Embed Size (px)
Citation preview

reimagining energyPETRONAS ANNUAL REPORT PE 2011 1
Petroliam Nasional Berhad (Company No. 20076-K)
Registered Office: Tower 1, PETRONAS Twin Towers,
Kuala Lumpur City Centre, 50088 Kuala Lumpur Malaysia
T +603 2051 5000
F +603 2026 5050
www.petronas.com
REIMAG
ININ
G EN
ERGY P
E2011 A
NN
UA
L RE
PO
RT

PETRONAS ANNUAL REPORT PE 20112
A
B
C
D
E
F G H I J
Crude Oil Natural Gas
OUR BUSINESS
Processed Gas/Peninsular Gas Utilisation (PGU) System
Petrochemical Plant
RegasificationTerminal
Liquefied Natural Gas (LNG)
Liquefied Petroleum Gas (LPG)
PetroleumProducts
• ExportSector
• ResidentialandCommercialSectors
• PowerSector
• IndustrialSector
• IndustrialSector-Ethylene,Methanol,MTBE,
Polyethylene,Propylene,UreaandVCM
• TransportationSector-Diesel,
Gasoline,JetFuelandLubricantsA
B
C
D
E
G
H
I
J
FExploration, Development and Production
Liquefaction
Processing
Refining
reimagining energyPETRONAS ANNUAL REPORT PE 2011 3
Africa •Algeria–Development•Cameroon–Exploration&Development•Chad – Development & Production •Egypt–Exploration,Development&Production•Mauritania–Exploration&Production• Mozambique – Exploration •Republic of South Sudan–Exploration,Development&Production•Republic of Sudan – Exploration, Development & ProductionAsia Pacific •Australia–Exploration,Development&Production•Brunei–Exploration•Indonesia – Exploration, Development & Production •Malaysia –Exploration,Development&Production•Malaysia-Thailand Joint Development Area – Exploration, Development & Production •Myanmar–Exploration,Development&Production•Vietnam – Exploration, Development & ProductionCentral Asia •Turkmenistan–Exploration,Development&Production•Uzbekistan – Exploration, Development & ProductionLatin America •Cuba–Exploration•Venezuela – Development Middle East •Iraq–Exploration,Development&Production•Oman – Exploration & DevelopmentNorth America •Canada – Development & Production
Exploration & Production (E&P)
Africa •Botswana–OilBusiness•Burundi–OilBusiness•Democratic Republic of the Congo–OilBusiness•Gabon – Oil Business •Ghana–OilBusiness•Guinea Bissau–OilBusiness•Kenya–OilBusiness•Lesotho–OilBusiness•Malawi – Oil Business •Mauritius–OilBusiness•Mozambique–OilBusiness•Namibia–OilBusiness•Nigeria–OilBusiness•Réunion – Oil Business •Rwanda–OilBusiness•Swaziland–OilBusiness•South Africa–OilBusiness•Republic of South Sudan – Oil Business •Tanzania–OilBusiness•Uganda–OilBusiness•Zambia–OilBusiness•Zimbabwe – Oil BusinessAsia Pacific •China–Oil&PetrochemicalBusinesses•India–Oil&PetrochemicalBusinesses•Indonesia – Oil & Petrochemical Businesses •Malaysia–Oil&PetrochemicalBusinesses•Philippines – Oil & Petrochemical Businesses •Thailand–Oil&PetrochemicalBusinesses•Vietnam – Oil & Petrochemical Businesses Europe •Austria–OilBusiness•Belgium–OilBusiness•Denmark–OilBusiness•France–OilBusiness•Germany – Oil Business •Italy–OilBusiness•Netherlands–OilBusiness•Poland–OilBusiness•Portugal–OilBusiness•Spain – Oil Business •Turkey–OilBusiness•United Kingdom – Oil BusinessLatin America •Argentina–OilBusiness•Brazil – Oil BusinessNorth America •United States of America – Oil Business
Downstream*
Africa •Egypt – LNG Asia Pacific •Australia–LNG&Infrastructure•Indonesia–Infrastructure•Malaysia – LNG, Infrastructure, Utilities & Power, Trading •Singapore–Power•Thailand – InfrastructureCentral Asia •Uzbekistan – Gas-to-LiquidEurope •Ireland–Infrastructure•United Kingdom – Infrastructure, Utilities & TradingNorth America •Canada – LNG
Gas & Power
*Includes Engen subsidiaries and marketing and trading offices.
©2012 PETROLIAM NASIONAL BERHAD (PETRONAS)All rights reserved. No part of this document may be reproduced, stored in a retrieval system or transmitted in any form or by any means (electronic, mechanical, photocopying, recording or otherwise) without the permission of the copyright owner. PETRONAS makes no representation or warranty, whether expressed or implied, as to the accuracy or completeness of the facts presented. PETRONAS disclaims responsibility from any liability arising out of reliance on the contents of this publication.
E&P
Gas & Power
Downstream
OURPRESENCE

PETRONAS ANNUAL REPORT PE 20114
40 Exploration & Production
50 Gas & Power
58 Downstream
66 Maritime & Logistics
70 Technology & Engineering
76 Our People
82 Health, Safety & Environment (HSE)
88 Awards & Recognitions
94 Corporate Social Responsibility
100 Main Events
112 Glossary
117 Financial Statements
Our Business
3 Our Presence
5 Corporate Statements
6 Corporate Profile
8 Board of Directors
14 Executive Committee
15 Management Committee
16 Vice Presidents
19 President & CEO and Acting Chairman’s Message
24 Statement of Corporate Governance
27 Statement of Anti-Corruption
28 Statement on Internal Control
32 Financial Results
TABLEOFCONTENTS
The Group and the
Company have changed the
financial year end from 31
March to 31 December. The
financial statements under
review are for a transition
period of 9 months from 1
April 2011 to 31 December
2011 (PE2011) whilst the
comparative figures are
the corresponding period
from 1 April 2010 to 31
December 2010.
reimagining energyPETRONAS ANNUAL REPORT PE 2011 5
MissionWe are a business entity
Petroleum is our core business
Our primary responsibility is to develop and
add value to this national resource
Our objective is to contribute to the well-being
of the people and the nation
VISION
Shared ValuesLoyalty
Loyal to nation and corporation
Integrity
Honest and upright
ProfessionalismCommitted, innovative and proactive and
always striving for excellence
CohesivenessUnited in purpose and fellowship
TO BE A LEADINGOIL AND GASMULTINATIONAL OF CHOICE

PETRONAS ANNUAL REPORT PE 20116
CORPORATEPROFILEPetroliam Nasional Berhad is Malaysia’s National Petroleum Corporation wholly-owned by the Malaysian Government. Established in 1974, PETRONAS is now ranked among the largest companies in the world with a proven track record in integrated oil and gas operations spanning the entire hydrocarbon value chain.
PETRONAS’ business activities include (i)
the exploration, development and production
of crude oil and natural gas in Malaysia
and overseas; (ii) the liquefaction, sale and
transportation of Liquefied Natural Gas (LNG);
(iii) the processing and transmission of natural
gas, including power generation, and the
sale of natural gas products; (iv) the refining
and marketing of petroleum products; (v) the
manufacturing and selling of petrochemical
Exploration & Production
PETRONAS Exploration & Production (E&P)
aims for Safe and Profitable Growth through
effective domestic resource management and
highgrading and acquiring assets/ventures
across the exploration, development and
production value chain.
The Petroleum Management Unit (PMU) of
PETRONAS manages domestic oil and gas
assets, by pioneering innovative solutions to
drive business growth in the Malaysian oil
and gas industry. This includes Enhanced Oil
Recovery (EOR), small field development and
intensifying exploration activities.
products; (vi) the trading of crude oil,
petroleum, gas and LNG products and
petrochemical products; and (vii) shipping
and logistics relating to LNG, crude oil
and petroleum products. Committed to
ensuring business sustainability, PETRONAS
also strives to responsibly manage natural
resources in a way that contributes
holistically to the well-being of the people
and nations wherever it operates.
Its E&P subsidiary, PETRONAS Carigali Sdn
Bhd (PCSB) is a hands-on operator with an
established track record of successful oil and
gas developments. Actively strengthening
the nation’s upstream resource base and
production, PCSB works alongside a
number of petroleum multinationals through
Production Sharing Contracts (PSCs) to
explore, develop and produce oil and gas
in Malaysia. Abroad, PETRONAS continues
to build on its E&P portfolio, securing
new acreages while undertaking various
development projects. These include
deepwater and unconventional resources.
PETRONAS continues to harness and
implement new technologies to reap the
benefits of every hydrocarbon molecule
recovered in its vision to become a leading
global E&P player.

reimagining energyPETRONAS ANNUAL REPORT PE 2011 7
Gas & Power
PETRONAS aspires to be a leading
integrated gas, LNG and power player
through two major portfolios under its
Gas and Power business; Global LNG
business and Infrastructure, Utilities &
Power business.
At present, its Global LNG business
commands a sizeable LNG market
share in the Far East. It aims to sustain
its market position and preserve its
reputation as a reliable supplier of
LNG. PETRONAS is involved in LNG
trading and is currently establishing
its foothold in the European energy
trading, which includes gas and
electricity. Apart from conventional
plays, the Group also expanded
into unconventional plays such as
Australia’s Gladstone Coal Bed
Methane (CBM) to LNG project in
2009, as well as shale gas to LNG
DownstreamPETRONAS’ ambitious downstream
expansion through its integrated
operations in refining & trading,
marketing & retailing as well as in
the petrochemicals sector plays a
strategic role to increase the value of
every molecule extracted through its
exploration activities.
PETRONAS owns and operates
three refineries in Malaysia, two in
Melaka and another in Kertih. The
PETRONAS refining portfolio is
also complemented by its refining
presence in Africa through its 80%
owned subsidiary, Engen Petroleum
Limited (Engen), a leading African
refining and marketing company
which owns and operates a refinery
in Durban, South Africa.
In the Malaysian market, PETRONAS
Dagangan Berhad (PDB) manages
all domestic marketing and retailing
activities for a wide range of
petroleum products. PETRONAS
also operates service stations in
various international markets including
Indonesia, Thailand, South Africa
and Sudan. PETRONAS Lubricants
International Sdn Bhd (PLI) is the
global lubricants manufacturing
and marketing arm of PETRONAS.
With a strong presence in more
than 20 countries globally, the PLI
product range includes lubricants
and functional fluids for both the
automotive and industrial markets as
well as a range of car care products.
The integrated development
of Malaysia’s petrochemical
industry is expected to promote
the development of the country’s
industrial base, especially the
plastics and chemical based
component manufacturing industry.
The Company’s consolidated
petrochemical business under the
PETRONAS Chemicals Group
Berhad (PCG) is the largest integrated
petrochemicals producer in Malaysia
and among the largest in South East
Asia.
venture in northeastern British
Columbia, Canada.
Its Infrastructure, Utilities & Power
business is focused on ensuring
long-term security and sustainability
of the gas market in Malaysia while
continuing to expand its portfolio
of infrastructure and power in high
growth markets. PETRONAS Gas
Berhad (PGB) owns and operates
the Peninsular Gas Utilisation (PGU)
system, that delivers gas to the
power and non-power sectors in
Peninsular Malaysia as well as the
power industry in Singapore. The
business has been operating the
PGU system exceeding world class
standards. PETRONAS is committed
to further grow in the power and
renewable business, leveraging on
existing capabilities and capturing
opportunities in key focus markets in
Asia and the Middle East.
PETRONAS’ robust development of its
downstream portfolio is expected to
further enhance Malaysia’s economic,
industrial and knowledge base. In the
long-term, this augurs well to support
Malaysia’s growth agenda and the
Company’s integrated plan to become
a key downstream player in the region.

PETRONAS ANNUAL REPORT PE 20118
Tan Sri Dato’ Shamsul Azhar AbbasActing Chairman of the PETRONAS Board,
President & Chief Executive Officer
Tan Sri Dr Wan Abdul Aziz Wan AbdullahNon Independent
Non Executive Director
Datuk Muhammad IbrahimNon Independent
Non Executive Director
Tan Sri Dato’ Seri Hj Megat Najmuddin Datuk Seri Dr Hj Megat KhasIndependent Non Executive Director,
Chairman of the PETRONAS Board
Governance & Risk Committee
Datin Yap Siew BeeIndependent Non Executive Director,
Chairperson of the PETRONAS
Remuneration Committee
Datuk Anuar AhmadExecutive Director
Dato’ Wee Yiaw HinExecutive Director
Dato’ Mohammed Azhar Osman KhairuddinCompany Secretary
BOARDOFDIRECTORS

reimagining energyPETRONAS ANNUAL REPORT PE 2011 9
Krishnan CK Menon, FCAIndependent Non Executive Director,
Chairman of the PETRONAS Board
Audit Committee
Dato’ Mohamad Idris MansorIndependent Non Executive Director
Tan Sri Amirsham A AzizIndependent Non Executive Director
Datuk Mohd Omar MustaphaIndependent Non Executive Director
Datuk Manharlal RatilalExecutive Director
Faridah Haris HamidJoint Company Secretary
Datuk Wan Zulkiflee Wan AriffinExecutive Director

PETRONAS ANNUAL REPORT PE 201110
Tan Sri Dato’ Shamsul Azhar AbbasActing Chairman of the PETRONAS Board, President & Chief Executive Officer
Tan Sri Dato’ Shamsul Azhar Abbas was appointed to the PETRONAS Board as Acting
Chairman and as President & Chief Executive Officer of PETRONAS on 10 February
2010. He began his career with PETRONAS in 1975 and prior to his current appointment
held numerous senior management positions within the Group. Tan Sri Dato’ Shamsul is
also Chairman of the Board of PETRONAS Carigali Sdn Bhd, the Group’s wholly-owned
exploration and production arm. He also serves as Chairman of the National Trust Fund
of Malaysia. On 2 June 2012, he was conferred the Darjah Panglima Setia Mahkota
(PSM) which carries the title Tan Sri by His Majesty the Yang Di-Pertuan Agong.
BOARDOFDIRECTORS
»
Tan Sri Dr Wan Abdul Aziz Wan AbdullahNon Independent Non Executive Director,
Member of the PETRONAS Board Audit Committee
Tan Sri Dr Wan Abdul Aziz is a member of the PETRONAS Board and currently
serves as the Secretary-General of Treasury in the Ministry of Finance. He also sits on
the Board of various organisations including Malaysian Airline System Berhad, Bintulu
Port Holdings Berhad, Bank Negara Malaysia, MISC Berhad, Retirement Fund
Incorporated and the Federal Land Development Authority (FELDA).
«
»
Datuk Muhammad IbrahimNon Independent Non Executive Director,
Member of the PETRONAS Board Audit Committee and Board Governance & Risk Committee
Datuk Muhammad Ibrahim was appointed to the PETRONAS Board in April 2010. He is
currently the Deputy Governor of Bank Negara Malaysia. His areas of expertise include
finance, banking, supervision and regulation, strategic planning, insurance and financial
markets. He is a trustee of the Tun Ismail Ali Chair Council, a former commissioner of
the Securities Commission of Malaysia and Senior Associate of the Institute of Bankers
Malaysia. He sits on the Board of the Retirement Fund Incorporated and is a member of
the Malaysian Institute of Accountants and member of the Investment Panel of National
Trust Fund. On 2 June 2012, he was conferred the Darjah Panglima Jasa Negara (PJN)
which carries the title Datuk by His Majesty the Yang Di-Pertuan Agong.
Tan Sri Amirsham A AzizIndependent Non Executive Director,
Member of the PETRONAS Board Governance & Risk Committee
Tan Sri Amirsham A Aziz was appointed to the PETRONAS Board in October 2011.
He joined the Maybank Group in 1977 and has held various senior positions within
the Group. He served as President and Chief Executive Officer of Maybank for a
period of 14 years from 1994 to 2008. He was Chairman of the National Economic
Advisory Council (NEAC) and served as the Minister in the Prime Minister’s Department
in charge of the Economic Planning Unit and the Department of Statistics in 2008
to 2009. He is a member of the Malaysian Institute of Certified Public Accountants
(MICPA) and is a non-executive director on the Boards of international companies such
as Lingui Developments Berhad, Samling Global Limited, and CapitaMall Asia Limited.
«

reimagining energyPETRONAS ANNUAL REPORT PE 2011 11
Dato’ Mohamad Idris MansorIndependent Non Executive Director,
Member of the PETRONAS Board Audit Committee and the PETRONAS Remuneration Committee
Dato’ Mohamad Idris Mansor was appointed to the PETRONAS Board in April
2010. He has extensive experience in the oil and gas industry, having held various
senior management positions within the Group including as Senior Vice President,
Exploration & Production Business. He is a Board member of PETRONAS Carigali
Sdn Bhd. He was also the International Business Advisor to PTT Exploration and
Production Company of Thailand prior to his current appointment. »
Datin Yap Siew BeeIndependent Non Executive Director,
Chairperson of the PETRONAS Remuneration Committee
Datin Yap Siew Bee was appointed to the PETRONAS Board in April 2010. She is
currently Consultant to the firm of Mah-Kamariyah & Phillip Koh. She has advised
as legal counsel on significant oil and petrochemical projects in Malaysia and has
extensive oil and gas advisory experience including negotiation of international oil and
gas ventures on behalf of PETRONAS. Her areas of expertise include mergers and
acquisitions, corporate finance, corporate restructuring and commercial ventures. «
»
Krishnan CK Menon, FCAIndependent Non Executive Director,
Chairman of the PETRONAS Board Audit Committee and Member of the PETRONAS Board
Governance & Risk Committee
Krishnan CK Menon was appointed to the PETRONAS Board in April 2010. He is a
Fellow of the Institute of Chartered Accountants in England and Wales, a member of
the Malaysian Institute of Accountants and the Malaysian Institute of Certified Public
Accountants. He is currently Chairman of Putrajaya Perdana Berhad, SCICOM (MSC)
Berhad, KLCC Property Holdings Berhad and KLCC (Holdings) Sdn Bhd. He is a
non-executive director of MISC Berhad and is also the Chairman of the Board Audit
Committee in MISC Berhad.
Tan Sri Dato’ Seri Hj Megat Najmuddin Datuk Seri Dr Hj Megat Khas
Independent Non Executive Director,
Chairman of the PETRONAS Board Governance & Risk Committee
Tan Sri Megat Najmuddin was appointed to the PETRONAS Board in April 2010. He
is currently the President of both the Federation of Public Listed Companies Berhad
(FPLC) and the Malaysian Institute of Corporate Governance (MICG). He currently
serves as the Non-Executive Chairman of several public listed companies and is
active in non-governmental organisations (NGOs). «

PETRONAS ANNUAL REPORT PE 201112
BOARD OF DIRECTORS
»
Datuk Wan Zulkiflee Wan AriffinExecutive Director
Datuk Wan Zulkiflee Wan Ariffin is a member of the PETRONAS Board, the
Executive Committee, Management Committee and serves on various Boards of
several Joint Ventures and subsidiary companies in the PETRONAS Group. He is
the Executive Vice President of Downstream Business and is the Chairman of two
of PETRONAS’ public listed subsidiaries namely PETRONAS Chemicals Group
Berhad and PETRONAS Dagangan Berhad. He was also a member of the Board of
Directors of MISC Berhad until end of November 2011 and is the Industry Advisor
to the Engineering Faculty of Universiti Putra Malaysia. Datuk Wan Zulkiflee is also
PETRONAS’ Chief Operating Officer effective 1 April 2012.
Datuk Anuar AhmadExecutive Director
Datuk Anuar Ahmad is a member of the PETRONAS Board, Executive Committee
and Management Committee. He is the Executive Vice President of Gas & Power
Business. Prior to this appointment, he served as Vice President of Human Resource
Management Division and, earlier, as Vice President of Oil Business. He also sits on
the Board of several companies within the PETRONAS Group.
»
Dato’ Wee Yiaw HinExecutive Director
Dato’ Wee Yiaw Hin was appointed to the PETRONAS Board in May 2010. He is the
Executive Vice President of Exploration & Production Business. He is also a member
of the Executive Committee, Management Committee and serves on various Boards
of subsidiary companies in the PETRONAS Group. Previously, he worked in Talisman
and Shell where he held various senior management positions.
«
Datuk Mohd Omar MustaphaIndependent Non Executive Director,
Member of the PETRONAS Remuneration Committee
Datuk Mohd Omar Mustapha was appointed to the PETRONAS Board in September
2009. He is the Founder and Chairman of Ethos & Company, a leading Malaysian-
based management consulting firm and a General Partner of Ethos Capital, a
regional private equity fund. He is an independent director of Air Asia Berhad and
Symphony House Berhad, an Eisenhower Fellow, a founding member of the World
Islamic Economic Forum’s Young Leaders Roundtable and a YGL member of the
World Economic Forum in Davos.

reimagining energyPETRONAS ANNUAL REPORT PE 2011 13
Dato’ Mohammed Azhar Osman KhairuddinCompany Secretary
Dato’ Mohammed Azhar Osman Khairuddin has been the Company Secretary of
PETRONAS since 1 April 2000. He joined PETRONAS in 1979 as a Legal Officer
and currently holds the position of Vice President, Legal. He is a member of the
PETRONAS Management Committee and serves on the Board of Directors of several
companies within the PETRONAS Group. He is also a member of the International
Bar Association and Inter Pacific Bar Association.
«
«
Datuk Manharlal RatilalExecutive Director
Datuk Manharlal Ratilal is a member of the PETRONAS Board, Executive Committee
and Management Committee. He is the Executive Vice President of Finance. He also
sits on the Board of several subsidiaries of PETRONAS. He joined PETRONAS in
2003. He previously served as Managing Director of an investment bank involved in
corporate finance, mergers and acquisitions, and the capital markets.
»
Faridah Haris HamidJoint Company Secretary
Faridah Haris Hamid is the Head of Legal Finance & Corporate Secretariat, Legal
Division. She spent 10 years in the banking sector before joining PETRONAS in
1992. She is the Joint Secretary to the PETRONAS Board of Directors and Secretary
to the Executive Committee of PETRONAS. Her areas of legal expertise include
corporate finance, capital markets and corporate governance and international
compliance.

PETRONAS ANNUAL REPORT PE 201114
Tan Sri Dato’ Shamsul Azhar AbbasPresident & Chief Executive Officer
EXECUTIVECOMMITTEE
Faridah Haris HamidSecretary
Datuk Wan Zulkiflee Wan AriffinExecutive Vice President
Downstream Business
Datuk Anuar AhmadExecutive Vice President
Gas & Power Business
Datuk Manharlal Ratilal Executive Vice President
Finance
Dato’ Wee Yiaw HinExecutive Vice President
Exploration & Production
Business

reimagining energyPETRONAS ANNUAL REPORT PE 2011 15
MANAGEMENTCOMMITTEE
Tan Sri Dato’ Shamsul Azhar AbbasPresident & Chief Executive Officer
»
»
Datuk Wan Zulkiflee Wan AriffinExecutive Vice President
Downstream
Datuk Anuar AhmadExecutive Vice President
Gas & Power
«
Dato’ Wee Yiaw HinExecutive Vice President
Exploration & Production
«
Ramlan Abdul MalekVice President
Petroleum Management
«
Datuk Manharlal RatilalExecutive Vice President
Finance
»
Dr Colin Wong Hee HuingVice President
Technology & Engineering
»

PETRONAS ANNUAL REPORT PE 201116
«Datuk Nasarudin Md IdrisPresident & CEO
MISC Berhad
Md Arif MahmoodVice President
Corporate Strategic Planning
«
Dato Mohammad Medan AbdullahSenior General Manager
Group Corporate Affairs Division
«
Juniwati Rahmat HussinVice President
Human Resource Management
»
Dato’ Mohammed Azhar Osman KhairuddinVice President
Legal
»
Hazleena HamzahSecretary
»

reimagining energyPETRONAS ANNUAL REPORT PE 2011 17
VICEPRESIDENTSEffendy Cheng AbdullahVice President & Chief Executive Officer
Exploration
»
Ramlan A MalekVice President
Petroleum Management
»
Datuk Abdullah KarimVice President & Chief Executive Officer
Development & Production
«
Adnan Zainol AbidinVice President
Global LNG
«
Amir Hamzah AzizanVice President
Downstream Marketing
«
Pramod Kumar KarunakaranVice President
Infrastructure & Utilities
»
M Farid AdnanVice President
Refining & Trading
»
PETRONAS ANNUAL REPORT PE 201118
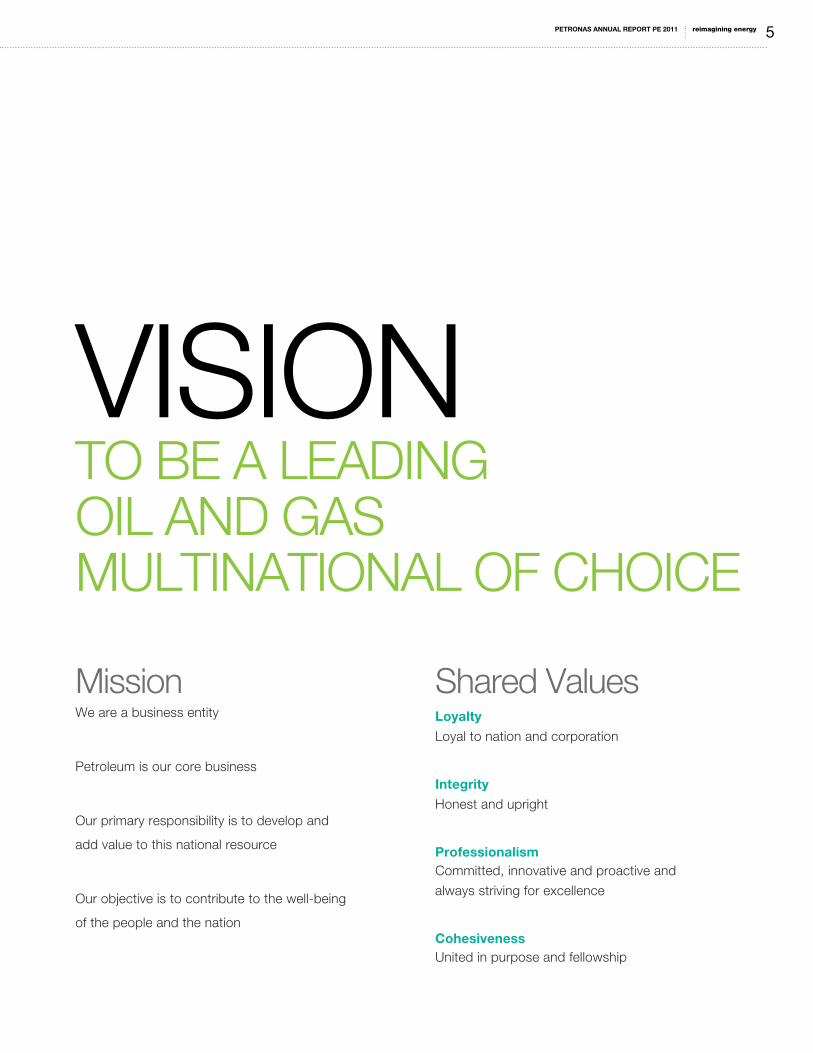
Ir Kamarudin ZakariaVice President
Downstream Operations
«
M Rashid YusofVice President
Supply Chain & Risk Management
«
Nuraini IsmailVice President
Treasury
»
«Juniwati Rahmat HussinVice President
Human Resource Management
«Dato’ Mohammed Azhar Osman KhairuddinVice President
Legal
Dr Colin Wong Hee HuingVice President
Technology & Engineering
»
Md Arif MahmoodVice President
Corporate Strategic Planning
»

reimagining energyPETRONAS ANNUAL REPORT PE 2011 19
PRESIDENT&CEOAND ACTING CHAIRMAN’S MESSAGE
Financial Period Ended 2011 (PE2011) was a watershed for PETRONAS — a pivotal nine-month period in which the Group delivered strong operating results and made substantial progress in bringing key objectives of the Corporate Enhancement Programme (CEP), critical for the long-term sustainability of its business, closer to realisation.
These accomplishments, the result of the Group’s
determination to explore new solutions and push performance
boundaries, reflect its continuing resolve to uphold its duties
as custodian of the Nation’s hydrocarbon resources and to
honour the trust of its stakeholders, even in the face of today’s
volatile and fundamentally-changing industry environment.
Financially, the Group’s performance for PE2011 was strong.
Notwithstanding the shorter transitional nine-month financial
period to a 31 December year-end, the results are comparable
to what would normally have required a full 12-month period
to achieve. Group Revenue strengthened to RM222.8 billion,
27% higher than the previous corresponding period, while
Net Profit attributable to Shareholders rose 10% to reach
RM48.9 billion. This enabled the Group to meet its demanding
dividend obligations, fund its ambitious CAPEX programme
and achieve a RM24.6 billion increase in Shareholder’s Funds,
MESSAGE FROM THE CEO |
TAN SRI DATO’ SHAMSUL AZHAR ABBAS President & CEO and Acting Chairman
PETRONAS ANNUAL REPORT PE 201120
which strengthened to RM288.3 billion. Reflecting this
more robust performance, the Group’s Return on Average
Capital Employed (ROACE) climbed to 21.8%. Higher sales
volumes in selected segments of the Group’s value-chain,
particularly in LNG, as well as a favourable price environment
were key drivers behind these improved results.
What proved more encouraging, however, were the
operational and strategic milestones achieved during the
Financial Period which will now enable PETRONAS to at
last address numerous long-standing growth challenges
and transcend the confines of its legacy assets. In the
Exploration & Production Business, the prospect of
mitigating the decline in domestic upstream production is in
sight, even if not yet at hand, thanks to the three-pronged
domestic upstream sector strategy we adopted two years
ago now beginning to produce the desired results. A
more determined push to optimise recovery from currently-
producing fields through Enhanced Oil Recovery (EOR)
and Improved Oil Recovery (IOR) techniques has yielded
an additional 380 million barrels of oil equivalent to count
towards future development and production. A second Risk
Service Contract (RSC) for the Balai Cluster of fields was
also successfully awarded, the granting of which continues
to underscore the necessity of pushing for innovative
commercial arrangement solutions in providing the right
commercial framework to unleash the potential of our
domestic marginal fields.
Through a more aggressive exploration campaign,
PETRONAS has also succeeded in proving up new play
types once dismissed by some as holding little promise,
which will potentially enhance the future prospects of
Malaysia’s upstream sector even further. In an effort to
shorten lead time-to-monetisation, we continued to explore
new solutions and methods — reconceptualising workflows,
processes, as well as field development design and
planning. The results were evident from our ability to bring
the Tangga Barat cluster onstream five months faster than
planned and the Sepat Field, more than one year ahead of
the original schedule.
Internationally, through further highgrading efforts, our
upstream portfolio continued to rebalance in favour of quality
assets which we expect will provide us better risk-adjusted
returns moving forward. At the same time, we are confident
that the successful development of our integrated gas
project in Turkmenistan will pave the way for other initiatives
in the Caspian Area to potentially allow us to grow a new
“heartland” in the Central Asian region.
In this same spirit of progress, our Gas & Power and
Downstream Businesses are also on the move. Previously
stable, mature operations whose performance were tied
to legacy assets, each can now speak of an ambitious
multi-billion dollar growth agenda. In Gas & Power, work
on Malaysia’s first LNG Regasification terminal (RGT1) in
Melaka continued to progress. At press time, RGT1 has
already achieved mechanical completion and remains on
track to be commissioned during the later half of 2012.
At the same time, we are confident that the
successful development of our integrated gas
project in Turkmenistan will pave the way for
other initiatives in the Caspian Area to potentially
allow us to grow a new “heartland” in the
Central Asian region.
reimagining energyPETRONAS ANNUAL REPORT PE 2011 21
Together with numerous upstream gas developments such
as Tangga Barat, Berantai and the North Malay Basin — and
coupled with the potential construction of a second LNG
Regasification terminal (RGT2) in Pengerang, Johor — the
additional gas supplies made available from the import of
LNG through RGT1 will go a long way towards enhancing
the security of gas supply in the Peninsular and also allow
for growth in premium gas demand. A third Regasification
terminal, currently being pursued as an integrated gas-
to-power development project in Lahad Datu, Sabah, is
now being targeted for commissioning in 2015. We are
also confident of being on track to deliver the world’s first
Floating LNG (FLNG) facility by that year and at the time of
writing, subsequent to the close of the Financial Period, Final
Investment Decision (FID) on the facility has already been
taken.
Abroad, further progress was made to develop new LNG
supply positions to complement our existing facilities in
driving forward our Global LNG aspirations. During the
Financial Period, we entered into a strategic partnership with
Progress Energy Resources Corporation to develop shale
gas assets in northeastern British Columbia, Canada — a
venture that will not only allow us to position ourselves to
capitalise on the emergence of a trans-Pacific energy trade
into Asia, but is also consistent with the aim of shifting our
global gas presence in favour of geopolitically more stable
regions in a bid to better serve our customers’ needs for
safe, secure and reliable supplies of energy. This venture
will also complement our involvement in the GLNG project in
Queensland, Australia, as we seek to grow our presence in
the unconventional gas business further.
Key growth projects in our Downstream Business also
achieved their respective major progress milestones during
the Financial Period. We completed the Detailed Feasibility
Study (DFS) of our RM60 billion Refinery and Petrochemical
Integrated Development (RAPID) and Front-End Engineering
Design (FEED) works have been commissioned. We
also took a Final Investment Decision (FID) on the Sabah
Ammonia and Urea (SAMUR) project and the contract for
its Basic & Detailed Engineering, Procurement, Construction
and Commissioning (BEPCC) has been awarded.
When completed, both projects will not only strengthen
PETRONAS’ ability to capitalise on the growing inputs of
energy and chemicals Asia requires to support its rapid
economic expansion and industrialisation, but will also
enable the Group to diversify its product offerings into higher
value-added and specialty petrochemicals.
Viewed in their totality, I believe what these milestone
achievements signify is that the pillars of PETRONAS’
next growth phase are now at last beginning to take
shape. To this end, I am confident that they will not only
enable the Group to address long-standing structural
challenges and push for growth, but will also create the
distinctive foundations to uphold its aspiration of being a
“Global Energy Champion known for its Resilience and
Distinctiveness”.
We are also confident of being on track to
deliver the world’s first Floating LNG (FLNG)
facility by that year and at the time of writing,
subsequent to the close of the Financial
Period, Final Investment Decision (FID) on the
facility has already been taken.

PETRONAS ANNUAL REPORT PE 201122
None of these accomplishments would have been possible
without the improvements and changes the CEP has
ushered in. A more determined, conscious effort to focus
on our core businesses helped concentrate vital resources
and energies to where they were most critical. The adoption
of measures enhancing governance and transparency
created a stronger impetus to outperform. Better talent
and performance management practices, including an
infusion of external talent, also generated a stronger drive of
business performance. At the same time, a greater sense
of ownership and accountability also propelled our people to
give their best.
Equally important, the accomplishments also reflect the
determination as well as commitment of our people,
particularly those men and women who proved themselves
worthy by embracing change and living up to the spirit
of “Reimagining Energy” — continuously challenging
accepted norms, exploring new solutions and driving
breakthrough execution; exemplifying, in the process, that
level of performance PETRONAS will need to consistently
demonstrate across the entire Group in confronting future
challenges.
Indeed, looking ahead, the industry environment looks set
to remain extremely challenging. The recent resurgence
of downside risks appears to be unfolding in line with
those projections forecasting an extended period of
macroeconomic volatility. In the near term, global growth
momentum looks set to slow, with growth prospects
expected to remain subdued and fragile. In tandem with
these circumstances, both energy demand and prices are
expected to soften.
At the same time, rising industry costs, an intensifying
competition for talent and major structural changes within
the industry unleashed by the growing mainstreaming of
Equally important, the accomplishments
also reflect the determination as well as
commitment of our people, particularly
those men and women who proved
themselves worthy by embracing
change and living up to the spirit of
“Reimagining Energy” — continuously
challenging accepted norms, exploring
new solutions and driving breakthrough
execution; exemplifying, in the process,
that level of performance PETRONAS
will need to consistently demonstrate
across the entire Group in confronting
future challenges.

reimagining energyPETRONAS ANNUAL REPORT PE 2011 23
we are able to improve our delivery momentum and
present ground breaking achievements through the
implementation of innovative ideas.
Finally, to our numerous customers, partners,
stakeholder, regulators, as well as the host
governments in our various countries of operations,
our sincere appreciation for your continued support
and association with the PETRONAS Group. May we
continue to reimagine the endless possibilities we can
achieve together.
TAN SRI DATO’ SHAMSUL AZHAR ABBAS
President&CEOandActingChairman
unconventional hydrocarbons and the advent of new
exploration frontiers - the precise nature, extent and
speed of whose implications remains as yet highly
uncertain - will severely test the agility, resilience and
resourcefulness of all industry players, favouring those
that prove themselves distinctive on all fronts.
To this end, PETRONAS resolves to remain vigilant
and will seek to enhance its resilience to weather
these risks while seeking to be at the forefront of
efforts to capitalise on the emerging trends. In so
doing and guided by the CEP, we will continue to be
driven by our long-standing commitment to uphold the
trust our stakeholders have accorded us - the people
and the Nation, foreign host governments, partners
and customers alike - to be a partner they all know
will consistently return greater value and contribute to
the meaningful development of nations and peoples
wherever it operates.
Lastly, I would like to take this opportunity to put on
record my appreciation to the Government of Malaysia
for its continued support, allowing us to remain
a strong international competitor and Malaysia’s
corporate flagship. I would also like to put on record
my appreciation to our Board of Directors, whose
stewardship and guidance ensured that PETRONAS
remains focused in delivering results in an extremely
competitive environment.
To the PETRONAS Executive and Management
Committees, as well as the broader senior leadership
team, thank you for exhibiting the spirit of change
and renewal, as well as driving and constantly
communicating these precepts in your respective
areas of responsibility. Thanks to the collective
leadership of the Board and the leadership team,
PETRONAS ANNUAL REPORT PE 201124
STATEMENTOFCORPORATEGOVERNANCE
PETRONAS believes that good Corporate
Governance is fundamental to ensuring the
organisation’s competitiveness, growth and
sustainability. Implementing best practices
in Corporate Governance is important to
PETRONAS given the Group’s strong global
orientation and the growing expectations of
stakeholders worldwide for good corporate
citizenship.
Enhanced standards of governance and
transparency serves to strengthen the
Group’s organisational effectiveness and
drive a high-performance culture within
the organisation, and are both essential
for PETRONAS to compete successfully in
today’s challenging industry environment.
The Board maintains and requires the
Management to uphold the high standards
of governance, transparency and ethical
conduct. Today, with a well-established global
footprint, PETRONAS continues to pave
the way towards ensuring the sustainability
of good corporate governance based on
international standards.
Corporate Governance & Transparency
Since its inception in 2011, the newly
established Corporate Governance &
International Compliance Unit, Legal Division
has launched a series of governance
programmes to further enhance the
application of governance standards across
the Group in line with best global practices.
These efforts include the revision of the
PETRONAS Code of Conduct and Discipline
(renamed as PETRONAS Code of Conduct
and Business Ethics) and the adoption of a
Whistle-blowing Policy, together with training
on competition law compliance in light
of the coming into force of the Malaysian
Competition Act 2010.

reimagining energyPETRONAS ANNUAL REPORT PE 2011 25
Business EthicsPETRONAS is committed to complying with
high ethical standards and applicable anti-
corruption laws. This is in line with PETRONAS’
core values, business principles and various
internal policies which reflect the continuous
focus on making ethics and anti-corruption
an integral part of PETRONAS’ business
operations. Such focus has helped to promote
strong ownership in relation to compliance
and ethics at all levels. In keeping with this
initiative, PETRONAS has adopted new policies
on gifts and entertainment and has made
enhancements to its Code of Conduct and
Discipline to accommodate the development of
local and international laws and customs.
PETRONAS Board Governance FrameworkThe Board directs the Company’s strategic
planning, financial, operational and resource
management, risk assessment and
provides effective oversight of the executive
management. Certain functions are delegated
to Board Committees consisting of Non-
Executive Directors as detailed in later
sections.
The Chairman leads the Board, and the
President & Chief Executive Officer (CEO)
leads the executive management of the
Company and provides direction for the
implementation of the strategies and
business plans as approved by the Board
and the overall management of the business
operations Groupwide.
In this regard, the President & CEO has the
support of the Executive Committee and
Management Committee which he chairs.
The Executive Committee’s role is to assist
the President & CEO in his management of
the business and affairs of the Company
particularly in relation to strategic business
development, high impact and high value
investments and cross-business issues of
the Group. It also serves as a platform for
the structured succession planning for the
President & CEO in the Company.
The Management Committee continues to
act as the advisory and deliberative body
that supports the President & CEO and the
Executive Committee and implements all
the Board resolutions and policies, as well
as supervise all management levels in the
PETRONAS Group.

PETRONAS ANNUAL REPORT PE 201126
The Board
Board Balance and Independence
Board CommitteesFor the period ended (PE) 2011, the Board
was made up of the Acting Chairman and
President & CEO, four Executive Directors
and eight Non-Executive Directors. A list of
the current Directors, with their biographies, is
provided on pages 8 to 13.
Currently, the position of the Chairman is
vacant, and the President & CEO is assuming
the responsibility until such time as the
shareholder makes an official appointment.
The Chairman’s role is to provide leadership
to the Board, facilitate the meeting process
and ensure that the Board and its committees
function effectively. Together with the
Company Secretary, he ensures that the
Board members receive regular and timely
information regarding the Company prior to
Board meetings. The Board members also
have access to the Company Secretary for
any further information they may require.
The Board met a total of eight times (which
included three Special Board Meetings)
during the period with a formal schedule
of matters reserved to the Board. These
include the consideration of the Company’s
long term strategy, plan and budget,
monitoring of Management Performance,
introduction of CEO’s and Executive Vice
Presidents’ (EVPs) Performance Scorecards,
Talent Management and the Company’s
Performance Review. In addition to managing
the Company’s financial reporting, the
Board monitors and identifies material risks
to PETRONAS and ensures that internal
systems of risk management and control are
in place to mitigate such risks.
The Special Board Meetings, which were
held three times during the period, had also
given the directors the opportunity to engage
in intensive deliberation on PETRONAS’
long term strategy, plan and budget and
talent management. These meetings
were used as a platform for the induction
and orientation of the Independent Non-
Executive Directors. Such induction and
orientation practice is crucial as it provides an
informative environment for the Independent
Non-Executive Directors to understand the
business more closely.
In July 2011, a Special Board meeting was
held in Turkmenistan in conjunction with the
First Gas Celebration. The Board was given
the opportunity to gain a better understanding
and appreciation of the business challenges
and issues faced in Turkmenistan as well as
to foster greater collaboration and networking
with the management and staff of our
Turkmenistan office.
The current Board composition reflects a
good mix of experience, backgrounds, skills
and qualifications and is considered to be of
an appropriate size. This diversity is identified
by the members as one of the strengths of
the Board.
The Non-Executive Directors combine broad
business and commercial experience with
independent and objective judgment. The
balance between the Non-Executive and
Executive Directors enables the Board to
provide clear and effective leadership and
maintain the highest standards of integrity
across the Company’s business activities.
The Company recently welcomed another
Non-Executive member bringing the total to
eight Non-Executive Directors for the period
ended 2011.
In accordance with the provisions of the
Company’s Articles of Association, at least
one-third of the Directors shall retire from
office once every subsequent year but shall
be eligible for re-election. This retirement by
rotation shall only be applicable to Non-
Executive Directors.
AuditCommitteeEstablished in 1985, the PETRONAS Board
Audit Committee assists the Board in fulfilling
its oversight functions in relation to internal
controls, risk management and financial
reporting of the Company. The Committee
provides the Board with the assurance of
the quality and reliability of the financial
information issued by the Company whilst
ensuring the integrity of the Company’s
assets.
Governance&RiskCommitteeThe Committee continues to be responsible
in assessing the performance of the Board,
reviewing management succession planning
as well as identifying, nominating and
orientating new Directors. With the recent
enhancement of the scope of the Committee,
it also reviews the Group’s Enterprise Risk
Management, Country Risk Profile as well as
Financial Risk Management Development &
Updates.
The Committee also continues to review and
recommend to the Board the appropriate
There are three Board Committees made up primarily of Non-Executive Directors, namely the Audit Committee, the Governance and Risk Committee and the Remuneration Committee.

reimagining energyPETRONAS ANNUAL REPORT PE 2011 27
corporate governance policies and
procedures in accordance with international
governance and best practices. Among the
programmes which were reviewed by the
Committee include the Code of Conduct
and Business Ethics and the new Whistle-
Blowing Policy. The Committee has direct
access to the Corporate Governance &
International Compliance Unit, Legal Division,
which promotes a structured, consistent
and centrally-driven integrated approach to
global governance and compliance for the
PETRONAS Group.
RemunerationCommitteeThe Remuneration Committee was
established to assist the Board in discharging
its responsibilities in the determination
of the remuneration and compensation
of the Executive Directors and certain
Senior Management of the Company. The
Committee determines and agrees with the
Board on the remuneration policy for the
President & CEO, the Executive Directors and
certain Senior Management of the Company.
The Committee also determines and agrees
with the Board on the matter of the President
& CEO’s Performance Scorecard.
STATEMENTOFANTI-CORRUPTION
This is in line with PETRONAS’ core values,
business principles and various internal
policies which reflect its focus on making
ethics and anti-corruption an integral part of
PETRONAS’ business operations.
PETRONAS’ management is committed
to communicating the vital importance of
strong ethics and anti-corruption practices
to all levels of the organisation. The signing
of the Corporate Integrity Pledge further
underpins PETRONAS’ commitment towards
addressing and prohibiting bribery and
corruption.
PETRONAS is committed to complying with high ethical standards and applicable anti-corruption laws of the relevant jurisdictions. The PETRONAS Code of Conduct and Business Ethics expressly prohibits the giving and acceptance of bribes by PETRONAS employees.

PETRONAS ANNUAL REPORT PE 201128
STATEMENTONINTERNALCONTROLThe Board is pleased to provide the following statement which outlines the nature and scope of internal control of Petroliam Nasional Berhad and its subsidiaries (PETRONAS Group) during the period in review.
Board’s ResponsibilitiesThe Board recognises the importance of
sound internal control and risk management
practices to good corporate governance
with the objective of safeguarding the
shareholders’ investment and the Group’s
assets. The Board affirms its overall
responsibility for the Group’s system of
internal controls and for reviewing the
adequacy and integrity of those systems
including financial and operational controls,
compliance with relevant laws and regulations
and risk management.
The Group has in place an ongoing process
for managing significant risks affecting the
achievement of its business objectives
throughout the period, which includes
identifying, evaluating, managing and
monitoring these risks that has been in
place for the period and up to the date of
approval of the Annual Report and Financial
Statements.
The Group’s system of internal control seeks
to manage and control risks appropriately,
rather than eliminate the risk of failure to
achieve business objectives. Because
of the inherent limitations in all control
systems, these internal control systems can
only provide reasonable and not absolute
assurance against material misstatement
or loss or the occurrence of unforeseeable
circumstances.

reimagining energyPETRONAS ANNUAL REPORT PE 2011 29
Internal Audit FunctionThe Board recognises that the internal
audit function is an integral component of
the governance process. One of the key
functions of PETRONAS’ Group Internal
Audit (GIA) Division is to assist the Group
in accomplishing its goals by bringing a
systematic and disciplined approach to
evaluate and improve the effectiveness of
risk management, control and governance
processes within the Group. GIA maintains its
impartiality, proficiency and due professional
care, as outlined in its Internal Audit Charter,
by having its plans and reports directly under
the purview of the Board Audit Committee
(BAC).
The internal audit function performs
independent audits in diverse areas within the
Group including management, accounting,
financial and operational activities, in
accordance with the annual internal audit plan
which is presented to the BAC for approval.
The BAC receives and reviews reports on
all internal audits performed including the
agreed corrective actions to be carried out
by the Management. GIA monitors the status
of agreed corrective actions through the
Quarterly Audit Status Report in which they
are recorded and assessed. The consolidated
reports are submitted and presented to the
BAC for deliberations.
GIA adopts the principles of the Institute of
Internal Auditor’s International Standards for
the Professional Practice of Internal Auditing.
Risk ManagementHaving regard to managing risk as an
inherent part of the Group’s activities, risk
management and the ongoing improvement
in corresponding control structures in all
significant risk areas including among others,
financial, health, safety and environment,
operations, geopolitics, trading and logistics,
remain a key focus of the Board in building a
successful and sustainable business.
A Risk Management Committee (RMC) is in
place to serve as a central platform of the
Group to assist the Management in identifying
principal risks at the Group level and providing
assurance on effective implementation of
risk management on a Groupwide basis. The
RMC also promotes sound risk management
practices through sharing of information and
best practices to enhance the risk culture
across the Group. The RMC seeks advice
and direction from the Executive Committee
and Board Governance and Risk Committee.
Group risks are being managed on an
integrated basis and their evaluation is
incorporated into the Group’s decision-
making process such as strategic planning
and project feasibility studies. Separate risk
management units or functions also exist
within the Group at various operating unit
levels, particularly for its listed subsidiaries,
to assess and evaluate the risk management
processes for reporting to their respective
Board and Management levels.

PETRONAS ANNUAL REPORT PE 201130
LimitsofAuthorityThe Limits of Authority (LOA) defines
expenditure spending limits for each level of
management within the Group. These limits
cover among others, authority for payments,
capital and revenue expenditure spending
limits and budget approvals. This LOA
manual provides a framework of authority
and accountability within the organisation and
facilitates decision making at the appropriate
level in the organisation’s hierarchy.
ProcurementThe Group has clearly defined authorisation
procedures and authority limits set for
awarding tenders and all procurement
transactions covering both capital and
revenue expenditure items. Tender
committees with cross functional
representation have been established to
provide the oversight functions on tendering
matters prior to approval by the approving
authorities as set out in the LOA approved by
the Board.
FinancialControlFrameworkThe Group has developed a Financial Control
Framework (FCF) with the principal objective
of enhancing the quality of the Company’s
financial reports through a structured process
of ensuring the adequacy and effectiveness
of key internal controls operating at various
levels within the Company at all times. FCF
requires among others, documentation of
key controls, remediation of control gaps as
well as a regular conduct of testing of control
operating effectiveness.
Other Elements Of Internal ControlThe other elements of the Group’s system of
internal control are as follows:
OrganisationalStructureThe internal control of the Group is supported
by a formal organisation structure with
delineated lines of authority, responsibility
and accountability. The Board has put in
place suitably qualified and experienced
management personnel to head the Group’s
diverse operating units into delivering results
and their performance are measured against
approved performance indicators.
BudgetApprovalBudgets are an important control mechanism
used by the Group to ensure an agreed
allocation of Group resources and that
the operational managers are sufficiently
guided in making business decisions. The
Group performs a comprehensive annual
planning and budgeting exercise including
the development and validation of business
strategies for a rolling five-year period and
establishment of performance indicators
against which business units and subsidiary
companies are evaluated.
Variances against the budgets are analysed
and reported to the Board on a quarterly
basis. The Group’s strategic directions are
also reviewed at reasonable intervals taking
into account changes in market conditions
and significant business risks.
On a semi-annual basis, each key process
owner at various management levels is
required to complete and submit a Letter of
Assurance which provides confirmation of
compliance to key controls for the areas of
the business for which they are accountable.
CorporateFinancialPolicyThe Corporate Financial Policy prescribes
the Group’s governing policies in effecting
the practice of financial risk management.
The policy stipulates a consistent framework
in which financial risk exposures of entities
within the Group are identified and strategies
developed to mitigate such risks. The policies
contained in the Corporate Financial Policy
are intended to provide clear communication
of the policy stance governing financial and
risk management throughout the PETRONAS
Group of Companies and consequently seeks
to provide a foundation upon which financial
risk management is practised across the
Group.
GroupHealth,SafetyandEnvironmentThe Group Health, Safety and Environment
(GHSE) Division drives various HSE
sustainable initiatives and defines the
framework that exemplifies the Group’s
effort to continuously meet legal compliance
and industry best practices. GHSE also
drives strategies and monitors and reports
performance to the Executive Committee to
ensure HSE risks are reduced to as low as
reasonably practicable.

reimagining energyPETRONAS ANNUAL REPORT PE 2011 31
EmployeesSenior Management sets the tone for a
nurturing culture in the organisation through
the Group’s Shared Values, developed to
focus on the importance of these four key
values – loyalty, integrity, professionalism and
cohesiveness. The importance of the Shared
Values is manifested in the Code of Conduct
and Discipline. Employees are required to
strictly adhere to the Code in performing their
duties.
Employees undergo structured training
and development programmes and
potential entrants or candidates are subject
to a structured recruitment process. A
performance management system is in place,
with established performance indicators
to measure employee performance and
the performance review is conducted on a
semi-annual basis. Action plans to address
employee developmental requirements are in
place. The Group believes that this will enable
employees to deliver their performance
indicators so that the Group can meet its
business requirements.
CONCLUSIONThe Board is of the view that the system
of internal control instituted throughout
the Group is sound and provides a level of
confidence on which the Board relies for
assurance. In the period under review, there
is no significant control failure or weakness
that would have resulted in material losses,
contingencies or uncertainties requiring
separate disclosure in the Annual Report.
The Board provides for a continuous review
of the internal control system of the Group to
ensure ongoing adequacy and effectiveness
of the system of internal control and risk
management practices to meet the changing
and challenging operating environment.
This statement is made in accordance with
the resolution of the Board of Directors dated
29 February 2012.
CrisisManagement The Group has in place a Contingency
Planning Standard which is designed to
provide guidelines for responding to any
major emergency or crisis by defining the
framework and delineation of roles and
responsibilities which enable support and
assistance where required. The Group
has implemented a three-tier response
system which seeks to provide a clear
demarcation of roles and responsibilities
between emergency site management,
operating unit management, corporate and
authorities. In the event of major emergency
or crisis, the response system will be
activated and the Group’s priority is the
protection of people, environment, asset
and reputation.
BusinessContinuityManagementThe Group is currently enhancing its
Business Continuity Management for
implementation across the Group. These
integrated business continuity strategies
shall provide comprehensive and clear
plans and procedures to enhance the
Group’s preparedness in managing
disasters that may disrupt business
operations.
The main objective is to respond and
reduce impact of crisis as well as recover
and restore the Group’s critical functions
within a reasonable period of time towards
sustaining the Group’s operational survival
thus protecting businesses, partners and
customers during crisis or disaster.

PETRONAS ANNUAL REPORT PE 201132
During the period, we also divested
our interest in Cairn India Limited and
recorded a gain of RM2.6 billion.
Closing balance of our Cash, Fund and
Other investments was RM164.3 billion,
a 5% growth from the balance as at 31
March 2011.
Our strong overall performance was
reflected in the improvement of our
Return on Average Capital Employed of
22% compared to 18% in FY2011.
FINANCIALRESULTS
REVIEW OF FINANCIAL RESULTS
PETRONAS Group delivered strong financial
performance in PE2011 compared to the
previous corresponding period. Revenue
increased by 27% and net profit attributable to
shareholders of the company increased by 10%.
The increase in revenue, from RM175.6 billion
to RM222.8 billion, was mainly driven by higher
realised prices and higher LNG sales volume.
On average, realised prices in PE2011 were
significantly higher compared to the same period
last year. Benchmark crude prices remained
elevated due to supply concerns arising from
continuing geopolitical tensions in the Middle
East and North Africa Region. Average Dated
Brent for PE2011 was USD113 per barrel
compared to USD81 per barrel in the previous
period, an increase of 40%.
LNG sales volume in PE2011 was 20.6 million
metric tonnes, led by the highest ever production
from the PETRONAS LNG Complex (PLC) in
Sarawak, Malaysia over a nine month period.
Revenue was however offset by a weaker US
Dollar against the Ringgit Malaysia and, to some
extent, crude oil production challenges faced
by the Group. The US Dollar weakened from an
average of RM3.17 to an average of RM3.06, a
drop of 11 sen during the period.
Group Earnings Before Interest, Tax,
Depreciation and Amortisation (EBITDA) and
Profit Before Taxation (PBT) were both higher by
19%.
The Group recorded a gain of RM2.6 billion
arising from the divestment of our interest in
Cairn India Ltd during the period. Excluding
this gain and Initial Public Offerings (IPO) gains
recorded in the previous corresponding period,
EBITDA and PBT improved significantly by 30%
and 33%, respectively.
HIGHLIGHTSAs announced, we changed our financial
year end from 31 March to 31 December
to synchronise our corporate planning
cycle with our ongoing transformation
efforts and to realign systems and
processes to support PETRONAS’
enhanced blue print and strategies. At the
same time, this change also facilitated
alignment of the Group’s financial year
end with the statutory filing requirements
of the various countries in which we
operate.
Led by better prices and LNG sales
volume, our financial results for this nine
month transition period from 1 April 2011
to 31 December 2011 were much better
than the previous corresponding period.
We recorded net profit attributable to
shareholders of the Company of RM48.9
billion, representing approximately 90% of
that achieved in the full 12 month period
ended 31 March 2011. Excluding gains
from the IPO recorded in 2010, results in
the nine month period under review was
7% higher than that achieved for the full
12 month period ended 31 March 2011.
DATUK MANHARLAL RATILAL
27% increase in RevenueRevenue of RM222.8 billion for the period, up
by 27% on the back of stronger prices for all
products
10% increase in ProfitNet profit attributable to shareholders of the
Company of RM48.9 billion increased by
10% on the back of higher prices and better
Liquefied Natural Gas (LNG) sales volume
22% ROACEReturn on Average Capital Employed
(ROACE) of 22%, an improvement from 18%
in FY2011

reimagining energyPETRONAS ANNUAL REPORT PE 2011 33
The Group’s total assets increased by RM38.6
billion or 9% from 31 March 2011. Property, Plant
and Equipment increased by 8% as a result of
further investments in major growth projects and
improvements to maintain the integrity of our
existing assets.
The Group generated RM72.0 billion in cash
from operations. This was sufficient to sustain
the current period capital investments and
dividends. Capital investments spent in PE2011
was RM30.8 billion with most of it allocated to
our Exploration & Production (E&P) business to
support exploration as well as to intensify efforts
to develop new fields and enhance recovery from
maturing existing fields. Out of the RM30.8 billion,
close to 60% was spent in Malaysia. Cash, Fund
and Other Investments ended higher at RM164.3
billion as at 31 December 2011 from RM156.4
billion as at 31 March 2011.
In line with higher profits, the Group’s Return on
Total Assets (ROTA) and ROACE increased to
23% and 22% respectively. The Gearing Ratio
was relatively unchanged at about 15%.
PE2011 +/- (%) 9M* FY2011 FY2010 FY2009 FY2008
Revenue 222.8 26.9 175.6 241.2 210.8 264.2 223.1
EBITDA 95.5 18.5 80.6 107.9 83.3 105.7 105.9
Profit Before Taxation 82.7 18.7 69.7 90.5 67.3 89.1 95.5
Net Profit Attributable to PETRONAS Shareholders 48.9 10.4 44.3 54.8 40.3 52.5 61.0
Total Assets 477.6 8.8** 439.0 410.9 389.8 339.3
Shareholders’ Funds 288.3 9.3** 263.8 242.9 232.1 201.7
PETRONAS’ Key Financial Ratios
PE2011 FY2011 FY2010 FY2009 FY2008
Return on Revenue 37.1% 37.5% 31.9% 33.7% 42.8%
Return on Total Assets 22.9%*** 20.6% 16.4% 23.0% 28.1%
Return on Average Capital Employed 21.8%*** 17.5% 15.9% 22.0% 28.0%
Debt/Assets Ratio 0.11x 0.11x 0.13x 0.11x 0.11x
Gearing Ratio 15.4% 15.3% 17.6% 15.9% 15.8%
Dividend Payout Ratio 61.3% 54.7% 74.4% 57.1% 39.3%
Overall Resource Replenishment Ratio 1.7x 2.5x 1.1x 1.8x 0.9x
08 09 10 11 9M PE11
264.2241.2
175.6
222.8223.1 210.8
08 09 10 11 9M PE11
105.7107.9
95.5105.9
83.380.6
08 09 10 11 9M PE11
89.1 90.582.7
95.5
67.3 69.7
Revenue Profit Before TaxationEBITDA
52.5 54.848.9
61.0
40.344.3
389.8439.0
477.6
339.3
410.9
232.1
263.8288.3
201.7
242.9
Net Profit Attributable to
PETRONAS Shareholders
Shareholders’ FundsTotal Assets
08 09 10 11 PE11 08 09 10 11 PE11 08 09 10 11 PE119M
* 9M - unaudited nine month 1 April 2010 to 31 December 2010. Included for comparative purposes with audited PE2011 result
** % change from 31 March 2011 to 31 December 2011
*** calculated based on annualised figures
Note: See Glossary on page 112
PETRONAS’ Key Financial IndicatorsInRMbillion
InRMbillion
PETRONAS ANNUAL REPORT PE 201134
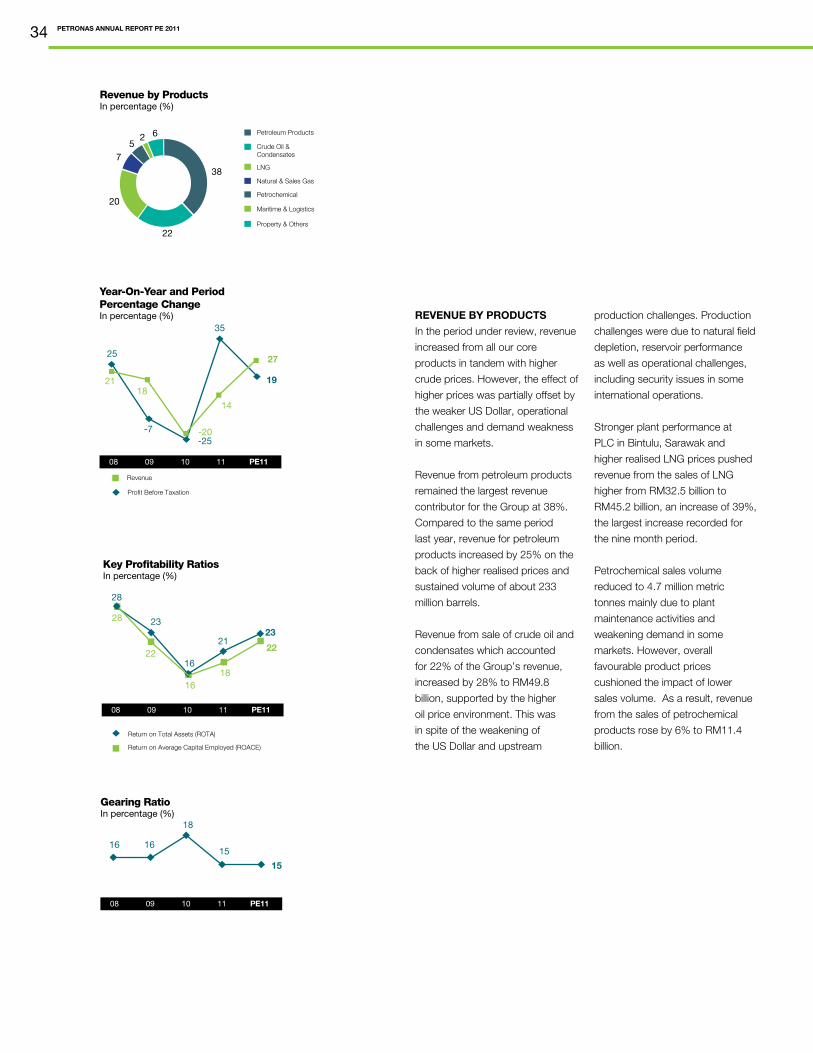
REVENUE BY PRODUCTS
In the period under review, revenue
increased from all our core
products in tandem with higher
crude prices. However, the effect of
higher prices was partially offset by
the weaker US Dollar, operational
challenges and demand weakness
in some markets.
Revenue from petroleum products
remained the largest revenue
contributor for the Group at 38%.
Compared to the same period
last year, revenue for petroleum
products increased by 25% on the
back of higher realised prices and
sustained volume of about 233
million barrels.
Revenue from sale of crude oil and
condensates which accounted
for 22% of the Group’s revenue,
increased by 28% to RM49.8
billion, supported by the higher
oil price environment. This was
in spite of the weakening of
the US Dollar and upstream
production challenges. Production
challenges were due to natural field
depletion, reservoir performance
as well as operational challenges,
including security issues in some
international operations.
Stronger plant performance at
PLC in Bintulu, Sarawak and
higher realised LNG prices pushed
revenue from the sales of LNG
higher from RM32.5 billion to
RM45.2 billion, an increase of 39%,
the largest increase recorded for
the nine month period.
Petrochemical sales volume
reduced to 4.7 million metric
tonnes mainly due to plant
maintenance activities and
weakening demand in some
markets. However, overall
favourable product prices
cushioned the impact of lower
sales volume. As a result, revenue
from the sales of petrochemical
products rose by 6% to RM11.4
billion.
Revenue by ProductsInpercentage(%)
Petroleum Products
Natural & Sales Gas
Crude Oil &Condensates
LNG
Maritime & Logistics
Petrochemical
Property & Others
38
22
20
75
2 6
Gearing RatioInpercentage(%)
08 09 10 11 PE11
18
16 16
15
15
Year-On-Year and Period Percentage ChangeInpercentage(%)
08 09 10 11 PE11
25
-7
19
35
-25
2118
-20
14
27
Profit Before Taxation
Revenue
Key Profitability RatiosInpercentage(%)
08 09 10 11 PE11
28
23
2123
16
Return on Average Capital Employed (ROACE)
16
28
2222
18
Return on Total Assets (ROTA)

reimagining energyPETRONAS ANNUAL REPORT PE 2011 35
REVENUE BY GEOGRAPHICAL
TRADE
PETRONAS recorded higher
revenue in all of its geographical
segments. Increases were recorded
in both international and export
segments where realised prices
moved in tandem with the market.
International Operations recorded
an increase of 32% in its revenue
to RM90.6 billion supported by
higher prices realised for the sale of
crude oil and petroleum products.
This translated to a 41% share of
Group total revenue, an increase
of 2% compared to the previous
corresponding period.
Our exports also recorded a
significant increase of 31% in
revenue to RM87.1 billion, mainly
due to higher revenue earned from
export of LNG and crude oil and
condensates. This translated to a
39% share of Group total revenue.
In domestic operations where
prices of petroleum products
and sales gas are subjected to
government regulated pricing,
revenue increased by a relatively
modest RM4.7 billion or 12%
compared to the previous
corresponding period.
SEGMENT EARNINGS
During PE2011, E&P business
recorded Net Operating Profit After
Tax (NOPAT) of RM36.0 billion
compared to RM23.5 billion in the
corresponding period last year, an
increase of 53%. The increase was
mainly due to higher realised prices
of crude oil and condensates and
lower operating costs.
Gas & Power business also
recorded higher NOPAT of RM12.6
billion compared to RM10.2 billion
in the corresponding period last
year, an increase of 24%. The
increase was driven by improved
LNG sales volume and LNG trading
margins but was partially offset
by losses incurred from sales gas
delivered in Peninsular Malaysia
due to regulated gas pricing, not
keeping up with costs.
Collectively, E&P and Gas & Power
businesses contributed 93% to the
Group’s gross NOPAT.
Downstream business recorded
lower NOPAT of RM4.4 billion, a
drop of 14% from RM5.1 billion.
This was due to lower realised
refining margins despite recording
higher revenue for the period and
improved product spreads in the
petrochemical business.
Revenue by Geographical TradeInRMbillion
241.2
175.6
222.8
99.1
68.5 90
.6
92.5
66.7
87.1
49.6
40.4
45.1
98.3
86.8
111.
2
89.9
210.8
75.8
92.3
42.7
54.7
46.4
Domestic InternationalExports
08 09 10 11 9M PE11
223.1
264.2
The Corporate & Others (C&O)
segment comprising mainly
Maritime & Logistics and the
Property business, recorded a
loss of RM0.6 billion. The shipping
industry’s oversupply conditions
exerted further downward
pressure on shipping rates, which
necessitated our shipping arm,
MISC Berhad, to exit the liner
business. The move resulted in
an accelerated provision of losses
resulting in an overall loss for the
C&O segment.
Gross NOPAT by Business SegmentInRMbillion
Exploration and Production
23.5
36.053%
Gas and Power
10.2
12.624%
Downstream
5.1
4.4-14%
Corporate and Others
1.5
-0.6> -100%
9M PE2011

PETRONAS ANNUAL REPORT PE 201136
SEGMENT CAPEX
During PE2011, the Group
spent RM30.8 billion on
capital investments, an
increase of 26% from the
corresponding period last
year.
E&P business accounted
for 68% of the total
investment to sustain and
grow production both in
Malaysia and internationally.
RM12.1 billion was spent
in Malaysia to reverse
declining production
by focusing more on
increasing the recovery
rate of producing fields
and developing new fields.
Among the key projects in
Malaysia are the Gumusut-
Kakap and Kinabalu Non-
Associated Gas projects
in Sabah and the Tangga
Barat project in Peninsular
Malaysia. In terms of
capital investments
made internationally, key
countries included Iraq,
Egypt and Turkmenistan.
This also included the
acquisition of equity in the
Montney Shale Gas Asset
in Canada, from Progress
Energy Resources
Corporation.
Gas & Power business
investments increased by
almost twofold to RM4.5
billion in PE2011. Key
projects included the
GLNG project in Australia
and the Melaka LNG
Regasification Terminal
project. Both projects are
important to meet the
nation’s growing energy
needs.
Similarly, Downstream
business also recorded
an increase in its capital
investments by RM0.5
billion to RM1.8 billion.
Most of the spending was
made by PETRONAS
Chemicals Group Berhad
and Engen Limited on
plant facilities and asset
acquisitions respectively,
during the period under
review.
C&O segment spent
RM3.5 billion during
the period with MISC
accounting for 66% of the
total spending. The bulk
of capital investments for
MISC were spent on new
petroleum tankers and
offshore floating facilities.
The remainder was spent
mostly by KLCC Group
which undertook significant
investments in the
commercial development of
PETRONAS Tower 3 and
government buildings in
Putrajaya.
37.1
26.8
10.3 34.9
24.530.8
23.4
16.9 17
.8
11.5
7.6 13
.0
44.0
26.2
17.8
20.0
37.6
17.6
Domestic and InternationalCAPEX BreakdownInRMbillion
Domestic International
08 09 10 11 9M PE11
Gas and Power
Downstream
Corporate and Others
Exploration and Production Domestic E&P
International E&P
CAPEX Allocation for PE2011Inpercentage(%)
42586815
6
11

reimagining energyPETRONAS ANNUAL REPORT PE 2011 37
PAYMENTS TO GOVERNMENTS
AND SUBSIDIES
During PE2011, PETRONAS paid
RM58.4 billion to the Federal and
State Governments in Malaysia
which comprised dividend
payments of RM30 billion, taxes of
RM21.9 billion, petroleum proceeds
of RM5.4 billion and export duties
of RM1.1 billion. Dividend at RM30
billion translated to a dividend
payout ratio of 61%.
Potential revenue foregone as
a result of the regulated pricing
imposed on the supply of gas to
customers in Peninsular Malaysia’s
power and non-power sectors was
RM18.4 billion with the power and
non-power sectors accounting for
RM10.3 billion and RM8.1 billion
respectively. This was after taking
into account the increase of RM3
per mmBtu in the sales price
announced by the Government
commencing 1 June 2011.
Since its inception, PETRONAS has
paid a total of RM653 billion to both
Federal and State Governments
and foregone potential revenue of
RM154.9 billion since regulated
gas prices came into effect in May
1997.
Potentialrevenueforegone(Subsidies) PE2011 +/-(%) FY2011 Cumulativetotalsince1997
In RM billion
POWER SECTOR
- Tenaga Nasional Berhad
- Independent Power Producers
10.3
3.9
6.4
-11.2
-20.4
-4.5
11.6
4.9
6.7
108.5
46.1
62.4
NON-POWER SECTOR - including industrial,
commercial, residential users and NGV8.1 -4.7 8.5 46.4
Total 18.4 -8.5 20.1 154.9
Dividend Payout RatioInpercentage(%)
08 09 10 11 PE11
74
5561
39
57
Dividend
Taxes
Petroleum Proceeds
Export Duty
Payments to the Malaysian GovernmentInRMbillion
08 09 10 11 PE11
26.0
24.0
29.4
30.0
18.7
30.0
30.0
30.0
25.1
21.9
9.5 2.
1 12.4 2.
2
8.3
0.6 9.
3
5.4
1.3
1.1
61.6
74.0
57.6
65.7
58.4

PETRONAS ANNUAL REPORT PE 201138
28.4Group Total Discovered Resources
of 28.4 billion boe and contribution of
over 25% from international assets.
billionboe
1.7 oRRR of 1.7 times for the
Group, for total oil and gas
resources.
x
2,047Total production of 2,047 thousand boe
per day with contribution from international
production of 519 thousand boe per day,
equivalent of 25% of the Group’s total
production.
thousandboeper day

reimagining energyPETRONAS ANNUAL REPORT PE 2011 39
maximising resources for growth

PETRONAS ANNUAL REPORT PE 201140
Our international position was strengthened
with portfolio highgrading efforts and
focus on delivering high quality assets. The
disciplined portfolio management system
that has been put in place for all projects in
Malaysia and abroad helped strengthen the
business fundamentals of PETRONAS E&P
Business.
As the number of activities grow and risk
levels elevate, safety management will
become a priority. Nevertheless, we remain
committed to the challenging goals we have
set for ourselves on our operational and
financial fronts. As expected, the challenges
are daunting especially in the initial years of
driving towards achieving these aggressive
goals. However, we are confident that the
business and organisation fundamentals as
well as the transformation efforts we have
embarked on will continue to propel us to our
aspired goals. Delivery and Performance will
be the critical success factors going forward.
EXPLORATION&PRODUCTION
Innovative, Out of the Box ApproachSepat fast track development - record of 12
months project execution to first production
and Tangga Barat smart options in gas
production to support national gas supply
needs
Intensified Exploration EffortsSuccessful exploration programme with 19
discoveries and proved-up new play in shallow
oil Sarawak and Vietnam basement
Aggressive Investment in MalaysiaConcluded 10 new exploration Production
Sharing Contracts (PSCs) and awarded the
second Risk Service Contract (RSC) for the
Balai Cluster fields
Growing International VenturesAchieved first gas production in Turkmenistan
and successful acquisition of shale gas asset
in Canada
HIGHLIGHTS
DATO’ WEE YIAW HIN
E&P Business has set clear and challenging
goals with strategies in place which are being
executed and are progressing as planned.
These imperatives have helped drive the
transformation of the E&P Business through
enhanced Structure, Process & Systems as
well as embed a Culture of Accountability,
Delivery and Performance. With these in
place, the period under review was an
eventful one for us. My leadership team and
I are very pleased that the organisation was
able to focus on delivery and performance,
including venturing into new and innovative
methods to achieve notable results. In many
ways, these are the results of the aggressive
transformation being pursued.
Testimony to this transformation, a number
of records were attained including the
number of project start ups within record
time, exploration discoveries in Malaysia,
including in areas disregarded by others
for many years, record high number of
PSCs concluded and rigorous production
enhancement with notable volumes achieved.
Over the next year or two, we aim to arrest
the decline in domestic production due to
depleting fields with production enhancement
and new aggressive developments.

reimagining energyPETRONAS ANNUAL REPORT PE 2011 41
OVERVIEWPETRONAS’ Exploration and Production (E&P)
business is focused on enhancing the value
and growing PETRONAS’ oil and gas resource
base. This is done by driving and carrying out
exploration, development and production of oil
and natural gas resources within the country
and overseas, leveraging on both the resource
owner role in Malaysia and as a reputable
operator globally.
PETRONAS Group continues to play an
enabler role as the host authority for the oil
and gas industry in Malaysia to maximise
upstream value, sustain production and
enhance prospectivity of the nation’s acreages.
PETRONAS also carries out upstream efforts
through partnerships with leading international
oil and gas companies and its wholly-owned
E&P subsidiary, PETRONAS Carigali Sdn Bhd
(PCSB).
As Malaysian basins become more mature,
PETRONAS faces considerable challenges
in sustaining production. To address this,
three key strategies were adopted namely
rejuvenation of existing fields through
Enhanced Oil Recovery (EOR), development
of marginal fields through innovative solutions
and intensified exploration activities, all of
which complement the Malaysian Economic
Transformation Programme (ETP). This involves
extending the lifecycle of existing resources
by optimising exploration, development and
production activities.
Significant efforts were made in the period
under review, not only by PETRONAS, but also
by the PSC and RSC contractors, as well as a
multitude of Malaysian service industries with
the Government’s support.
In line with its first strategy to maximise the
recovery of producing fields through EOR and
Improved Oil Recovery (IOR), PETRONAS
approved more than 380 million barrels of
oil equivalent (mmboe) additional oil and
gas resources to be developed. Through its
second strategy to unlock the monetisation
potential of marginal fields through innovative
solutions, the development of Balai Cluster
fields was awarded under a RSC arrangement,
the second of its kind, following Berantai RSC
which was awarded last year. This innovative
commercial solution continues to enable the
development of challenging marginal fields.
In its efforts to support long term growth by
intensifying exploration activities, proving
up new play types and exploiting remaining
potential, more than 530 mmboe of new
resources was discovered. PETRONAS’ future
positioning was further strengthened through
new investments, with 10 new exploration
PSCs concluded by the period end. These
conscious efforts will revitalise the domestic oil
& gas industry by helping to attract and sustain
upstream investments, which will in turn help
Malaysia to sustain its production and grow its
resource base.
In the international arena, the key areas of
focus was in highgrading the E&P portfolio,
as well as to ensure successful delivery
of development and exploration business
objectives. Achieving first gas production,
together with the signing of a Gas Sales
Agreement (GSA) for Block 1 in Turkmenistan
were key highlights of delivery success. This
signifies PETRONAS’ perseverance to operate
in challenging international operations as
well as provide confidence for future major
commitments in Iraq, Venezuela and Canada.
Divestment and dilution of six existing assets
were undertaken driven by profitability and
EXPLORATION&PRODUCTION

PETRONAS ANNUAL REPORT PE 201142
prudent risk management. In driving growth,
a successful major acquisition of a shale gas
asset in Canada increased the resource and
production potential in the portfolio. This has
provided PETRONAS with a foothold in a
new country and continent, and also signifies
PETRONAS taking the first major step in
venturing into shale gas opportunities.
Overall, total production for PETRONAS
was lower at 2,047 thousand barrels of oil
equivalent (kboe) per day compared to 2,119
kboe per day in the previous corresponding
period, despite aggressive production efforts.
The difference was largely due to continued
natural field depletion in maturing fields, major
reservoir issues and operational uncertainties
in international ventures. Of this, PETRONAS
Group’s share of total production amounted to
1,424 kboe per day.
In terms of its resource base, PETRONAS
successfully maintained a healthy three-year
rolling average Overall Resource Replenishment
Ratio (oRRR) of 1.7x for the Group with
domestic oRRR at 1.6x and international at
1.97x. New resource addition was recorded
at 1.2 billion boe which was contributed by
exploration discoveries, accounting for 70%,
with the balance resulting from EOR, IOR and
Improved Gas Recovery (IGR) efforts from
both Malaysia and international operations.
This brings the Group’s hydrocarbon resource
base for 2P and 2C to 13.5 and 14.9 billon
boe respectively. Liquids resources stand at
4.9 billion barrels, and 3.9 billion barrels for
2P and 2C respectively, while natural gas
for 2P and 2C stands at 8.4 and 10.8 billion
boe, respectively. Unconventional resources
stand at 0.2 and 0.1 billion boe for 2P and 2C
respectively. In total, the Group’s oil and gas
resources remained relatively stable with close
to 75% residing in Malaysia.
1 January 2012 % 1January
2011
Crude Oil & Condensates
Reserves (2P)
Contingent Resources (2C)
Entitlement
4.853
3.878
3.125
3.5%
0.0%
8.1%
4.689
3.879
2.89
Natural Gas
Reserves (2P)
Contingent Resources (2C)
Entitlement
8.396
10.844
6.465
-1.3%
0.5%
18.0%
8.508
10.789
5.479
Unconventional
Reserves (2P)
Contingent Resources (2C)
Entitlement
0.239
0.145
0.235
2.6%
-22.9%
14.1
0.233
0.188
0.206
Total Discovered Resources
PETRONAS Entitlement
Overall Resource Replenishment Ratio (3yrsave)
28.355
9.825
1.7x
0.2%
14.6%
28.286
8.575
2.5x
PETRONAS’ Group Petroleum ResourcesBboe (billion barrels of oil equivalent)
PETRONAS’ Group Oiland Gas Production‘000boeperday
2,2882,137
2,119 2,047
2,288 2,271
1,65
9
1,61
4
1,60
2
1,52
8
1,67
3
629
523
517
51961
5
1,63
164
0
Malaysia International
08 09 10 11 9M PE11
PETRONAS’ Group Resource Addition BySource
68%
32%
Exploration EOR/IOR/IGR
PETRONAS’ Group Resource AdditionMMboe
08 09 10 11 PE11
1,200
Malaysia International
1,646
1,24
640
0
1,705
698
864
1,00
7
336
1,877
1,04
483
3
679
1,593
914

reimagining energyPETRONAS ANNUAL REPORT PE 2011 43
The production of crude oil and
condensates amounted to an
average of 557 thousand barrels
per day. This is 12% lower than the
previous corresponding period of
630 thousand barrels per day.
Natural gas production remained
stable averaging at 5.826 billion
cubic feet per day (equivalent to
971 kboe per day), compared
to 5.832 billion cubic feet per
day (972 kboe per day) in the
corresponding period last year.
Nevertheless, fulfilling domestic gas
demand remains a major upstream
challenge.
On the back of higher average oil
prices, PETRONAS’ share of total
average domestic production,
inclusive of PCSB, accounted
for 1,069 kboe per day or 72%
of Malaysia’s total average
production, which is comparable to
the previous year’s share of 69%.
Overall production was maintained
by the addition of three new gas
fields (Cilipadi, F9 and Melor &
Laho) and three new oil fields
(Dana, East Piatu and Sepat) that
were brought onstream during the
period under review. This increased
the total number of producing fields
in Malaysia to 124, comprising 76
oil fields and 48 gas fields.
An inventive and novel approach
to field development is integral in
efforts to sustain business delivery
in PETRONAS. Two Malaysian
projects that merit recognition
are the Tangga Barat cluster and
Sepat field developments. Fields
in the Tangga Barat cluster were
brought onstream five months
earlier than planned, through
‘smart’ recognition of opportunities
from the reservoir potential and
modification of the design facilities.
This was instrumental in alleviating
the challenging situation of the gas
supply requirements for Peninsular
Malaysia. In the Sepat oil project,
leveraging on innovative workflow
and processes, as well as effective
framing in the development design
and planning, enabled faster
procurement and project execution.
This resulted in significant cost and
schedule benefits, leading to the
achievement of first oil production
more than one year ahead of the
original schedule.
MALAYSIA’S EXPLORATIONAND PRODUCTIONAs a resource owner, PETRONAS
is responsible for managing and
sustaining the production of oil
and gas in Malaysia. For the
period under review, Malaysia’s
total production decreased by
5% to 1,528 kboe per day from
1,602 kboe per day in the previous
corresponding period.
The challenge to sustain oil
production levels is expected
to persist for the next one to
two years. This is mainly due to
maturing fields and is compounded
by reservoir issues from both
deepwater and shallow water
fields. Additionally, major scheduled
maintenance and shutdown
programmes were carried out
during this period, involving
over 70 fields and 10 pipelines.
These shutdowns were planned
to coincide with tie-in work for
new field development facilities
expected to come onstream in the
next few years. Concerted efforts
to ensure the integrity of assets and
safe operations remain the highest
priority.
RISK SERVICE CONTRACTS
Is a new petroleum
arrangement by PETRONAS
for the development of
marginal fields. Instead of
trying to improve the PSC
terms, this model strikes a
balance in the sharing of risks
with fair returns. Under this
arrangement, PETRONAS is the
project owner while contractors
are service providers with
equity share in the RSC.
Upfront investment of the
capital is contributed by the
contractors according to their
equity share. Contractors will
receive payment only upon first
production
IN FOCUS

PETRONAS ANNUAL REPORT PE 201144
Enabling technical and commercial
development for marginal fields was also
a focus for PETRONAS. In the period
under review, the RSC for Balai Cluster
was signed on 16 August 2011 with Roc
Oil Malaysia (Holdings) Sdn Bhd, Dialog
D&P Sdn Bhd and PCSB. The underlying
principle for this arrangement was the
sharing of commercial and technical
risks between the host authority and
contractors which was viable and
mutually acceptable by both parties.
The commercial arrangement caters
for the appraisal of the reserves, thus
managing the technical risks involved.
In recognition of the evolving landscape
of upstream opportunities in Malaysia,
PETRONAS’ future direction continues
to encourage attractive arrangements
of mutual risk-sharing and innovative
development approaches.
For longer term production, harnessing
EOR potential is a key strategy. Two
EOR projects were approved, affirming
141 millon stock tank barrels (mmstb)
of oil to be developed under recovery
maximising efforts. Additionally, the
Heads of Agreement for two new EOR
and further reserve development PSCs,
for Baram Delta and North Sabah,
were signed in November 2011. With
this, the total reserves to be developed
under EOR grew by 750 mmstb,
with investments of USD12 billion
over the next 20 to 30 years. These
milestones are timely with PETRONAS’
establishment of the E&P Technology
Centre (EPTC) in September 2011,
which focuses on the development and
deployment of EOR and high carbon
dioxide (CO2) management technologies,
and provides a “One Stop Shop” to
institutionalise these core capabilities
within the PETRONAS Group. The
seamless integration of R&D, field
development planning and deployment
in the monetisation of EOR and high
CO2 gas fields leverages on technical
collaboration and sharing of resources
with PSCs undertaking these projects
in Malaysia. PETRONAS aspires to
position EOR and CO2 management as
value propositions in its partnerships and
international operations in the future.
As at 1 January 2012, Malaysia’s total
discovered resources increased by over
2% to 21.3 billion boe from 20.9 billion
boe last year. The oRRR for the year
was 1.6x for total oil and gas in Malaysia.
Exploration discoveries contributed to
over 60% of the new resources added in
Malaysia with the remaining added from
efforts in IOR and EOR.
For the period, exploration efforts
continued to be encouraging with 14 out
of 22 exploration wells drilled showing
positive results. In the drive to intensify
exploration activity, key efforts include
ensuring the availability of a complete
inventory of technically-ready prospects
for drilling, fast drilling execution
and close integration in common rig
utilisation. This practical initiative ensured
that the targeted number of wells were
drilled. Exploration activities were also
supported by the drive to prove-up new
plays for resource growth, which in some
cases involved initiatives to overcome
previous skepticism of exploration
targets.
Additionally, two exploration PSCs were
awarded while eight were finalised, giving
promise that exploration investments
and activities will be sustained. The
exploration PSCs awarded included
deepwater Blocks R & S. Block R was
awarded to JX-Nippon-Inpex Consortium
(75% equity) and PCSB (25% equity).
Block S was awarded to Inpex (75%
equity) and PCSB (25% equity).
Overall, a total of RM30.1 billion was
spent in Malaysia’s upstream sector
during the period. Of this, RM16.4 billion
or 54% was for development activities,
RM2.4 billion or 8% for exploration and
RM11.3 billion or 38% for operational
expenditure.
1,673
1 January 2012 % 1January
2011
Crude Oil & CondensatesReserves (2P)
Contingent Resources (2C)
3.739
2.215
4.7%
-3.1%
3.572
2.286
Natural GasReserves (2P)
Contingent Resources (2C)
6.815
8.539
2.3%
2.4%
6.660
8.337
Total Discovered Resources
Overall Resource Replenishment Ratio (3yrsave)
21.308
1.6x
2.2% 20.855
1.5x
Malaysia’s Petroleum ResourcesBboe (billion barrels of oil equivalent)
Malaysia’s Average Oiland Gas Production‘000boeperday
CrudeOil Condensates NaturalGas
08 09 10 11 9M PE11
128
563
982 1,659
1,673
125
554
980
1,631
122
535
974
1,6141,602
1,528
512
518
451
115
112
106
987
972
971

reimagining energyPETRONAS ANNUAL REPORT PE 2011 45
INTERNATIONAL EXPLORATIONAND PRODUCTIONThe Group’s international E&P business performance remains healthy. Total average production from the Group’s international operations stood at 519 kboe per day, a slight increase from 517 kboe per day for the same period last year. Liquids production remained at 249 kboe per day, marginally lower than the same period in the previous year of 253 kboe per day, while gas production increased to 270 kboe per day from 264 kboe per day for the corresponding period in the previous year, mainly due to the Turkmenistan gas project coming onstream.
The achievement of first gas and the conclusion of the GSA for Turkmenistan’s Block 1 in July 2011 were significant milestones for PETRONAS E&P due to its considerable reserves and production potential. With these achievements, the Onshore Gas Terminal (OGT) in Kiyanly is now commissioned and fully operational to support the future gas production increase from Block 1 at the capacity of 500 mmscfd. This period also saw first production from two fields in Sudan (Blocks 3&7 and Blocks 1,2,4) and one field in Indonesia (Gajah Baru). Additionally, international operations were strengthened
1 January 2012 % 1January
2011
Crude Oil & Condensates Reserves (2P)
Contingent Resources (2C)
Entitlement
1.114
1.663
0.587
-0.3%
4.4%
24.6%
1.117
1.593
0.471
Natural Gas Reserves (2P)
Contingent Resources (2C)
Entitlement
1.581
2.305
1.005
-14.4%
-6.0%
61.7%
1.848
2.452
0.766
Unconventional Reserves (2P)
Contingent Resources (2C)
Entitlement
0.239
0.145
0.235
2.6%
-22.9%
0.0%
0.233
0.188
0.206
Total Discovered Resources
PETRONAS’ Entitlement
Overall Resource Replenishment Ratio (3yrsave)
7.047
1.827
1.97x
-5.2%
40.8%
7.431
1.443
5.6x
PETRONAS’ International Petroleum ResourcesBboe (billion barrels of oil equivalent)
THE THREE STAGES OF OIL
FIELD DEVELOPMENT
Primary Recovery — Oil is forced
out by pressure generated from
gas present in the oil reservoir
Secondary Recovery — The
reservoir is subjected to water
flooding or gas injection to
maintain a pressure that
continues to move oil to the
surface
Tertiary Recovery — Also known
as Enhanced Oil Recovery
(EOR), introduces fluids that
reduce viscosity and improve
flow. These fluids could consist
of gases that are miscible with
oil (typically carbon dioxide),
steam, air or oxygen, polymer
solutions, gels, surfactant-
polymer formulations,
alkaline-surfactant-polymer
formulations, or microorganism
formulations
IN FOCUS
Breakdown ofInternational ResourcesbyRegion
MiddleEastandAsia
SouthEastAsiaandOceania
Americas
Africa
PETRONAS International Oiland Gas Production‘000boeperday
CrudeOil&Condensates Gas
08 09 10 11 9M PE11
519
270
249
Breakdown ofInternational ProductionbyRegion
Note:SouthEastAsiaexcludesMalaysia
MiddleEastandAsia
SouthEastAsiaandOceania
Africa
58%
6%
36%
31%
37%
8%
24%
640
265
375 523
517
252
253
271
264
629
276
353
287
615
328

PETRONAS ANNUAL REPORT PE 201146
with the opening of a new PETRONAS office in Juba, the capital of the Republic of South Sudan. This supported production operations while facilitating stakeholder management in the newly formed country post the Sudan Referendum and the country’s independence. In Iraq, both the Garraf Base Camp and the PETRONAS representative office in Baghdad were successfully operationalised.
PETRONAS’ international resource base continued to grow with new resource additions from both exploration and improved recovery efforts. Notable discoveries were made in Vietnam and Turkmenistan. Vietnam’s Diamond-4X well made oil discovery, extending PETRONAS’ success in exploiting the country’s basement potential in Block 01/02. Turkmenistan’s Garagyol Deniz West-1 discovery in Turkmenistan Block 1 assures the promise of further oil resource potential of over 80 mmboe.
In continuing efforts to high grade the E&P portfolio, a notable milestone was achieved through the successful acquisition of 50% equity in the Montney Shale Gas Asset
in Canada, from Progress Energy Resources Corporation. This was concluded in August 2011, which gives PETRONAS rights to exploit the shale gas potential, in collaboration with the existing operator, Progress. It also signifies a critical milestone in PETRONAS’ intent to pursue and grow in unconventional plays, while complementing its existing portfolio with the Gladstone CBM and LNG integrated development in Australia. Meanwhile, dilutions and divestments were concluded for six assets, driven by profitability, prudent risk management and the greater objective of enhancing portfolio value return and strategic alignment. Farm-outs included assets in Cuba, Mauritania and Uzbekistan while relinquished assets included exploration blocks in Sudan and Uzbekistan.
This brings PETRONAS’ international resource total to 7.0 billion boe, a decrease of 5% compared to the previous year; with 2.9 billion boe of 2P and 4.1 billion boe of 2C resources as at 1 January 2012. The decrease reflects the result of de-booking resources for relinquished assets in 2010 and 2011 namely in Ethiopia, Pakistan and Sudan. The
three-year rolling average oRRR achieved for the review period for international was 1.97x. On the whole, the resource base continued to be heavy in gas which are mainly located in Turkmenistan, Malaysia-Thailand Joint Development Area, Australia and Egypt. More than 80% of the oil and gas resources are located in Middle East and Asia, Africa and South East Asia region.
A total of RM11.8 billion was invested in international E&P ventures, of which 52% was for development, 12% for exploration and the rest for operations of existing assets.
THE MONTNEY SHALE GAS ASSET
play is in east-central British Columbia. The Montney
Formation has sandy facies in Western Alberta, where
oil is produced in the Sturgeon Lakes and Saddle Hills
areas. Major facies include fine-grained shoreface
sandstones, shelf siltstones and shales, fine-grained
turbidites and organic-rich phosphatic shale. Natural gas
is extracted from siltstone reservoir in the Dawson Creek
and Pouce Coupe areas and gas rich silty shales occur in
the northern and western fringes of the deposit.
IN FOCUS

reimagining energyPETRONAS ANNUAL REPORT PE 2011 47
Disclaimer on forward-looking statements: Forward-looking statements involve inherent risks and uncertainties. Should one or more of these or other uncertainties or risks materialise, actual results may vary materially from those estimated, anticipated or projected. Specifically, but without limitation, capital costs could increase, projects could be delayed, and anticipated improvements in capacity, performance or profit levels might not be fully realised. Although PETRONAS believes that the expectations of its management as reflected by such forward-looking statements are reasonable based on information currently available to it, no assurances can be given that such expectations will prove to have been correct. Accordingly, you are cautioned not to place undue reliance on the forward-looking statements, which speak only as of the date they are made. PETRONAS undertakes no obligation to update or revise any of them, whether as a result of new information, future developments or otherwise.
» EXPLORATION
AND PRODUCTION
OPERATIONS
PETRONAS continues
to place strong
emphasis on HSE
in all aspects of our
operations through
integrating essential
practices into our
business activities in
line with international
standards and
practices.
acquisition of new assets to enhance the portfolio for long term asset quality and sustainable profitability.
The over arching priority will continue to be in sustaining and realising production. Nevertheless, operating in countries with geopolitical uncertainties like Sudan and Iraq may affect achievement of production targets. This will be an area of great challenge for the Group in the future.
PETRONAS is fully committed to HSE excellence. Internal transformation in the E&P organisation continues to be implemented to elevate and enhance HSE leadership drive, which focuses on operational HSE and structural needs to ensure systems robustness. Process Safety Management and Behavioural Safety practices will be the key for seamless integration in work culture, to support the journey of achieving HSE excellence.
OUTLOOK The global upstream sector is expected to remain exciting in 2012, driven by dynamic business drivers such as oil price, energy demand outlook, global economic recovery and geopolitical uncertainties.
While many parties are reaping the benefits from current oil prices, the question remains, whether the high price levels can be sustained. The volatile nature of oil prices further emphasises the need for rigorous risk considerations and robust business decisions. Nevertheless, it is expected that investments will continue to be seen from E&P companies. PETRONAS anticipates that international oil companies and national oil companies will continue to pursue business expansion and growth while financial results will be highly dependent on hydrocarbon demand.
The competition for resources is anticipated to heighten interest in unconventional resource opportunities,
especially with the dramatic shift of importance to unconventional gas seen in North America. This will surely drive capability development and required services regionally and globally for unconventional activities.
PETRONAS’ strategies are on track for Malaysia, having reaffirmed its marginal field development strategy through the two awarded RSCs, with new RSCs expected to be signed in 2012. Both efforts in IOR and exploration are expected to be sustained with the recent deals, securing future activities for exploration drilling and EOR implementation. Key institutional capability development with the establishment of the EPTC promises results for future EOR and high CO2 gas projects.
In the international arena, focus on project delivery and operational excellence will continue in major countries namely Iraq, Turkmenistan and Venezuela. Simultaneously, PETRONAS will continue to relentlessly pursue growth through

PETRONAS ANNUAL REPORT PE 201148
24HigherNOPATby24%comparedto
thepreviouscorrespondingperiodon
thebackofhigherLNGsalesvolume
andprice,whichcontributed21%to
theoverallGroupprofitfortheperiod
underreview.
99.98PGBachievedareliabilityrateof99.98%forthe
PGUsystemexceedingtheworldclassstandardof
99.90%duringtheperiodunderreview.
%
20.6HigherLNGsalesvolumeonthebackof
higherPLCproductionandPLLtrading
volumeduringtheperiodunderreview.
milliontonnes
%

reimagining energyPETRONAS ANNUAL REPORT PE 2011 49
expandingthe horizon
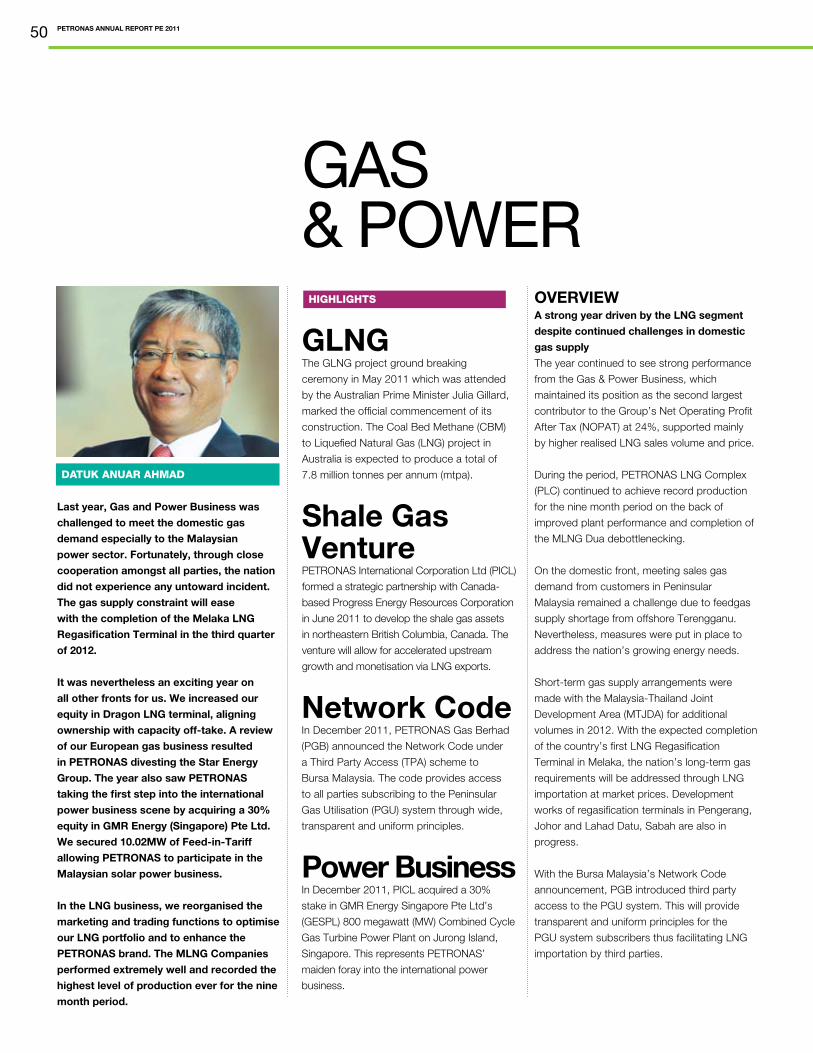
PETRONAS ANNUAL REPORT PE 201150
GAS&POWER
OVERVIEWA strong year driven by the LNG segment
despite continued challenges in domestic
gas supply
The year continued to see strong performance
from the Gas & Power Business, which
maintained its position as the second largest
contributor to the Group’s Net Operating Profit
After Tax (NOPAT) at 24%, supported mainly
by higher realised LNG sales volume and price.
During the period, PETRONAS LNG Complex
(PLC) continued to achieve record production
for the nine month period on the back of
improved plant performance and completion of
the MLNG Dua debottlenecking.
On the domestic front, meeting sales gas
demand from customers in Peninsular
Malaysia remained a challenge due to feedgas
supply shortage from offshore Terengganu.
Nevertheless, measures were put in place to
address the nation’s growing energy needs.
Short-term gas supply arrangements were
made with the Malaysia-Thailand Joint
Development Area (MTJDA) for additional
volumes in 2012. With the expected completion
of the country’s first LNG Regasification
Terminal in Melaka, the nation’s long-term gas
requirements will be addressed through LNG
importation at market prices. Development
works of regasification terminals in Pengerang,
Johor and Lahad Datu, Sabah are also in
progress.
With the Bursa Malaysia’s Network Code
announcement, PGB introduced third party
access to the PGU system. This will provide
transparent and uniform principles for the
PGU system subscribers thus facilitating LNG
importation by third parties.
GLNGThe GLNG project ground breaking
ceremony in May 2011 which was attended
by the Australian Prime Minister Julia Gillard,
marked the official commencement of its
construction. The Coal Bed Methane (CBM)
to Liquefied Natural Gas (LNG) project in
Australia is expected to produce a total of
7.8 million tonnes per annum (mtpa).
Shale Gas VenturePETRONAS International Corporation Ltd (PICL)
formed a strategic partnership with Canada-
based Progress Energy Resources Corporation
in June 2011 to develop the shale gas assets
in northeastern British Columbia, Canada. The
venture will allow for accelerated upstream
growth and monetisation via LNG exports.
Network CodeIn December 2011, PETRONAS Gas Berhad
(PGB) announced the Network Code under
a Third Party Access (TPA) scheme to
Bursa Malaysia. The code provides access
to all parties subscribing to the Peninsular
Gas Utilisation (PGU) system through wide,
transparent and uniform principles.
Power BusinessIn December 2011, PICL acquired a 30%
stake in GMR Energy Singapore Pte Ltd’s
(GESPL) 800 megawatt (MW) Combined Cycle
Gas Turbine Power Plant on Jurong Island,
Singapore. This represents PETRONAS’
maiden foray into the international power
business.
HIGHLIGHTS
Last year, Gas and Power Business was
challenged to meet the domestic gas
demand especially to the Malaysian
power sector. Fortunately, through close
cooperation amongst all parties, the nation
did not experience any untoward incident.
The gas supply constraint will ease
with the completion of the Melaka LNG
Regasification Terminal in the third quarter
of 2012.
It was nevertheless an exciting year on
all other fronts for us. We increased our
equity in Dragon LNG terminal, aligning
ownership with capacity off-take. A review
of our European gas business resulted
in PETRONAS divesting the Star Energy
Group. The year also saw PETRONAS
taking the first step into the international
power business scene by acquiring a 30%
equity in GMR Energy (Singapore) Pte Ltd.
We secured 10.02MW of Feed-in-Tariff
allowing PETRONAS to participate in the
Malaysian solar power business.
In the LNG business, we reorganised the
marketing and trading functions to optimise
our LNG portfolio and to enhance the
PETRONAS brand. The MLNG Companies
performed extremely well and recorded the
highest level of production ever for the nine
month period.
DATUK ANUAR AHMAD

reimagining energyPETRONAS ANNUAL REPORT PE 2011 51
Going beyond business as usual, the
Group made its maiden entry into the
international power business with the
acquisition of a 30% stake in GESPL.
Concurrently, the construction of the
300MW Kimanis Power Plant project is
also on track for completion by 2013
to meet the increasing power needs in
Sabah.
In growing its renewable energy
business, the Group managed to secure
a 10.02MW of Feed-in-Tariff (FiT) quota
from Sustainable Energy Development
Authority (SEDA) which will allow the
development of PETRONAS’ first Solar
Independent Power Producer project in
the country.
Since the Group’s venture into the GLNG
project in 2009, its unconventional
play expanded with a joint venture
with Canada-based Progress Energy
Resources Corporation, to develop
shale gas to LNG in northeastern British
Columbia, Canada.
As part of its European Energy business
portfolio rationalisation, Star Energy
Group Limited was divested to IGas
Energy plc whilst retaining the Humbly
Grove gas storage facilities. Business
growth will now be focused on enhancing
energy trading activities through
PETRONAS Energy Trading Ltd.
» GLNG, QUEENSLAND, AUSTRALIA
Is a joint venture between PETRONAS (27.5%), Santos
(30%), Total (27.5%) and Kogas (15%).
The project includes the development of CBM
resources in the Bowen and Surat Basins in south-
east Queensland, construction of a 420-kilometre gas
transmission pipeline from the gas fields to Gladstone,
and two LNG processing trains with a combined
nameplate capacity of 7.8 mtpa.
GAS&POWER
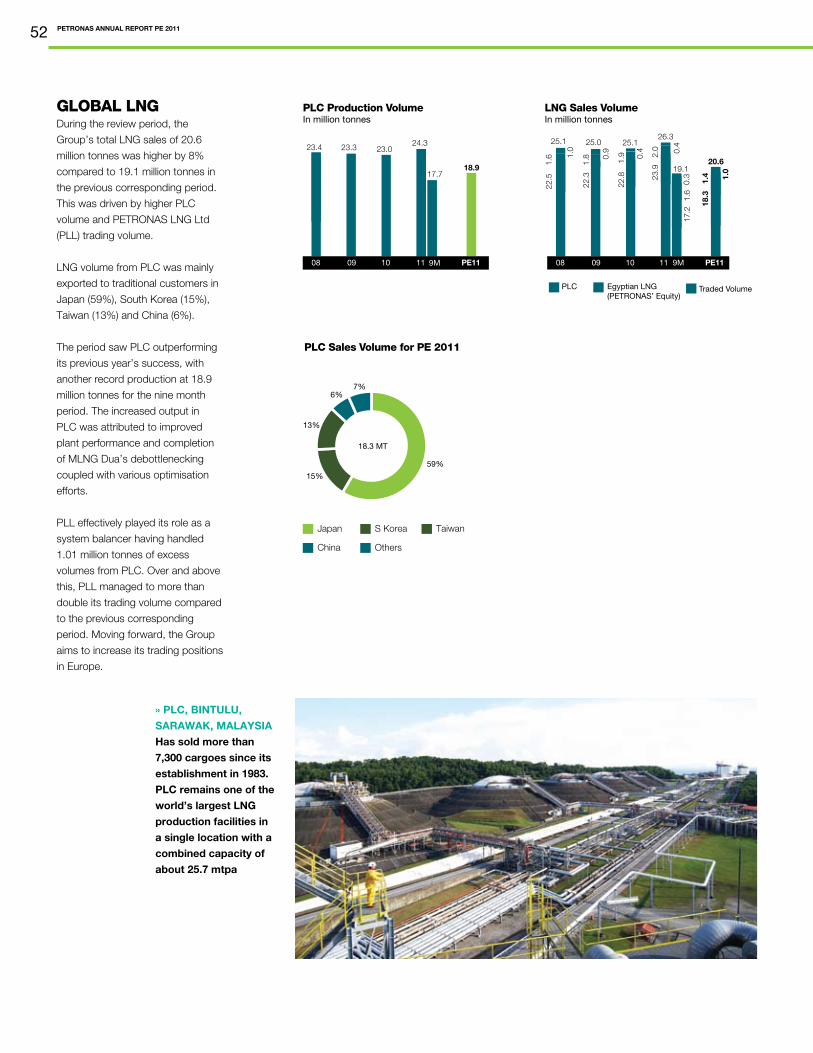
PETRONAS ANNUAL REPORT PE 201152
» PLC, BINTULU,
SARAWAK, MALAYSIA
Has sold more than
7,300 cargoes since its
establishment in 1983.
PLC remains one of the
world’s largest LNG
production facilities in
a single location with a
combined capacity of
about 25.7 mtpa
GLOBAL LNG During the review period, the
Group’s total LNG sales of 20.6
million tonnes was higher by 8%
compared to 19.1 million tonnes in
the previous corresponding period.
This was driven by higher PLC
volume and PETRONAS LNG Ltd
(PLL) trading volume.
LNG volume from PLC was mainly
exported to traditional customers in
Japan (59%), South Korea (15%),
Taiwan (13%) and China (6%).
The period saw PLC outperforming
its previous year’s success, with
another record production at 18.9
million tonnes for the nine month
period. The increased output in
PLC was attributed to improved
plant performance and completion
of MLNG Dua’s debottlenecking
coupled with various optimisation
efforts.
PLL effectively played its role as a
system balancer having handled
1.01 million tonnes of excess
volumes from PLC. Over and above
this, PLL managed to more than
double its trading volume compared
to the previous corresponding
period. Moving forward, the Group
aims to increase its trading positions
in Europe.
PLC Production VolumeInmilliontonnes
08 09 10 11 PE11
23.3 24.3
17.718.9
23.4 23.0
LNG Sales VolumeInmilliontonnes
08 09 10 11 9M PE11
26.3
19.120.6
23.9
17.2
18.3
2.0
1.6
1.4
0.4
0.3 1.
0
25.125.025.1
1.9
1.8
1.6
22.8
22.3
22.5
0.4
0.9
1.0
PLC TradedVolumeEgyptianLNG(PETRONAS’Equity)
PLC Sales Volume for PE 2011
Japan S Korea Taiwan
China Others
59%
15%
6%7%
13%
9M
18.3MT

reimagining energyPETRONAS ANNUAL REPORT PE 2011 53
INFRASTRUCTURE, UTILITIES & POWEROn the domestic front, feedgas
supply to Peninsular Malaysia
remains a challenge due to
upstream issues from offshore
Terengganu. During the period
under review, 2,304 million
standard cubic feet per day
(mmscfd) of gas was delivered to
customers in Peninsular Malaysia,
Sabah and Sarawak, compared
to 2,563 mmscfd in the previous
corresponding period. Of that, 81%
or an average of 1,873 mmscfd
was delivered through the PGU
system, a decrease of 10% from
the previous corresponding period
at 2,082 mmscfd. Sales gas
delivery to the power sector and
exports dropped by 17% and 19%
respectively as a result of the supply
shortfall in Peninsular Malaysia.
Delivery to the power sector was
approximately 49% (927 mmscfd) of
the total volume delivered through
the PGU system. Non-power
sector and exports to Singapore
constituted the remaining 44% (831
mmscfd) and 6% (115 mmscfd)
respectively.
In addition to supply from offshore
Terengganu, gas was also sourced
from Indonesia at 225 mmscfd and
MTJDA at 348 mmscfd bringing it
to a total of 573 mmscfd, higher by
5% than the previous corresponding
period of 544 mmscfd. The increase
was contributed by the additional,
temporary supply of gas from
MTJDA.
The Group’s gas processing and
transmission arm, PGB, sustained
world class performance with
reliability rates of 99.60% for its gas
processing plants and 99.98% for
its pipeline network.
Peninsular Malaysia (PGU System)
Sarawak Sabah and Labuan
Average Sales Gas Volume DeliveryInmmscfd
THE PGU SYSTEM
Is the longest pipeline in Malaysia.
The 2,505 kilometres of pipeline
connects the Kertih and Paka Gas
Processing Plants in Terengganu
to power and non-power sectors in
Peninsular Malaysia as well as power
customers in Singapore.
IN FOCUS
GPP and PGU System Reliability RateInpercentage(%)
PGU SystemGPPs
FY2010 FY2011 PE2011FY2009FY200895
96
97
98
99
100
99.98
99.60
Indonesia&MTJDA
OffshorePeninsularMalaysia
PGU System Supply SourcesInmmscfd
08 09 10 11 PE11
2,047
1,49
355
4
2,082
1,53
854
4 1,873
1,30
057
3
2,088
499
1,58
9
2,146
511
1,63
5
2,170
432
1,73
8
9M
Average Sales GasThrough the PGU SystemInmmscfd
Power ExportNon-Power
08 09 10 11 PE11
2,1462,170
732
703
1,28
0
1,31
0
2,047
1,08
781
914
1
2,082
1,12
181
914
2
2,088
787
1,17
612
5
134
157
115
1,873
927
831
9M
1,873
225
206
2,304
PE 2011
2,082
216
265
2,563
9M

PETRONAS ANNUAL REPORT PE 201154
» PGU SYSTEM
In Malaysia, PETRONAS supplies natural gas largely through the
PGU system, which was developed to spearhead the use of natural
gas in Malaysia
OUTLOOK Gas demand is growing in every
region of the world. The share of
natural gas in the global energy mix
is expected to increase from 21%
in 2011 to 25% in 2035, pushing
the share of coal into decline and
overtaking it by 2030.
Although currently LNG only
accounts for less than 10% of gas
traded, this is expected to increase
in the future due to its abundance
and flexibility of supply. The global
LNG market will remain tight over
the next two to three years due to
the Fukushima incident in March
2011 and the uncertainty over
Japan’s nuclear policy.
The world has seen an extraordinary
number of LNG projects reaching
Final Investment Decision in
Australia last year. However,
Australia is expected to take a
breather due to rising costs and
shortage of skilled labour. The next
wave of growth is expected to be
from North America. Nonetheless,
the uncertainty with government
policies and environmental issues
will determine the success of
North America’s LNG projects.
PETRONAS is strengthening its
LNG position in the medium-and-
long-term by venturing into shale
gas to LNG project in Canada,
tapping the opportunities of
abundant shale gas in North
America.
Gas pricing remains non-uniformed
based on geographical market
dynamics, with gas contracts in
Asia and much of Europe to be

reimagining energyPETRONAS ANNUAL REPORT PE 2011 55
Disclaimer on forward-looking statements: Forward-looking statements involve inherent risks and uncertainties. Should one or more of these or other uncertainties or risks materialise, actual results may vary materially from those estimated, anticipated or projected. Specifically, but without limitation, capital costs could increase, projects could be delayed, and anticipated improvements in capacity, performance or profit levels might not be fully realised. Although PETRONAS believes that the expectations of its management as reflected by such forward-looking statements are reasonable based on information currently available to it, no assurances can be given that such expectations will prove to have been correct. Accordingly, you are cautioned not to place undue reliance on the forward-looking statements, which speak only as of the date they are made. PETRONAS undertakes no obligation to update or revise any of them, whether as a result of new information, future developments or otherwise.
» PGB RGT
In 2012, PETRONAS
is poised to write
Malaysian history with
the completion of
Malaysia’s first LNG
regasification terminal
in Melaka, targeted
for August 2012. This
will facilitate the
importation of LNG
by PETRONAS and
third parties towards
ensuring security of gas
supply for the nation in
the future.
On the domestic front, ensuring
the security of gas supply remains
our primary focus. LNG imports are
inevitable in meeting rising demand
due to depleting offshore resources.
However the domestic gas demand
will be affected by the Government’s
gas pricing policy.
The demand for power generation is
expected to rise in emerging nations
on the back of economic growth.
The push for renewable energy
to generate power is gaining
momentum, driven by environmental
and energy security considerations
as more governments are promoting
green policies.
PETRONAS will continue to explore
opportunities in the power and
renewable energy sectors whilst
enhancing its capabilities in the
solar power generation business.
oil-indexed while North America
and to some extent Europe hub
prices will be heavily influenced
by the regional price benchmark.
This situation is expected to
remain in the foreseeable future.
Hub prices will only take form
in the Asia Pacific region when
there are among others, sufficient
liquidity and appropriate enabling
regulation. Amidst this gas price
fragmentation, PETRONAS will
continue to leverage on the
long-term oil-indexed LNG supply
contracts supplying primarily to
traditional buyers in East Asia.
At the same time, PETRONAS
strives to become a global LNG
player through trading activities,
diversification of supply sources
and market expansion. This
includes increasing its presence in
the Atlantic Basin.

PETRONAS ANNUAL REPORT PE 201156
98.498.4%overallreliabilityrateof
thedomesticrefineries.
%
59.5PDBretainsitspositionasamarket
leaderforCommercialBusinesswith
59.5%marketshare.
%
142.1Group’spetroleumproductsalesvolume
grewby12%againstthesameperiodlast
year,testimonyoftheaggressivegrowth
andportfoliomanagementofretailand
marketingarmoperationsdomesticallyand
oninternationalfronts.
millionbarrels

reimagining energyPETRONAS ANNUAL REPORT PE 2011 57
strengthening the buildingblocks

PETRONAS ANNUAL REPORT PE 201158
DOWNSTREAMOVERVIEWPETRONAS Downstream business plays
a strategic role in enhancing the value of
Malaysia’s oil and gas resources through
its integrated operations in refining and
trading, marketing of crude oil and petroleum
products locally and internationally, as well
as through manufacturing and marketing of
petrochemicals products.
PETRONAS owns and operates three
refineries in Malaysia and one in South Africa.
Two of the Malaysian refineries are located
in Melaka and comprises PETRONAS
Penapisan (Melaka) Sdn Bhd (PP(M)SB),
a 100% owned PETRONAS entity and
Malaysian Refining Company Sdn Bhd
(MRC), a joint venture refinery with Conoco
Philips. The third refinery, PETRONAS
Penapisan (Terengganu) Sdn Bhd (PP(T)SB)
is located on the East Coast of Malaysia
in Kertih. PETRONAS owns a refinery in
Durban, South Africa through its majority
shareholding in Engen Petroleum Limited
(Engen). Through its wholly-owned global
trading and marketing subsidiary PETRONAS
Trading Corporation Sdn Bhd (PETCO),
PETRONAS further enhances the value of its
own equity crude and petroleum products.
In Malaysia, PETRONAS Dagangan Berhad
(PDB) manages all domestic marketing
and retailing activities of a wide range
of petroleum products. PETRONAS
also operates service stations in various
international markets including Indonesia,
South Africa, Sudan and Thailand.
PETRONAS is the leading marketer of
petroleum products in Malaysia with a
total market share of 41.6% and is the
leading retailer and marketer of petroleum
products in Southern Africa through Engen.
PETRONAS Lubricants International Sdn
Bhd (PLI) is the global lubricants arm of
DATUK WAN ZULKIFLEE WAN ARIFFIN
The period under review was indeed
another exciting period for Downstream
Business as our focus was on
strengthening our business foundation
through preserving quality assets with
active portfolio management, strengthening
governance by improving hygiene factors
as well as compliance to process and
procedures. We also focused on talent
management by placing the right people in
the right job and conducted performance
measurement through benchmarking with
best practices.
For growth initiatives, we have completed
a Detailed Feasibility Study for a Refinery
and Petrochemical Integrated Development
(RAPID) project and awarded the Front-End
Engineering Design (FEED) contract amidst
a very tight schedule. The Sabah Ammonia
Urea (SAMUR) project achieved a key
milestone with a Final Investment Decision
and the award of the Basic and Detailed
Engineering, Procurement, Construction
and Commissioning (BEPCC) contract. We
also incorporated PETRONAS Lubricant
Africa Ltd (PLAL) to spearhead our lubricant
business expansion in Africa.
Moving forward for 2012 we will continue
to focus on key areas to achieve our
targets. We will pay more attention to
growth and operational performance
while talent management, governance and
quality assets remain important elements
to achieve our targets. In growing our
business further, we will be securing
partners for the RAPID project and
expanding our lubricants business mainly
by pursuing acquisition opportunities.
I would like to take this opportunity to thank
our dedicated teams in the Downstream
business for all their professionalism,
determination and commitment in making
this period a significant success. I hope we
will continue to strive to be a merit-based
high performing business.
Sub-Saharan Africa
Establishment of PLAL in growing the
lubricant business in African countries.
HIGHLIGHTS
SAMURPETRONAS Chemicals Fertiliser Sabah Sdn
Bhd through PETRONAS Chemicals Group
Berhad (PCG) formally awarded the BEPCC
Alliance contract for the SAMUR project.

reimagining energyPETRONAS ANNUAL REPORT PE 2011 59
REFINING & TRADINGPETRONAS owns and operates four
refineries with a total refining capacity
of about 500,000 barrels a day. The
Group’s crude oil and petroleum products
marketing and trading activities span the
globe and our crude oil portfolio includes
a range of grades from various regions.
CRUDE OIL REFININGThe Group’s domestic refineries continue
to play a strategic role in adding value to
the nation’s petroleum resources, as well
as enhancing the security of its energy
supplies. In the period under review, the
Group’s domestic refineries collectively
recorded a lower throughput volume of
76.8 million barrels as compared to the
total throughput volume during the same
period last year of 80.3 million barrels.
This is due to planned maintenance
shutdowns at both MRC and PP(T)SB
and is reflected in the lower utilisation rate
of 84.2%.
The overall reliability rate of the domestic
refineries increased to 98.4%, testimony
to the Group’s continued commitment
to operational excellence. The strong
emphasis on safe operations was
recognised with both PP(M)SB and
PP(T)SB winning major awards in the
oil and gas sector namely the Chemical
Industries Council of Malaysia (CICM)
Award 2010, the Prime Minister’s
Hibiscus Award 2010/11. PP(M)SB was
also recognised in the Malaysian Society
of Occupational Safety & Health (MSOSH)
Awards 2010 and the Royal Society for
the Prevention of Accidents (RoSPA)
Award 2011.
PETRONAS with a presence in more than 20
countries encompassing manufacturing and
marketing infrastructure. The PLI product
range includes lubricants and functional fluids
for the automotive and industrial markets as
well as a range of car care products.
PCG is the leading petrochemicals producer
in Malaysia and one of the largest producers
in South East Asia. It primarily manufactures,
markets and sells a diversified range of
petrochemical products which include olefins,
polymers, fertilisers, methanol and other basic
chemicals and derivative products. PCG has
over 25 years of combined experience in the
petrochemicals industry.
84.2
Refining ThroughputInmillionbarrels
DomesticRefineries
OverseasRefineries
08 09 10 11 9M PE11
134.4
103.699.0
107.
6
80.3
76.8
26.8
23.3
22.2
138.0
103.
934
.1
158.4150.9
126.
8
115.
8
31.6
35.1
Utilisation Ratefor Group’s RefineriesInpercentage(%)
DomesticRefineries TotalRefineries
08 09 10 11 PE11
96.7 97.3
91.6
86.2
85.7
80.882.4
79.3
91.0

PETRONAS ANNUAL REPORT PE 201160
CRUDE OIL & PETROLEUM PRODUCTS MARKETINGThe Group’s crude oil and petroleum products
marketing activities decreased for the period
under review at 116.6 million barrels against
the total volume for the same period last year
of 131.1 million barrels attributable to lower
production of Malaysian Crude Oil (MCO).
PETRONAS MCO entitlement reduced by 9.5%
to 46.5 million barrels from 51.4 million barrels
during the period due to production challenges.
The Group’s sales of Foreign Equity Crude
Oil (FEC) decreased by 16.2% to 34.7 million
barrels from 41.4 million barrels during the same
period last year reflecting lower entitlements
from the Group’s International Operations amid
higher global crude oil prices.
The Group also exported lower volumes of
petroleum products of 35.4 million barrels
against the total volume for the same period
last year of 38.3 million barrels mainly due to
lower products available for export as a result of
planned maintenance shutdowns at domestic
refineries coupled with higher domestic
consumption.
CRUDE OIL & PETROLEUM PRODUCTS TRADINGThe Group’s crude oil and petroleum products
trading activities for the period under review
decreased by 13.2% to 118.3 million barrels.
The total volume of crude oil traded during
the year increased to 63.4 million barrels
resulting from higher third party trades to cover
for the shortfall of equity marketing volumes
and increased opportunistic trading due to
the volatile crude oil market. However, the
total volume of petroleum products traded
decreased to 54.9 million barrels mainly due
to lower trading risk appetite as a result of
global macroeconomics and financial exposure
concerns. This was further aggravated by
geopolitical events that affected global supply
and demand.
MalaysianCrudeOilExports
PetroleumProductsExports
SalesofForeignEquityCrudeOil(FEC)
Marketing VolumesInmillionbarrels
08 09 10 11 9M PE11
116.6
46.5
35.4
34.7
170.9
131.169
.6
51.4
51.4
38.3
49.9
41.4
166.8
55.6
58.8
52.4
188.5206.7
60.362
.2
76.494
.6
51.849
.9
CrudeOil
PetroleumProducts
Trading VolumesInmillionbarrels
08 09 10 11 9M PE11
118.3
63.4
54.9
162.6
136.3
79.1
62.8
83.5
73.5
190.4
85.6
104.
8
172.0
116.9
75.2
60.5
96.8
56.4

reimagining energyPETRONAS ANNUAL REPORT PE 2011 61
DOWNSTREAM MARKETINGDownstream Marketing oversees the
retail and marketing activities for the
full range of petroleum products which
include diesel, Jet A1, lubricants and
motor gasoline as well as Liquefied
Petroleum Gas (LPG) for home and
commercial use.
In the period under review, the Group’s
petroleum products’ sales volume grew
by 12% to 142.1 million barrels against
the same period last year. This was
testimony to the aggressive growth and
portfolio management of the retail and
marketing arm operations domestically
and on international fronts.
RETAIL BUSINESSPetroleum products are marketed to
the consumer through a network of
over 2,558 retail stations in Indonesia,
Malaysia, South Africa, Sudan, Thailand
and across Sub-Saharan African
countries as well as to the various
industrial and commercial markets.
PDB is the domestic retail arm while
internationally the business is managed
by Engen, PETRONAS Marketing Sudan
Limited (PMSL), PT PETRONAS Niaga
Indonesia (PTPNI) and PETRONAS Retail
Thailand Co Ltd (PRTCL).
For the period under review, PDB
registered 31% retail market share.
Active involvement and years of strategic
partnership with the Formula 1 team
allowed PDB to build a strong capability
in fuel technology. This experience
has enabled the R&D team to develop
the PETRONAS Fluid Technology
Solutions™ which benefits everyday
customers.
PDB successfully launched PRIMAX 95
Xtra in April 2011, a new fuel inspired
by F1TM technology, proven to deliver
superior power, better acceleration and
savings for customers. On top of that,
PDB also became the first fuel operator
in the country to introduce the mobile fuel
dispenser launched and operated at the
Sepang International Circuit in November
2011. This is for the convenience of
customers to fuel up with PETRONAS’
high-powered PRIMAX fuels at the
circuit.
PDB also increased its retail station
network to 968 and has the largest
network of convenience stores at retail
stations in Malaysia with 630 Kedai
Mesra convenience stores.
Taking customer service to the next
level, PDB introduced its car spa
outlets offering premium car washing
and detailing services complete with
comfortable waiting rooms. The pilot
phase was rolled out at selected
PETRONAS stations in Kuala Lumpur
and Johor. As part of PDB’s efforts to
go “All The Way” for its customers, PDB
will launch the PETRONAS Durance and
Arexons, a range of high quality car care
products and air fresheners developed
by its Italy based sister company, PLI.
Expansion of LPG
Terminals from
four to five with the
construction of a
new terminal in Cebu
further strengthens the
downstream marketing
portfolio
IN FOCUS
» ENGEN SERVICE STATION
Engen has re-positioned its retail
destination beyond the typical
petrol station outlets by introducing
“driving & shopping” experiences
under one roof concept. In South
Africa, the convenience stores
continues to deliver incomparable
“Service Excellence” by offering
more value to the customers by the
continuous upgrading of selected
stores to the Engen 1-Plus Store
model; a model that offers “all in
one basket” convenient shopping
experience from groceries to movies
to fast foods and to a cup of coffee.PDB ENGENacrosstheAfricancontinent
Retail StationsNo.ofstations
08 09 10 11 PE11
968
1590
955
925
1429 1473 1489
1572
912892

PETRONAS ANNUAL REPORT PE 201162
COMMERCIAL BUSINESSThe commercial business covers the
marketing and sales of petroleum
products in bulk to the various
industrial and commercial sectors.
PETRONAS through its domestic and
international marketing arms, continues
to strengthen its market leadership
through personalised and differentiated
services while persistently securing new
contracts.
PDB currently is the market leader in
the commercial business with 59.5%
market share and its commercial
presence is prominent in the aviation and
bitumen sectors with 73% market share
respectively. In the period under review,
PDB successfully secured new aviation
contracts with prominent customers and
improved their market share with Arab
Air Carriers Organisation (AACO) namely
Gulf Air, Jordan Aviation Company,
Oman Air & Yemen Airways from 30% to
39%. PDB bitumen sales increased by
22.2% compared to the same period last
year as a result of aggressive commercial
strategies capturing demand from the
10th Malaysia Plan and the Economic
Transformation Programme (ETP).
In South Africa and Sub-Sahara, Engen
continues to accelerate the growth
journey in transportation, mining,
agriculture and other industries through
sealing of contracts with several new
customers.
PMSL maintained its position as the
preferred supplier in the market it
operates in. The company made great
strides by securing new contracts with
several new international airlines. PMSL’s
outstanding performance in delivering the
UN-African Union Mission peacekeeping
force in Darfur (UNAMID) contract by
providing quality and reliable product
supply at stringent HSE standards
resulted in the contract being extended
to December 2012.
PETRONAS also has commercial
business presence in Indonesia
and Thailand which is managed by
PTPNI and PRTCL respectively. Both
companies continued their path of
growth by improving their nationwide
logistics and distribution capability for
seamless supply of products to their
customers.
Engen continues on its journey towards
becoming a Champion in South Africa and
Sub-Saharan Africa with a retail network
of 1,590 retail stations. This includes 714
convenience stores and in excess of 300
fast food outlets and corner bakeries.
In the period under review, Engen
successfully completed the acquisition
of Chevron’s downstream business in
seven countries including Mozambique
and Zimbabwe. Engen also completed the
re-branding of 66 selected former Chevron
service stations.
PETRONAS continues to strengthen its
position in the LPG market under the brand
name of “Gas PETRONAS” in Malaysia,
Philippines and Vietnam. Regionally,
PETRONAS LPG marketing companies
include PETRONAS Energy Philippines Inc.
(PEPI) and PETRONAS (Vietnam) Co Ltd
(PVL). Both business units have extended
their nationwide logistics and distribution
system for seamless supply of products to
the customers.
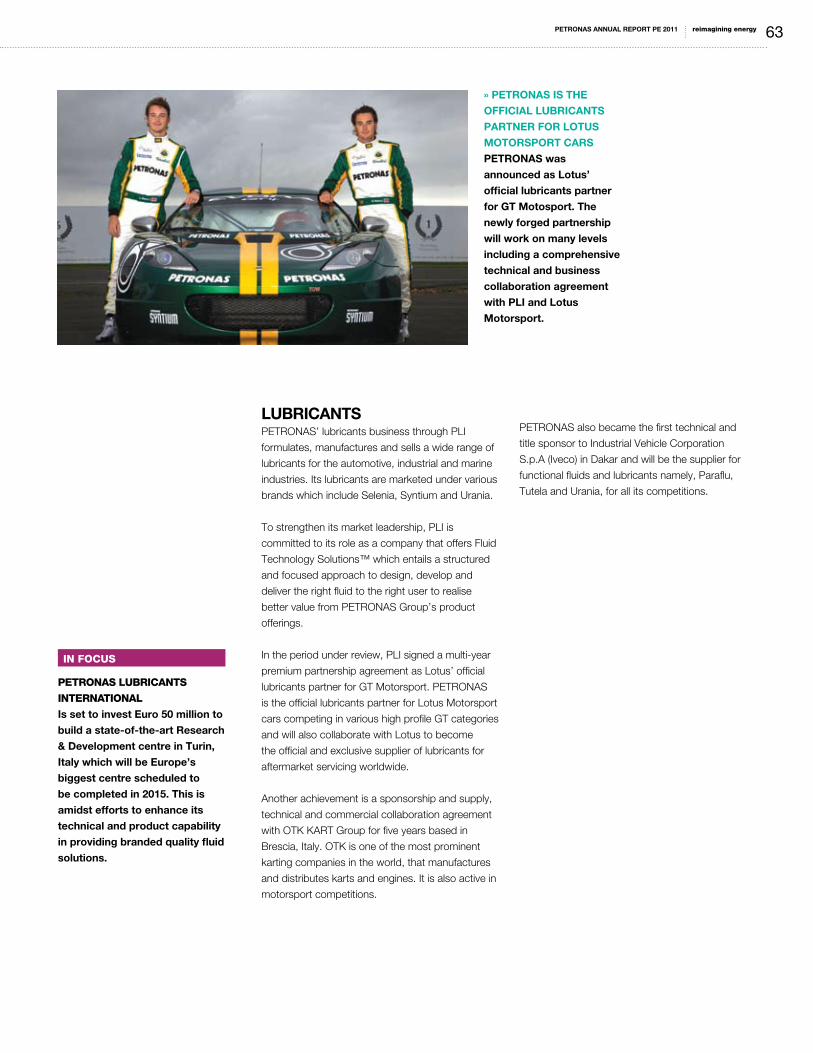
reimagining energyPETRONAS ANNUAL REPORT PE 2011 63
LUBRICANTS PETRONAS’ lubricants business through PLI
formulates, manufactures and sells a wide range of
lubricants for the automotive, industrial and marine
industries. Its lubricants are marketed under various
brands which include Selenia, Syntium and Urania.
To strengthen its market leadership, PLI is
committed to its role as a company that offers Fluid
Technology Solutions™ which entails a structured
and focused approach to design, develop and
deliver the right fluid to the right user to realise
better value from PETRONAS Group’s product
offerings.
In the period under review, PLI signed a multi-year
premium partnership agreement as Lotus’ official
lubricants partner for GT Motorsport. PETRONAS
is the official lubricants partner for Lotus Motorsport
cars competing in various high profile GT categories
and will also collaborate with Lotus to become
the official and exclusive supplier of lubricants for
aftermarket servicing worldwide.
Another achievement is a sponsorship and supply,
technical and commercial collaboration agreement
with OTK KART Group for five years based in
Brescia, Italy. OTK is one of the most prominent
karting companies in the world, that manufactures
and distributes karts and engines. It is also active in
motorsport competitions.
PETRONAS also became the first technical and
title sponsor to Industrial Vehicle Corporation
S.p.A (Iveco) in Dakar and will be the supplier for
functional fluids and lubricants namely, Paraflu,
Tutela and Urania, for all its competitions.
PETRONAS LUBRICANTS
INTERNATIONAL
Is set to invest Euro 50 million to
build a state-of-the-art Research
& Development centre in Turin,
Italy which will be Europe’s
biggest centre scheduled to
be completed in 2015. This is
amidst efforts to enhance its
technical and product capability
in providing branded quality fluid
solutions.
IN FOCUS
» PETRONAS IS THE
OFFICIAL LUBRICANTS
PARTNER FOR LOTUS
MOTORSPORT CARS
PETRONAS was
announced as Lotus’
official lubricants partner
for GT Motosport. The
newly forged partnership
will work on many levels
including a comprehensive
technical and business
collaboration agreement
with PLI and Lotus
Motorsport.
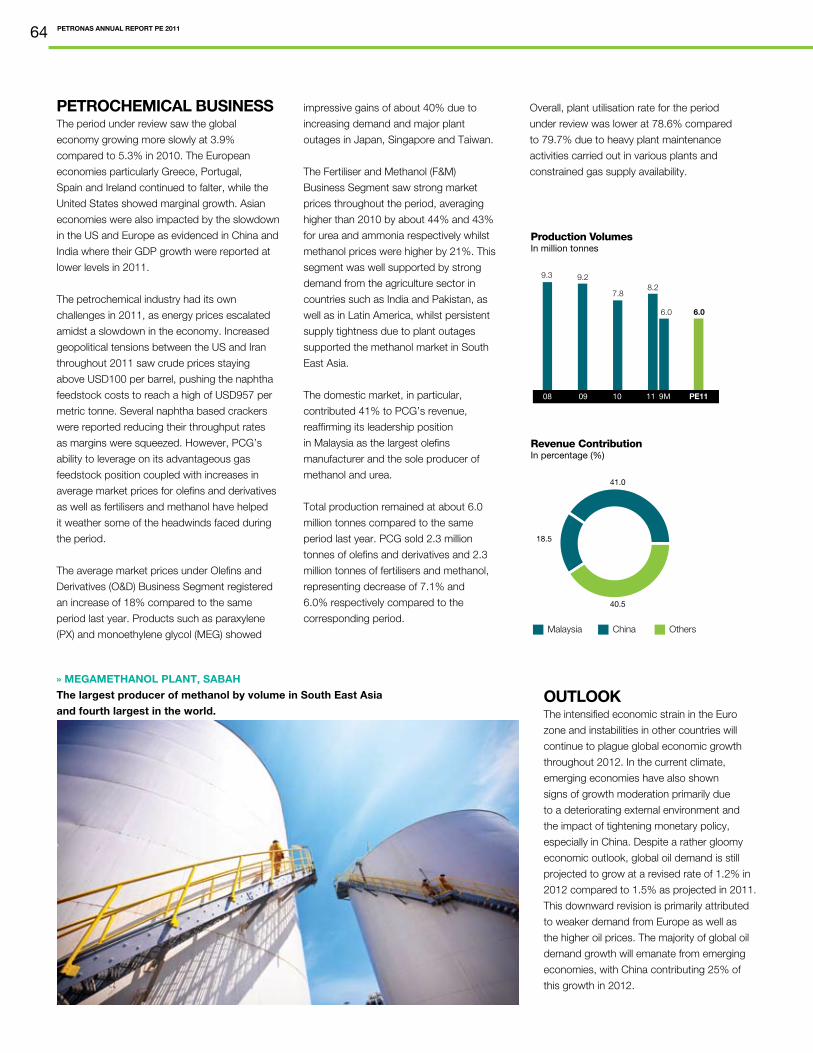
PETRONAS ANNUAL REPORT PE 201164
PETROCHEMICAL BUSINESSThe period under review saw the global
economy growing more slowly at 3.9%
compared to 5.3% in 2010. The European
economies particularly Greece, Portugal,
Spain and Ireland continued to falter, while the
United States showed marginal growth. Asian
economies were also impacted by the slowdown
in the US and Europe as evidenced in China and
India where their GDP growth were reported at
lower levels in 2011.
The petrochemical industry had its own
challenges in 2011, as energy prices escalated
amidst a slowdown in the economy. Increased
geopolitical tensions between the US and Iran
throughout 2011 saw crude prices staying
above USD100 per barrel, pushing the naphtha
feedstock costs to reach a high of USD957 per
metric tonne. Several naphtha based crackers
were reported reducing their throughput rates
as margins were squeezed. However, PCG’s
ability to leverage on its advantageous gas
feedstock position coupled with increases in
average market prices for olefins and derivatives
as well as fertilisers and methanol have helped
it weather some of the headwinds faced during
the period.
The average market prices under Olefins and
Derivatives (O&D) Business Segment registered
an increase of 18% compared to the same
period last year. Products such as paraxylene
(PX) and monoethylene glycol (MEG) showed
impressive gains of about 40% due to
increasing demand and major plant
outages in Japan, Singapore and Taiwan.
The Fertiliser and Methanol (F&M)
Business Segment saw strong market
prices throughout the period, averaging
higher than 2010 by about 44% and 43%
for urea and ammonia respectively whilst
methanol prices were higher by 21%. This
segment was well supported by strong
demand from the agriculture sector in
countries such as India and Pakistan, as
well as in Latin America, whilst persistent
supply tightness due to plant outages
supported the methanol market in South
East Asia.
The domestic market, in particular,
contributed 41% to PCG’s revenue,
reaffirming its leadership position
in Malaysia as the largest olefins
manufacturer and the sole producer of
methanol and urea.
Total production remained at about 6.0
million tonnes compared to the same
period last year. PCG sold 2.3 million
tonnes of olefins and derivatives and 2.3
million tonnes of fertilisers and methanol,
representing decrease of 7.1% and
6.0% respectively compared to the
corresponding period.
OUTLOOKThe intensified economic strain in the Euro
zone and instabilities in other countries will
continue to plague global economic growth
throughout 2012. In the current climate,
emerging economies have also shown
signs of growth moderation primarily due
to a deteriorating external environment and
the impact of tightening monetary policy,
especially in China. Despite a rather gloomy
economic outlook, global oil demand is still
projected to grow at a revised rate of 1.2% in
2012 compared to 1.5% as projected in 2011.
This downward revision is primarily attributed
to weaker demand from Europe as well as
the higher oil prices. The majority of global oil
demand growth will emanate from emerging
economies, with China contributing 25% of
this growth in 2012.
» MEGAMETHANOL PLANT, SABAH
The largest producer of methanol by volume in South East Asia
and fourth largest in the world.
Production VolumesInmilliontonnes
08 09 10 11 9M PE11
8.2
6.0 6.0
7.8
9.29.3
Revenue Contribution Inpercentage(%)
Malaysia China Others
41.0
40.5
18.5
Overall, plant utilisation rate for the period
under review was lower at 78.6% compared
to 79.7% due to heavy plant maintenance
activities carried out in various plants and
constrained gas supply availability.

reimagining energyPETRONAS ANNUAL REPORT PE 2011 65
Disclaimer on forward-looking statements: Forward-looking statements involve inherent risks and uncertainties. Should one or more of these or other uncertainties or risks materialise, actual results may vary materially from those estimated, anticipated or projected. Specifically, but without limitation, capital costs could increase, projects could be delayed, and anticipated improvements in capacity, performance or profit levels might not be fully realised. Although PETRONAS believes that the expectations of its management as reflected by such forward-looking statements are reasonable based on information currently available to it, no assurances can be given that such expectations will prove to have been correct. Accordingly, you are cautioned not to place undue reliance on the forward-looking statements, which speak only as of the date they are made. PETRONAS undertakes no obligation to update or revise any of them, whether as a result of new information, future developments or otherwise.
Volatility stemming from the persistent
political turmoil in the Middle East and
North African regions continues to
impose risk premiums on crude prices.
However, physical crude supplies
are not expected to be affected even
with Iran sanctions as other OPEC
countries have already committed to
increase production, if necessary in
order to compensate for the shortfall.
Furthermore, the gradual return of
roughly 1.2 million barrels per day of
disrupted Libyan crude as well as a
900 thousand barrels per day increase
in non-OPEC oil production will offset
minor declines in the other oil producing
countries.
As such, the recovery of the global
economy remains fragile largely due
to the risk of recession in the EU, the
slowdown of the US and Chinese
economies and sustained high oil prices.
On the refinery front, Asian refiners
will experience better margins, albeit
at slightly lower levels than in 2011,
compared to its Western counterparts.
However, in Europe, improved crude
supplies will alleviate pressure on refiners
while refinery closures will contribute
to improved margins in the region. The
outlook for US refining margins will be
fragmented based on their crude diets
as well as logistical challenges in certain
regions. Refineries processing West
Texas Intermediate (WTI) crude will enjoy
wider discounts while others may benefit
from some refinery rationalisation.
A positive outlook on Asia’s product
demand and the rationalisation and
upgrade of inefficient refineries in the
region will keep margins relatively strong.
Refinery capacity additions in the Middle
East is only anticipated to come on
stream by 2015, and as such will not
have an effect on product supply, which
in turn will support relatively strong
refining margins. Overall, complex
refineries will continue to enjoy higher
margins compared to hydro skimming
refineries, and this will prompt refiners to
pursue upgrading of existing refineries to
be able to process heavier crudes.
Chemical demand in emerging
economies will continue to support
growth in the industry amidst high
feedstock prices and a bearish outlook
on the global economy. It is estimated
that demand in emerging markets will
grow at an expected 6.2% in 2012,
compared to 5.4% in 2011. Asian
countries such as China and India, as
well as other emerging markets such
as Brazil will remain the main focus for
chemical exporters in 2012. However,
exporters to Asia and Brazil will see fierce
competition as product flows will begin
to be redirected into the region. This
will be brought about by the emergence
of the US as a low-cost gas-fed
petrochemical producer coupled with the
exports from the new capacity additions
in the Middle East. It is thus expected
that margins will remain under pressure,
especially for naphtha-based producers.
Growth in Asia, albeit at a lower rate than
in 2011 will bode well for PETRONAS
which is strategically well positioned
in this region. Through its expansion
plans in Asia Pacific especially in the
petrochemical and lubricant businesses,
PETRONAS will capitalise on the growth
in the region while adding value to its
downstream portfolio. PETRONAS is
also making good progress with the
RAPID project to be undertaken in
Pengerang, Southern Johor. During
the period under review, PETRONAS
completed the detailed feasibility study
for RAPID and the project aims to reach
its Final Investment Decision in the
middle of 2013. Subject to its viability,
RAPID presents the opportunity to
significantly grow the petrochemical
product portfolio, moving into high value
specialty chemicals. It will also diversify
the feedstock base from predominantly
gas to naphtha.
In addition to its Asia Pacific focus,
Africa remains a key component of
the portfolio where expansion will be
pursued on an opportunistic basis. The
growth and optimisation of the global
lubricants business remains a priority for
PETRONAS, albeit the mature markets
will pose a greater challenge for this
business.
In order to secure the value creation
from the growth initiatives and existing
businesses, a strong focus will be
placed on disciplined project execution,
performance enhancement, molecule
optimisation supported by continuous
portfolio management, governance
and HSE compliance. Strengthening
product brand across downstream will
also be emphasised to enhance the
brand equity. Talent management and
high attrition rates pose a challenge, but
will be addressed through dedicated
initiatives. The organisational climate
in the Downstream Business is also
enhanced by working towards common
goals in line with the PETRONAS’ Shared
Values and striving for it to be a “Merit-
Based High Performing Business”.
PETRONAS ANNUAL REPORT PE 201166
MARITIME&LOGISTICS
OVERVIEWLed by subsidiary MISC, PETRONAS’ maritime
and logistics business is involved in owning
and operating of ships, tank terminals and
offshore floating facilities as well as in marine
repair, marine conversion and engineering and
construction works.
MISC, with more than 160 owned and in-
chartered vessels and a combined tonnage of
more than 15 million deadweight tonnes (dwt),
is one of the world’s leading owner-operator
of LNG carriers and the third largest owner of
Aframax fleet in the world.
Customised Solution AET to supply two Marine Capture Vessels
(MCVs) for hydrocarbon containment in the
event of a deep water well control incident
Liner BusinessExitFirst in a series of bold steps to reconstruct
MISC Berhad’s (MISC) business portfolio
FSUs Conversion of two liquefied natural gas
(LNG) tankers into Floating Storage Units
(FSUs) for Malaysia’s first regasification
terminal in Melaka, targeted for August
2012
HIGHLIGHTS
MISC-Owned Fleet by
Business
As at 31
December
2011
As at 31
March
2011
LNG Carriers 27 29
Petroleum Tankers 53 50
Chemical Tankers19 19
Liner 16 18
Offshore Facilities
FPSO 5 5
FSO 5 5
MOPU 2 1
TOTAL 127 127
*Note: Excluding Tenaga Satu and Tenaga
Empat, which are currently undergoing
conversion works into Floating Storage Units
(FSUs)
FLEET SIZE

reimagining energyPETRONAS ANNUAL REPORT PE 2011 67
Business conditions in the maritime
industry continued to be extremely
challenging for MISC for the
period under review. Uncertainty
in macroeconomic direction and
protracted geopolitical tensions across
the globe did little to bolster demand
growth for shipping services that had
weakened considerably since the onset
of the global financial crisis in 2008.
Supply growth continued to outstrip
demand growth, further exacerbating an
already oversupply situation dating back
to 2009.
The period under review saw record
deliveries in terms of newbuilds. In the
Very Large Crude Carrier (VLCC) space,
the market witnessed a third straight
year of double-digit tonnage addition.
Sixty VLCCs totalling 18.5 million dwt
or 11.2% of the global VLCC fleet were
delivered in 2011, dwarfing the 15
VLCCs with four million dwt capacity
that were scrapped. The Aframax
segment added a slower 6.4% of
tonnage or 4.2 million dwt.
Meanwhile, competitors in the
containership market continued to push
the boundaries with orders of giant size
Triple-E ships with capacity of up to
18,000 Twenty Foot Equivalent Units
(TEUs), the largest container vessel
ever built. These Triple-E vessels are
designed to give the operators an
estimated 40% fuel efficiency and 30%
overall cost reduction, assuming that
these vessels can be filled to a targeted
level of utilisation. While this may
serve the owners and operators of the
vessels well from a cost and possible
profit standpoint, it is detrimental from
an industry perspective given the
aggravation to an already oversupplied
market.
» Seri Anggun
MISC’s LNG carrier
MARITIME&LOGISTICS

PETRONAS ANNUAL REPORT PE 201168
With over capacity of more than
20%, freight rates inevitably
suffered and this was most evident
in the petroleum tanker market.
Rates plummeted below operating
cost per day in 2011, serving as a
grim reminder of the severity of the
downturn on the shipping industry,
compared to previous cycles.
Despite the very depressed
outlook for the shipping industry
in general, there remains growth
opportunities for MISC. The LNG
shipping space was a bright spot
in 2011. The earthquake in Japan
early 2011 led to the shutdown of
nuclear power plants and raised
LNG import demand from Japan
as a substitute fuel. This bodes
well for demand in the short to
medium term LNG shipping.
Meanwhile, the emerging demand
for fast track gas importing
facilities such as Floating Storage
Regasification Units (FSRUs)
and FSUs provided product
diversification opportunities in the
LNG space. Two of MISC’s first
generation conventional LNG ships
are undergoing conversion works
into FSUs and will form an integral
part of the first regasification
terminal in Malaysia.
MISC’s fully owned subsidiary
AET Tanker Holdings Sdn Bhd
scored a first when it was selected
by the Marine Well Containment
Company (comprising leading
oil companies in the US) to
supply two Marine Capture
Vessels (MCVs) for hydrocarbon
capture services in the event of a
deepwater well control incident in
the US Gulf of Mexico. The service
contract for these two MCVs will
run for 20 years.
Despite the challenges to the
shipping industry brought about
by the high oil price environment, it
also presented new opportunities
to MISC’s offshore division
and heavy engineering division
(through Malaysia Marine &
Heavy Engineering Holdings
Bhd or MHB). Enhanced Oil
Recovery (EOR) activities and the
development of unconventional
sources of energy such as
marginal and deepwater fields,
create sustained demand for
larger and more complex offshore
structures which both businesses
could exploit. During this period,
MISC’s offshore division awarded
the conversion of FPSO Cendor
to MHB, which will replace
the existing FSO Cendor once
completed in 2013. For the
period under review, MHB inked
RM2.9 billion in new contracts
encompassing construction and
installation of offshore structures
under ExxonMobil’s EOR projects
and Telok Gas Development.
» AET
One of the largest
tanker operators
in the world with
more than 80
petroleum vessels
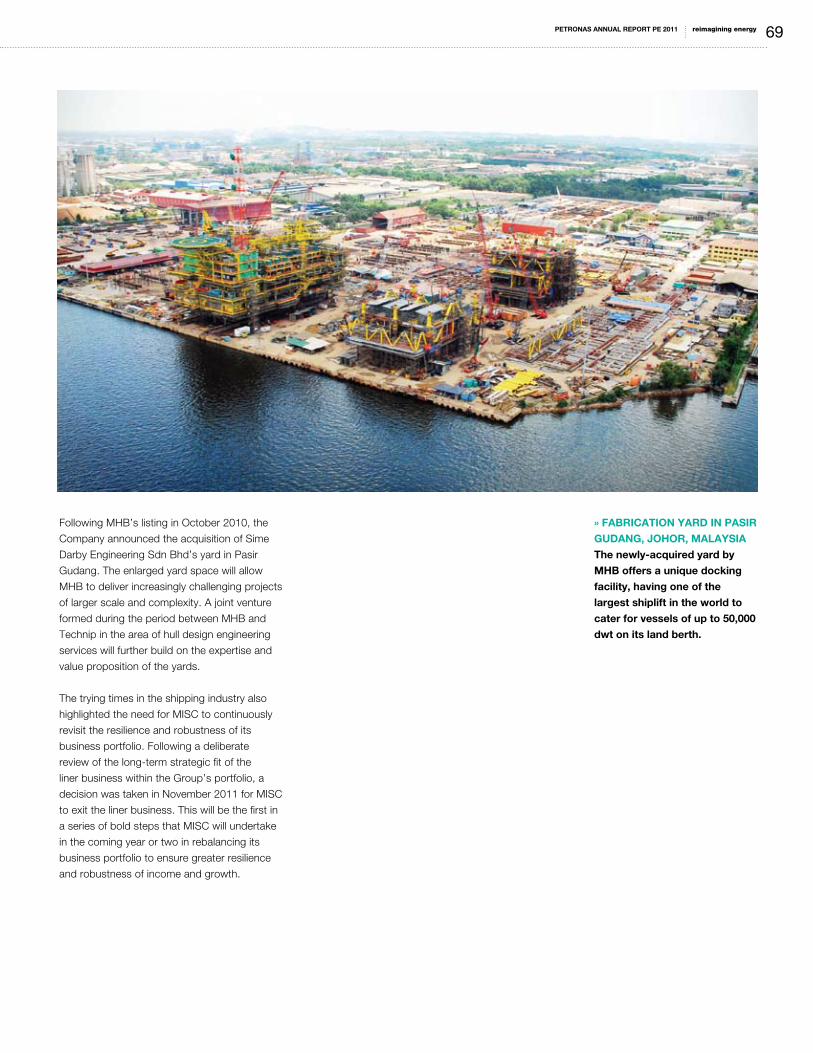
reimagining energyPETRONAS ANNUAL REPORT PE 2011 69
Following MHB’s listing in October 2010, the
Company announced the acquisition of Sime
Darby Engineering Sdn Bhd’s yard in Pasir
Gudang. The enlarged yard space will allow
MHB to deliver increasingly challenging projects
of larger scale and complexity. A joint venture
formed during the period between MHB and
Technip in the area of hull design engineering
services will further build on the expertise and
value proposition of the yards.
The trying times in the shipping industry also
highlighted the need for MISC to continuously
revisit the resilience and robustness of its
business portfolio. Following a deliberate
review of the long-term strategic fit of the
liner business within the Group’s portfolio, a
decision was taken in November 2011 for MISC
to exit the liner business. This will be the first in
a series of bold steps that MISC will undertake
in the coming year or two in rebalancing its
business portfolio to ensure greater resilience
and robustness of income and growth.
» FABRICATION YARD IN PASIR
GUDANG, JOHOR, MALAYSIA
The newly-acquired yard by
MHB offers a unique docking
facility, having one of the
largest shiplift in the world to
cater for vessels of up to 50,000
dwt on its land berth.

PETRONAS ANNUAL REPORT PE 201170
TECHNOLOGY& ENGINEERING
OVERVIEW
TECHNOLOGY & ENGINEERING FOR SUPERIOR PERFORMANCEIn the ever competitive oil and gas industry,
technology is one of the key enablers that
sets industry leaders apart from the rest.
With the days of ‘easy-oil’ fast disappearing,
PETRONAS is faced with various challenges
such as depleting resources and ageing
facilities, gas fields containing high CO2 and
other contaminants such as mercury, acid and
sulphur.
PETRONAS is intensifying efforts in EOR to
sustain oil production and simultaneously
explore technologies to economically develop
gas fields containing high CO2. Continuous
efforts are also being pursued to develop
technologies to manage contaminants in oil and
gas.
PETRONAS filed nine patents in the period
under review, bringing a total of 273 patents
filed to date.
In view of the complex and technically
demanding oil and gas industry, engineering
expertise and technical solutions are essential
for safe and efficient operations. As such,
PETRONAS has developed a group of technical
experts to provide innovative and value-adding
technology solutions as well as institute technical
standards and governance. They will also drive
the technical capability development for effective
implementation of Capital expenditure (CAPEX)
projects towards achieving Plant Operational
Excellence.
HIGHLIGHTS
Technology breakthroughsEnhanced Oil Recovery (EOR), carbon dioxide
(CO2) management, contaminants removal,
green and sustainable technologies were
pursued during the period under review.
RM1.6 billionProvision of technical solutions and services
by in-house technical expertise achieved
a value creation of about RM1.6 billion for
PETRONAS through optimisation, yield
improvement and cost avoidance.
ISO 9001:2008The Integrated Plant Operations Capability
System and the management of PETRONAS
Technical Standards achieved ISO 9001:2008
certification (Quality Management System)
from SIRIM QAS International Sdn Bhd.
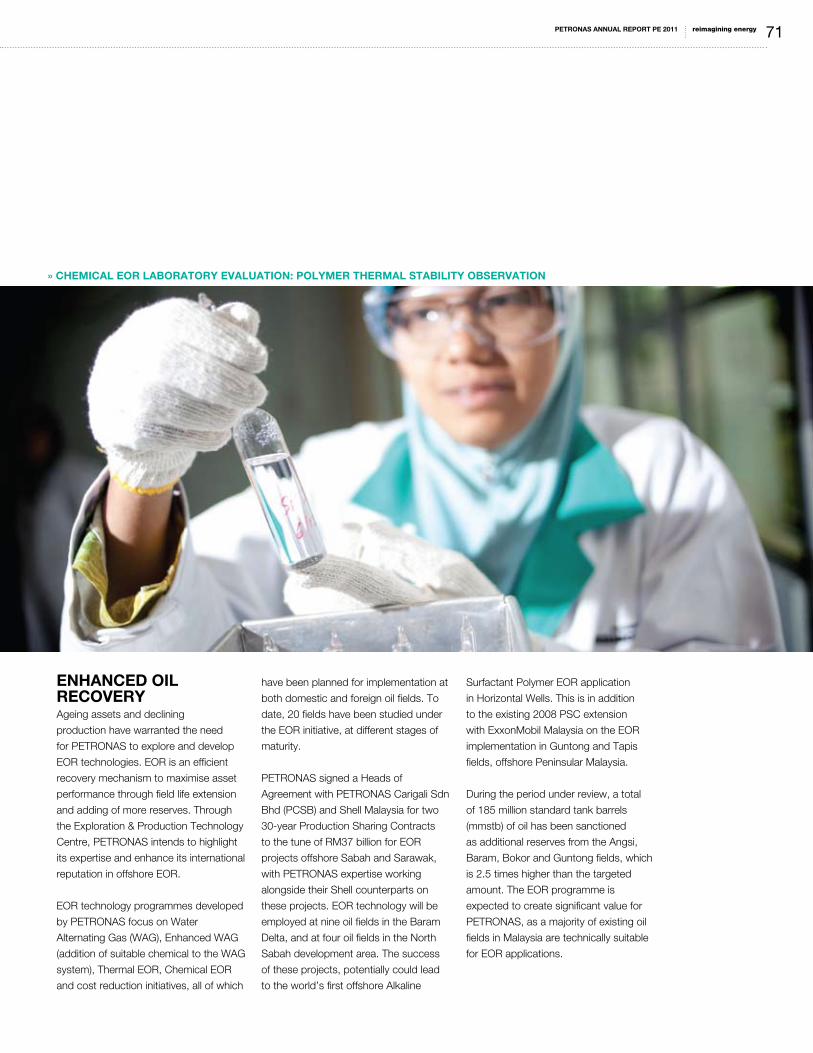
reimagining energyPETRONAS ANNUAL REPORT PE 2011 71
» CHEMICAL EOR LABORATORY EVALUATION: POLYMER THERMAL STABILITY OBSERVATION
ENHANCED OIL RECOVERYAgeing assets and declining
production have warranted the need
for PETRONAS to explore and develop
EOR technologies. EOR is an efficient
recovery mechanism to maximise asset
performance through field life extension
and adding of more reserves. Through
the Exploration & Production Technology
Centre, PETRONAS intends to highlight
its expertise and enhance its international
reputation in offshore EOR.
EOR technology programmes developed
by PETRONAS focus on Water
Alternating Gas (WAG), Enhanced WAG
(addition of suitable chemical to the WAG
system), Thermal EOR, Chemical EOR
and cost reduction initiatives, all of which
have been planned for implementation at
both domestic and foreign oil fields. To
date, 20 fields have been studied under
the EOR initiative, at different stages of
maturity.
PETRONAS signed a Heads of
Agreement with PETRONAS Carigali Sdn
Bhd (PCSB) and Shell Malaysia for two
30-year Production Sharing Contracts
to the tune of RM37 billion for EOR
projects offshore Sabah and Sarawak,
with PETRONAS expertise working
alongside their Shell counterparts on
these projects. EOR technology will be
employed at nine oil fields in the Baram
Delta, and at four oil fields in the North
Sabah development area. The success
of these projects, potentially could lead
to the world’s first offshore Alkaline
Surfactant Polymer EOR application
in Horizontal Wells. This is in addition
to the existing 2008 PSC extension
with ExxonMobil Malaysia on the EOR
implementation in Guntong and Tapis
fields, offshore Peninsular Malaysia.
During the period under review, a total
of 185 million standard tank barrels
(mmstb) of oil has been sanctioned
as additional reserves from the Angsi,
Baram, Bokor and Guntong fields, which
is 2.5 times higher than the targeted
amount. The EOR programme is
expected to create significant value for
PETRONAS, as a majority of existing oil
fields in Malaysia are technically suitable
for EOR applications.
TECHNOLOGY& ENGINEERING

PETRONAS ANNUAL REPORT PE 201172
CO2 MANAGEMENTPETRONAS is pursuing CO2
management technology which
is focused not only on the
development of high CO2 gas fields,
but also ensures that natural gas is
produced in a cost-effective manner
with minimal environmental impact.
The CO2 management concentrates
on the entire value chain, from
carbon capture to transportation
and storage.
PETRONAS, in collaboration with
Cameron Process Solutions USA,
has successfully developed and
tested a new multi-fibre membrane
technology for more efficient and
cost-effective removal of CO2
from natural gas production. Field
trials of this new PN-1 Multi-Fibre
Membrane were performed at the
Scurry Area Canyon Reef Operators
(SACROC), testing facility in the
United States, and at CPOC-Muda
platform at the Malaysia-Thailand
Joint Development Area (MTJDA).
This provided valuable data to
validate the technology and prepare
it for commercialisation. The
multi-fibre membrane technology
will be deployed at the JDA-Gas
Balancing Evacuation project at the
PETRONAS Onshore Slug Catcher
in Kertih, Terengganu.
CONTAMINANTS REMOVALPETRONAS made a breakthrough
in collaboration with Queen’s
University of Belfast in Northern
Ireland and Universiti Teknologi
PETRONAS, to develop HycaPureTM
which is capable of removing
impurities to improve product quality
and refining processes.
During the period, the first
commercial 15 tonnes of HycaPure
HgTM for mercury removal in gas
was successfully commissioned
at PETRONAS Gas Bhd (PGB). At
the same time, HycaPure HgTM to
remove mercury from condensates
was developed. The pilot plant will
be commissioned at the Oil and
Gas Terminal (OGT) in Kertih by
2012. Proof-of-concept on mercury
removal from produced water is
currently in progress.
PETRONAS also developed a novel
process to remove naphthenic acid
from crude oil using HycaPureTM.
The pilot plant will be commissioned
at PETRONAS Penapisan (Melaka)
Sdn Bhd by 2013.
» MEMBRANE FIBRES
POTTING FOR
SCREENING STUDY
» HYCAPURE HgTM FOR MERCURY
REMOVAL
15 tonnes of HycaPure HgTM for
mercury removal in gas was
successfully commissioned at PGB
PETRONAS is also in partnership
with University Teknologi Malaysia
(UTM) for the development of
advanced membrane technology for
bulk removal of CO2. The developed
proprietary technology has the
potential to improve CO2 and
hydrocarbon selectivity, allowing for
better performance and separation
efficiency. The membrane material
and process for CO2 removal is
patented by PETRONAS.

reimagining energyPETRONAS ANNUAL REPORT PE 2011 73
GREEN & SUSTAINABLEAs environmental deterioration and natural
resource depletion is a concern, green and
sustainable initiatives are being pursued by
PETRONAS. This is an important objective
where PETRONAS continues to research,
develop and apply green technologies and
solutions in its operations.
SOLARPETRONAS took its first step into renewable
energy with the Suria KLCC Solar Photovoltaic
(PV) Demonstration project, a joint effort
between PETRONAS and Mitsubishi
Corporation Japan. The installation at Suria
KLCC is Malaysia’s single largest PV installation
on a shopping mall rooftop with a capacity
of 685 kilowatt-peak (kWp). It is estimated to
produce 500 megawatt-hours of solar energy
annually, equivalent to 10% of Suria KLCC’s
energy requirement. The electricity produced
could power 200 households, and will contribute
to a greenhouse gas reduction of about 300,000
kg of CO2 per annum.
The PETRONAS Green Station project is another
renewable energy initiative that will install a PV
system at a selected PETRONAS service station
with an estimated peak capacity of 190 kWp.
Detailed engineering work is currently ongoing
and is slated for completion by the end of 2012.
BIOCHEMICALPETRONAS successfully developed palm-
based biopolyols technology for biolubricant
and bio-polyurethane applications. Biopolyols
are designed to replace petroleum-based
polyols, the primary ingredient in making
polyurethane foams a more eco-friendly product.
Biolubricants are the preferred choice especially
in environmentally sensitive applications,
where requirements for biodegradability are
becoming more important. Pilot trials are
currently being conducted and thus far the
trials have successfully produced biopolyols
for flexible and coating applications such as
adhesive and sealants. Pilot trials on the polyol
esters for lubricant applications showed very
promising results with product quality meeting
specifications.
WASTE GAS CONVERSION
In advancing our technological capabilities and
repertoire, PETRONAS invested in LanzaTech,
a company pursuing the conversion of waste
gases such as Carbon Monoxide (CO) and CO2
into valuable chemicals and low carbon fuels
using proprietary microbes. As a strategic
investor, PETRONAS will collaborate with
LanzaTech in the up-scaling of CO and CO2
conversion technology as part of continuous
efforts to reduce greenhouse gas emissions
from PETRONAS operations.
» THE SURIA KLCC SOLAR PHOTOVOLTAIC (PV) DEMONSTRATION PROJECT
is Malaysia’s single largest photovoltaic installation on a 9,000m2 shopping mall
rooftop.
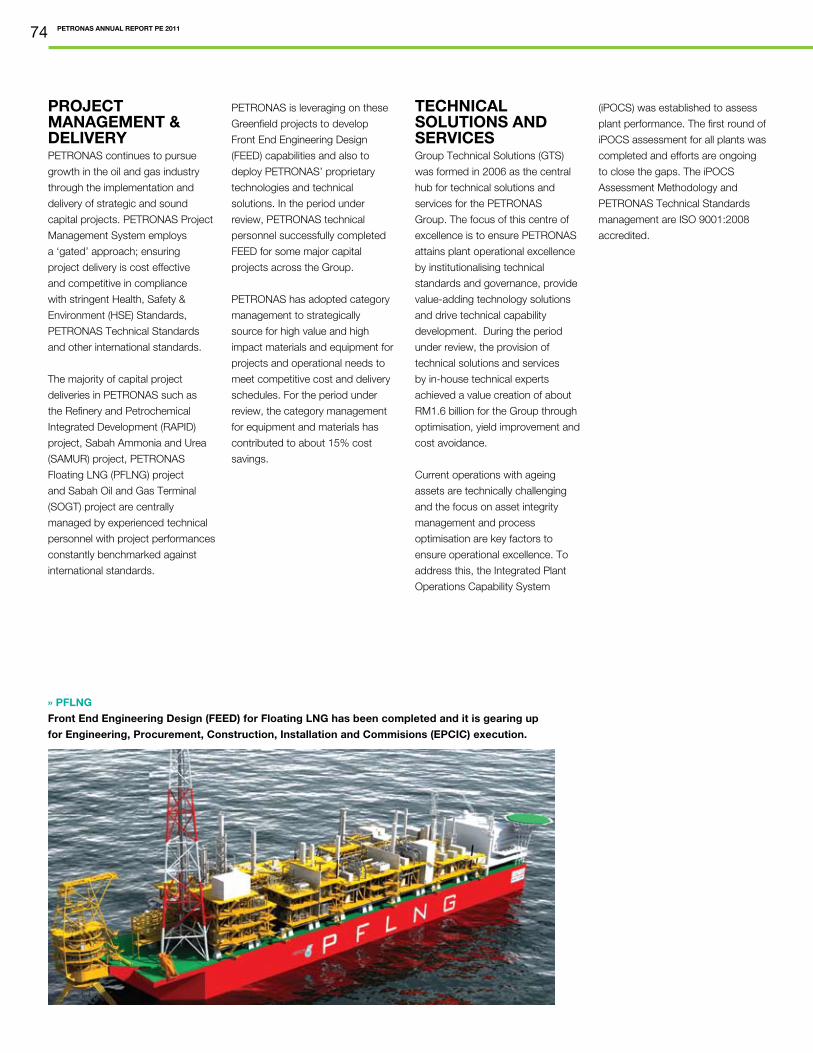
PETRONAS ANNUAL REPORT PE 201174
PROJECT MANAGEMENT & DELIVERYPETRONAS continues to pursue
growth in the oil and gas industry
through the implementation and
delivery of strategic and sound
capital projects. PETRONAS Project
Management System employs
a ‘gated’ approach; ensuring
project delivery is cost effective
and competitive in compliance
with stringent Health, Safety &
Environment (HSE) Standards,
PETRONAS Technical Standards
and other international standards.
The majority of capital project
deliveries in PETRONAS such as
the Refinery and Petrochemical
Integrated Development (RAPID)
project, Sabah Ammonia and Urea
(SAMUR) project, PETRONAS
Floating LNG (PFLNG) project
and Sabah Oil and Gas Terminal
(SOGT) project are centrally
managed by experienced technical
personnel with project performances
constantly benchmarked against
international standards.
» PFLNG
Front End Engineering Design (FEED) for Floating LNG has been completed and it is gearing up
for Engineering, Procurement, Construction, Installation and Commisions (EPCIC) execution.
PETRONAS is leveraging on these
Greenfield projects to develop
Front End Engineering Design
(FEED) capabilities and also to
deploy PETRONAS’ proprietary
technologies and technical
solutions. In the period under
review, PETRONAS technical
personnel successfully completed
FEED for some major capital
projects across the Group.
PETRONAS has adopted category
management to strategically
source for high value and high
impact materials and equipment for
projects and operational needs to
meet competitive cost and delivery
schedules. For the period under
review, the category management
for equipment and materials has
contributed to about 15% cost
savings.
TECHNICAL SOLUTIONS AND SERVICESGroup Technical Solutions (GTS)
was formed in 2006 as the central
hub for technical solutions and
services for the PETRONAS
Group. The focus of this centre of
excellence is to ensure PETRONAS
attains plant operational excellence
by institutionalising technical
standards and governance, provide
value-adding technology solutions
and drive technical capability
development. During the period
under review, the provision of
technical solutions and services
by in-house technical experts
achieved a value creation of about
RM1.6 billion for the Group through
optimisation, yield improvement and
cost avoidance.
Current operations with ageing
assets are technically challenging
and the focus on asset integrity
management and process
optimisation are key factors to
ensure operational excellence. To
address this, the Integrated Plant
Operations Capability System
(iPOCS) was established to assess
plant performance. The first round of
iPOCS assessment for all plants was
completed and efforts are ongoing
to close the gaps. The iPOCS
Assessment Methodology and
PETRONAS Technical Standards
management are ISO 9001:2008
accredited.

reimagining energyPETRONAS ANNUAL REPORT PE 2011 75
ASSET INTEGRITY MANAGEMENTBoth upstream and downstream
operating units have conducted
aggressive Asset Integrity
Management programmes. To
address the issue of ageing assets,
PETRONAS developed its own
methodology and technology
products which include Asset Life
Studies (P-ALS), Pipeline Integrity
Performance Monitoring (PiPeM),
Process Safety Management (PSM),
PETRONAS Risk-Based Inspection
(P-RBI™) and PIPEASSURE™.
P-ALS was developed to study
asset integrity and to optimise
equipment replacement outlay.
During the period under review, it
was deployed in four clusters of
offshore production platforms and
three downstream sites.
In ensuring pipeline integrity for
upstream operations, PiPeM is
an online web-based pipeline
management system that monitors
the integrity and health of 7,600 km
of oil and gas pipeline infrastructure
in Malaysia.
PSM has further strengthened the
implementation of asset integrity
management. During the period,
PSM was mainly deployed at
upstream facilities and efforts are
currently ongoing to close identified
gaps.
P-RBI™, a risk-based inspection
management system to determine
the inspection requirements of
equipment and facilities for safe
operations was also implemented.
P-RBI™ allows extended ‘safe run’
between major turnarounds. The
online web-based system has been
recognised and adopted by the
Department of Occupational Safety
and Health (DOSH) for issuance and
renewal of Certificates of Fitness
for DOSH-registered equipment.
In November 2011, DOSH signed
a Memorandum of Understanding
with PETRONAS for the use of this
system. During the period under
review, P-RBI™ was successfully
deployed at 15 upstream offshore
platforms and several other
operating units such as Ethylene/
Polyethylene (Malaysia) Sdn Bhd
(EPEMSB), Malaysia LNG (MLNG)
and PGB.
PIPEASSURE™ is a novel pipeline
repair system using composite
materials to strengthen and repair
leaks. This PETRONAS proprietary
technology was deployed and
commercialised at risers for
offshore platforms and gas plants.
PROCESS OPTIMISATIONFollowing the successful
optimisation efforts of offshore
platforms since 2009, PETRONAS
developed the Inflow/Outflow
Performance Relationship (IPR)
modelling tool that maximises
production via topside operating
pressure optimisation. IPR was
successfully implemented at four
platforms, which contributed to an
additional production of 538 barrels
per day for the period under review.
Clogged wells are a common issue
which compromised production.
PETRONAS’ in-house chemical
formulation such as SolidClenzTM
was developed to remove organic
and inorganic solid deposits in
well bores and production tubing.
To date, SolidClenzTM has been
applied in 20 wells offshore Sabah
and Sarawak with a success rate
of 75%. This is equivalent to an oil
production increase of 800 barrels
per day for the period under review.
Sand issues also emerged as
a key hindrance to production.
Two sand research projects were
initiated to develop new tools to
resolve these issues. PETRONAS
is also collaborating with Shell on
sand management for Sarawak
Operations.
For downstream production
and distillation optimisation, the
deployment of PETRONAS’
Advanced Dispersion Valve Pinnacle
(ADV-P) high performance trays
and Vapour Horn device at Melaka
Refinery (PSR2 Revamp) have
resulted in favourable performance.
The ADV-P trays will also be used
for MLNG and MLNG Dua plant
acid-gas removal columns and for
all distillation columns in the SOGT
project.
TECHNICAL CAPABILITY MANAGEMENTPETRONAS is aggressively
building a pool of competent
technical personnel through a
structured Technical Capability
Development Programme (TCDP)
which was implemented locally. The
Accelerated Capability Development
programme under the TCDP,
established since January 2009,
also enables young engineers to
gain skills and experience in their
engineering fields to achieve time-
to-autonomy of seven to eight years
as compared to an average of 10-
12 years previously.
The development of Technical
Professionals (TPs) and Technical
Trade Specialists (TTSs) remains
robust in its implementation with
a total of 551 TPs and 92 TTSs
qualified and appointed to date.
The successful implementation of
structured capability management
gained recognition from PETRONAS
operations overseas. Similar
programmes are being adopted
by Engen and PCSB Operations
in Vietnam, Myanmar and
Turkmenistan. In addition, the
Department of Skills Development
(Ministry of Human Resources)
has also adopted one of the TCDP
programmes such as PETRONAS’
Occupational Skills Standard as
the national occupational skills
standard for the oil and gas sector
nationwide.
The developments of TPs
and TTSs remain robust in its
implementation with a total of
551 TPs and 92 TTSs qualified
and appointed to date
IN FOCUS
Time to Autonomy (TTA)for Technical Executives
2009 2010 2011 2012 20142013 2015
NumberofYears
ActualTTA
Year
10
9
8
7
ProjectedTTAof7Years

PETRONAS ANNUAL REPORT PE 201176
OURPEOPLEOVERVIEW Our People Remain Our Greatest Asset
The Company credits the success of its business
to the commitment, dedication and capabilities of
its people. As PETRONAS continues to expand
its presence across the globe, it is equally
committed to create the right work environment
that matches the capabilities of its employees,
while challenging them to push their performance
boundaries and deliver results.
For the period under review, through its Human
Resource Management Division (HRMD),
PETRONAS implemented several key initiatives
to drive strategic talent management across the
Group.
43,266 staffFor the period under review, PETRONAS employees
Groupwide increased by 3.9% to 43,266.
Strengthening High Performance CultureIn our quest to strengthen a high performance
culture that pervades throughout the organisation,
we collaborated with top industry players for staff
exchange, internship and scholarship programmes
to enable our talents to broaden their knowledge
and experiences in the oil and gas industry.
HIGHLIGHTS

reimagining energyPETRONAS ANNUAL REPORT PE 2011 77
RECRUITMENT & TRAINING Business Heads drove talent
sourcing at their respective Business
Units to enable timely, effective
and focused recruitment for their
business needs. The Company’s
competitive Employment Value
Proposition (EVP) is crucial in
attracting, developing and retaining
talent in support of PETRONAS’
business growth strategies.
During the period, PETRONAS
actively embarked on various
talent management initiatives to
nurture and develop its workforce.
To further support its international
business operations, the Company
enhanced the remuneration
package, in line with global market
practices to ensure that it remains
competitive globally.
A total of 932 candidates were
recruited as permanent hires,
comprising 839 Malaysians and 93
international hires during the period.

PETRONAS ANNUAL REPORT PE 201178
DEVELOPING OUR PEOPLEThe Company restructured its
People Development Committees
(PDCs) at various levels to provide
greater line ownership and better
talent management. A total of six
Executive Committee (EXCO) PDCs,
chaired by the President, and over
40 PDCs, chaired by the respective
Business Heads, were successfully
conducted. The PDCs focused
essentially on strategic decisions
regarding talent development,
performance and consequence
management, as well as staff
mobility.
Succession Planning remained a
high priority to identify potential
leaders for Corporate and Business
Critical Positions. To this end, the
Company conducted an aggressive
succession planning exercise, which
resulted in an increase in the ratio of
Leaders to the Critical Positions.
As part of the Company’s effort
to develop potential top talents,
the Development Workshop (DW)
continues to assess the career
potential of these nominated talents.
This effort saw an increase of 30%
in the top talent pool by period end.
Taking a sustainable approach in
developing future leaders in the
technical discipline, PETRONAS
introduced the Techno-Commercial
Leaders Development Programme
this period. Selected technical
talents were nominated to pursue
the comprehensive programme
that focuses on developing and
cultivating top performing technical
staff in the areas of strategic thinking
and commercial competency. The
programme includes an MBA in
Finance at Ivy League universities in
the United States.
In addition, PETRONAS continues
to leverage on its relationships
with its business partners through
strategic collaborations that enable
our top talents to participate in staff
exchange programmes.
Various talent engagement
programmes were also conducted
during the period, such as the
Emerging Leaders Programme
(ELP) and the Bean Bag Circle
of Conversation. The Bean Bag
engagement programme, for
example, provided a platform for
top talents to informally interact with
Vice Presidents and Executive Vice
Presidents on current issues. The
experience gained seeks to instill a
sense of belonging within the talents
and inculcate greater understanding
of the expectations and their role in
the Company. Both programmes
received notable reviews from the
participants.
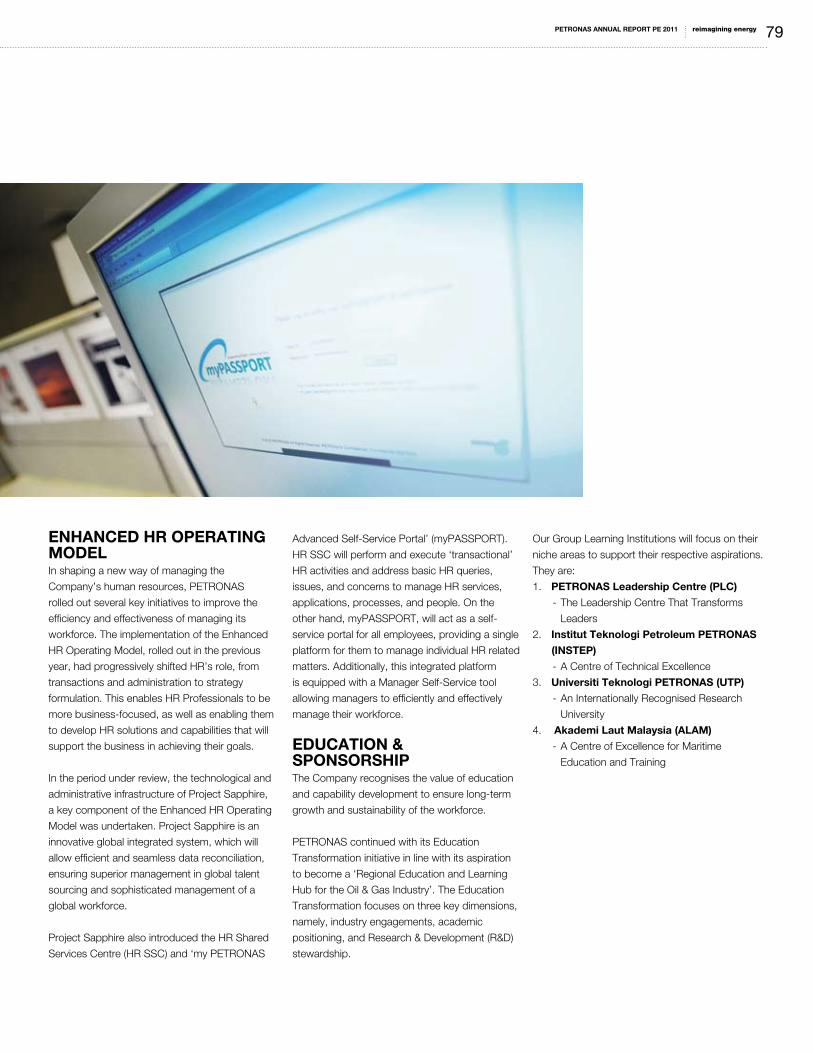
reimagining energyPETRONAS ANNUAL REPORT PE 2011 79
ENHANCED HR OPERATING MODELIn shaping a new way of managing the
Company’s human resources, PETRONAS
rolled out several key initiatives to improve the
efficiency and effectiveness of managing its
workforce. The implementation of the Enhanced
HR Operating Model, rolled out in the previous
year, had progressively shifted HR’s role, from
transactions and administration to strategy
formulation. This enables HR Professionals to be
more business-focused, as well as enabling them
to develop HR solutions and capabilities that will
support the business in achieving their goals.
In the period under review, the technological and
administrative infrastructure of Project Sapphire,
a key component of the Enhanced HR Operating
Model was undertaken. Project Sapphire is an
innovative global integrated system, which will
allow efficient and seamless data reconciliation,
ensuring superior management in global talent
sourcing and sophisticated management of a
global workforce.
Project Sapphire also introduced the HR Shared
Services Centre (HR SSC) and ‘my PETRONAS
Advanced Self-Service Portal’ (myPASSPORT).
HR SSC will perform and execute ‘transactional’
HR activities and address basic HR queries,
issues, and concerns to manage HR services,
applications, processes, and people. On the
other hand, myPASSPORT, will act as a self-
service portal for all employees, providing a single
platform for them to manage individual HR related
matters. Additionally, this integrated platform
is equipped with a Manager Self-Service tool
allowing managers to efficiently and effectively
manage their workforce.
EDUCATION & SPONSORSHIPThe Company recognises the value of education
and capability development to ensure long-term
growth and sustainability of the workforce.
PETRONAS continued with its Education
Transformation initiative in line with its aspiration
to become a ‘Regional Education and Learning
Hub for the Oil & Gas Industry’. The Education
Transformation focuses on three key dimensions,
namely, industry engagements, academic
positioning, and Research & Development (R&D)
stewardship.
Our Group Learning Institutions will focus on their
niche areas to support their respective aspirations.
They are:
1. PETRONAS Leadership Centre (PLC)
- The Leadership Centre That Transforms
Leaders
2. Institut Teknologi Petroleum PETRONAS
(INSTEP)
- A Centre of Technical Excellence
3. Universiti Teknologi PETRONAS (UTP)
- An Internationally Recognised Research
University
4. Akademi Laut Malaysia (ALAM)
- A Centre of Excellence for Maritime
Education and Training
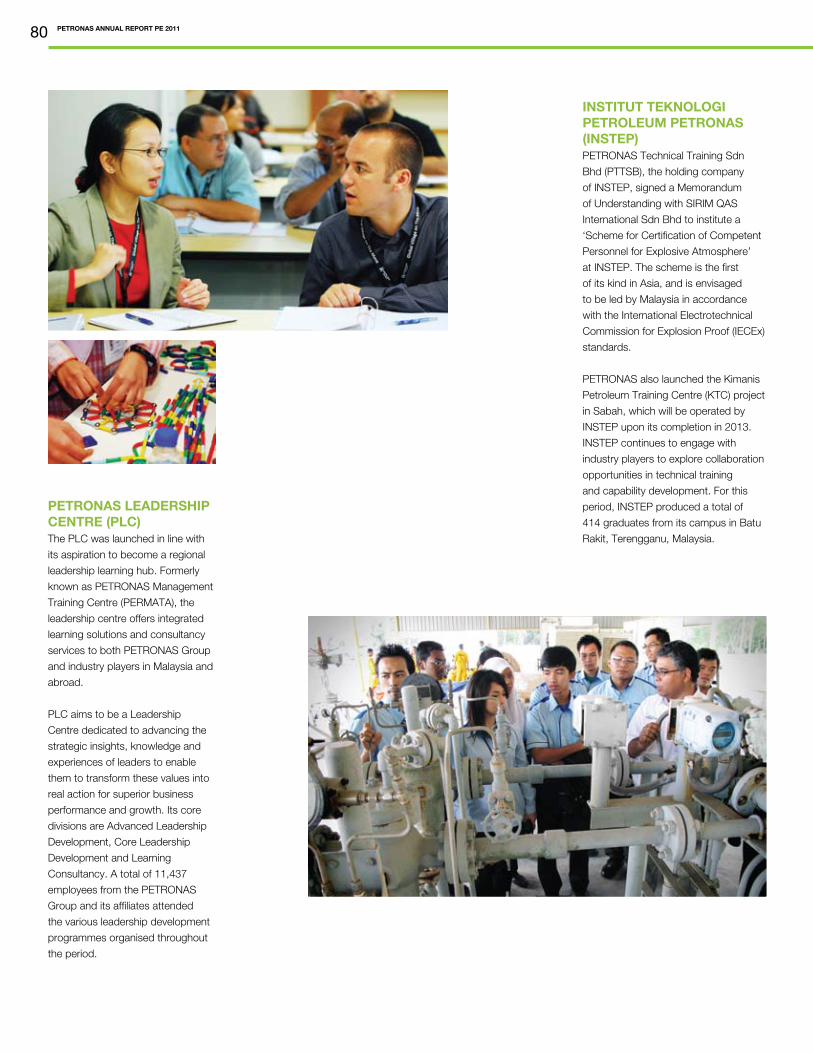
PETRONAS ANNUAL REPORT PE 201180
PETRONAS LEADERSHIP CENTRE (PLC)The PLC was launched in line with
its aspiration to become a regional
leadership learning hub. Formerly
known as PETRONAS Management
Training Centre (PERMATA), the
leadership centre offers integrated
learning solutions and consultancy
services to both PETRONAS Group
and industry players in Malaysia and
abroad.
PLC aims to be a Leadership
Centre dedicated to advancing the
strategic insights, knowledge and
experiences of leaders to enable
them to transform these values into
real action for superior business
performance and growth. Its core
divisions are Advanced Leadership
Development, Core Leadership
Development and Learning
Consultancy. A total of 11,437
employees from the PETRONAS
Group and its affiliates attended
the various leadership development
programmes organised throughout
the period.
INSTITUT TEKNOLOGI PETROLEUM PETRONAS (INSTEP) PETRONAS Technical Training Sdn
Bhd (PTTSB), the holding company
of INSTEP, signed a Memorandum
of Understanding with SIRIM QAS
International Sdn Bhd to institute a
‘Scheme for Certification of Competent
Personnel for Explosive Atmosphere’
at INSTEP. The scheme is the first
of its kind in Asia, and is envisaged
to be led by Malaysia in accordance
with the International Electrotechnical
Commission for Explosion Proof (IECEx)
standards.
PETRONAS also launched the Kimanis
Petroleum Training Centre (KTC) project
in Sabah, which will be operated by
INSTEP upon its completion in 2013.
INSTEP continues to engage with
industry players to explore collaboration
opportunities in technical training
and capability development. For this
period, INSTEP produced a total of
414 graduates from its campus in Batu
Rakit, Terengganu, Malaysia.

reimagining energyPETRONAS ANNUAL REPORT PE 2011 81
UNIVERSITI TEKNOLOGI PETRONAS (UTP) UTP is on track in its bid to achieve
Research University (RU) status by
2013. The RU status is granted by
the Malaysian Ministry of Higher
Education and it paves the way for
funding and grants for research,
development and commercialisation
activities. UTP offers undergraduate
and postgraduate courses related to
the oil and gas industry.
For the period under review, UTP
added the following to its learning
offerings:
1. Establishment of a Geosciences
& Petroleum Engineering
Faculty, consisting of the
Department of Geosciences and
the Department of Petroleum
Engineering.
PETRONAS SCHOLARSHIP PROGRAMME PETRONAS believes that investing in education and human capital
development today will ensure availability of a sustainable pool of
motivated and knowledge-empowered talent for PETRONAS, our
partners, our host nations and local communities.
PETRONAS sponsored 257 students to institutions of higher learning. A
total of 99 scholarships were awarded for international universities and
158 scholarships for local universities in various disciplines relevant to
PETRONAS’ business needs.
A total of 469 PETRONAS scholars graduated during this period, with
238 (50.7%) recruited by PETRONAS and 231 (49.3%) employed by top
industry players across the nation.
AKADEMI LAUT MALAYSIA (ALAM)ALAM is among the top 10% of
the world’s Maritime Education
and Training institutions with world
class infrastructure and training
standards; validated through
the Det Norske Veritas’s annual
benchmarking exercise.
In the period under review,
ALAM enhanced its course
syllabus to meet the new training
requirements as stipulated in the
Manila Amendment on ‘Standards
of Training Certification &
Watchkeeping’ (STCW).
ALAM also became the official
training provider for the Offshore
Petroleum Industry Training
Organisation (OPITO). Additionally,
ALAM provides both training and
consultancy services in supporting
projects that include PETRONAS’
Regasification Terminal Project in
Melaka, as well as the ATB/Vitol
Tanjung Bin Oil Terminal and yard
2. Finalisation of the MBA
programme in Energy
Management with PLC and
international institutions, as
learning partners.
Several other industry collaborations
were also established for Research
& Developement (R&D), student/
staff exchange, internships and
sponsorships for undergraduate and
postgraduate students.
A total of 1,333 students graduated,
out of which 444 graduates (33.3%)
were immediately absorbed into
the PETRONAS workforce. The
remaining 889 (66.7%) graduates
were employed across various
industries in the country.
optimisation project for Malaysia
Marine and Heavy Engineering
(MMHE). ALAM acquired 26 new
customers for both its academic and
consultancy services, demonstrating
its calibre and capabilities towards
realising its vision as a centre of
excellence in maritime education
and training.
ALAM also collaborated with
government agencies namely
Majlis Amanah Rakyat (MARA), the
Federal Land Development Authority
(FELDA) and the Public Services
Department (JPA) in sponsoring
a total of 109 cadets to study at
ALAM.
Collaboration and partnership with
key industry players remain a priority
in ALAM’s strategic growth agenda.
In the period under review, three
Memorandums of Understanding
were signed with Nantong Shipping
College (China), Jefri Bolkiah College
of Engineering (Brunei) and FELDA.

PETRONAS ANNUAL REPORT PE 201182
HEALTH,SAFETY&ENVIRONMENT
OVERVIEWCommitted to being a responsible corporate
citizen, PETRONAS continues to reinforce its
HSE management at all levels. For the period
in review, the Company set up the PETRONAS
HSE Executive Council which serves as a
platform to set targets, review and recommend
industry-driven strategies or initiatives across the
Group. The Council also reviews existing HSE
performance, measures the effectiveness of the
Company’s annual HSE strategy and makes
recommendations. In addition, the PETRONAS
HSE Technical Council was established to
strengthen HSE leadership, mindset and culture.
Collectively, these initiatives will elevate HSE
technical standards based on industry best
practices across the Group.
The Company also completed a Corporate
Sustainability Study to embed sustainable
development in the business. PETRONAS’
Corporate Sustainability Council (CSC), which
was formed in 2010, comprises Heads and
Vice Presidents of businesses and corporate
functions. Chaired by the Company’s Executive
Vice President for Exploration and Production
Business, the CSC continued to drive
sustainability across PETRONAS in the period
under review by providing strategic direction for
Corporate Sustainability implementation.
HSE Governance and Risk ManagementRolled out Health, Safety & Environment (HSE)
Mandatory Control Framework (MCF) and
established best practices for Mercury and
Asbestos Management
18% DecreaseThe Group’s Lost Time Injury Frequency (LTIF)
decreased by 18%
24.9 million mmBtuEnergy savings in our domestic Downstream and
Gas & Power operations
Process Safety Leadership Cascaded Process Safety Leadership (PSL)
programme to management and personnel
Groupwide
HIGHLIGHTS

reimagining energyPETRONAS ANNUAL REPORT PE 2011 83
SAFETYPERFORMANCEThroughout the review period,
six fatalities were reported. Three
contractors lost lives in a single
aviation incident and another three
in project construction activities.
A reduction trend was observed for
the Group’s LTIF, which decreased
by 18% from 0.39 during the
Financial Year 2011 to 0.32 in the
period under review. On the other
hand, the Group’s Total Reportable
Case Frequency (TRCF) rose to
1.00 in the period under review
compared to 0.81 in the previous
year, attributed to improved
reporting.
08 09 10 11 PE11
3.75
2.582.86
5.72
3.36
Fatal Accident RateReportableFatalitiesper100millionmanhours
08 09 10 11 PE11
0.88
0.35 0.
44
0.31 0.
39
0.32
0.88
0.78 0.
81
1.00
LTIF and TRCF for the GroupNo.ofcasesperonemillionmanhours
LTIF TRCF
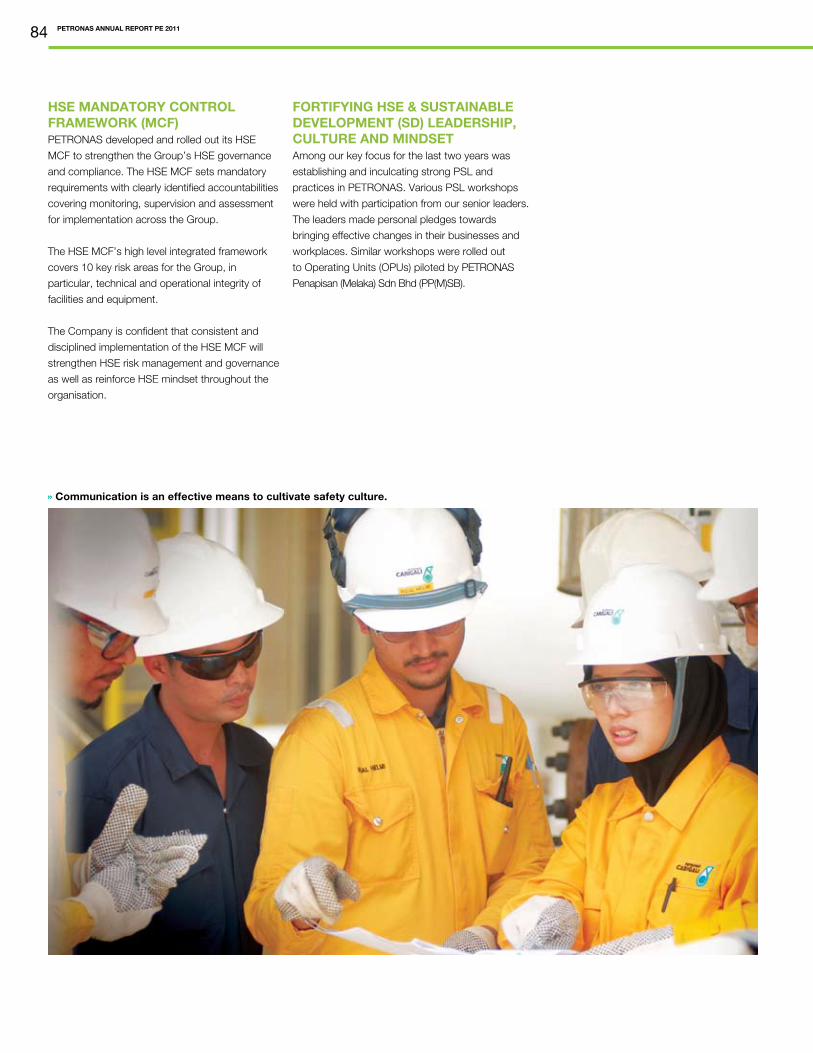
PETRONAS ANNUAL REPORT PE 201184
HSE MANDATORY CONTROL FRAMEWORK (MCF)PETRONAS developed and rolled out its HSE
MCF to strengthen the Group’s HSE governance
and compliance. The HSE MCF sets mandatory
requirements with clearly identified accountabilities
covering monitoring, supervision and assessment
for implementation across the Group.
The HSE MCF’s high level integrated framework
covers 10 key risk areas for the Group, in
particular, technical and operational integrity of
facilities and equipment.
The Company is confident that consistent and
disciplined implementation of the HSE MCF will
strengthen HSE risk management and governance
as well as reinforce HSE mindset throughout the
organisation.
FORTIFYING HSE & SUSTAINABLE DEVELOPMENT (SD) LEADERSHIP, CULTURE AND MINDSETAmong our key focus for the last two years was
establishing and inculcating strong PSL and
practices in PETRONAS. Various PSL workshops
were held with participation from our senior leaders.
The leaders made personal pledges towards
bringing effective changes in their businesses and
workplaces. Similar workshops were rolled out
to Operating Units (OPUs) piloted by PETRONAS
Penapisan (Melaka) Sdn Bhd (PP(M)SB).
» Communication is an effective means to cultivate safety culture.

reimagining energyPETRONAS ANNUAL REPORT PE 2011 85
HSE RISK MANAGEMENTGroup HSE Risk Profiling was
developed in July 2011 and
incorporated into the current Group
Enterprise Risk Management. This
was rolled out and adopted by
OPUs in August 2011. In line with
our strategy to strengthen HSE risk
management, HSE Tier 3 assurance
schedules were developed based
on OPU’s Risk Profiles.
With the aim to further improve
safety awareness and performance,
an interactive online courseware,
iZeTo, and two animation videos
were developed. Comprising
11 modules, iZeTo features the
animated Lat cartoon characters,
Tuah and ZeTo, and includes an
interactive quiz to assess the users’
knowledge and understanding of
the rules. The two PETRONAS
ZeTo Rules Animation Video
showcase the ZeTo rules and its
importance and the requirements
of Permit to Work. As the response
to both learning aids have been
positive, more educational tools
will be developed to elevate safety
awareness.
In line with our strategy to
strengthen HSE regulation, the
PETRONAS HSE Executive Council
consisting of PETRONAS senior
management from respective
businesses was established during
the period. The Council approved
the HSE MCF at its first bi-annual
meeting in November 2011.
HEALTHAt PETRONAS we are committed to
support our employees in reducing
health risks and maintaining good
physical and mental health through
the implementation of workplace
health programmes.
With this in mind, several measures
have been institutionalised to
improve workplace conditions and
minimise risk at work.
Leveraging on our good practices,
PETRONAS has been tasked to
lead the development of a national
guideline for the oil and gas industry.
» THE GUIDELINES ON MERCURY
MANAGEMENT IN OIL AND GAS
INDUSTRY
The guideline was published in
September 2011 and provides
information and recommendations
on how to manage mercury in the
oil and gas industry
NATIONAL MERCURY MANAGEMENT GUIDELINES FOR THE OIL & GAS INDUSTRYPETRONAS was benchmarked
for its Mercury Management
Guidelines (PHgMG) to effectively
manage mercury issues. The
Group was tasked by the
Department of Occupational
Safety and Health (DOSH) to lead
the development of the National
Mercury Management Guidelines
for the oil and gas industry.
The guideline was published
in September 2011 and
provides information and
recommendations on how to
manage mercury in the oil and
gas industry in accordance
with the Occupational Safety
and Health (Use and Standards
of Exposure of Chemicals
Hazardous to Health) Regulations
2000.

PETRONAS ANNUAL REPORT PE 201186
HEALTH RISK ASSESSMENT (HRA)HRA was rolled out Groupwide, with 85% completion in
domestic operations. To ensure successful implementations
of HRA, efforts were taken including the development of
a Health Risk Profiling methodology. In Malaysia, a series
of PETRONAS–DOSH engagement sessions were held
after PETRONAS obtained approval from the Director
General (DG) of DOSH for PETRONAS HRA methodology
in conducting both DOSH’s Chemical HRA (CHRA) and
HRA. For international operations, HRA workshops were
organised with our Downstream Business, particularly in
Italy, Spain and Belgium.
ASBESTOS MANAGEMENT INTERVENTION PROGRAMME (AMIP)PETRONAS established the AMIP in 2011. The programme
aims to assist OPUs and joint ventures in asbestos
identification, risk assessment and prioritisation in addition
to removal work.
The Company also issued a directive to ban any
introduction of asbestos to the businesses, at the end of
2010, with the aim to achieve an asbestos-free workplace
within five years. An ‘Asbestos Ban’ statement was included
in all procurement documents and incorporated into
PETRONAS’ Technical Standards. A series of workshops
were also held with OPUs apart from presenting the
requirements to the Plant Engineering Panel and during the
HSE Managers’ Meeting.
ENVIRONMENTIn our continuous effort to operate in an environmentally-
responsible manner, PETRONAS has developed a product
carbon footprint during the period under review, based on
established guidelines. There were also various engagement
sessions on oil spill response and preparedness to ensure
that our operations are governed by industry best practices.
PRODUCT CARBON FOOTPRINT DEVELOPMENTPETRONAS developed and compiled preliminary product
carbon footprint data for key products namely, composite
crude oil, natural gas, methyl tertiary butyl ether (MTBE)
and propylene. The creation of the product carbon footprint
was based on the Company’s internally developed Life
Cycle Inventory guideline with special regards to carbon
footprint accounting. These guidelines provide step-by-
step assistance in establishing the carbon footprint of the
product processed, manufactured and distributed by the
Group.
OIL SPILL RESPONSE AND PREPAREDNESSPETRONAS headed the Production Sharing Contracts’
(PSCs) Oil Spill Response Task Force in Malaysia. The task
force plays a key role in streamlining technical, procedural
and regulatory aspects in oil spill response.
» ETHYLENE/POLYETHYLENE
MALAYSIA SDN BHD
Staff monitoring personal mercury
exposure during gas compressor
cleaning activity

reimagining energyPETRONAS ANNUAL REPORT PE 2011 87
CUMULATIVE ENERGY SAVINGS IN DOMESTIC DOWNSTREAM AND GAS & POWER OPERATIONSPETRONAS OPUs continued to
achieve energy savings resulting
in lower resource consumption in
the review period. These savings
were realised through long-term
initiatives such as Strategic Energy
Review (SER) and Energy Loss
Management (ELM). In the period
under review, PETRONAS achieved
savings of 2.7 million mmBtu in our
domestic Downstream and Gas
& Power operations, bringing the
cumulative energy savings total to
24.9 million mmBtu since Financial
Year 2007.
GREENHOUSE GAS (GHG) EMISSIONSTo effectively manage operational
carbon footprint, ongoing efforts are
being made to assess performance
and strengthen processes across
businesses. In the period under
review, total GHG emissions for
PETRONAS’ operations in Malaysia
was 40.42 million tonnes of CO2
equivalent.
PRODUCT STEWARDSHIPPETRONAS continued to fortify its
product stewardship practices to
minimise potential HSE impacts
across the product value chain. A
Product Stewardship Framework
was developed and is currently
being implemented by PETRONAS
Chemicals Group’s (PCG) value
chain.
» MALAYSIA LNG (MLNG)
SER was carried out at MLNG, contributing to the cumulative energy savings

PETRONAS ANNUAL REPORT PE 201188
PETRONAS Group was recognised for its accomplishments and continuous pursuit of excellence with numerous awards and recognitions received in 2011.
AWARDS&RECOGNITIONS
Grand Award• MTBE/PolypropyleneMalaysiaSdnBhd
• PETRONASFertilizer(Kedah)SdnBhd
• PETRONASGasBerhad–CentralisedUtilityFacilities
(CUF), Gebeng
• PETRONASGasBerhad–SegamatRegional
Operations Office
• PETRONASGasBerhad–GasProcessingPlant
Complex B
Gold Merit Award• PETRONASAmmoniaSdnBhd
• PETRONASMethanol(Labuan)SdnBhd
• PETRONASPenapisan(Melaka)SdnBhd
• PETRONASGasBerhad–CentralisedUtilityFacilities
(CUF), Kertih
• PETRONASGasBerhad–ExportTerminal
Royal Society for the Prevention of Accidents (RoSPA) Awards
One of the top awards in the health and safety
calendar, the annual RoSPA Awards offer organisations
a prime opportunity to prove their ongoing commitment
to raising health and safety standards. Among the
longest running and highly respected occupational
safety award programmes today, the awards
recognise excellence in work-related health and safety
performance by private and public sector organisations.
Sector Awards Oil and Gas Sector Award• PETRONASPenapisan(Melaka)SdnBhd
Gold Award• PETRONASAmmoniaSdnBhd
Silver Award• PETRONASFertilizer(Kedah)SdnBhd
Malaysian Society for Occupational Safety and Health (MSOSH) Awards
The annual MSOSH Awards recognise companies in
Malaysia that demonstrate outstanding occupational safety
and health performance.

reimagining energyPETRONAS ANNUAL REPORT PE 2011 89
Chemical Industries Council of Malaysia (CICM) Responsible Care Awards 2010
CICM is the governing body representing the various sub-sector
chemical groups ranging from oleochemicals, paints, fertilisers,
petrochemicals, agriculture chemicals, industrial gases, coating
resins and biodiesel sectors. The CICM Responsible Care Awards,
introduced in 2001, recognise organisations that have made
the most significant and measurable progress in implementing
Responsible Care’s Six Codes of Management Practices in
Malaysia. The Codes encompass Distribution, Process Safety,
Pollution Prevention, Product Stewardship, Community Awareness
& Emergency Response as well as Employee Health & Safety.
Category – PetrochemicalsGold Award Product Stewardship • MTBE/PolypropyleneMalaysiaSdnBhd
• Ethylene/PolyethyleneMalaysiaSdnBhd
Community Awareness & Emergency Response• MTBE/PolypropyleneMalaysiaSdnBhd
Process Safety• OPTIMALChemicals(Malaysia)SdnBhd
• Ethylene/PolyethyleneMalaysiaSdnBhd
Distribution• Ethylene/PolyethyleneMalaysiaSdnBhd
Employee Health and Safety• PETRONASPenapisan(Melaka)SdnBhd
Silver Award Distribution• OPTIMALChemicals(Malaysia)SdnBhd
Employee Health and Safety• Ethylene/PolyethyleneMalaysiaSdnBhd
Community Awareness & Emergency Response• PETRONASFertilizer(Kedah)SdnBhd
Pollution Prevention Code• BASFPETRONASChemicalsSdnBhd
Process Safety• BASFPETRONASChemicalsSdnBhd
Product Stewardship• BASFPETRONASChemicalsSdnBhd
Merit AwardCommunity Awareness & Emergency Response• PETRONASAmmoniaSdnBhd
• OPTIMALChemicals(Malaysia)SdnBhd
• Ethylene/PolyethyleneMalaysiaSdnBhd
• PETRONASPenapisan(Melaka)SdnBhd
• Petlin(Malaysia)SdnBhd
Pollution Prevention• PETRONASAmmoniaSdnBhd
• AromaticsMalaysiaSdnBhd
• MTBE/PolypropyleneMalaysiaSdnBhd
• Petlin(Malaysia)SdnBhd
• OPTIMALChemicals(Malaysia)SdnBhd
• Ethylene/PolyethyleneMalaysiaSdnBhd
• PETRONASFertilizer(Kedah)SdnBhd
• PETRONASPenapisan(Terengganu)SdnBhd
Gold (Class I) • PETRONASCarigaliSdnBhd–SabahGasTerminal
• PETRONASGasBerhad–GasProcessingPlant
Complex A
Gold (Class II)• PETRONASCarigaliSdnBhd–LabuanGasTerminal
• PETRONASGasBerhad–PasirGudangRegional
Operations Office

PETRONAS ANNUAL REPORT PE 201190
Process Safety• PETRONASAmmoniaSdnBhd
• AromaticsMalaysiaSdnBhd
• MTBE/PolypropyleneMalaysiaSdnBhd
• Petlin(Malaysia)SdnBhd
• PETRONASFertilizer(Kedah)SdnBhd
• PETRONASPenapisan(Melaka)SdnBhd
• PETRONASPenapisan(Terengganu)SdnBhd
Employee Health & Safety• AromaticsMalaysiaSdnBhd
• MTBE/PolypropyleneMalaysiaSdnBhd
• Petlin(Malaysia)SdnBhd
• OPTIMALChemicals(Malaysia)SdnBhd
• BASFPETRONASChemicalsSdnBhd
• PETRONASAmmoniaSdnBhd
• PETRONASPenapisan(Terengganu)SdnBhd
• PETRONASFertilizer(Kedah)SdnBhd
Product Stewardship • Petlin(Malaysia)SdnBhd
• PETRONASPenapisan(Melaka)SdnBhd
Distribution• Petlin(Malaysia)SdnBhd
National Council for Occupational Safety and Health (NCOSH) Excellence Award
The Award is an initiative by the NCOSH, Ministry of Human
Resources to give recognition to organisations, employers
and employees in various sectors in the industry that achieved
excellence in managing safety and health systems in their
workplace.
Category - Petroleum/Gas/Chemicals • PETRONASAmmoniaSdnBhd
Category - Power Facility• PETRONASGasBerhad–CentralisedUtilityFacilities(CUF),
Gebeng
Category - Gas Facility• PETRONASGasBerhad–NegeriSembilan
Category - Property• KLCCUrushartaSdnBhd(PETRONASTwinTowers)

reimagining energyPETRONAS ANNUAL REPORT PE 2011 91
Malaysian Occupational Safety and Health Professionals’ Association (MOSHPA) Awards
The MOSHPA Awards recognise the outstanding achievements
of companies in the field of Occupational Safety and Health in
improving safety at the workplace. The awards encourage the
implementation and improvement of strategies in managing
Occupational Safety and Health.
Occupational Safety and Health Award for Project Management and Consultancy• KLCCProjeksSdnBhd
The Prime Minister’s Hibiscus Award is the premier private sector
environmental award for businesses and industries in Malaysia.
The Award is jointly organised by four of Malaysia’s leading
private sector non-profit organisations concerned with corporate
environmental management and performance, namely Business
Council for Sustainability and Responsibility Malaysia (BCSRM),
Environmental Management & Research Association of Malaysia
(ENSEARCH), Federation of Malaysian Manufacturers (FMM) and
Malaysian International Chamber of Commerce & Industry (MICCI).
Exceptional Achievement in Environmental Performance• PETRONASCarigaliSdnBhd-OnshoreGasTerminal
Notable Achievement in Environmental Performance• AromaticsMalaysiaSdnBhd
• MTBE/PolypropyleneMalaysiaSdnBhd
• Petlin(Malaysia)SdnBhd
• PETRONASCarigaliSdnBhd-OnshoreGasTerminal
• PETRONASPenapisan(Melaka)SdnBhd
• PETRONASPenapisan(Terengganu)SdnBhd
Melaka State Award• PETRONASPenapisan(Melaka)SdnBhd
Terengganu State Award• PETRONASCarigaliSdnBhd-OnshoreGasTerminal
Challenge Trophy• PETRONASCarigaliSdnBhd-OnshoreGasTerminal
Prime Minister’s Hibiscus Award

PETRONAS ANNUAL REPORT PE 201192
Kancil Awards 2011
The Kancil Awards recognise home-grown Malaysian creative
excellence in endorsing the highest standards of creativity in
advertising. The winning advertisements were produced by Leo
Burnett Advertising Sdn Bhd.
Silver KancilCinematography• PETRONASHariRaya/Merdeka2011advertisement
entitled ‘Hands’
Bronze KancilFilm (Single)• PETRONASChineseNewYear2011advertisement
entitled ‘Their Hope’
• PETRONASMotorsportsFormulaOne
advertisement entitled ‘F1 for Everyone’
• PETRONASDeepavali2010advertisemententitled
‘Giant’
Film (Direction)• PETRONASMotorsportsFormulaOne
advertisement entitled ‘F1 for Everyone’
Film (Editing)• PETRONASMotorsportsFormulaOne
advertisement entitled ‘F1 for Everyone’
Cinematography• PETRONASMotorsportsFormulaOne
advertisement entitled ‘F1 for Everyone’
RecognitionPETRONAS Penapisan (Terengganu) Sdn Bhd successfully
recorded the biggest turnaround exercise in history (more than
700,000 safe manhours) without any major incidents, in addition
to completing it ahead of schedule while registering a final
budget of 13% below the initial cost.
RecognitionFor 2010 Solomon Benchmarking, both PETRONAS Penapisan
(Melaka) Sdn Bhd and Malaysian Refining Company Sdn Bhd
achieved top quartile performance in TCOE & Mechanical
Availability. Both plants also achieved better rating for Enegy
Intensity Index, Maintenance Index and Personnel Index compared
to their 2008 results.
Turnaround and Project (TANP) 2011
Solomon Benchmarking Result

reimagining energyPETRONAS ANNUAL REPORT PE 2011 93
Merit KancilFilm (Single)• PETRONASHariRaya/Merdeka2011
advertisement entitled ‘Hands’
• PETRONASMotorsportsFormulaOne
advertisement entitled ‘F1 Carwash’
Film (Campaign)• PETRONASMotorsportsFormulaOne
advertisement entitled ‘F1 for Everyone’
Copywriting• PETRONASHariRaya/Merdeka2011
advertisement entitled ‘Hands’
• PETRONASDeepavali2010advertisement
entitled ‘Giant’
Film (Direction)• PETRONASDeepavali2010advertisement
entitled ‘Giant’
Film (Editing)• PETRONASHariRaya/Merdeka2011
advertisement entitled ‘Hands’
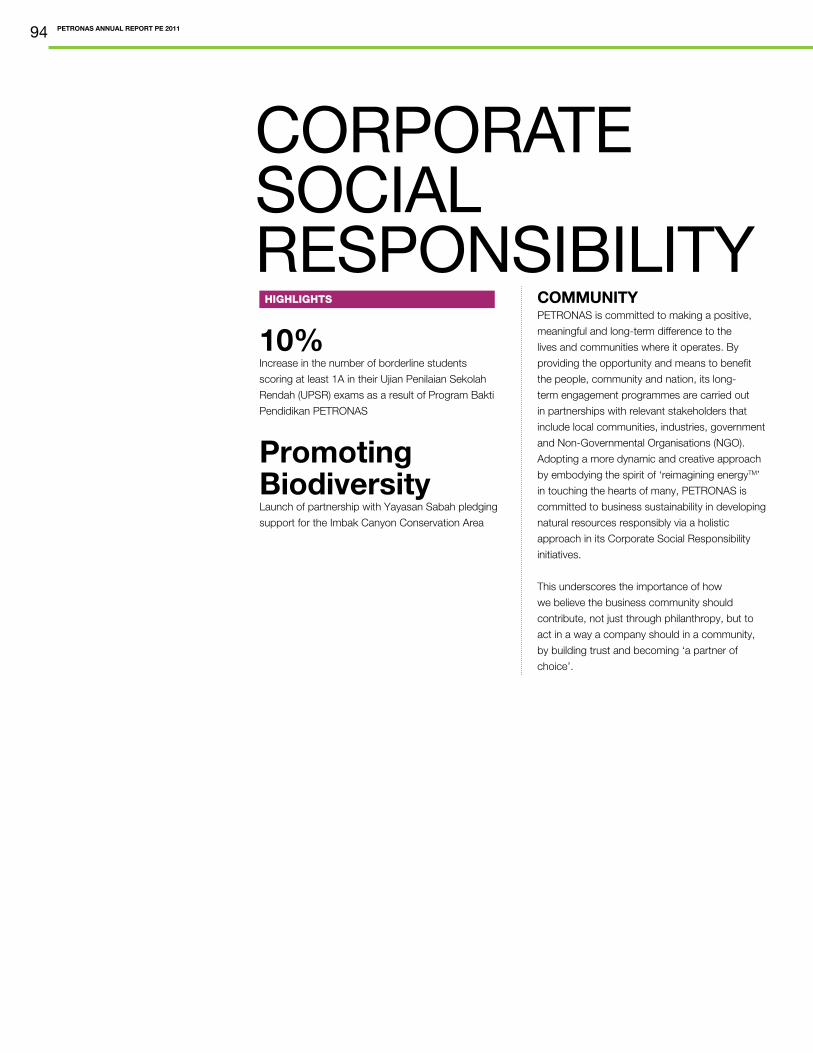
PETRONAS ANNUAL REPORT PE 201194
CORPORATESOCIALRESPONSIBILITY
COMMUNITYPETRONAS is committed to making a positive,
meaningful and long-term difference to the
lives and communities where it operates. By
providing the opportunity and means to benefit
the people, community and nation, its long-
term engagement programmes are carried out
in partnerships with relevant stakeholders that
include local communities, industries, government
and Non-Governmental Organisations (NGO).
Adopting a more dynamic and creative approach
by embodying the spirit of ‘reimagining energyTM’
in touching the hearts of many, PETRONAS is
committed to business sustainability in developing
natural resources responsibly via a holistic
approach in its Corporate Social Responsibility
initiatives.
This underscores the importance of how
we believe the business community should
contribute, not just through philanthropy, but to
act in a way a company should in a community,
by building trust and becoming ‘a partner of
choice’.
10%Increase in the number of borderline students
scoring at least 1A in their Ujian Penilaian Sekolah
Rendah (UPSR) exams as a result of Program Bakti
Pendidikan PETRONAS
Promoting BiodiversityLaunch of partnership with Yayasan Sabah pledging
support for the Imbak Canyon Conservation Area
HIGHLIGHTS

reimagining energyPETRONAS ANNUAL REPORT PE 2011 95
Our investments in a broad range of community-
based programmes, both at home and abroad
include:
PROGRAM BAKTI PENDIDIKAN PETRONAS (PBPP)Introduced in 2002 in partnership with schools
nationwide, this outreach programme aims to
build a strong academic foundation for borderline
students from underprivileged families in the
communities where PETRONAS operates.
In support of the Government’s efforts to improve
the level of academic achievement in English,
Mathematics and Science among students, the
programme focuses on teaching these subjects
through weekly academic and non-academic
activities conducted by full-time teachers and
PETRONAS staff facilitators.
In the period under review, 42 schools
participated in this programme. Over 1,000
academic and fun learning sessions were held in
schools nationwide, benefiting over 3,000 Year 4
to Year 6 students.
The programme saw the participation of over 700
PETRONAS staff facilitators. There was a 10%
increase in the number of students who achieved
at least 1A in their UPSR examinations compared
to the corresponding period.
In addition, one of the PBPP schools achieved
best school status as seven out of the 12
borderline students achieved 5As in the UPSR
exams, helping to elevate the position of the
school.
» PROGRAM BAKTI
PENDIDIKAN
PETRONAS (PBPP)
PBPP reached out to
over 3,000 Year 4 to
Year 6 students in 2011
CORPORATESOCIALRESPONSIBILITY

PETRONAS ANNUAL REPORT PE 201196
NATIONAL CONSUMER DAY In support of the Federation of
Malaysian Consumers Association’s
(FOMCA) efforts to educate and
raise consumer awareness about
smart and sustainable consumerism,
PETRONAS contributed RM100,000
towards National Consumer Day
activities.
PROGRAM KENALI ANAK KITA (KAK)In partnership with PENGASIH,
a NGO and self-help group
affiliated with the World Federation
of Therapeutic Communities,
PETRONAS organised a series of
seminars and workshops involving
about 4,600 parents.
The programme helped raise
awareness on the dangers of
substance abuse and equipped
parents with the knowledge to
prevent substance abuse among
their children while promoting a
healthy lifestyle.
PETRONAS launched this
programme in 2009 to support the
Government’s efforts to combat
substance abuse.
PROGRAM PENCEGAHAN DADAH PETRONAS (SAHABAT PPDa)While the Group works closely with
parents through KAK, Sahabat
PPDa PETRONAS aims to raise
awareness of substance abuse
among students and teachers.
Sahabat PPDa PETRONAS
continues to be Malaysia’s
Ministry of Education’s (MOE) sole
nationwide drug awareness and
prevention programme. In this
period, seminars and workshops
held under this programme were
organised in collaboration with MOE.
The programme reached out to
more than 10,000 students and
teachers who play the role of
change agents for drug awareness
in their respective schools.
PROGRAM SENTUHAN HARAPAN PETRONASLaunched in 2010, the Sentuhan
Harapan Programme (A Touch of
Hope) is a community outreach
initiative by PETRONAS in
collaboration with MyKasih
Foundation, a non-profit
organisation. The programme
provides food aid to eligible
underprivileged families through
designated PETRONAS service
station convenience stores (Kedai
Mesra).
In 2011, PETRONAS contributed
RM2 million in food aid to about
5,000 families in 10 states namely
Johor, Kedah, Kelantan, Melaka,
Pahang, Perak, Sabah, Sarawak,
Selangor and Terengganu.
PETRONAS also conducted
awareness programmes for the
recipients on financial literacy,
health management and youth
development to help these families
transform their lives for the better.
These supplementary programmes
were conducted in collaboration
with the National Population and
Family Development Board.

reimagining energyPETRONAS ANNUAL REPORT PE 2011 97
» IMBAK CANYON CONSERVATION
AREA, SABAH
The Imbak Canyon’s rainforest acts
as a wildlife corridor linking the
Danum Valley and Maliau Basin
PROGRAM SENTUHAN KASIH PETRONASIn conjunction with the annual
Hari Raya, Chinese New Year,
Deepavali, Hari Gawai and Tadau
Ka’amatan celebrations in 2011,
PETRONAS hosted a series of
gatherings for underprivileged
children from orphanages and
shelter homes in and around its
areas of operations. During the
period, between 300 and 500
staff volunteered to engage with
more than 1,000 children who
participated in these programmes.
REACHING OUT THROUGH MEDIAAs testimony to PETRONAS’
commitment to reach out to
the community, its Hari Raya/
Merdeka, Chinese New Year and
Deepavali 2011 advertisements
were accorded recognition in the
prestigious Kancil Awards in 2011.
Notable among the achievements
was the ‘Hands’ television
advertisement conveyed through a
visual poetry concept, showcasing
a metaphor of togetherness and
forgiveness. These were the
main values embodied in the twin
festivities of Hari Raya Aidilfitri and
Hari Merdeka.
PETRONAS harnessed the
popularity of social media platforms
to launch the ‘Saya Suka Malaysia
Contest’ held in conjunction with
Malaysia’s Independence Day and
reached out to over one million
page views. The exposure also
boosted PETRONAS’ Facebook
page with 30,000 new fans and
reached over 7.5 million Malaysians
through the Internet.
As a powerful engagement
platform, the initiative was
consistent with the Group’s spirit of
reimagining energy™, which is to
do things differently in reimagining
our engagements with key
stakeholders to communicate what
PETRONAS represents.
IMBAK CANYON CONSERVATION AREA
In June 2011, PETRONAS
launched its partnership
with Yayasan Sabah (Sabah
Foundation) and pledged RM6
million to support the Imbak
Canyon Conservation Area, a
region of unexplored rainforest
with a potential for new scientific
discoveries due to its rich
biodiversity. The contribution will
be used to establish the Imbak
Canyon Study Centre which will
manage the area and conduct
various activities including research,
environmental education and
outreach programmes. Together,
PETRONAS and Yayasan Sabah
aim to develop long-term research
collaborations to increase the
awareness on Imbak Canyon
as well as to educate the public
and the communities living in
the surrounding areas on how to
preserve and protect this natural
treasure.
Imbak Canyon serves as a wildlife
corridor linking Danum Valley and
Maliau Basin, which falls under the
purview of Yayasan Sabah. Imbak
Canyon is expected to play a key
role in future forest rehabilitation,
while promoting greater interest
in environmental education and
nature tourism for Sabah and
Malaysia in general.

PETRONAS ANNUAL REPORT PE 201198
MERDEKA AWARDThe Merdeka Award was
established in 2007 by PETRONAS,
ExxonMobil and Shell as a symbol
of the oil and gas industry’s
contribution to Malaysia’s enduring
legacy and to celebrate half-a-
century of our growth and progress
as an independent nation.
Each year, the Award is presented
for outstanding achievements in five
categories:
1. Education and Community
2. Environment
3. Health, Science and Technology
4. Outstanding Scholastic
Achievement
5. Outstanding Contribution to the
People of Malaysia.
These categories represent
key areas which are critical to
Malaysia’s continuous growth and
development. These categories
also portray the development
areas supported by the Founding
Members through their various
Corporate Social Responsibility
initiatives in this country.
This year, the award was conferred
to Dato’ Dr Kenneth Yeang for his
outstanding contribution to the
development of design methods for
the ecological design and planning
of the built environment; Professor
Dato’ Dr Goh Khean Lee for
his outstanding contribution
in elevating the study and
practice of gastroenterology and
hepatology in Malaysia to global
standards; and Professor Dr Mak
Joon Wah for his outstanding
fundamental and applied research
in parasitology and parasitic
diseases, public health and
pathology.
PETRONAS continues to actively contribute to community projects abroad through our international operations.
MYANMARIn Myanmar, PETRONAS continued
to manage its socio-economic
and humanitarian projects under
the Yetagun Socio-Economic
Development Programme. During
the period, under the Early
Childhood Care & Development
(ECCD) Programme, 70% of the
children passed their matriculation
examinations.Through direct
involvement with the communities,
PETRONAS continuously improved
this programme.
The ECCD was established in
1997 in collaboration with village
committees and has nurtured more
than 10,000 children living in 37
villages around the pipeline corridor.
During the period, PETRONAS
also collaborated with a private
vocational training centre to
provide skills and build confidence
among the youth living in the
pipeline area to prepare them for
better employment and career
opportunities. So far, 107 have
graduated and found employment
or have started their own
businesses.
TURKMENISTANAs one of PETRONAS’ key
strategies in developing human
capital in the country, PETRONAS
continued to provide training and
education opportunities to Turkmen
nationals in 2011.
» RECIPIENTS OF THE MERDEKA AWARD WITH
THE PATRON AND FOUNDING MEMBERS
The Merdeka Award is presented annually
to Malaysians as well as non-Malaysians for
their outstanding achievements and lasting
contributions to the nation
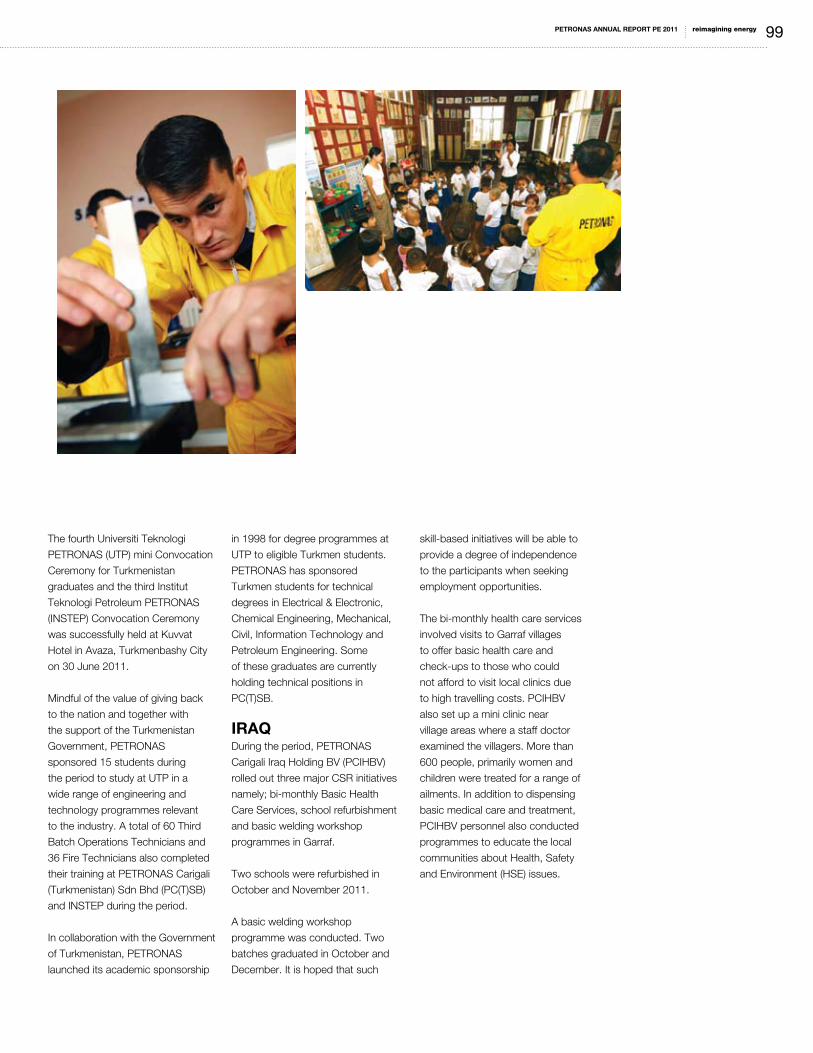
reimagining energyPETRONAS ANNUAL REPORT PE 2011 99
The fourth Universiti Teknologi
PETRONAS (UTP) mini Convocation
Ceremony for Turkmenistan
graduates and the third Institut
Teknologi Petroleum PETRONAS
(INSTEP) Convocation Ceremony
was successfully held at Kuvvat
Hotel in Avaza, Turkmenbashy City
on 30 June 2011.
Mindful of the value of giving back
to the nation and together with
the support of the Turkmenistan
Government, PETRONAS
sponsored 15 students during
the period to study at UTP in a
wide range of engineering and
technology programmes relevant
to the industry. A total of 60 Third
Batch Operations Technicians and
36 Fire Technicians also completed
their training at PETRONAS Carigali
(Turkmenistan) Sdn Bhd (PC(T)SB)
and INSTEP during the period.
In collaboration with the Government
of Turkmenistan, PETRONAS
launched its academic sponsorship
in 1998 for degree programmes at
UTP to eligible Turkmen students.
PETRONAS has sponsored
Turkmen students for technical
degrees in Electrical & Electronic,
Chemical Engineering, Mechanical,
Civil, Information Technology and
Petroleum Engineering. Some
of these graduates are currently
holding technical positions in
PC(T)SB.
IRAQDuring the period, PETRONAS
Carigali Iraq Holding BV (PCIHBV)
rolled out three major CSR initiatives
namely; bi-monthly Basic Health
Care Services, school refurbishment
and basic welding workshop
programmes in Garraf.
Two schools were refurbished in
October and November 2011.
A basic welding workshop
programme was conducted. Two
batches graduated in October and
December. It is hoped that such
skill-based initiatives will be able to
provide a degree of independence
to the participants when seeking
employment opportunities.
The bi-monthly health care services
involved visits to Garraf villages
to offer basic health care and
check-ups to those who could
not afford to visit local clinics due
to high travelling costs. PCIHBV
also set up a mini clinic near
village areas where a staff doctor
examined the villagers. More than
600 people, primarily women and
children were treated for a range of
ailments. In addition to dispensing
basic medical care and treatment,
PCIHBV personnel also conducted
programmes to educate the local
communities about Health, Safety
and Environment (HSE) issues.

PETRONAS ANNUAL REPORT PE 2011100
MAINEVENTS
CORPORATE
3 May 2011 Mercedes-Benz announced an extension of its motorsports partnership
with PETRONAS from Formula One to the German Touring Car Masters
(DTM) series. The partnership between PETRONAS and Mercedes-Benz
discovers and nurtures young talents in Formula 3 to the senior categories
of DTM and Formula One.
5 April 2011
PETRONAS’ partnership with
Mercedes GP PETRONAS Formula
One Team reached another
significant milestone with the
supply of its Fluid Technology
Solutions™ package. PETRONAS
Fluid Technology Solutions™,
19 June 2011 PETRONAS supported the Langkawi International
Dialogue session with the aim of strengthening ties and
building rapport with key officials from various participating
nations. PETRONAS has been supporting the sessions
since 1996.
29 June 2011PETRONAS
inked a three-
year partnership
with Yayasan
Sabah,
contributing RM6
million for the
conservation of
Sabah’s Imbak
Canyon, which
is among the
last remaining frontiers of pristine and natural equatorial
rainforests in the region.
19 July 2011PETRONAS improved its ranking to 86th from 107th in
FORTUNE Magazine’s annual ranking of the world’s 500
largest companies by revenue. PETRONAS also improved
its ranking to 11th from 25th place in the FORTUNE’s list of
the world’s most profitable companies.
5 August 2011
PETRONAS signed separate Memorandums of
Understanding with four major oil and gas players to
collaborate in enhancing the industry’s local workforce
competency through a variety of capability development
programmes and education activities.
which includes fuel, engine oils,
hydraulic and gear oils as well as
transmission fluids, will be supplied
to the team through PETRONAS’
subsidiary, PETRONAS Lubricants
International (PLI).

reimagining energyPETRONAS ANNUAL REPORT PE 2011 101
9 September 2011PETRONAS celebrated its 20th year in Vietnam.
PETRONAS Carigali Vietnam Limited organised
various activities involving staff and the community to
commemorate the historic milestone.
27 September 2011
PETRONAS presented all proceeds from performances
by the Asian Youth Orchestra (AYO) held at Dewan
Filharmonik PETRONAS (DFP) in aid of Yayasan Jantung
Malaysia (The Heart Foundation of Malaysia).
20 October 2011Team PETRONAS
unveiled the Moriwaki
Moto2 bike that will be
used by local riders,
Mohd Zamri Baba and
Hafizh Syahrin Abdullah,
in the Malaysian
Motorcycle Grand Prix
(MotoGP).
9 November 2011PETRONAS and the Department of Occupational Safety and Health
(DOSH) signed a Memorandum of Understanding on Risk-Based
Inspection to facilitate the introduction of an online approval system to
issue certificates of fitness of DOSH-registered equipment at PETRONAS
plants.
10 November 2011The PETRONAS Leadership Centre (PLC), formerly known as PERMATA,
was formally unveiled by Datuk Anuar Ahmad, Executive Vice President of
Gas and Power business. The event marked PLC’s transformation from
being a key learning provider for the PETRONAS Group to a Leadership
Centre offering learning solutions and consultancy services to both
PETRONAS and industry players in Malaysia and abroad.

PETRONAS ANNUAL REPORT PE 2011102
16 January 2011
11 November 2011PETRONAS signed an agreement with Mitsubishi
Corporation marking its maiden solar project. Its Solar
Photovoltaic Demonstration is a pilot project that will test
different solar technologies and provide data on related
performances in the context of Malaysia’s climate. The
project serves as a viable catalyst to explore further
opportunities in renewable energy that can be applied in
PETRONAS’ existing core businesses.
15 November 2011PETRONAS, in support of a national Humanitarian Relief
Mission, sponsored 10 in-land trucks and extended
logistical assistance to transport aid for the victims of
Thailand’s worst flooding in 50 years.
3 December 2011PETRONAS was awarded a Gold Medal at the European
Salon of Inventions and International Innovation, Scientific
Research and New Technologies MEDINNOVA 2011
Awards for its Aqua™ MTM, a non-intrusive subsea
pipeline inspection technology. The technology is owned
by PETRONAS and jointly developed with Transkor-K. The
Aqua™ MTM is a tool that evaluates defects in pipelines
based on relative changes of local stress levels.
12 December 2011PETRONAS Technology Ventures Sdn Bhd (PTVSB), the
technology commercialisation arm of PETRONAS, and
Innovative Oil fields Solutions Sdn Bhd (IOSSB), signed an
agreement for the commercialisation of PipeAssure™. It is
a system that allows operations to continue while pipeline
repair work is carried out. This enables repairs to be
performed efficiently and in a cost effective manner while
avoiding lengthy pipeline shutdowns.
EXPLORATION & PRODUCTION
PETRONAS signed an Unitisation
Agreement with the Malaysia–Thailand
Joint Development Authority (MTJDA)
for the gas fields straddling across
Block PM301 in the northeast coast of
Peninsular Malaysia and for Block A-18
on the MTJDA. The Agreement augurs
well with PETRONAS’ efforts towards
ensuring the sustainability and security of
national gas production and supply.
Garraf Base Camp was
completed and has
accommodated staff since
January 2011, to support
Iraq development work.
21 April 2011
22 May 2011PETRONAS’ Tangga Barat Cluster (offshore Peninsular Malaysia) Phase 1
Project achieved first gas production from the Laho field to supplement the
gas supply for Peninsular Malaysia.
10 June 2011PETRONAS Carigali Iraq Holding BV in partnership with Japan Petroleum
Exploration Co Ltd and Iraq’s State-owned North Oil Company commenced
their First Commercial Production Drilling Campaign after spudding the first
appraisal well in the Garraf Field.
29 June 2011PETRONAS and PetroVietnam announced the successful discovery of
basement oil offshore Vietnam from the Diamond-4X exploration well located
in Blocks 01 & 02.

reimagining energyPETRONAS ANNUAL REPORT PE 2011 103
20 July 2011PETRONAS Carigali Sdn Bhd (PCSB) and Cameron Solutions Inc. developed
a state-of-the-art CO2 separation technology, the PN-1. The multi-fibre
membrane technology significantly reduces the total deck footprint and weight
of the membrane skids used offshore which will translate into lower costs.
16 August 2011PETRONAS
signed its second
Risk Service
Contract (RSC)
for the Balai
Cluster Small
Field with ROC
Oil Malaysia
(Holdings) Sdn
Bhd, Dialog D&P Sdn Bhd and PCSB as the service providers. The RSC will
see the development and production of small fields located offshore Sarawak
for oil and gas over a contract period of 15 years.
13 September 2011PETRONAS Carigali Brunei Ltd successfully spudded its first deepwater
well, Tualang North-1, just nine months after signing the Production Sharing
Agreement. The well is the first spudded from two back-to-back drilling
campaigns held in 2011.
18 September 2011PCSB made a significant oil discovery offshore Sabah at its Wakid-1 well
within Block 2G-2J, located about 100km northwest of Kota Kinabalu.
30 September 2011The Bekok-C Mobile Offshore Production Unit delivered its first export of sales
gas to the Onshore Gas Terminal and oil to the Terengganu Crude Oil Terminal.
27 October 2011PETRONAS Carigali Mauritania signed a new Exploration
Production Sharing Contract (PSC C-10) and secured
extensions for its existing PSC A and PSC B.
10 November 2011
PETRONAS signed a Heads of Agreement (HOA) with
Shell plc for two, 30-year Production Sharing Contracts for
Enhanced Oil Recovery (EOR) projects offshore Sarawak
and Sabah in East Malaysia. The project is expected to
see several key benefits of national importance, including
building local capabilities in a niche technology area, as
well as increasing the average recovery factor in the Baram
Delta and North Sabah fields from around 36% to 50%.
17 December 2011PETRONAS Carigali Vietnam Ltd achieved first gas from its
4P well on the Ruby-B platform. The project also clocked
250,000 man-hours without Lost Time Injury Frequency.
29 December 2011PCSB achieved commercial oil production for its Sepat Oil
Development Project in a record breaking 12 months and
nine days. The project set a new benchmark in meeting
the aggressive schedule, tight cost and high quality
standards. This was a joint effort with Petrofac Engineering
& Construction (E&C) as the Engineering, Procurement,
Construction, Installation and Commissioning Contractor.
The project also achieved two million man-hours with zero
Lost Time Injury Frequency.
12 July 2011Prime Minister Yang Amat Berhormat
Dato’ Sri Mohd Najib Tun Hj Abdul Razak
and Turkmenistan President His Excellency
Mr Gurbanguly Berdimuhamedov
jointly launched PETRONAS’ Kiyanly
Gas Treatment Plant and Onshore Gas
Terminal. This marked a high point in
the history of bilateral relations between
Malaysia and Turkmenistan.

PETRONAS ANNUAL REPORT PE 2011104
28 October 2011
PETRONAS LNG Sdn Bhd was incorporated on 1
September 2011, with focus on global LNG marketing
and trading functions. It will enable optimisation of the
Company’s LNG portfolio across the value chain and
enhance the PETRONAS brand.
11 November 2011 PETRONAS established PETRONAS Power Sdn Bhd
(PPSB) a wholly-owned subsidiary of PICL to serve as
a holding company for all PETRONAS’ investments in
power. PETRONAS through PPSB, is geared to establish
itself as a player in the domestic and international power
industry.
13 December 2011 PETRONAS LNG Ltd (PLL) celebrated its 200th traded
cargo in an event attended by its management team
and members of the LNG fraternity. The event also
commemorated PLL’s successful trading of the second
100 cargoes in three years, half the time it took to achieve
its first 100 cargoes.
15 December 2011PETRONAS completed the sale of the oil production
business of its UK-based wholly-owned subsidiary, Star
Energy Group Limited to IGas Energy plc. PETRONAS
will continue to focus on its energy trading portfolio via
its Humbly Grove Gas Storage Facility. PETRONAS also
entered into a long-term gas supply agreement with IGas
Energy through its London-based subsidiary PETRONAS
Energy Trading Limited (PETL) to purchase natural
gas produced by IGas Energy. The deal is in line with
PETRONAS’ strategy to focus on growing its European
energy portfolio through market positioning and strategic
trading.
A delegation comprising
representatives from the
GLNG project team and
the Port Curtis Coral Coast
(PCCC) Native Title Claimant
Group visited the PETRONAS
Twin Towers in Kuala Lumpur
and operation sites in Bintulu.
4 October 2011
16 May 2011PETRONAS acquired 4Gas BV’s 20% stake in the Dragon LNG Terminal in
Wales. With the acquisition, PETRONAS’ equity ownership stands at 50%
and is aligned with its capacity off-take at the terminal.
GAS & POWER
Australian Prime Minister Julia Gillard
and Queensland Premier Anna Bligh
officially launched the construction of
the GLNG Project reflecting strong
endorsement by the country’s top
leadership. The groundbreaking
ceremony was held at the project site
on Curtis Island, Queensland.
2 June 2011PETRONAS, through its wholly-owned subsidiary PETRONAS International
Corporation Ltd (PICL), reached an agreement to form a strategic partnership
with Canada-based Progress Energy Resources Corporation to develop the
Altares, Lily and Kahta shale gas assets in northeastern British Columbia.
The proposed acquisition will mark PETRONAS’ maiden entry into Canada
and will allow for accelerated upstream growth for potential future Liquefied
Natural Gas (LNG) exports.
27 May 2011

reimagining energyPETRONAS ANNUAL REPORT PE 2011 105
23 December 2011 PETRONAS Gas Berhad (PGB) announced the publication
of its PGB Network Code, a code of conduct which
defines a standard of behaviour and disclosure with
respect to Third Party Access of the Peninsular Gas
Utilisation (PGU) system. The Network Code signifies
another proactive measure by PGB to capitalise on the
open access concept for gas transmission services,
gearing for the liberalisation of the Malaysian gas market.
27 December 2011PETRONAS, through its wholly-owned subsidiary, PICL
signed a Shareholders’ Agreement (SHA) and a Sale
and Purchase Agreement (SPA) with GMR Infrastructure
(Singapore) Pte Ltd and GMR Infrastructure Ltd
(subsidiaries of India’s GMR Group) for a 30% stake in
GMR Energy Singapore Pte Ltd (GESPL). GMR Supply
Singapore Pte Ltd, a wholly-owned subsidiary of GESPL,
holds an electricity retail license in Singapore, which will
carry out its electricity retail business in the Republic.
30 December 2011
PETRONAS’ wholly-owned subsidiary, PPSB, secured
10.02MW Feed-in Tariff (FiT) quota from the Sustainable
Energy Development Authority (SEDA). The allocated FiT
quota will allow the development of PETRONAS’ first Solar
Independent Power Producer project, which is expected
to be completed by the first quarter of 2014.
DOWNSTREAM
21 April 2011PETRONAS and Malaysian
automotive manufacturer
PROTON launched an
automatic transmission
fluid (ATF), PETRONAS
ATF-XP3, at the Putrajaya
International Convention
Centre. Jointly developed
by PETRONAS and
PROTON, PETRONAS
ATF-XP3 was uniquely
formulated and extensively
field-tested for PROTON cars. It is the only automatic transmission fluid
approved in accordance with PROTON’s PES-1133 standard.
13 May 2011Malaysian Prime
Minister, Yang Amat
Berhormat Dato’ Sri
Mohd Najib Tun Hj Abdul
Razak, announced
PETRONAS’ Refinery And
Petrochemical Integrated
Development (RAPID)
complex located in
Southern Johor.
16 May 2011PETRONAS’ Syntium Workshop was
selected as a pilot site for the National
Automotive Workshop Modernisation
(ATOM) project led by the Ministry of
Domestic Trade, Cooperatives and
Consumerism (KPDNKK). The initiative
is part of the Malaysian Government’s
Economic Transformation Programme
(ETP) for the implementation of the National Key Economic Areas (NKEA)
projects for the wholesale and retailing sectors.
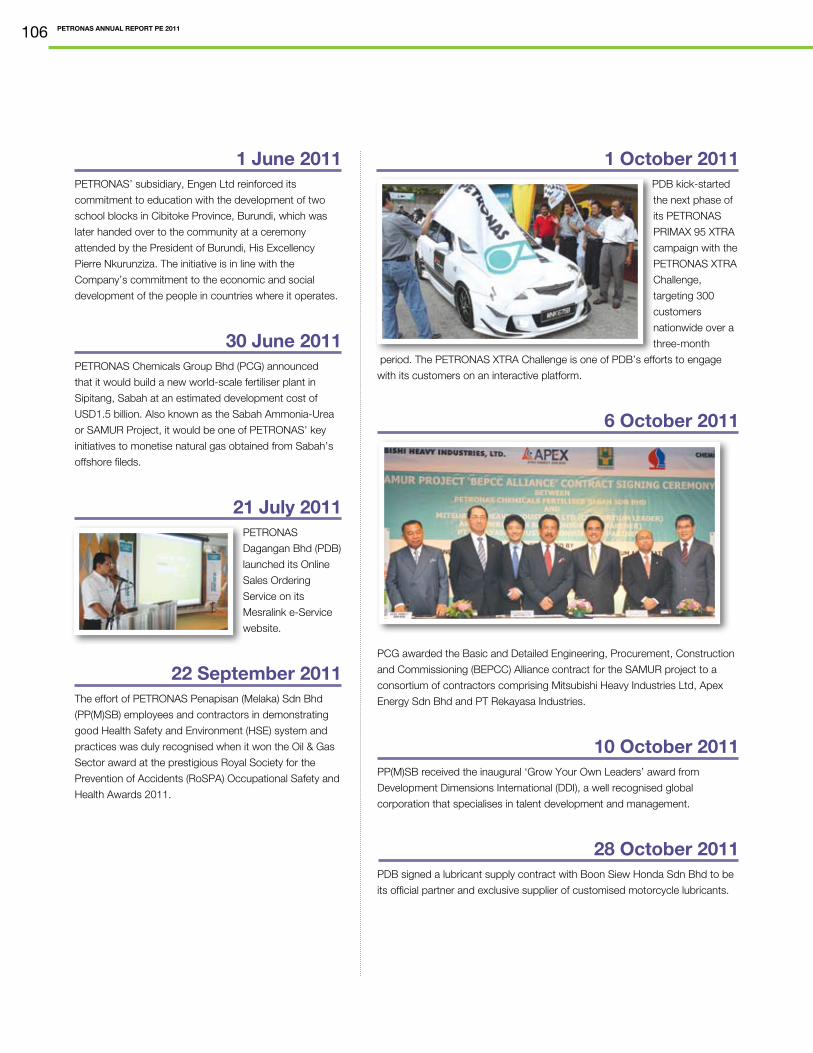
PETRONAS ANNUAL REPORT PE 2011106
1 October 2011 PDB kick-started
the next phase of
its PETRONAS
PRIMAX 95 XTRA
campaign with the
PETRONAS XTRA
Challenge,
targeting 300
customers
nationwide over a
three-month
period. The PETRONAS XTRA Challenge is one of PDB’s efforts to engage
with its customers on an interactive platform.
6 October 2011
PCG awarded the Basic and Detailed Engineering, Procurement, Construction
and Commissioning (BEPCC) Alliance contract for the SAMUR project to a
consortium of contractors comprising Mitsubishi Heavy Industries Ltd, Apex
Energy Sdn Bhd and PT Rekayasa Industries.
10 October 2011PP(M)SB received the inaugural ‘Grow Your Own Leaders’ award from
Development Dimensions International (DDI), a well recognised global
corporation that specialises in talent development and management.
28 October 2011PDB signed a lubricant supply contract with Boon Siew Honda Sdn Bhd to be
its official partner and exclusive supplier of customised motorcycle lubricants.
1 June 2011PETRONAS’ subsidiary, Engen Ltd reinforced its
commitment to education with the development of two
school blocks in Cibitoke Province, Burundi, which was
later handed over to the community at a ceremony
attended by the President of Burundi, His Excellency
Pierre Nkurunziza. The initiative is in line with the
Company’s commitment to the economic and social
development of the people in countries where it operates.
30 June 2011PETRONAS Chemicals Group Bhd (PCG) announced
that it would build a new world-scale fertiliser plant in
Sipitang, Sabah at an estimated development cost of
USD1.5 billion. Also known as the Sabah Ammonia-Urea
or SAMUR Project, it would be one of PETRONAS’ key
initiatives to monetise natural gas obtained from Sabah’s
offshore fileds.
21 July 2011PETRONAS
Dagangan Bhd (PDB)
launched its Online
Sales Ordering
Service on its
Mesralink e-Service
website.
22 September 2011The effort of PETRONAS Penapisan (Melaka) Sdn Bhd
(PP(M)SB) employees and contractors in demonstrating
good Health Safety and Environment (HSE) system and
practices was duly recognised when it won the Oil & Gas
Sector award at the prestigious Royal Society for the
Prevention of Accidents (RoSPA) Occupational Safety and
Health Awards 2011.

reimagining energyPETRONAS ANNUAL REPORT PE 2011 107
25 April 2011 MISC Bhd (MISC) signed a
Contract of Affreightment
(COA) Renewal with
PETRONAS Base Oil (M)
Sdn Bhd (PBOM), which
sees MISC’s Melati Class
vessels continue to ship
base oil from PBOM’s
refinery in Sungai Udang,
Melaka to Europe for
another year.
17 May 2011 MISC’s LNG Carrier Seri
Anggun commenced
her maiden loading for
the North West Shelf
Ventures, Australia at
Withnell Bay Terminal,
signifying the start of
a four-year contract
with International Gas
Transportation Company
Limited. This is MISC’s maiden entry into Australia’s LNG market, with
Australia set to potentially supply 127.2 mtpa of LNG post 2015.
31 May 2011
Malaysia Marine and Heavy Engineering Holdings Bhd (MHB) through its
subsidiary, Malaysia Marine and Heavy Engineering Sdn Bhd (MMHE),
signed a contract with MISC Bhd for the Repair, Life Extension and
Conversion of MT Onozo into a Floating Production, Storage and Offloading
Facility (FPSO) for the Cendor Phase 2 development in Malaysia.
20 November 2011
As part of celebrating the success of its PRIMAX line
of fuels, PDB unveiled Malaysia’s First Mobile Fuel
Dispenser at the Sepang International Circuit. The mobile
fuel dispenser will enable cars within the circuit to fill up with
PETRONAS high-powered PRIMAX fuels at the track.
7 December 2011
PETRONAS’ subsidiary Engen Ltd toasted the
phenomenal success of its Klevakids Paraffin Safety
Campaign. Three years after its inception, the campaign
has reached more than 78,000 learners (190 schools) in
seven provinces across South Africa and neighbouring
Lesotho.
18 December 2011PETRONAS Energy Philippines Inc (PEPI) lent their
support in the relief operation for those affected by
Typhoon Washi. PEPI contributed food and clothing
at MSU IIT Gymnasium in Tibanga, a large evacuation
centre, and in San Lorenzo Parish Church in Hinaplanon.
MARITIME & LOGISTICS

PETRONAS ANNUAL REPORT PE 2011108
2 June 2011
AET Tanker Holdings Sdn Bhd (AET) received the 2011
Devlin Safety Awards for 33 ships and four workboats
in its fleet at the annual safety awards reception held in
New Orleans, Louisiana – an industry recognition of AET’s
commitment to safety. To be eligible for the safety award, a
vessel must achieve at least two consecutive years without
Lost Time Injury Frequency (LTIF).
16 June 2011
MMHE was awarded a conversion project for the Repair,
Life Extension and Conversion of MISC’s SS Tenaga Satu,
a Liquefied Natural Gas (LNG) vessel, into a floating storage
unit (FSU) facility, FSU Lekas. Upon completion, FSU Lekas
will be moored at the Melaka LNG Regasification Terminal.
24 June 2011
AET signed a 20-year contract with Marine Well
Containment Company (MWCC) to supply two modular
capture vessels (MCVs) for hydrocarbon capture services
in the event of a deepwater well control incident in the
US Gulf of Mexico. The MCVs will be converted from
two newbuild Aframax tankers constructed for AET at the
Tsuneishi Tadotsu shipyard in Japan. AET will manage
and implement all marine aspects of the tanker conversion
work.
30 June 2011
The Malaysian
Maritime Academy
(ALAM) signed a
Memorandum of
Cooperation with
the Federal Land
Development
Authority (FELDA)
to promote
collaboration of
common interests
in maritime education. This includes collaboration to train young school
leavers from FELDA under ALAM’s sponsorship programme for cadetship
and able seafarers.
6 July 2011
MHB entered into a Joint Venture Agreement with Technip Geoproduction
(M) Sdn Bhd to establish a jointly controlled entity, Technip MHB Hull
Engineering Sdn Bhd. The company will perform hull engineering services on
floating structures for the oil and gas industry.
8 August 2011
In collaboration with the Royal Malaysian Navy (RMN) and the National
Security Council, MISC Bhd launched Bunga Mas Enam as a RMN Auxiliary
Vessel. The 699 TEU containership is the second Malaysian-registered
merchant ship to be modified as an Auxiliary Vessel for Tentera Laut Diraja
Malaysia (TLDM) to escort and protect MISC’s vessels plying the Gulf of
Aden and its surrounding waters. The modification work for Bunga Mas
Enam was carried out by MMHE at their shipyard in Pasir Gudang, Johor.
9 August 2011
MISC and MHB launched ‘Program Sentuhan Harapan PETRONAS’ in
Johor, jointly sponsoring 200 underprivileged families in the areas of Kukup
and Pasir Gudang in Johor. The programme is a community outreach
initiative by PETRONAS in collaboration with MyKasih Foundation. Under the
two year programme, MISC and MHB will contribute a total of RM500,000
towards improving the lives of the 200 families.
25 August 2011
MHB announced that MMHE had entered into a definitive sale and purchase
agreement for the proposed acquisition of the Sime Darby Engineering Sdn
Bhd’s yard in Pasir Gudang, Johor.
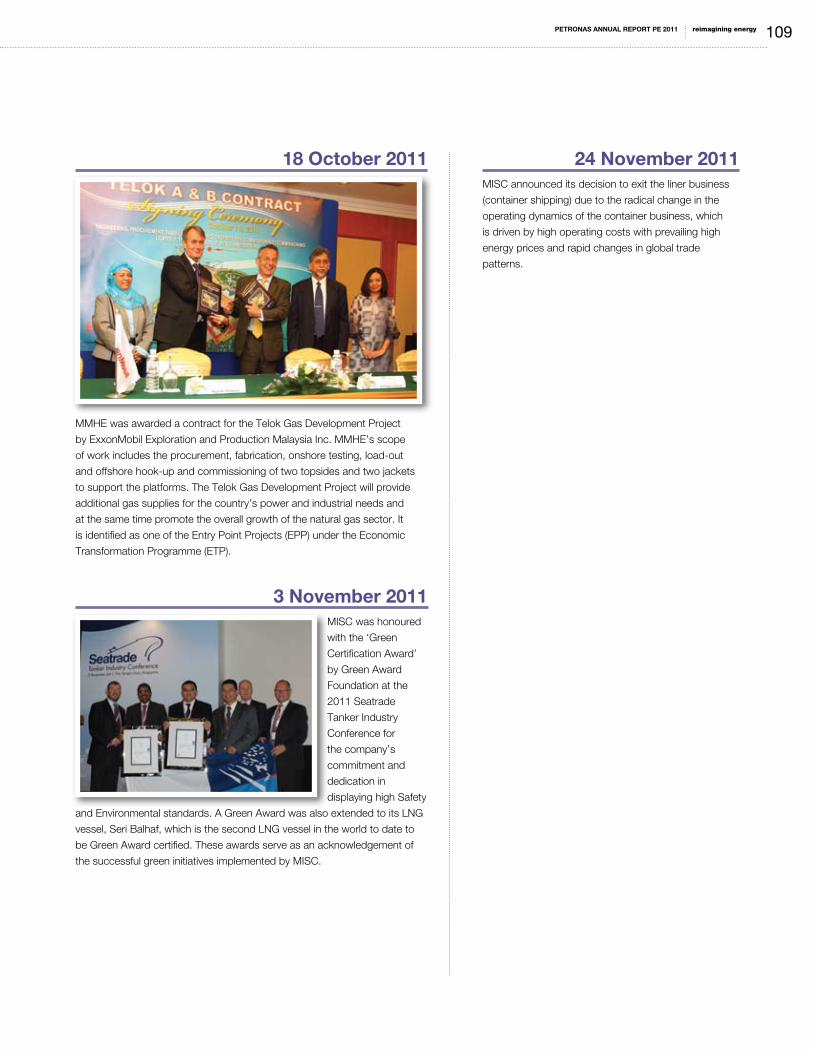
reimagining energyPETRONAS ANNUAL REPORT PE 2011 109
18 October 2011
MMHE was awarded a contract for the Telok Gas Development Project
by ExxonMobil Exploration and Production Malaysia Inc. MMHE’s scope
of work includes the procurement, fabrication, onshore testing, load-out
and offshore hook-up and commissioning of two topsides and two jackets
to support the platforms. The Telok Gas Development Project will provide
additional gas supplies for the country’s power and industrial needs and
at the same time promote the overall growth of the natural gas sector. It
is identified as one of the Entry Point Projects (EPP) under the Economic
Transformation Programme (ETP).
3 November 2011
MISC was honoured
with the ‘Green
Certification Award’
by Green Award
Foundation at the
2011 Seatrade
Tanker Industry
Conference for
the company’s
commitment and
dedication in
displaying high Safety
and Environmental standards. A Green Award was also extended to its LNG
vessel, Seri Balhaf, which is the second LNG vessel in the world to date to
be Green Award certified. These awards serve as an acknowledgement of
the successful green initiatives implemented by MISC.
24 November 2011
MISC announced its decision to exit the liner business
(container shipping) due to the radical change in the
operating dynamics of the container business, which
is driven by high operating costs with prevailing high
energy prices and rapid changes in global trade
patterns.

PETRONAS ANNUAL REPORT PE 2011110
24 August 2011Over 40 participants of the PETRONAS Graduates Employability
Enhancement Scheme shared a special day with the residents of Pusat
Jagaan Nur Hasanah and Rumah Rose in Beranang and Rinching in
Selangor respectively. This community project was jointly organised with
Badan Kebajikan dan Riadah PERMATA (BAKRI).
8 September 2011In line with environmental conservation efforts, PC Myanmar (Hong Kong)
Ltd (PCML) organised two tree planting initiatives that saw PCML staff and
their family members plant over 1,200 trees. The first effort took place near
Hlaw Gar Nature Reserve and Water Reservoir in Yangon.
1 November 2011
PETRONAS extended its Sentuhan Harapan community outreach
programme to Sabah and Melaka to provide basic assistance to the
country’s identified hardcore poor families. The programme was launched
in July 2010 by Prime Minister Yang Amat Berhormat Dato’ Sri Mohd Najib
Tun Hj Abdul Razak in Miri, Sarawak as part of PETRONAS’ Corporate
Social Responsibility (CSR) efforts to contribute to the Government’s poverty
eradication efforts in the country.
CORPORATE SOCIAL RESPONSIBILITY
3 November 2011PETRONAS East Coast Regional Office, in collaboration
with Group HRM and Group Corporate Affairs Division
organised the first Majlis Sekalung Budi 2011 for the East
Coast region. The annual event is aimed at recognising
long-serving and loyal staff of the Company.
19 November 2011
PETRONAS’ Legal Division participated in the University
of Malaya Law Career Convention 2011, drawing throngs
of people to its booth at the Law Faculty in Kuala Lumpur.
The PETRONAS business lounge attracted an estimated
400 people including visitors, law students and graduates
who did not miss the opportunity to converse with 12 of
our PETRONAS in-house lawyers.
21 November 2011Upholding the spirit of giving and sharing, The
Association of Wives and Female Staff of PETRONAS
(PETRONITA), participated in two CSR initiatives to assist
the underprivileged members of society. These efforts
complemented PETRONAS’ various community efforts
aimed at giving back to societies in areas where its
operates.

reimagining energyPETRONAS ANNUAL REPORT PE 2011 111
24 November 2011
More than 20 PETRONAS staff volunteers were presented with certificates
of appreciation in recognition of their commitment, dedication, volunteerism
and patriotic spirit at the 54th Merdeka Day Parade this year.
27 December 2011PETRONAS hosted a pre-departure dinner for 25 Sudanese participants of
the PETRONAS-Khartoum Vocational Training Academy Training-of-Trainers
Programme who had embarked on a month-long skills enhancement course
in Malaysia. The programme is an extension of PETRONAS’ long-standing
collaboration with the State Government of Khartoum’s Supreme Council of
Vocational Training on skills training of Sudanese youths.

PETRONAS ANNUAL REPORT PE 2011112
GLOSSARYIndustry terms as generally understood
AdditivesChemicals added in small quantities to fuel or lubricants to control engine deposits and
improve lubricating performance.
BarrelA standard unit of measurement for oil production. One barrel contains 159 litres of oil.
Barrels of oil equivalent (boe)A unit of measurement to quantify the amount of crude oil, condensates and natural gas. Natural gas volumes are converted to barrels on the basis of energy content.
Base oilAn oil to which other oils or additives are added to produce a lubricant. This includes Group III base oil that has been subjected to the highest level of refining of the base oil groups, offering very high viscosity index to produce premium quality lubricants.
BasinA low-lying area beneath the Earth’s surface filled with thick layers of sediment, often a source of valuable hydrocarbons.
Brent priceThe benchmark crude oil price in Europe, as traded on the International Petroleum Exchange in London. Brent crude refers to a particular grade of crude oil, which is slightly heavier than WTI crude. See WTI price.
CO2
Carbon dioxide, one of the primary greenhouse gases.
Coal Ced MethaneA form of natural gas extracted from coal beds, as opposed to the conventional natural gas found in reservoirs.
CondensatesLiquid hydrocarbons produced with natural gas, separated by cooling and other means.
Deadweight tonne (dwt)A ship’s maximum carrying capacity in tonnes of cargo, including passengers, crew,
stores, ballast and fuel.
DeepwaterIn Malaysia offshore exploration, deepwater is demarcated at water depths exceeding 200 m. Unique methods are required to produce the oil and gas from the ocean bed at such depths. See Floating Production Unit.
DevelopmentDrilling, construction and related activities following discovery that are necessary to begin production and transportation of crude oil and natural gas.
Dividend Payout RatioPercentage of net profit attributable to PETRONAS shareholders paid as dividend in the period.
DownstreamAll segments of a value chain that add value to the crude oil and natural gas produced, for example, oil refining, gas processing, gas liquefaction, petrochemical manufacturing, marketing of petroleum and petrochemical products, storage and transportation.
Earnings before Interest, Tax, Depreciation and Amortisation (EBITDA)Profit before taxation with the
addition of amounts previously deducted for depreciation, amortisation and impairment loss on property, plant and equipment and intangible assets and financing costs and the exclusion of interest income.
Energy Loss Management (ELM)An initiative to improve energy efficiency and reduce greenhouse gas (GHG) emissions.
Enhanced Oil Recovery (EOR)Any method(s) applied to productive reservoirs in order to increase production rates and to improve the overall recovery factor.
ExplorationThe search for crude oil and/or natural gas by geological and topographical studies, geophysical and seismic surveys, and drilling of wells.
Feed-in-Tariff (FiT)Malaysia’s FiT system is a policy mechanism designed to accelerate investment in renewable energy
technologies. It requires Distribution Licensees (DLs) to buy electricity produced from renewable resources from Feed-in Approval Holders (FIAHs) and sets the rate. The DLs will pay for renewable energy supplied to the electricity grid for a specific duration. The goal of FiT is to offer cost-based compensation to renewable energy producers, providing the price certainty and long-term contracts that help finance renewable energy investments.
FieldA geographical area overlying a hydrocarbon reservoir.

reimagining energyPETRONAS ANNUAL REPORT PE 2011 113
Floating Liquefied Natural Gas (FLNG) Either a ship or barge that can sail or be towed to offshore gas fields, extract gas, freeze it to Liquefied Natural Gas (LNG) and offload the LNG to tankers for shipping.
Floating Production Unit (FPU)Floating structures of various designs used in offshore production. These ‘floaters’ replace traditional fixed platforms and they are moored to the ocean bed. FPU is more commonly used in deepwater. See Deepwater.
Floating Production, Storage and Offloading (FPSO)A converted or custom-built ship-like structure, with modular facilities to process oil and gas and for temporary storage of the oil prior to transfer to tankers.
Floating, Storage and Offloading (FSO)A converted or custom-built ship-like structure for temporary storage of the oil prior to transfer to tankers.
Floating Storage Unit (FSU)A converted or custom-built ship-like structure to receive and store LNG.
Gas ProcessingAn activity to turn streams of natural gas into commercial products, in addition to treating
gas deposits.
Gas To Liquids (GTL)A refinery process to convert natural gas or other gaseous hydrocarbons into longer chain hydrocarbons, such as gasoline or diesel fuel. It is used predominantly in the creation of high-quality transportation fuels.
Gearing ratioTotal borrowing expressed as a percentage of total borrowing plus equity attributable to shareholders of PETRONAS.
Greenhouse gases (GHG)Gases that trap heat in the Earth’s atmosphere, e.g. carbon dioxide, methane, nitrous oxide, hydrofluorocarbons, perfluorocarbons and sulphur hexafluoride.
Heavy Oil/BitumenUnlike conventional crude oil that can be pumped without being heated or diluted, heavy oil is
oil that cannot be extracted in its natural state via a well and conventional production methods. This definition is also applicable to bitumen.
High Pressure High Temperature wellWell with a surface shut-in pressure greater than 10,000 psi and a bottomhole temperature greater than 150ºC.
Heads of Agreement (HOA)A non-binding document outlining the main issues relevant to a tentative partnership agreement. HOA represents the first step on the path to a full legally binding agreement or contract, and serves as a guideline for the roles and responsibilities of the parties involved in a potential partnership before any binding documents are drawn up.
Integrated oil and gas companyA company that engages in all aspects of the oil and gas industry - exploring for and producing crude oil and
natural gas (upstream); refining, marketing and transporting crude oil, natural gas and refined products (downstream); as well as manufacturing and distributing petrochemicals.
Ionic liquidsLiquids that comprise entirely of positive and negatively charged ions. Ionic liquids are being explored for an array of applications, e.g. as environmentally friendly substitutes for volatile organic compounds in the oil and gas industry.
Improved Oil Recovery (IOR)Improved Oil Recovery that is commonly used to describe any process, or combination of processes, that may be applied to economically increase the cumulative volume of oil that is ultimately recovered from the reservoir at an accelerated rate. IOR may include chemical, mechanical, physical, or procedural processes.
Improved Gas Recovery (IGR)Refers to recovery of gas by injection of fluids beyond the normal recovery through conventional methods. In recent times, carbon dioxide is used as a lubricant fluid to recover additional gas from the reservoir and thereby provides an avenue for storing the captured carbon dioxide.
Joint ventureA partnership between two or more companies to undertake a specific project and share the resulting
profit and loss.
Liquefied Natural Gas (LNG)Natural gas that is liquefied under extremely cold temperatures of about minus 260 degrees
Fahrenheit to facilitate storage or transportation in specially designed vessels.
Liquefied Petroleum Gas (LPG)Light gases, such as butane and propane, that can be maintained as liquids while under pressure.

PETRONAS ANNUAL REPORT PE 2011114
Lost Time Injury (LTI)This is defined as an occurrence that resulted in a fatality, permanent disability or time lost from work including days off, off shift, weekends or public holidays.
Lost Time Injury Frequency (LTIF)This refers to the total LTI cases per million exposure hours worked during the period.
LubricantA substance to reduce friction and wear among moving surfaces, resulting in improved efficiency. It contains about 90% base oil and about 10% additives.
MmmBtuMillion metric British thermal unit. It measures the energy content in fuel and is used in the power, steam generation, heating and air conditioning industries.
mmscfdMillion metric standard cubic feet per day. It is a unit of measurement for natural gas. Liquefied Petroleum Gas (LPG), compressed natural gas and other gases that extracted, processed or transported in high quantities.
Mobile offshore Production Unit (MOPU)Self installing and re-usable production jack-ups.
mtpaMillion tonnes per annum. A standard measurement of output for the year.
Natural gasA clean burning, odourless, colourless, highly compressible mixture of hydrocarbons found
occurring naturally in gaseous form. Natural gas is made up of methane but can also include ethane, propane and butane.
NOPATNet operating profit after tax is derived from net profit after tax excluding financing cost, share of profits of associates and jointly controlled entities and other non-operating income and expenses.
NaphthaUsually an intermediate product between gasoline and benzene, naphtha is a colourless and volatile petroleum distillate used as a solvent or fuel.
OEMOriginal Equipment Manufacturer. Refers to a company that acquires a
product or component, then reuses or incorporates it into a new product with its own brand name.
OlefinsAny from a class of unsaturated open-chain hydrocarbons such as ethylene, having the general formula CnH2n; an alkene with only one carbon-carbon double bond.
Operational Performance Improvement (OPI)A set of tools and methodologies that emphasise on instilling operational discipline, with the aim of improving operational excellence of PETRONAS’ producing assets.
Peninsular Gas Utilisation (PGU)The PGU system was developed to spearhead the use of natural
gas in Malaysia. The natural gas produced from offshore Terengganu is processed in six Gas Processing Plants in Kertih and are then fed into a 2,505 km pipeline system that delivers natural gas to the power, industrial, petrochemical and other sectors throughout Peninsular Malaysia and Singapore.
PetrochemicalsOrganic and inorganic compounds and mixtures derived from petroleum, used principally to manufacture chemicals, plastics and resins, synthetic fibres, detergents, adhesives and synthetic motor oils.
Production Sharing Contract (PSC)A contractual agreement between a company and a host government, whereby the company bears all exploration, development and production costs in return for an agreed-upon share of production.
Regasification Terminal (RGT)Also known as a receiving terminal, an RGT is usually a coastal plant that accepts
deliveries of LNG and processes it back into gaseous form for injection into a pipeline system.
RefiningA purification process for natural resources which includes hydrocarbons, using distillation, cooling and/or compression.
Renewable energyEnergy derived from natural sources that are replaceable.

reimagining energyPETRONAS ANNUAL REPORT PE 2011 115
ReservesHydrocarbons which are anticipated to be recovered from known accumulations of hydrocarbons.
Reservoir Any porous and permeable rock (usually sandstone or limestone/chalk and occasionally a normally impermeable rock which has been heavily fractured), thus providing interconnecting spaces through which oil/gas can flow.
ResourcesResources are defined as the total estimated quantities of petroleum at a specific date to be contained in, or that have been produced from known accumulations of hydrocarbon.
Resource Replenishment RatioFigures reported are calculated based on a formula of (Difference of Resource Base of current year and previous year + Production Volume of previous year) / (Production Volume of previous year).
Return on Average of Capital Employed (ROACE) NOPAT expressed as a percentage of average of equity attributable to shareholders of PETRONAS and long-term debt during the period.
Return On Revenue (ROR)Profit before taxation expressed as a percentage of total revenue.
Risk Service Contract (RSC)In the context of this report, RSC refers to a petroleum arrangement between PETRONAS and any other company for the appraisal, development and/or production of petroleum in a contract area on behalf of PETRONAS whereby the PA Contractors are remunerated on a set based on achieved Key Performance Indicators consisting of the agreed Cost, Schedule and Production level.
Return on Total Assets (ROTA) Profit before taxation expressed as a percentage of total assets.
Seismic dataThe collection of stratigraphic data obtained by creating shockwaves through the rock
layers. Reflection of these waves from anomalies within the rock layers are electronically recorded at surface. These recordings are then analysed to produce a stratigraphic representation of the surveyed area, which helps to deduce the structure of the underlying rock layers.
Shale GasNatural gas found in shale rock derived from underground shale deposits that are broken up by hydraulic fracturing. The process is needed to produce gas in commercial quantities as shale has low matrix permeability.
ThroughputThe amount of output produced by a system, e.g. a refinery, plant, or pipeline, in a given period of time.
Total Reportable Case (TRC) The sum of injuries resulting in fatalities, permanent total disabilities, permanent partial disabilities, lost workday cases, restricted work cases and medical treatment cases, but excluding first aid cases.
Total Reportable Case Frequency (TRCF)This refers to the number of total reportable cases per million exposure hours worked during the period.
Unconventional oil and gasOil and gas that cannot be produced or extracted using conventional methods.
UpstreamSegment of value chain pertaining to finding, developing and producing crude oil and natural gas. These include oil and gas exploration, development and production operations; also known as Exploration & Production (E&P).
WTI priceStands for West Texas Intermediate, the benchmark crude oil price in the US
measured in USD per barrel, which refers to a type of high quality light crude oil.

PETRONAS ANNUAL REPORT PE 2011116
This page has been intentionally left blank.

Financial Statements
118 Directors’ Report
123 Statement by Directors
124 Statutory Declaration
125 Consolidated Statement of Financial Position
126 Consolidated Statement of Comprehensive Income
127 Consolidated Statement of Changes in Equity
131 Consolidated Statement of Cash Flow
132 Statement of Financial Position
133 Statement of Comprehensive Income
134 Statement of Changes in Equity
135 Statement of Cash Flow
136 Notes to the Financial Statements
230 Report of the Auditors to the Members
232 Appendix I
PETRONAS ANNUAL REPORT PE 2011118
DIRECTORS’ REPORT FOR THE PERIOD ENDED31 DECEMBER 2011
The Directors have pleasure in submitting their report and the audited financial statements of the Group and of the Company for the period ended 31 December 2011.
PRINCIPAL ACTIVITIES
The principal activities of the Company in the course of the financial period remained unchanged and consist of exploitation of oil and gas through production sharing contracts, the marketing of petroleum and petroleum products and investment holding. The principal activities of significant subsidiaries, associates and jointly controlled entities are stated in note 45, note 46 and note 47 to the financial statements respectively.
RESULTS Group Company RM Mil RM Mil Profit for the period 55,574 40,201 Attributable to: Shareholders of the Company 48,863 40,201 Non-controlling interests 6,711 -
DIVIDENDS
During the financial period, the Company paid:
(i) a third tax exempt interim dividend under Section 84 of the Petroleum (Income Tax) Act, 1967 of RM60,000 per ordinary share amounting to RM6 billion in respect of the financial year ended 31 March 2011;
(ii) a tax exempt final dividend under Section 84 of the Petroleum (Income Tax) Act, 1967 of RM220,000 per ordinary share amounting to RM22 billion in respect of the financial year ended 31 March 2011; and
(iii) a first tax exempt interim dividend under Section 84 of the Petroleum (Income Tax) Act, 1967 of RM20,000 per ordinary share amounting to RM2 billion in respect of the financial period ended 31 December 2011.
The Directors propose a tax exempt final dividend under Section 84 of the Petroleum (Income Tax) Act, 1967 of RM280,000 per ordinary share amounting to RM28 billion in respect of the financial period ended 31 December 2011 for shareholders’ approval at the forthcoming Annual General Meeting.
The financial statements for the current financial period do not reflect this proposed dividend. Such dividend, if approved by the shareholders, will be accounted for in equity as an appropriation of retained profits in the financial year ending 31 December 2012.
RESERVES AND PROVISIONS
There were no material movements to and from reserves and provisions during the period other than as disclosed in the financial statements.
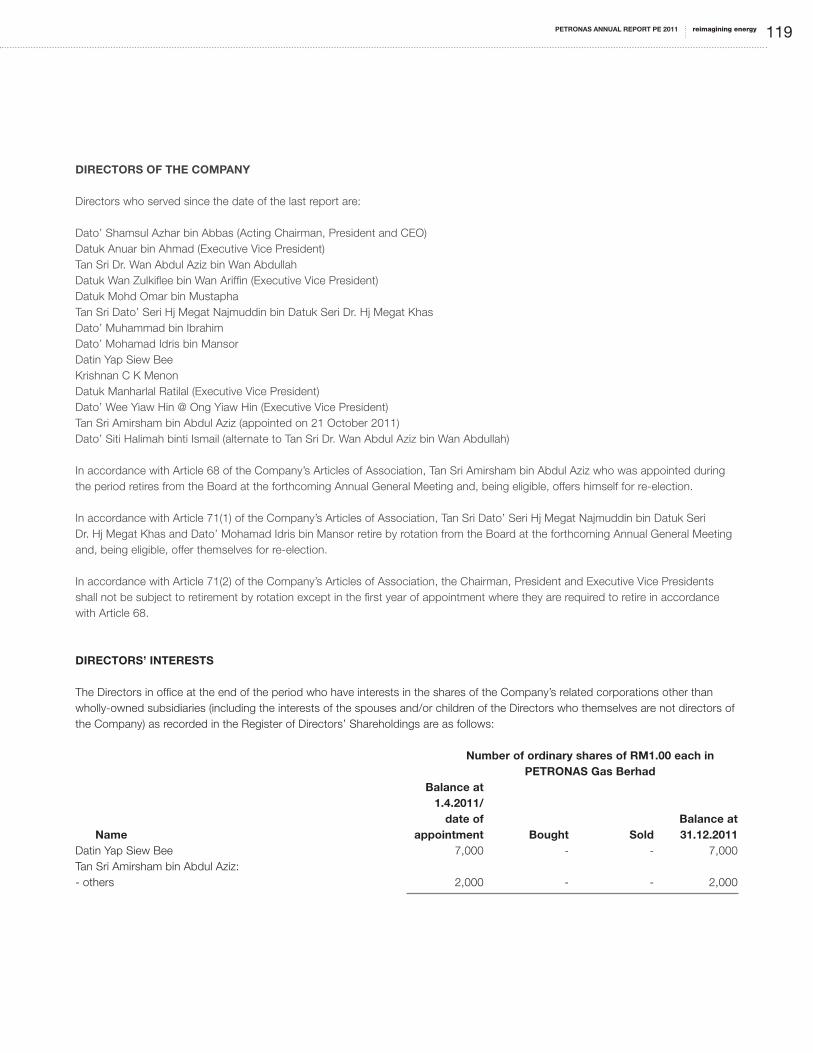
reimagining energyPETRONAS ANNUAL REPORT PE 2011 119
DIRECTORS OF THE COMPANY
Directors who served since the date of the last report are:
Dato’ Shamsul Azhar bin Abbas (Acting Chairman, President and CEO)Datuk Anuar bin Ahmad (Executive Vice President)Tan Sri Dr. Wan Abdul Aziz bin Wan Abdullah Datuk Wan Zulkiflee bin Wan Ariffin (Executive Vice President) Datuk Mohd Omar bin Mustapha Tan Sri Dato’ Seri Hj Megat Najmuddin bin Datuk Seri Dr. Hj Megat Khas Dato’ Muhammad bin Ibrahim Dato’ Mohamad Idris bin Mansor Datin Yap Siew Bee Krishnan C K Menon Datuk Manharlal Ratilal (Executive Vice President)Dato’ Wee Yiaw Hin @ Ong Yiaw Hin (Executive Vice President)Tan Sri Amirsham bin Abdul Aziz (appointed on 21 October 2011)Dato’ Siti Halimah binti Ismail (alternate to Tan Sri Dr. Wan Abdul Aziz bin Wan Abdullah) In accordance with Article 68 of the Company’s Articles of Association, Tan Sri Amirsham bin Abdul Aziz who was appointed during the period retires from the Board at the forthcoming Annual General Meeting and, being eligible, offers himself for re-election.
In accordance with Article 71(1) of the Company’s Articles of Association, Tan Sri Dato’ Seri Hj Megat Najmuddin bin Datuk Seri Dr. Hj Megat Khas and Dato’ Mohamad Idris bin Mansor retire by rotation from the Board at the forthcoming Annual General Meeting and, being eligible, offer themselves for re-election.
In accordance with Article 71(2) of the Company’s Articles of Association, the Chairman, President and Executive Vice Presidents shall not be subject to retirement by rotation except in the first year of appointment where they are required to retire in accordance with Article 68.
DIRECTORS’ INTERESTS
The Directors in office at the end of the period who have interests in the shares of the Company’s related corporations other than wholly-owned subsidiaries (including the interests of the spouses and/or children of the Directors who themselves are not directors of the Company) as recorded in the Register of Directors’ Shareholdings are as follows: Number of ordinary shares of RM1.00 each in PETRONAS Gas Berhad Balance at 1.4.2011/ date of Balance at Name appointment Bought Sold 31.12.2011Datin Yap Siew Bee 7,000 - - 7,000Tan Sri Amirsham bin Abdul Aziz: - others 2,000 - - 2,000
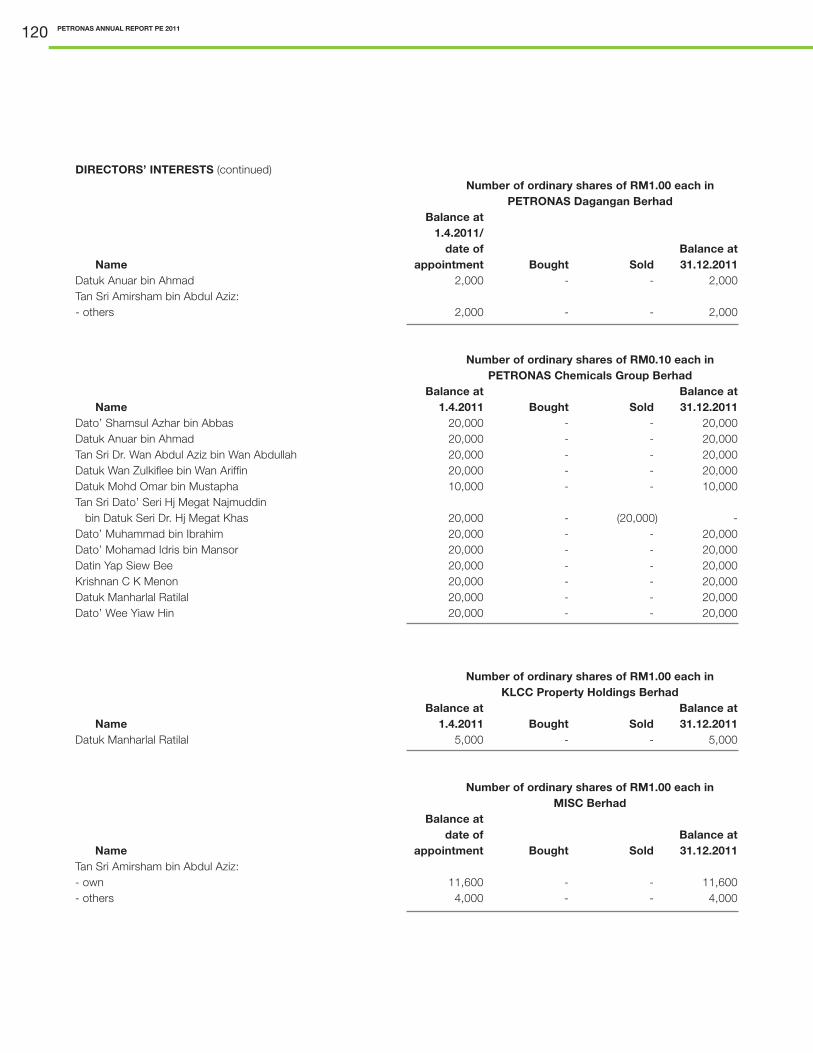
PETRONAS ANNUAL REPORT PE 2011120
DIRECTORS’ INTERESTS (continued) Number of ordinary shares of RM1.00 each in PETRONAS Dagangan Berhad Balance at 1.4.2011/ date of Balance at Name appointment Bought Sold 31.12.2011Datuk Anuar bin Ahmad 2,000 - - 2,000Tan Sri Amirsham bin Abdul Aziz: - others 2,000 - - 2,000
Number of ordinary shares of RM0.10 each in PETRONAS Chemicals Group Berhad Balance at Balance at Name 1.4.2011 Bought Sold 31.12.2011Dato’ Shamsul Azhar bin Abbas 20,000 - - 20,000Datuk Anuar bin Ahmad 20,000 - - 20,000Tan Sri Dr. Wan Abdul Aziz bin Wan Abdullah 20,000 - - 20,000Datuk Wan Zulkiflee bin Wan Ariffin 20,000 - - 20,000Datuk Mohd Omar bin Mustapha 10,000 - - 10,000Tan Sri Dato’ Seri Hj Megat Najmuddin bin Datuk Seri Dr. Hj Megat Khas 20,000 - (20,000) -Dato’ Muhammad bin Ibrahim 20,000 - - 20,000Dato’ Mohamad Idris bin Mansor 20,000 - - 20,000Datin Yap Siew Bee 20,000 - - 20,000Krishnan C K Menon 20,000 - - 20,000Datuk Manharlal Ratilal 20,000 - - 20,000Dato’ Wee Yiaw Hin 20,000 - - 20,000
Number of ordinary shares of RM1.00 each in KLCC Property Holdings Berhad Balance at Balance at Name 1.4.2011 Bought Sold 31.12.2011 Datuk Manharlal Ratilal 5,000 - - 5,000
Number of ordinary shares of RM1.00 each in MISC Berhad Balance at date of Balance at Name appointment Bought Sold 31.12.2011Tan Sri Amirsham bin Abdul Aziz: - own 11,600 - - 11,600- others 4,000 - - 4,000

reimagining energyPETRONAS ANNUAL REPORT PE 2011 121
DIRECTORS’ INTERESTS (continued) Number of ordinary shares of RM0.50 each in Malaysia Marine and Heavy Engineering Holdings Berhad Balance at Balance at Name 1.4.2011 Bought Sold 31.12.2011Dato’ Shamsul Azhar bin Abbas 10,000 - (10,000) -Datuk Wan Zulkiflee bin Wan Ariffin 10,000 - - 10,000
The other Director holding office at 31 December 2011 had no interest in the ordinary shares of the Company and of its related corporations during the financial period.
DIRECTORS’ BENEFITS
Since the end of the previous financial year, no Director of the Company has received or become entitled to receive any benefit (other than the benefit included in the aggregate amount of emoluments received or due and receivable by Directors as shown in the financial statements), by reason of a contract made by the Company or a related corporation with the Director or with a firm of which the Director is a member, or with a company in which the Director has a substantial financial interest.
There were no arrangements during and at the end of the financial period which had the object of enabling Directors of the Company to acquire benefits by means of the acquisition of shares in or debentures of the Company or any other body corporate.
ISSUE OF SHARES
There were no changes in the issued and paid up capital of the Company during the financial period.
OPTIONS GRANTED OVER UNISSUED SHARES
No options were granted to any person to take up unissued shares of the Company during the financial period.
OTHER STATUTORY INFORMATION
Before the financial statements of the Group and of the Company were made out, the Directors took reasonable steps to ascertain that:
(i) all known bad debts have been written off and adequate provision made for doubtful debts, and
(ii) any current assets which were unlikely to realise, in the ordinary course of business, their values as shown in the accounting records of the Group and of the Company, had been written down to an amount which they might be expected so to realise.
At the date of this report, the Directors are not aware of any circumstances:
(i) that would render the amount written off for bad debts, or the amount of the provision for doubtful debts, in the Group and in the Company inadequate to any substantial extent, or
(ii) that would render the value attributed to the current assets in the financial statements of the Group and of the Company misleading, or

PETRONAS ANNUAL REPORT PE 2011122
OTHER STATUTORY INFORMATION (continued)
(iii) which have arisen which render adherence to the existing method of valuation of assets or liabilities of the Group and of the Company misleading or inappropriate, or
(iv) not otherwise dealt with in this report or the financial statements, that would render any amount stated in the financial statements of the Group and of the Company misleading.
At the date of this report, there does not exist:
(i) any charge on the assets of the Group or of the Company that has arisen since the end of the financial period and which secures the liabilities of any other person, or
(ii) any contingent liability in respect of the Group or of the Company that has arisen since the end of the financial period.
No contingent liability or other liability of any company in the Group has become enforceable, or is likely to become enforceable within the period of twelve months after the end of the financial period which, in the opinion of the Directors, will or may substantially affect the ability of the Group and of the Company to meet their obligations as and when they fall due.
In the opinion of the Directors, the financial performance of the Group and of the Company for the financial period ended 31 December 2011 have not been substantially affected by any item, transaction or event of a material and unusual nature nor has any such item, transaction or event occurred in the interval between the end of that financial period and the date of this report except as disclosed in note 40 to the financial statements.
AUDITORS
The auditors, Messrs KPMG Desa Megat & Co., have indicated their willingness to accept re-appointment.
Signed on behalf of the Board of Directors in accordance with a resolution of the Directors:
………………………………………………………….Dato’ Shamsul Azhar bin Abbas
………………………………………………………….Datuk Anuar bin Ahmad
Kuala Lumpur,Date: 29 February 2012

reimagining energyPETRONAS ANNUAL REPORT PE 2011 123
STATEMENT BY DIRECTORS
In the opinion of the Directors, the financial statements set out on pages 125 to 229, are drawn up in accordance with Financial Reporting Standards and the Companies Act, 1965 in Malaysia so as to give a true and fair view of the financial position of the Group and of the Company at 31 December 2011 and of their financial performance and cash flows for the period ended on that date.
Signed on behalf of the Board of Directorsin accordance with a resolution of the Directors:
………………………………………………………….Dato’ Shamsul Azhar bin Abbas
………………………………………………………….Datuk Anuar bin Ahmad
Kuala Lumpur,Date: 29 February 2012

PETRONAS ANNUAL REPORT PE 2011124
STATUTORY DECLARATION
I, Datuk Manharlal Ratilal, the Director primarily responsible for the financial management of PETROLIAM NASIONAL BERHAD, do solemnly and sincerely declare that the financial statements set out on pages 125 to 229 are, to the best of my knowledge and belief, correct and I make this solemn declaration conscientiously believing the same to be true, and by virtue of the provisions of the Statutory Declarations Act, 1960.
Subscribed and solemnly declared by the abovenamed Datuk Manharlal Ratilal at Kuala Lumpur in Wilayah Persekutuan on 29 February 2012.
BEFORE ME:
PE
SU
RUHJAYA
SUMPA
HM A L A Y S I A
No: W 287Lim Heng LinAMP,
AMN
4 Tkt. Mezzanine, Medan Pasar50050 Kuala Lumpur
Tel: 03-20783299, 016-2099638

reimagining energyPETRONAS ANNUAL REPORT PE 2011 125
CONSOLIDATED STATEMENT OF FINANCIAL POSITIONAT 31 DECEMBER 2011
31.12.2011 31.3.2011 Note RM Mil RM MilASSETS Property, plant and equipment 3 206,117 191,575 Investment properties 4 11,024 10,561 Land held for development 5 1,601 1,641 Prepaid lease payments 6 625 551 Investments in associates 8 5,381 5,725 Investments in jointly controlled entities 9 6,942 5,836 Intangible assets 10 22,604 15,389 Long term receivables 11 4,084 3,289 Fund and other investments 12 3,495 11,824 Deferred tax assets 14 3,880 3,975 Cash and cash equivalents 15 89 108 TOTAL NON-CURRENT ASSETS 265,842 250,474 Property development costs 16 507 441 Trade and other inventories 17 11,765 9,700 Trade and other receivables 18 37,364 33,162 Tax recoverable 762 446 Assets classified as held for sale 19 631 346 Fund and other investments 12 35,383 37,869 Cash and cash equivalents 15 125,358 106,556 TOTAL CURRENT ASSETS 211,770 188,520 TOTAL ASSETS 477,612 438,994
EQUITY Share capital 20 100 100 Reserves 21 288,210 263,688 Total equity attributable to shareholders of the Company 288,310 263,788 Non-controlling interests 22 32,869 32,126TOTAL EQUITY 321,179 295,914 LIABILITIES Borrowings 23 39,674 44,354 Deferred tax liabilities 14 13,628 13,258 Other long term liabilities and provisions 25 23,977 24,544 TOTAL NON-CURRENT LIABILITIES 77,279 82,156 Trade and other payables 26 50,310 38,039 Borrowings 23 12,849 3,457 Taxation 15,995 13,428 Dividend payable - 6,000 TOTAL CURRENT LIABILITIES 79,154 60,924 TOTAL LIABILITIES 156,433 143,080 TOTAL EQUITY AND LIABILITIES 477,612 438,994
The notes set out on pages 136 to 229 are an integral part of these financial statements.

PETRONAS ANNUAL REPORT PE 2011126
CONSOLIDATED STATEMENT OF COMPREHENSIVE INCOMEFOR THE PERIOD ENDED 31 DECEMBER 2011
1.4.2011 1.4.2010 to to 31.12.2011 31.3.2011 Note RM Mil RM Mil
Revenue 222,797 241,228 Cost of revenue (126,236) (143,427)Gross profit 27 96,561 97,801 Selling and distribution expenses (3,585) (4,291)Administration expenses (10,663) (12,072)Other expenses (4,050) (2,766)Other income 5,135 13,221 Operating profit 28 83,398 91,893 Financing costs (2,028) (3,473)Share of profit after tax and non-controlling interests of equity accounted associates and jointly controlled entities 1,317 2,076 Profit before taxation 82,687 90,496 Tax expense 30 (27,113) (27,488)Profit for the period/year 55,574 63,008 Other comprehensive income/(expenses) Net movements from exchange differences 5,204 (7,417)Available-for-sale financial assets - Changes in fair value (1,875) 2,274 - Transfer to profit or loss upon disposal (3,068) -Other comprehensive expenses (33) (171)Total other comprehensive income/(expenses) for the period/year 228 (5,314)
TOTAL COMPREHENSIVE INCOME FOR THE PERIOD/YEAR 55,802 57,694
Profit attributable to: Shareholders of the Company 48,863 54,848 Non-controlling interests 6,711 8,160 PROFIT FOR THE PERIOD/YEAR 55,574 63,008 Total comprehensive income attributable to: Shareholders of the Company 48,558 50,871 Non-controlling interests 7,244 6,823 TOTAL COMPREHENSIVE INCOME FOR THE PERIOD/YEAR 55,802 57,694
The notes set out on pages 136 to 229 are an integral part of these financial statements.
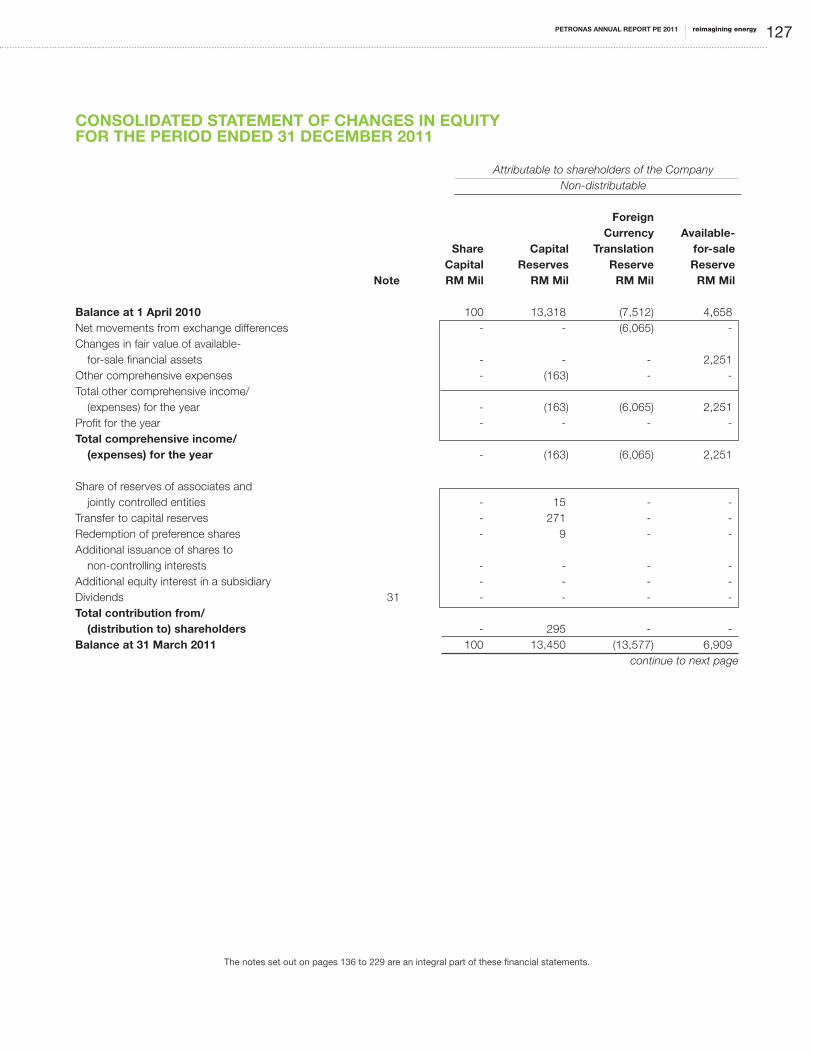
reimagining energyPETRONAS ANNUAL REPORT PE 2011 127
CONSOLIDATED STATEMENT OF CHANGES IN EQUITYFOR THE PERIOD ENDED 31 DECEMBER 2011
Attributable to shareholders of the Company Non-distributable
Foreign Currency Available- Share Capital Translation for-sale Capital Reserves Reserve Reserve Note RM Mil RM Mil RM Mil RM Mil Balance at 1 April 2010 100 13,318 (7,512) 4,658 Net movements from exchange differences - - (6,065) - Changes in fair value of available- for-sale financial assets - - - 2,251 Other comprehensive expenses - (163) - - Total other comprehensive income/ (expenses) for the year - (163) (6,065) 2,251Profit for the year - - - -Total comprehensive income/ (expenses) for the year - (163) (6,065) 2,251 Share of reserves of associates and jointly controlled entities - 15 - -Transfer to capital reserves - 271 - -Redemption of preference shares - 9 - -Additional issuance of shares to non-controlling interests - - - -Additional equity interest in a subsidiary - - - -Dividends 31 - - - -Total contribution from/ (distribution to) shareholders - 295 - -Balance at 31 March 2011 100 13,450 (13,577) 6,909
continue to next page
The notes set out on pages 136 to 229 are an integral part of these financial statements.
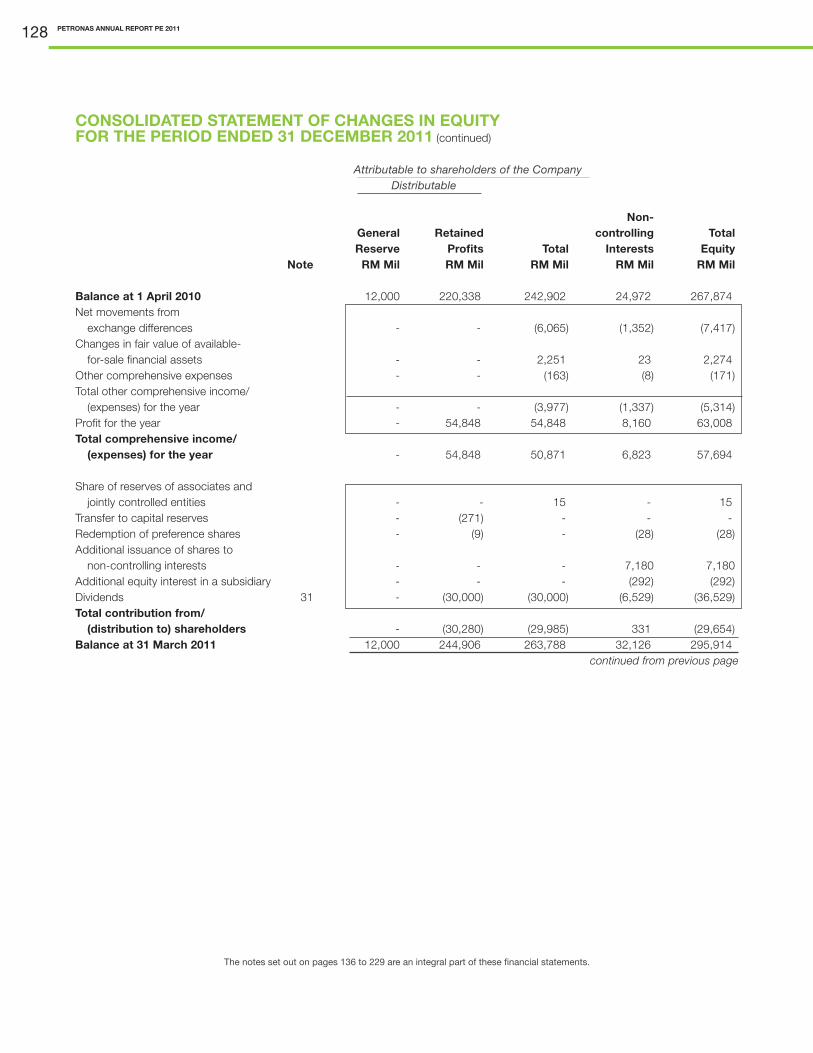
PETRONAS ANNUAL REPORT PE 2011128
CONSOLIDATED STATEMENT OF CHANGES IN EQUITYFOR THE PERIOD ENDED 31 DECEMBER 2011 (continued)
Attributable to shareholders of the Company Distributable
Non- General Retained controlling Total Reserve Profits Total Interests Equity Note RM Mil RM Mil RM Mil RM Mil RM Mil Balance at 1 April 2010 12,000 220,338 242,902 24,972 267,874 Net movements from exchange differences - - (6,065) (1,352) (7,417)Changes in fair value of available- for-sale financial assets - - 2,251 23 2,274Other comprehensive expenses - - (163) (8) (171)Total other comprehensive income/ (expenses) for the year - - (3,977) (1,337) (5,314)Profit for the year - 54,848 54,848 8,160 63,008Total comprehensive income/ (expenses) for the year - 54,848 50,871 6,823 57,694 Share of reserves of associates and jointly controlled entities - - 15 - 15 Transfer to capital reserves - (271) - - -Redemption of preference shares - (9) - (28) (28)Additional issuance of shares to non-controlling interests - - - 7,180 7,180 Additional equity interest in a subsidiary - - - (292) (292)Dividends 31 - (30,000) (30,000) (6,529) (36,529)Total contribution from/ (distribution to) shareholders - (30,280) (29,985) 331 (29,654)Balance at 31 March 2011 12,000 244,906 263,788 32,126 295,914 continued from previous page
The notes set out on pages 136 to 229 are an integral part of these financial statements.

reimagining energyPETRONAS ANNUAL REPORT PE 2011 129
CONSOLIDATED STATEMENT OF CHANGES IN EQUITYFOR THE PERIOD ENDED 31 DECEMBER 2011 (continued)
Attributable to shareholders of the Company Non-distributable
Foreign Currency Available- Share Capital Translation for-sale Capital Reserves Reserve Reserve Note RM Mil RM Mil RM Mil RM Mil Balance at 1 April 2011 100 13,450 (13,577) 6,909 Net movements from exchange differences - - 4,649 - Available-for-sale financial assets: - Changes in fair value - - - (1,867)- Transfer to profit or loss upon disposal - - - (3,068)Other comprehensive expenses - (19) - - Total other comprehensive income/ (expenses) for the period - (19) 4,649 (4,935)Profit for the period - - - -Total comprehensive income/ (expenses) for the period - (19) 4,649 (4,935) Share of reserves of associates and jointly controlled entities - (36) - - Redemption of preference shares - 10 - - Additional issuance of shares to non-controlling interests - - - - Dividends 31 - - - - Total distribution to shareholders - (26) - -Balance at 31 December 2011 100 13,405 (8,928) 1,974
continue to next page
The notes set out on pages 136 to 229 are an integral part of these financial statements.

PETRONAS ANNUAL REPORT PE 2011130
CONSOLIDATED STATEMENT OF CHANGES IN EQUITYFOR THE PERIOD ENDED 31 DECEMBER 2011 (continued)
Attributable to shareholders of the Company Distributable
Non- General Retained controlling Total Reserve Profits Total Interests Equity Note RM Mil RM Mil RM Mil RM Mil RM Mil Balance at 1 April 2011 12,000 244,906 263,788 32,126 295,914 Net movements from exchange differences - - 4,649 555 5,204 Available-for-sale financial assets: - Changes in fair value - - (1,867) (8) (1,875)- Transfer to profit or loss upon disposal - - (3,068) - (3,068)Other comprehensive expenses - - (19) (14) (33)Total other comprehensive income/ (expenses) for the period - - (305) 533 228 Profit for the period - 48,863 48,863 6,711 55,574 Total comprehensive income/ (expenses) for the period - 48,863 48,558 7,244 55,802 Share of reserves of associates and jointly controlled entities - - (36) - (36)Redemption of preference shares - (10) - (36) (36)Additional issuance of shares to non-controlling interests - - - 37 37 Dividends 31 - (24,000) (24,000) (6,502) (30,502)Total distribution to shareholders - (24,010) (24,036) (6,501) (30,537)Balance at 31 December 2011 12,000 269,759 288,310 32,869 321,179
continued from previous page
The notes set out on pages 136 to 229 are an integral part of these financial statements.

reimagining energyPETRONAS ANNUAL REPORT PE 2011 131
CONSOLIDATED STATEMENT OF CASH FLOWFOR THE PERIOD ENDED 31 DECEMBER 2011
1.4.2011 1.4.2010 to to 31.12.2011 31.3.2011 Note RM Mil RM MilCASH FLOWS FROM OPERATING ACTIVITIES Cash receipts from customers 217,481 233,712 Cash paid to suppliers and employees (121,351) (134,410) 96,130 99,302 Interest income from fund and other investments 2,046 2,466 Interest expenses paid (1,699) (2,388) Taxation paid (24,499) (28,615) Net cash generated from operating activities 71,978 70,765
CASH FLOWS FROM INVESTING ACTIVITIES
Net cash used in investing activities 32 (21,049) (29,183)
CASH FLOWS FROM FINANCING ACTIVITIES
Net cash used in financing activities 33 (34,229) (36,613)
NET INCREASE IN CASH AND CASH EQUIVALENTS 16,700 4,969
DECREASE/(INCREASE) IN DEPOSITS RESTRICTED 232 (257)
NET FOREIGN EXCHANGE DIFFERENCES 1,274 (2,338)
CASH AND CASH EQUIVALENTS AT BEGINNING OF THE PERIOD/YEAR 106,077 103,703
CASH AND CASH EQUIVALENTS AT END OF THE PERIOD/YEAR 124,283 106,077 CASH AND CASH EQUIVALENTS Cash and bank balances and deposits 15 125,447 106,664 Negotiable certificate of deposits 12 514 490 Bank overdrafts 23 (908) (75) 125,053 107,079 Less: Deposits restricted 15 (770) (1,002) 124,283 106,077
The notes set out on pages 136 to 229 are an integral part of these financial statements.

PETRONAS ANNUAL REPORT PE 2011132
STATEMENT OF FINANCIAL POSITION AT 31 DECEMBER 2011
31.12.2011 31.3.2011 Note RM Mil RM Mil ASSETS Property, plant and equipment 3 3,225 3,025 Investments in subsidiaries 7 46,479 45,778 Investments in associates 8 302 302 Investments in jointly controlled entities 9 1,385 1,385 Long term receivables 11 69,716 71,813 Fund and other investments 12 2,570 76 Deferred tax assets 14 2,558 2,108 TOTAL NON-CURRENT ASSETS 126,235 124,487 Trade and other inventories 17 24 49 Trade and other receivables 18 15,096 12,519 Fund and other investments 12 28,356 31,815 Cash and cash equivalents 15 75,608 58,164 TOTAL CURRENT ASSETS 119,084 102,547 TOTAL ASSETS 245,319 227,034 EQUITY Share capital 20 100 100 Reserves 21 173,126 156,877 TOTAL EQUITY 173,226 156,977 LIABILITIES Borrowings 23 21,612 26,591 Other long term liabilities and provisions 25 18,743 21,587 TOTAL NON-CURRENT LIABILITIES 40,355 48,178 Trade and other payables 26 14,284 6,712 Borrowings 23 6,357 - Taxation 11,097 9,167 Dividend payable - 6,000 TOTAL CURRENT LIABILITIES 31,738 21,879 TOTAL LIABILITIES 72,093 70,057 TOTAL EQUITY AND LIABILITIES 245,319 227,034
The notes set out on pages 136 to 229 are an integral part of these financial statements.

reimagining energyPETRONAS ANNUAL REPORT PE 2011 133
STATEMENT OF COMPREHENSIVE INCOMEFOR THE PERIOD ENDED 31 DECEMBER 2011
1.4.2011 1.4.2010 to to 31.12.2011 31.3.2011 Note RM Mil RM MilRevenue 92,229 96,540 Cost of revenue (35,118) (42,797)Gross profit 27 57,111 53,743 Selling and distribution expenses (217) (351)Administration expenses (3,046) (3,209)Other expenses (2,573) (2,840)Other income 3,779 19,609 Operating profit 28 55,054 66,952 Financing costs (1,023) (1,561)Profit before taxation 54,031 65,391 Tax expense 30 (13,830) (14,919)Profit for the period/year 40,201 50,472 Other comprehensive income/(expenses) Changes in fair value of available-for-sale financial assets 48 (55)
TOTAL COMPREHENSIVE INCOME FOR THE PERIOD/YEAR 40,249 50,417
The notes set out on pages 136 to 229 are an integral part of these financial statements.

PETRONAS ANNUAL REPORT PE 2011134
STATEMENT OF CHANGES IN EQUITYFOR THE PERIOD ENDED 31 DECEMBER 2011
Non-distributable Distributable Available- Share for-sale General Retained Total Capital Reserve Reserve Profits Equity Note RM Mil RM Mil RM Mil RM Mil RM Mil Balance at 1 April 2010 100 156 12,000 124,304 136,560 Changes in fair value of available-for-sale financial assets representing other comprehensive expense for the year - (55) - - (55)Profit for the year - - - 50,472 50,472 Total comprehensive income/ (expenses) for the year - (55) - 50,472 50,417 Dividends representing total distribution to shareholders 31 - - - (30,000) (30,000)
Balance at 31 March 2011 100 101 12,000 144,776 156,977 Balance at 1 April 2011 100 101 12,000 144,776 156,977 Changes in fair value of available-for-sale financial assets representing other comprehensive income for the period - 48 - - 48 Profit for the period - - - 40,201 40,201 Total comprehensive income for the period - 48 - 40,201 40,249 Dividends representing total distribution to shareholders 31 - - - (24,000) (24,000) Balance at 31 December 2011 100 149 12,000 160,977 173,226
The notes set out on pages 136 to 229 are an integral part of these financial statements.

reimagining energyPETRONAS ANNUAL REPORT PE 2011 135
STATEMENT OF CASH FLOWFOR THE PERIOD ENDED 31 DECEMBER 2011
1.4.2011 1.4.2010 to to 31.12.2011 31.3.2011 Note RM Mil RM MilCASH FLOWS FROM OPERATING ACTIVITIES Cash receipts from customers 76,325 77,321 Cash paid to suppliers and employees (37,489) (40,954) 38,836 36,367 Interest income from fund and other investments 2,062 2,285 Interest expenses paid (809) (987) Taxation paid (12,188) (14,996) Net cash generated from operating activities 27,901 22,669 CASH FLOWS FROM INVESTING ACTIVITIES Net cash generated from investing activities 32 18,878 9,981
CASH FLOWS FROM FINANCING ACTIVITIES
Net cash used in financing activities 33 (30,000) (30,000)
NET INCREASE IN CASH AND CASH EQUIVALENTS 16,779 2,650 NET FOREIGN EXCHANGE DIFFERENCES 689 (1,303) CASH AND CASH EQUIVALENTS AT BEGINNING OF THE PERIOD/YEAR 58,654 57,307 CASH AND CASH EQUIVALENTS AT END OF THE PERIOD/YEAR 76,122 58,654 CASH AND CASH EQUIVALENTS Cash and bank balances and deposits 15 75,608 58,164 Negotiable certificate of deposits 12 514 490 76,122 58,654
The notes set out on pages 136 to 229 are an integral part of these financial statements.

PETRONAS ANNUAL REPORT PE 2011136
NOTES TO THE FINANCIAL STATEMENTS - 31 DECEMBER 2011
1. BASIS OF PREPARATION
1.1 Statement of compliance
The financial statements of the Group and of the Company have been prepared in accordance with Financial Reporting Standards (FRSs), generally accepted accounting principles and the Companies Act, 1965 in Malaysia.
At the beginning of the current financial period, the Group and the Company had adopted new and revised FRSs, amendments and IC interpretations (collectively referred to as “pronouncements”) that have been issued by the Malaysian Accounting Standards Board (“MASB”) as described fully in note 43.
The MASB has also issued new and revised pronouncements which are not yet effective and therefore, have not been implemented by the Group and the Company in these financial statements, as set out in note 44.
Following the announcement made by the MASB on 19 November 2011, the Group and the Company will prepare their financial statements in accordance with the Malaysian Financial Reporting Standards (“MFRS”) framework from 1 January 2012 onwards.
The financial statements were approved and authorised for issue by the Board of Directors on 29 February 2012.
1.2 Change of financial year end
The Group and the Company have changed their financial year end from 31 March to 31 December. Consequently, the current financial statements, being the Group and the Company’s first financial statements under the new financial year, are for a period of 9 months from 1 April 2011 to 31 December 2011. The comparative figures are for the previous 12-month period from 1 April 2010 to 31 March 2011.
1.3 Basis of measurement
The financial statements of the Group and of the Company have been prepared on historical cost basis except that, as disclosed in the accounting policies below, certain items are measured at fair value.
1.4 Functional and presentation currency
The individual financial statements of each entity in the Group are measured using the currency of the primary economic environment in which the entity operates (“the functional currency”). The Group and the Company’s financial statements are presented in Ringgit Malaysia, which is the Company’s functional currency.
1.5 Use of estimates and judgments
The preparation of financial statements requires management to make judgments, estimates and assumptions that affect the application of accounting policies and the reported amounts of assets, liabilities, income and expenses. Actual results may differ from these estimates.
Estimates and underlying assumptions are reviewed on an ongoing basis. Revisions to accounting estimates are
recognised in the period in which the estimate is revised and in any future periods affected.
reimagining energyPETRONAS ANNUAL REPORT PE 2011 137
1. BASIS OF PREPARATION (continued)
1.5 Use of estimates and judgments (continued)
In particular, information about significant areas of estimation uncertainty and critical judgments in applying accounting policies that have the most significant effect on the amount recognised in the financial statements are described in the following notes:
(i) Note 3 : Property, Plant and Equipment; (ii) Note 10 : Intangible Assets; (iii) Note 14 : Deferred Tax; (iv) Note 25 : Other Long Term Liabilities and Provisions; and (v) Note 41 : Financial Instruments.
2. SIGNIFICANT ACCOUNTING POLICIES
The accounting policies set out below have been applied consistently to all periods presented in these financial statements, and have been applied consistently by Group entities, unless otherwise stated.
2.1 Basis of consolidation
Subsidiaries are entities controlled by the Company. Control exists when the Company has the power, directly or indirectly, to govern the financial and operating policies of an entity so as to obtain benefits from its activities.
The financial statements of subsidiaries are included in the consolidated financial statements of the Group from the date that control commences until the date that control ceases.
All inter-company transactions are eliminated on consolidation and revenue and profits relate to external transactions only. Unrealised losses resulting from intercompany transactions are also eliminated unless cost cannot be recovered.
Business combinations
Business combinations are accounted for using the acquisition method of accounting. From 1 April 2011, the Group has applied FRS 3, Business Combinations (revised) in accounting for business combinations. This change in accounting policy has been applied prospectively in accordance with the transitional provisions provided by the standard and does not have significant impact on the Group’s reported income or net assets.
For acquisitions on or after 1 April 2011, the Group measures goodwill as the excess of the aggregate of consideration transferred, amount recognised for any non-controlling interests in the acquiree and the fair value of any previously held equity interest in the acquiree over the fair value of the identifiable assets acquired and liabilities assumed. When the excess is negative, the difference is recognised immediately in the profit or loss.
Costs related to the acquisition, other than those associated with the issuance of debt or equity securities, that the
Group incurs in connection with a business combination are expensed as incurred.
For acquisitions between 1 April 2006 and 31 March 2011, goodwill represents the excess of the cost of acquisition over the Group’s interest in the fair values of the net identifiable assets and liabilities and contingent liabilities of the acquiree. When the excess was negative, the difference was recognised immediately in profit or loss.
Transaction costs that the Group incurred in connection with business combinations were capitalised as part of the cost of acquisition.
For acquisitions prior to 1 April 2006, goodwill represents the excess of the cost of acquisition over the Group’s interest in the fair values of the net identifiable assets and liabilities of the acquiree.

PETRONAS ANNUAL REPORT PE 2011138
2. SIGNIFICANT ACCOUNTING POLICIES (continued)
2.1 Basis of consolidation (continued)
Non-controlling interests
Non-controlling interests at the reporting date, being the portion of the net assets of subsidiaries attributable to equity interests that are not owned by the Company, whether directly or indirectly through subsidiaries, are presented in the consolidated statement of financial position and statement of changes in equity within equity, separately from equity attributable to the equity shareholders of the Company. Non-controlling interests in the results of the Group are presented in the consolidated statement of comprehensive income as an allocation of the profit or loss and the comprehensive income for the period between the non-controlling interests and the equity shareholders of the Company.
Since the beginning of the reporting period, the Group has applied FRS 127, Consolidated and Separate Financial Statements (revised) where losses applicable to the non-controlling interests in a subsidiary are allocated to the non-controlling interests even if doing so causes the non-controlling interests to have a deficit balance. This change in accounting policy has been applied prospectively in accordance with the transitional provisions of the standard and does not have significant impact on the Group’s reported income or net assets.
In the previous years, where losses applicable to the non-controlling interests exceed their interests in the equity of a subsidiary, the excess, and any further losses applicable to the non-controlling interests, were charged against the Group’s interest except to the extent that the non-controlling interests had a binding obligation to, and was able to, make additional investment to cover the losses. If the subsidiary subsequently reported profits, the Group’s interest was allocated all such profits until the non-controlling interests’ share of losses previously absorbed by the Group had been recovered.
The Group treats all changes in its ownership interest in a subsidiary that do not result in a loss of control as equity transactions between the Group and its non-controlling interest holders. Any difference between the Group’s share of net assets before and after the change, and any consideration received or paid, is adjusted to or against Group reserves.
Loss of control
Upon implementation of the revised FRS 127, when control of a subsidiary is lost, the Group derecognises the assets and liabilities of the subsidiary, any non-controlling interests and the other components of equity related to the subsidiary. Any surplus or deficit arising on the loss of control is recognised in profit or loss. If the Group retains any interest in the previous subsidiary, then such interest is measured at fair value at the date that control is lost. Subsequently it is accounted for as an equity-accounted investee or as an available-for-sale financial asset depending on the level of influence retained.
Prior to adopting the revised FRS 127, if the Group retained any interest in the previous subsidiary, such interest was measured at the carrying amount at the date that control was lost and this carrying amount would be regarded as cost on initial measurement of the investment.
2.2 Associates
Associates are entities in which the Group has significant influence including representation on the Board of Directors, but not control or joint control, over the financial and operating policies of the investee company.
Associates are accounted for in the consolidated financial statements using the equity method. The consolidated financial statements include the Group’s share of post-acquisition profits or losses of the equity accounted associates, after adjustments to align the accounting policies with those of the Group, from the date that significant influence commences until the date that significant influence ceases.

reimagining energyPETRONAS ANNUAL REPORT PE 2011 139
2. SIGNIFICANT ACCOUNTING POLICIES (continued)
2.2 Associates (continued)
The Group’s share of post-acquisition reserves and retained profits less losses is added to the carrying value of the investment in the consolidated statement of financial position. These amounts are taken from the latest audited financial statements or management financial statements of the associates.
When the Group’s share of post-acquisition losses exceeds its interest in an equity accounted associate, the carrying amount of that interest (including any long-term investments) is reduced to nil and the recognition of further losses is discontinued except to the extent that the Group has an obligation or has made payments on behalf of the investee.
Unrealised profits arising from transactions between the Group and its associates are eliminated to the extent of the Group’s interests in the associates. Unrealised losses on such transactions are also eliminated partially, unless cost cannot be recovered.
2.3 Jointly controlled entities
The Group has interests in joint ventures which are jointly controlled entities. A joint venture is a contractual arrangement whereby the Group and other parties undertake an economic activity that is subject to joint control, established by contractual agreement and requiring unanimous consent for strategic financial and operating decisions. A jointly controlled entity is a joint venture that involves the establishment of a separate entity in which each venturer has an interest.
Investments in jointly controlled entities are accounted for in the consolidated financial statements using the equity method of accounting as described in note 2.2.
2.4 Property, plant and equipment and depreciation
Freehold land and projects-in-progress are stated at cost less accumulated impairment losses and is not depreciated. Other property, plant and equipment are stated at cost less accumulated depreciation and accumulated impairment losses.
Cost includes expenditures that are directly attributable to the acquisition of the assets and any other costs directly attributable to bringing the assets to working condition for their intended use, and the costs of dismantling and removing the items and restoring the site on which they are located. The cost of self-constructed assets also includes the cost of materials and direct labour. For qualifying assets, borrowing costs are capitalised in accordance with the accounting policy on borrowing costs. Purchased software that is integral to the functionality of the related equipment is capitalised as part of that equipment.
When significant parts of an item of property, plant and equipment have different useful lives, they are accounted for as separate items (major components) of property, plant and equipment.
The cost of replacing part of an item of property, plant and equipment is recognised in the carrying amount of the item if it is probable that the future economic benefits embodied within the part will flow to the Group and its cost can be measured reliably. The net book value of the replaced item of property, plant and equipment is derecognised with any corresponding gain or loss recognised in the profit or loss accordingly. The costs of the day-to-day servicing of property, plant and equipment are recognised in the profit or loss as incurred.
When the use of a property changes from owner-occupied to investment property, the property is reclassified as investment property at cost.
Depreciation for property, plant and equipment other than freehold land, oil and gas properties and projects-in-progress, is recognised in the profit or loss on a straight-line basis over the estimated useful lives of each part of an item of property, plant and equipment. Property, plant and equipment are not depreciated until the assets are ready for their intended use.
PETRONAS ANNUAL REPORT PE 2011140
2. SIGNIFICANT ACCOUNTING POLICIES (continued)
2.4 Property, plant and equipment and depreciation (continued)
Depreciation of producing oil and gas properties is computed based on the unit of production method using total proved and probable reserves for capitalised acquisition costs and total proved and probable developed reserves for capitalised exploration and development costs.
Lease properties are depreciated over the lease term or the estimated useful lives, whichever is shorter. Leasehold land is depreciated over the lease term.
The estimated useful lives of the other property, plant and equipment are as follows:
Buildings 14 - 50 years Plant and equipment 3 - 67 years Office equipment, furniture and fittings 5 - 10 years Computer software and hardware 5 years Motor vehicles 3 - 5 years Vessels 25 - 40 years
Estimates in respect of certain items of property, plant and equipment were revised during the year (refer note 3).
Property, plant and equipment individually costing less than RM5,000 are expensed off in the year of purchase.
The depreciable amount is determined after deducting residual value. The residual value, useful life and depreciation method are reviewed at each financial period/year end to ensure that the amount, period and method of depreciation are consistent with previous estimates and the expected pattern of consumption of the future economic benefits embodied in the items of property, plant and equipment.
An item of property, plant and equipment is derecognised upon disposal or when no future economic benefits are expected from its use or disposal. The difference between the net disposal proceeds, if any, and the net carrying amount is recognised in the profit or loss.
2.5 Investment properties
Investment properties are properties which are owned either to earn rental income or for capital appreciation or for both. Properties that are occupied by the companies in the Group are accounted for as owner-occupied rather than as investment properties.
Freehold land and projects-in-progress are stated at cost and are not depreciated. Other investment properties are stated at cost less accumulated depreciation and accumulated impairment losses, if any, consistent with the accounting policy for property, plant and equipment as stated in note 2.4.
Cost includes expenditure that is directly attributable to the acquisition of the investment property. The cost of self-constructed investment property includes the cost of materials and direct labour, any other costs directly attributable to bringing the investment property to a working condition for its intended use and capitalised borrowing costs.
Depreciation is recognised in the profit or loss on a straight-line basis over their estimated useful lives ranging between 10 and 50 years for buildings.
An investment property is derecognised on its disposal, or when it is permanently withdrawn from use and no future economic benefits are expected from its disposal. The difference between the net disposal proceeds and the carrying amount is recognised in profit or loss in the period in which the item is derecognised.

reimagining energyPETRONAS ANNUAL REPORT PE 2011 141
2. SIGNIFICANT ACCOUNTING POLICIES (continued)
2.6 Land held for development and property development costs Land held for development
Land held for development consists of land or such portions thereof on which no development activities have been carried out or where development activities are not expected to be completed within the normal operating cycle. Such land is classified as non-current asset and is stated at cost less accumulated impairment losses, if any.
Cost includes acquisition cost of land and attributable development expenditure. Cost associated with the acquisition of land includes the purchase price of the land, professional fees, stamp duties, commissions, conversion fees and other relevant levies. Where the Group had previously recorded the land at revalued amount, it continues to retain this amount as its surrogate costs as allowed by FRS 2012004, Property Development Activities.
Land held for development is reclassified as property development costs at the point when development activities have commenced and where it can be demonstrated that the development activities can be completed within the normal operating cycle.
Property development costs
Property development costs comprise costs associated with the acquisition of land, all costs that are directly attributable to development activities or that can be allocated on a reasonable basis to such activities and interest expenses incurred during the period of active development.
Property development cost not recognised as an expense is recognised as an asset and is stated at the lower of cost and net realisable value.
2.7 Leased assets
From 1 April 2011, the Group has applied IC Interpretation 4, Determining whether an arrangement contains a lease. This change in accounting policy has been applied retrospectively in accordance with the transitional provisions provided by the standard and does not have significant impact on the Group’s reported income or net assets.
When the fulfillment of an arrangement is dependent on the use of a specific asset and the arrangement conveys a right to use the asset, it is accounted for as a lease although the arrangement does not take the legal form of a lease. Once determined to be a lease arrangement, it is accounted for as finance or operating lease in accordance with the accounting policy as stated below.
Finance lease
A lease is recognised as a finance lease if it transfers substantially to the Group and the Company all the risks and rewards incidental to ownership. Upon initial recognition, the leased asset is measured at an amount equal to the lower of its fair value and the present value of the minimum lease payments at the inception of the lease. Subsequent to initial recognition, the asset is accounted for in accordance with the accounting policy applicable to that asset. The corresponding liability is included in the statement of financial position as borrowings.
Minimum lease payments made under finance leases are apportioned between the finance costs and the reduction of the outstanding liability. Finance costs, which represent the difference between the total leasing commitments and the fair value of the assets acquired, are recognised in the profit or loss over the lease term so as to produce a constant periodic rate of interest on the remaining balance of the liability for each accounting period.
Contingent lease payments, if any, are accounted for by revising the minimum lease payments over the remaining term of the lease when the lease adjustment is confirmed.
Leasehold land which in substance is a finance lease is classified as property, plant and equipment.

PETRONAS ANNUAL REPORT PE 2011142
2. SIGNIFICANT ACCOUNTING POLICIES (continued)
2.7 Leased assets (continued)
Operating lease
All leases that do not transfer substantially to the Group and the Company all the risks and rewards incidental to ownership are classified as operating leases and, the leased assets are not recognised on the Group’s statement of financial position.
Payments made under operating leases are recognised as an expense in the profit or loss on a straight-line basis over the term of the lease. Lease incentives received are recognised as a reduction of rental expense over the lease term on a straight-line basis. Contingent rentals are charged to profit or loss in the reporting period in which they are incurred.
Prepaid lease payments Prepaid rental together with leasehold land which in substance is an operating lease are classified as prepaid lease
payments. The payment made on entering into a lease arrangement or acquiring a leasehold land is accounted for as prepaid lease payments that are amortised over the lease term in accordance with the pattern of benefits provided.
Leasehold land is classified into long lease and short lease. Long lease is defined as a lease with an unexpired lease period of fifty years or more. Short lease is defined as a lease with an unexpired lease period of less than fifty years.
2.8 Investments
Long term investments in subsidiaries, associates and jointly controlled entities are stated at cost less impairment loss, if any, in the Company’s financial statements.
The carrying amount of these investments includes fair value adjustments on shareholder’s loans and advances, if any (note 2.12(i)).
2.9 Intangible assets
Goodwill
Goodwill arising from business combinations is initially measured at cost. Following the initial recognition, goodwill is measured at cost less any accumulated impairment losses. Goodwill is not amortised but instead, it is reviewed for impairment, annually or more frequently if events or changes in circumstances indicate that the carrying value may be impaired.
In respect of equity accounted investees, the carrying amount of goodwill is included in the carrying amount of the investment. The entire carrying amount of the investment is reviewed for impairment when there is objective evidence of impairment.
Exploration expenditure
Intangible assets also include expenditure on the exploration for and evaluation of oil and natural gas resources (hereinafter collectively referred to as “exploration expenditure”). The accounting policy for exploration expenditure is described separately in note 2.10.
Other intangible assets
Intangible assets other than goodwill and exploration expenditure are measured on initial recognition at cost. The costs of intangible assets acquired in a business combination are their fair values as at the date of acquisition.

reimagining energyPETRONAS ANNUAL REPORT PE 2011 143
2. SIGNIFICANT ACCOUNTING POLICIES (continued)
2.9 Intangible assets (continued) Other intangible assets (continued)
Following initial recognition, intangible assets with finite useful lives are carried at cost less accumulated amortisation and any accumulated impairment losses.
Amortisation for intangible assets with finite useful lives is recognised in the profit or loss on a straight-line basis over the estimated economic useful lives. The amortisation method and the useful life for intangible assets are reviewed at least at each reporting date. Intangible assets are assessed for impairment whenever there is an indication that the intangible assets may be impaired.
Intangible assets with indefinite useful lives are carried at cost less accumulated impairment losses. These intangible assets are reviewed for impairment annually or more frequently if events or changes in circumstances indicate that the carrying value may be impaired.
2.10 Exploration and development expenditure
The Group follows the successful efforts method of accounting for the exploration and development expenditure.
Exploration expenditure
Costs directly associated with an exploration well, including license acquisition and drilling costs, are initially capitalised as intangible assets until the results have been evaluated.
If a well does not result in successful discovery of economically recoverable volume of hydrocarbons, such costs are written off as a dry well. If hydrocarbons are found and, subject to further appraisal activity which may include the drilling of further wells, are likely to be capable of commercial development under prevailing economic conditions, the costs continue to be carried as intangible assets. All such carried costs are reviewed at least once a year to determine whether the reserves found or appraised remain economically viable. When this is no longer the case, the costs are written off.
Where development plan is commercially viable and approved by the relevant authorities, the related exploration and evaluation costs are transferred to projects-in-progress in property, plant and equipment.
Development expenditure
Development expenditure comprises all costs incurred in bringing a field to commercial production and is capitalised as incurred. The amount capitalised includes attributable interests and other financing costs incurred on exploration and development before commencement of production.
Upon commencement of production, the exploration and development expenditure initially capitalised as projects-in-progress are transferred to oil and gas properties, and are depreciated as described in the accounting policy for property, plant and equipment (note 2.4).
2.11 Non-current assets held for sale
Non-current assets and disposal groups comprising assets and liabilities that are expected to be recovered primarily through sale rather than through continuing use, are classified as held for sale. This condition is regarded as met only when the sale is highly probable and the asset is available for immediate sale in its present condition.
Immediately before classification as held for sale, the assets (or all the assets and liabilities in a disposal group) are remeasured in accordance with the Group’s applicable accounting policies. Thereafter, on initial classification as held for sale, the assets or disposal groups are measured at the lower of carrying amount and fair value less cost to sell.

PETRONAS ANNUAL REPORT PE 2011144
2. SIGNIFICANT ACCOUNTING POLICIES (continued)
2.11 Non-current assets held for sale (continued)
Any differences are charged to the profit or loss.
Property, plant and equipment and investment properties once classified as held for sale are not depreciated. 2.12 Financial instruments
A financial instrument is recognised in the statement of financial position when, and only when, the Group or the Company becomes a party to the contractual provisions of the instrument.
(i) Financial assets
Initial recognition
Financial assets are classified as financial assets at fair value through profit or loss, loans and receivables, held-to-maturity investments or available-for-sale financial assets, as appropriate. The Group and the Company determine the classification of financial assets at initial recognition.
Financial assets are recognised initially at fair value, normally being the transaction price plus, in the case of financial assets not at fair value through profit or loss, any directly attributable transaction costs.
Purchases or sales that require delivery of financial assets within a timeframe established by regulation or convention in the marketplace (regular way purchases) are recognised on the trade date i.e. the date that the Group and the Company commit to purchase or sell the financial asset.
Fair value adjustments on shareholder’s loans and advances at initial recognition, if any, are added to the carrying value of investments in the Company’s financial statements.
Subsequent measurement
The subsequent measurement of financial assets depends on their classification as follows:
Financial assets at fair value through profit or loss
Financial assets at fair value through profit or loss include financial assets held for trading and financial assets designated upon initial recognition as at fair value through profit or loss. Financial assets are classified as held for trading if they are acquired for the purpose of selling in the near term. This category includes derivative financial instruments entered into by the Group and the Company, including separated embedded derivatives, unless they are designated as effective hedging instruments.
Financial assets at fair value through profit or loss are carried in the statement of financial position at fair value with gains or losses recognised in the profit or loss. The methods used to measure fair values are stated in note 2.12(vi).
Loans and receivables
Loans and receivables are non-derivative financial assets with fixed or determinable payments that are not quoted in an active market. Subsequent to initial recognition, such financial assets are carried at amortised cost, using the effective interest rate method (note 2.12(vii)), less impairment losses.
Gains and losses are recognised in the profit or loss when the loans and receivables are derecognised or impaired, as well as through the amortisation process.

reimagining energyPETRONAS ANNUAL REPORT PE 2011 145
2. SIGNIFICANT ACCOUNTING POLICIES (continued)
2.12 Financial instruments (continued)
(i) Financial assets (continued)
Held-to-maturity investments
Non-derivative financial assets with fixed or determinable payments and fixed maturities are classified as held-to-maturity when the Group and the Company have positive intention and ability to hold the assets to maturity. Subsequent to initial recognition, held-to-maturity investments are measured at amortised cost using the effective interest rate method less impairment losses. Gains and losses are recognised in the profit or loss when the investments are derecognised or impaired, as well as through the amortisation process.
Available-for-sale financial assets
Available-for-sale financial assets are non-derivative financial assets that are designated as available-for-sale or are not classified in any of the three preceding categories. Subsequent to initial recognition, such financial assets are measured at fair value with unrealised gains or losses recognised directly in other comprehensive income and accumulated under available-for-sale reserve in equity until the investment is derecognised or determined to be impaired, at which time the cumulative gain or loss previously recorded in equity is recognised in the profit or loss.
(ii) Financial liabilities
Initial recognition
Financial liabilities are classified as financial liabilities at fair value through profit or loss or loans and borrowings, as appropriate. The Group and the Company determine the classification of financial liabilities at initial recognition.
Financial liabilities are recognised initially at fair value less, in the case of loans and borrowings, any directly attributable transaction costs.
Subsequent measurement
The subsequent measurement of financial liabilities depends on their classification as follows:
Financial liabilities at fair value through profit or loss
Financial liabilities at fair value through profit or loss include financial liabilities held for trading and financial liabilities designated upon initial recognition as at fair value through profit or loss. This category includes derivative financial instruments entered into by the Group and the Company that do not meet the hedge accounting criteria.
Financial liabilities at fair value through profit or loss are carried on the statement of financial position at fair value with gains or losses recognised in the profit or loss.
Loans and borrowings
Subsequent to initial recognition, loans and borrowings are measured at amortised cost using the effective interest rate method.
Gains and losses are recognised in the profit or loss when the liabilities are derecognised as well as through the amortisation process.

PETRONAS ANNUAL REPORT PE 2011146
2. SIGNIFICANT ACCOUNTING POLICIES (continued)
2.12 Financial instruments (continued) (iii) Financial guarantee contracts
Financial guarantee contracts issued by the Group and the Company are those contracts that require a payment to be made to reimburse the holder for a loss it incurs because the specified debtor fails to make a payment when due in accordance with the terms of a debt instrument.
Financial guarantee contracts are recognised initially as a liability at fair value, adjusted for transaction costs that are directly attributable to the issuance of the guarantee. When settlement of a financial guarantee contract becomes probable, an estimate of the obligation is made. If the carrying value of the financial guarantee contract is lower than the obligation, the carrying value is adjusted to the obligation amount and accounted for as provision.
Financial guarantee contracts are amortised on a straight-line basis over the contractual period of the debt instrument. Where the guarantee does not have a specific period, the guarantee will only be recognised in the profit or loss when the underlying facilities are withdrawn.
(iv) Derivative financial instruments
The Group and the Company use derivative financial instruments such as interest rate and foreign currency swaps, forward rate contracts, futures and options, to manage certain exposures to fluctuations in foreign currency exchange rates, interest rates and commodity prices.
Derivative financial instruments are initially recognised at fair value on the date on which a derivative contract is entered into and are subsequently remeasured at fair value. Derivatives are carried as financial assets when the fair value is positive and as financial liabilities when the fair value is negative.
Any gains or losses arising from changes in fair value on derivatives during the year are taken directly to the profit or loss.
An embedded derivative is recognised separately from the host contract and accounted for as a derivative if, and only if, it is not closely related to the economic characteristics and risks of the host contract and the host contract is not categorised as at fair value through profit or loss. The host contract, in the event an embedded derivative is recognised separately, is accounted for in accordance with policy applicable to the nature of the host contract.
In general, contracts to sell or purchase non-financial items to meet expected own use requirements are not accounted for as financial instruments. However, contracts to sell or purchase commodities that can be net settled or which contain written options are required to be recognised at fair value, with gains and losses taken to the profit or loss.
(v) Offsetting of financial instruments
Financial assets and financial liabilities are offset and the net amount is reported in the statement of financial position if, and only if, there is a currently enforceable legal right to offset the recognised amounts and there is an intention to settle on a net basis or to realise the assets and settle the liabilities simultaneously.
(vi) Fair value of financial instruments
The fair value of financial instruments that are actively traded in organised financial markets is determined by reference to quoted market bid prices at the close of business at the end of reporting date. For financial instruments where there is no active market, fair value is determined using valuation techniques.

reimagining energyPETRONAS ANNUAL REPORT PE 2011 147
2. SIGNIFICANT ACCOUNTING POLICIES (continued)
2.12 Financial instruments (continued)
(vi) Fair value of financial instruments (continued) Such techniques may include using recent arm’s length market transactions; reference to the current fair value
of another instrument that is substantially the same; discounted cash flow analysis or other valuation models. Where fair value cannot be reliably estimated, assets are carried at cost less impairment losses.
(vii) Amortised cost of financial instruments
Amortised cost is computed using the effective interest rate method. This method uses effective interest rate that exactly discounts estimated future cash receipts or payments through the expected life of the financial instrument to the net carrying amount of the financial instrument. Amortised cost takes into account any transaction costs and any discount or premium on settlement.
(viii) Derecognition of financial instruments
A financial asset is derecognised when the rights to receive cash flows from the asset have expired or, the Group and the Company have transferred their rights to receive cash flows from the asset or have assumed an obligation to pay the received cash flows in full without material delay to a third party under a “pass-through” arrangement without retaining control of the asset or substantially all the risks and rewards of the asset. On derecognition of a financial asset, the difference between the carrying amount and the sum of the consideration received (including any new asset obtained less any new liability assumed) and any cumulative gain or loss that had been recognised in equity is recognised in the profit or loss.
A financial liability is derecognised when the obligation under the liability is discharged or cancelled or expired. On derecognition of a financial liability, the difference between the carrying amount of the financial liabilities extinguished or transferred to another party and the consideration paid, including any non-cash assets transferred or liabilities assumed, is recognised in the profit or loss.
2.13 Impairment
(i) Financial assets
A financial asset is assessed at each reporting date to determine whether there is any objective evidence that it is impaired. A financial asset is deemed to be impaired if, and only if, there is objective evidence of impairment as a result of one or more events that has occurred after the initial recognition of the asset (an incurred loss event) and that loss event has an impact on the estimated future cash flows of the financial asset that can be reliably estimated.
Loans and receivables
For loans and receivables carried at amortised cost, individually significant financial assets are tested for impairment on an individual basis. The remaining financial assets are assessed collectively in groups that share similar credit risk characteristics.
An impairment loss is measured as the difference between an asset’s carrying amount and the present value of estimated future cash flows discounted at the asset’s original effective interest rate. The carrying amount of the asset is reduced through the use of an allowance account and the amount of the loss is recognised in the profit or loss.
If, in a subsequent year, the amount of the estimated impairment loss increases or decreases because of an event occurring after the impairment was recognised, the previously recognised impairment loss is increased or reduced by adjusting the allowance account.

PETRONAS ANNUAL REPORT PE 2011148
2. SIGNIFICANT ACCOUNTING POLICIES (continued)
2.13 Impairment (continued)
(i) Financial assets (continued)
Available-for-sale financial assets
When a decline in the fair value of an available-for-sale financial asset has been recognised directly in equity and there is objective evidence that the asset is impaired, an amount comprising the difference between its cost and its fair value is transferred from equity to the profit or loss.
If, in a subsequent period, the fair value of an available-for-sale financial asset increases and the increase can be objectively related to an event occurring after the impairment loss was recognised in the profit or loss, the impairment loss is reversed, with the amount of the reversal recognised in the profit or loss.
Impairment losses recognised in the profit or loss relating to investment in an equity instrument classified as available-for-sale is not to be reversed through profit or loss.
(ii) Non-financial assets
The carrying amounts of assets, other than inventories, property development costs, deferred tax assets and financial assets (financial assets in this context exclude investments in subsidiaries, associates and jointly controlled entities), are reviewed at each reporting date to determine whether there is any indication of impairment. For certain classes of assets, the carrying amounts are reviewed more frequently if events or changes in circumstances indicate that the carrying value may be impaired, as described in the respective assets’ accounting policies.
If any such indication exists, the asset’s recoverable amount is estimated. An impairment loss is recognised if the carrying amount of an asset or the cash-generating unit to which it belongs exceeds its recoverable amount. Impairment losses are recognised in the profit or loss.
A cash-generating unit is the smallest identifiable asset group that generates cash flows that are largely independent from other assets and groups. An impairment loss recognised in respect of a cash-generating unit is allocated first to reduce the carrying amount of any goodwill allocated to the unit and then to reduce the carrying amount of the other assets in the unit on a pro-rata basis.
The recoverable amount is the greater of the asset’s fair value less cost to sell and its value in use. In assessing value in use, the estimated future cash flows are discounted to their present value using a pre-tax discount rate that reflects current market assessments of the time value of money and the risks specific to the asset. For an asset that does not generate largely independent cash inflows, the recoverable amount is determined for the cash-generating unit to which the asset belongs.
An impairment loss in respect of goodwill is not reversed in a subsequent period. In respect of other assets, impairment losses are reversed if there has been a change in the estimates used to determine the recoverable amount. An impairment loss is reversed only to the extent that the asset’s carrying amount does not exceed the carrying amount that would have been determined, net of depreciation or amortisation, if no impairment loss had been recognised.
Reversals of impairment losses are credited to the profit or loss in the year in which the reversals are recognised.
reimagining energyPETRONAS ANNUAL REPORT PE 2011 149
2. SIGNIFICANT ACCOUNTING POLICIES (continued)
2.14 Cash and cash equivalents
Cash and cash equivalents consist of cash on hand and bank balances, deposits with licensed financial institutions and highly liquid investments which have an insignificant risk of changes in value. For the purpose of the cash flow statement, cash and cash equivalents are presented net of bank overdrafts and deposits restricted, if any.
2.15 Amount due from contract customers
Amount due from contract customers on construction contracts is included in trade and other receivables and is stated at cost plus attributable profits less foreseeable losses and less progress billings. Cost includes all direct construction costs and other related costs. Where progress billings exceed the aggregate amount due from contract customers plus attributable profits less foreseeable losses, the net credit balance on all such contracts is included in trade and other payables as amount due to contract customers.
2.16 Inventories
Inventories are stated at the lower of cost and net realisable value. Net realisable value is the estimated selling price in the ordinary course of business, less the estimated costs of completion and selling expenses.
Cost of crude oil and condensates includes costs of bringing the inventories to their present location and condition and is determined on a weighted average basis.
Cost of petroleum products includes crude oil costs, export duty, transportation charges and processing costs and is determined on a weighted average basis.
Cost of liquefied natural gas (“LNG”) and petrochemical products includes raw gas costs and production overheads and is determined on a weighted average basis.
Cost of material stores and spares consists of the invoiced value from suppliers and import duty charges and is determined on a weighted average basis.
Cost of developed properties held for sale consists of costs associated with the acquisition of land, direct costs and appropriate proportions of common costs attributable to developing the properties to completion.
2.17 Provisions
A provision is recognised if, as a result of a past event, the Group and the Company have a present legal or constructive obligation that can be estimated reliably, and it is probable that an outflow of economic benefits will be required to settle the obligation. Provisions are determined by discounting the expected future net cash flows at a pre-tax rate that reflects current market assessments of the time value of money and the risks specific to the liability. Where discounting is used, the accretion in the provision due to the passage of time is recognised as finance cost.
The amount recognised as a provision is the best estimate of the net expenditure required to settle the present obligation at the reporting date. Provisions are reviewed at each reporting date and adjusted to reflect the current best estimate.
Possible obligations whose existence will only be confirmed by the occurrence or non-occurrence of one or more future events not wholly within the control of the Group, are not recognised in the financial statements but are disclosed as contingent liabilities unless the possibility of an outflow of economic resources is considered remote.
In particular, information about provisions that have the most significant effect on the amount recognised in the financial statements is described in note 25.

PETRONAS ANNUAL REPORT PE 2011150
2. SIGNIFICANT ACCOUNTING POLICIES (continued)
2.18 Employee benefits
Short term benefits
Wages and salaries, bonuses and social security contributions are recognised as an expense in the year in which the associated services are rendered by employees of the Group and the Company.
Defined contribution plans
As required by law, companies in Malaysia make contributions to the state pension scheme, the Employees Provident Fund (“EPF”).
Some of the Group’s foreign subsidiaries make contributions to their respective countries’ statutory pension schemes and certain other independently-administered funds which are defined contribution plans.
Such contributions are recognised as an expense in the profit or loss as incurred.
2.19 Taxation
Tax on the profit or loss for the period comprises current and deferred tax. Income tax is recognised in the profit or loss except to the extent it relates to items recognised directly in equity, in which case it is recognised in equity.
Current tax
Current tax expense is the expected tax payable on the taxable income for the period, using the statutory tax rates at the reporting date, and any adjustment to tax payable in respect of previous years.
Deferred tax
Deferred tax is provided for, using the liability method, on temporary differences at the reporting date between the tax bases of assets and liabilities and their carrying amounts in the financial statements. In principle, deferred tax liabilities are recognised for all taxable temporary differences and deferred tax assets are recognised for all deductible temporary differences, unabsorbed capital allowances, unused reinvestment allowances, unused investment tax allowances, unused tax losses and unused tax credits to the extent that it is probable that future taxable profit will be available against which the deductible temporary differences, unabsorbed capital allowances, unused reinvestment allowances, unused investment tax allowances, unused tax losses and unused tax credits can be utilised.
Deferred tax is not recognised for the following temporary differences: the initial recognition of goodwill, and the initial recognition of an asset or liability in a transaction which is not a business combination and that affects neither accounting nor taxable profit or loss.
Deferred tax is measured at the tax rates that are expected to apply in the period when the asset is realised or the liability is settled, based on the laws that have been enacted or substantively enacted by the end of the reporting period.
Deferred tax asset is reviewed at each reporting date and is reduced to the extent that it is no longer probable that the
related tax benefit will be realised.
2.20 Foreign currency transactions
In preparing the financial statements of individual entities in the Group, transactions in currencies other than the entity’s functional currency (foreign currencies) are translated to the functional currencies at rates of exchange ruling on the transaction dates.

reimagining energyPETRONAS ANNUAL REPORT PE 2011 151
2. SIGNIFICANT ACCOUNTING POLICIES (continued)
2.20 Foreign currency transactions (continued) Monetary assets and liabilities denominated in foreign currencies at the reporting date have been retranslated to the
functional currency at rates ruling on the reporting date.
Non-monetary assets and liabilities denominated in foreign currencies, which are measured at fair value, are retranslated to the functional currency at the foreign exchange rates ruling at the date when the fair value was determined. Non-monetary items that are measured in terms of historical cost in a foreign currency are not retranslated.
Gains and losses on exchange arising from retranslation are recognised in the profit or loss, except for differences arising on retranslation of available-for-sale equity instruments, which are recognised in equity.
On consolidation, the assets and liabilities of subsidiaries with functional currencies other than Ringgit Malaysia, are translated into Ringgit Malaysia at the exchange rates approximating those ruling at the reporting date. The income and expenses are translated at the average exchange rates for the year, which approximates the exchange rates at the dates of the transactions. All resulting exchange differences are taken to the foreign currency translation reserve within equity.
In the consolidated financial statements, when settlement of a monetary item receivable from or payable to the Group’s foreign operation is neither planned nor likely in the foreseeable future, foreign exchange gains and losses arising from such a monetary item are considered to form part of a net investment in a foreign operation and are reclassified to other comprehensive income and accumulated under foreign currency translation reserve in equity. Upon disposal of the investment, the cumulative exchange differences previously recorded in equity are recognised in the consolidated profit or loss.
2.21 Borrowing costs and foreign currency exchange differences relating to projects-in-progress
Borrowing costs which are directly attributable to the acquisition, construction or production of qualifying assets, which are assets that necessarily take a substantial period of time to be prepared for their intended use or sale, are capitalised as part of the cost of those assets.
The capitalisation of borrowing costs as part of the cost of a qualifying asset commences when expenditure for the asset is being incurred, borrowing costs are being incurred and activities that are necessary to prepare the asset for its intended use or sale are in progress. Capitalisation of borrowing costs ceases when all activities necessary to prepare the qualifying asset for its intended use or sale are completed.
The capitalisation rate used to determine the amount of borrowing costs eligible for capitalisation is the weighted average of the borrowing costs applicable to borrowings that are outstanding during the period, other than borrowings made specifically for the purpose of financing a specific qualifying asset, in which case the actual borrowing cost incurred on that borrowing less any investment income on the temporary investment of that borrowings, will be capitalised.
Exchange differences arising from foreign currency borrowings, although regarded as an adjustment to borrowing costs, are not capitalised but instead recognised in the profit or loss in the period in which they arise.
2.22 Revenue
Revenue from sale of oil and gas and their related products are recognised in the profit or loss when the risks and rewards of ownership have been transferred to the buyer.
Revenue from services rendered is recognised in the profit or loss based on actual and estimates of work done in respect of services rendered for long term project management contracts. Work done is measured based on internal certification of project activities. Full provision is made for any foreseeable losses.

PETRONAS ANNUAL REPORT PE 2011152
2. SIGNIFICANT ACCOUNTING POLICIES (continued)
2.22 Revenue (continued)
Revenue arising from shipping activities are mainly from freight income and charter income. Freight income and the relevant discharged costs of cargoes loaded onto vessels up to the reporting date are accrued for in the profit or loss based on percentage of completion method. Charter income is accrued on time accrual basis.
Revenue from property development activities is recognised based on the stage of completion measured by reference to the proportion that property development costs incurred for work performed to-date, bear to the estimated total property development costs. Where the financial outcome of a property development activity cannot be reliably estimated, property development revenue is recognised only to the extent of property development costs incurred that is probable will be recoverable, and property development costs on the development units sold are recognised as an expense in the period in which they are incurred. Any expected loss on a development project, including costs to be incurred over the defects liability period, is recognised immediately in the profit or loss.
Revenue arising from assets yielding interest is recognised on a time proportion basis that takes into account the effective yield on the assets.
Revenue arising from investments yielding dividend is recognised when the shareholders’ right to receive payment is established.
2.23 Financing costs
Financing costs comprise interest payable on borrowings and profit share margin on Islamic Financing Facilities, as well as accretion in provision due to the passage of time.
All interest and other costs incurred in connection with borrowings are expensed as incurred, other than that capitalised in accordance with the accounting policy stated in note 2.21. The interest component of finance lease payments is accounted for in accordance with the policy set out in note 2.7.
2.24 Operating segments
An operating segment is a component of the Group that engages in business activities from which it may earn revenues and incur expenses, including revenues and expenses that relate to transactions with any of the Group’s other component. An operating segment’s operating results are reviewed regularly by the chief operating decision maker, which in this case is the PETRONAS Executive Committee, to make decision about resources to be allocated to the segment and to assess its performance, and for which discrete financial information is available.

reimagining energyPETRONAS ANNUAL REPORT PE 2011 153
The fair value of property, plant and equipment of subsidiaries acquired during the period is presented on a gross basis, where cost is separately presented from accumulated depreciation and impairment losses.
3. PROPERTY, PLANT AND EQUIPMENT
Acquisition/ Group At (disposal) of Disposals/31.12.2011 1.4.2011 Additions subsidiaries write-offs RM Mil RM Mil RM Mil RM MilAt cost: Freehold land 2,513 20 11 (5)Leasehold land 2,508 8 - (3)Lease properties 1,176 - - -Oil and gas properties 112,092 1,689 (1,470) (1)Buildings 15,751 103 42 (29)Plant and equipment 77,043 1,798 (1,186) (553)Office equipment, furniture and fittings 2,158 62 6 (23)Computer software and hardware 2,317 95 (10) (30)Motor vehicles 522 77 (3) (22)Vessels 30,498 367 - (188)Projects-in-progress - oil and gas properties 53,905 16,146 - (22)- other projects 11,247 6,344 - (181) 311,730 26,709 (2,610) (1,057)
continue to next page
Acquisition/ At Charge for (disposal) of Disposals/ 1.4.2011 the period subsidiaries write-offs RM Mil RM Mil RM Mil RM MilAccumulated depreciation and impairment losses: Freehold land 22 - - -Leasehold land 565 24 - (3)Lease properties 718 50 - -Oil and gas properties 50,530 6,674 (1,019) -Buildings 4,562 334 8 (17)Plant and equipment 43,798 3,281 (1,169) (446)Office equipment, furniture and fittings 1,614 101 7 (18)Computer software and hardware 1,832 136 (7) (22)Motor vehicles 319 38 1 (15)Vessels 13,377 870 - (126)Projects-in-progress - oil and gas properties 2,724 - - -- other projects 94 - - - 120,155 11,508 (2,179) (647)
continue to next page
PETRONAS ANNUAL REPORT PE 2011154
a Includes revision to future cost of decommissioning of oil and gas properties amounting to (RM1,745 million) and corresponding depreciation charges of (RM147 million).
b Includes net transfers of (RM1,621 million) comprising transfer from intangible assets of RM118 million and transfers to assets held for sale of (RM1,253 million), long term receivables of (RM464 million), prepaid lease payments of (RM20 million) and investment properties of (RM2 million).
c Includes net transfers of (RM766 million) comprising transfer from prepaid lease payments of RM5 million and transfers to assets held for sale of (RM569 million) and long term receivables of (RM202 million).
3. PROPERTY, PLANT AND EQUIPMENT (continued)
Transfers/ Translation Group reclass/ exchange At31.12.2011 adjustment difference 31.12.2011 RM Mil RM Mil RM MilAt cost: Freehold land (52) (5) 2,482 Leasehold land (118) 5 2,400 Lease properties 49 (1) 1,224 Oil and gas properties 18,794 2,361 133,465 Buildings (150) (151) 15,566 Plant and equipment 416 509 78,027 Office equipment, furniture and fittings (21) (13) 2,169 Computer software and hardware 57 (57) 2,372 Motor vehicles (6) (24) 544 Vessels (1,893) 1,617 30,401 Projects-in-progress - oil and gas properties (20,748) 791 50,072 - other projects 306 459 18,175 ab (3,366) 5,491 336,897
continued from previous page
Transfers/ Translation Impairment reclass/ exchange At loss adjustment difference 31.12.2011 RM Mil RM Mil RM Mil RM MilAccumulated depreciation and impairment losses: Freehold land - (22) - -Leasehold land - (35) 3 554 Lease properties - 7 (3) 772 Oil and gas properties 6 (126) 1,049 57,114 Buildings 18 (221) (54) 4,630 Plant and equipment 175 (470) 275 45,444 Office equipment, furniture and fittings 2 (14) (9) 1,683 Computer software and hardware 3 (7) (37) 1,898 Motor vehicles 1 8 (9) 343 Vessels 666 (219) 751 15,319 Projects-in-progress - oil and gas properties 19 228 - 2,971 - other projects - (42) - 52 890 ac (913) 1,966 130,780
continued from previous page
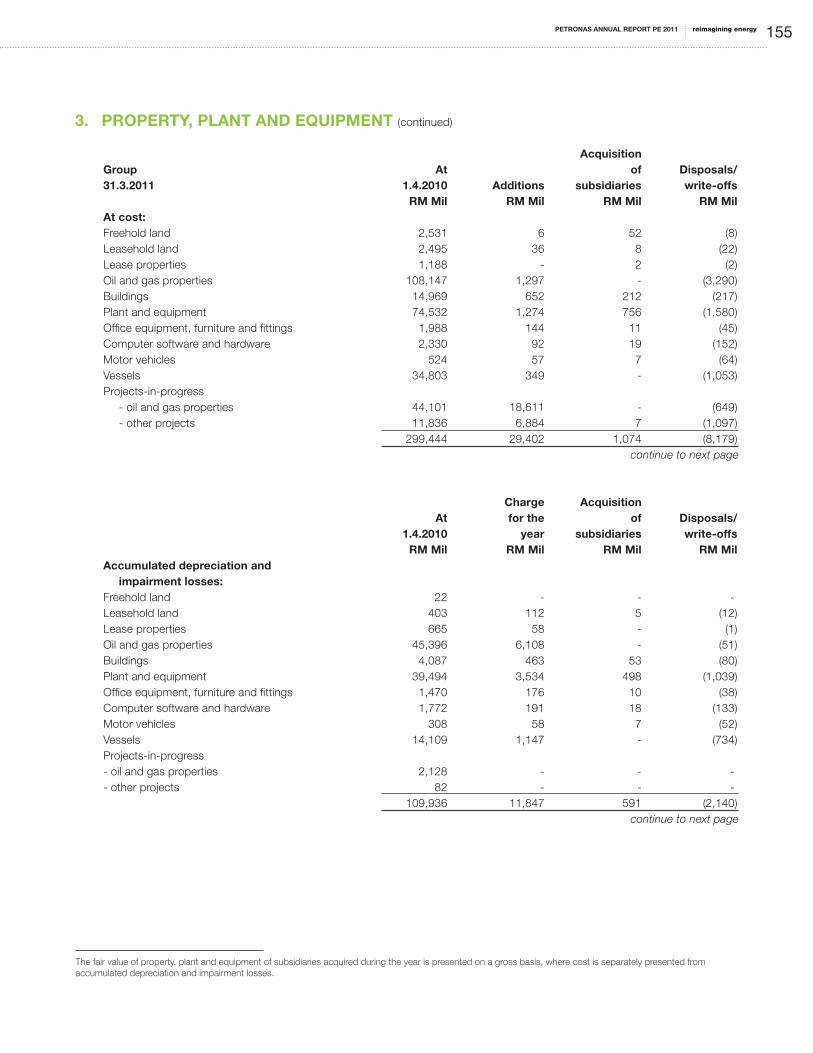
reimagining energyPETRONAS ANNUAL REPORT PE 2011 155
The fair value of property, plant and equipment of subsidiaries acquired during the year is presented on a gross basis, where cost is separately presented from accumulated depreciation and impairment losses.
3. PROPERTY, PLANT AND EQUIPMENT (continued)
Acquisition Group At of Disposals/31.3.2011 1.4.2010 Additions subsidiaries write-offs RM Mil RM Mil RM Mil RM MilAt cost: Freehold land 2,531 6 52 (8)Leasehold land 2,495 36 8 (22)Lease properties 1,188 - 2 (2)Oil and gas properties 108,147 1,297 - (3,290)Buildings 14,969 652 212 (217)Plant and equipment 74,532 1,274 756 (1,580)Office equipment, furniture and fittings 1,988 144 11 (45)Computer software and hardware 2,330 92 19 (152)Motor vehicles 524 57 7 (64)Vessels 34,803 349 - (1,053)Projects-in-progress - oil and gas properties 44,101 18,611 - (649) - other projects 11,836 6,884 7 (1,097) 299,444 29,402 1,074 (8,179)
continue to next page
Charge Acquisition At for the of Disposals/ 1.4.2010 year subsidiaries write-offs RM Mil RM Mil RM Mil RM MilAccumulated depreciation and impairment losses: Freehold land 22 - - -Leasehold land 403 112 5 (12)Lease properties 665 58 - (1)Oil and gas properties 45,396 6,108 - (51)Buildings 4,087 463 53 (80)Plant and equipment 39,494 3,534 498 (1,039)Office equipment, furniture and fittings 1,470 176 10 (38)Computer software and hardware 1,772 191 18 (133)Motor vehicles 308 58 7 (52)Vessels 14,109 1,147 - (734)Projects-in-progress - oil and gas properties 2,128 - - -- other projects 82 - - - 109,936 11,847 591 (2,140)
continue to next page

PETRONAS ANNUAL REPORT PE 2011156
3. PROPERTY, PLANT AND EQUIPMENT (continued)
Transfers/ TranslationGroup reclass/ exchange At31.3.2011 adjustment difference 31.3.2011 RM Mil RM Mil RM MilAt cost: Freehold land (53) (15) 2,513 Leasehold land - (9) 2,508 Lease properties (4) (8) 1,176 Oil and gas properties 8,585 (2,647) 112,092 Buildings 191 (56) 15,751 Plant and equipment 3,723 (1,662) 77,043 Office equipment, furniture and fittings 74 (14) 2,158 Computer software and hardware 47 (19) 2,317 Motor vehicles 2 (4) 522 Vessels (434) (3,167) 30,498 Projects-in-progress - oil and gas properties (7,316) (842) 53,905 - other projects (5,631) (752) 11,247 ab(816) (9,195) 311,730
continued from previous page
Transfers/ Translation Impairment reclass/ exchange At loss adjustment difference 31.3.2011 RM Mil RM Mil RM Mil RM MilAccumulated depreciation and impairment losses: Freehold land - - - 22 Leasehold land 63 - (6) 565 Lease properties - (1) (3) 718 Oil and gas properties 528 (99) (1,352) 50,530 Buildings 72 (14) (19) 4,562 Plant and equipment 2,315 11 (1,015) 43,798 Office equipment, furniture and fittings 3 - (7) 1,614 Computer software and hardware 2 (1) (17) 1,832 Motor vehicles 1 (1) (2) 319 Vessels 529 (286) (1,388) 13,377 Projects-in-progress - oil and gas properties 596 - - 2,724 - other projects 12 - - 94 4,121 ac (391) (3,809) 120,155
continued from previous page
a Includes revision to future cost of decommissioning of oil and gas properties amounting to (RM684 million) and corresponding depreciation charges of (RM73 million).
b Includes net transfers of (RM132 million) comprising transfer from intangible assets of RM2,102 million and transfers to investment properties of (RM1,424 million), assets held for sale of (RM527 million) and other receivables of (RM283 million).
c Includes transfer to assets held for sale of (RM318 million).
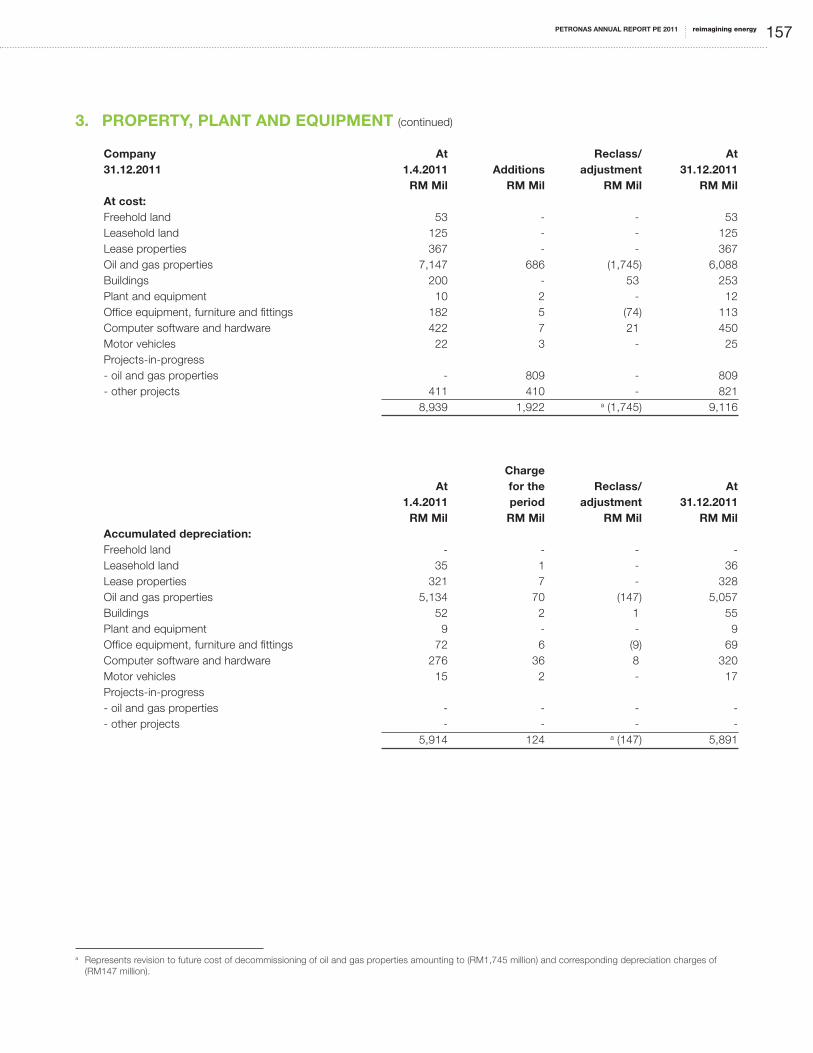
reimagining energyPETRONAS ANNUAL REPORT PE 2011 157
3. PROPERTY, PLANT AND EQUIPMENT (continued)
Company At Reclass/ At31.12.2011 1.4.2011 Additions adjustment 31.12.2011 RM Mil RM Mil RM Mil RM MilAt cost: Freehold land 53 - - 53 Leasehold land 125 - - 125 Lease properties 367 - - 367 Oil and gas properties 7,147 686 (1,745) 6,088 Buildings 200 - 53 253 Plant and equipment 10 2 - 12 Office equipment, furniture and fittings 182 5 (74) 113 Computer software and hardware 422 7 21 450 Motor vehicles 22 3 - 25 Projects-in-progress - oil and gas properties - 809 - 809 - other projects 411 410 - 821 8,939 1,922 a (1,745) 9,116
Charge At for the Reclass/ At 1.4.2011 period adjustment 31.12.2011 RM Mil RM Mil RM Mil RM MilAccumulated depreciation: Freehold land - - - -Leasehold land 35 1 - 36 Lease properties 321 7 - 328 Oil and gas properties 5,134 70 (147) 5,057 Buildings 52 2 1 55 Plant and equipment 9 - - 9 Office equipment, furniture and fittings 72 6 (9) 69 Computer software and hardware 276 36 8 320 Motor vehicles 15 2 - 17 Projects-in-progress - oil and gas properties - - - -- other projects - - - - 5,914 124 a (147) 5,891
a Represents revision to future cost of decommissioning of oil and gas properties amounting to (RM1,745 million) and corresponding depreciation charges of (RM147 million).

PETRONAS ANNUAL REPORT PE 2011158
3. PROPERTY, PLANT AND EQUIPMENT (continued)
Company At Reclass/ At31.3.2011 1.4.2010 Additions Disposals adjustment 31.3.2011 RM Mil RM Mil RM Mil RM Mil RM MilAt cost: Freehold land 53 - - - 53 Leasehold land 127 - (2) - 125 Lease properties 367 - - - 367 Oil and gas properties 7,825 68 - (746) 7,147 Buildings 200 - - - 200 Plant and equipment 10 - - - 10 Office equipment, furniture and fittings 182 2 - (2) 182 Computer software and hardware 408 12 - 2 422 Motor vehicles 16 6 - - 22 Projects-in-progress - other projects 160 257 (6) - 411 9,348 345 (8) (746) 8,939
Charge At for the Reclass/ At 1.4.2010 year Disposals adjustment 31.3.2011 RM Mil RM Mil RM Mil RM Mil RM MilAccumulated depreciation: Freehold land - - - - -Leasehold land 35 1 (1) - 35 Lease properties 311 10 - - 321 Oil and gas properties 4,704 501 - (71) 5,134 Buildings 49 3 - - 52 Plant and equipment 9 - - - 9 Office equipment, furniture and fittings 48 24 - - 72 Computer software and hardware 229 47 - - 276 Motor vehicles 13 2 - - 15 Projects-in-progress - other projects - - - - - 5,398 588 (1) (71) 5,914
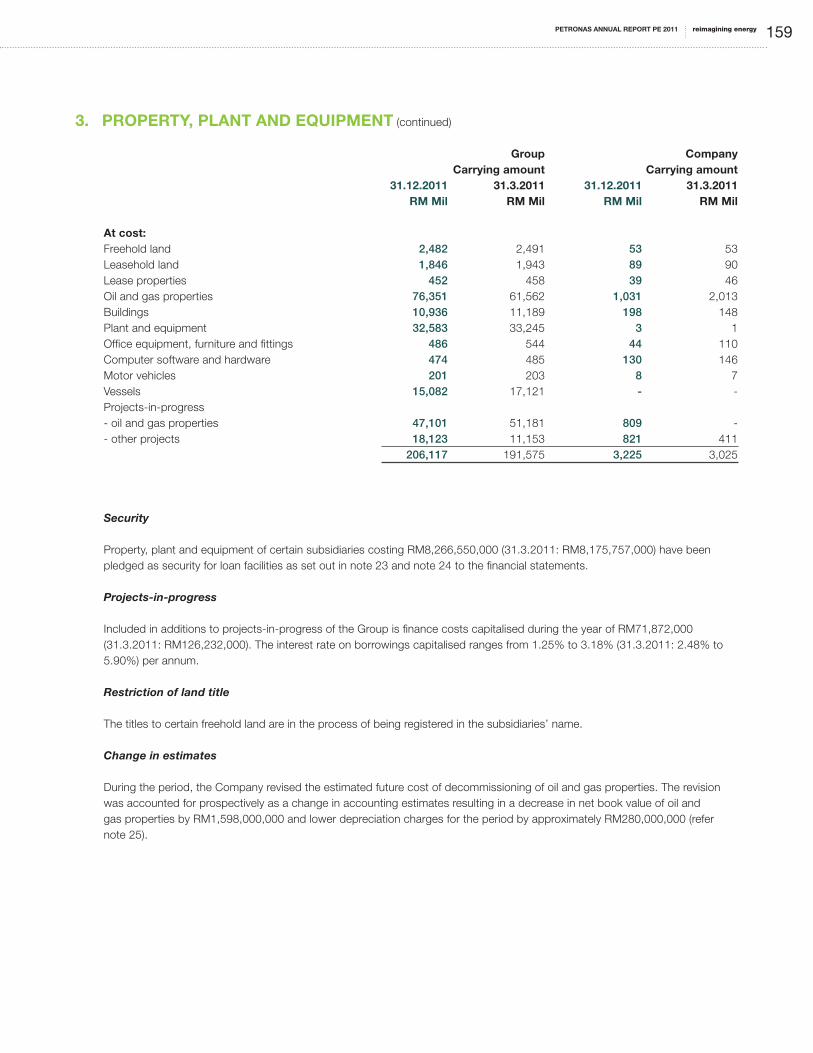
reimagining energyPETRONAS ANNUAL REPORT PE 2011 159
3. PROPERTY, PLANT AND EQUIPMENT (continued) Group Company Carrying amount Carrying amount 31.12.2011 31.3.2011 31.12.2011 31.3.2011 RM Mil RM Mil RM Mil RM Mil At cost: Freehold land 2,482 2,491 53 53 Leasehold land 1,846 1,943 89 90 Lease properties 452 458 39 46 Oil and gas properties 76,351 61,562 1,031 2,013 Buildings 10,936 11,189 198 148 Plant and equipment 32,583 33,245 3 1 Office equipment, furniture and fittings 486 544 44 110 Computer software and hardware 474 485 130 146 Motor vehicles 201 203 8 7 Vessels 15,082 17,121 - -Projects-in-progress - oil and gas properties 47,101 51,181 809 -- other projects 18,123 11,153 821 411 206,117 191,575 3,225 3,025
Security
Property, plant and equipment of certain subsidiaries costing RM8,266,550,000 (31.3.2011: RM8,175,757,000) have been pledged as security for loan facilities as set out in note 23 and note 24 to the financial statements.
Projects-in-progress
Included in additions to projects-in-progress of the Group is finance costs capitalised during the year of RM71,872,000 (31.3.2011: RM126,232,000). The interest rate on borrowings capitalised ranges from 1.25% to 3.18% (31.3.2011: 2.48% to 5.90%) per annum.
Restriction of land title
The titles to certain freehold land are in the process of being registered in the subsidiaries’ name.
Change in estimates
During the period, the Company revised the estimated future cost of decommissioning of oil and gas properties. The revision was accounted for prospectively as a change in accounting estimates resulting in a decrease in net book value of oil and gas properties by RM1,598,000,000 and lower depreciation charges for the period by approximately RM280,000,000 (refer note 25).

PETRONAS ANNUAL REPORT PE 2011160
3. PROPERTY, PLANT AND EQUIPMENT (continued) Estimation of oil and gas reserves
Oil and gas reserves are key elements in the Group and the Company investment decision-making process. They are also an important element in testing for impairment. The term “reserves” describes the recoverable quantity of oil and gas volumes that are commercially viable for development given the prevailing economic situation present at the time of estimation. While it is crucial to know the quantity of these oil and gas reserves to the exact volume, in all cases, oil and gas reserves are only estimates.
Estimation of oil and gas reserves are normally conducted using industry-recognised method. Sufficient availability of key technical information are critical to ensure reserves estimates are technically sound while recognising the existence of uncertainties present in the oil and gas reservoirs. Reserves estimates are normally presented alongside the range of level of certainties namely the P1 (proved reserves; high level of certainty), P2 (probable reserves; mean level of certainty) and P3 (possible reserves; low level of certainty). The level of certainties depends on the availability and understanding of the geological and reservoir data available at the time of estimation and is normally represented in the form of probability distribution.
The Group adopts the 2P (or P1 + P2) reserves estimation approach for its reporting and investment decision making purposes. This approach is in line with the general industry-wide application supported by the Society of Petroleum Engineers (SPE), World Petroleum Congress (WPC) and Society of Petroleum Evaluators and Estimators (SPEE).
The reserves are further subdivided into developed and undeveloped categories. Developed reserves are reserves expected to be recovered through existing wells and facilities under the operating conditions that have been designed for. Whereas the undeveloped reserves are reserves to be recovered from approved and sanctioned projects and remain so until the wells are drilled and completed and ready for production which would by then be classified as developed.
In the annual reporting, these reserves may be revised based on new data that may become available (e.g. additional wells, actual production) or changes in economic parameters (e.g. cost, oil prices). These changes will eventually affect the financial and accounting measures such as the standardised measure of discounted cash flow, depreciation and amortisation charges and decommissioning provisions. Ultimately, these changes will also affect profit.
Impairment
As at 31 December 2011, the Group recognised net impairment losses on certain property, plant and equipment amounting to RM890,000,000 (31.3.2011: RM4,121,000,000). In arriving at the impairment loss amount, the carrying amount of each impaired cash generating unit is compared with the recoverable amount of the cash generating unit.
The recoverable amount is determined from the value in use calculations, using cash flow projections. The Group uses a range of long term assumptions including prices, volumes, margins and costs based on past performance and management’s expectations of market development. The projected cash flows were discounted using a discount rate between 9% and 10% (31.3.2011: 9% and 10%).

reimagining energyPETRONAS ANNUAL REPORT PE 2011 161
4. INVESTMENT PROPERTIES
Translation Group At exchange At 31.12.2011 1.4.2011 Additions Disposal Transfers difference 31.12.2011 RM Mil RM Mil RM Mil RM Mil RM Mil RM MilAt cost: Freehold land 1,104 - (1) 69 - 1,172 Buildings 10,404 7 (8) 1,409 11 11,823 Projects-in-progress 1,680 731 (12) (1,437) - 962
13,188 738 (21) a 41 11 13,957
Translation At Charge for exchange At 1.4.2011 the period Disposal Transfers difference 31.12.2011 RM Mil RM Mil RM Mil RM Mil RM Mil RM MilAccumulated depreciation: Freehold land - - - - - -Buildings 2,627 305 (3) (3) 7 2,933 Projects-in-progress - - - - - -
2,627 305 (3) b (3) 7 2,933
Translation At exchange At 31.3.2011 1.4.2010 Additions Disposal Transfers difference 31.3.2011 RM Mil RM Mil RM Mil RM Mil RM Mil RM MilAt cost: Freehold land 1,116 3 (152) 137 - 1,104 Buildings 9,968 616 (164) 1 (17) 10,404 Projects-in-progress - 396 (27) 1,311 - 1,680 11,084 1,015 (343) c 1,449 (17) 13,188
Translation At Charge for exchange At 1.4.2010 the year Disposal Transfers difference 31.3.2011 RM Mil RM Mil RM Mil RM Mil RM Mil RM MilAccumulated depreciation: Freehold land - - - - - -Buildings 2,294 364 (22) - (9) 2,627 Projects-in-progress - - - - - - 2,294 364 (22) - (9) 2,627
a Comprises transfers from land held for development of RM37 million, property development cost of RM11 million and property, plant and equipment of RM2 million and transfer to asset held for sale of (RM9 million).
b Comprises transfer to assets held for sale of (RM3 million).c Comprises transfers from property, plant and equipment of RM1,424 million and land held for development of RM25 million.
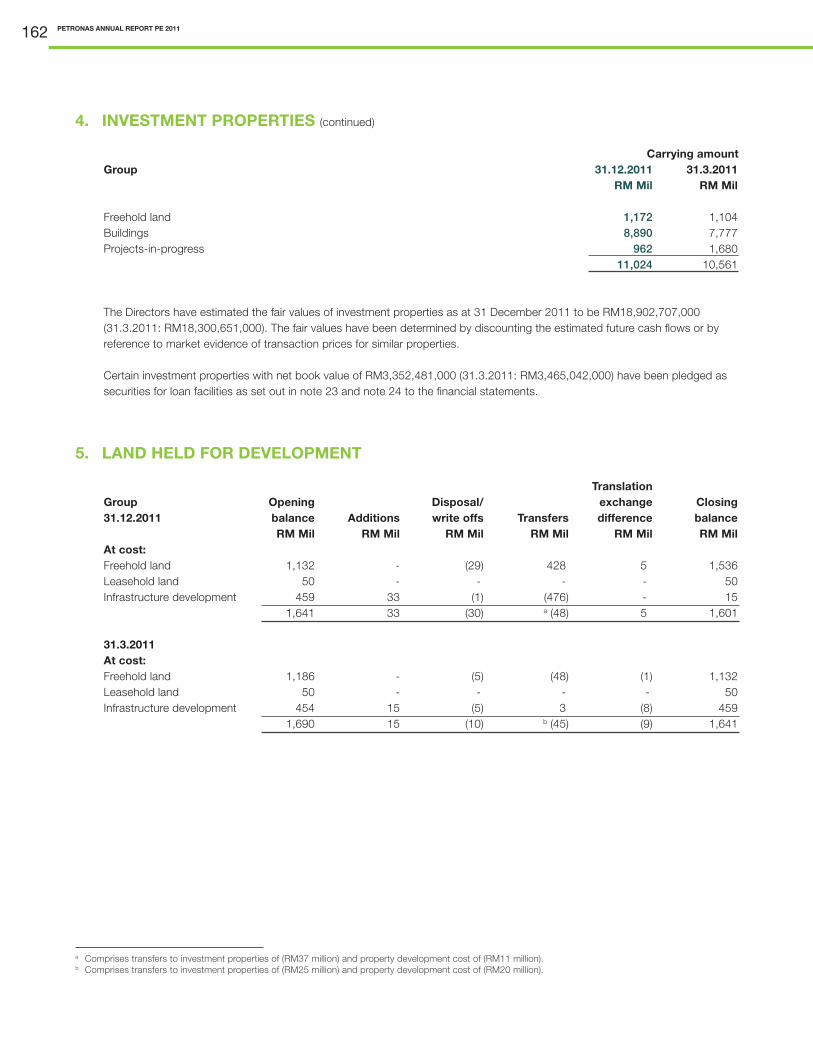
PETRONAS ANNUAL REPORT PE 2011162
4. INVESTMENT PROPERTIES (continued)
Carrying amountGroup 31.12.2011 31.3.2011 RM Mil RM Mil Freehold land 1,172 1,104 Buildings 8,890 7,777 Projects-in-progress 962 1,680 11,024 10,561
The Directors have estimated the fair values of investment properties as at 31 December 2011 to be RM18,902,707,000 (31.3.2011: RM18,300,651,000). The fair values have been determined by discounting the estimated future cash flows or by reference to market evidence of transaction prices for similar properties.
Certain investment properties with net book value of RM3,352,481,000 (31.3.2011: RM3,465,042,000) have been pledged as securities for loan facilities as set out in note 23 and note 24 to the financial statements.
5. LAND HELD FOR DEVELOPMENT
Translation Group Opening Disposal/ exchange Closing 31.12.2011 balance Additions write offs Transfers difference balance RM Mil RM Mil RM Mil RM Mil RM Mil RM MilAt cost: Freehold land 1,132 - (29) 428 5 1,536 Leasehold land 50 - - - - 50 Infrastructure development 459 33 (1) (476) - 15 1,641 33 (30) a (48) 5 1,601
31.3.2011 At cost: Freehold land 1,186 - (5) (48) (1) 1,132 Leasehold land 50 - - - - 50 Infrastructure development 454 15 (5) 3 (8) 459 1,690 15 (10) b (45) (9) 1,641
a Comprises transfers to investment properties of (RM37 million) and property development cost of (RM11 million).b Comprises transfers to investment properties of (RM25 million) and property development cost of (RM20 million).

reimagining energyPETRONAS ANNUAL REPORT PE 2011 163
6. PREPAID LEASE PAYMENTS
Transfers from/(to) property, Translation Group At plant and exchange At 31.12.2011 1.4.2011 Additions equipment difference 31.12.2011 RM Mil RM Mil RM Mil RM Mil RM MilAt cost: Leasehold land - long lease 89 16 27 - 132- short lease 58 - - - 58Prepaid rental 630 54 (7) - 677 777 70 20 - 867
Transfer to Charge for property, Translation At the plant and exchange At 1.4.2011 period equipment difference 31.12.2011 RM Mil RM Mil RM Mil RM Mil RM MilAccumulated amortisation and impairment losses: Leasehold land - long lease 7 2 - - 9- short lease 26 2 - - 28Prepaid rental 193 17 (5) - 205 226 21 (5) - 242
Translation At exchange At 31.3.2011 1.4.2010 Additions Transfers difference 31.3.2011 RM Mil RM Mil RM Mil RM Mil RM MilAt cost: Leasehold land - long lease 75 14 - - 89- short lease 55 3 - - 58 Prepaid rental 598 33 - (1) 630 728 50 - (1) 777
Translation At Charge for exchange At 1.4.2010 the year Transfers difference 31.3.2011 RM Mil RM Mil RM Mil RM Mil RM MilAccumulated amortisation and impairment losses: Leasehold land - long lease 6 1 - - 7- short lease 24 2 - - 26Prepaid rental 171 22 - - 193 201 25 - - 226

PETRONAS ANNUAL REPORT PE 2011164
6. PREPAID LEASE PAYMENTS (continued)
Carrying amountGroup 31.12.2011 31.3.2011 RM Mil RM MilLeasehold land - long lease 123 82- short lease 30 32Prepaid rental 472 437 625 551
Restrictions of land title
The title to certain leasehold land is in the process of being registered in the subsidiary’s name. Certain long term leasehold land of the Group cannot be disposed of, charged or sub-leased without the prior consent of the relevant authority.
7. INVESTMENTS IN SUBSIDIARIES
Company 31.12.2011 31.3.2011 RM Mil RM MilInvestments at cost - quoted shares - in Malaysia 16,284 16,284 - unquoted shares 25,107 24,117 Fair value adjustments on loans and advances and financial guarantee 6,044 6,325 47,435 46,726 Less: Impairment losses - unquoted shares (956) (948) 46,479 45,778 Market value of quoted shares 77,380 84,756
Details of significant subsidiaries are stated in note 45 to the financial statements.
8. INVESTMENTS IN ASSOCIATES
Group Company 31.12.2011 31.3.2011 31.12.2011 31.3.2011 RM Mil RM Mil RM Mil RM MilInvestments at cost - quoted shares - in Malaysia 256 256 302 302 - unquoted shares 2,622 2,512 - -Share of post-acquisition profits and reserves 2,593 3,029 - - 5,471 5,797 302 302 Less: Impairment losses - unquoted shares (90) (72) - - 5,381 5,725 302 302 Market value of quoted shares 867 852 867 852

reimagining energyPETRONAS ANNUAL REPORT PE 2011 165
8. INVESTMENTS IN ASSOCIATES (continued)
Group Company 31.12.2011 31.3.2011 31.12.2011 31.3.2011 RM Mil RM Mil RM Mil RM MilSummary of financial information on associates: Total assets (100%) 25,464 25,320 1,013 1,021 Total liabilities (100%) (13,971) (13,092) (137) (176)Revenue (100%) 10,351 12,659 485 455 Profit (100%) 2,156 4,512 181 150 Contingent liabilities: Guarantees extended to third parties (3,444) (3,757) - (2)
Details of significant associates are stated in note 46 to the financial statements.
9. INVESTMENTS IN JOINTLY CONTROLLED ENTITIES
Group Company 31.12.2011 31.3.2011 31.12.2011 31.3.2011 RM Mil RM Mil RM Mil RM Mil Investments at cost - unquoted shares 4,166 4,116 677 677 Fair value adjustments on loans and advances and financial guarantee 1,437 1,275 717 717 Share of post-acquisition profits and reserves 1,382 492 - - 6,985 5,883 1,394 1,394 Less: Impairment losses (43) (47) (9) (9) 6,942 5,836 1,385 1,385 Summary of financial information on jointly controlled entities: Total assets (100%) 18,558 18,038 3,831 3,875 Total liabilities (100%) (12,105) (11,733) (2,098) (2,139)Revenue (100%) 4,427 3,091 316 615 Profit (100%) 1,031 592 57 249 Contingent liabilities: Guarantees extended to third parties - (2) - (2)
The Group’s share of the current period and cumulative losses of certain jointly controlled entities amounting to RM18,562,000 (31.3.2011: RM3,383,000) and RM172,923,000 (31.3.2011: RM154,361,000) respectively have not been recognised in the Group’s profit or loss as equity accounting has ceased when the Group’s share of losses of these jointly controlled entities exceeded the carrying amount of its investment in these jointly controlled entities. The investments in these jointly controlled entities have been fully impaired in the respective companies’ financial statements.
Details of significant jointly controlled entities are stated in note 47 to the financial statements.

PETRONAS ANNUAL REPORT PE 2011166
10. INTANGIBLE ASSETS Group At Disposal/ Transfer/31.12.2011 1.4.2011 Additions write-offs ReclassAt cost: RM Mil RM Mil RM Mil RM MilGoodwill 6,436 - - -Exploration expenditure 7,799 8,024 (341) 98 Other intangible assets 4,131 254 (52) (216) 18,366 8,278 (393) a (118) continue to next page At Charge for Disposal/ Accumulated amortisation 1.4.2011 the period write-offs Reclass and impairment losses: RM Mil RM Mil RM Mil RM MilGoodwill 542 - - -Exploration expenditure 965 - - 35 Other intangible assets 1,470 282 (43) (35) 2,977 282 (43) - continue to next page
At Disposal/31.3.2011 1.4.2010 Additions write-offs Transfer At cost: RM Mil RM Mil RM Mil RM MilGoodwill 6,551 - (28) (792)Exploration expenditure 9,521 3,637 (2,777) (2,200)Other intangible assets 2,309 549 (50) 794 18,381 4,186 (2,855) b (2,198) continue to next page
At Charge for Disposal/ ImpairmentAccumulated amortisation 1.4.2010 the year write-offs loss and impairment losses: RM Mil RM Mil RM Mil RM MilGoodwill 191 - - 351 Exploration expenditure 121 - (121) 965 Other intangible assets 1,147 305 (11) 47 1,459 305 (132) 1,363 continue to next page
a Comprises transfer to property, plant and equipment of (RM118 million).b Comprises transfers to property, plant and equipment of (RM2,102 million) and assets held for sale of (RM96 million).

reimagining energyPETRONAS ANNUAL REPORT PE 2011 167
10. INTANGIBLE ASSETS (continued)
Acquisition/ Translation Group (disposal) of exchange At31.12.2011 subsidiaries difference 31.12.2011At cost: RM Mil RM Mil RM MilGoodwill (325) 27 6,138 Exploration expenditure (55) 382 15,907 Other intangible assets - (40) 4,077 (380) 369 26,122 continued from previous page Impairment Acquisition/ Translation loss/ (disposal) of exchange AtAccumulated amortisation (write-back) subsidiaries difference 31.12.2011 and impairment losses: RM Mil RM Mil RM Mil RM MilGoodwill 25 (341) (4) 222 Exploration expenditure 688 - 4 1,692 Other intangible assets (47) - (23) 1,604 666 (341) (23) 3,518 continued from previous page
Translation Acquisition of exchange At 31.3.2011 subsidiaries difference 31.3.2011At cost: RM Mil RM Mil RM MilGoodwill 442 263 6,436 Exploration expenditure - (382) 7,799 Other intangible assets 569 (40) 4,131 1,011 (159) 18,366 continued from previous page Translation Acquisition of exchange At Accumulated amortisation subsidiaries difference 31.3.2011 and impairment losses: RM Mil RM Mil RM MilGoodwill - - 542 Exploration expenditure - - 965 Other intangible assets - (18) 1,470 - (18) 2,977 continued from previous page

PETRONAS ANNUAL REPORT PE 2011168
10. INTANGIBLE ASSETS (continued)
Carrying Amount 31.12.2011 31.3.2011 RM Mil RM MilGroup Goodwill 5,916 5,894 Exploration expenditure 14,215 6,834 Other intangible assets 2,473 2,661 22,604 15,389
Impairment review of goodwill
For the purpose of impairment testing, goodwill is allocated to groups of cash-generating units which represent the lowest level within the Group at which the goodwill is monitored for internal management purposes.
In assessing whether goodwill has been impaired, the carrying amount of the cash-generating unit (including goodwill) is compared with the recoverable amount of the cash-generating unit. The recoverable amount is the higher of fair value less costs to sell and value in use. In the absence of any information about the fair value of a cash-generating unit, the value in use is deemed to be the recoverable amount.
Included in goodwill is an amount of RM3,986,000,000 (31.3.2011: RM3,986,000,000) arising from the acquisition of PETRONAS Lubricants Italy S.p.A Group (“PLI Group”). The recoverable amount of PLI Group unit was based on its value in use and was determined with the assistance of independent valuers. The value in use was determined by using the discounted cash flow method based on management’s business plan cash flow projections for 5 financial years from 2012 to 2016, adjusted with an estimated terminal value. The cash flow assumes a long term growth rate of 2.8% (31.3.2011: 2.9%) and is discounted to present value using discount rate of between 8.2% and 9.4% (31.3.2011: 8.1% and 8.4%).
Based on the above, the recoverable amount of the unit was determined to be higher than its carrying amount and therefore, no impairment loss was recognised. The above estimates are sensitive in the following areas:
(i) A decrease of a half percentage point in long term growth rate used would have reduced the recoverable amount by approximately RM318 million but would not result in impairment loss.
(ii) An increase of a one percentage point in discount rate used would have reduced the recoverable amount by approximately RM549 million but would not result in impairment loss.
The value in use of other goodwill is derived from the respective cash-generating units’ business plan cash flow projections for 5 financial years and extrapolated using long term average growth rate of the respective industries those units are engaged in. These cash flows are discounted to present value using discount rate at 9% (31.3.2011: 7% to 9%).
Based on the above, the carrying amount of other goodwill of certain units were determined to be higher than their recoverable amount and impairment losses of RM25,000,000 (31.3.2011: RM351,000,000) was recognised. The impairment loss was allocated to goodwill and is included in administration expenses.

reimagining energyPETRONAS ANNUAL REPORT PE 2011 169
11. LONG TERM RECEIVABLES
Group Company 31.12.2011 31.3.2011 31.12.2011 31.3.2011 RM Mil RM Mil RM Mil RM Mil Term loans and advances: Loans and advances due from subsidiaries - - 65,207 67,151 Term loans due from subsidiaries - - 3,714 3,502 Loans and advances due from associates and jointly controlled entities 1,788 918 - - 1,788 918 68,921 70,653 Derivative assets (note 13) 491 433 1,298 1,663 Other receivables 2,309 2,317 - - 4,588 3,668 70,219 72,316 Less: Impairment losses - Term loans and advances (2) (68) (503) (503)- Other receivables (502) (311) - - 4,084 3,289 69,716 71,813
Included in the Company’s loans and advances due from subsidiaries is an amount of RM46,735,665,000 (31.3.2011: RM44,436,480,000), which bears interest at rates ranging from 2.04% to 7.88% (31.3.2011: 3.10% to 7.88%) per annum.
Included in the Group’s loans and advances due from associates and jointly controlled entities is an amount of RM1,242,935,000 (31.3.2011: RM538,809,000), which bears interest at rates ranging from 0.95% to 10.00% (31.3.2011: 3.22% to 10.00%) per annum.
Term loans due from subsidiaries were on-lending of term loans obtained by the Company, on terms and conditions similar as those of the principal loan agreements entered into by the Company.

PETRONAS ANNUAL REPORT PE 2011170
12. FUND AND OTHER INVESTMENTS
Group Company 31.12.2011 31.3.2011 31.12.2011 31.3.2011 RM Mil RM Mil RM Mil RM MilNon-current Loans and receivables Unquoted securities 715 682 - - Held-to-maturity Malaysian Government Securities 407 - 407 - Corporate Private Debt Securities 2,087 - 2,087 - 2,494 - 2,494 -Available-for-sale Quoted shares - in Malaysia 72 373 - - - outside Malaysia - 10,344 - - Unquoted shares 217 428 76 76 289 11,145 76 76 Less: Impairment losses Unquoted shares (3) (3) - - 286 11,142 76 76 Total non-current investments 3,495 11,824 2,570 76 Current Available-for-sale Quoted shares - in Malaysia 611 284 334 286 - outside Malaysia 9,035 6,731 - - Treasury Bills 16,073 18,450 16,073 18,450 25,719 25,465 16,407 18,736 Fair value through profit or loss Designated upon initial recognition Quoted shares - outside Malaysia - 104 - - Quoted securities - outside Malaysia 964 1,351 964 1,351 Malaysian Government Securities 5,876 6,286 5,814 6,193 Corporate Private Debt Securities 2,115 3,918 4,657 5,045 Negotiable Certificate of Deposits 514 490 514 490 Unquoted securities 195 250 - - Loan Stock - 5 - - 9,664 12,404 11,949 13,079 Total current investments 35,383 37,869 28,356 31,815 Total fund and other investments 38,878 49,693 30,926 31,891 Representing items: At amortised cost 3,338 995 2,570 76 At fair value 35,540 48,698 28,356 31,815 38,878 49,693 30,926 31,891
Included in corporate private debt securities of the Company are securities issued by subsidiaries amounting to RM2,542,000,000 (31.3.2011: RM1,127,000,000).

reimagining energyPETRONAS ANNUAL REPORT PE 2011 171
13. DERIVATIVE ASSETS/LIABILITIES
Group Company 31.12.2011 31.3.2011 31.12.2011 31.3.2011 Note RM Mil RM Mil RM Mil RM MilDerivative assets Non-current Forward foreign exchange contracts 491 433 1,298 1,663 Current Commodity swaps 4 4 - -Forward gas contracts 106 - - -Forward foreign exchange contracts 38 74 16 17 148 78 16 17 Included within: Long term receivables 11 491 433 1,298 1,663 Trade and other receivables 18 148 78 16 17 639 511 1,314 1,680 Derivative liabilities Non-current Interest rate swaps (281) (303) - -Forward foreign exchange contracts - - (208) (164) (281) (303) (208) (164)Current Commodity swaps (4) (51) - -Interest rate swaps (6) (4) - -Forward gas contracts (18) - - -Forward foreign exchange contracts (23) (70) (6) (9)Forward oil price contracts (12) (121) - - (63) (246) (6) (9)Included within: Other long term liabilities and provisions 25 (281) (303) (208) (164)Trade and other payables 26 (63) (246) (6) (9) (344) (549) (214) (173)
Included in the Company’s non-current derivative assets and derivative liabilities are forward foreign exchange contracts entered into with certain subsidiaries in relation to loans due from the subsidiaries amounting to RM807,000,000 (31.3.2011: RM1,230,000,000) and RM208,000,000 (31.3.2011: RM164,000,000) respectively.
In the normal course of business, the Group and the Company enter into derivative financial instruments to manage their normal business exposures in relation to commodity prices, foreign currency exchange rates and interest rates, including management of the balance between floating rate and fixed rate debt, consistent with risk management policies and objectives.
The calculation of fair value for derivative financial instruments depends on the type of instruments. The fair value of interest rate swap agreements are estimated by discounting expected future cash flows using current market interest rates and yield curve over the remaining term of the instrument. The fair value of forward foreign currency exchange contracts is based on the fair value difference between forward exchange rates and the contracted rate. The fair value of commodity swap and commodity forward contracts is based on the fair value difference between market price at the date of measurement and the contracted price.
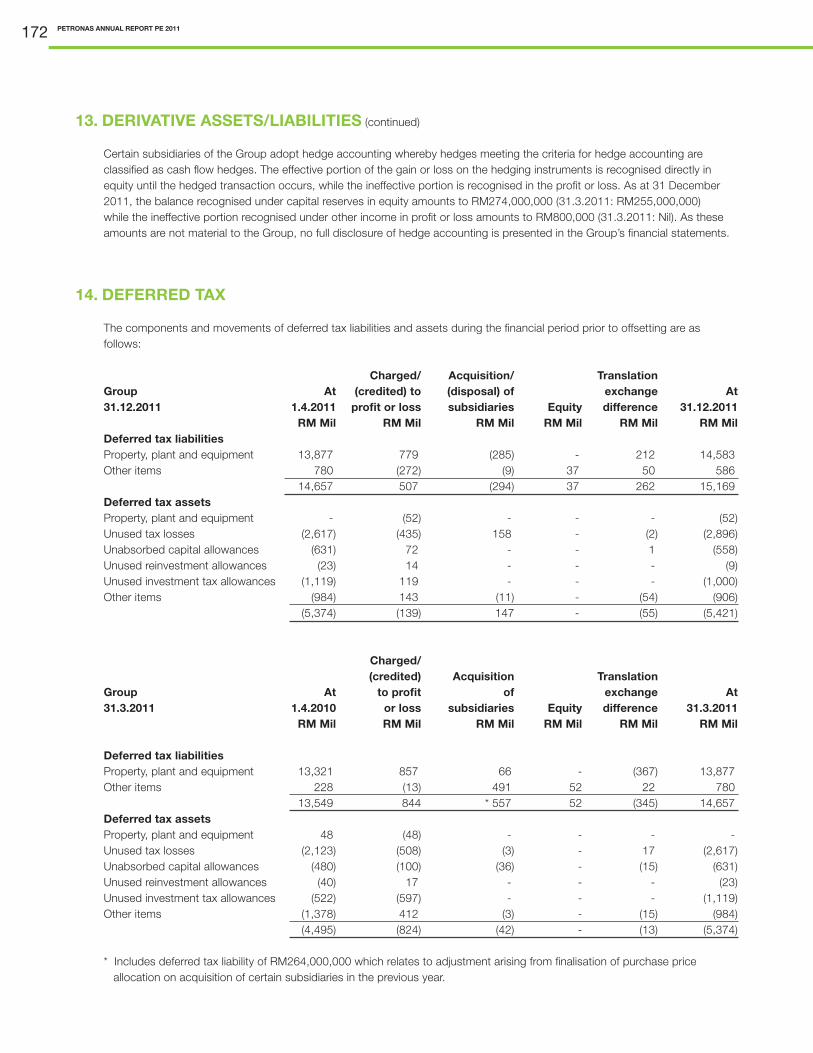
PETRONAS ANNUAL REPORT PE 2011172
13. DERIVATIVE ASSETS/LIABILITIES (continued)
Certain subsidiaries of the Group adopt hedge accounting whereby hedges meeting the criteria for hedge accounting are classified as cash flow hedges. The effective portion of the gain or loss on the hedging instruments is recognised directly in equity until the hedged transaction occurs, while the ineffective portion is recognised in the profit or loss. As at 31 December 2011, the balance recognised under capital reserves in equity amounts to RM274,000,000 (31.3.2011: RM255,000,000) while the ineffective portion recognised under other income in profit or loss amounts to RM800,000 (31.3.2011: Nil). As these amounts are not material to the Group, no full disclosure of hedge accounting is presented in the Group’s financial statements.
14. DEFERRED TAX
The components and movements of deferred tax liabilities and assets during the financial period prior to offsetting are as follows:
Charged/ Acquisition/ Translation Group At (credited) to (disposal) of exchange At31.12.2011 1.4.2011 profit or loss subsidiaries Equity difference 31.12.2011 RM Mil RM Mil RM Mil RM Mil RM Mil RM MilDeferred tax liabilities Property, plant and equipment 13,877 779 (285) - 212 14,583 Other items 780 (272) (9) 37 50 586 14,657 507 (294) 37 262 15,169 Deferred tax assets Property, plant and equipment - (52) - - - (52)Unused tax losses (2,617) (435) 158 - (2) (2,896)Unabsorbed capital allowances (631) 72 - - 1 (558)Unused reinvestment allowances (23) 14 - - - (9)Unused investment tax allowances (1,119) 119 - - - (1,000)Other items (984) 143 (11) - (54) (906) (5,374) (139) 147 - (55) (5,421)
Charged/ (credited) Acquisition TranslationGroup At to profit of exchange At31.3.2011 1.4.2010 or loss subsidiaries Equity difference 31.3.2011 RM Mil RM Mil RM Mil RM Mil RM Mil RM Mil Deferred tax liabilities Property, plant and equipment 13,321 857 66 - (367) 13,877 Other items 228 (13) 491 52 22 780 13,549 844 * 557 52 (345) 14,657 Deferred tax assets Property, plant and equipment 48 (48) - - - -Unused tax losses (2,123) (508) (3) - 17 (2,617)Unabsorbed capital allowances (480) (100) (36) - (15) (631)Unused reinvestment allowances (40) 17 - - - (23)Unused investment tax allowances (522) (597) - - - (1,119)Other items (1,378) 412 (3) - (15) (984) (4,495) (824) (42) - (13) (5,374)
* Includes deferred tax liability of RM264,000,000 which relates to adjustment arising from finalisation of purchase price allocation on acquisition of certain subsidiaries in the previous year.

reimagining energyPETRONAS ANNUAL REPORT PE 2011 173
14. DEFERRED TAX (continued)
Charged/ Opening (credited) to ClosingCompany balance profit or loss balance31.12.2011 RM Mil RM Mil RM Mil
Deferred tax liabilities Property, plant and equipment 29 (25) 4 Others 120 (55) 65 149 (80) 69 Deferred tax assets Unused tax losses (2,210) (383) (2,593)Others (47) 13 (34) (2,257) (370) (2,627)
31.3.2011 Deferred tax liabilities Property, plant and equipment 78 (49) 29Others 14 106 120 92 57 149 Deferred tax assets Unused tax losses (1,717) (493) (2,210)Others (160) 113 (47) (1,877) (380) (2,257)
Deferred tax liabilities and assets are offset when there is a legally enforceable right to set off current tax assets against current tax liabilities and when the deferred taxes relate to the same tax authority. The amounts determined after appropriate offsetting are as follows:
Group Company 31.12.2011 31.3.2011 31.12.2011 31.3.2011 RM Mil RM Mil RM Mil RM MilDeferred tax assets Deferred tax liabilities 809 681 69 149 Deferred tax assets (4,689) (4,656) (2,627) (2,257) (3,880) (3,975) (2,558) (2,108) Deferred tax liabilities Deferred tax liabilities 14,360 13,976 - -Deferred tax assets (732) (718) - - 13,628 13,258 - -
No deferred tax has been recognised for the following items: Group 31.12.2011 31.3.2011 RM Mil RM MilDeductible temporary differences 27 -Unabsorbed capital allowances 1,100 771 Unused tax losses 6,617 3,885 Unused investment tax allowances 1,582 1,863 9,326 6,519

PETRONAS ANNUAL REPORT PE 2011174
14. DEFERRED TAX (continued)
The unabsorbed capital allowances, unused tax losses and unused investment tax allowances do not expire under current tax legislation. Deferred tax assets have not been recognised in respect of these items because it is not probable that future taxable profit will be available against which the Group can utilise the benefits.
The Group and the Company have unused tax losses carried forward of RM18,201,000,000 (31.3.2011: RM14,353,000,000) and RM10,372,000,000 (31.3.2011: RM8,840,000,000) respectively which give rise to the recognised and unrecognised deferred tax assets above.
The Group also has unused investment tax allowances and unused reinvestment allowances of RM5,582,000,000 (31.3.2011: RM6,339,000,000) and RM36,000,000 (31.3.2011: RM92,000,000) respectively, which give rise to the recognised and unrecognised deferred tax assets above.
15. CASH AND CASH EQUIVALENTS
Group Company 31.12.2011 31.3.2011 31.12.2011 31.3.2011 RM Mil RM Mil RM Mil RM MilNon-current Deposits placed: Banks 89 108 - - Current Cash and bank balances 4,084 2,510 2 2 Deposits placed: Banks 114,400 98,850 70,462 54,654 Finance companies 65 42 50 - Other corporations 6,809 5,154 5,094 3,508 125,358 106,556 75,608 58,164 125,447 106,664 75,608 58,164
Included in cash and bank balances of the Group are interest-bearing balances amounting to RM3,595,102,000 (31.3.2011: RM1,901,221,000).
Included in cash and bank balances of the Group are amounts of RM23,222,000 (31.3.2011: RM26,692,000) held pursuant to the requirement of the Housing Development (Housing Development Account) Regulations 2002 and are therefore restricted from use in other operations.
Included in deposits placed with licensed financial institutions of the Group is an amount of RM769,891,000 (31.3.2011: RM1,001,700,000) being deposits held under designated accounts for repayment of term loan and redemption of Islamic Financing Facilities. Deposits held in respect of repayments which are not due within the next 12 months are presented as non-current.

reimagining energyPETRONAS ANNUAL REPORT PE 2011 175
16. PROPERTY DEVELOPMENT COSTS
Costs incurred/ (charged) Reversal of Translation Group Opening during the completed exchange Closing 31.12.2011 balance period/year Transfer projects difference balance RM Mil RM Mil RM Mil RM Mil RM Mil RM Mil
Freehold land 39 - 60 (7) - 92 Development costs 456 120 (21) (103) 1 453 Less: Accumulated costs charged to profit or loss (54) (94) - 110 - (38) 441 26 a 39 - 1 50731.3.2011 Freehold land 22 1 16 - - 39 Development costs 453 68 4 (67) (2) 456Less: Accumulated costs charged to profit or loss (2) (119) - 67 - (54) 473 (50) b 20 - (2) 441
Included in property development costs incurred is finance costs capitalised during the period of RM13,362,000 (31.3.2011: RM11,560,000).
The interest rate on the borrowings capitalised is 3.60% (31.3.2011: 5.77%) per annum.
17. TRADE AND OTHER INVENTORIES
Group Company 31.12.2011 31.3.2011 31.12.2011 31.3.2011 RM Mil RM Mil RM Mil RM Mil Crude oil and condensate 2,329 2,072 - -Petroleum products 4,885 4,885 24 49 Petrochemical products 582 100 - -Liquefied natural gas 883 485 - -Stores, spares and others 2,756 1,809 - -Developed properties held for sale 330 349 - - 11,765 9,700 24 49
a Comprises transfers from land held for development of RM11 million and other receivables of RM49 million and transfers to investment properties of (RM11 million) and inventories of (RM10 million).
b Comprises transfer from land held for development of RM20 million.
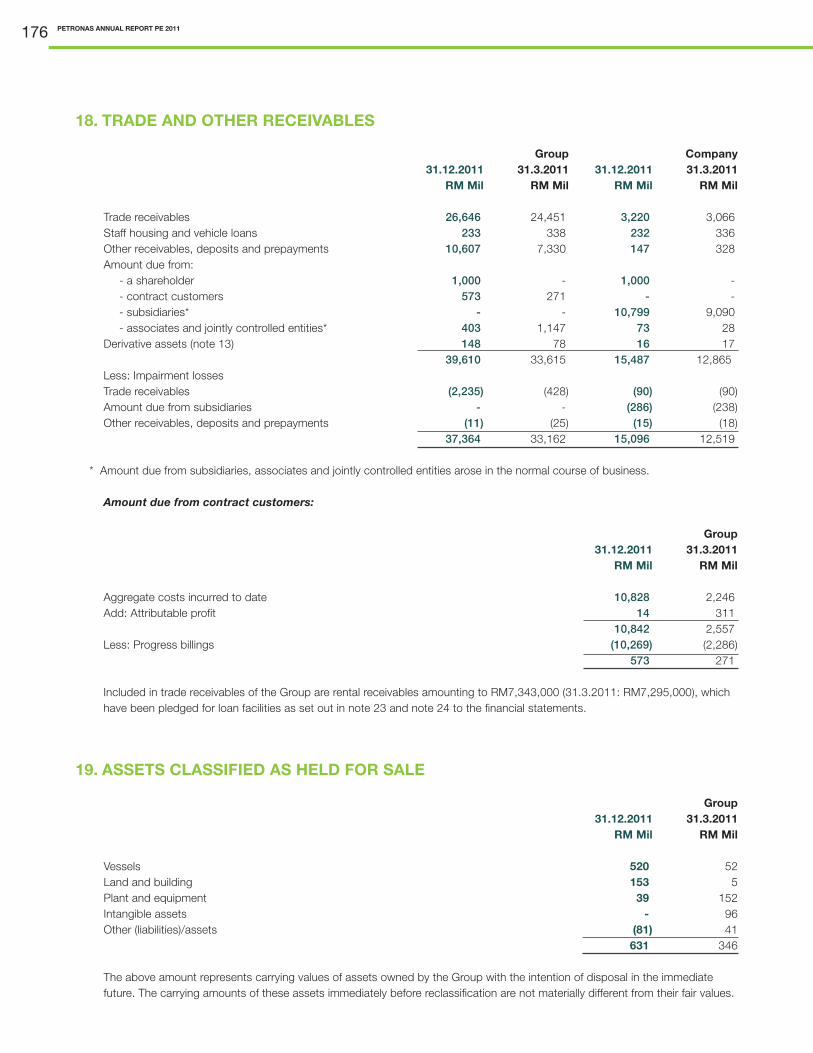
PETRONAS ANNUAL REPORT PE 2011176
18. TRADE AND OTHER RECEIVABLES
Group Company 31.12.2011 31.3.2011 31.12.2011 31.3.2011 RM Mil RM Mil RM Mil RM Mil Trade receivables 26,646 24,451 3,220 3,066 Staff housing and vehicle loans 233 338 232 336 Other receivables, deposits and prepayments 10,607 7,330 147 328 Amount due from: - a shareholder 1,000 - 1,000 - - contract customers 573 271 - - - subsidiaries* - - 10,799 9,090 - associates and jointly controlled entities* 403 1,147 73 28 Derivative assets (note 13) 148 78 16 17 39,610 33,615 15,487 12,865 Less: Impairment losses Trade receivables (2,235) (428) (90) (90)Amount due from subsidiaries - - (286) (238)Other receivables, deposits and prepayments (11) (25) (15) (18) 37,364 33,162 15,096 12,519
* Amount due from subsidiaries, associates and jointly controlled entities arose in the normal course of business.
Amount due from contract customers:
Group 31.12.2011 31.3.2011 RM Mil RM Mil Aggregate costs incurred to date 10,828 2,246 Add: Attributable profit 14 311 10,842 2,557 Less: Progress billings (10,269) (2,286) 573 271
Included in trade receivables of the Group are rental receivables amounting to RM7,343,000 (31.3.2011: RM7,295,000), which have been pledged for loan facilities as set out in note 23 and note 24 to the financial statements.
19. ASSETS CLASSIFIED AS HELD FOR SALE Group 31.12.2011 31.3.2011 RM Mil RM Mil
Vessels 520 52 Land and building 153 5 Plant and equipment 39 152 Intangible assets - 96 Other (liabilities)/assets (81) 41 631 346
The above amount represents carrying values of assets owned by the Group with the intention of disposal in the immediate future. The carrying amounts of these assets immediately before reclassification are not materially different from their fair values.

reimagining energyPETRONAS ANNUAL REPORT PE 2011 177
20. SHARE CAPITAL Company 31.12.2011 31.3.2011 RM Mil RM MilAuthorised: 500,000 ordinary shares of RM1,000 each 500 500 Issued and fully paid: 100,000 ordinary shares of RM1,000 each 100 100
21. RESERVES
Pursuant to Section 84 of the Petroleum (Income Tax) Act 1967, dividends paid out on income derived from petroleum operations are not chargeable to income tax. Subject to agreement by the Inland Revenue Board, the Company has sufficient income derived from petroleum operations, Section 108 tax credit and tax exempt income to distribute all its distributable reserves at 31 December 2011, if paid out as dividends.
The Financial Act, 2007 introduced a single tier company income tax system with effect from year of assessment 2008. As such, the remaining Section 108 tax credit as at 31 December 2011 will be available to the Company until such time the credit is fully utilised or upon expiry of the six-year transitional period on 31 December 2013, whichever is earlier.
Capital Reserves
Capital reserves represent primarily reserves created upon bonus share issuance by subsidiaries, reserves created upon redemption of preference shares and the Group’s share of its associate companies’ reserves.
Foreign Currency Translation Reserve
The foreign currency translation reserve comprises all foreign currency differences arising from the translation of the financial statements of subsidiaries whose functional currencies are different from that of the Group’s presentation currency.
Available-for-sale Reserve
This reserve records the changes in fair value of available-for-sale investments. On disposal or impairment, the cumulative changes in fair value are transferred to the profit or loss.
General Reserve
General reserve represents appropriation of retained profits for general purposes rather than for a specific item of future loss or expense. In effect, it is a reserve for unspecified possible events.
22. NON-CONTROLLING INTERESTS
This consists of the non-controlling interests proportion of share capital and reserves of partly-owned subsidiaries.

PETRONAS ANNUAL REPORT PE 2011178
23. BORROWINGS Group Company 31.12.2011 31.3.2011 31.12.2011 31.3.2011 RM Mil RM Mil RM Mil RM Mil Current Secured Term loans 743 602 - - Islamic financing facilities 300 679 - - Total current secured borrowings 1,043 1,281 - -
Unsecured Term loans 675 536 - - Notes and Bonds 6,357 - 6,357 - Islamic financing facilities 1,137 1,250 - - Revolving credits 2,729 274 - - Bankers’ acceptances - 41 - - Bank overdrafts 908 75 - - Total current unsecured borrowings 11,806 2,176 6,357 -
Total current borrowings 12,849 3,457 6,357 - Non-current Secured Term loans 3,380 2,463 - - Islamic financing facilities 1,863 2,292 - - Total non-current secured borrowings 5,243 4,755 - -
Unsecured Term loans 7,672 8,167 - - Notes and Bonds 19,039 24,195 16,815 22,055 Islamic financing facilities 7,720 7,237 4,797 4,536 Total non-current unsecured borrowings 34,431 39,599 21,612 26,591 Total non-current borrowings 39,674 44,354 21,612 26,591 Total borrowings 52,523 47,811 27,969 26,591
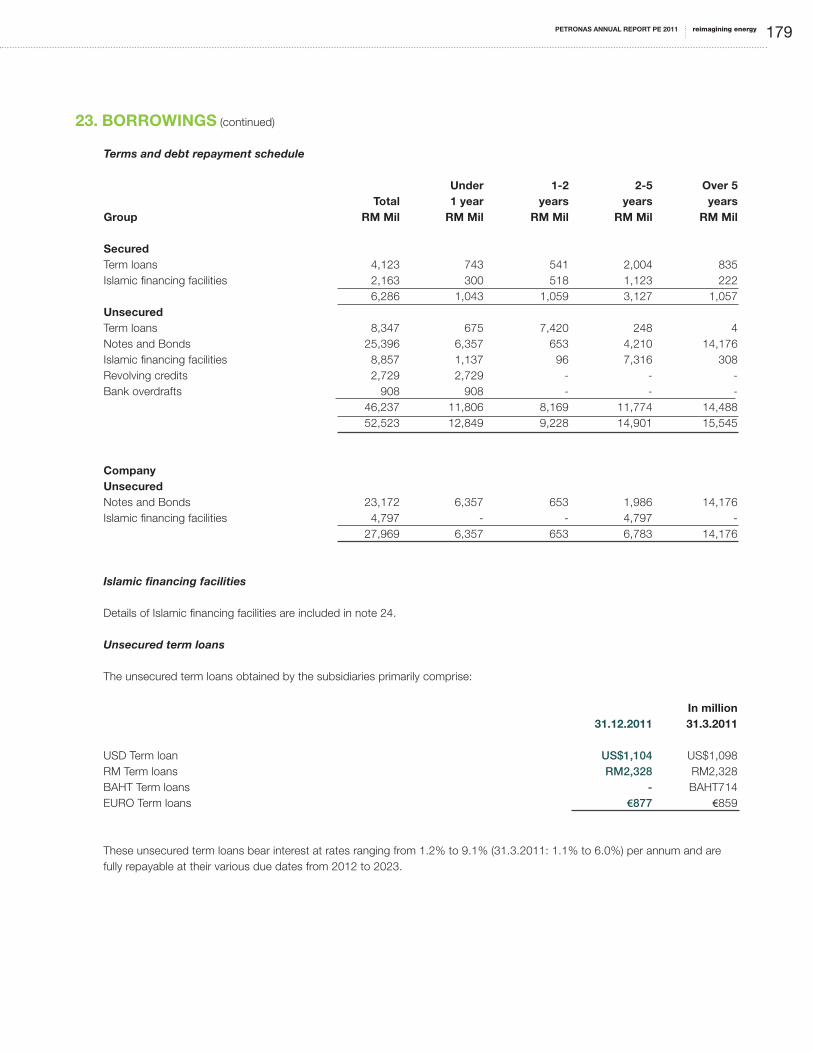
reimagining energyPETRONAS ANNUAL REPORT PE 2011 179
23. BORROWINGS (continued)
Terms and debt repayment schedule
Under 1-2 2-5 Over 5 Total 1 year years years yearsGroup RM Mil RM Mil RM Mil RM Mil RM Mil Secured Term loans 4,123 743 541 2,004 835 Islamic financing facilities 2,163 300 518 1,123 222 6,286 1,043 1,059 3,127 1,057 Unsecured Term loans 8,347 675 7,420 248 4 Notes and Bonds 25,396 6,357 653 4,210 14,176 Islamic financing facilities 8,857 1,137 96 7,316 308 Revolving credits 2,729 2,729 - - -Bank overdrafts 908 908 - - - 46,237 11,806 8,169 11,774 14,488 52,523 12,849 9,228 14,901 15,545
Company Unsecured Notes and Bonds 23,172 6,357 653 1,986 14,176 Islamic financing facilities 4,797 - - 4,797 - 27,969 6,357 653 6,783 14,176
Islamic financing facilities
Details of Islamic financing facilities are included in note 24.
Unsecured term loans
The unsecured term loans obtained by the subsidiaries primarily comprise:
In million 31.12.2011 31.3.2011 USD Term loan US$1,104 US$1,098RM Term loans RM2,328 RM2,328BAHT Term loans - BAHT714 EURO Term loans €877 €859
These unsecured term loans bear interest at rates ranging from 1.2% to 9.1% (31.3.2011: 1.1% to 6.0%) per annum and are fully repayable at their various due dates from 2012 to 2023.
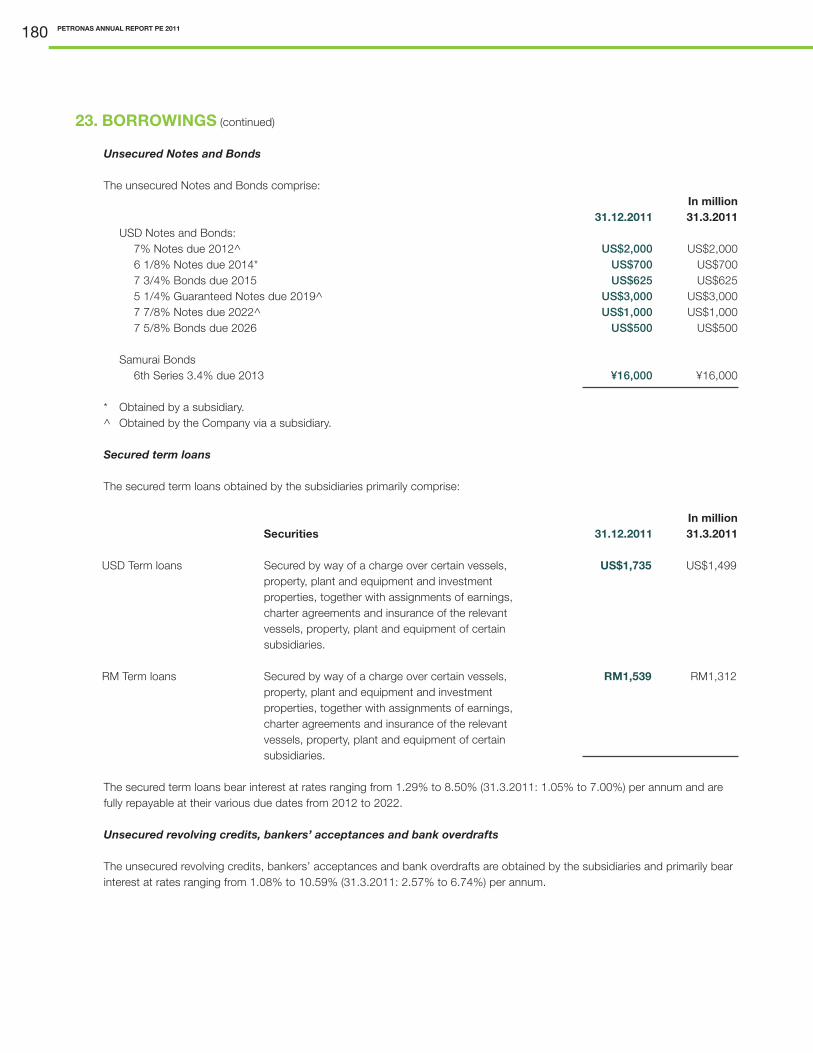
PETRONAS ANNUAL REPORT PE 2011180
23. BORROWINGS (continued)
Unsecured Notes and Bonds
The unsecured Notes and Bonds comprise: In million 31.12.2011 31.3.2011 USD Notes and Bonds: 7% Notes due 2012^ US$2,000 US$2,000 6 1/8% Notes due 2014* US$700 US$700 7 3/4% Bonds due 2015 US$625 US$625 5 1/4% Guaranteed Notes due 2019^ US$3,000 US$3,000 7 7/8% Notes due 2022^ US$1,000 US$1,000 7 5/8% Bonds due 2026 US$500 US$500 Samurai Bonds 6th Series 3.4% due 2013 ¥16,000 ¥16,000 * Obtained by a subsidiary. ^ Obtained by the Company via a subsidiary.
Secured term loans
The secured term loans obtained by the subsidiaries primarily comprise:
In million Securities 31.12.2011 31.3.2011
The secured term loans bear interest at rates ranging from 1.29% to 8.50% (31.3.2011: 1.05% to 7.00%) per annum and are fully repayable at their various due dates from 2012 to 2022.
Unsecured revolving credits, bankers’ acceptances and bank overdrafts
The unsecured revolving credits, bankers’ acceptances and bank overdrafts are obtained by the subsidiaries and primarily bear interest at rates ranging from 1.08% to 10.59% (31.3.2011: 2.57% to 6.74%) per annum.
USD Term loans Secured by way of a charge over certain vessels, property, plant and equipment and investment properties, together with assignments of earnings, charter agreements and insurance of the relevant vessels, property, plant and equipment of certain subsidiaries.
RM Term loans Secured by way of a charge over certain vessels, property, plant and equipment and investment properties, together with assignments of earnings, charter agreements and insurance of the relevant vessels, property, plant and equipment of certain subsidiaries.
US$1,735 US$1,499
RM1,539 RM1,312

reimagining energyPETRONAS ANNUAL REPORT PE 2011 181
23. BORROWINGS (continued) Certain borrowings obtained by the Company are on-lent to subsidiaries, associates and jointly controlled entities. At the reporting date, the outstanding amounts on-lent to subsidiaries are as follows:
Company 31.12.2011 31.3.2011 RM Mil RM Mil Subsidiaries - repayable after twelve months (note 11) 3,714 3,502 In connection with the long term borrowing facility agreements, the Group and the Company have agreed on the following significant covenants with the lenders:
i. not to allow any material indebtedness (the minimum aggregate amount exceeding US$30,000,000 or its equivalent in any other currency) for borrowed money of the Company to become due or capable of being declared due before its stated maturity, any material guarantee of the Company is not discharged at maturity or when validly called or the Company goes into default under, or commits a breach of, any instrument or agreement relating to any such indebtedness for borrowed money or guarantee and such default or breach remains unpaid or unremedied for a period of 30 days;
ii. the Company (not including any of its subsidiaries) not to create, incur or have outstanding any mortgage, pledge, lien,
charge, encumbrance or any other lien upon the whole or any part of its property or assets, present or future indebtedness of itself or any other person, unless the aggregate outstanding principal amount of all such secured indebtedness (other than indebtedness secured by the liens already in existence) plus attributable debt of the Company in respect of sales and leaseback transactions would not exceed 10% of the consolidated net tangible assets; and
iii. the Company (not including any of its subsidiaries) not to enter into any sale and leaseback transaction, unless the
attributable debt in respect of such sale and leaseback transaction and all other sale and leaseback transaction plus the aggregate outstanding principal amount of indebtedness for borrowed money secured by security interests (other than permitted security interests) then outstanding which have not equally and rateably secured the total outstandings would not exceed 10% of the Company’s tangible net worth provided that, within 12 months after such sale and leaseback transaction, it applies to the retirement of indebtedness for borrowed money the repayment obligations in respect of which are at least pari passu with its repayment obligations hereunder and which are not secured by any security interest, an amount equal to the greater of:
• thenetproceedsofthesaleortransferofthepropertyorotherassetswhicharethesubjectofsuchsaleandleasebacktransaction as determined by the Company; or
• thefairmarketvalueofthepropertyorotherassetssoleasedasdeterminedbytheCompany.
24. ISLAMIC FINANCING FACILITIES
Secured Islamic Financing Facilities
The secured Islamic financing facilities obtained by the subsidiaries comprise: RM Mil 31.12.2011 31.3.2011 Al Bai’bithaman Ajil long term facilities 2,410 2,450Bai’ Al-Dayn Note Issuance Facilities 200 399Al Murabahah Medium Term Notes 2,200 2,200

PETRONAS ANNUAL REPORT PE 2011182
24. ISLAMIC FINANCING FACILITIES (continued)
The secured Islamic financing facilities bear a yield payable ranging from 3.4% to 7.2% (31.3.2011: 3.4% to 8.3%) per annum and are fully repayable at their various due dates from 2012 to 2023.
The Islamic financing facilities are secured by way of a charge over certain property, plant and equipment and investment properties.
Unsecured Islamic Financing Facilities
The unsecured Islamic financing facilities obtained by the subsidiaries comprise:
In million 31.12.2011 31.3.2011 Murabahah Note Issuance Facilities RM5,000 RM5,000Sukuk Musyarakah RM2,380 RM1,500Ijarah Muntahiyah Bit Tamleek RM95 RM95Trust Certificates^ US$1,500 US$1,500
^ Obtained by the Company via a subsidiary.
The unsecured Islamic financing facilities bear a yield payable ranging from 3.30% to 6.20% (31.3.2011: 3.08% to 6.20%) per annum and are fully repayable at their various due dates from 2012 to 2021.
The Company has obtained the above Trust Certificates financing via a subsidiary of the Group (referred to as special purpose vehicle or “SPV”). In relation to this financing arrangement, certain subsidiaries sold their beneficial ownership of property, plant and equipment (“sukuk assets”) with a net book value of RM2,526,000,000 (31.3.2011: RM2,710,000,000) to the SPV to hold in trust for and on behalf of the Trust Certificate holders. The SPV then leased this beneficial ownership of the sukuk assets to the Company in accordance with Syariah Principles.
25. OTHER LONG TERM LIABILITIES AND PROVISIONS
Group Company 31.12.2011 31.3.2011 31.12.2011 31.3.2011 RM Mil RM Mil RM Mil RM MilProvision for decommissioning of: - oil and gas properties 16,367 22,517 14,282 20,743 - other property, plant and equipment 229 241 - -Financial guarantees 464 425 647 680 Derivative liabilities (note 13) 281 303 208 164 Others 6,636 1,058 3,606 - 23,977 24,544 18,743 21,587
Provision for decommissioning of oil and gas properties and other property, plant and equipment is recognised when there is an obligation to decommission and remove a facility or an item of property, plant and equipment and to restore the site on which it is located, and when a reasonable estimate of that liability can be made.
The provision recognised is the present value of the estimated future costs determined in accordance with local conditions and requirements net of, in the case of oil and gas properties, amounts received and estimated future funds receivable from contractors pursuant to the terms of the various production sharing contracts that the Company has entered into.
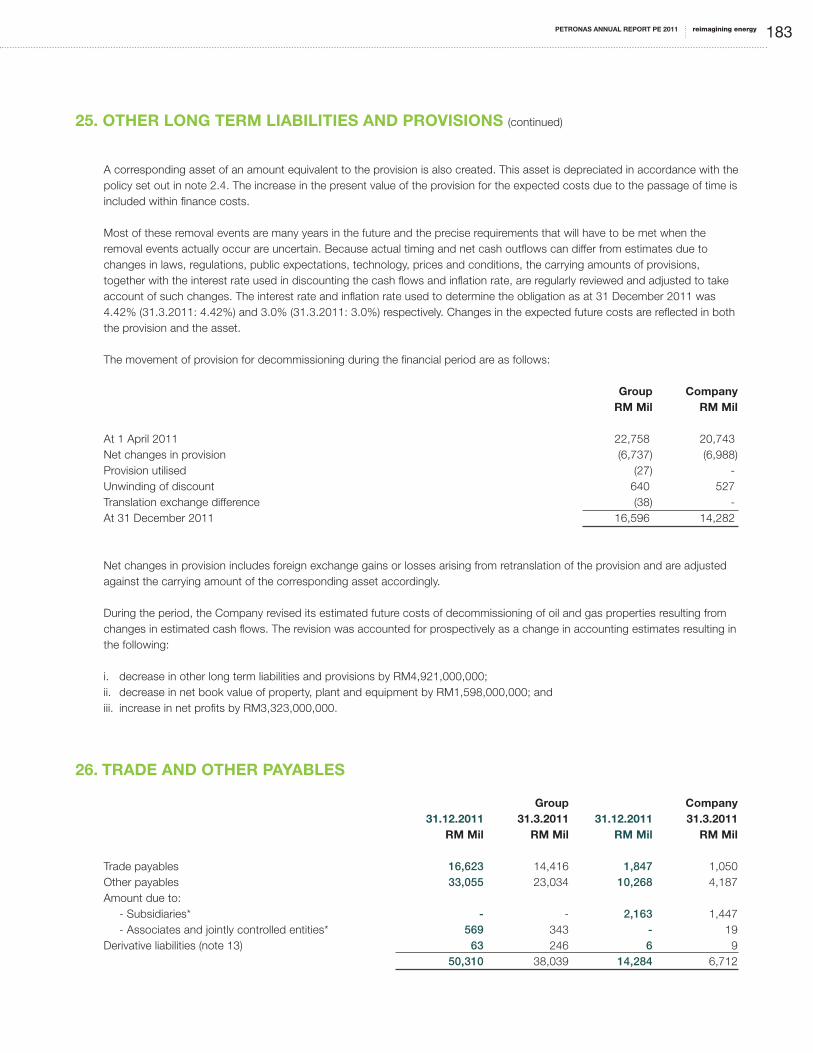
reimagining energyPETRONAS ANNUAL REPORT PE 2011 183
25. OTHER LONG TERM LIABILITIES AND PROVISIONS (continued)
A corresponding asset of an amount equivalent to the provision is also created. This asset is depreciated in accordance with the policy set out in note 2.4. The increase in the present value of the provision for the expected costs due to the passage of time is included within finance costs.
Most of these removal events are many years in the future and the precise requirements that will have to be met when the removal events actually occur are uncertain. Because actual timing and net cash outflows can differ from estimates due to changes in laws, regulations, public expectations, technology, prices and conditions, the carrying amounts of provisions, together with the interest rate used in discounting the cash flows and inflation rate, are regularly reviewed and adjusted to take account of such changes. The interest rate and inflation rate used to determine the obligation as at 31 December 2011 was 4.42% (31.3.2011: 4.42%) and 3.0% (31.3.2011: 3.0%) respectively. Changes in the expected future costs are reflected in both the provision and the asset.
The movement of provision for decommissioning during the financial period are as follows: Group Company RM Mil RM Mil At 1 April 2011 22,758 20,743 Net changes in provision (6,737) (6,988)Provision utilised (27) -Unwinding of discount 640 527 Translation exchange difference (38) -At 31 December 2011 16,596 14,282
Net changes in provision includes foreign exchange gains or losses arising from retranslation of the provision and are adjusted against the carrying amount of the corresponding asset accordingly.
During the period, the Company revised its estimated future costs of decommissioning of oil and gas properties resulting from changes in estimated cash flows. The revision was accounted for prospectively as a change in accounting estimates resulting in the following:
i. decrease in other long term liabilities and provisions by RM4,921,000,000;ii. decrease in net book value of property, plant and equipment by RM1,598,000,000; andiii. increase in net profits by RM3,323,000,000.
26. TRADE AND OTHER PAYABLES Group Company 31.12.2011 31.3.2011 31.12.2011 31.3.2011 RM Mil RM Mil RM Mil RM Mil Trade payables 16,623 14,416 1,847 1,050 Other payables 33,055 23,034 10,268 4,187 Amount due to: - Subsidiaries* - - 2,163 1,447 - Associates and jointly controlled entities* 569 343 - 19 Derivative liabilities (note 13) 63 246 6 9 50,310 38,039 14,284 6,712

PETRONAS ANNUAL REPORT PE 2011184
26. TRADE AND OTHER PAYABLES (continued)
Included in other payables of the Group are security deposits of RM100,361,000 (31.3.2011: RM75,929,000) mainly held in respect of tenancies of a shopping centre and office buildings. These deposits are refundable upon termination of the respective lease agreements.
Also included in trade payables and other payables of the Group are retention sums on construction contracts amounting to RM182,216,000 (31.3.2011: RM188,180,000) and RM36,144,000 (31.3.2011: RM36,201,000) respectively.
* Amount due to subsidiaries, associates and jointly controlled entities arose in the normal course of business.
27. GROSS PROFIT
Group Company 1.4.2011 1.4.2010 1.4.2011 1.4.2010 to to to to 31.12.2011 31.3.2011 31.12.2011 31.3.2011 RM Mil RM Mil RM Mil RM MilRevenue - sales of oil and gas 204,951 222,269 65,698 70,506 - others 5,043 4,227 9,528 7,508 209,994 226,496 75,226 78,014 - rendering of services 2,689 2,914 29 48 - shipping and shipping related services 5,306 6,726 - - - sale and rental of properties 1,746 1,945 - - 9,741 11,585 29 48 - dividend income in Malaysia (Quoted) - subsidiaries - - 2,918 2,190 - associates - - 49 49 - investments 5 13 5 13 in Malaysia (Unquoted) - subsidiaries - - 11,976 14,008 - associates - - 5 263 - investments 26 57 26 57 outside Malaysia (Quoted) - investments 350 285 - - 381 355 14,979 16,580 - interest income 2,681 2,792 1,995 1,898 222,797 241,228 92,229 96,540 Cost of revenue - cost of sales (117,788) (136,189) (35,118) (42,797) - cost of services (8,448) (7,238) - - (126,236) (143,427) (35,118) (42,797) Gross profit 96,561 97,801 57,111 53,743
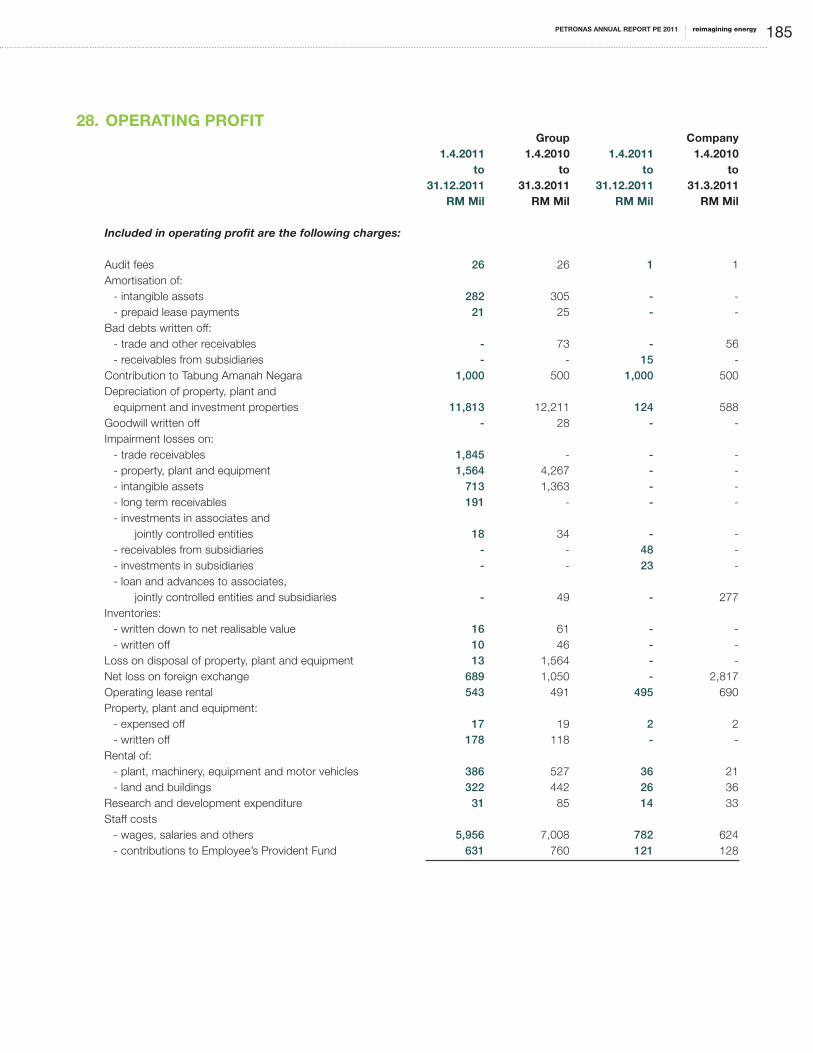
reimagining energyPETRONAS ANNUAL REPORT PE 2011 185
28. OPERATING PROFIT Group Company 1.4.2011 1.4.2010 1.4.2011 1.4.2010 to to to to 31.12.2011 31.3.2011 31.12.2011 31.3.2011 RM Mil RM Mil RM Mil RM Mil Included in operating profit are the following charges:
Audit fees 26 26 1 1 Amortisation of: - intangible assets 282 305 - - - prepaid lease payments 21 25 - -Bad debts written off: - trade and other receivables - 73 - 56 - receivables from subsidiaries - - 15 -Contribution to Tabung Amanah Negara 1,000 500 1,000 500 Depreciation of property, plant and equipment and investment properties 11,813 12,211 124 588 Goodwill written off - 28 - -Impairment losses on: - trade receivables 1,845 - - - - property, plant and equipment 1,564 4,267 - - - intangible assets 713 1,363 - - - long term receivables 191 - - - - investments in associates and jointly controlled entities 18 34 - - - receivables from subsidiaries - - 48 - - investments in subsidiaries - - 23 - - loan and advances to associates, jointly controlled entities and subsidiaries - 49 - 277 Inventories: - written down to net realisable value 16 61 - - - written off 10 46 - -Loss on disposal of property, plant and equipment 13 1,564 - -Net loss on foreign exchange 689 1,050 - 2,817 Operating lease rental 543 491 495 690 Property, plant and equipment: - expensed off 17 19 2 2 - written off 178 118 - -Rental of: - plant, machinery, equipment and motor vehicles 386 527 36 21 - land and buildings 322 442 26 36Research and development expenditure 31 85 14 33 Staff costs - wages, salaries and others 5,956 7,008 782 624 - contributions to Employee’s Provident Fund 631 760 121 128

PETRONAS ANNUAL REPORT PE 2011186
28. OPERATING PROFIT (continued)
Group Company 1.4.2011 1.4.2010 1.4.2011 1.4.2010 to to to to 31.12.2011 31.3.2011 31.12.2011 31.3.2011 RM Mil RM Mil RM Mil RM Mil and credits: Gain on disposal of: - other investment 2,556 - - - - subsidiaries 400 - - - - property, plant and equipment 74 148 - - - associates and jointly controlled entities - 291 - 7,200 Interest income - others 158 164 2,208 2,886 Reversal of write down of inventories to net realisable value 2 12 - -Rental income on land and buildings 173 160 179 130 Write back of impairment losses on: - property, plant and equipment 674 146 - - - intangible assets 47 - - - - investments in associates and jointly controlled entities 4 15 - 84 - receivables from subsidiaries - - - 161 - investments in subsidiaries - - 15 309 - loan and advances to associates, jointly controlled entities and subsidiaries 66 - - - - other receivables 14 168 3 26 Net gain on foreign exchange - - 1,109 -Net gain from subsidiaries' initial public offering - 9,190 - 7,275 Negative goodwill - 51 - -Reversal of contingent payment - 607 - -
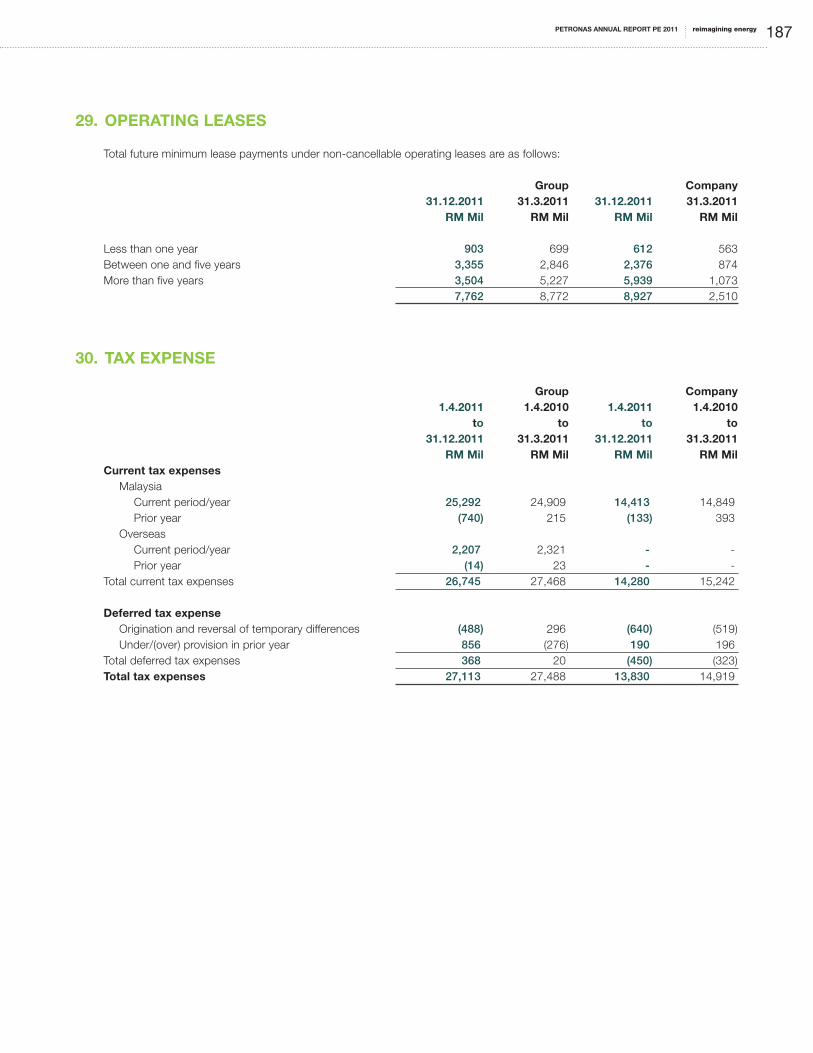
reimagining energyPETRONAS ANNUAL REPORT PE 2011 187
29. OPERATING LEASES
Total future minimum lease payments under non-cancellable operating leases are as follows:
Group Company 31.12.2011 31.3.2011 31.12.2011 31.3.2011 RM Mil RM Mil RM Mil RM Mil Less than one year 903 699 612 563 Between one and five years 3,355 2,846 2,376 874 More than five years 3,504 5,227 5,939 1,073 7,762 8,772 8,927 2,510
30. TAX EXPENSE
Group Company 1.4.2011 1.4.2010 1.4.2011 1.4.2010 to to to to 31.12.2011 31.3.2011 31.12.2011 31.3.2011 RM Mil RM Mil RM Mil RM MilCurrent tax expenses Malaysia Current period/year 25,292 24,909 14,413 14,849 Prior year (740) 215 (133) 393 Overseas Current period/year 2,207 2,321 - - Prior year (14) 23 - -Total current tax expenses 26,745 27,468 14,280 15,242 Deferred tax expense Origination and reversal of temporary differences (488) 296 (640) (519) Under/(over) provision in prior year 856 (276) 190 196 Total deferred tax expenses 368 20 (450) (323)Total tax expenses 27,113 27,488 13,830 14,919

PETRONAS ANNUAL REPORT PE 2011188
30. TAX EXPENSE (continued)
A reconciliation of income tax expense applicable to profit before taxation at the statutory income tax rate to income tax expense at the effective income tax rate of the Group and of the Company is as follows:
1.4.2011 1.4.2010 to to 31.12.2011 31.3.2011 % RM Mil % RM MilGroup Profit before taxation 82,687 90,496 Taxation at Malaysian statutory tax rate 25 20,672 25 22,624 Effect of different tax rates in foreign jurisdictions 1 585 1 992 Effect of different tax rates between corporate income tax and petroleum income tax 8 6,320 5 4,672 Effect of changes in tax rates - 66 - 37 Non deductible expenses, net of non assessable income 1 1,158 5 4,412 Net gain from initial public offering, non assessable income - - (3) (2,298)Tax exempt income (3) (2,639) (3) (2,632)Tax incentives - (58) - (134)Effect of deferred tax benefits not recognised, net of utilisation of deferred tax benefits previously not recognised 1 702 - 88 Foreign exchange translation difference - 205 - (235) 33 27,011 30 27,526Under/(over) provision in prior years 102 (38)Tax expense 27,113 27,488
Company Profit before taxation 54,031 65,391 Taxation at Malaysian statutory tax rate 25 13,508 25 16,348 Effect of different tax rates between corporate income tax and petroleum income tax 10 5,154 7 4,650 (Non assessable income, net of non deductible expenses)/ non deductible expenses, net of non assessable income (2) (1,303) 1 586 Tax exempt income (7) (3,586) (6) (3,635)Net gain from initial public offering, non assessable income (including related gain on disposal) - - (6) (3,619) 26 13,773 21 14,330 Under provision in prior years 57 589 Tax expense 13,830 14,919

reimagining energyPETRONAS ANNUAL REPORT PE 2011 189
31. DIVIDENDS Company 1.4.2011 1.4.2010 to to 31.12.2011 31.3.2011 RM Mil RM MilOrdinary: Final: Tax exempt dividend of RM220,000 (31.3.2011 : RM100,000) per ordinary share under Section 84 of the Petroleum (Income Tax) Act, 1967 in respect of financial year 31 March 2011 (31.3.2011: 31 March 2010) 22,000 10,000
Interim: First tax exempt dividend of RM20,000 (31.3.2011 : RM60,000) per ordinary share under Section 84 of the Petroleum (Income Tax) Act, 1967 in respect of financial period 31 December 2011 (31.3.2011: 31 March 2011) 2,000 6,000 Second tax exempt dividend of RMNil (31.3.2011 : RM80,000) per ordinary share under Section 84 of the Petroleum (Income Tax) Act, 1967 in respect of financial period 31 December 2011 (31.3.2011: 31 March 2011) - 8,000 Third tax exempt dividend of RMNil (31.3.2011 : RM60,000) per ordinary share under Section 84 of the Petroleum (Income Tax) Act, 1967 in respect of financial period 31 December 2011 (31.3.2011: 31 March 2011) - 6,000 24,000 30,000 Proposed: Final: Tax exempt dividend of RM280,000 (31.3.2011: RM220,000) per ordinary share under Section 84 of the Petroleum (Income Tax) Act, 1967 in respect of financial period 31 December 2011 (31.3.2011: 31 March 2011) 28,000 22,000
The proposed tax exempt final dividend under Section 84 of the Petroleum (Income Tax) Act, 1967 of RM280,000 per ordinary share amounting to RM28 billion in respect of the financial period ended 31 December 2011, has not been accounted for in the financial statements.

PETRONAS ANNUAL REPORT PE 2011190
32. NET CASH (USED IN)/GENERATED FROM INVESTING ACTIVITIES
The cash (used in)/generated from investing activities comprise:
Group Company 1.4.2011 1.4.2010 1.4.2011 1.4.2010 to to to to 31.12.2011 31.3.2011 31.12.2011 31.3.2011 RM Mil RM Mil RM Mil RM Mil Acquisition of subsidiaries, net of cash acquired (note 34) (55) (1,180) - -Dividends received 381 355 14,821 15,592 Investment in: - associates, jointly controlled entities and unquoted companies (146) (2,688) - - - securities (3,640) (13,951) (6,085) (13,732)Long term receivables and advances repaid from/(to): - subsidiaries - - 3,243 (5,885) - associates and jointly controlled entities (861) 1,008 - 179 Net cost incurred in property development cost (120) (68) - -Other long term receivables 135 (829) - -Proceeds from disposal of: - investment in subsidiaries, net of cash disposed (note 34) 521 - 39 - - investment in associates and jointly controlled entities - 9 - - - property, plant and equipment, prepaid lease payments and intangible assets 287 3,560 - - - securities and other investment 13,425 2,677 7,220 2,573Purchase of: - property, plant and equipment, prepaid lease payments and intangible assets (30,800) (34,877) (428) (18) - other investments (176) (52) - -Redemption of preference shares in: - subsidiaries - - 68 48 - associates - 80 - 80 Proceeds from initial public offering - 16,773 - 11,144 (21,049) (29,183) 18,878 9,981

reimagining energyPETRONAS ANNUAL REPORT PE 2011 191
33. NET CASH USED IN FINANCING ACTIVITIES The cash used in financing activities comprise:
Group Company 1.4.2011 1.4.2010 1.4.2011 1.4.2010 to to to to 31.12.2011 31.3.2011 31.12.2011 31.3.2011 RM Mil RM Mil RM Mil RM Mil Dividends paid (30,000) (30,000) (30,000) (30,000)Dividends paid to non-controlling interests (6,502) (6,529) - -Drawdown of: - Islamic financing facilities 706 1,193 - - - term loans, notes and bonds 1,172 1,030 - - - revolving credits and bankers’ acceptances 3,805 3,020 - -Repayment of: - Islamic financing facilities (1,477) (1,046) - - - term loans, notes and bonds (635) (984) - - - revolving credits and bankers’ acceptances (1,299) (3,269) - -Payment to non-controlling interests on redemption of shares (36) (28) - -Proceeds from shares issued to non-controlling interests 37 - - - (34,229) (36,613) (30,000) (30,000)
34. SIGNIFICANT ACQUISITIONS AND DISPOSALS
Significant acquisition of assets
On 2 August 2011, the Group acquired 50% participating interest in the shale gas assets in Canada for a total consideration of approximately C$1.07 billion (approximately RM3.57 billion) via a sale and purchase agreement with Progress Energy Resources Corporation (“Progress”). This comprises an initial payment of C$267.5 million (approximately RM892.5 million) and a further payment of up to C$802.5 million (approximately RM2.68 billion) will be paid based on Progress’ share of future capital expenditure.
Significant disposal of assets
On 19 April 2011, the Group via its subsidiary, PETRONAS International Corporation Ltd., disposed its entire 14.9% equity holdings in Cairn India Limited for a total cash consideration of USD2.08 billion (approximately RM6.73 billion), resulting in a net gain on disposal of USD846.8 million (approximately RM2.56 billion).

PETRONAS ANNUAL REPORT PE 2011192
34. SIGNIFICANT ACQUISITIONS AND DISPOSALS (continued)
Acquisition of subsidiaries
During the financial period, the Group acquired several companies for a total purchase consideration of RM62 million. As a result, these companies became subsidiaries of the Group. The net profits contributed by these subsidiaries from the date of acquisition to 31 December 2011 is not material in relation to the consolidated net profit for the period.
The net effect of acquisitions of subsidiaries on the cash flows and fair values of assets and liabilities acquired are as follows: Carrying amount representing fair value
at acquisition date RM Mil Property, plant and equipment 59Cash and cash equivalents 7 Other assets 56 Deferred tax liability (13)Other liabilities (63) 46Add: Goodwill on acquisition 16 Purchase consideration 62 Less: Cash and cash equivalents of subsidiaries acquired (7)Cash flow on acquisition, net of cash acquired (note 32) 55 Disposal of subsidiaries
During the financial period, the Group also disposed several subsidiaries for a total consideration of RM644 million. The net profit contributed by these subsidiaries from 1 April 2011 to the date of disposal is not material in relation to the consolidated net profit of the Group for the period.
The net effect of the above disposals of subsidiaries on the cash flows and carrying amount of assets and liabilities disposed are as follows: Carrying amount
at disposal date RM Mil Property, plant and equipment 490 Intangible assets 55 Cash and cash equivalents 123 Assets classified as held for sale 292 Other assets 80 Deferred tax liability (160)Other liabilities (636) 244 Add: Gain on disposal of subsidiaries 400 Proceeds from disposal of subsidiaries 644 Less: Cash and cash equivalents of subsidiaries disposed (123)Cash flow on disposals, net of cash disposed (note 32) 521

reimagining energyPETRONAS ANNUAL REPORT PE 2011 193
35. COMMITMENTS
Outstanding commitments in respect of capital expenditure at the end of the reporting period not provided for in the financial statements are:
Group Company 31.12.2011 31.3.2011 31.12.2011 31.3.2011 RM Mil RM Mil RM Mil RM Mil Property, plant and equipment Approved and contracted for Less than one year 22,461 10,824 3,523 15 Between one and five years 23,098 16,086 9,229 337 More than five years 221 67 - - 45,780 26,977 12,752 352 Approved but not contracted for Less than one year 21,496 20,027 6,525 17 Between one and five years 153,736 37,338 70,081 23 More than five years - 2,461 - 2,451 175,232 59,826 76,606 2,491 221,012 86,803 89,358 2,843
Share of capital expenditure of joint venture Approved and contracted for Less than one year 11,124 10,401 - - Between one and five years 4,697 6,121 - - 15,821 16,522 - - Approved but not contracted for Less than one year 11,530 5,354 - - Between one and five years 55,177 49,310 - - 66,707 54,664 - - 82,528 71,186 - -Investment in shares Approved and contracted for Less than one year - 79 - - Approved but not contracted for Less than one year - 547 - - - 626 - - Total commitments 303,540 158,615 89,358 2,843

PETRONAS ANNUAL REPORT PE 2011194
36. CONTINGENT LIABILITIES (UNSECURED)
Group Company 31.12.2011 31.3.2011 31.12.2011 31.3.2011 RM Mil RM Mil RM Mil RM Mil Guarantees extended to third parties 285 155 - -Claims filed by/disputes with various parties - 3 - 3 Contingent payments 301 258 - - 586 416 - 3
The Terengganu and Kelantan States Government filed legal suits against the Company in the year 2000 and 2010 respectively claiming that they were entitled to certain cash payments arising out of the production of crude oil and gas beyond the territorial waters of the States concerned. The amount of the cash payments has been fully accounted for in the financial statements. The legal suits are still on-going as at period end.
37. RELATED PARTY DISCLOSURES
Key management personnel compensation Company 1.4.2011 1.4.2010 to to 31.12.2011 31.3.2011 RM Mil RM MilDirectors remuneration: - Fees 2 2- Emoluments 15 15
The estimated monetary value of Directors’ benefits-in-kind is RM183,000 (31.3.2011: RM152,000).
Significant transactions with related parties
For the purpose of these financial statements, parties are considered to be related to the Company if the Company has the ability, directly or indirectly, to control the party or exercise significant influence over the party in making financial and operating decisions, or vice versa. Related parties may be individuals or other entities.

reimagining energyPETRONAS ANNUAL REPORT PE 2011 195
37. RELATED PARTY DISCLOSURES (continued)
Significant transactions with related parties (continued)
In addition to the transactions detailed elsewhere in the financial statements, the Group and the Company had the following transactions with related parties during the financial period/year: 1.4.2011 1.4.2010 to to 31.12.2011 31.3.2011Group RM Mil RM Mil Associate companies: Sales of petrochemical products, processed gas and utilities 2,598 3,795 Lease and rental expenses (222) (247) Other expenses (46) (174) Other income 14 22 Jointly controlled entities: Sales of petrochemical products, processed gas, petroleum products and general merchandise 137 178 Purchase of petrochemical products, processed gas and utilities - (310) Interest receivable from jointly controlled entities 54 91 Gas processing fee payable (244) (279) Other income 323 141 Company Subsidiaries: Sales of crude oil, petroleum products and natural gas 40,434 43,597 Interest receivable from subsidiaries 1,948 2,135 Purchase of crude oil and natural gas (17,803) (18,489) Gas processing fee payable (2,137) (2,747) Research cess 101 107 Supplemental payments 4,377 3,127 Handling and storage fees (23) (41) Associate companies: Sales of processed gas 1,276 1,375 Jointly controlled entities: Interest receivable from jointly controlled entities - 5 Gas processing fee payable (244) (279)

PETRONAS ANNUAL REPORT PE 2011196
37. RELATED PARTY DISCLOSURES (continued)
Significant transactions with related parties (continued)
Information regarding outstanding balances arising from related party transactions as at 31 December 2011 are disclosed in note 11, note 18 and note 26.
Information regarding impairment losses on receivables and bad debts written off during the financial period are disclosed in note 28.
The Directors of the Company are of the opinion that the above transactions have been entered into in the normal course of business and have been established on a commercial basis. The above has been stated at contracted amount.
38. OPERATING SEGMENTS
The Group has four reportable segments, as described below, which offer different products and services and are managed separately because they require different technology and marketing strategies. The following summary describes the operations in each of the Group’s reportable segments:
• ExplorationandProduction-activitiesincludeoilandnaturalgasexploration,developmentandproduction,togetherwithrelated pipeline and transportation activities.
• GasandPower-activitiesincludegasprocessingandmarketingandtradingofliquefiednaturalgas(“LNG”)andsalesgas.
• Downstream-activitiesincludethesupplyandtrading,refining,manufacturing,marketingandtransportationofcrudeoil,petroleum and petrochemical products.
• Corporateandothers-compriseprimarilylogisticandmaritimesegment,propertysegmentandcentraltreasuryfunction.
For each of the reportable segment, the Group chief operating decision maker, which in this case is the PETRONAS Executive Committee, reviews internal management reports at least on a quarterly basis.
Performance is measured based on segment net operating profit after tax (“NOPAT”), which is derived from net profit after tax excluding financing cost, share of profits of associates and jointly controlled entities and other non-operating income and expenses, as included in the internal management reports. Segment NOPAT is used to measure performance as the Executive Committee believes that such information is the most relevant in evaluating the results of the segments.
Segment assets are measured based on total assets (including goodwill) of a segment, as included in the internal management reports and are used to measure the return of assets of each segment.

reimagining energyPETRONAS ANNUAL REPORT PE 2011 197
38. OPERATING SEGMENTS (continued)
Consolidation Exploration Corporate adjustments Group and Gas and and and 31.12.2011 Production Power Downstream Others eliminations Total RM Mil RM Mil RM Mil RM Mil RM Mil RM Mil Revenue Third parties 40,445 55,601 115,816 10,935 - 222,797 Inter-segment 46,547 5,751 1,395 3,685 (57,378) - Total revenue 86,992 61,352 117,211 14,620 (57,378) 222,797 Reportable segment profit/(loss) 36,043 12,558 4,377 (619) (289) 52,070 Included in the measure of segment profit/(loss) are: Depreciation and amortisation (5,984) (1,857) (2,358) (1,917) - (12,116) Impairment losses (3,288) (5) (293) (745) - (4,331) Tax expense (20,095) (4,787) (1,521) (710) - (27,113) Segment assets 155,649 54,183 83,895 204,643 (20,758) 477,612 Included in the measure of segment assets are: Investments in associates and JCEs 3,048 2,285 1,035 5,955 - 12,323 Additions to non-current assets other than financial instruments and deferred tax assets 22,394 5,577 2,475 5,382 - 35,828

PETRONAS ANNUAL REPORT PE 2011198
38. OPERATING SEGMENTS (continued)
Consolidation Exploration Corporate adjustments Group and Gas and and and 31.3.2011 Production Power Downstream Others eliminations Total RM Mil RM Mil RM Mil RM Mil RM Mil RM Mil Revenue Third parties 43,263 57,027 128,466 12,472 - 241,228 Inter-segment 50,010 6,945 1,520 6,730 (65,205) - Total revenue 93,273 63,972 129,986 19,202 (65,205) 241,228 Reportable segment profit 33,969 11,229 7,175 1,385 (1,145) 52,613 Included in the measure of segment profit are: Depreciation and amortisation (5,339) (2,488) (2,687) (2,027) - (12,541) Impairment losses (1,796) (1,898) (1,339) (631) - (5,664) Tax expense (20,116) (4,744) (1,582) (1,046) - (27,488) Segment assets 135,528 60,167 82,085 175,404 (14,190) 438,994 Included in the measure of segment assets are: Investments in associates and JCEs 2,278 4,587 1,018 3,678 - 11,561 Additions to non-current assets other than financial instruments and deferred tax assets 22,559 3,593 2,098 5,869 - 34,119

reimagining energyPETRONAS ANNUAL REPORT PE 2011 199
38. OPERATING SEGMENTS (continued)
Reconciliations of reportable segment profits
1.4.2011 1.4.2010 to toGroup 31.12.2011 31.3.2011 RM Mil RM Mil
Total reportable segment profit 52,070 52,613 Financing cost, net of tax (1,363) (2,418)Share of profits of associates and jointly controlled entities, net of tax 1,317 2,076 Unrealised foreign exchange (loss)/gains (584) 1,264 Net gain from initial public offering - 9,190 Other non-operating income, net of tax 4,134 283 Profit for the period/year 55,574 63,008
Products and services segments
The following are revenue from external customers by product and service:
1.4.2011 1.4.2010 to toGroup 31.12.2011 31.3.2011 RM Mil RM Mil Petroleum products 84,046 93,130 Crude oil and condensates 49,772 52,642 Liquefied natural gas 45,183 45,345 Sales and natural gas 14,506 16,609 Petrochemicals 11,444 14,543 Shipping services 5,306 6,726 Investment income 2,681 2,792 Others 9,859 9,441 222,797 241,228 Geographical segments
In presenting information on the basis of geographical segments, segment revenue is based on geographical location of customers. Segment assets are based on the geographical location of the assets. The amounts of non-current assets do not include financial instruments (including investment in associates and jointly controlled entities) and deferred tax assets.
Revenue Non-current assets 1.4.2011 1.4.2010 1.4.2011 1.4.2010 to to to toGroup 31.12.2011 31.3.2011 31.12.2011 31.3.2011 RM Mil RM Mil RM Mil RM Mil Asia 114,680 121,955 25,616 22,730 Malaysia 52,535 52,394 174,619 162,892 South Africa 27,130 27,633 2,725 2,784 Rest of the world 28,452 39,246 39,011 31,311 222,797 241,228 241,971 219,717

PETRONAS ANNUAL REPORT PE 2011200
38. OPERATING SEGMENTS (continued)
Major customers
As at 31 December 2011, there are no major customers with revenue that contribute to more than 10 percent of Group revenue.
39. PETROLEUM ARRANGEMENTS
The Petroleum Development Act, 1974 vests the entire ownership, rights, powers, liberties and privileges of exploiting petroleum resources on land and offshore Malaysia in PETRONAS.
The exploitation by PETRONAS of petroleum resources is carried out primarily by means of production sharing contracts (“PSCs”) with international oil and gas companies and with its subsidiaries. Under the terms of the various PSCs that PETRONAS has entered into, the PSC Contractors bear all costs. The PSC Contractors may recover their costs in barrels of crude oil or gas equivalent in accordance with the terms of their respective PSCs.
Certain terms of the PSCs are:
i. Research cess, supplemental payments and crude oil or gas entitlement
The determination of research cess, supplemental payments, and PETRONAS’ and the contractors’ entitlements to crude oil or gas produced subsequent to 31 December 1992 have been based on the returns submitted by contractors and is dependent on agreement being reached on the method of valuation of crude oil or gas and the quantum of costs incurred and claimed by contractors subject to the maximum rate provided under the production sharing contracts for the year. PETRONAS’ entitlements to crude oil and natural gas are taken up as income on the basis of liftings and sales respectively made by the Company.
ii. Property, plant and equipment
Title to all equipment and other assets purchased or acquired by PSC Contractors exclusively for the purpose of petroleum operations, and which costs are recoverable in barrels of cost oil or gas equivalent, vested with PETRONAS. However, the values of these assets are not taken up in the financial statements of PETRONAS other than:
• theproperty,plantandequipmentofasubsidiarywhichisalsoacontractortoPETRONASundercertainPSCs;and
• theestimatedcostsofdecommissioningandremovingtheassetsandrestoringthesiteonwhichtheyarelocatedwhere there is an obligation to do so.
iii. Inventories
Title to all crude oil held in inventories by the PSC Contractors lies with PETRONAS and title to the contractors’ entitlement passes only upon delivery at point of export. However, the values of these inventories are not taken up in the financial statements of PETRONAS.
The exploitation of petroleum resources is also carried out by means of risk service contracts (“RSCs”). Under the terms of the RSCs, RSC Contractors provide services for the development and production of oil and gas resources on behalf of PETRONAS.

reimagining energyPETRONAS ANNUAL REPORT PE 2011 201
39. PETROLEUM ARRANGEMENTS (continued)
Certain terms of the RSCs are:
i. Cost reimbursement and remuneration fees
RSC Contractors incur all upfront costs and will be reimbursed upon first commercial production. Under the terms of the RSCs, PETRONAS owns the title to all equipment and other assets purchased or acquired by the RSC Contractors for the purpose of petroleum operations. The values of these assets are taken up in the financial statements of PETRONAS upon incurrence, together with the estimated costs of decommissioning the assets where there is an obligation to do so.
Contractors are also entitled to remuneration fees which commensurate with their performance under the contract. All payments of remuneration fees are recognised as expenditures in PETRONAS’ financial statements.
ii. Production
All barrels of crude oil and gas produced belongs to PETRONAS and inventories, if any, are taken up in the financial statements of PETRONAS.
40. SIGNIFICANT AND SUBSEQUENT EVENTS
Upon the secession of the Republic of South Sudan (“RSS”) from the Republic of Sudan (“RoS”) on 9 July 2011, significant parts of Contract Areas under the Group’s Exploration and Production Service Agreements (“EPSA”) for Block 1,2&4, Block 3&7 and Block 5A signed with the RoS, now lie under the jurisdiction of the RSS. Subsequently, the RSS agreed to grant Foreign Oil companies (“FOCs”) including the Group, rights to conduct petroleum operations in the original Contract Areas of these three blocks located in South Sudan through Transition Agreements (“TAs”) which were signed on 13 January 2012. The TAs contain substantially the same fiscal and contractual terms and conditions.
Following disputes between the RSS and RoS, the Government of RSS through the Ministry of Petroleum and Mining has issued a Shut Down Order in respect of all petroleum operations in Block 1,2&4, Block 3&7 and Block 5A located in South Sudan. All producing wells in these blocks located in South Sudan were completely shut down on 23 January 2012, 24 January 2012 and 6 February 2012 respectively under close supervision by the RSS National Intelligence Security Services. As a consequence, no new oil production has since flowed from South Sudan.
Following the above shut downs, the Group has in consultation with other foreign parties undertaken various measures including preservation of the oil fields facilities as well as conducting ongoing discussions with senior officials of the RSS and RoS in order to minimise the adverse impact to the Group. The full impact of the above shut downs to the Group is not yet determinable and is largely dependent upon the outcome of the negotiations between the RSS and RoS.
41. FINANCIAL INSTRUMENTS
Categories of financial instruments
The table below provides an analysis of financial instruments categorised as follows:
i. Loans and receivables (“L&R”) ii. Fair value through profit or loss (“FVTPL”) - Designated upon initial recognition (“DUIR”) - Held for trading (“HFT”) iii. Available-for-sale financial assets (“AFS”) iv. Loans and borrowings (“L&B”) v. Held-to-maturity investments (“HTM”)

PETRONAS ANNUAL REPORT PE 2011202
41. FINANCIAL INSTRUMENTS (continued)
Categories of financial instruments
The table below provides an analysis of financial instruments categorised as follows:
i. Loans and receivables (“L&R”) ii. Fair value through profit or loss (“FVTPL”) - Designated upon initial recognition (“DUIR”) - Held for trading (“HFT”) iii. Available-for-sale financial assets (“AFS”) iv. Loans and borrowings (“L&B”) v. Held-to-maturity investments (“HTM”)
TotalGroup L&R/ FVTPL FVTPL carrying31.12.2011 (L&B) - DUIR - HFT AFS HTM amount Note RM Mil RM Mil RM Mil RM Mil RM Mil RM MilFinancial assets Long term receivables * 3,402 - 491 - - 3,893 Fund and other investments 12 715 9,664 - 26,005 2,494 38,878 Trade and other receivables * 36,334 - 148 - - 36,482 Cash and cash equivalents 15 125,447 - - - - 125,447 165,898 9,664 639 26,005 2,494 204,700 Financial liabilities Borrowings 23 (52,523) - - - - (52,523) Other long term liabilities * (464) - (281) - - (745) Trade and other payables * (46,572) - (63) - - (46,635) (99,559) - (344) - - (99,903)
31.3.2011 Financial assets Long term receivables * 2,636 - 433 - - 3,069 Fund and other investments 12 682 12,404 - 36,607 - 49,693 Trade and other receivables * 32,794 - 78 - - 32,872 Cash and cash equivalents 15 106,664 - - - - 106,664 142,776 12,404 511 36,607 - 192,298 Financial liabilities Borrowings 23 (47,811) - - - - (47,811) Other long term liabilities * (425) - (303) - - (728) Trade and other payables * (36,945) - (246) - - (37,191) Dividend payable (6,000) - - - - (6,000) (91,181) - (549) - - (91,730)
* These balances exclude non-financial instruments balances.
Certain fund and other investments have been designated upon initial recognition as at fair value through profit or loss as management internally monitors these investments on fair value basis.
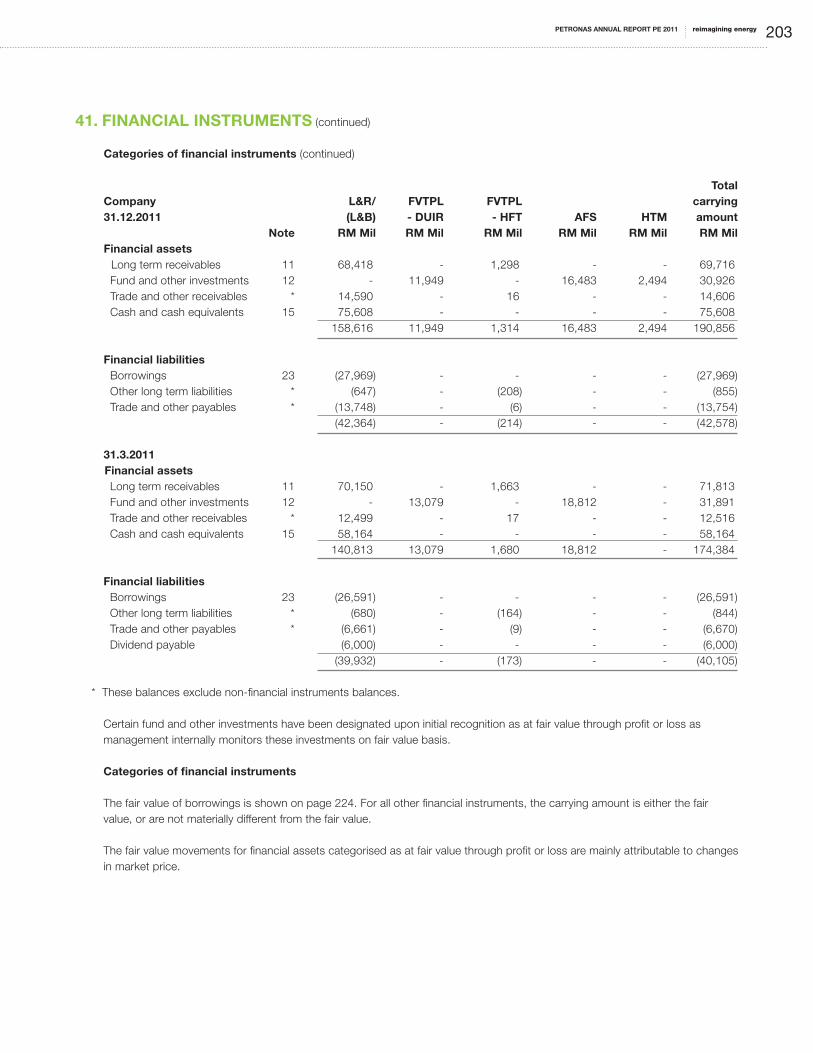
reimagining energyPETRONAS ANNUAL REPORT PE 2011 203
41. FINANCIAL INSTRUMENTS (continued)
Categories of financial instruments (continued)
TotalCompany L&R/ FVTPL FVTPL carrying31.12.2011 (L&B) - DUIR - HFT AFS HTM amount Note RM Mil RM Mil RM Mil RM Mil RM Mil RM MilFinancial assets Long term receivables 11 68,418 - 1,298 - - 69,716 Fund and other investments 12 - 11,949 - 16,483 2,494 30,926 Trade and other receivables * 14,590 - 16 - - 14,606 Cash and cash equivalents 15 75,608 - - - - 75,608 158,616 11,949 1,314 16,483 2,494 190,856 Financial liabilities Borrowings 23 (27,969) - - - - (27,969) Other long term liabilities * (647) - (208) - - (855) Trade and other payables * (13,748) - (6) - - (13,754) (42,364) - (214) - - (42,578)
31.3.2011 Financial assets Long term receivables 11 70,150 - 1,663 - - 71,813 Fund and other investments 12 - 13,079 - 18,812 - 31,891 Trade and other receivables * 12,499 - 17 - - 12,516 Cash and cash equivalents 15 58,164 - - - - 58,164 140,813 13,079 1,680 18,812 - 174,384 Financial liabilities Borrowings 23 (26,591) - - - - (26,591) Other long term liabilities * (680) - (164) - - (844) Trade and other payables * (6,661) - (9) - - (6,670) Dividend payable (6,000) - - - - (6,000) (39,932) - (173) - - (40,105)
* These balances exclude non-financial instruments balances.
Certain fund and other investments have been designated upon initial recognition as at fair value through profit or loss as management internally monitors these investments on fair value basis.
Categories of financial instruments
The fair value of borrowings is shown on page 224. For all other financial instruments, the carrying amount is either the fair value, or are not materially different from the fair value.
The fair value movements for financial assets categorised as at fair value through profit or loss are mainly attributable to changes in market price.

PETRONAS ANNUAL REPORT PE 2011204
41. FINANCIAL INSTRUMENTS (continued)
Financial risk management
As an integrated oil and gas company, the Group and the Company are exposed to various risks that are particular to its core business of exploration and production, gas and power and downstream operations. These risks, which arise in the normal course of the Group’s and of the Company’s business, comprise credit risk, liquidity risk and market risk relating to interest rates, foreign currency exchange rates, equity prices and commodity prices.
The Group has policies and guidelines in place that sets the foundation for a consistent approach towards establishing an effective financial risk management across the PETRONAS Group.
The Group and the Company’s goal in risk management are to ensure that the management understands, measures and monitors the various risks that arise in connection with their operations. Policies and guidelines have been developed to identify, analyse, appraise and monitor the dynamic risks facing the Group and the Company. Based on this assessment, each business unit adopts appropriate measures to mitigate these risks in accordance with the business unit’s view of the balance between risk and reward.
Credit risk
Credit risk is the potential exposure of the Group and of the Company to losses in the event of non-performance by counterparties. The Group and the Company’s exposures to credit risk arise principally from their receivables from customers, investment securities and financial guarantees given to financial institutions for credit facilities granted to subsidiaries, jointly controlled entities and associates. Credit risks are controlled by individual operating units in line with PETRONAS’ policies and guidelines.
Receivables
The Group and the Company minimise credit risk by entering into contracts with highly credit rated counterparties. Potential counterparties are subject to credit assessment and approval prior to any transaction being concluded and existing counterparties are subject to regular reviews, including re-appraisal and approval of granted limits. The creditworthiness of counterparties is assessed based on an analysis of all available quantitative and qualitative data regarding business risks and financial standing, together with the review of any relevant third party and market information. Reports are prepared and presented to the management that cover the Group’s overall credit exposure against limits and securities, exposure by segment and overall quality of the portfolio.
Depending on the types of transactions and counterparty creditworthiness, the Group and the Company further mitigate and limit risks related to credit by requiring collateral or other credit enhancements such as cash deposits, letter of credit and bank guarantees.
Exposure to losses increases with concentrations of credit risk which may exist when a number of counterparties are involved in similar activities or operate in the same industry sector or geographical area, which may result in their ability to meet contractual obligations being impacted by changes in economic, political or other conditions. The Group’s principal customers with which it conducts business are located throughout the world and there is no significant concentration of credit risk at reporting date.
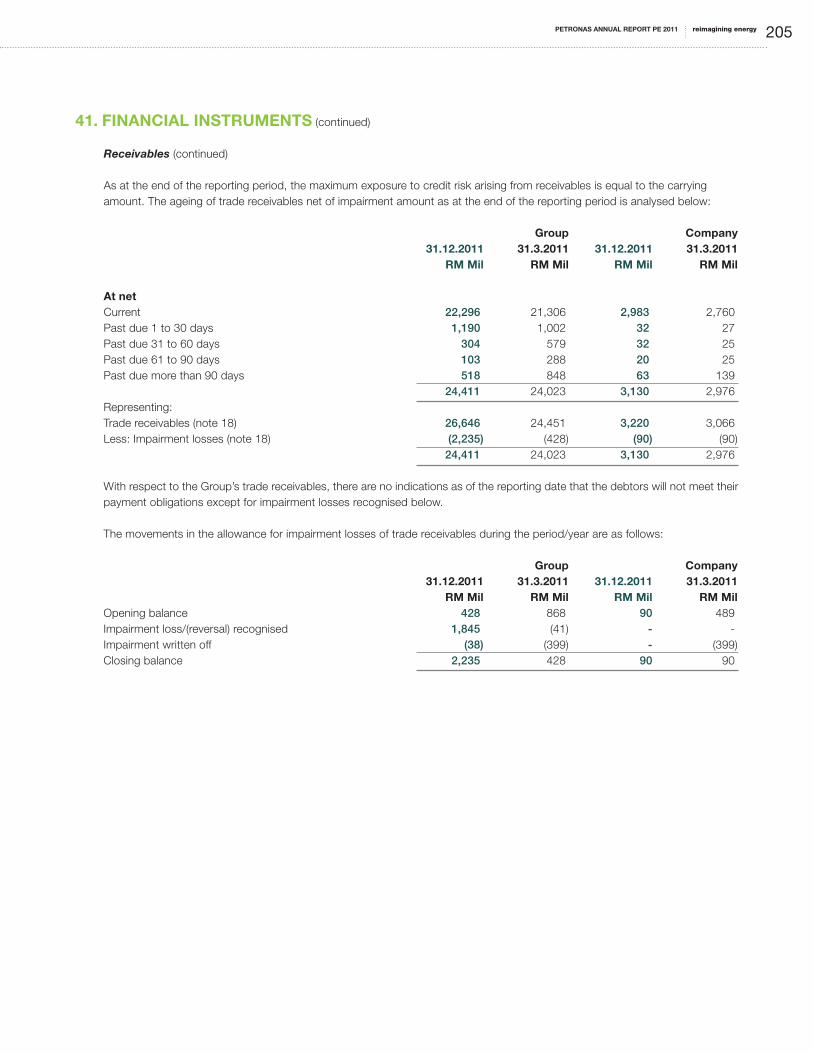
reimagining energyPETRONAS ANNUAL REPORT PE 2011 205
41. FINANCIAL INSTRUMENTS (continued)
Receivables (continued)
As at the end of the reporting period, the maximum exposure to credit risk arising from receivables is equal to the carrying amount. The ageing of trade receivables net of impairment amount as at the end of the reporting period is analysed below:
Group Company 31.12.2011 31.3.2011 31.12.2011 31.3.2011 RM Mil RM Mil RM Mil RM Mil At net Current 22,296 21,306 2,983 2,760 Past due 1 to 30 days 1,190 1,002 32 27 Past due 31 to 60 days 304 579 32 25 Past due 61 to 90 days 103 288 20 25 Past due more than 90 days 518 848 63 139 24,411 24,023 3,130 2,976 Representing: Trade receivables (note 18) 26,646 24,451 3,220 3,066 Less: Impairment losses (note 18) (2,235) (428) (90) (90) 24,411 24,023 3,130 2,976
With respect to the Group’s trade receivables, there are no indications as of the reporting date that the debtors will not meet their payment obligations except for impairment losses recognised below.
The movements in the allowance for impairment losses of trade receivables during the period/year are as follows:
Group Company 31.12.2011 31.3.2011 31.12.2011 31.3.2011 RM Mil RM Mil RM Mil RM MilOpening balance 428 868 90 489 Impairment loss/(reversal) recognised 1,845 (41) - -Impairment written off (38) (399) - (399)Closing balance 2,235 428 90 90

PETRONAS ANNUAL REPORT PE 2011206
41. FINANCIAL INSTRUMENTS (continued)
Fund and other investment
The Group and the Company are also exposed to counterparty credit risk from financial institutions through fund investment activities comprising primarily money market placement and investments in bonds, and trade facilities. These exposures are managed in accordance with existing policies and guidelines that define the parameters within which the investment activities shall be undertaken in order to achieve the Group’s investment objective of preserving capital and generating optimal returns above appropriate benchmarks within allowable risk parameters.
Investments are only made with approved counterparties who met the appropriate rating and other relevant criteria, and within approved credit limits, as stipulated in the policies and guidelines. The treasury function undertakes a credit risk management activities similar to the credit management and monitoring procedures for receivables.
As at the reporting date, the Group and the Company has invested 94% (31.3.2011: 97%) of the investments in domestic securities and 6% (31.3.2011: 3%) in foreign securities.
The fund and other investments are unsecured, however, in view of the sound credit rating of counterparties, management does not expect any counterparty to fail to meet its obligation.
Financial guarantees
The Group and the Company provide unsecured financial guarantees to banks in respect of banking facilities granted to certain subsidiaries, jointly controlled entities and associates (“Group entities”). The Group and the Company monitor on an ongoing basis, the results of the Group entities and repayments made by the Group entities.
The maximum exposure to credit risk amounted to RM4,639,000,000 (31.3.2011: RM4,890,000,000) which represents the outstanding banking facilities of the Group entities as at reporting date. As at reporting date, there was no indication that any Group entities would default on repayment. The fair value of the financial guarantee recognised is disclosed in note 25.
Liquidity Risk
Liquidity risk is the risk that suitable sources of funding for the Group’s business activities may not be available. In managing its liquidity risk, the Group maintains sufficient cash and liquid marketable assets. The Company’s current credit rating enables it to access banking facilities in excess of current and immediate future requirements of the Group and of the Company. The Group’s borrowing power is not limited by its Articles of Association. However, certain covenants included in agreements impose limited restrictions on some of the debt level of PETRONAS’ subsidiaries.
Maturity analysis
The table below summarises the maturity profile of the Group’s and of the Company’s financial liabilities as at the reporting date based on undiscounted contractual payments:

reimagining energyPETRONAS ANNUAL REPORT PE 2011 207
41. FINANCIAL INSTRUMENTS (continued)
Maturity analysis (continued) Contractual interest/ Group Carrying profit rates Contractual Within31.12.2011 amount per annum cash flows 1 year RM Mil % RM Mil RM MilLoans and borrowings Secured Term Loans USD fixed rate loan 1,371 5.09 1,520 435 USD floating rate loan 1,100 2.01 1,260 241 RM fixed rate loan 563 7.35 667 65 RM floating rate loan 618 4.16 722 64 ZAR fixed rate loan 252 11.00 310 19 GBP fixed rate loan 190 4.00 202 78 Other floating rate loans 29 13.33 39 15 Unsecured Term Loans USD floating rate loan 3,454 1.66 3,715 153 RM fixed rate loan 834 5.50 867 475 RM floating rate loan 380 3.68 413 117 EURO floating rate loan 3,537 3.38 3,563 65 Other fixed rate loan 35 5.83 41 18 Other floating rate loan 107 7.33 120 42 Unsecured Notes and Bonds USD Notes 11,759 7.07 14,758 6,919 USD Guaranteed Notes 9,408 5.25 13,222 501 USD Bonds 3,576 7.69 5,997 275 JPY Bonds 653 3.40 687 22 Unsecured revolving credits USD revolving credits 1,110 1.08 1,122 1,122 RM revolving credits 1,206 3.50 1,249 1,249 GBP revolving credits 413 1.84 421 421 Unsecured bank overdrafts EURO bank overdrafts 141 3.03 158 158 ZAR bank overdrafts 767 6.43 848 848 Secured Islamic financing facilities RM Islamic financing facilities 2,163 5.53 2,262 336 Unsecured Islamic financing facilities USD Islamic financing facilities 4,797 4.25 5,327 203 RM Islamic financing facilities 4,060 5.27 4,996 1,365 Trade and other payables 46,572 - 46,572 46,572 Fair value through profit or loss – held for trading Derivative liabilities 344 - 344 63 99,439 111,402 61,841
continue to next page
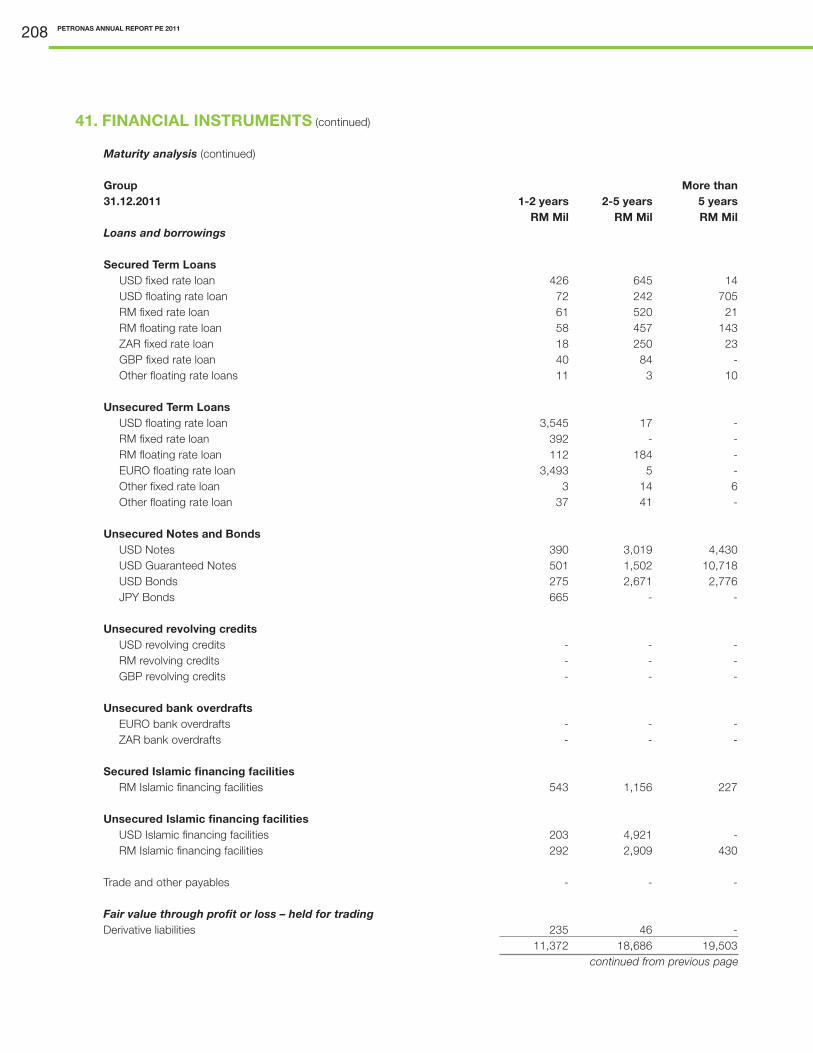
PETRONAS ANNUAL REPORT PE 2011208
41. FINANCIAL INSTRUMENTS (continued)
Maturity analysis (continued)
Group More than31.12.2011 1-2 years 2-5 years 5 years RM Mil RM Mil RM MilLoans and borrowings Secured Term Loans USD fixed rate loan 426 645 14 USD floating rate loan 72 242 705 RM fixed rate loan 61 520 21 RM floating rate loan 58 457 143 ZAR fixed rate loan 18 250 23 GBP fixed rate loan 40 84 - Other floating rate loans 11 3 10 Unsecured Term Loans USD floating rate loan 3,545 17 - RM fixed rate loan 392 - - RM floating rate loan 112 184 - EURO floating rate loan 3,493 5 - Other fixed rate loan 3 14 6 Other floating rate loan 37 41 - Unsecured Notes and Bonds USD Notes 390 3,019 4,430 USD Guaranteed Notes 501 1,502 10,718 USD Bonds 275 2,671 2,776 JPY Bonds 665 - - Unsecured revolving credits USD revolving credits - - - RM revolving credits - - - GBP revolving credits - - - Unsecured bank overdrafts EURO bank overdrafts - - - ZAR bank overdrafts - - - Secured Islamic financing facilities RM Islamic financing facilities 543 1,156 227 Unsecured Islamic financing facilities USD Islamic financing facilities 203 4,921 - RM Islamic financing facilities 292 2,909 430 Trade and other payables - - - Fair value through profit or loss – held for trading Derivative liabilities 235 46 - 11,372 18,686 19,503
continued from previous page
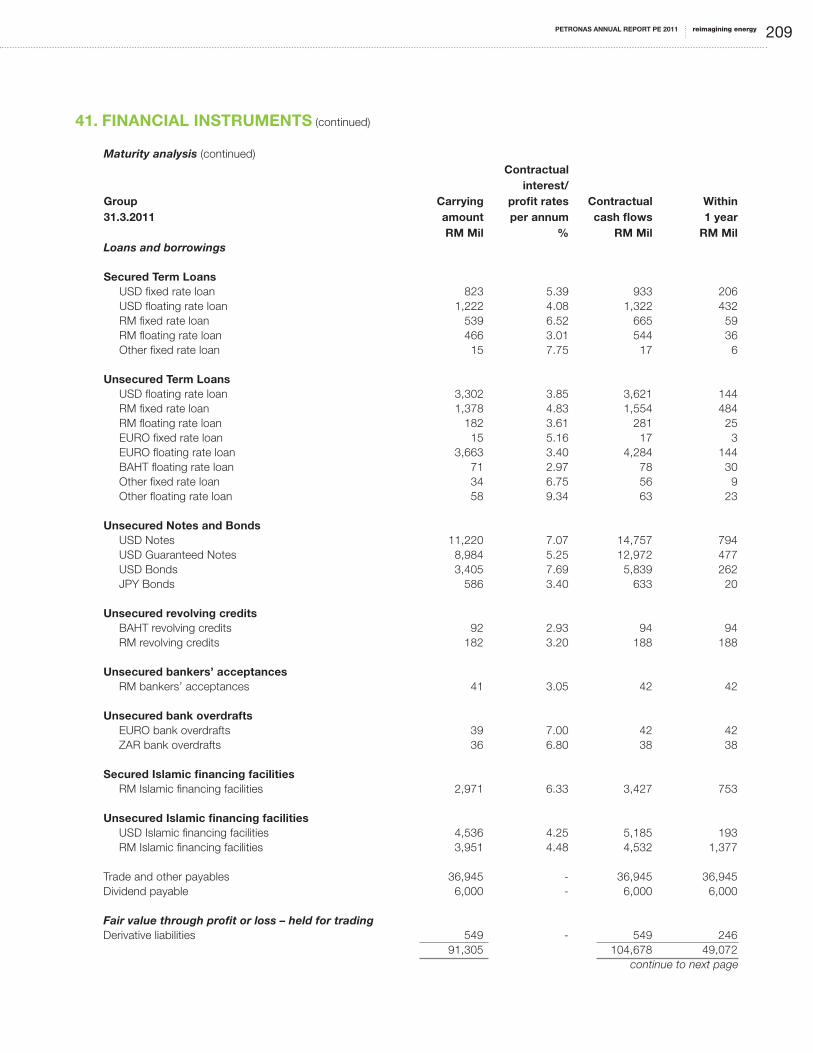
reimagining energyPETRONAS ANNUAL REPORT PE 2011 209
41. FINANCIAL INSTRUMENTS (continued)
Maturity analysis (continued) Contractual interest/ Group Carrying profit rates Contractual Within31.3.2011 amount per annum cash flows 1 year RM Mil % RM Mil RM MilLoans and borrowings Secured Term Loans USD fixed rate loan 823 5.39 933 206 USD floating rate loan 1,222 4.08 1,322 432 RM fixed rate loan 539 6.52 665 59 RM floating rate loan 466 3.01 544 36 Other fixed rate loan 15 7.75 17 6 Unsecured Term Loans USD floating rate loan 3,302 3.85 3,621 144 RM fixed rate loan 1,378 4.83 1,554 484 RM floating rate loan 182 3.61 281 25 EURO fixed rate loan 15 5.16 17 3 EURO floating rate loan 3,663 3.40 4,284 144 BAHT floating rate loan 71 2.97 78 30 Other fixed rate loan 34 6.75 56 9 Other floating rate loan 58 9.34 63 23 Unsecured Notes and Bonds USD Notes 11,220 7.07 14,757 794 USD Guaranteed Notes 8,984 5.25 12,972 477 USD Bonds 3,405 7.69 5,839 262 JPY Bonds 586 3.40 633 20 Unsecured revolving credits BAHT revolving credits 92 2.93 94 94 RM revolving credits 182 3.20 188 188 Unsecured bankers’ acceptances RM bankers’ acceptances 41 3.05 42 42 Unsecured bank overdrafts EURO bank overdrafts 39 7.00 42 42 ZAR bank overdrafts 36 6.80 38 38 Secured Islamic financing facilities RM Islamic financing facilities 2,971 6.33 3,427 753 Unsecured Islamic financing facilities USD Islamic financing facilities 4,536 4.25 5,185 193 RM Islamic financing facilities 3,951 4.48 4,532 1,377 Trade and other payables 36,945 - 36,945 36,945 Dividend payable 6,000 - 6,000 6,000 Fair value through profit or loss – held for trading Derivative liabilities 549 - 549 246 91,305 104,678 49,072 continue to next page
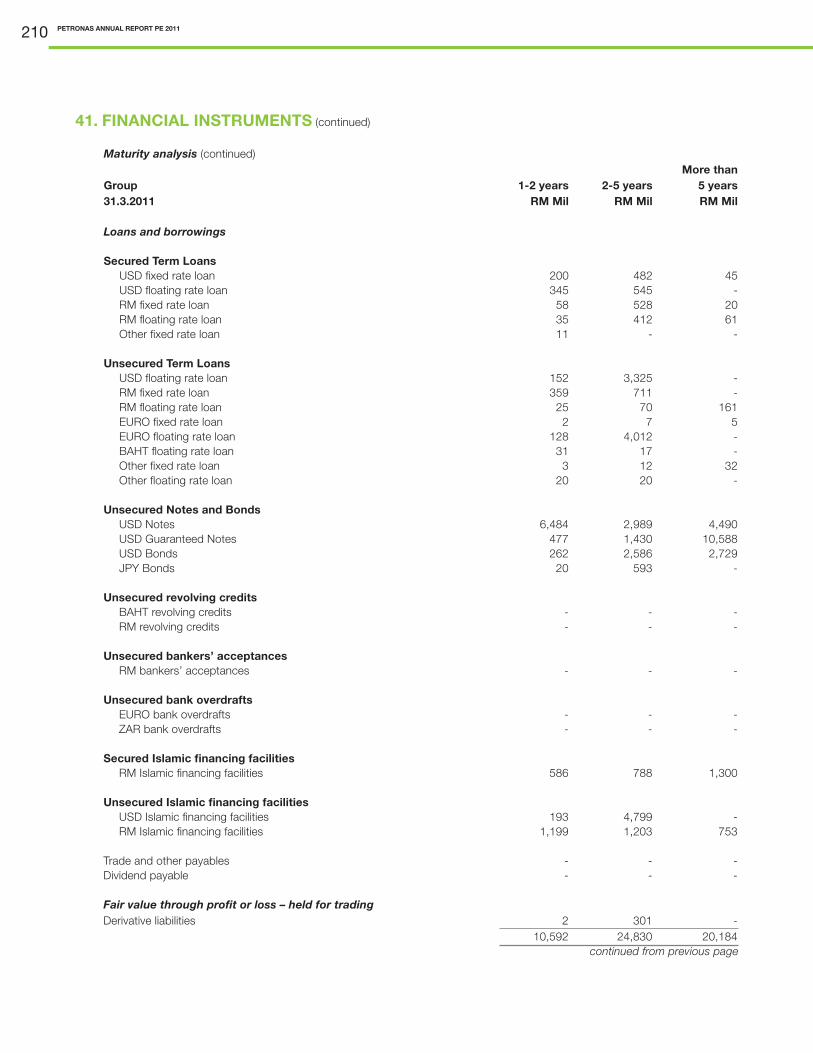
PETRONAS ANNUAL REPORT PE 2011210
41. FINANCIAL INSTRUMENTS (continued)
Maturity analysis (continued) More thanGroup 1-2 years 2-5 years 5 years31.3.2011 RM Mil RM Mil RM Mil
Loans and borrowings Secured Term Loans USD fixed rate loan 200 482 45 USD floating rate loan 345 545 - RM fixed rate loan 58 528 20 RM floating rate loan 35 412 61 Other fixed rate loan 11 - - Unsecured Term Loans USD floating rate loan 152 3,325 - RM fixed rate loan 359 711 - RM floating rate loan 25 70 161 EURO fixed rate loan 2 7 5 EURO floating rate loan 128 4,012 - BAHT floating rate loan 31 17 - Other fixed rate loan 3 12 32 Other floating rate loan 20 20 - Unsecured Notes and Bonds USD Notes 6,484 2,989 4,490 USD Guaranteed Notes 477 1,430 10,588 USD Bonds 262 2,586 2,729 JPY Bonds 20 593 - Unsecured revolving credits BAHT revolving credits - - - RM revolving credits - - - Unsecured bankers’ acceptances RM bankers’ acceptances - - - Unsecured bank overdrafts EURO bank overdrafts - - - ZAR bank overdrafts - - - Secured Islamic financing facilities RM Islamic financing facilities 586 788 1,300 Unsecured Islamic financing facilities USD Islamic financing facilities 193 4,799 - RM Islamic financing facilities 1,199 1,203 753 Trade and other payables - - -Dividend payable - - - Fair value through profit or loss – held for trading Derivative liabilities 2 301 - 10,592 24,830 20,184 continued from previous page

reimagining energyPETRONAS ANNUAL REPORT PE 2011 211
41. FINANCIAL INSTRUMENTS (continued)
Maturity analysis (continued) Contractual interest/ Company Carrying profit rates Contractual Within 31.12.2011 amount per annum cash flows 1 year RM Mil % RM Mil RM MilLoans and borrowings Unsecured Notes and Bonds USD Notes 9,535 7.29 12,211 6,780 USD Guaranteed Notes 9,408 5.25 13,222 501 USD Bonds 3,576 7.69 5,997 275 JPY Bonds 653 3.40 687 22 Unsecured Islamic financing facilities USD Islamic financing facilities 4,797 4.25 5,327 203 Trade and other payables 13,748 - 13,748 13,748 Fair value through profit or loss – held for trading Derivative liabilities 214 - 214 6 41,931 51,406 21,535
continue to next page
31.3.2011 Loans and borrowings Unsecured Notes and Bonds USD Notes 9,080 7.29 12,218 662 USD Guaranteed Notes 8,984 5.25 12,972 477 USD Bonds 3,405 7.69 5,839 262 JPY Bonds 586 3.40 633 20 Unsecured Islamic financing facilities USD Islamic financing facilities 4,536 4.25 5,185 193 Trade and other payables 6,661 - 6,661 6,661 Dividend payable 6,000 - 6,000 6,000 Fair value through profit or loss – held for trading Derivative liabilities 173 - 173 9 39,425 49,681 14,284
continue to next page

PETRONAS ANNUAL REPORT PE 2011212
41. FINANCIAL INSTRUMENTS (continued)
Maturity analysis (continued) More thanCompany 1-2 years 2-5 years 5 years31.12.2011 RM Mil RM Mil RM Mil Loans and borrowings Unsecured Notes and Bonds USD Notes 250 751 4,430 USD Guaranteed Notes 501 1,502 10,718 USD Bonds 275 2,671 2,776 JPY Bonds 665 - - Unsecured Islamic financing facilities USD Islamic financing facilities 203 4,921 - Trade and other payables - - - Fair value through profit or loss – held for trading Derivative liabilities 208 - - 2,102 9,845 17,924
continued from previous page
31.3.2011 Loans and borrowings Unsecured Notes and Bonds USD Notes 6,351 715 4,490 USD Guaranteed Notes 477 1,430 10,588 USD Bonds 262 2,586 2,729 JPY Bonds 20 593 - Unsecured Islamic financing facilities USD Islamic financing facilities 193 4,799 - Trade and other payables - - -Dividend payable - - - Fair value through profit or loss – held for trading Derivative liabilities - 164 - 7,303 10,287 17,807
continued from previous page
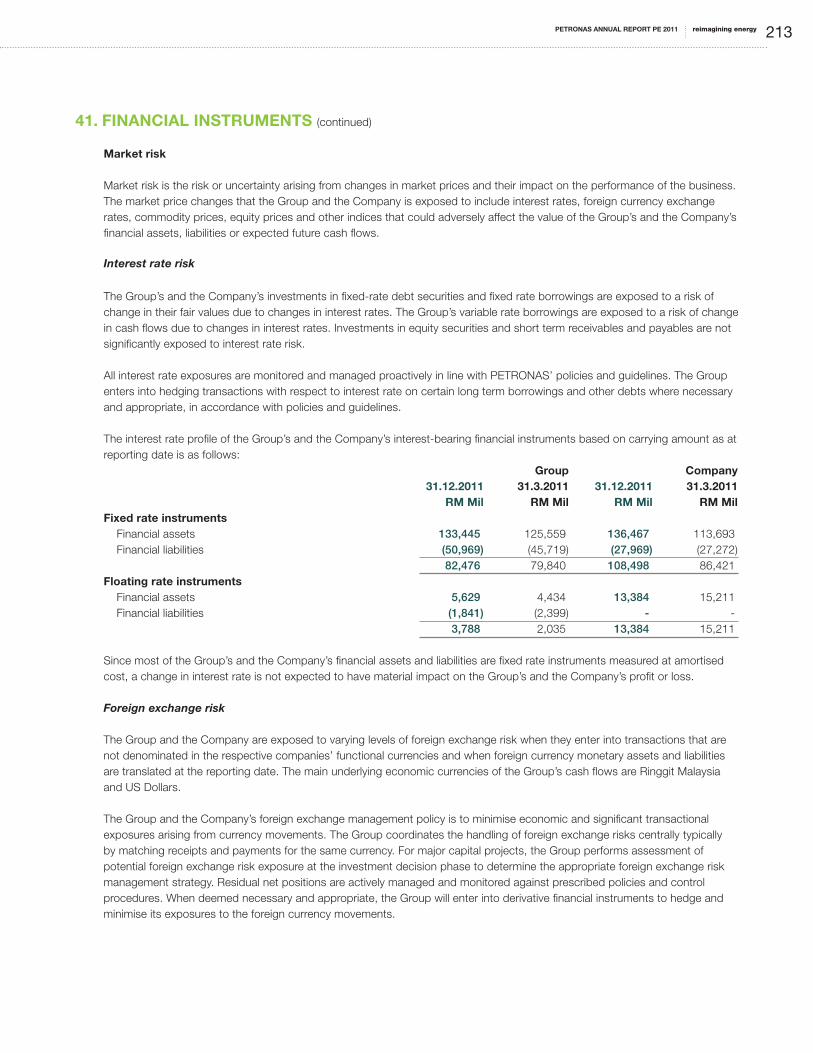
reimagining energyPETRONAS ANNUAL REPORT PE 2011 213
41. FINANCIAL INSTRUMENTS (continued)
Market risk
Market risk is the risk or uncertainty arising from changes in market prices and their impact on the performance of the business. The market price changes that the Group and the Company is exposed to include interest rates, foreign currency exchange rates, commodity prices, equity prices and other indices that could adversely affect the value of the Group’s and the Company’s financial assets, liabilities or expected future cash flows.
Interest rate risk
The Group’s and the Company’s investments in fixed-rate debt securities and fixed rate borrowings are exposed to a risk of change in their fair values due to changes in interest rates. The Group’s variable rate borrowings are exposed to a risk of change in cash flows due to changes in interest rates. Investments in equity securities and short term receivables and payables are not significantly exposed to interest rate risk.
All interest rate exposures are monitored and managed proactively in line with PETRONAS’ policies and guidelines. The Group enters into hedging transactions with respect to interest rate on certain long term borrowings and other debts where necessary and appropriate, in accordance with policies and guidelines.
The interest rate profile of the Group’s and the Company’s interest-bearing financial instruments based on carrying amount as at reporting date is as follows: Group Company 31.12.2011 31.3.2011 31.12.2011 31.3.2011 RM Mil RM Mil RM Mil RM MilFixed rate instruments Financial assets 133,445 125,559 136,467 113,693 Financial liabilities (50,969) (45,719) (27,969) (27,272) 82,476 79,840 108,498 86,421 Floating rate instruments Financial assets 5,629 4,434 13,384 15,211 Financial liabilities (1,841) (2,399) - - 3,788 2,035 13,384 15,211
Since most of the Group’s and the Company’s financial assets and liabilities are fixed rate instruments measured at amortised cost, a change in interest rate is not expected to have material impact on the Group’s and the Company’s profit or loss.
Foreign exchange risk
The Group and the Company are exposed to varying levels of foreign exchange risk when they enter into transactions that are not denominated in the respective companies’ functional currencies and when foreign currency monetary assets and liabilities are translated at the reporting date. The main underlying economic currencies of the Group’s cash flows are Ringgit Malaysia and US Dollars.
The Group and the Company’s foreign exchange management policy is to minimise economic and significant transactional exposures arising from currency movements. The Group coordinates the handling of foreign exchange risks centrally typically by matching receipts and payments for the same currency. For major capital projects, the Group performs assessment of potential foreign exchange risk exposure at the investment decision phase to determine the appropriate foreign exchange risk management strategy. Residual net positions are actively managed and monitored against prescribed policies and control procedures. When deemed necessary and appropriate, the Group will enter into derivative financial instruments to hedge and minimise its exposures to the foreign currency movements.

PETRONAS ANNUAL REPORT PE 2011214
41. FINANCIAL INSTRUMENTS (continued)
Foreign exchange risk (continued)
The Group’s and the Company’s significant exposure to foreign currency risk, based on carrying amounts as at the reporting date is as follows:
31.12.2011 31.3.2011 Denominated in Denominated inGroup USD MYR AUD USD MYR AUD RM Mil RM Mil RM Mil RM Mil RM Mil RM MilFinancial assets Loan and advances to subsidiaries 43,458 - - 62,250 - - Cash and cash equivalents 5,142 277 181 15,319 2,040 177 Trade and other receivables 10,489 2,896 44 7,722 1,052 5 Long term receivables 2,412 496 - 1,846 - - Fund and other investments 588 1 2,094 989 33 361 Other financial assets 816 - 13 1,303 - - 62,905 3,670 2,332 89,429 3,125 543 Financial liabilities Loan and advances from holding company (4,461) (1,537) - (16,360) (2,962) (36) Borrowings (27,660) (80) - (26,466) - - Trade and other payables (5,950) (468) (276) (6,362) (2,537) (98) Other financial liabilities (834) - - (1,311) - - (38,905) (2,085) (276) (50,499) (5,499) (134) Net exposure 24,000 1,585 2,056 38,930 (2,374) 409
Denominated in USDCompany 31.12.2011 31.3.2011 RM Mil RM MilFinancial assets Loan and advances to subsidiaries 42,927 53,314 Cash and cash equivalents 3,758 13,461 Trade and other receivables 5,543 3,773 Fund and other investments 566 989 Other financial assets 808 1,247 53,602 72,784 Financial liabilities Borrowings (27,315) (26,004) Trade and other payables (2,359) (1,026) Other financial liabilities (502) (500) (30,176) (27,530)
Net exposure 23,426 45,254
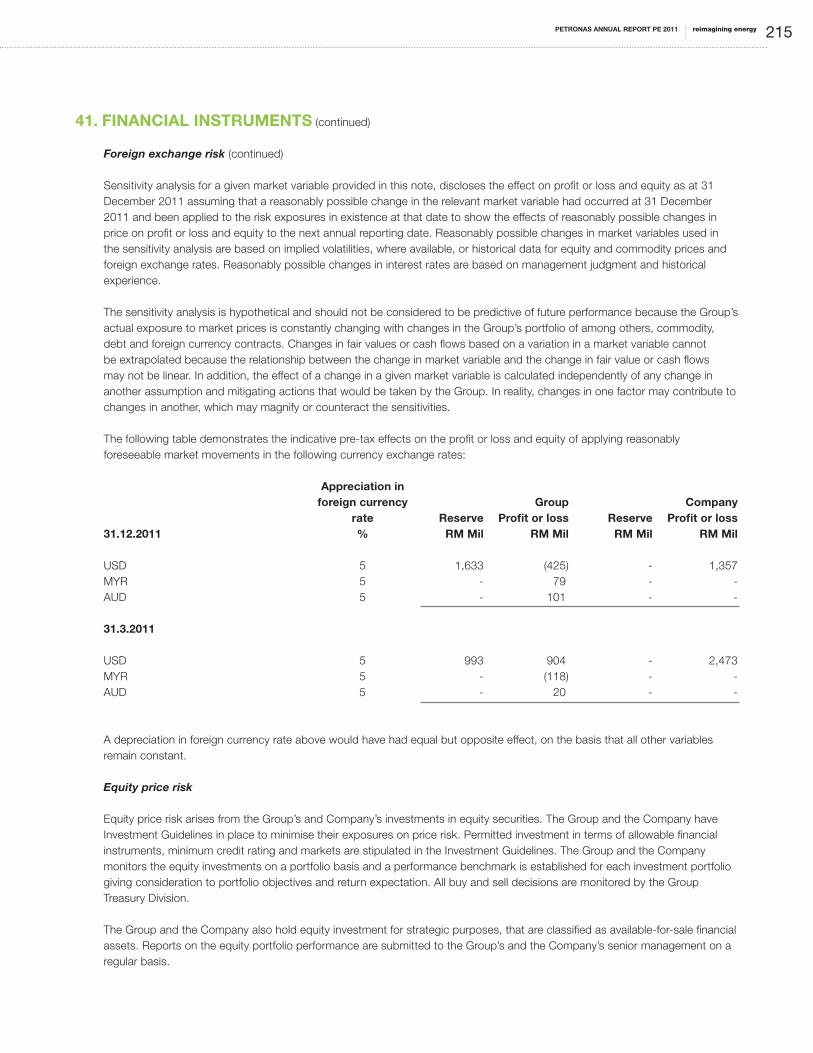
reimagining energyPETRONAS ANNUAL REPORT PE 2011 215
41. FINANCIAL INSTRUMENTS (continued)
Foreign exchange risk (continued) Sensitivity analysis for a given market variable provided in this note, discloses the effect on profit or loss and equity as at 31 December 2011 assuming that a reasonably possible change in the relevant market variable had occurred at 31 December 2011 and been applied to the risk exposures in existence at that date to show the effects of reasonably possible changes in price on profit or loss and equity to the next annual reporting date. Reasonably possible changes in market variables used in the sensitivity analysis are based on implied volatilities, where available, or historical data for equity and commodity prices and foreign exchange rates. Reasonably possible changes in interest rates are based on management judgment and historical experience.
The sensitivity analysis is hypothetical and should not be considered to be predictive of future performance because the Group’s actual exposure to market prices is constantly changing with changes in the Group’s portfolio of among others, commodity, debt and foreign currency contracts. Changes in fair values or cash flows based on a variation in a market variable cannot be extrapolated because the relationship between the change in market variable and the change in fair value or cash flows may not be linear. In addition, the effect of a change in a given market variable is calculated independently of any change in another assumption and mitigating actions that would be taken by the Group. In reality, changes in one factor may contribute to changes in another, which may magnify or counteract the sensitivities.
The following table demonstrates the indicative pre-tax effects on the profit or loss and equity of applying reasonably foreseeable market movements in the following currency exchange rates:
Appreciation in foreign currency Group Company rate Reserve Profit or loss Reserve Profit or loss31.12.2011 % RM Mil RM Mil RM Mil RM Mil
USD 5 1,633 (425) - 1,357 MYR 5 - 79 - -AUD 5 - 101 - -
31.3.2011 USD 5 993 904 - 2,473MYR 5 - (118) - -AUD 5 - 20 - -
A depreciation in foreign currency rate above would have had equal but opposite effect, on the basis that all other variables remain constant.
Equity price risk
Equity price risk arises from the Group’s and Company’s investments in equity securities. The Group and the Company have Investment Guidelines in place to minimise their exposures on price risk. Permitted investment in terms of allowable financial instruments, minimum credit rating and markets are stipulated in the Investment Guidelines. The Group and the Company monitors the equity investments on a portfolio basis and a performance benchmark is established for each investment portfolio giving consideration to portfolio objectives and return expectation. All buy and sell decisions are monitored by the Group Treasury Division.
The Group and the Company also hold equity investment for strategic purposes, that are classified as available-for-sale financial assets. Reports on the equity portfolio performance are submitted to the Group’s and the Company’s senior management on a regular basis.

PETRONAS ANNUAL REPORT PE 2011216
41. FINANCIAL INSTRUMENTS (continued)
Equity price risk (continued)
The Group’s and the Company’s exposure to equity price risk based on carrying amounts as at the reporting date is as follows:
Group Company 31.12.2011 31.3.2011 31.12.2011 31.3.2011 RM Mil RM Mil RM Mil RM Mil Local equities 768 657 334 286 Foreign equities 9,035 17,179 - - 9,803 17,836 334 286
The following table demonstrates the indicative pre-tax effects on the profit or loss and equity of applying reasonably foreseeable market movements in the following equities:
Increase in price based on average change in Group Company index rate Reserve Profit or loss Reserve Profit or loss31.12.2011 % RM Mil RM Mil RM Mil RM Mil Local equities 15 119 - 50 -Foreign equities 15 to 20 1,440 - - -
31.3.2011 Local equities 15 99 - 43 - Foreign equities 15 to 20 2,629 23 - -
A decrease in price based on average change in index rate above would have had equal but opposite effect, on the basis that all other variables remain constant.
Commodity price risk
The Group is exposed to changes in crude oil and petroleum products prices which may affect the value of the Group’s assets, liabilities or expected future cash flows. To mitigate these exposures from a business perspective, the Group enters into various financial instruments. In effecting these transactions, the Group operates within policies and procedures designed to ensure that risks are minimised. All financial instruments positions are marked-to-market by independent risk management department and reported to management for performance monitoring and risk management purposes on a daily basis.
Since the Group undertakes hedging using commodity derivatives for the majority of its transactions, a change in commodity price is not likely to result in a significant impact on the Group’s and the Company’s profit or loss and equity.

reimagining energyPETRONAS ANNUAL REPORT PE 2011 217
41. FINANCIAL INSTRUMENTS (continued)
Fair value
The fair values of financial liabilities measured at amortised cost, together with the carrying amounts are as follows:
31.12.2011 31.3.2011 Carrying Fair Carrying FairGroup amount value amount value Note RM Mil RM Mil RM Mil RM Mil Loans and borrowings Notes and Bonds 23 25,396 29,003 24,195 27,084 Term loans 23 12,470 12,460 11,768 11,834 Islamic financing facilities 23 11,020 12,491 11,458 11,701 Revolving credits 23 2,729 2,729 274 274 Bankers’ acceptances 23 - - 41 41 Bank overdrafts 23 908 908 75 75
Company Loans and borrowings Notes and Bonds 23 23,172 26,774 22,055 24,758 Islamic financing facilities 23 4,797 5,070 4,536 4,773
Fair value hierarchy
The following table analyses financial instruments carried at fair value by valuation method. The different levels have been defined as follows:
• Level1 -Quotedprices(unadjusted)inactivemarketsforidenticalassetsorliabilities. • Level2 - InputotherthanquotedpricesincludedwithinLevel1thatareobservablefortheassetorliability,eitherdirectly
(i.e. as prices) or indirectly (i.e. derived from prices). • Level3 - Inputfortheassetorliabilitythatarenotbasedonobservablemarketdata(unobservableinput).
Comparative figures have not been presented for 31 March 2011 by virtue of paragraph 44G of FRS 7, Financial Instruments: Disclosures.

PETRONAS ANNUAL REPORT PE 2011218
41. FINANCIAL INSTRUMENTS (continued)
Fair value hierarchy (continued)
Group31.12.2011 Level 1 Level 2 Total RM Mil RM Mil RM MilFinancial assets Quoted shares 9,718 - 9,718 Treasury bills - 16,073 16,073 Negotiable Certificate of Deposits - 514 514 Quoted securities - 964 964 Malaysian Government Securities - 5,876 5,876 Corporate Private Debt Securities - 2,115 2,115 Unquoted securities - 195 195 Forward foreign exchange contracts - 529 529 Commodity swaps - 4 4 Forward gas contracts 106 - 106 Others - 85 85 9,824 26,355 36,179 Financial liabilities Interest rate swaps - (287) (287) Forward foreign exchange contracts - (23) (23) Commodity swaps - (4) (4) Forward gas contracts (18) - (18) Forward oil price contracts (12) - (12) (30) (314) (344)
Company 31.12.2011 Financial assets Quoted shares 334 - 334 Treasury Bills - 16,073 16,073 Negotiable Certificate of Deposits - 514 514 Quoted securities - 964 964 Malaysian Government Securities - 5,814 5,814 Corporate Private Debt Securities - 4,657 4,657 Forward foreign exchange contracts - 1,314 1,314 334 29,336 29,670 Financial liabilities Forward foreign exchange contracts - (214) (214) - (214) (214)

reimagining energyPETRONAS ANNUAL REPORT PE 2011 219
41. FINANCIAL INSTRUMENTS (continued)
Income/(expense), net gains and losses arising from financial instruments
Group Reversal/ 1.4.2011 Interest Interest (impairment to 31.12.2011 income expense loss) Others Total RM Mil RM Mil RM Mil RM Mil RM MilFinancial instruments at fair value through profit or loss - Held for trading - - - 223 223 - Designated upon initial recognition 357 - - 5 362 Available-for-sale - recognised in profit or loss - - - 458 458 - recognised in equity - - - (4,943) (4,943)Loans and receivables - recognised in profit or loss 2,482 - (1,956) (660) (134) - recognised in equity - - - 1,452 1,452 Financial liabilities at amortised cost - (1,388) - (149) (1,537)Total 2,839 (1,388) (1,956) (3,614) (4,119)
1.4.2010 to 31.3.2011 Financial instruments at fair value through profit or loss - Held for trading - - - 35 35 - Designated upon initial recognition 331 - - (37) 294 Available-for-sale - recognised in profit or loss 794 - - 407 1,201 - recognised in equity - - - 2,251 2,251 Loans and receivables - recognised in profit or loss 1,831 - 119 (861) 1,089 - recognised in equity - - - (1,737) (1,737)Financial liabilities at amortised cost - (2,511) - (234) (2,745)Total 2,956 (2,511) 119 (176) 388

PETRONAS ANNUAL REPORT PE 2011220
41. FINANCIAL INSTRUMENTS (continued)
Income/(expense), net gains and losses arising from financial instruments (continued)
Company Interest Interest Impairment 1.4.2011 income expense loss Others Totalto 31.12.2011 RM Mil RM Mil RM Mil RM Mil RM Mil
Financial instruments at fair value through profit or loss - Held for trading - - - (409) (409) - Designated upon initial recognition 376 - - 133 509 Available-for-sale - recognised in profit or loss - - - 26 26 - recognised in equity - - - 48 48Loans and receivables 3,827 - (45) 966 4,748 Financial liabilities at amortised cost - (820) - - (820)Total 4,203 (820) (45) 764 4,102
1.4.2010to 31.3.2011 Financial instruments at fair value through profit or loss - Held for trading - - - 410 410 - Designated upon initial recognition 365 - - (40) 325Available-for-sale - recognised in profit or loss 397 - - 57 454 - recognised in equity - - - (54) (54)Loans and receivables 4,022 - (90) (2,820) 1,112Financial liabilities at amortised cost - (693) - - (693)Total 4,784 (693) (90) (2,447) 1,554
Others relate to gains and losses arising from financial instruments other than interest income, interest expense and impairment loss such as realised and unrealised foreign exchange gains or losses, dividend income and fair value gains or losses.
42. CAPITAL MANAGEMENT
The Group, as an essential part of its capital management strategy, is committed to a policy of financial prudence as outlined in the PETRONAS Group Corporate Financial Policy. The Group’s capital structure consists of consolidated equity plus debt, defined as the current and long term portions of the Group’s debt.
The objective of the Group’s capital management is to maintain an optimal capital structure and ensure availability of funds in order to meet financial obligations, support business growth and maximise shareholders’ value. The Group monitors and maintains a prudent level of total debt to total assets ratio and ensures compliance with all covenants.
There were no changes in the Group’s approach to capital management during the period.

reimagining energyPETRONAS ANNUAL REPORT PE 2011 221
43. ADOPTION OF NEW AND REVISED PRONOUNCEMENTS
On 1 April 2011, the Group and the Company adopted the following new and revised FRSs, amendments and IC interpretations that have been issued by the Malaysian Accounting Standards Board:
Effective for annual periods beginning on or after 1 July 2010 FRS 1, First-time Adoption of Financial Reporting Standards (revised) FRS 3, Business Combinations (revised) FRS 127, Consolidated and Separate Financial Statements (revised) Amendment to FRS 5, Non-current Assets Held for Sale and Discontinued Operations Amendments to FRS 138, Intangible Assets IC 12, Service Concession Arrangements IC 16, Hedges of a Net Investment in a Foreign Operation IC 17, Distribution of Non-cash Assets to Owners Amendments to IC 9, Reassessment of Embedded Derivatives
Effective for annual periods beginning on or after 1 January 2011 Amendment to FRS 1, Limited Exemption from Comparative FRS 7 Disclosures for First-time Adopters Amendments to FRS 1, Additional Exemptions for First-time Adopters Amendments to FRS 1, First-time Adoption of Financial Reporting Standards Amendments to FRS 3, Business Combinations Amendments to FRS 7, Improving Disclosures about Financial Instruments Amendments to FRS 7, Financial Instruments: Disclosures Amendments to FRS 101, Presentation of Financial Statements Amendments to FRS 121, The Effects of Changes in Foreign Exchange Rates Amendments to FRS 128, Investments in Associates Amendments to FRS 131, Interests in Joint Ventures Amendments to FRS 132, Financial Instruments: Presentation Amendments to FRS 134, Interim Financial Reporting Amendments to FRS 139, Financial Instruments: Recognition and Measurement IC 4, Determining whether an Arrangement contains a Lease IC 18, Transfer of Assets from Customers Amendments to IC 13, Customer Loyalty Programmes
The principal changes in accounting policies and their effects are set out below:
i. FRS 3, Business Combinations (revised)
From 1 April 2011, the Group has applied FRS 3 (revised) in accounting for business combinations.
For acquisitions on or after 1 April 2011, the Group measures goodwill as the excess of the aggregate of consideration transferred, amount recognised for any non-controlling interests in the acquiree and the fair value of any previously held equity interest in the acquiree over the fair value of the identifiable assets acquired and liabilities assumed. When the excess is negative, the difference is recognised immediately in the profit or loss.
Non-controlling interests, being the equity in a subsidiary not attributable directly or indirectly to the equity holders of the Company, in a business combination can be measured either at fair value or at the non-controlling interest’s proportionate share of the net identifiable assets acquired.
Costs related to the acquisition, other than those associated with the issuance of debt or equity securities, that the Group incurs in connection with a business combination are expensed as incurred.

PETRONAS ANNUAL REPORT PE 2011222
43. ADOPTION OF NEW AND REVISED PRONOUNCEMENTS (continued)
i. FRS 3, Business Combinations (revised) (continued)
Prior to adopting FRS 3 (revised), goodwill in respect of all acquisitions made on or after 1 April 2006, represents the excess of the cost of acquisition over the Group’s interest in the fair values of the net identifiable assets and liabilities and contingent liabilities of the acquiree. Transaction costs that the Group incurred in connection with business combinations were capitalised as part of the cost of acquisition.
For acquisitions prior to 1 April 2006, goodwill represents the excess of the cost of acquisition over the Group’s interest in the fair values of the net identifiable assets and liabilities of the acquiree.
This change in accounting policy has been applied prospectively in accordance with the transitional provisions provided by the standard and does not have significant impact on the Group’s reported income or net assets.
ii. Amendments to FRS 101, Presentation of Financial Statements
The Group applies Amendments to FRS 101 which became effective for annual periods beginning on or after 1 January 2011. Arising from the adoption of the Amendments to FRS 101, the statement of changes in equity includes for each component of equity, a reconciliation between the carrying amount at the beginning and the end of the period, separately disclosing changes resulting from profit or loss, other comprehensive income and transactions with owners.
Comparative information has been represented so that it is in conformity with the revised presentation. Since the change only affects presentation aspects, there is no impact on the Group’s and the Company’s reported income or net assets.
iii. FRS 127, Consolidated and Separate Financial Statements (revised)
Since the beginning of the reporting period, the Group has applied FRS 127 (revised) where losses applicable to the non-controlling interests in a subsidiary are allocated to the non-controlling interests even if doing so causes the non-controlling interests to have a deficit balance.
Prior to the adoption of FRS 127 (revised), where losses applicable to the non-controlling interests exceed their interests in the equity of a subsidiary, the excess, and any further losses applicable to the non-controlling interests, were charged against the Group’s interest except to the extent that the non-controlling interests had a binding obligation to, and was able to, make additional investment to cover the losses. If the subsidiary subsequently reported profits, the Group’s interest was allocated all such profits until the non-controlling interests’ share of losses previously absorbed by the Group had been recovered.
In addition, upon implementation of the revised FRS 127, when control of a subsidiary is lost but the Group continues to retain certain equity holdings in the previous subsidiary, then such interest is measured at fair value at the date that control is lost. Subsequently it is accounted for as an equity-accounted investee or as an available-for-sale financial asset depending on the level of influence retained.
Previously if the Group retained any interest in the previous subsidiary, such interest was measured at the carrying amount at the date that control was lost and this carrying amount would be regarded as cost on initial measurement of the investment.
This change in accounting policy has been applied prospectively in accordance with the transitional provisions of the standard and does not have significant impact on the Group’s reported income or net assets.

reimagining energyPETRONAS ANNUAL REPORT PE 2011 223
43. ADOPTION OF NEW AND REVISED PRONOUNCEMENTS (continued)
iv. IC Interpretation 4, Determining Whether an Arrangement contains a Lease
From 1 April 2011, the Group has applied IC Interpretation 4, Determining Whether an Arrangement contains a Lease. When the fulfillment of an arrangement is dependent on the use of a specific asset and the arrangement conveys a right to use the asset, it is accounted for as a lease although the arrangement does not take the legal form of a lease.
Once determined to be a lease arrangement, it is accounted for as finance or operating lease in accordance with the above accounting policy. In particular, where a property, plant and equipment is determined to contain an embedded finance lease arrangement, the accounting treatment in the financial statements of the lessee involves the derecognition of the tangible asset and the recognition of future minimum lease payments due from the customer, equivalent to the net investment in the lease, under receivables and vice versa.
This change in accounting policy has been applied retrospectively in accordance with the transitional provisions provided by the standard and does not have significant impact on the Group’s reported income or net assets.
44. NEW AND REVISED PRONOUNCEMENTS YET IN EFFECT
The following revised FRSs, amendments and IC Interpretations that have been issued by the Malaysian Accounting Standards Board will become effective for future financial reporting periods. Since the Group’s and the Company’s financial statements will be prepared in accordance with the Malaysian Financial Reporting Standards from 1 January 2012 onwards, these pronouncements will not be implemented in the Group’s and the Company’s future financial reporting.
Effective for annual periods beginning on or after 1 July 2011 IC 19, Extinguishing Financial Liabilities with Equity Instruments Amendments to IC 14, Prepayments of a Minimum Funding Requirement
Effective for annual periods beginning on or after 1 January 2012 FRS 124, Related Party Disclosures (revised) Amendments to FRS 1, First-time Adoption of Financial Reporting Standards – Severe Hyperinflation and Removal of Fixed Dates for First-time Adopters Amendments to FRS 7, Financial Instruments: Disclosures – Transfers of Financial Assets Amendments to FRS 112, Income Taxes – Deferred Tax: Recovery of Underlying Assets
Effective for annual periods beginning on or after 1 July 2012 Amendments to FRS 101, Presentation of Financial Statements – Presentation of Items of Other Comprehensive Income
Effective for annual periods beginning on or after 1 January 2013 FRS 9, Financial Instruments (2009) FRS 9, Financial Instruments (2010) FRS 10, Consolidated Financial Statements FRS 11, Joint Arrangements FRS 12, Disclosure of Interests in Other Entities FRS 13, Fair Value Measurement FRS 119, Employee Benefits (2011) FRS 127, Separate Financial Statements (2011) FRS 128, Investments in Associates and Joint Ventures (2011) IC 20, Stripping Costs in the Production Phase of a Surface Mine

PETRONAS ANNUAL REPORT PE 2011224
45. SIGNIFICANT SUBSIDIARIES AND ACTIVITIES
The significant subsidiary undertakings of the Company at 31 December 2011 and the Group percentage of share capital are set out below: Effective Percentage Country of Holding Incorporation Principal Activities 31.12.2011 31.3.2011 % %
* PETRONAS Carigali Sdn. Bhd. 100 100 Malaysia Petroleum exploration, development and production Doba Pipeline Investment Inc. 100 100 Cayman Investment holding Islands
PETRONAS Carigali (Chad EP) Inc. 100 100 Cayman Petroleum operations Islands
PETRONAS Carigali Chad 100 100 Cayman Islands Investment holding Exploration and Production Inc. PETRONAS Carigali Overseas Sdn. Bhd. 100 100 Malaysia Investment holding and petroleum operations
∞* PETRONAS International Corporation Ltd. 100 100 Malaysia Investment holding PC JDA Ltd. 100 100 Republic of Petroleum operations Mauritius
PC Vietnam Ltd. 100 100 Republic of Petroleum operations Mauritius
PETRONAS Australia Pty. Limited 100 100 Australia Investment holding
PAPL (Upstream) Pty. Limited 100 100 Australia Exploration and production of coal seam gas
PETRONAS Carigali (Jabung) Ltd. 100 100 Bahamas Petroleum operations
PETRONAS Carigali (Turkmenistan) Sdn. Bhd. 100 100 Malaysia Petroleum operations PETRONAS Carigali Canada Ltd. 100 - Canada Petroleum operations
PETRONAS Carigali Iraq Holding B.V. 100 100 Netherlands Petroleum operations
PETRONAS Carigali Myanmar Inc. 100 100 Liberia Petroleum operations
PETRONAS Carigali Nile Ltd. 100 100 Republic of Petroleum operations Mauritius
∞ PICL (Egypt) Corporation Ltd. 100 100 Malaysia Investment holding, exploration, and production of oil and gas
Engen Limited 80 80 South Africa Refining of crude oil and marketing of refined petroleum products
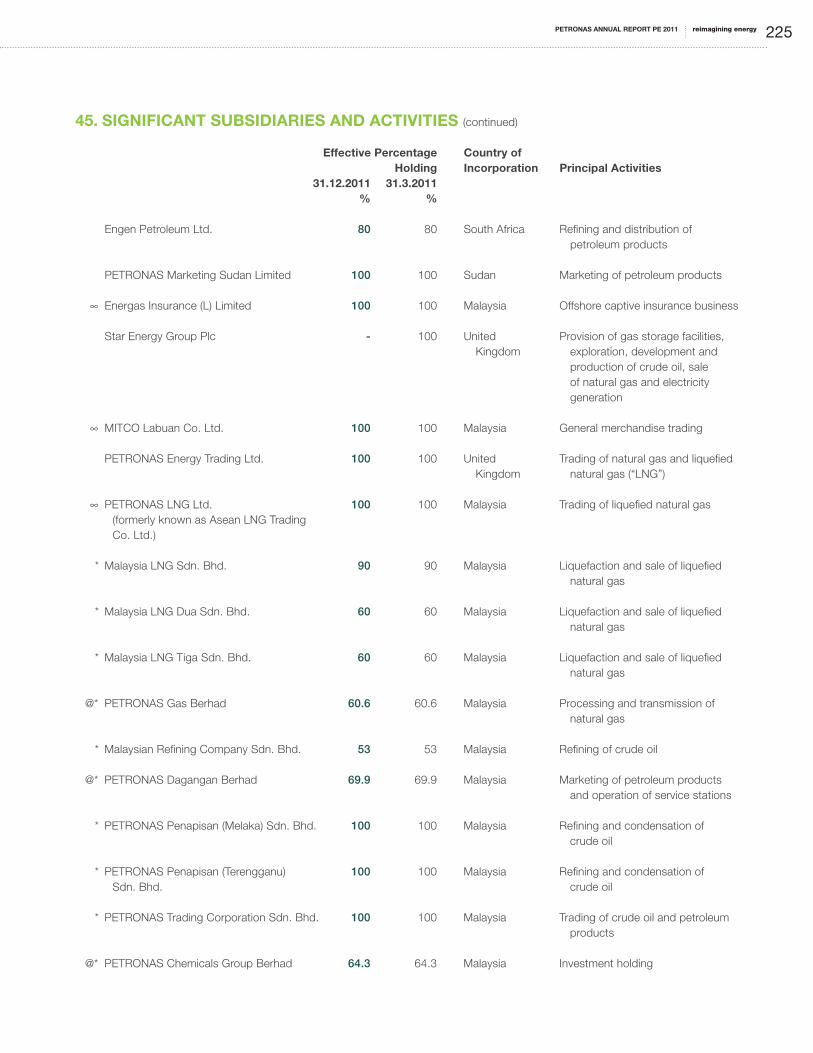
reimagining energyPETRONAS ANNUAL REPORT PE 2011 225
45. SIGNIFICANT SUBSIDIARIES AND ACTIVITIES (continued)
Effective Percentage Country of Holding Incorporation Principal Activities 31.12.2011 31.3.2011 % %
Engen Petroleum Ltd. 80 80 South Africa Refining and distribution of petroleum products
PETRONAS Marketing Sudan Limited 100 100 Sudan Marketing of petroleum products
∞ Energas Insurance (L) Limited 100 100 Malaysia Offshore captive insurance business
Star Energy Group Plc - 100 United Provision of gas storage facilities, Kingdom exploration, development and production of crude oil, sale of natural gas and electricity generation
∞ MITCO Labuan Co. Ltd. 100 100 Malaysia General merchandise trading
PETRONAS Energy Trading Ltd. 100 100 United Trading of natural gas and liquefied Kingdom natural gas (“LNG”)
∞ PETRONAS LNG Ltd. 100 100 Malaysia Trading of liquefied natural gas (formerly known as Asean LNG Trading Co. Ltd.)
* Malaysia LNG Sdn. Bhd. 90 90 Malaysia Liquefaction and sale of liquefied natural gas
* Malaysia LNG Dua Sdn. Bhd. 60 60 Malaysia Liquefaction and sale of liquefied natural gas
* Malaysia LNG Tiga Sdn. Bhd. 60 60 Malaysia Liquefaction and sale of liquefied natural gas
@* PETRONAS Gas Berhad 60.6 60.6 Malaysia Processing and transmission of natural gas
* Malaysian Refining Company Sdn. Bhd. 53 53 Malaysia Refining of crude oil @* PETRONAS Dagangan Berhad 69.9 69.9 Malaysia Marketing of petroleum products and operation of service stations * PETRONAS Penapisan (Melaka) Sdn. Bhd. 100 100 Malaysia Refining and condensation of crude oil
* PETRONAS Penapisan (Terengganu) 100 100 Malaysia Refining and condensation of Sdn. Bhd. crude oil
* PETRONAS Trading Corporation Sdn. Bhd. 100 100 Malaysia Trading of crude oil and petroleum products
@* PETRONAS Chemicals Group Berhad 64.3 64.3 Malaysia Investment holding

PETRONAS ANNUAL REPORT PE 2011226
45. SIGNIFICANT SUBSIDIARIES AND ACTIVITIES (continued)
Effective Percentage Country of Holding Incorporation Principal Activities 31.12.2011 31.3.2011 % %
Aromatics Malaysia Sdn. Bhd. 45 45 Malaysia Production and sale of aromatics products
Asean Bintulu Fertilizer Sdn. Bhd. 40.9 40.9 Malaysia Production and sale of urea and ammonia
OPTIMAL Chemicals (Malaysia) Sdn. Bhd. 64.3 64.3 Malaysia Manufacturing and selling ethylene and propylene derivative products PETRONAS Chemicals Ethylene Sdn. Bhd. 56.3 56.3 Malaysia Production and sale of ethylene (formerly known as Ethylene Malaysia Sdn. Bhd.)
PETRONAS Chemicals Ammonia Sdn. Bhd. 64.3 64.3 Malaysia Production and sale of ammonia, (formerly known as PETRONAS Ammonia syngas and carbon monoxide Sdn. Bhd.)
PETRONAS Chemicals Fertilizer Kedah 64.3 64.3 Malaysia Production and sale of urea, Sdn. Bhd. (formerly known as PETRONAS ammonia and methanol Fertilizer (Kedah) Sdn. Bhd.)
PETRONAS Chemicals Glycols (Malaysia) 64.3 64.3 Malaysia Manufacturing and selling ethylene Sdn. Bhd. (formerly known as Optimal oxide, ethylene glycol and Glycols (Malaysia) Sdn. Bhd.) other glycols PETRONAS Chemicals Marketing Sdn. Bhd. 64.3 64.3 Malaysia Petrochemicals and general trading (formerly known as Malaysian International Trading Corporation Sdn. Bhd.)
PETRONAS Chemicals Methanol Sdn. Bhd. 64.3 64.3 Malaysia Production and sale of methanol (formerly known as PETRONAS Methanol (Labuan) Sdn. Bhd.)
PETRONAS Chemicals MTBE Sdn. Bhd. 64.3 64.3 Malaysia Production and sale of methyl (formerly known as MTBE Malaysia tertiary butyl ether and propylene Sdn. Bhd.)
PETRONAS Chemicals Olefins 56.6 56.6 Malaysia Manufacturing and marketing of Sdn. Bhd. (formerly known as ethylene, propylene and other Optimal Olefins (Malaysia) hydrocarbon products Sdn. Bhd.)
PETRONAS Chemicals Fertiliser 64.3 100 Malaysia Intended to manufacture and Sabah Sdn. Bhd. (formerly market ammonia, urea and any known as Styrene Monomer component or derivative (Malaysia) Sdn. Bhd.) substances

reimagining energyPETRONAS ANNUAL REPORT PE 2011 227
45. SIGNIFICANT SUBSIDIARIES AND ACTIVITIES (continued)
Effective Percentage Country of Holding Incorporation Principal Activities 31.12.2011 31.3.2011 % %
* PrimeSourcing International 100 100 Malaysia Trading and procurement of Sdn. Bhd. (formerly known as equipment spares and materials Malaysian International Trading Corporation (Japan) Sdn. Bhd.)
* PETRONAS Lubricants International 100 100 Malaysia Investment holding, manufacturing Sdn. Bhd. and trading of lubricant products PLI (Netherlands) B.V. 100 100 Netherlands Investment holding
PETRONAS Lubricants Italy S.p.A 100 100 Italy Manufacturing and marketing of lubricant products
@* MISC Berhad 62.6 62.6 Malaysia Shipping and shipping related activities
AET Inc. Limited 62.6 62.6 Bermuda Ship-owning and operations
∞ Malaysia Deepwater Floating 31.8 31.8 Malaysia Floating production storage and off- Terminal (Kikeh) Ltd. loading (“FPSO”) owner
@ Malaysia Marine and Heavy 41.6 41.6 Malaysia Investment holding Engineering Holdings Berhad
MISC Tankers Sdn. Bhd. 62.6 62.6 Malaysia Investment holding and provision of management services
* KLCC (Holdings) Sdn. Bhd. 100 100 Malaysia Property investment related activities and property development
Kuala Lumpur Convention Centre 100 100 Malaysia Property investment Sdn. Bhd.
Midciti Resources Sdn. Bhd. 76.1 76.1 Malaysia Property investment
Putrajaya Holdings Sdn. Bhd. 64.4 64.4 Malaysia Property owner and developer
@* KLCC Property Holdings Berhad 52.6 52.6 Malaysia Property investment, hotel and recreation
Suria KLCC Sdn. Bhd. 31.6 31.6 Malaysia Property investment
* Institute of Technology 100 100 Malaysia Institute of higher learning PETRONAS Sdn. Bhd.
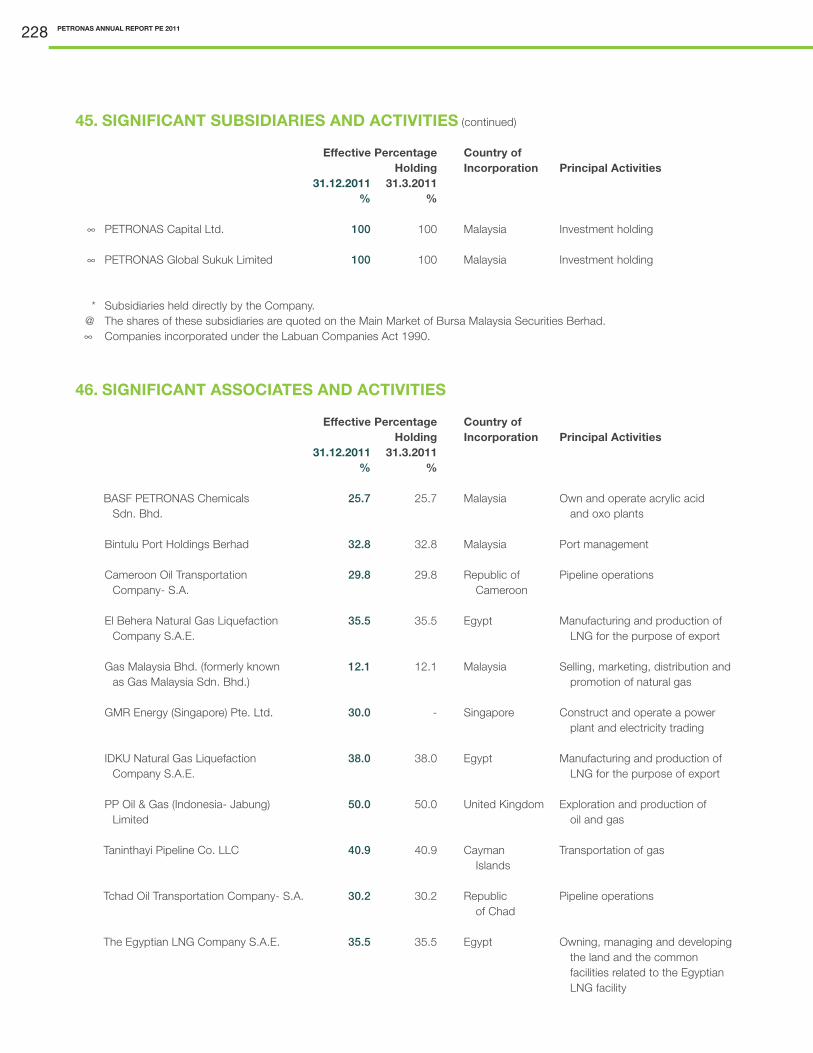
PETRONAS ANNUAL REPORT PE 2011228
45. SIGNIFICANT SUBSIDIARIES AND ACTIVITIES (continued)
Effective Percentage Country of Holding Incorporation Principal Activities 31.12.2011 31.3.2011 % %
∞ PETRONAS Capital Ltd. 100 100 Malaysia Investment holding
∞ PETRONAS Global Sukuk Limited 100 100 Malaysia Investment holding
* Subsidiaries held directly by the Company. @ The shares of these subsidiaries are quoted on the Main Market of Bursa Malaysia Securities Berhad. ∞ Companies incorporated under the Labuan Companies Act 1990.
46. SIGNIFICANT ASSOCIATES AND ACTIVITIES Effective Percentage Country of Holding Incorporation Principal Activities 31.12.2011 31.3.2011 % %
BASF PETRONAS Chemicals 25.7 25.7 Malaysia Own and operate acrylic acid Sdn. Bhd. and oxo plants
Bintulu Port Holdings Berhad 32.8 32.8 Malaysia Port management
Cameroon Oil Transportation 29.8 29.8 Republic of Pipeline operations Company- S.A. Cameroon
El Behera Natural Gas Liquefaction 35.5 35.5 Egypt Manufacturing and production of Company S.A.E. LNG for the purpose of export
Gas Malaysia Bhd. (formerly known 12.1 12.1 Malaysia Selling, marketing, distribution and as Gas Malaysia Sdn. Bhd.) promotion of natural gas
GMR Energy (Singapore) Pte. Ltd. 30.0 - Singapore Construct and operate a power plant and electricity trading
IDKU Natural Gas Liquefaction 38.0 38.0 Egypt Manufacturing and production of Company S.A.E. LNG for the purpose of export
PP Oil & Gas (Indonesia- Jabung) 50.0 50.0 United Kingdom Exploration and production of Limited oil and gas
Taninthayi Pipeline Co. LLC 40.9 40.9 Cayman Transportation of gas Islands
Tchad Oil Transportation Company- S.A. 30.2 30.2 Republic Pipeline operations of Chad
The Egyptian LNG Company S.A.E. 35.5 35.5 Egypt Owning, managing and developing the land and the common facilities related to the Egyptian LNG facility

reimagining energyPETRONAS ANNUAL REPORT PE 2011 229
47. SIGNIFICANT JOINTLY-CONTROLLED ENTITIES AND ACTIVITIES
Effective Percentage Country of Holding Incorporation Principal Activities 31.12.2011 31.3.2011 % %
BP PETRONAS Acetyls Sdn. Bhd. 19.3 19.3 Malaysia Manufacture, sell and distribute acetic acid
Dragon LNG Group Ltd. 50.0 30.0 United Operate LNG import and Kingdom storage terminal
Trans Thai-Malaysia (Thailand) Ltd. 50.0 50.0 Thailand Gas pipeline transportation and gas separation services
Trans Thai-Malaysia (Malaysia) 50.0 50.0 Malaysia Transporting and delivering gas Sdn. Bhd. products
Indianoil PETRONAS Private Limited 50.0 50.0 India Manufacture and bottling services of LPG
VTTI B.V. 31.3 31.3 Netherlands Owning, operating and managing a network of oil product storage terminals and refineries
PETRONAS ANNUAL REPORT PE 2011230
REPORT OF THE AUDITORS TO THE MEMBERS
Report on the Financial Statements
We have audited the financial statements of Petroliam Nasional Berhad, which comprise the statements of financial position as at 31 December 2011 of the Group and of the Company, and the statements of comprehensive income, changes in equity and cash flows of the Group and of the Company for the period then ended, and a summary of significant accounting policies and other explanatory notes, as set out on pages 125 to 229.
Directors’ Responsibility for the Financial Statements
The Directors of the Company are responsible for the preparation of financial statements that give a true and fair view in accordance with Financial Reporting Standards and the Companies Act, 1965 in Malaysia, and for such internal control as the Directors determine are necessary to enable the preparation of financial statements that are free from material misstatement, whether due to fraud or error.
Auditors’ Responsibility
Our responsibility is to express an opinion on these financial statements based on our audit. We conducted our audit in accordance with approved standards on auditing in Malaysia. Those standards require that we comply with ethical requirements and plan and perform the audit to obtain reasonable assurance about whether the financial statements are free from material misstatement.
An audit involves performing procedures to obtain audit evidence about the amounts and disclosures in the financial statements. The procedures selected depend on our judgment, including the assessment of risks of material misstatement of the financial statements, whether due to fraud or error. In making those risk assessments, we consider internal control relevant to the entity’s preparation of financial statements that give a true and fair view in order to design audit procedures that are appropriate in the circumstances, but not for the purpose of expressing an opinion on the effectiveness of the entity’s internal control. An audit also includes evaluating the appropriateness of accounting policies used and the reasonableness of accounting estimates made by the Directors, as well as evaluating the overall presentation of the financial statements.
We believe that the audit evidence we have obtained is sufficient and appropriate to provide a basis for our audit opinion.
Opinion
In our opinion, the financial statements have been properly drawn up in accordance with Financial Reporting Standards and the Companies Act, 1965 in Malaysia so as to give a true and fair view of the financial position of the Group and of the Company as of 31 December 2011 and of their financial performance and cash flows for the period then ended.
Report on Other Legal and Regulatory Requirements
In accordance with the requirements of the Companies Act, 1965 in Malaysia, we also report the following:
a) In our opinion, the accounting and other records and the registers required by the Act to be kept by the Company and its subsidiaries of which we have acted as auditors have been properly kept in accordance with the provisions of the Act.
b) We have considered the accounts and the auditors’ reports of all the subsidiaries of which we have not acted as auditors, which are indicated in Appendix I to the financial statements.
c) We are satisfied that the accounts of the subsidiaries that have been consolidated with the Company’s financial statements are in form and content appropriate and proper for the purposes of the preparation of the financial statements of the Group and we have received satisfactory information and explanations required by us for those purposes.
d) The audit reports on the accounts of the subsidiaries did not contain any qualification or any adverse comment made under Section 174(3) of the Act.

reimagining energyPETRONAS ANNUAL REPORT PE 2011 231
Other Matters
This report is made solely to the members of the Company, as a body, in accordance with Section 174 of the Companies Act, 1965 in Malaysia and for no other purpose. We do not assume responsibility to any other person for the content of this report.
KPMG Desa Megat & Co. Abdullah Abu SamahFirm Number: AF 0759 PartnerChartered Accountants Approval Number: 2013/06/12(J) Chartered Accountant
Petaling Jaya, Malaysia
Date: 29 February 2012
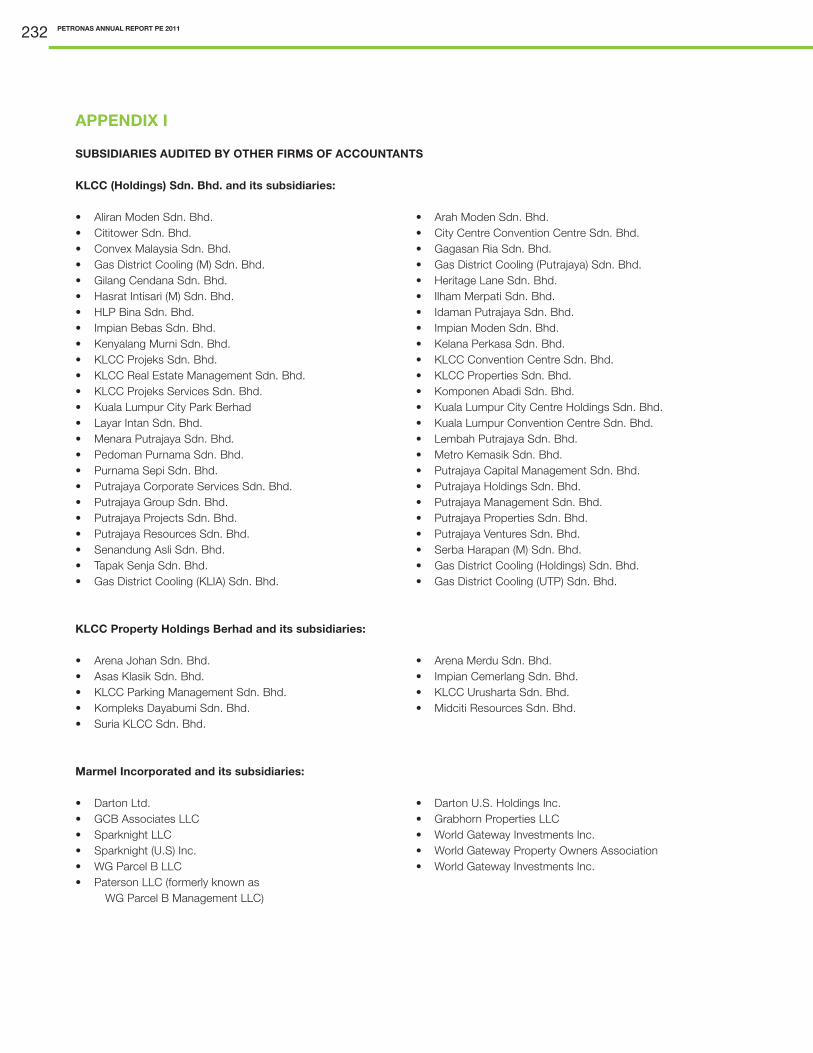
PETRONAS ANNUAL REPORT PE 2011232
APPENDIX I
SUBSIDIARIES AUDITED BY OTHER FIRMS OF ACCOUNTANTS
KLCC (Holdings) Sdn. Bhd. and its subsidiaries:
• AliranModenSdn.Bhd. • ArahModenSdn.Bhd.• CititowerSdn.Bhd. • CityCentreConventionCentreSdn.Bhd.• ConvexMalaysiaSdn.Bhd. • GagasanRiaSdn.Bhd.• GasDistrictCooling(M)Sdn.Bhd. • GasDistrictCooling(Putrajaya)Sdn.Bhd.• GilangCendanaSdn.Bhd. • HeritageLaneSdn.Bhd.• HasratIntisari(M)Sdn.Bhd. • IlhamMerpatiSdn.Bhd.• HLPBinaSdn.Bhd. • IdamanPutrajayaSdn.Bhd.• ImpianBebasSdn.Bhd. • ImpianModenSdn.Bhd.• KenyalangMurniSdn.Bhd. • KelanaPerkasaSdn.Bhd.• KLCCProjeksSdn.Bhd. • KLCCConventionCentreSdn.Bhd.• KLCCRealEstateManagementSdn.Bhd. • KLCCPropertiesSdn.Bhd.• KLCCProjeksServicesSdn.Bhd. • KomponenAbadiSdn.Bhd.• KualaLumpurCityParkBerhad • KualaLumpurCityCentreHoldingsSdn.Bhd.• LayarIntanSdn.Bhd. • KualaLumpurConventionCentreSdn.Bhd.• MenaraPutrajayaSdn.Bhd. • LembahPutrajayaSdn.Bhd.• PedomanPurnamaSdn.Bhd. • MetroKemasikSdn.Bhd.• PurnamaSepiSdn.Bhd. • PutrajayaCapitalManagementSdn.Bhd.• PutrajayaCorporateServicesSdn.Bhd. • PutrajayaHoldingsSdn.Bhd.• PutrajayaGroupSdn.Bhd. • PutrajayaManagementSdn.Bhd.• PutrajayaProjectsSdn.Bhd. • PutrajayaPropertiesSdn.Bhd.• PutrajayaResourcesSdn.Bhd. • PutrajayaVenturesSdn.Bhd.• SenandungAsliSdn.Bhd. • SerbaHarapan(M)Sdn.Bhd.• TapakSenjaSdn.Bhd. • GasDistrictCooling(Holdings)Sdn.Bhd.• GasDistrictCooling(KLIA)Sdn.Bhd. • GasDistrictCooling(UTP)Sdn.Bhd.
KLCC Property Holdings Berhad and its subsidiaries:
• ArenaJohanSdn.Bhd. • ArenaMerduSdn.Bhd.• AsasKlasikSdn.Bhd. • ImpianCemerlangSdn.Bhd.• KLCCParkingManagementSdn.Bhd. • KLCCUrushartaSdn.Bhd.• KompleksDayabumiSdn.Bhd. • MidcitiResourcesSdn.Bhd.• SuriaKLCCSdn.Bhd.
Marmel Incorporated and its subsidiaries:
• DartonLtd. • DartonU.S.HoldingsInc.• GCBAssociatesLLC • GrabhornPropertiesLLC• SparknightLLC • WorldGatewayInvestmentsInc.• Sparknight(U.S)Inc. • WorldGatewayPropertyOwnersAssociation• WGParcelBLLC • WorldGatewayInvestmentsInc.• PatersonLLC(formerlyknownas WG Parcel B Management LLC)
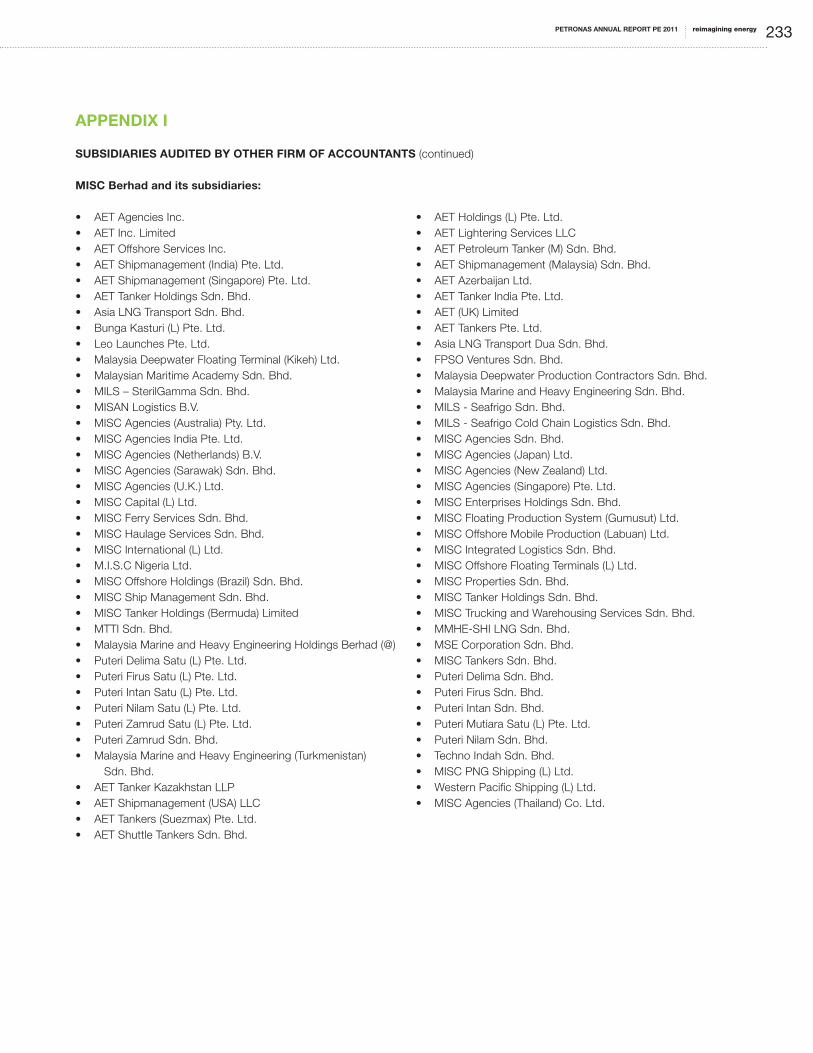
reimagining energyPETRONAS ANNUAL REPORT PE 2011 233
APPENDIX I
SUBSIDIARIES AUDITED BY OTHER FIRM OF ACCOUNTANTS (continued)
MISC Berhad and its subsidiaries:
• AETAgenciesInc. • AETHoldings(L)Pte.Ltd.• AETInc.Limited • AETLighteringServicesLLC• AETOffshoreServicesInc. • AETPetroleumTanker(M)Sdn.Bhd.• AETShipmanagement(India)Pte.Ltd. • AETShipmanagement(Malaysia)Sdn.Bhd.• AETShipmanagement(Singapore)Pte.Ltd. • AETAzerbaijanLtd.• AETTankerHoldingsSdn.Bhd. • AETTankerIndiaPte.Ltd.• AsiaLNGTransportSdn.Bhd. • AET(UK)Limited• BungaKasturi(L)Pte.Ltd. • AETTankersPte.Ltd.• LeoLaunchesPte.Ltd. • AsiaLNGTransportDuaSdn.Bhd.• MalaysiaDeepwaterFloatingTerminal(Kikeh)Ltd. • FPSOVenturesSdn.Bhd.• MalaysianMaritimeAcademySdn.Bhd. • MalaysiaDeepwaterProductionContractorsSdn.Bhd.• MILS–SterilGammaSdn.Bhd. • MalaysiaMarineandHeavyEngineeringSdn.Bhd.• MISANLogisticsB.V. • MILS-SeafrigoSdn.Bhd.• MISCAgencies(Australia)Pty.Ltd. • MILS-SeafrigoColdChainLogisticsSdn.Bhd.• MISCAgenciesIndiaPte.Ltd. • MISCAgenciesSdn.Bhd.• MISCAgencies(Netherlands)B.V. • MISCAgencies(Japan)Ltd.• MISCAgencies(Sarawak)Sdn.Bhd. • MISCAgencies(NewZealand)Ltd.• MISCAgencies(U.K.)Ltd. • MISCAgencies(Singapore)Pte.Ltd.• MISCCapital(L)Ltd. • MISCEnterprisesHoldingsSdn.Bhd.• MISCFerryServicesSdn.Bhd. • MISCFloatingProductionSystem(Gumusut)Ltd.• MISCHaulageServicesSdn.Bhd. • MISCOffshoreMobileProduction(Labuan)Ltd.• MISCInternational(L)Ltd. • MISCIntegratedLogisticsSdn.Bhd.• M.I.S.CNigeriaLtd. • MISCOffshoreFloatingTerminals(L)Ltd.• MISCOffshoreHoldings(Brazil)Sdn.Bhd. • MISCPropertiesSdn.Bhd.• MISCShipManagementSdn.Bhd. • MISCTankerHoldingsSdn.Bhd.• MISCTankerHoldings(Bermuda)Limited • MISCTruckingandWarehousingServicesSdn.Bhd.• MTTISdn.Bhd. • MMHE-SHILNGSdn.Bhd.• MalaysiaMarineandHeavyEngineeringHoldingsBerhad(@) • MSECorporationSdn.Bhd.• PuteriDelimaSatu(L)Pte.Ltd. • MISCTankersSdn.Bhd.• PuteriFirusSatu(L)Pte.Ltd. • PuteriDelimaSdn.Bhd.• PuteriIntanSatu(L)Pte.Ltd. • PuteriFirusSdn.Bhd.• PuteriNilamSatu(L)Pte.Ltd. • PuteriIntanSdn.Bhd.• PuteriZamrudSatu(L)Pte.Ltd. • PuteriMutiaraSatu(L)Pte.Ltd.• PuteriZamrudSdn.Bhd. • PuteriNilamSdn.Bhd.• MalaysiaMarineandHeavyEngineering(Turkmenistan) • TechnoIndahSdn.Bhd. Sdn.Bhd. • MISCPNGShipping(L)Ltd.• AETTankerKazakhstanLLP • WesternPacificShipping(L)Ltd.• AETShipmanagement(USA)LLC • MISCAgencies(Thailand)Co.Ltd.• AETTankers(Suezmax)Pte.Ltd.• AETShuttleTankersSdn.Bhd.

PETRONAS ANNUAL REPORT PE 2011234
APPENDIX I
SUBSIDIARIES AUDITED BY OTHER FIRM OF ACCOUNTANTS (continued)
PETRONAS Carigali Sdn. Bhd. and its subsidiaries:
• DobaPipelineInvestmentInc. • PCAlgeriaLtd.(ϒ)• PCGulfLtd. • PCLampungIILtd.• PC(NorthEastMaduraIV)Ltd. • PCRanduguntingLtd.• PC(SEPalungAru)Ltd. • PC(SouthPars)11Ltd.• PC(TimorSea06-102)Ltd. • PCVenezuelaLtd.• PETRONASCarigali(Australia)Pty.Ltd. • PETRONASCarigali(Baisun)OperatingCompanyLLC• PETRONASCarigali(ChadEP)Inc. • PETRONASCarigali(Karapan)Ltd.• PETRONASCarigali(Ketapang)Ltd. • PCKetapangIILtd.• PETRONASCarigali(Surumana)Ltd. • PETRONASCarigali(Surkhanski)OperatingCompanyLLC• PETRONASCarigali(TanjungJabung)Ltd. • PETRONASCarigali(TanjungAru)Ltd.• PETRONASCarigaliEquatorialGuineaLtd. • PETRONASCarigaliChadExploration&ProductionInc.• PETRONASChadMarketingInc. • PETRONASCarigaliInternationalSdn.Bhd.• PETRONASCarigaliMyanmarIIInc. • PETRONASCarigaliMozambiqueE&PLtd.• PETRONASCarigaliNigerExploration&ProductionLtd. • PETRONASCarigaliNigeriaLimited• PETRONASCarigaliWhiteNile(5B)Ltd. • PETRONASCarigaliOverseasSdn.Bhd.• PETRONASCarigaliVietnam(Blocks10&11-1)Ltd. • SeeratRefineryInvestmentInc.• PETRONASCarigali(Mandar)Ltd. • PCMozambique(RovumaBasin)Ltd.• PETRONASCarigali(Oman)Ltd. • PETRONASCarigaliCameroonLtd.• PETRONASIraqGarrafLtd. • PETRONASCarigali(Baisun)Ltd.• PETRONASCarigaliIraq(Halfaya)Ltd. • PETRONASCarigali(WestGlagahKambuna)Ltd.• PETRONASCarigaliIraqHoldingB.V. • PETRONASCarigaliIraq(Majnoon)Ltd.• PETRONASCarigaliIraq(Badra)Ltd. • E&PVentureSolutionsCo.Sdn.Bhd.
PETRONAS Chemicals Group Berhad and its subsidiaries:
• KertihPortSdn.Bhd. • PETLIN(Malaysia)Sdn.Bhd.• PETRONASChemicalsAmmoniaSdn.Bhd. • PETRONASChemicalsFertilizerKedahSdn.Bhd. (formerly known as PETRONAS Ammonia Sdn. Bhd.) (formerly known as PETRONAS Fertilizer (Kedah) Sdn. Bhd.)• PhuMyPlasticsandChemicalsCo.Ltd.(α) • OPTIMALChemicals(Malaysia)Sdn.Bhd.• PETRONASChemicalsGlycols(Malaysia)Sdn.Bhd. • PETRONASChemicalsOlefinsSdn.Bhd. (formerly known as Optimal Glycols (Malaysia) Sdn. Bhd.) (formerly known as Optimal Olefins (Malaysia) Sdn. Bhd.)• VinylChloride(Malaysia)Sdn.Bhd. • PETRONASChemicalsTrading(Labuan)Ltd.(α)
PETRONAS Hartabina Sdn. Bhd. and its subsidiary:
• PrinceCourtMedicalCentreSdn.Bhd.

reimagining energyPETRONAS ANNUAL REPORT PE 2011 235
APPENDIX I
SUBSIDIARIES AUDITED BY OTHER FIRM OF ACCOUNTANTS (continued)
PETRONAS International Corporation Ltd. and its subsidiaries:
• AktolChemicals(Pty.)Ltd.• AzaniaPetroleum(Pty.)Ltd.• CitycatProperties(Pty.)Ltd.• Chemico(Pty.)Ltd.• EngenAfricanMinorityHoldings• EngenGabonS.A.• EngenGroupFundingTrust• EngenHoldings(Ghana)Ltd.• EngenInternationalHoldings(Mauritius)Ltd.• EngenLesotho(Pty.)Ltd.• EngenMarketingBotswana(Pty.)Ltd.• Engen(Nigeria)Ltd.• EngenOffshoreHoldings(Mauritius)Ltd.• EngenSwaziland(Pty.)Ltd.• EngenRwandaLtd.• EngenPetroleumZimbabwe(PVT)Ltd.• EngenPetroleumInternationalLtd.• EngenPetroleum(Mocambique)Ltd.• EngenPetroleumZambiaLtd.• EngenGuinea-BissauLtd.• EnpetInsuranceLtd.• FedericoTrading(Pty.)Ltd.• IvoryProperties(Pty.)Ltd.• Imtrasel(Pty.)Ltd.• LabuanEnergyCorporationLimited• NewJackTrading(Pty.)Ltd.• PAPL(Upstream)PtyLimited• PCJDALtd.• PCMuriahLtd.• PCMyanmar(HongKong)Ltd.• PAPLServicesPtyLimited• PAPL(UpstreamII)PtyLimited• PetroleumInvestmentHoldingLtd.• PETRONASEnergyTradingLtd. (formerly known as PETGAS Trading UK Ltd.) (ϒ)• PETRONASCarigaliMyanmarInc.• PETRONASCarigaliNileLtd.• PCGreenlandHoldingLtd.• PCGreenlandA/S• PETRONASCarigaliMyanmarIIIInc.• ArgentineanPipelineHoldingCompanyS.A. (formerly known as PETRONAS Argentina S.A.) (α) (ϒ)• PETRONASCarigali(Urga)Ltd.• PETRONASMarketingSudanLtd.• ChevronZimbabwe(Pvt)Ltd.• PETRONASPhilippinesInc.(α) (ϒ)• PETRONAS(Thailand)Co.Ltd.(α)
• PETRONASLNGLtd. (formerly known as Asean LNG Trading Co. Ltd.)• BGIPropertiesLtd.• CavalloEngineering&Construction(Pty.)Ltd.• DurbanLiquidStoragePty.Ltd.• EngenAfricanHoldings• EngenBotswanaLimited(β)• EngenGhanaLtd.• EngenHoldings(Pty.)Ltd.• EngenHoldingsZimbabwe(PVT)Ltd.• EngenKenyaLtd.• EngenLimited• EngenMarketingLtd.• EngenMarketingZimbabweLtd.• EngenNamibia(Pty.)Ltd.• EngenProducing(Nigeria)Ltd.• EngenUgandaLtd.• EngenPetroleum(Burundi)Ltd.• EngenPetroleum(DRC)Ltd.• EngenPetroleumLtd.• EngenPetroleumTanzaniaLtd.• EngenPetroleumZimbabwe(PVT)Ltd.• EnpetAfricaInsuranceLtd.• MITCOLabuanCo.Limited• MyanmarPETRONASTradingCo.Ltd.• LECIrelandEmploymentLtd.• MITCOLabuanIndiaPrivateLimited• NadaPropertiesCompanyLtd.• Natuna1B.V.• OilTankingLtd.• Pakenzyl(Pty.)Ltd.• ParsiInternationalLtd.• PCMaduraLtd.• PAPL(Downstream)PtyLimited• PCMyanmarHoldingsLtd.(ϒ)• PCVietnamLtd.• PetrarchPetroleum(Pty.)Ltd.• PETRONASAustraliaPty.Ltd.• PETRONASCarigali(Jabung)Ltd.• PETRONASCarigali(Turkmenistan)Sdn.Bhd.• PETRONASCarigali(Urga)OperatingCompanyLLC(ϒ)• PETRONASMarketing(India)PrivateLtd.• PETRONASMarketing(Thailand)Co.Ltd.(α)• PETRONASNatunaSdn.Bhd.• PETRONASRetail(Thailand)Co.Ltd.(α)• PETRONASRetailProperty(Thailand)Co.Ltd.(α)

PETRONAS ANNUAL REPORT PE 2011236
APPENDIX I
SUBSIDIARIES AUDITED BY OTHER FIRM OF ACCOUNTANTS (continued)
PETRONAS International Corporation Ltd. and its subsidiaries (continued):
• PETRONASVietnamCo.Ltd.• PICLSiriCompanyLimited(α)• PICLDownstream(Mauritius)Ltd.• PSEKinsaleEnergyLtd.• PTPETRONASNiagaIndonesia(α)• PCMauritaniaIPtyLimited• PCMauritaniaIIB.V.• PCBruneiCo.Ltd.• PETRONASLNGSdn.Bhd.• PETRONASLNG(UK)Ltd.• Quickstep285(Pty.)Ltd.• RenaissancePetroleum(Pty.)Ltd.• SEPBurundi• PETRONASPowerSdn.Bhd.• PETRONASMarketingVenturesLtd. (formerly known as PICL Southern Sudan Co. Ltd.)• ThangLongLPGJVCompanyLtd.• PETRONASLubricant(Thailand)Co.Ltd. (formerly known as The Fifth Retail Ltd.)• TrekPetroleum(Pty.)Ltd.• ZenexOil(Pty.)Ltd.• EngenOilLesotho(Pty.)Ltd.• EngenProperties(Pty.)Ltd.• EngenReunionSA• EngenPetroleum(Mauritius)Ltd.
• PICLMarketingThailandLtd.(ϒ)• PICL(Egypt)CorporationLtd.• PSEIrelandLimited• PSESevenHeadLtd.• Quickstep284(Pty.)Ltd.• Quickstep286(Pty.)Ltd.• RockyhillProperties(Pty.)Ltd.• SirriInternationalLtd.• SonapPetroleum(SouthAfrica)(Pty.)Ltd.• ENGENLtd.(Malawi)• ENGENDRCSARL• PCCanadaBV• PCCanadaLtd.• PetrochemicalShippingLtd.• AeroServicesSARL• UniversalPropertyCompanyLimited(α)• XimexEnergyHoldings(PVT)Ltd.• ValaisInvestments(Pty.)Ltd.• EngenMarketingTanzaniaLtd.• SocietedeTransportMaceSA• EngenCompany(Mauritius)Ltd.• EngenOilTankingLtd.• KabuyeDepotHoldingCompanyRwandaLtd.
PETRONAS Maritime Services Sdn. Bhd. and its subsidiary:
• SungaiUdangPortSdn.Bhd.
PETRONAS Assets Sdn. Bhd. and its subsidiaries:
• iPerintisSdn.Bhd. • PetrofibreNetwork(M)Sdn.Bhd.
PLI (Netherlands) B.V. and its subsidiaries:
• PETRONASLubricantsItalyS.p.A(α) • PETRONASLubricantsBelgiumN.V.(α)• PETRONASLubrificantesBrasilS.A.(α) • ViscosityOilCo.(α)• PETRONASLubricantsFranceS.A.S. • PETRONASLubricantsPolandSp.Zo.o(α)• PETRONASLubricantsNetherlandsB.V.(α) • PETRONASLubricantsArgentinaS.A.(α)• PETRONASMadeniYaglarTICLTDSTI(α) • PETRONASLubricantsGreatBritainLtd.(α)• PETRONASLubricantsSpainS.L.U.(α) • PETRONASLubricantsDeutschlandGmbH(α)• PETRONASLubricantsPortugalLda(α) • ViscosityOilFincoLLC(α)• FLNomineesLtd.(α)

reimagining energyPETRONAS ANNUAL REPORT PE 2011 237
APPENDIX I
SUBSIDIARIES AUDITED BY OTHER FIRM OF ACCOUNTANTS (continued)
Subsidiaries held directly by the Company:
• EnergasInsurance(L)Limited • InstituteofTechnologyPETRONASSdn.Bhd.• PETRONASManagementTrainingSdn.Bhd. • PETRONASe-LearningSolutionsSdn.Bhd.• PETRONASSouthAfrica(Pty.)Ltd.(α) • PETRONASIndia(Holdings)Co.Pte.Ltd.(α)• PETRONASNGVSdn.Bhd.
ϒ Consolidated based on management financial statements.α Audited by affiliates of KPMG Desa Megat and Co.@ The shares of this subsidiary are quoted on the Main Market of Bursa Malaysia Securities Berhad.β The shares of this subsidiary are quoted on the Botswana Stock Exchange.

Petroliam Nasional Berhad (Company No. 20076-K)
Registered Office: Tower 1, PETRONAS Twin Towers,
Kuala Lumpur City Centre, 50088 Kuala Lumpur Malaysia
T +603 2051 5000
F +603 2026 5050
www.petronas.com
REIMAG
ININ
G EN
ERGY P
E2011 A
NN
UA
L RE
PO
RT