Embed Size (px)
Citation preview

Research ArticleRelation between Blood Pressure Management and RenalEffects of Sodium-Glucose Cotransporter 2 Inhibitors in DiabeticPatients with Chronic Kidney Disease
Kazuo Kobayashi ,1 Masao Toyoda ,1,2 Noriko Kaneyama ,1,2 Nobuo Hatori,1
Takayuki Furuki,1 Hiroyuki Sakai,1 Masahiro Takihata,1 Tomoya Umezono,1 Shun Ito,1
Daisuke Suzuki,1 Hiroshi Takeda,1 Akira Kanamori,1 Hisakazu Degawa,1
Hareaki Yamamoto,1 Hideo Machimura,1 Atsuko Mokubo,1 Keiichi Chin,1 Mitsuo Obana,1
Toshimasa Hishiki,1 Kouta Aoyama,1 Shinichi Nakajima,1 Shinichi Umezawa,1
Hidetoshi Shimura,1 Togo Aoyama,1 and Masaaki Miyakawa1
1Committee of Hypertension and Kidney Disease, Kanagawa Physicians Association, Yokohama, Kanagawa Prefecture, Japan2Division of Nephrology, Endocrinology and Metabolism, Department of Internal Medicine, Tokai University School of Medicine,Isehara, Kanagawa 259-1193, Japan
Correspondence should be addressed to Kazuo Kobayashi; [email protected]
Received 9 January 2019; Revised 15 May 2019; Accepted 26 August 2019; Published 3 November 2019
Academic Editor: Raffaele Marfella
Copyright © 2019 Kazuo Kobayashi et al. This is an open access article distributed under the Creative Commons AttributionLicense, which permits unrestricted use, distribution, and reproduction in any medium, provided the original work isproperly cited.
Aim. The renoprotective effect of sodium-glucose cotransporter 2 inhibitors is thought to be due, at least in part, to a decrease inblood pressure. The aim of this study was to determine the renal effects of these inhibitors in low blood pressure patients and thedependence of such effect on blood pressure management status.Methods. The subjects of this retrospective study were 740 patientswith type 2 diabetes mellitus and chronic kidney disease who had been managed at the clinical facilities of the Kanagawa PhysiciansAssociation. Data on blood pressure management status and urinary albumin-creatinine ratio were analyzed before and aftertreatment. Results. Changes in the logarithmic value of urinary albumin-creatinine ratio in 327 patients with blood pressure <130/80mmHg at the initiation of treatment and in 413 patients with BP above 130/80mmHg were −0:13 ± 1:05 and −0:24 ±0:97, respectively. However, there was no significant difference between the two groups by analysis of covariance models afteradjustment of the logarithmic value of urinary albumin-creatinine ratio at initiation of treatment. Changes in the logarithmicvalue of urinary albumin-creatinine ratio in patients with mean blood pressure of <102mmHg (n = 537) and those with≥102mmHg (n = 203) at the time of the survey were −0:25 ± 1:02 and −0:03 ± 0:97, respectively, and the difference wassignificant in analysis of covariance models even after adjustment for the logarithmic value of urinary albumin-creatinine ratioat initiation of treatment (p < 0:001). Conclusion. Our results confirmed that blood pressure management status after treatmentwith SGLT2 inhibitors influences the extent of change in urinary albumin-creatinine ratio. Stricter blood pressure managementis needed to allow the renoprotective effects of sodium-glucose cotransporter 2 inhibitors.
1. Introduction
Sodium-glucose cotransporter 2 inhibitors (SGLT2i) are neworal glucose-lowering agents, which act by increasing urineglucose excretion through inhibition of SGLT2 present in
the renal proximal tubules. The associated loss of caloriesthrough the huge amount of urinary glucose excretion leadsto body weight (BW) loss. In addition to their direct effectson blood glucose level, SGLT2i have other indirect beneficialeffects, such as lowering blood pressure (BP) and improving
HindawiJournal of Diabetes ResearchVolume 2019, Article ID 9415313, 7 pageshttps://doi.org/10.1155/2019/9415313

dyslipidemia and liver dysfunction. These pleiotropic effectshave attracted attention and wide use of SGLT2i in the treat-ment of type 2 diabetes mellitus (T2DM), especially in obesepatients.
The results of several large-scale cardiovascular outcomeclinical trials on SGLT2i, such as the EMPA-REG OUT-COME trial [1] and CANVAS/CANVAS-R program [2],showed significant improvement in cardiovascular eventsand even diabetic nephropathy in T2DM patients. Our groupalso reported previously that SGLT2i reduce the urinaryalbumin-creatinine ratio (ACR; mg/gCr) in Japanese T2DMpatients with chronic kidney disease (CKD) [3]. This mecha-nism of this effect was not completely understood and pre-sumed to be indirectly related to a decrease in BP. In thisregard, little is known at present on the renal effects ofSGLT2i in low BP patients and the overall effects of BP man-agement on the clinical outcome of treatment with SGLT2i.The aim of the present retrospective study was to investigatethese two issues in adult patients with diabetic nephropathytreated with SGLT2i.
2. Material and Methods
2.1. Study Design and Study Population. The study wasapproved by the Human Ethics Committee of KanagawaMedical Association (#1576, August 23, 2016). The studysubjects included all 935 T2DM patients who were registeredand visited the clinics of medical facilities of the KanagawaPhysicians Association between November 2016 and March2017. The inclusion criteria of this study were as follows:T2DM patients (1) aged more than 20 years, (2) who com-menced treatment with SGLT2i for the first time at least4 months before the current study, and (3) who had CKDas defined by the K/DOQI clinical practice guidelines forCKD [4]. These guidelines include >3 months of diagnosisof CKD that was based on one of the following criteria: (i)positivity for markers of kidney damage (albuminuria(ACR > 30mg/gCr), urine sediment abnormalities, electro-lyte and other abnormalities associated with tubular disor-ders, abnormalities detected by histology, and structuralabnormalities detected by imaging), (ii) history of kidneytransplantation, or (iii) low glomerular filtration rate (GFR)(estimatedGFR ðeGFRÞ < 60ml/min/1:73m2). The follow-ing patients were excluded: (1) type 1 DM, (2) on chronicdialysis, (3) had severe liver dysfunction, severe heart failure,or severe infection, (4) malignancy on terminal stage, (5)pregnant women, (6) irregular use of SGLT2i during thestudy period based on information included in the medicalrecords, and (7) individuals who indicated intention of opt-out at the time of the survey. The following parameters wererecorded both at the time of initiation of SGLT2i treat-ment and at the time of the survey: age, sex, BW, BP(both systolic (SBP) and diastolic (DBP)), serum Cr, hemo-globin A1c (HbA1c), ACR (mg/gCr), and proteinuria (quanti-tative or qualitative). Based on the above criteria, 67 patientswere excluded from the study. Thus, the study included 740patients who were treated with SGLT2i for a median durationof 15.9 months (range 4-36, i.e., the time from the initiationof SGLT2i therapy to the present study). We collected data
based on the observations of the GPs. BP measurements atoffice were performed at each participating medical officeusing their own validated cuff oscillometric devices. Accordingto the JSH 2014 guidelines [5], BP at office was measured in aquiet environment after the patient rested for a few minutes inthe seated position on a chair with their legs not crossed.When two consecutive measurements were taken 1–2 minutesapart, the average of the two measurements was defined asthe BP at office. The eGFR was calculated using the followingformula: (eGFR ðml/min/1:73m2Þ = 194 × age−0:287 × serumcreatinine−1:094 × ½0:739 for women�) [6].
The study patients were divided into two groups based onBP management status: the “poorly controlled” group, whichincluded 413 patients whose SBP or DBP at the initiation ofSGLT2i treatment was over 130mmHg or 80mmHg, respec-tively, and the “well-controlled” group that comprised 327patients with BP at the initiation of SGLT2i of less than130/80mmHg.
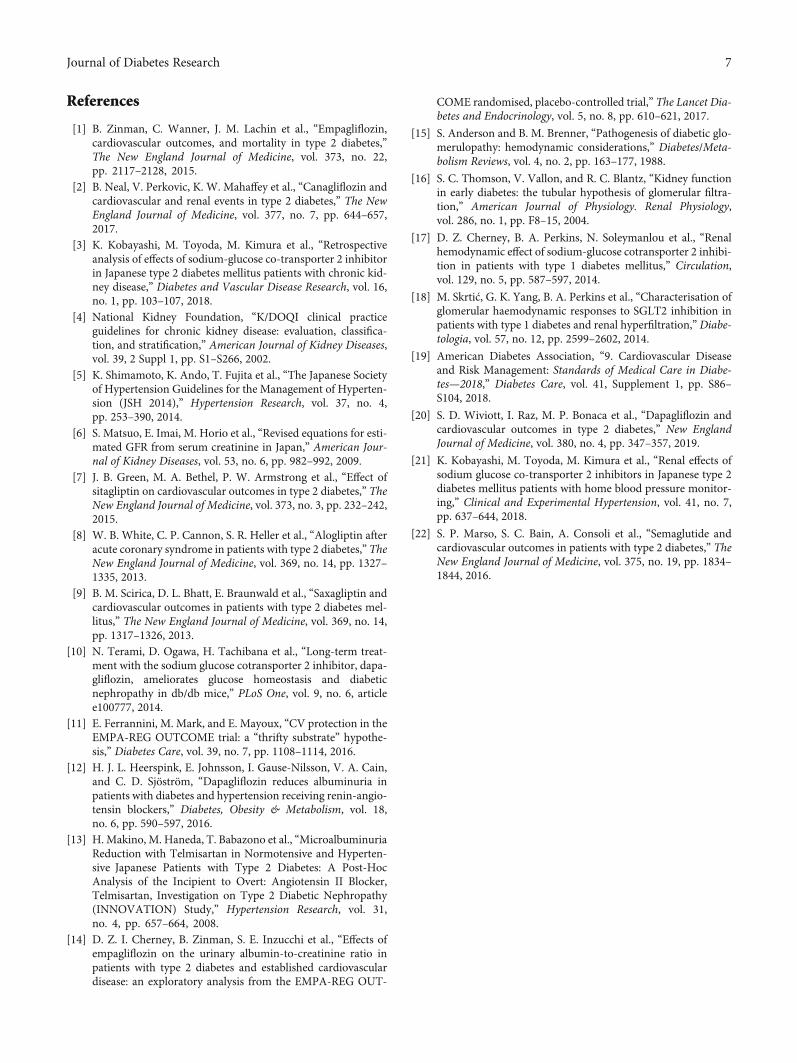
Based on the receiver operating characteristic (ROC)analysis shown in Figure 1, we also divided the patientsinto two groups based on mean arterial pressure (MAP;MAP = 1/3 ðSBP –DBPÞ + DBP) at the time of the survey:below 102mmHg group (n = 537) and ≥102mmHg group(n = 203).
The change in the logarithmic value of ACR (ΔLNACR) atthe end of the treatment period was analyzed retrospectively.
2.2. Statistical Analysis. Data that showed normal distribu-tion are reported as mean ± SD while those with skewed dis-tribution are reported as median (lower quartile, upperquartile). Differences between before and after treatmentdata of the two groups were analyzed by the paired t-testfor parametric parameters and Wilcoxon signed-rank testfor nonparametric parameters, and p value less than 0.05was considered significant. The chi-square test was used to
00 20
20
40
40
60
60
80
80 100
100ROC curve
Sen
sitiv
ity (%
)
1 – specificity (%)
Figure 1: Receiver operating characteristic (ROC) curve showingthe overall prediction accuracy of MAP measured at survey andimprovement or lack of it in ACR in patients treated with SGLT2inhibitors.
2 Journal of Diabetes Research

evaluate differences in the percentages of the three groupsbased on the status of albuminuria.
Analysis of covariance (ANCOVA) was performed withLNACR at the initiation of SGLT2i as the covariate andLNACR at the time of the survey as the dependent variable,taking into consideration BP management at the initiationof SGLT2i treatment (well-controlled versus poorly con-trolled groups) and the MAP at the time of the survey(<102 versus ≥102 groups).
ROC curve was used to test the overall prediction accu-racy of the MAP at the survey and the improvement or lackof improvement in ACR in patients treated with SGLT2i,and the results were reported as the area under the curve(AUC). The IBM SPSS Statistics 25.0 software program(IBM Inc., Armonk, NY) was used in all statistical analyses.
3. Results
Supplementary Table 1 lists the background of patients atthe time of initiation of SGLT2i treatment, breakdown ofSGLT2i, duration of treatment with SGLT2i, and concomitantmedications (glucose-lowering agents, antihypertensiveagents, and others) at the time of the survey.
The results of ROC analysis showed an estimated optimalcutoff value for a change in MAP (as a marker of improve-ment) in ACR of 102mmHg, with sensitivity of 30% andspecificity of 23%, with an AUC of 0.52 (95% confidenceinterval (95% CI) of 0.48-0.56, p < 0:0001) (Figure 1).
Table 1 shows the clinical background of patients of thewell-controlled and poorly controlled groups at the time ofinitiation of SGLT2i treatment. BW, BMI, BP at office, eGFR,
Table 1: Differences among the study groups based on blood pressure at initiation of treatment and MAP at the time of survey.
BP (mmHg) at initiation of SGLT2i treatmentWell-controlled group (n = 327) Poorly controlled group (n = 413) p value
Age (years) 62:2 ± 12:4 58:7 ± 12:6 <0.001Sex, males : females 210 : 117 273 : 140 n.s.
BW (kg) 73:6 ± 15:0 79:0 ± 17:3 <0.001BMI (kg/m2) 26:6 ± 4:7 28:1 ± 5:2 <0.001SBP/DBP at office (mmHg) 124 ± 12:3/69:0 ± 8:5 149 ± 16:6/86:5 ± 10:0 <0.001/<0.001MAP at office (mmHg) 87:4 ± 7:3 107:3 ± 9:8 <0.001HbA1c (mmol/mol) (%) 62:5 ± 16:1 (7:9 ± 1:5) 63:9 ± 16:4 (8:0 ± 1:5) n.s.
eGFR (ml/min/1.7m2) 75:9 ± 23:8 81:4 ± 23:7 0.002
CCR (ml/min) 106 ± 48:3 123 ± 53:5 <0.001ACR (mg/gCr) 38.1 (13.3, 103.6) 58.5 (24.0, 185.9) <0.001Logarithmic value of ACR 3:77 ± 1:51 4:25 ± 1:58 <0.001ACR < 30/30‐300/≥300mg/gCr, n 125/167/35 114/224/75 <0.001Duration of treatment (months) 15 (11, 22) 12 (10, 24) n.s.
MAP (mmHg) at the time of the survey
<102 (n = 537) ≥102 (n = 203) p value
Age (years) 61:5 ± 12:6 57:0 ± 11:8 <0.001Sex, males : females 337 : 200 146 : 57 0.02
BW (kg) 75:1 ± 16:1 80:6 ± 17:0 <0.001BMI (kg/m2) 26:9 ± 4:8 28:8 ± 5:4 <0.001SBP/DBP at office (mmHg) 135 ± 18:1/75:9 ± 11:6 147 ± 19:6/86:5 ± 12:4 <0.001/<0.001MAP at office (mmHg) 95:4 ± 11:9 106:7 ± 13:1 <0.001HbA1c (mmol/mol) (%) 63:0 ± 16:3 (7:9 ± 1:5) 64:3 ± 16:3 (8:0 ± 1:5) n.s.
eGFR (ml/min/1.7m2) 77:7 ± 24:0 82:4 ± 23:5 0.018
CCR (ml/min) 111 ± 50:9 127 ± 52:9 <0.001ACR (mg/gCr) 42.6 (16.2, 140.0) 58.5 (26.1, 164.9) 0.023
Logarithmic value of ACR 3:96 ± 1:56 4:24 ± 1:55 0.027
ACR < 30/30‐300/≥300mg/gCr, n 185/275/77 54/116/33 n.s.
Duration of treatment (months) 15 (11, 23) 12 (8, 24) n.s.∗p < 0:05, ¶p < 0:01, compared with the other group (in two-group comparisons); §p < 0:01, compared with the <125/75 group; and †p < 0:01, compared withthe ≥130/80 to <135/85 group. Abbreviations: ACR: urinary albumin-creatinine ratio; BMI: body mass index; BW: body weight; SBP: systolic blood pressure;DBP: diastolic blood pressure; CCR: creatinine clearance, calculated by the Cockcroft-Gault formula; eGFR: estimated glomerular filtration rate; HbA1c:hemoglobin A1c; MAP: mean arterial pressure; n.s.: not significant; SGLT2i: sodium-glucose cotransporter 2 inhibitors.
3Journal of Diabetes Research

creatinine clearance rate (CCR), and ACR were significantlyhigher in patients of the poorly controlled group (p < 0:001,p < 0:001, p < 0:001, p = 0:002, p < 0:001, and p < 0:001,respectively). Patients of the poorly controlled group weresignificantly younger than those of the well-controlled group(p < 0:001).
Table 1 also shows the clinical background of patients ofthe two MAP groups at the time of the survey. BW, BMI, BPat office, eGFR, CCR, and ACR were significantly higher inthe MAP ≥ 102 group than the MAP < 102 group (p < 0:001,p < 0:001, p < 0:001, p = 0:018, p < 0:001, and p = 0:023,respectively). The MAP ≥ 102 group included significantlyhigher proportion of young males compared with theMAP < 102 group (p < 0:001 and p = 0:02, respectively).
Table 2 shows changes in LNACR and differences in theclinical findings between the BP well-controlled and poorlycontrolled groups at the time of initiation of SGLT2i treat-ment. Changes in eGFR, CCR, HbA1c, and BP at office weresignificantly larger in patients of the poorly controlled group(p = 0:007, p = 0:016, p = 0:023, and p < 0:001, respectively).However, there was no significant difference in the changesin LNACR between these two groups.
Table 2 also shows changes in LNACR and differences inthe clinical findings between the MAP < 102 group and theMAP ≥ 102 group at the time of the survey. Changes inBW and BP at office were significantly smaller in patientsof the MAP ≥ 102 group compared with the MAP < 102group (p = 0:004 and p < 0:001, respectively). There was asignificant difference in changes in LNACR between thesetwo groups.
Figure 2 shows the results of analyses of ANCOVAmodelsafter adjustments for LNACR at the initiation of SGLT2itreatment. There was no significant difference in the changesin adjusted LNACR between the BP well-controlled andpoorly controlled groups at the time of initiation of SGLT2itreatment (estimated difference (95% CI) was 0.10 (-0.13 to0.15)). On the other hand, there was a significant differencein the changes in adjusted LNACR between the MAP < 102and MAP ≥ 102 groups at the time of the survey (p < 0:001,estimated difference (95% CI) was -0.28 (-0.43 to 0.12)).
4. Discussion
Several cardiovascular outcome clinical trials (CVOCT) ofnew glucose-lowering agents have been performed to deter-mine their effects on cardiovascular events. The EMPA-REG OUTCOME trial [1] and CANVAS/CANVAS-Rprogram [2], which used SGLT2i, showed the benefits ofthese agents in reducing cardiovascular events. The TECOSstudy [7], EXAMINE study [8], and SAVOR-TIMI 53 study[9], which tested DPP4 inhibitors, reported the lack of effectof these agents on cardiovascular events. Patients treatedwith glucose-lowering agents in these CVOCT had lowerlevel of HbA1c relative to the placebo group, but the appro-priate treatment was used in both groups of patients forthe management of complications, such as hypertension,<130/80mmHg, and/or lipid disorders.
What are the mechanisms of the organ protective effectsof SGLT2i? Several studies hinted to a multitude of factors,such as body weight loss, improvement of glucose control,
Table 2: Delta changes in parameters of blood pressure and diabetes control.
BP (mmHg) at initiation of SGLT2i treatmentWell-controlled group (n = 327) Poorly controlled group (n = 413) p value
Δlogarithmic value of ACR −0:13 ± 1:05 −0:24 ± 0:97 n.s.
ΔeGFR (ml/min/1.73m2) −1:8 ± 10:9 −4:0 ± 11:2 0.007
ΔCCR (ml/min) −6:0 ± 14:7 −9:0 ± 17:7 0.016
ΔHbA1c (mmol/mol) (%) −6:2 ± 12:6 −8:5 ± 14:7 0.023
ΔBW (kg) −2:4 ± 3:6 −2:7 ± 4:4 n.s.
ΔSBP/ΔDBP at office (mmHg) 2:6 ± 15:7/3:5 ± 10:0 −12:8 ± 18:3/−5:6 ± 10:2 <0.001/<0.001ΔMAP at office (mmHg) 3:2 ± 10:3 −8:0 ± 11:2 <0.001
MAP (mmHg) at the time of the survey
<102 (n = 537) ≥102 (n = 203) p value
Δlogarithmic value of ACR −0:25 ± 1:02 −0:03 ± 0:97 <0.001ΔeGFR (ml/min/1.73m2) −3:2 ± 11:0 −2:7 ± 11:4 n.s.
ΔCCR (ml/min) −8:3 ± 15:4 −5:9 ± 18:4 n.s.
ΔHbA1c (mmol/mol) (%) −7:4 ± 13:8 −7:8 ± 14:0 n.s.
ΔBW (kg) −2:8 ± 3:7 −1:9 ± 4:8 0.004
ΔSBP/ΔDBP at office (mmHg) −8:7 ± 17:7/−3:2 ± 10:5 1:2 ± 19:9/2:8 ± 11:4 <0.001/<0.001ΔMAP at office (mmHg) −5:0 ± 11:4 2:3 ± 12:6 <0.001Abbreviations: ACR: urinary albumin-creatinine ratio; BW: body weight; CCR: creatinine clearance, calculated by the Cockcroft-Gault formula; DBP: diastolicblood pressure; Δ: change in; eGFR: estimated glomerular filtration rate; HbA1c: hemoglobin A1c; MAP: mean arterial pressure; n.s.: not significant; SGLT2i:sodium-glucose cotransporter 2 inhibitors; SBP: systolic blood pressure.
4 Journal of Diabetes Research

correction of dyslipidemia, and lowering of BP. Terami et al.[10] reported that dapagliflozin reduced oxidative stress inrats with diabetic nephropathy while Ferrannini et al. [11]reported the importance of ketone body metabolism incardiovascular protection. However, Heerspink et al. [12]indicated that the ACR-lowering rate and the direct effectof dapagliflozin itself were the major factors involved inthe reduction of ACR in T2DM patients.
We reported recently the renoprotective effect of SGLT2iin Japanese T2DM patients with CKD [3]. The multiregres-sion analysis applied in that study demonstrated the impor-tance of a decrease in BP as an independent factor for theimprovement of ACR. We speculated that improvement inACR in hypertensive patients might be larger than that innormotensive or well-controlled hypertensive patients beforeSGLT2i treatment. Based on the results of the present study,SGLT2i treatment resulted in a significant improvement inACR not only in normotensives and well-controlled hyper-tensive patients but also in poorly controlled hypertensivepatients before SGLT2i treatment. Considering our findingstogether with the above studies, it seems that these improve-ment effects of ACR by SGLT2i treatment cannot beexplained simply by their BP-lowering effect. In fact, theeffects observed in our study were similar to the results ofthe INNOVATION study [13], which showed improvementin ACR by telmisartan in both hypertensive and normoten-sive Japanese T2DM patients. In this regard, Cherney et al.[14] reported that the changes in ACR by empagliflozin wereindependent of changes in SBP. Although the changes inACR by empagliflozin in normotensive patients were notmentioned in their study, our present results were consideredto be consistent with their results.
On the other hand, our study showed no significantimprovement in ACR in patients of the MAP ≥ 102 group
(patients with SBP/DBP of 135/85mmHg) after treatmentwith SGLT2i. The pathogenesis of diabetic nephropathy issuggested to involve glomerular hyperfiltration [15]. Hyper-filtration induces activation of tubuloglomerular feedbackand the renin-angiotensin-aldosterone system, and thesemechanisms play an important role in the progression of dia-betic nephropathy [16]. In this regard, previous studiesreported that empagliflozin inhibits glomerular hyperfiltrationin patients with type 1 DM [17, 18]. While we could not con-firm the state of hyperfiltration in hypertensive patients,improvement in hyperfiltration might not be enough to pro-duce a renoprotective effect in the poorly controlled hyperten-sive patients, as shown in the present study.
The control of BP is an important aspect of the overallmanagement of DM, especially in CKD patients [19]. In mostCVOCT, e.g., the EMPA-REG OUTCOME trial [1], CAN-VAS/CANVAS-R program [2], DECLARE-TIMI 58 study[20], TECOS study [7], EXAMINE study [8], and SAVOR-TIMI 53 study [9], the registered patients received standardcare for treatment of DM and cardiovascular risk factors,and in many cases, the target BP was set below 130/80mmHgthroughout the study period. In the TECOS study, 86% of thepatients treated with sitagliptin were hypertensives withSBP/DBP at baseline of 135 ± 17/77 ± 10mmHg [7]. Further-more, 83% of patients of the EXAMINE study were hyperten-sives [8], and 82% of those of the SAVOR-TIMI 53 study hadhypertension [9]. These data indicate that tight BP controlwas not achieved in these patients at the time of study entry.Importantly, CVOCT on DPP4 inhibitors reported no clearchanges in BP, suggesting that these agents have no benefitin achieving the target BP control. In contrast, BP at the timeof the initiation of CVOCT using SGLT2i was 135 ± 17/77± 10mmHg in the empagliflozin group of the EMPA-REGOUTCOME trial (95% of patients received antihypertensive
–1.4
–1.2
–1
–0.8
–0.6
–0.4
–0.2
0
Chan
ge in
LN
ACR
BP (mmHg) at the initiation of SGLT2i treatment
MAP (mmHg) at the time of the survey
p < 0.001Estimate difference (95% CI)
0.10 (–0.13 to 0.15)Estimate difference (95% CI)
-0.28 (–0.43 to –0.12)
Well controlled Poorly controlled <102 >102
(a) (b)
Figure 2: Comparison of changes in urinary albumin-creatinine ratio (ACR) at the initiation of treatment with sodium-glucose cotransporter2 inhibitors (SGLT2i) and at the time of the survey. Comparisons between patients with BP less than and above 130/80mmHg at the initiationof SGLT2i (a) and between patients with mean arterial pressure ðMAPÞ < 102 and MAP ≥ 102mmHg at the time of the survey. Data aremean ± SD. ANCOVA models were adjusted for the LNACR at the initiation of SGLT2i treatment. ANCOVA: analysis of covariance; BP:blood pressure; CI: confidence interval; LNACR: logarithmic value of urinary albumin-creatinine ratio; MAP: mean arterial pressure;SGLT2i: sodium-glucose cotransporter 2 inhibitors.
5Journal of Diabetes Research

agents) [1], 136 ± 16/78 ± 10mmHg in the canagliflozingroup of the CANVAS/CANVAS-R program (90% werehypertensives) [2], and 135 ± 16mmHg in all participantsof the DECLARE-TIMI study [20]. These values were similarto those of CVOCT using DPP4 inhibitors. However, clearfalls in BP were observed in the CVOCT using SGLT2i, sug-gesting the benefits of these agents in the achievement of tar-get BP control. In the EMPA-REG OUTCOME trial, thefrequency of use of antihypertensive agents increased duringthe study period and no adverse effect of hypotension wasobserved despite the decrease in BP by SGLT2i [1]. Theseresults highlight the difficulty of management of BP in suchpatients and that SGLT2i seem useful for BP management.We reported previously that treatment with SGLT2 signifi-cantly changed the rates of achieving the target BP (to130/80mmHg measured at the office and to 125/75mmHgin the morning measured at home) in patients with diabeticnephropathy from 26.9% and 25.3% to 34.6% and 34.3%,respectively (p < 0:05, each) [21]. A similar decrease in BPwas observed in CVOCT using semaglutide (SUSTAIN-6study [22]). SGLT2i or GLP1 receptor agonists are recom-mended for hypertensive DM patients because they enhancethe achievement rate to target BP relative to DPP4 inhibitors.
The above findings highlight the advantage of usingSGLT2i in the dual management of T2DM and BP. It shouldbe noted, however, that our study showed that SGLT2i treat-ment did not significantly improve ACR in patients withpoor BP control. It is possible, however, for patients withpoor BP control during treatment with SGLT2i to exhibitimprovement in ACR than patients on placebo. Based onthe renal data of the EMPA-REG OUTCOME trial [14],ACR decreased from baseline in patients with microalbumi-nuria and macroalbuminuria, but the relation between ACRimprovement and BP control was not discussed in that study.Further studies are needed to investigate the renoprotectiveeffect of SGLT2i in normotensive DM patients or patientswith CKD unrelated to diabetic nephropathy.
4.1. Limitation. The present study was a retrospective obser-vational study. The use of other glucose-lowering and antihy-pertensive agents was only investigated at the survey. Patientsof the adequate BP group might include those who discontin-ued antihypertensive agents after the initiation of SGLT2itherapy. Further, our study is only a single-arm study thatdid not include patients treated with placebo. Although theseclinical and methodological limitations do not allow firmconclusions, the large number of patients included in thisstudy provides clear evidence for the benefits of SGLT2i inhypertensive T2DM patients.
5. Conclusion
Our results confirmed that blood pressure management sta-tus after SGLT2i administration influences the extent ofchange in urinary albumin-creatinine ratio. Stricter BP man-agement might be needed in general practice to demonstratethe renoprotective effects of SGLT2i in Japanese T2DMpatients with CKD.
Abbreviations
ACR: Urinary albumin-creatinine ratioANCOVA: Analysis of covarianceBP: Blood pressureBW: Body weightBMI: Body mass indexCI: Confidence intervalCKD: Chronic kidney diseaseDPP4: Dipeptidyl peptidase-4DBP: Diastolic blood pressureΔACR: Change in urinary albumin-creatinine ratioeGFR: Estimated glomerular filtration rateGP: General practitionerGLA: Glucose-lowering agentsGLP1: Glucagon-like peptide-1HbA1c: Hemoglobin A1cLNACR: Logarithmic value of urinary albumin-
creatinine ratioMAP: Mean arterial pressureRAS: Renin-angiotensin systemROC: Receiver operating characteristicSBP: Systolic blood pressureSGLT2i: Sodium-glucose cotransporter 2 inhibitorsT2DM: Type 2 diabetes mellitus.
Data Availability
The data used to support the findings of this study are avail-able from the corresponding author upon request.
Conflicts of Interest
The author and coauthors declare no conflict of interest asso-ciated with this study.
Acknowledgments
We acknowledge the members of Kanagawa PhysiciansAssociation for their valuable contribution to the data collec-tion of the previous study. Also, we acknowledge Dr.Kazuyoshi Sato who is its director for his valuable contribu-tion to the design, data collection, analysis, and writing ofthe previous study.
Supplementary Materials
The backgrounds of patients at the time of initiation ofSGLT2i treatment; age, sex, BW, BMI, BP, HbA1c, eGFR,CCR, and ACR are shown in Supplementary Table 1: sixkinds of SGLT2i, ipragliflozin, dapagliflozin, tofogliflozin,luseogliflozin, canagliflozin, and empagliflozin, are used inthe patients of this study. The duration of administrationof SGLT2i is divided into 4 groups (from 4 to 12 months,from 13 to 18 months, from 19 to 24 months, and over 25months), and the number of patients in each groups isshown in this table. The concomitant medications (glu-cose-lowering agents, antihypertensive agents, and statins)at survey time are also shown in this table. (SupplementaryMaterials)
6 Journal of Diabetes Research
References
[1] B. Zinman, C. Wanner, J. M. Lachin et al., “Empagliflozin,cardiovascular outcomes, and mortality in type 2 diabetes,”The New England Journal of Medicine, vol. 373, no. 22,pp. 2117–2128, 2015.
[2] B. Neal, V. Perkovic, K. W. Mahaffey et al., “Canagliflozin andcardiovascular and renal events in type 2 diabetes,” The NewEngland Journal of Medicine, vol. 377, no. 7, pp. 644–657,2017.
[3] K. Kobayashi, M. Toyoda, M. Kimura et al., “Retrospectiveanalysis of effects of sodium-glucose co-transporter 2 inhibitorin Japanese type 2 diabetes mellitus patients with chronic kid-ney disease,” Diabetes and Vascular Disease Research, vol. 16,no. 1, pp. 103–107, 2018.
[4] National Kidney Foundation, “K/DOQI clinical practiceguidelines for chronic kidney disease: evaluation, classifica-tion, and stratification,” American Journal of Kidney Diseases,vol. 39, 2 Suppl 1, pp. S1–S266, 2002.
[5] K. Shimamoto, K. Ando, T. Fujita et al., “The Japanese Societyof Hypertension Guidelines for the Management of Hyperten-sion (JSH 2014),” Hypertension Research, vol. 37, no. 4,pp. 253–390, 2014.
[6] S. Matsuo, E. Imai, M. Horio et al., “Revised equations for esti-mated GFR from serum creatinine in Japan,” American Jour-nal of Kidney Diseases, vol. 53, no. 6, pp. 982–992, 2009.
[7] J. B. Green, M. A. Bethel, P. W. Armstrong et al., “Effect ofsitagliptin on cardiovascular outcomes in type 2 diabetes,” TheNew England Journal of Medicine, vol. 373, no. 3, pp. 232–242,2015.
[8] W. B. White, C. P. Cannon, S. R. Heller et al., “Alogliptin afteracute coronary syndrome in patients with type 2 diabetes,” TheNew England Journal of Medicine, vol. 369, no. 14, pp. 1327–1335, 2013.
[9] B. M. Scirica, D. L. Bhatt, E. Braunwald et al., “Saxagliptin andcardiovascular outcomes in patients with type 2 diabetes mel-litus,” The New England Journal of Medicine, vol. 369, no. 14,pp. 1317–1326, 2013.
[10] N. Terami, D. Ogawa, H. Tachibana et al., “Long-term treat-ment with the sodium glucose cotransporter 2 inhibitor, dapa-gliflozin, ameliorates glucose homeostasis and diabeticnephropathy in db/db mice,” PLoS One, vol. 9, no. 6, articlee100777, 2014.
[11] E. Ferrannini, M. Mark, and E. Mayoux, “CV protection in theEMPA-REG OUTCOME trial: a “thrifty substrate” hypothe-sis,” Diabetes Care, vol. 39, no. 7, pp. 1108–1114, 2016.
[12] H. J. L. Heerspink, E. Johnsson, I. Gause-Nilsson, V. A. Cain,and C. D. Sjöström, “Dapagliflozin reduces albuminuria inpatients with diabetes and hypertension receiving renin‐angio-tensin blockers,” Diabetes, Obesity & Metabolism, vol. 18,no. 6, pp. 590–597, 2016.
[13] H. Makino, M. Haneda, T. Babazono et al., “MicroalbuminuriaReduction with Telmisartan in Normotensive and Hyperten-sive Japanese Patients with Type 2 Diabetes: A Post-HocAnalysis of the Incipient to Overt: Angiotensin II Blocker,Telmisartan, Investigation on Type 2 Diabetic Nephropathy(INNOVATION) Study,” Hypertension Research, vol. 31,no. 4, pp. 657–664, 2008.
[14] D. Z. I. Cherney, B. Zinman, S. E. Inzucchi et al., “Effects ofempagliflozin on the urinary albumin-to-creatinine ratio inpatients with type 2 diabetes and established cardiovasculardisease: an exploratory analysis from the EMPA-REG OUT-
COME randomised, placebo-controlled trial,” The Lancet Dia-betes and Endocrinology, vol. 5, no. 8, pp. 610–621, 2017.
[15] S. Anderson and B. M. Brenner, “Pathogenesis of diabetic glo-merulopathy: hemodynamic considerations,” Diabetes/Meta-bolism Reviews, vol. 4, no. 2, pp. 163–177, 1988.
[16] S. C. Thomson, V. Vallon, and R. C. Blantz, “Kidney functionin early diabetes: the tubular hypothesis of glomerular filtra-tion,” American Journal of Physiology. Renal Physiology,vol. 286, no. 1, pp. F8–15, 2004.
[17] D. Z. Cherney, B. A. Perkins, N. Soleymanlou et al., “Renalhemodynamic effect of sodium-glucose cotransporter 2 inhibi-tion in patients with type 1 diabetes mellitus,” Circulation,vol. 129, no. 5, pp. 587–597, 2014.
[18] M. Skrtić, G. K. Yang, B. A. Perkins et al., “Characterisation ofglomerular haemodynamic responses to SGLT2 inhibition inpatients with type 1 diabetes and renal hyperfiltration,” Diabe-tologia, vol. 57, no. 12, pp. 2599–2602, 2014.
[19] American Diabetes Association, “9. Cardiovascular Diseaseand Risk Management: Standards of Medical Care in Diabe-tes—2018,” Diabetes Care, vol. 41, Supplement 1, pp. S86–S104, 2018.
[20] S. D. Wiviott, I. Raz, M. P. Bonaca et al., “Dapagliflozin andcardiovascular outcomes in type 2 diabetes,” New EnglandJournal of Medicine, vol. 380, no. 4, pp. 347–357, 2019.
[21] K. Kobayashi, M. Toyoda, M. Kimura et al., “Renal effects ofsodium glucose co-transporter 2 inhibitors in Japanese type 2diabetes mellitus patients with home blood pressure monitor-ing,” Clinical and Experimental Hypertension, vol. 41, no. 7,pp. 637–644, 2018.
[22] S. P. Marso, S. C. Bain, A. Consoli et al., “Semaglutide andcardiovascular outcomes in patients with type 2 diabetes,” TheNew England Journal of Medicine, vol. 375, no. 19, pp. 1834–1844, 2016.
7Journal of Diabetes Research

Stem Cells International
Hindawiwww.hindawi.com Volume 2018
Hindawiwww.hindawi.com Volume 2018
MEDIATORSINFLAMMATION
of
EndocrinologyInternational Journal of
Hindawiwww.hindawi.com Volume 2018
Hindawiwww.hindawi.com Volume 2018
Disease Markers
Hindawiwww.hindawi.com Volume 2018
BioMed Research International
OncologyJournal of
Hindawiwww.hindawi.com Volume 2013
Hindawiwww.hindawi.com Volume 2018
Oxidative Medicine and Cellular Longevity
Hindawiwww.hindawi.com Volume 2018
PPAR Research
Hindawi Publishing Corporation http://www.hindawi.com Volume 2013Hindawiwww.hindawi.com
The Scientific World Journal
Volume 2018
Immunology ResearchHindawiwww.hindawi.com Volume 2018
Journal of
ObesityJournal of
Hindawiwww.hindawi.com Volume 2018
Hindawiwww.hindawi.com Volume 2018
Computational and Mathematical Methods in Medicine
Hindawiwww.hindawi.com Volume 2018
Behavioural Neurology
OphthalmologyJournal of
Hindawiwww.hindawi.com Volume 2018
Diabetes ResearchJournal of
Hindawiwww.hindawi.com Volume 2018
Hindawiwww.hindawi.com Volume 2018
Research and TreatmentAIDS
Hindawiwww.hindawi.com Volume 2018
Gastroenterology Research and Practice
Hindawiwww.hindawi.com Volume 2018
Parkinson’s Disease
Evidence-Based Complementary andAlternative Medicine
Volume 2018Hindawiwww.hindawi.com
Submit your manuscripts atwww.hindawi.com


![[C31]世界最速カラムナーDBは本物だ! by Daisuke Hirama](https://img.pdfslide.tips/doc/110x75/557811e5d8b42ab40c8b46f1/c31db-by-daisuke-hirama.jpg)


![[ダウンロード推奨]OOW2017 and Javaone2017 report Daisuke Nishino(Sompo Systems)](https://img.pdfslide.tips/doc/110x75/5a6629557f8b9a214f8b5dcb/oow2017-and-javaone2017-report-daisuke-nishinosompo.jpg)