Embed Size (px)
Citation preview
The Study on the Improvement Measures for Electric Power Generation Facilities in Java-Bali Region in the Republic of Indonesia
3. REVIEW OF EXISTING ELECTRIC POWER GENERATION FACILITIES 3.1. Confirmation of Current Status and Issues Relating to Facilities 3.1.1. Thermal Power Stations 3.1.1.1. Overall Status and Issues of the Objective Twelve (12) Thermal Power Stations
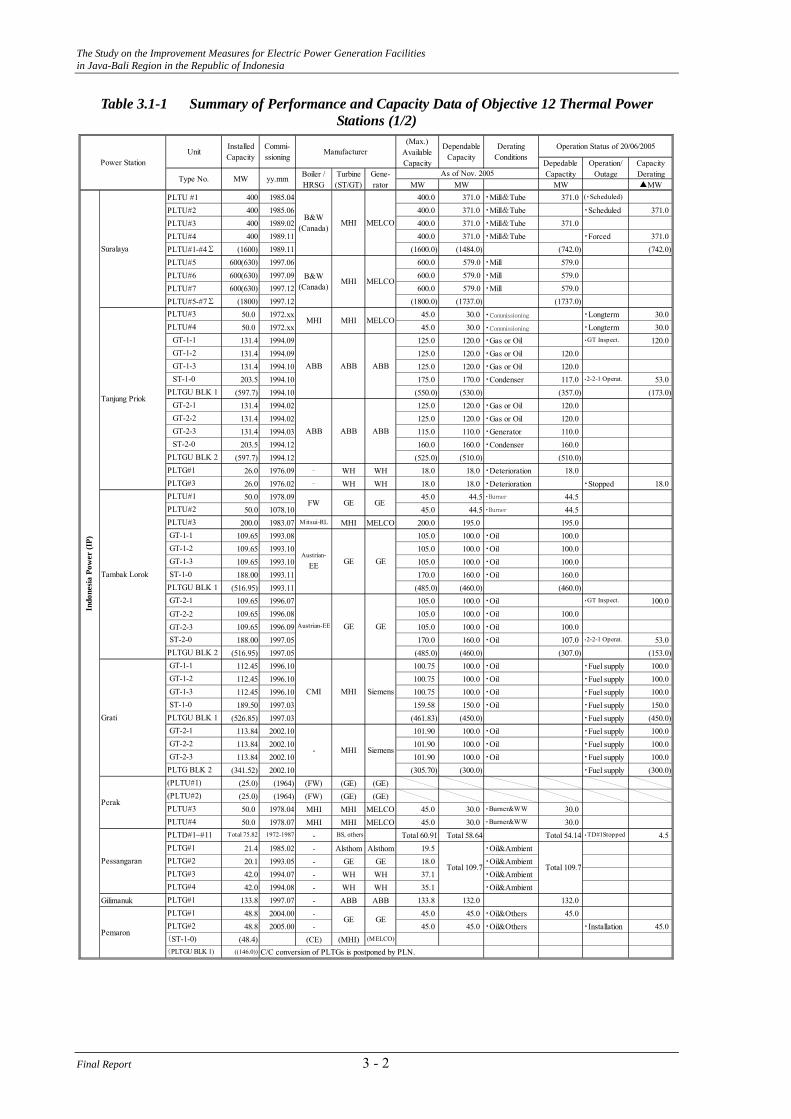
The thermal team of the JICA Study Team visited and investigated the objective twelve (12) thermal power stations in Java-Bali region during the 1st Field Work from November 17 through December 15, 2005. The Study Team got and collected the huge volume of the operational data in the forms of hard copies or soft copies supplied by each power station. Thereafter, the Study Team visited some thermal power stations again in order to complement these data using the timings of the 2nd and 3rd Field Works. Table 3.1-1 shows the summary of the performance and capacity data for the investigated 12 thermal power stations. The objective 12 thermal power stations were selected as having its total capacity of 100 MW or more among IP (Indonesia Power) and PJB own power stations. PLN and IPP own power stations and the geo-thermal power stations were omitted from the study of this Study. Then, it is noted that the figures of the total installed capacities of the objective thermal power stations have major difference between the Java-Bali region and our study of this time. Both figures of total installed capacities are compared as follows;
Total Capacity Objective Capacity Thermal Power : 16,232 MW 12,660 MW Hydro Power : 2,548 MW 1,995 MW Geo-thermal Power : 754 MW - Total : 19,534 MW 14,655 MW
The operation status on 20/06/2005 causing the serious power supply shortage in Java-Bali region are listed in the Table 3.1-1 for the review of the requirements for the Study as to the requirements of capacity gain measures recovering performance deterioration for the thermal power stations.
3 - 1 Final Report
The Study on the Improvement Measures for Electric Power Generation Facilities in Java-Bali Region in the Republic of Indonesia
Table 3.1-1 Summary of Performance and Capacity Data of Objective 12 Thermal Power Stations (1/2)
MW MW MW ▲MWPLTU #1 400 1985.04 400.0 371.0 ・Mill&Tube 371.0 (・Scheduled)
PLTU#2 400 1985.06 400.0 371.0 ・Mill&Tube ・Scheduled 371.0PLTU#3 400 1989.02 400.0 371.0 ・Mill&Tube 371.0PLTU#4 400 1989.11 400.0 371.0 ・Mill&Tube ・Forced 371.0PLTU#1-#4∑ (1600) 1989.11 (1600.0) (1484.0) (742.0) (742.0)PLTU#5 600(630) 1997.06 600.0 579.0 ・Mill 579.0PLTU#6 600(630) 1997.09 600.0 579.0 ・Mill 579.0PLTU#7 600(630) 1997.12 600.0 579.0 ・Mill 579.0PLTU#5-#7∑ (1800) 1997.12 (1800.0) (1737.0) (1737.0)
50.0 1972.xx 45.0 30.0 ・Commissioning ・Longterm 30.050.0 1972.xx 45.0 30.0 ・Commissioning ・Longterm 30.0131.4 1994.09 125.0 120.0 ・Gas or Oil ・GT Inspect. 120.0131.4 1994.09 125.0 120.0 ・Gas or Oil 120.0131.4 1994.10 125.0 120.0 ・Gas or Oil 120.0203.5 1994.10 175.0 170.0 ・Condenser 117.0 ・2-2-1 Operat. 53.0
(597.7) 1994.10 (550.0) (530.0) (357.0) (173.0)131.4 1994.02 125.0 120.0 ・Gas or Oil 120.0131.4 1994.02 125.0 120.0 ・Gas or Oil 120.0131.4 1994.03 115.0 110.0 ・Generator 110.0203.5 1994.12 160.0 160.0 ・Condenser 160.0
(597.7) 1994.12 (525.0) (510.0) (510.0)26.0 1976.09 ‐ WH WH 18.0 18.0 ・Deterioration 18.026.0 1976.02 ‐ WH WH 18.0 18.0 ・Deterioration ・Stopped 18.050.0 1978.09 45.0 44.5 ・Burner 44.550.0 1078.10 45.0 44.5 ・Burner 44.5
200.0 1983.07 Mitsui-RL MHI MELCO 200.0 195.0 195.0109.65 1993.08 105.0 100.0 ・Oil 100.0109.65 1993.10 105.0 100.0 ・Oil 100.0109.65 1993.10 105.0 100.0 ・Oil 100.0188.00 1993.11 170.0 160.0 ・Oil 160.0
(516.95) 1993.11 (485.0) (460.0) (460.0)109.65 1996.07 105.0 100.0 ・Oil ・GT Inspect. 100.0
GT-2-2 109.65 1996.08 105.0 100.0 ・Oil 100.0 GT-2-3 109.65 1996.09 105.0 100.0 ・Oil 100.0
188.00 1997.05 170.0 160.0 ・Oil 107.0 ・2-2-1 Operat. 53.0(516.95) 1997.05 (485.0) (460.0) (307.0) (153.0)
112.45 1996.10 100.75 100.0 ・Oil ・Fuel supply 100.0112.45 1996.10 100.75 100.0 ・Oil ・Fuel supply 100.0112.45 1996.10 100.75 100.0 ・Oil ・Fuel supply 100.0189.50 1997.03 159.58 150.0 ・Oil ・Fuel supply 150.0
(526.85) 1997.03 (461.83) (450.0) ・Fuel supply (450.0)113.84 2002.10 101.90 100.0 ・Oil ・Fuel supply 100.0113.84 2002.10 101.90 100.0 ・Oil ・Fuel supply 100.0113.84 2002.10 101.90 100.0 ・Oil ・Fuel supply 100.0
(341.52) 2002.10 (305.70) (300.0) ・Fuel supply (300.0)(25.0) (1964) (FW) (GE) (GE)(25.0) (1964) (FW) (GE) (GE)50.0 1978.04 MHI MHI MELCO 45.0 30.0 ・Burner&WW 30.050.0 1978.07 MHI MHI MELCO 45.0 30.0 ・Burner&WW 30.0
Total 75.82 1972-1987 - BS, others Total 60.91 Total 58.64 Totol 54.14 ・TD#1Stopped 4.521.4 1985.02 - Alsthom Alsthom 19.5 ・Oil&Ambient20.1 1993.05 - GE GE 18.0 ・Oil&Ambient42.0 1994.07 - WH WH 37.1 ・Oil&Ambient42.0 1994.08 - WH WH 35.1 ・Oil&Ambient
Gilimanuk 133.8 1997.07 - ABB ABB 133.8 132.0 132.048.8 2004.00 - 45.0 45.0 ・Oil&Others 45.048.8 2005.00 - 45.0 45.0 ・Oil&Others ・Installation 45.0
(48.4) (CE) (MHI) (MELCO)
((146.0))
B&W(Canada)
MHI MELCO
B&W(Canada)
MHI MELCO
Type No.
InstalledCapacity
Commi-ssioning
Manufacturer
MW yy.mm Boiler /HRSG
Turbine(ST/GT)
MHI
FW GE
ABB ABB
Suralaya
Indo
nesi
a Po
wer
(IP)
Tambak Lorok
Pemaron
Perak
Pessangaran
Tanjung Priok
Grati
-
MHI
C/C conversion of PLTGs is postponed by PLN.
SiemensMHI
MHI
ABB
GE
GE
Siemens
PLTG#2
PLTG#1
PLTU#4PLTD#1~#11
PLTG#1
PLTG#2PLTG#3PLTG#4
Total 109.7
GEGE
Total 109.7
GT-1-1
PLTGU BLK 1
Austrian-EE
GT-1-1
CMI
GEGE
PLTGU BLK 1
PLTGU BLK 2
GT-1-2 GT-1-3 ST-1-0
(PLTGU BLK 1)
(ST-1-0)
PLTG#1
Unit(Max.)
AvailableCapacity Operation/
OutageCapacityDerating
DepedableCapactity
Operation Status of 20/06/2005
Power StationGene-rator
DependableCapacity
PLTU#2
GT-2-1
GT-2-3 ST-2-0PLTGU BLK 2
PLTGU BLK 1
PLTG#1
ST-1-0
PLTG BLK 2
PLTU#3(PLTU#2)
GT-2-1
ST-2-0
GT-2-1 GT-2-2 GT-2-3
(PLTU#1)
DeratingConditions
As of Nov. 2005
ABB
PLTG#3
PLTU#4
GT-2-2
GT-1-1
MELCO
GT-1-2 GT-1-3
PLTU#3
ABB
GT-1-2 GT-1-3
PLTU#3
ST-1-0
PLTU#1
ABB
GEAustrian-
EE
Final Report 3 - 2
The Study on the Improvement Measures for Electric Power Generation Facilities in Java-Bali Region in the Republic of Indonesia
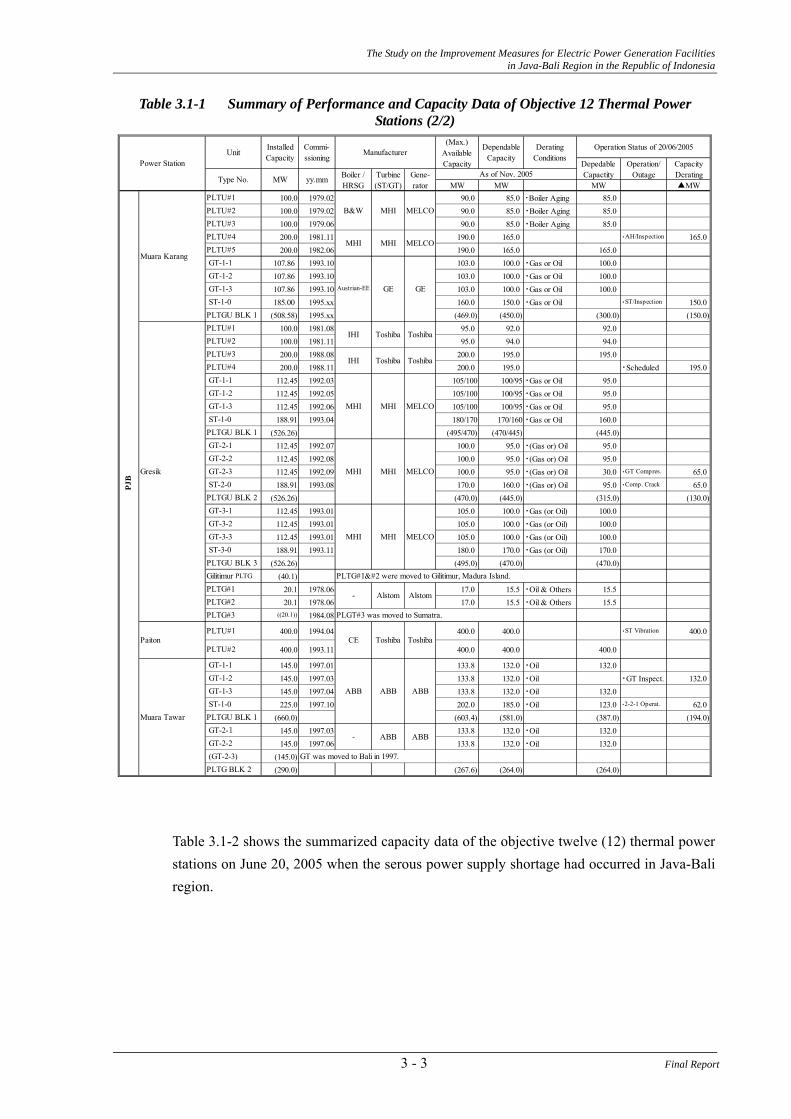
Table 3.1-1 Summary of Performance and Capacity Data of Objective 12 Thermal Power Stations (2/2)
MW MW MW ▲MW100.0 1979.02 90.0 85.0 ・Boiler Aging 85.0100.0 1979.02 90.0 85.0 ・Boiler Aging 85.0100.0 1979.06 90.0 85.0 ・Boiler Aging 85.0200.0 1981.11 190.0 165.0 ・AH/Inspection 165.0200.0 1982.06 190.0 165.0 165.0
107.86 1993.10 103.0 100.0 ・Gas or Oil 100.0107.86 1993.10 103.0 100.0 ・Gas or Oil 100.0107.86 1993.10 103.0 100.0 ・Gas or Oil 100.0185.00 1995.xx 160.0 150.0 ・Gas or Oil ・ST/Inspection 150.0
(508.58) 1995.xx (469.0) (450.0) (300.0) (150.0)100.0 1981.08 95.0 92.0 92.0100.0 1981.11 95.0 94.0 94.0200.0 1988.08 200.0 195.0 195.0200.0 1988.11 200.0 195.0 ・Scheduled 195.0
112.45 1992.03 105/100 100/95 ・Gas or Oil 95.0112.45 1992.05 105/100 100/95 ・Gas or Oil 95.0112.45 1992.06 105/100 100/95 ・Gas or Oil 95.0188.91 1993.04 180/170 170/160 ・Gas or Oil 160.0
(526.26) (495/470) (470/445) (445.0)112.45 1992.07 100.0 95.0 ・(Gas or) Oil 95.0112.45 1992.08 100.0 95.0 ・(Gas or) Oil 95.0112.45 1992.09 100.0 95.0 ・(Gas or) Oil 30.0 ・GT Compres. 65.0188.91 1993.08 170.0 160.0 ・(Gas or) Oil 95.0 ・Comp. Crack 65.0
(526.26) (470.0) (445.0) (315.0) (130.0)112.45 1993.01 105.0 100.0 ・Gas (or Oil) 100.0112.45 1993.01 105.0 100.0 ・Gas (or Oil) 100.0112.45 1993.01 105.0 100.0 ・Gas (or Oil) 100.0188.91 1993.11 180.0 170.0 ・Gas (or Oil) 170.0
(526.26) (495.0) (470.0) (470.0)(40.1)
20.1 1978.06 17.0 15.5 ・Oil & Others 15.520.1 1978.06 17.0 15.5 ・Oil & Others 15.5
((20.1)) 1984.08
400.0 1994.04 400.0 400.0 ・ST Vibration 400.0
400.0 1993.11 400.0 400.0 400.0
145.0 1997.01 133.8 132.0 ・Oil 132.0145.0 1997.03 133.8 132.0 ・Oil ・GT Inspect. 132.0145.0 1997.04 133.8 132.0 ・Oil 132.0225.0 1997.10 202.0 185.0 ・Oil 123.0 ・2-2-1 Operat. 62.0
(660.0) (603.4) (581.0) (387.0) (194.0)145.0 1997.03 133.8 132.0 ・Oil 132.0145.0 1997.06 133.8 132.0 ・Oil 132.0
(145.0)(290.0) (267.6) (264.0) (264.0)
MELCO
MHI MELCOMHI
GT was moved to Bali in 1997.
Type No.
InstalledCapacity
Commi-ssioning
Manufacturer
MW yy.mm Boiler /HRSG
Turbine(ST/GT)
GEGE
B&W
PLTG#3
GT-2-2 GT-2-3 ST-2-0PLTGU BLK 2
PLTU#1
PJB
Muara Karang
Gresik
Muara Tawar
Paiton
GT-3-1 GT-3-2 GT-3-3 ST-3-0PLTGU BLK 3
PLTG BLK 2
GT-2-2
ST-1-0
MHI
PLTU#4
PLTU#2PLTU#1
Austrian-EE
PLTU#4
GT-1-2
PLTU#2
IHI
PLTGU BLK 1 GT-2-1
(GT-2-3)
GT-1-3
ST-1-0PLTGU BLK 1
GT-1-3 ST-1-0
GT-1-2
PLTU#1
PLTGU BLK 1
GT-1-1
PLTU#3
PLTU#2
GT-2-1
GT-1-2
GT-1-1
PLTG#1PLTG#2
GT-1-3
Gilitimur PLTG
GT-1-1PLTU#5
PLTU#3
MELCO
MHI MELCO
MHI MELCOMHI
MHI MHI
MHI
Alstom
CE Toshiba Toshiba
- Alstom
- ABB ABB
ABB ABB ABB
Unit(Max.)
AvailableCapacity Operation/
OutageCapacityDerating
DepedableCapactity
Operation Status of 20/06/2005
Power StationGene-rator
DependableCapacity
DeratingConditions
PLTG#1 were moved to Gilitimur, Madura Island.
PLGT#3 was moved to Sumatra.
As of Nov. 2005
Toshiba
IHI Toshiba Toshiba
Toshiba
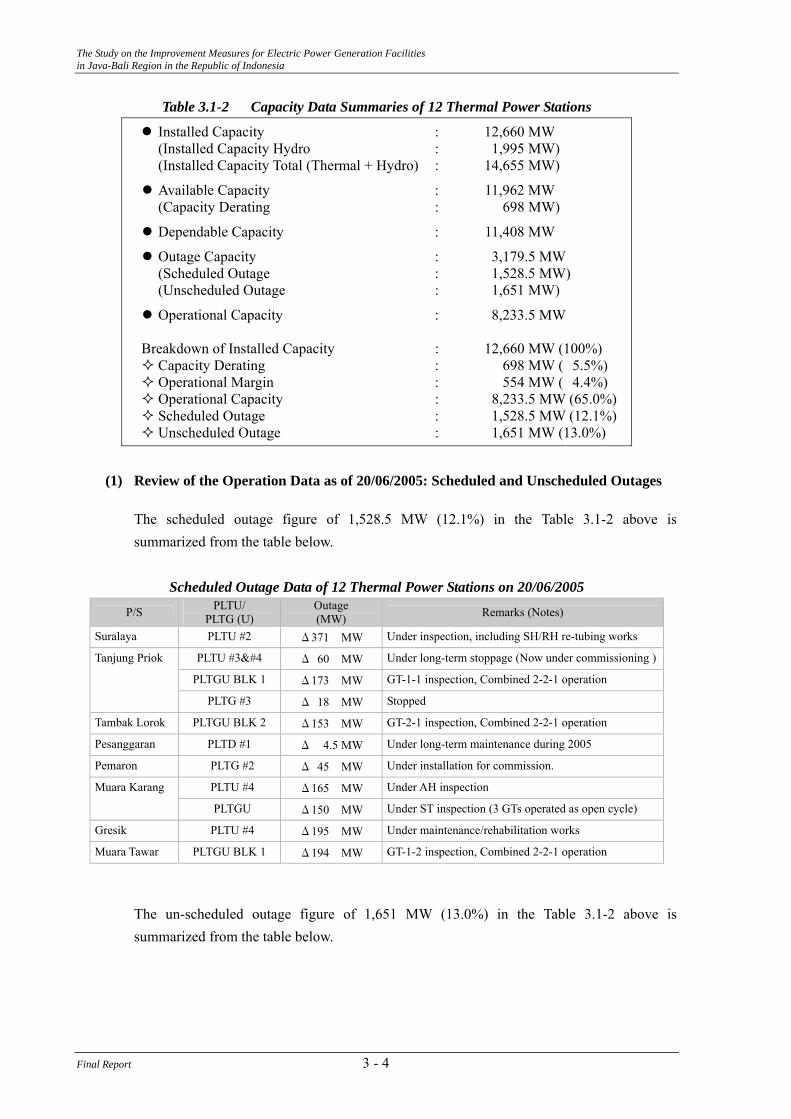
Table 3.1-2 shows the summarized capacity data of the objective twelve (12) thermal power stations on June 20, 2005 when the serous power supply shortage had occurred in Java-Bali region.
3 - 3 Final Report
The Study on the Improvement Measures for Electric Power Generation Facilities in Java-Bali Region in the Republic of Indonesia
Table 3.1-2 Capacity Data Summaries of 12 Thermal Power Stations
Installed Capacity : 12,660 MW (Installed Capacity Hydro : 1,995 MW) (Installed Capacity Total (Thermal + Hydro) : 14,655 MW)
Available Capacity : 11,962 MW (Capacity Derating : 698 MW)
Dependable Capacity : 11,408 MW
Outage Capacity : 3,179.5 MW (Scheduled Outage : 1,528.5 MW) (Unscheduled Outage : 1,651 MW)
Operational Capacity : 8,233.5 MW Breakdown of Installed Capacity : 12,660 MW (100%)
Capacity Derating : 698 MW ( 5.5%) Operational Margin : 554 MW ( 4.4%) Operational Capacity : 8,233.5 MW (65.0%) Scheduled Outage : 1,528.5 MW (12.1%) Unscheduled Outage : 1,651 MW (13.0%)
(1) Review of the Operation Data as of 20/06/2005: Scheduled and Unscheduled Outages
The scheduled outage figure of 1,528.5 MW (12.1%) in the Table 3.1-2 above is summarized from the table below.
Scheduled Outage Data of 12 Thermal Power Stations on 20/06/2005
P/S PLTU/ PLTG (U)
Outage (MW) Remarks (Notes)
Suralaya PLTU #2 Δ371 MW Under inspection, including SH/RH re-tubing works
PLTU #3 Δ 60 MW Under long-term stoppage (Now under commissioning )
PLTGU BLK 1 Δ173 MW GT-1-1 inspection, Combined 2-2-1 operation
Tanjung Priok
PLTG #3 Δ 18 MW Stopped
Tambak Lorok PLTGU BLK 2 Δ153 MW GT-2-1 inspection, Combined 2-2-1 operation
Pesanggaran PLTD #1 Δ 4.5 MW Under long-term maintenance during 2005
Pemaron PLTG #2 Δ 45 MW Under installation for commission.
PLTU #4 Δ165 MW Under AH inspection Muara Karang
PLTGU Δ150 MW Under ST inspection (3 GTs operated as open cycle)
Gresik PLTU #4 Δ195 MW Under maintenance/rehabilitation works
Muara Tawar PLTGU BLK 1 Δ194 MW GT-1-2 inspection, Combined 2-2-1 operation
The un-scheduled outage figure of 1,651 MW (13.0%) in the Table 3.1-2 above is summarized from the table below.
Final Report 3 - 4
The Study on the Improvement Measures for Electric Power Generation Facilities in Java-Bali Region in the Republic of Indonesia
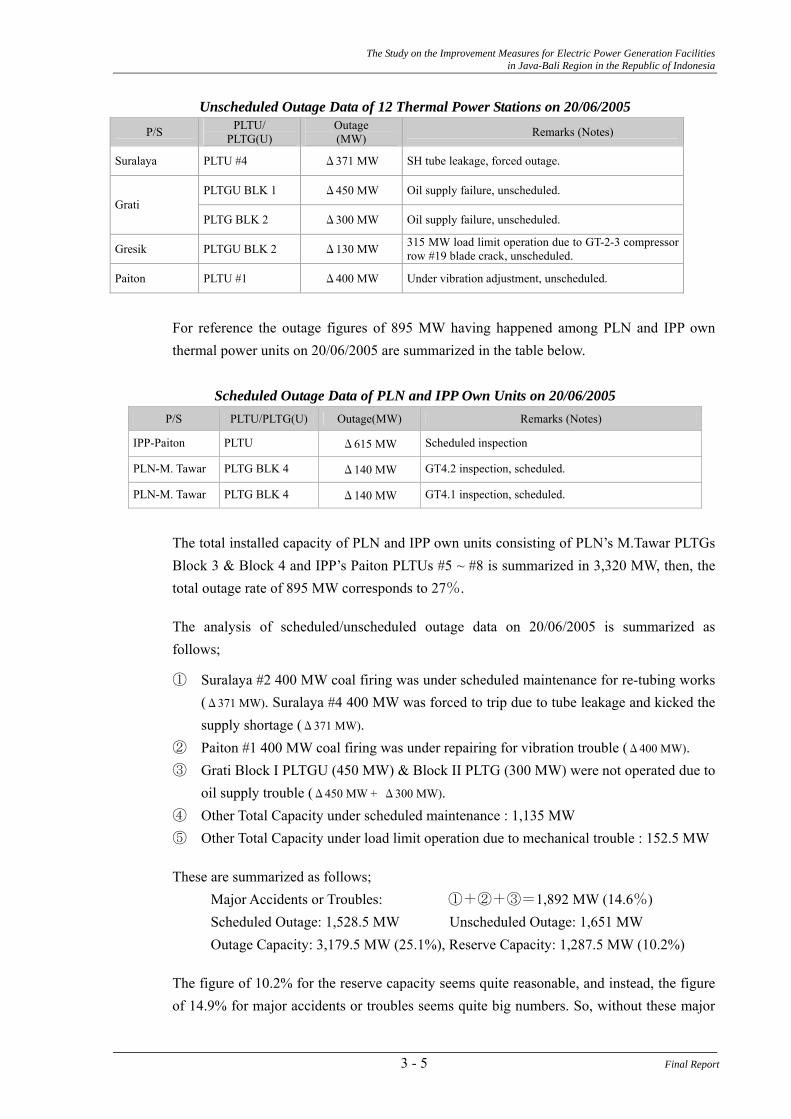
Unscheduled Outage Data of 12 Thermal Power Stations on 20/06/2005
P/S PLTU/ PLTG(U)
Outage (MW) Remarks (Notes)
Suralaya PLTU #4 Δ371 MW SH tube leakage, forced outage.
PLTGU BLK 1 Δ450 MW Oil supply failure, unscheduled. Grati
PLTG BLK 2 Δ300 MW Oil supply failure, unscheduled.
Gresik PLTGU BLK 2 Δ130 MW 315 MW load limit operation due to GT-2-3 compressor row #19 blade crack, unscheduled.
Paiton PLTU #1 Δ400 MW Under vibration adjustment, unscheduled.
For reference the outage figures of 895 MW having happened among PLN and IPP own thermal power units on 20/06/2005 are summarized in the table below.
Scheduled Outage Data of PLN and IPP Own Units on 20/06/2005
P/S PLTU/PLTG(U) Outage(MW) Remarks (Notes)
IPP-Paiton PLTU Δ615 MW Scheduled inspection
PLN-M. Tawar PLTG BLK 4 Δ140 MW GT4.2 inspection, scheduled.
PLN-M. Tawar PLTG BLK 4 Δ140 MW GT4.1 inspection, scheduled.
The total installed capacity of PLN and IPP own units consisting of PLN’s M.Tawar PLTGs Block 3 & Block 4 and IPP’s Paiton PLTUs #5 ~ #8 is summarized in 3,320 MW, then, the total outage rate of 895 MW corresponds to 27%.
The analysis of scheduled/unscheduled outage data on 20/06/2005 is summarized as follows;
① Suralaya #2 400 MW coal firing was under scheduled maintenance for re-tubing works (Δ371 MW). Suralaya #4 400 MW was forced to trip due to tube leakage and kicked the supply shortage (Δ371 MW).
② Paiton #1 400 MW coal firing was under repairing for vibration trouble (Δ400 MW). ③ Grati Block I PLTGU (450 MW) & Block II PLTG (300 MW) were not operated due to
oil supply trouble (Δ450 MW + Δ300 MW). ④ Other Total Capacity under scheduled maintenance : 1,135 MW ⑤ Other Total Capacity under load limit operation due to mechanical trouble : 152.5 MW
These are summarized as follows; Major Accidents or Troubles: ①+②+③=1,892 MW (14.6%) Scheduled Outage: 1,528.5 MW Unscheduled Outage: 1,651 MW Outage Capacity: 3,179.5 MW (25.1%), Reserve Capacity: 1,287.5 MW (10.2%)
The figure of 10.2% for the reserve capacity seems quite reasonable, and instead, the figure of 14.9% for major accidents or troubles seems quite big numbers. So, without these major
3 - 5 Final Report
The Study on the Improvement Measures for Electric Power Generation Facilities in Java-Bali Region in the Republic of Indonesia
accidents or troubles, the serious power supply shortage on 20/06/2005 would not have happened.
This causes these major requirements; ① Reliability Improvement Rehabilitation of Coal Fired Boilers, including Re-tubing
Works ② Oil (HSD) Supply Expansion or Oil Reduction
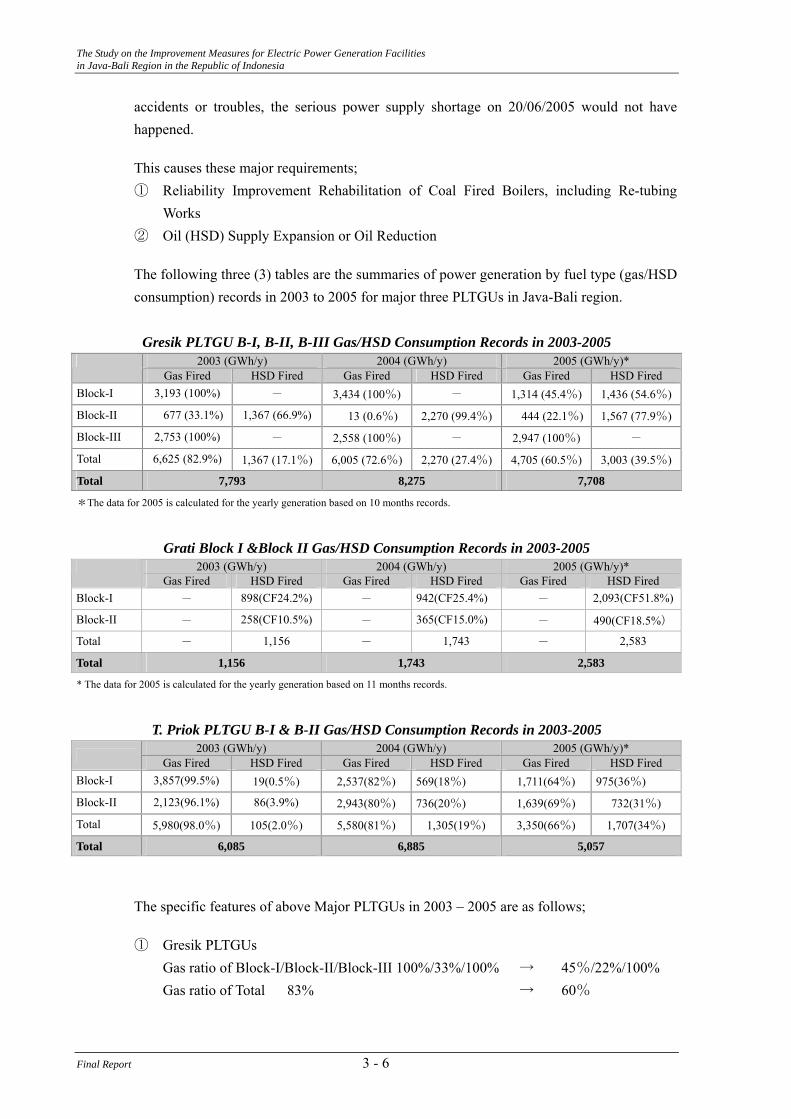
The following three (3) tables are the summaries of power generation by fuel type (gas/HSD consumption) records in 2003 to 2005 for major three PLTGUs in Java-Bali region.
Gresik PLTGU B-I, B-II, B-III Gas/HSD Consumption Records in 2003-2005
2003 (GWh/y) 2004 (GWh/y) 2005 (GWh/y)* Gas Fired HSD Fired Gas Fired HSD Fired Gas Fired HSD Fired
Block-I 3,193 (100%) - 3,434 (100%) - 1,314 (45.4%) 1,436 (54.6%)
Block-II 677 (33.1%) 1,367 (66.9%) 13 (0.6%) 2,270 (99.4%) 444 (22.1%) 1,567 (77.9%)
Block-III 2,753 (100%) - 2,558 (100%) - 2,947 (100%) -
Total 6,625 (82.9%) 1,367 (17.1%) 6,005 (72.6%) 2,270 (27.4%) 4,705 (60.5%) 3,003 (39.5%)
Total 7,793 8,275 7,708
*The data for 2005 is calculated for the yearly generation based on 10 months records.
Grati Block I &Block II Gas/HSD Consumption Records in 2003-2005 2003 (GWh/y) 2004 (GWh/y) 2005 (GWh/y)*
Gas Fired HSD Fired Gas Fired HSD Fired Gas Fired HSD Fired Block-I - 898(CF24.2%) - 942(CF25.4%) - 2,093(CF51.8%)
Block-II - 258(CF10.5%) - 365(CF15.0%) - 490(CF18.5%)
Total - 1,156 - 1,743 - 2,583
Total 1,156 1,743 2,583
* The data for 2005 is calculated for the yearly generation based on 11 months records.
T. Priok PLTGU B-I & B-II Gas/HSD Consumption Records in 2003-2005
2003 (GWh/y) 2004 (GWh/y) 2005 (GWh/y)* Gas Fired HSD Fired Gas Fired HSD Fired Gas Fired HSD Fired Block-I 3,857(99.5%) 19(0.5%) 2,537(82%) 569(18%) 1,711(64%) 975(36%)
Block-II 2,123(96.1%) 86(3.9%) 2,943(80%) 736(20%) 1,639(69%) 732(31%)
Total 5,980(98.0%) 105(2.0%) 5,580(81%) 1,305(19%) 3,350(66%) 1,707(34%)
Total 6,085 6,885 5,057
The specific features of above Major PLTGUs in 2003 – 2005 are as follows;
① Gresik PLTGUs Gas ratio of Block-I/Block-II/Block-III 100%/33%/100% → 45%/22%/100% Gas ratio of Total 83% → 60%
Final Report 3 - 6
The Study on the Improvement Measures for Electric Power Generation Facilities in Java-Bali Region in the Republic of Indonesia
② Grati PLTGU/PLTG of HSD Firing CF of Block-I CF=24% → CF=52% CF of Block-II CF=10% → CF=18%
③ T. Priok PLTGUs Gas ratio of Block-I/Block-II 100%/100% → 64%/69% Gas ratio total 100% → 66%
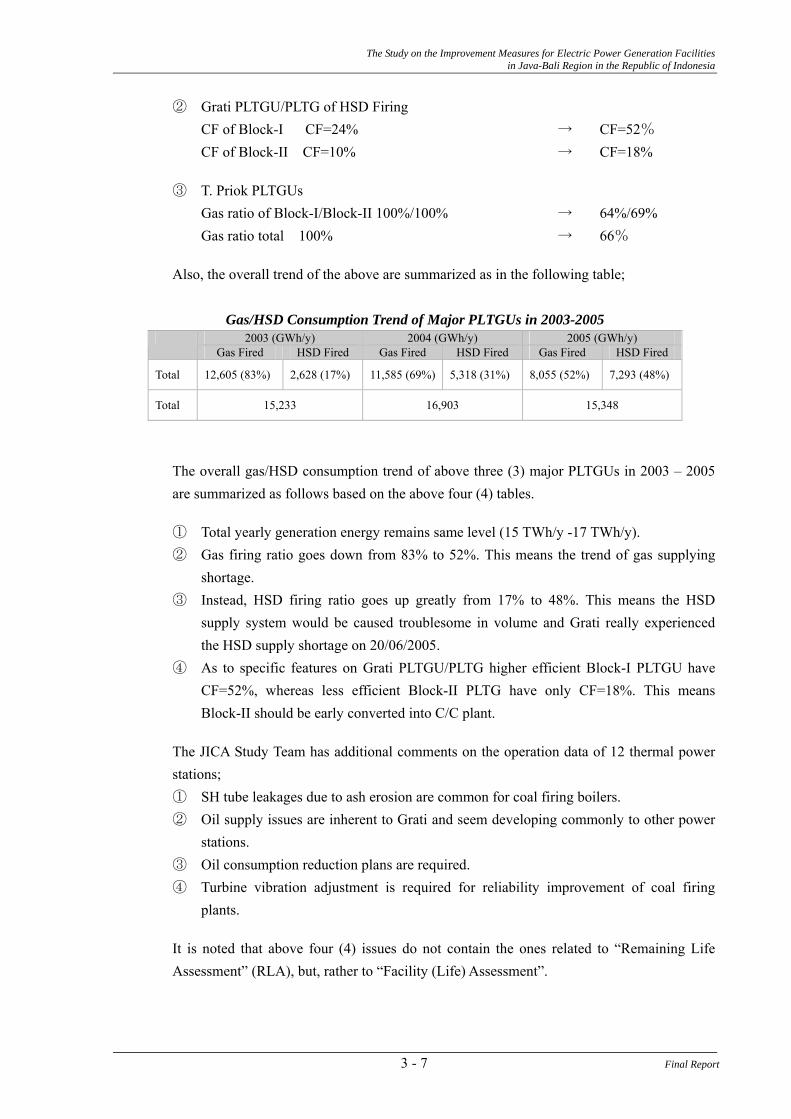
Also, the overall trend of the above are summarized as in the following table;
Gas/HSD Consumption Trend of Major PLTGUs in 2003-2005 2003 (GWh/y) 2004 (GWh/y) 2005 (GWh/y)
Gas Fired HSD Fired Gas Fired HSD Fired Gas Fired HSD Fired
Total 12,605 (83%) 2,628 (17%) 11,585 (69%) 5,318 (31%) 8,055 (52%) 7,293 (48%)
Total 15,233 16,903 15,348
The overall gas/HSD consumption trend of above three (3) major PLTGUs in 2003 – 2005 are summarized as follows based on the above four (4) tables.
① Total yearly generation energy remains same level (15 TWh/y -17 TWh/y). ② Gas firing ratio goes down from 83% to 52%. This means the trend of gas supplying
shortage. ③ Instead, HSD firing ratio goes up greatly from 17% to 48%. This means the HSD
supply system would be caused troublesome in volume and Grati really experienced the HSD supply shortage on 20/06/2005.
④ As to specific features on Grati PLTGU/PLTG higher efficient Block-I PLTGU have CF=52%, whereas less efficient Block-II PLTG have only CF=18%. This means Block-II should be early converted into C/C plant.
The JICA Study Team has additional comments on the operation data of 12 thermal power stations; ① SH tube leakages due to ash erosion are common for coal firing boilers. ② Oil supply issues are inherent to Grati and seem developing commonly to other power
stations. ③ Oil consumption reduction plans are required. ④ Turbine vibration adjustment is required for reliability improvement of coal firing
plants.
It is noted that above four (4) issues do not contain the ones related to “Remaining Life Assessment” (RLA), but, rather to “Facility (Life) Assessment”.
3 - 7 Final Report
The Study on the Improvement Measures for Electric Power Generation Facilities in Java-Bali Region in the Republic of Indonesia
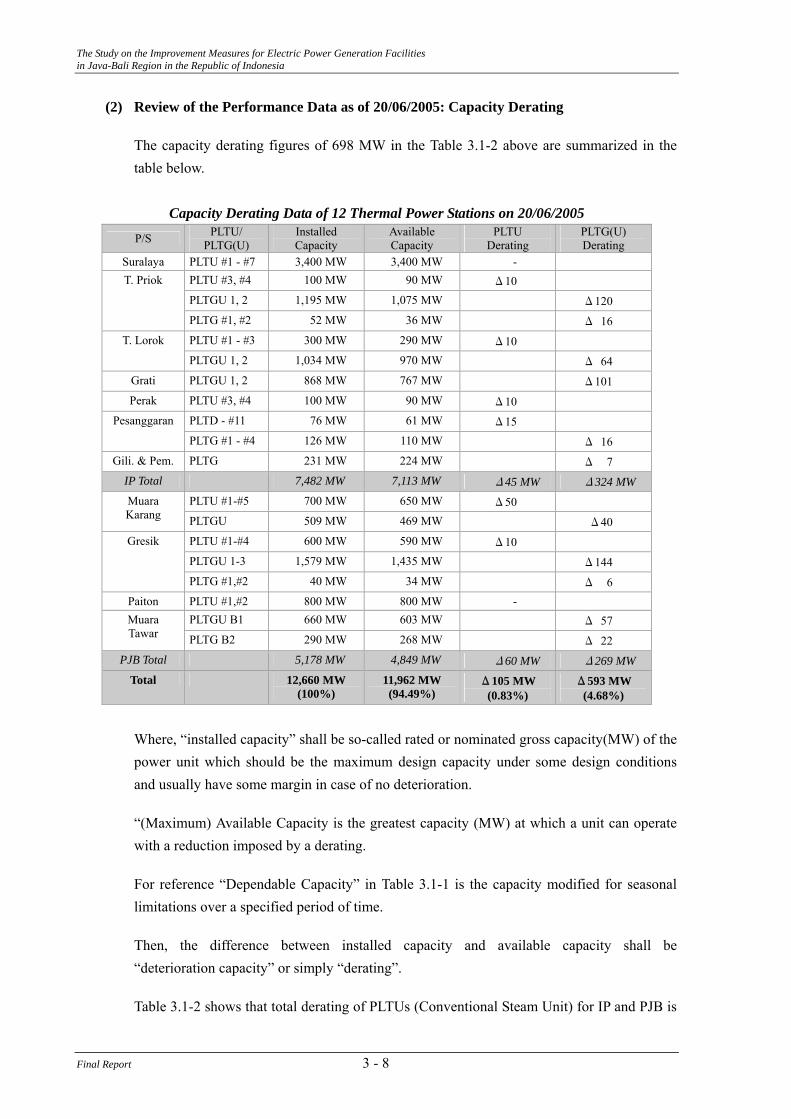
(2) Review of the Performance Data as of 20/06/2005: Capacity Derating
The capacity derating figures of 698 MW in the Table 3.1-2 above are summarized in the table below.
Capacity Derating Data of 12 Thermal Power Stations on 20/06/2005
P/S PLTU/ PLTG(U)
Installed Capacity
Available Capacity
PLTU Derating
PLTG(U) Derating
Suralaya PLTU #1 - #7 3,400 MW 3,400 MW - PLTU #3, #4 100 MW 90 MW Δ10
PLTGU 1, 2 1,195 MW 1,075 MW Δ120
T. Priok
PLTG #1, #2 52 MW 36 MW Δ 16 PLTU #1 - #3 300 MW 290 MW Δ10 T. Lorok
PLTGU 1, 2 1,034 MW 970 MW Δ 64 Grati PLTGU 1, 2 868 MW 767 MW Δ101 Perak PLTU #3, #4 100 MW 90 MW Δ10
PLTD - #11 76 MW 61 MW Δ15 Pesanggaran
PLTG #1 - #4 126 MW 110 MW Δ 16 Gili. & Pem. PLTG 231 MW 224 MW Δ 7
IP Total 7,482 MW 7,113 MW Δ45 MW Δ324 MW PLTU #1-#5 700 MW 650 MW Δ50 Muara
Karang PLTGU 509 MW 469 MW Δ40 PLTU #1-#4 600 MW 590 MW Δ10
PLTGU 1-3 1,579 MW 1,435 MW Δ144
Gresik
PLTG #1,#2 40 MW 34 MW Δ 6 Paiton PLTU #1,#2 800 MW 800 MW -
PLTGU B1 660 MW 603 MW Δ 57 Muara Tawar PLTG B2 290 MW 268 MW Δ 22
PJB Total 5,178 MW 4,849 MW Δ60 MW Δ269 MW Total 12,660 MW
(100%) 11,962 MW (94.49%)
Δ105 MW (0.83%)
Δ593 MW (4.68%)
Where, “installed capacity” shall be so-called rated or nominated gross capacity(MW) of the power unit which should be the maximum design capacity under some design conditions and usually have some margin in case of no deterioration.
“(Maximum) Available Capacity is the greatest capacity (MW) at which a unit can operate with a reduction imposed by a derating.
For reference “Dependable Capacity” in Table 3.1-1 is the capacity modified for seasonal limitations over a specified period of time.
Then, the difference between installed capacity and available capacity shall be “deterioration capacity” or simply “derating”.
Table 3.1-2 shows that total derating of PLTUs (Conventional Steam Unit) for IP and PJB is
Final Report 3 - 8
The Study on the Improvement Measures for Electric Power Generation Facilities in Java-Bali Region in the Republic of Indonesia
only 105 MW (0.83%), that means, almost no capacity derating happens on PLTUs, and total derating of PLTGs (Simple Cycle Gas Turbine) and PLTGUs (Combined Cycle Plant) for IP and PJB is 593 MW (4.68%), the figure of which seems little bigger compared to PLTUs, but, it still is not a big number itself.
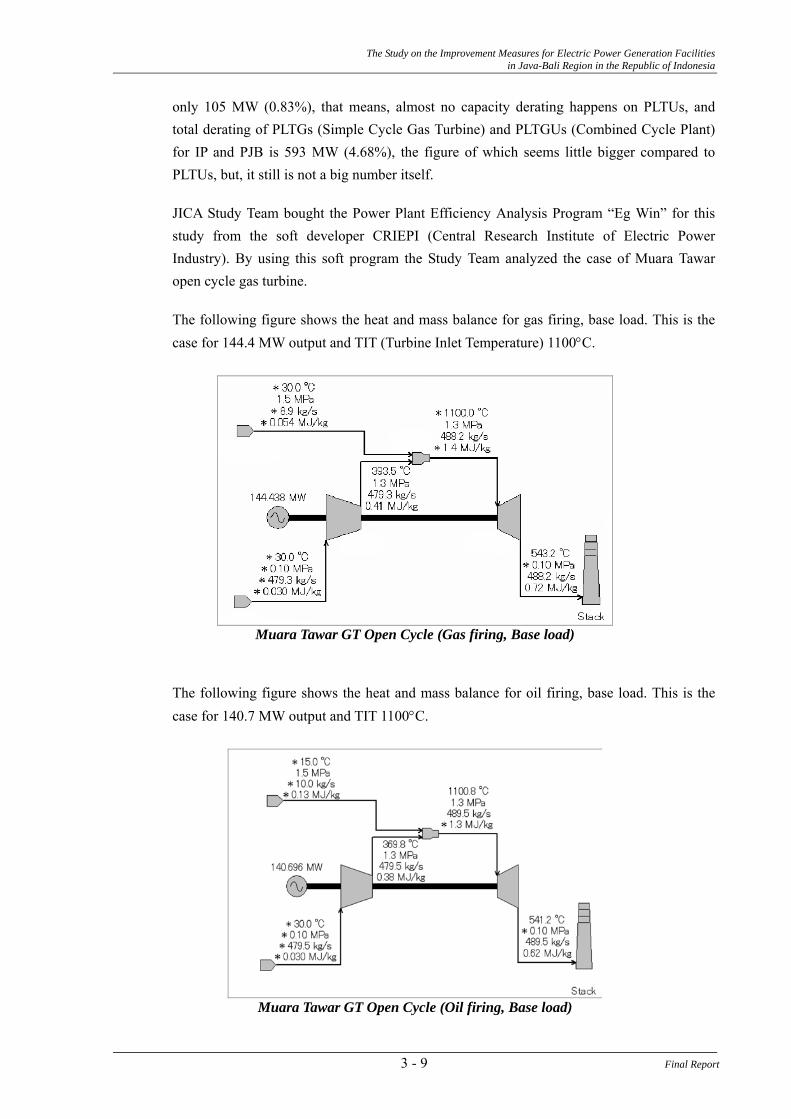
JICA Study Team bought the Power Plant Efficiency Analysis Program “Eg Win” for this study from the soft developer CRIEPI (Central Research Institute of Electric Power Industry). By using this soft program the Study Team analyzed the case of Muara Tawar open cycle gas turbine.
The following figure shows the heat and mass balance for gas firing, base load. This is the case for 144.4 MW output and TIT (Turbine Inlet Temperature) 1100°C.
Muara Tawar GT Open Cycle (Gas firing, Base load)
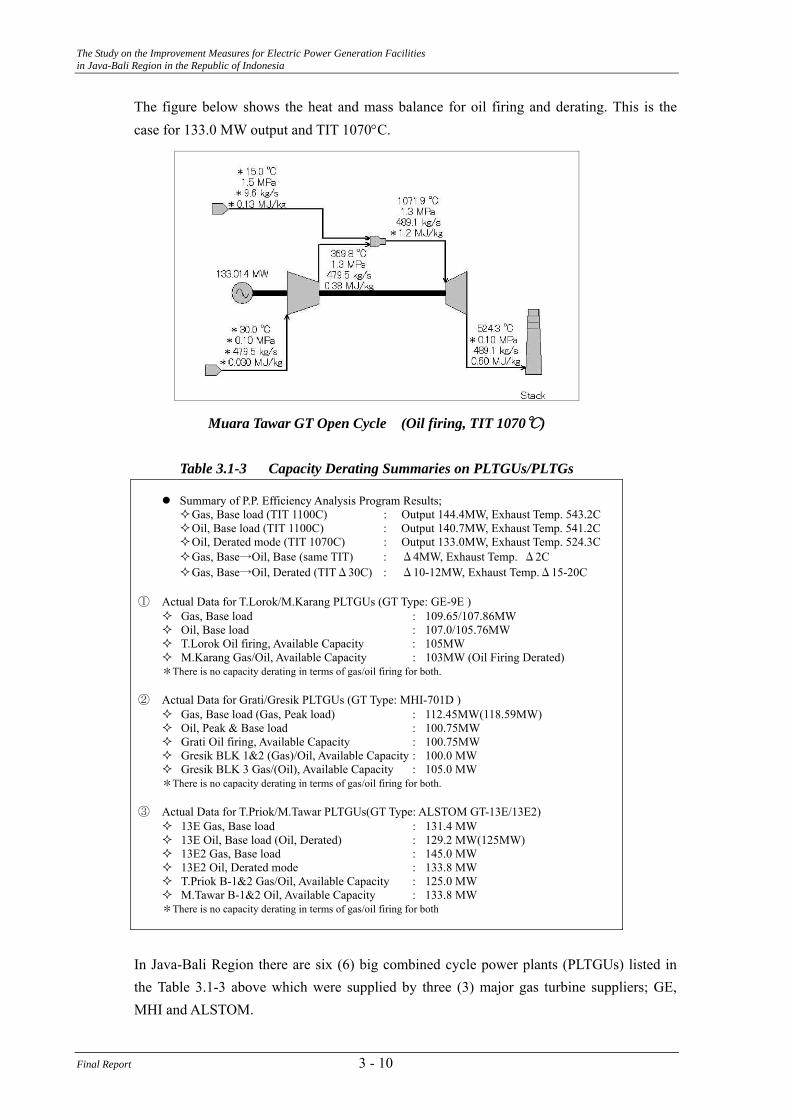
The following figure shows the heat and mass balance for oil firing, base load. This is the case for 140.7 MW output and TIT 1100°C.
Muara Tawar GT Open Cycle (Oil firing, Base load)
3 - 9 Final Report
The Study on the Improvement Measures for Electric Power Generation Facilities in Java-Bali Region in the Republic of Indonesia
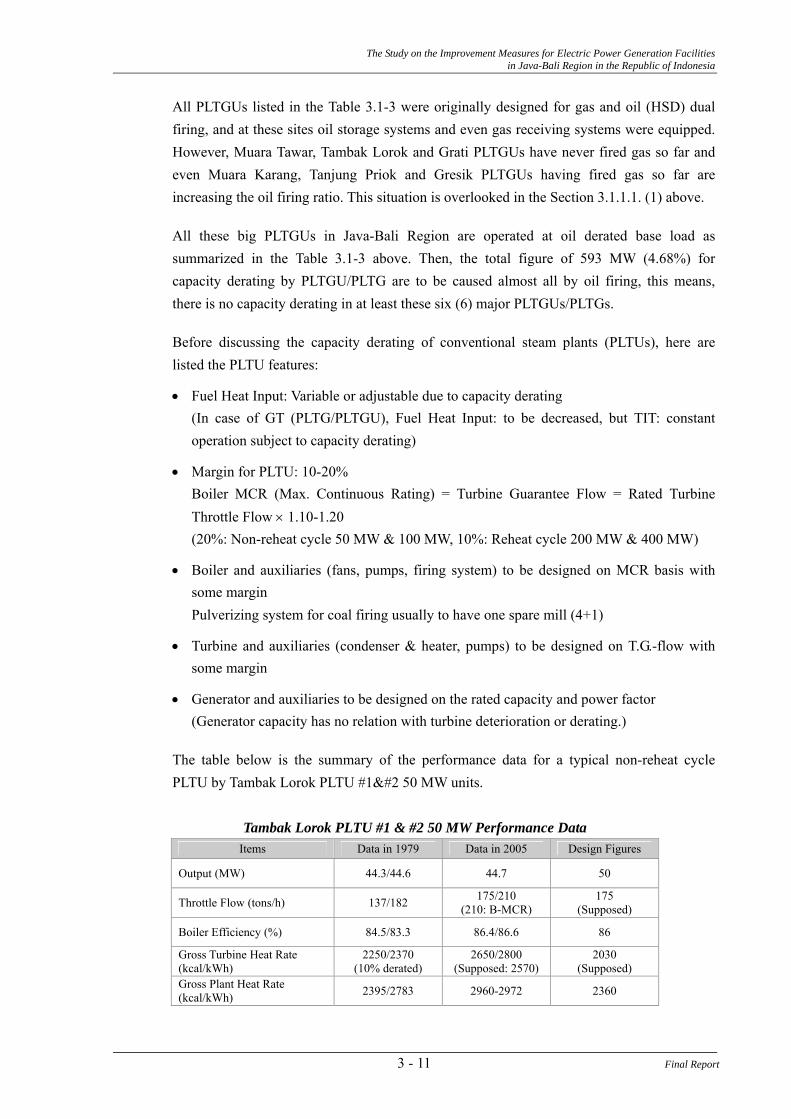
The figure below shows the heat and mass balance for oil firing and derating. This is the case for 133.0 MW output and TIT 1070°C.
Muara Tawar GT Open Cycle (Oil firing, TIT 1070℃)
Table 3.1-3 Capacity Derating Summaries on PLTGUs/PLTGs
Summary of P.P. Efficiency Analysis Program Results; Gas, Base load (TIT 1100C) : Output 144.4MW, Exhaust Temp. 543.2C Oil, Base load (TIT 1100C) : Output 140.7MW, Exhaust Temp. 541.2C Oil, Derated mode (TIT 1070C) : Output 133.0MW, Exhaust Temp. 524.3C Gas, Base→Oil, Base (same TIT) : Δ4MW, Exhaust Temp. Δ2C Gas, Base→Oil, Derated (TITΔ30C) : Δ10-12MW, Exhaust Temp.Δ15-20C
① Actual Data for T.Lorok/M.Karang PLTGUs (GT Type: GE-9E )
Gas, Base load : 109.65/107.86MW Oil, Base load : 107.0/105.76MW T.Lorok Oil firing, Available Capacity : 105MW M.Karang Gas/Oil, Available Capacity : 103MW (Oil Firing Derated)
*There is no capacity derating in terms of gas/oil firing for both. ② Actual Data for Grati/Gresik PLTGUs (GT Type: MHI-701D )
Gas, Base load (Gas, Peak load) : 112.45MW(118.59MW) Oil, Peak & Base load : 100.75MW Grati Oil firing, Available Capacity : 100.75MW Gresik BLK 1&2 (Gas)/Oil, Available Capacity : 100.0 MW Gresik BLK 3 Gas/(Oil), Available Capacity : 105.0 MW
*There is no capacity derating in terms of gas/oil firing for both. ③ Actual Data for T.Priok/M.Tawar PLTGUs(GT Type: ALSTOM GT-13E/13E2)
13E Gas, Base load : 131.4 MW 13E Oil, Base load (Oil, Derated) : 129.2 MW(125MW) 13E2 Gas, Base load : 145.0 MW 13E2 Oil, Derated mode : 133.8 MW T.Priok B-1&2 Gas/Oil, Available Capacity : 125.0 MW M.Tawar B-1&2 Oil, Available Capacity : 133.8 MW
*There is no capacity derating in terms of gas/oil firing for both
In Java-Bali Region there are six (6) big combined cycle power plants (PLTGUs) listed in the Table 3.1-3 above which were supplied by three (3) major gas turbine suppliers; GE, MHI and ALSTOM.
Final Report 3 - 10
The Study on the Improvement Measures for Electric Power Generation Facilities in Java-Bali Region in the Republic of Indonesia
All PLTGUs listed in the Table 3.1-3 were originally designed for gas and oil (HSD) dual firing, and at these sites oil storage systems and even gas receiving systems were equipped. However, Muara Tawar, Tambak Lorok and Grati PLTGUs have never fired gas so far and even Muara Karang, Tanjung Priok and Gresik PLTGUs having fired gas so far are increasing the oil firing ratio. This situation is overlooked in the Section 3.1.1.1. (1) above.
All these big PLTGUs in Java-Bali Region are operated at oil derated base load as summarized in the Table 3.1-3 above. Then, the total figure of 593 MW (4.68%) for capacity derating by PLTGU/PLTG are to be caused almost all by oil firing, this means, there is no capacity derating in at least these six (6) major PLTGUs/PLTGs.
Before discussing the capacity derating of conventional steam plants (PLTUs), here are listed the PLTU features:
• Fuel Heat Input: Variable or adjustable due to capacity derating (In case of GT (PLTG/PLTGU), Fuel Heat Input: to be decreased, but TIT: constant
operation subject to capacity derating)
• Margin for PLTU: 10-20% Boiler MCR (Max. Continuous Rating) = Turbine Guarantee Flow = Rated Turbine
Throttle Flow × 1.10-1.20 (20%: Non-reheat cycle 50 MW & 100 MW, 10%: Reheat cycle 200 MW & 400 MW)
• Boiler and auxiliaries (fans, pumps, firing system) to be designed on MCR basis with some margin
Pulverizing system for coal firing usually to have one spare mill (4+1)
• Turbine and auxiliaries (condenser & heater, pumps) to be designed on T.G.-flow with some margin
• Generator and auxiliaries to be designed on the rated capacity and power factor (Generator capacity has no relation with turbine deterioration or derating.)
The table below is the summary of the performance data for a typical non-reheat cycle PLTU by Tambak Lorok PLTU #1 50 MW units.
Tambak Lorok PLTU #1 & #2 50 MW Performance Data
Items Data in 1979 Data in 2005 Design Figures
Output (MW) 44.3/44.6 44.7 50
Throttle Flow (tons/h) 137/182 175/210 (210: B-MCR)
175 (Supposed)
Boiler Efficiency (%) 84.5/83.3 86.4/86.6 86
Gross Turbine Heat Rate (kcal/kWh)
2250/2370 (10% derated)
2650/2800 (Supposed: 2570)
2030 (Supposed)
Gross Plant Heat Rate (kcal/kWh) 2395/2783 2960-2972 2360
3 - 11 Final Report
The Study on the Improvement Measures for Electric Power Generation Facilities in Java-Bali Region in the Republic of Indonesia
About 20% capacity derating has happened at Tambak Lorok #1 50 MW units. It is considered that the half 10% capacity derating had happened at the early initial stage up to 1979 with firing system trouble and another half 10% capacity derating has happened afterwards up to now. However, the boiler MCR evaporation (210 ton/h) still has enough margins for derated turbine throttle flow. Then, the capacity derating issue on PLTUs of this class does not clearly exist.
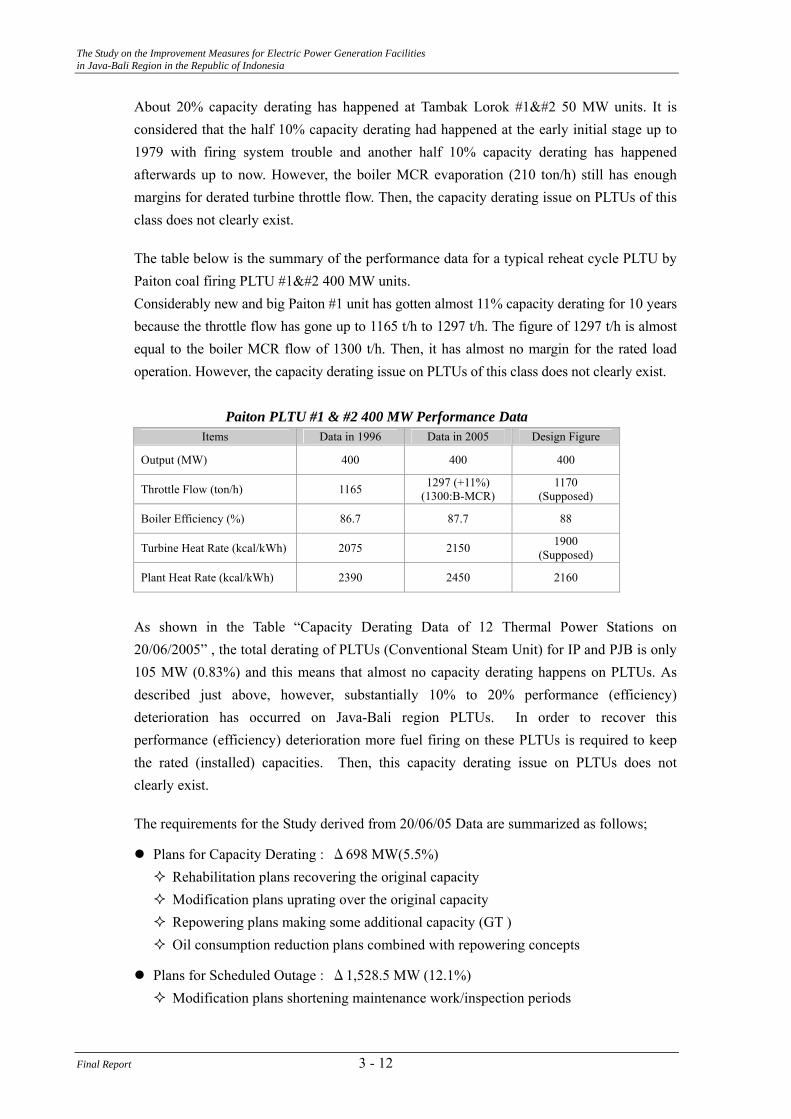
The table below is the summary of the performance data for a typical reheat cycle PLTU by Paiton coal firing PLTU #1 400 MW units. Considerably new and big Paiton #1 unit has gotten almost 11% capacity derating for 10 years because the throttle flow has gone up to 1165 t/h to 1297 t/h. The figure of 1297 t/h is almost equal to the boiler MCR flow of 1300 t/h. Then, it has almost no margin for the rated load operation. However, the capacity derating issue on PLTUs of this class does not clearly exist.
Paiton PLTU #1 & #2 400 MW Performance Data Items Data in 1996 Data in 2005 Design Figure
Output (MW) 400 400 400
Throttle Flow (ton/h) 1165 1297 (+11%) (1300:B-MCR)
1170 (Supposed)
Boiler Efficiency (%) 86.7 87.7 88
Turbine Heat Rate (kcal/kWh) 2075 2150 1900 (Supposed)
Plant Heat Rate (kcal/kWh) 2390 2450 2160
As shown in the Table “Capacity Derating Data of 12 Thermal Power Stations on 20/06/2005” , the total derating of PLTUs (Conventional Steam Unit) for IP and PJB is only 105 MW (0.83%) and this means that almost no capacity derating happens on PLTUs. As described just above, however, substantially 10% to 20% performance (efficiency) deterioration has occurred on Java-Bali region PLTUs. In order to recover this performance (efficiency) deterioration more fuel firing on these PLTUs is required to keep the rated (installed) capacities. Then, this capacity derating issue on PLTUs does not clearly exist.
The requirements for the Study derived from 20/06/05 Data are summarized as follows;
Plans for Capacity Derating : Δ698 MW(5.5%) Rehabilitation plans recovering the original capacity Modification plans uprating over the original capacity Repowering plans making some additional capacity (GT ) Oil consumption reduction plans combined with repowering concepts
Plans for Scheduled Outage : Δ1,528.5 MW (12.1%) Modification plans shortening maintenance work/inspection periods
Final Report 3 - 12
The Study on the Improvement Measures for Electric Power Generation Facilities in Java-Bali Region in the Republic of Indonesia
Modification plans avoiding overlapped maintenance works
Plans for Unscheduled/Forced Outage : Δ1,651 MW(13.0%) Preventive rehabilitation plans based on “Facility (Life) assessment” Modernization plans preventing recurrent (instrumental) trip outage Life extension plans based on “Remaining Life Assessment (RLA)” for repowering plans.
3.1.1.2. Each Power Station
(1) Muara Tawar Power Station
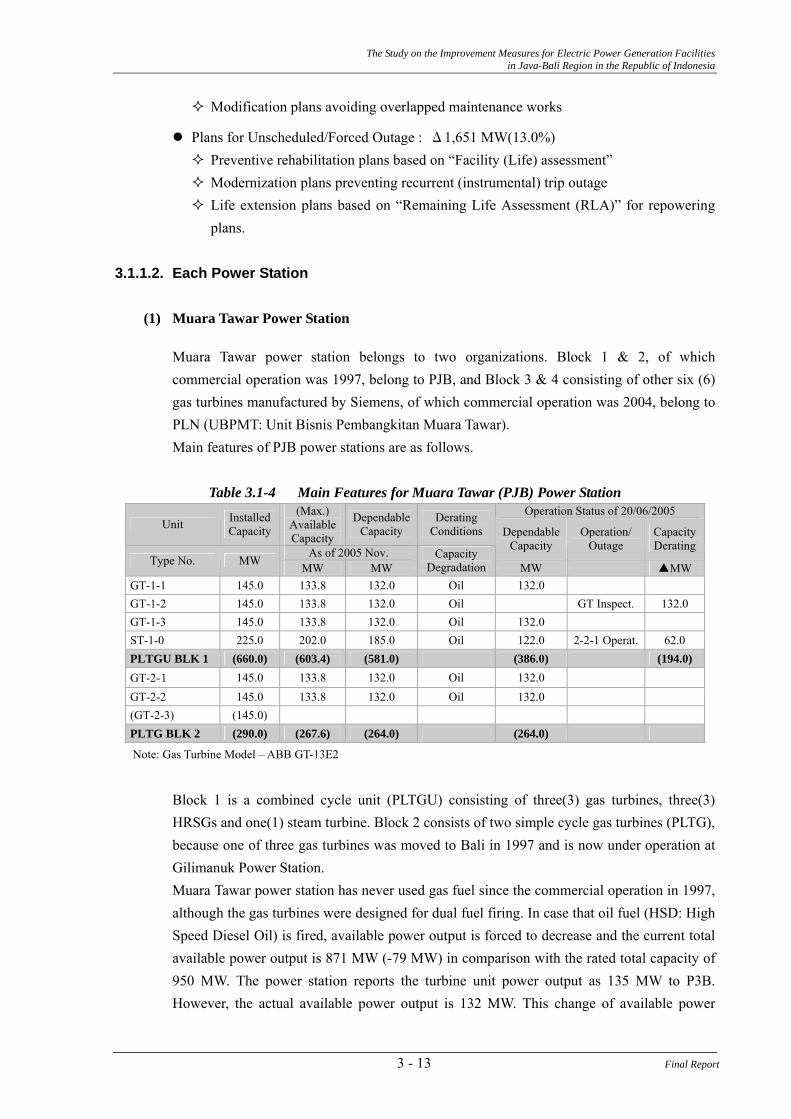
Muara Tawar power station belongs to two organizations. Block 1 & 2, of which commercial operation was 1997, belong to PJB, and Block 3 & 4 consisting of other six (6) gas turbines manufactured by Siemens, of which commercial operation was 2004, belong to PLN (UBPMT: Unit Bisnis Pembangkitan Muara Tawar). Main features of PJB power stations are as follows.
Table 3.1-4 Main Features for Muara Tawar (PJB) Power Station
Operation Status of 20/06/2005 Unit Installed
Capacity
(Max.) Available Capacity
Dependable Capacity
Derating Conditions
As of 2005 Nov.
Dependable Capacity
Operation/ Outage
Capacity Derating
Type No. MW MW MW Capacity
Degradation MW ▲MW
GT-1-1 145.0 133.8 132.0 Oil 132.0 GT-1-2 145.0 133.8 132.0 Oil GT Inspect. 132.0 GT-1-3 145.0 133.8 132.0 Oil 132.0 ST-1-0 225.0 202.0 185.0 Oil 122.0 2-2-1 Operat. 62.0 PLTGU BLK 1 (660.0) (603.4) (581.0) (386.0) (194.0) GT-2-1 145.0 133.8 132.0 Oil 132.0 GT-2-2 145.0 133.8 132.0 Oil 132.0 (GT-2-3) (145.0) PLTG BLK 2 (290.0) (267.6) (264.0) (264.0)
Note: Gas Turbine Model – ABB GT-13E2
Block 1 is a combined cycle unit (PLTGU) consisting of three(3) gas turbines, three(3) HRSGs and one(1) steam turbine. Block 2 consists of two simple cycle gas turbines (PLTG), because one of three gas turbines was moved to Bali in 1997 and is now under operation at Gilimanuk Power Station. Muara Tawar power station has never used gas fuel since the commercial operation in 1997, although the gas turbines were designed for dual fuel firing. In case that oil fuel (HSD: High Speed Diesel Oil) is fired, available power output is forced to decrease and the current total available power output is 871 MW (-79 MW) in comparison with the rated total capacity of 950 MW. The power station reports the turbine unit power output as 135 MW to P3B. However, the actual available power output is 132 MW. This change of available power
3 - 13 Final Report
The Study on the Improvement Measures for Electric Power Generation Facilities in Java-Bali Region in the Republic of Indonesia
output was caused by changing the gas turbine inlet temperature (TIT) to 1070℃. The figure of 133.8 MW for Block 2 is the one derived from Gilimanuk PLTG being open cycle operated.
Muara Tawar Block 1 and Block 2 used to have heavy tube leakage troubles on their HRSGs from just after commissioning and also have many combustion troubles on the new type of 13E2 gas turbines. Then, their operation records show very low availability rates in the previous years. However, the data in 2004 show much improvement in the factor of availability hours. TIT decreasing mentioned above will contribute to this improvement.
Without any gas firing at Muara Tawar power station, HRSGs of PLTGU Block 1 get some contamination (soot dust) on their heating bank tubes and then cause less heat absorption, and or stack gas temperature get higher. This results in steam turbine (ST-1-0) derating.
The following repowering plan to Block 2 would be considered; A combined cycle installation (PLTGU 3-3-1) of Block 2 by adding one(1) gas turbine, three(3) HRSGs and one(1) steam turbine/generator.
Note: Above repowering plan has been already proposed by others as “Add-one Project”.
(2) Gresik Power Station
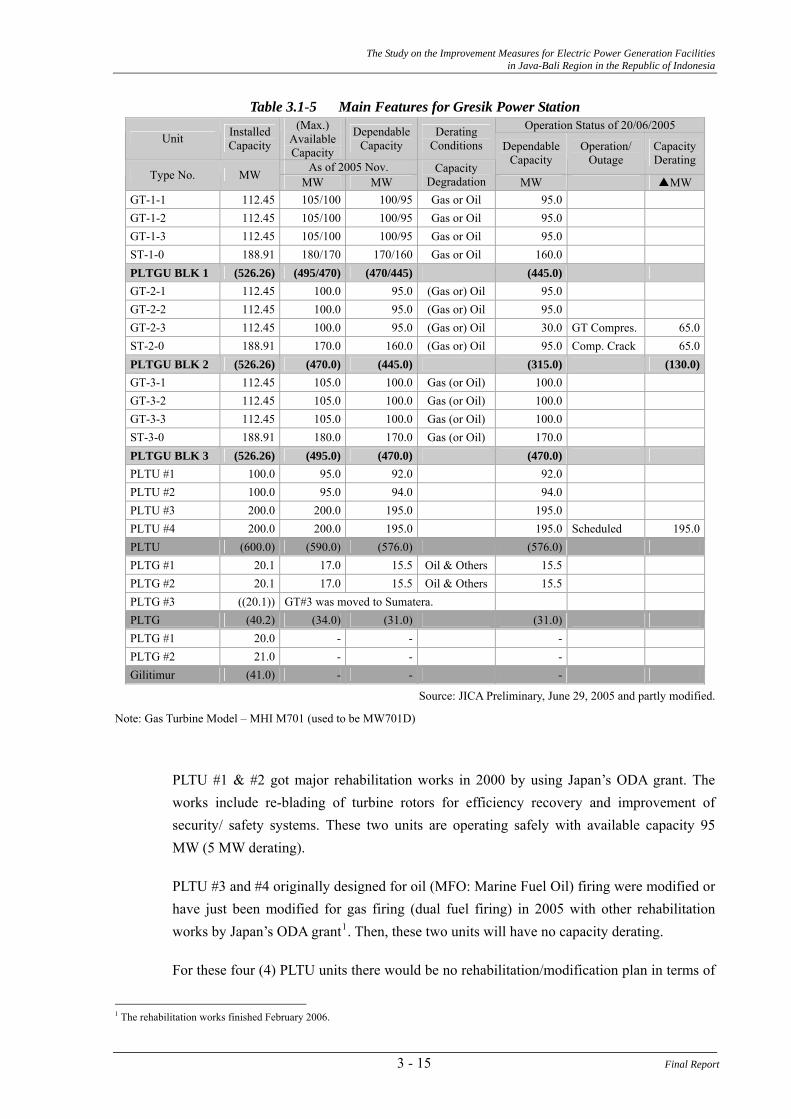
Gresik power station consists of conventional units (PLTU: boiler/turbine), combined cycle units (PLTGU: gas turbine/HRSG/steam turbine), and open cycle gas turbines (PLTG : simple cycle gas turbine) and the total rated capacity is 2,259 MW. Two units of gas turbines (PLTGs) out of five (5) open cycle gas turbines moved to Madura Island (about 2 km far from Gresik) and have been operated as Gilitimur power station. Gilitimur power station is under control of Gresik power station. The following table shows the main features for Gresik power station including Gilitimur power station.
PLTGU Block 1, Block 2 and Block 3 were designed for dual fuel (gas/HSD) firing. Available power output of gas turbines and combined cycle plant with HSD firing is decreased by about 5 %. Gas turbines with HSD firing can produce 105 MW in comparison of the rated capacity of 112.5 MW for gas firing. Rated capacity for oil firing of Block 1, 2 and 3 is 460 MW (GT 100 MW × 3 + ST 160 MW). Capacity derating of steam turbine for oil firing is considerably big, because of less heat absorption by HRSG due to avoiding low temperature corrosion by sulfur in oil.
A gas turbine trends to decrease of its power output due to sticking dirt in an air compressor generally. However, restoration of about 5 MW will be expected by the vane cleanings with twice a year.
Final Report 3 - 14
The Study on the Improvement Measures for Electric Power Generation Facilities in Java-Bali Region in the Republic of Indonesia
Table 3.1-5 Main Features for Gresik Power Station Operation Status of 20/06/2005
Unit Installed Capacity
(Max.) Available Capacity
Dependable Capacity
Derating Conditions
As of 2005 Nov.
Dependable Capacity
Operation/ Outage
Capacity Derating
Type No. MW MW MW Capacity
Degradation MW ▲MW
GT-1-1 112.45 105/100 100/95 Gas or Oil 95.0 GT-1-2 112.45 105/100 100/95 Gas or Oil 95.0 GT-1-3 112.45 105/100 100/95 Gas or Oil 95.0 ST-1-0 188.91 180/170 170/160 Gas or Oil 160.0 PLTGU BLK 1 (526.26) (495/470) (470/445) (445.0) GT-2-1 112.45 100.0 95.0 (Gas or) Oil 95.0 GT-2-2 112.45 100.0 95.0 (Gas or) Oil 95.0 GT-2-3 112.45 100.0 95.0 (Gas or) Oil 30.0 GT Compres. 65.0 ST-2-0 188.91 170.0 160.0 (Gas or) Oil 95.0 Comp. Crack 65.0 PLTGU BLK 2 (526.26) (470.0) (445.0) (315.0) (130.0)GT-3-1 112.45 105.0 100.0 Gas (or Oil) 100.0 GT-3-2 112.45 105.0 100.0 Gas (or Oil) 100.0 GT-3-3 112.45 105.0 100.0 Gas (or Oil) 100.0 ST-3-0 188.91 180.0 170.0 Gas (or Oil) 170.0 PLTGU BLK 3 (526.26) (495.0) (470.0) (470.0) PLTU #1 100.0 95.0 92.0 92.0 PLTU #2 100.0 95.0 94.0 94.0 PLTU #3 200.0 200.0 195.0 195.0 PLTU #4 200.0 200.0 195.0 195.0 Scheduled 195.0 PLTU (600.0) (590.0) (576.0) (576.0) PLTG #1 20.1 17.0 15.5 Oil & Others 15.5 PLTG #2 20.1 17.0 15.5 Oil & Others 15.5 PLTG #3 ((20.1)) GT#3 was moved to Sumatera. PLTG (40.2) (34.0) (31.0) (31.0) PLTG #1 20.0 - - - PLTG #2 21.0 - - - Gilitimur (41.0) - - -
Source: JICA Preliminary, June 29, 2005 and partly modified.
Note: Gas Turbine Model – MHI M701 (used to be MW701D)
PLTU #1 & #2 got major rehabilitation works in 2000 by using Japan’s ODA grant. The works include re-blading of turbine rotors for efficiency recovery and improvement of security/ safety systems. These two units are operating safely with available capacity 95 MW (5 MW derating).
PLTU #3 and #4 originally designed for oil (MFO: Marine Fuel Oil) firing were modified or have just been modified for gas firing (dual fuel firing) in 2005 with other rehabilitation works by Japan’s ODA grant1. Then, these two units will have no capacity derating.
For these four (4) PLTU units there would be no rehabilitation/modification plan in terms of
1 The rehabilitation works finished February 2006.
3 - 15 Final Report
The Study on the Improvement Measures for Electric Power Generation Facilities in Java-Bali Region in the Republic of Indonesia
capacity recovery, because these are being operated with almost rating (installed) capacity.
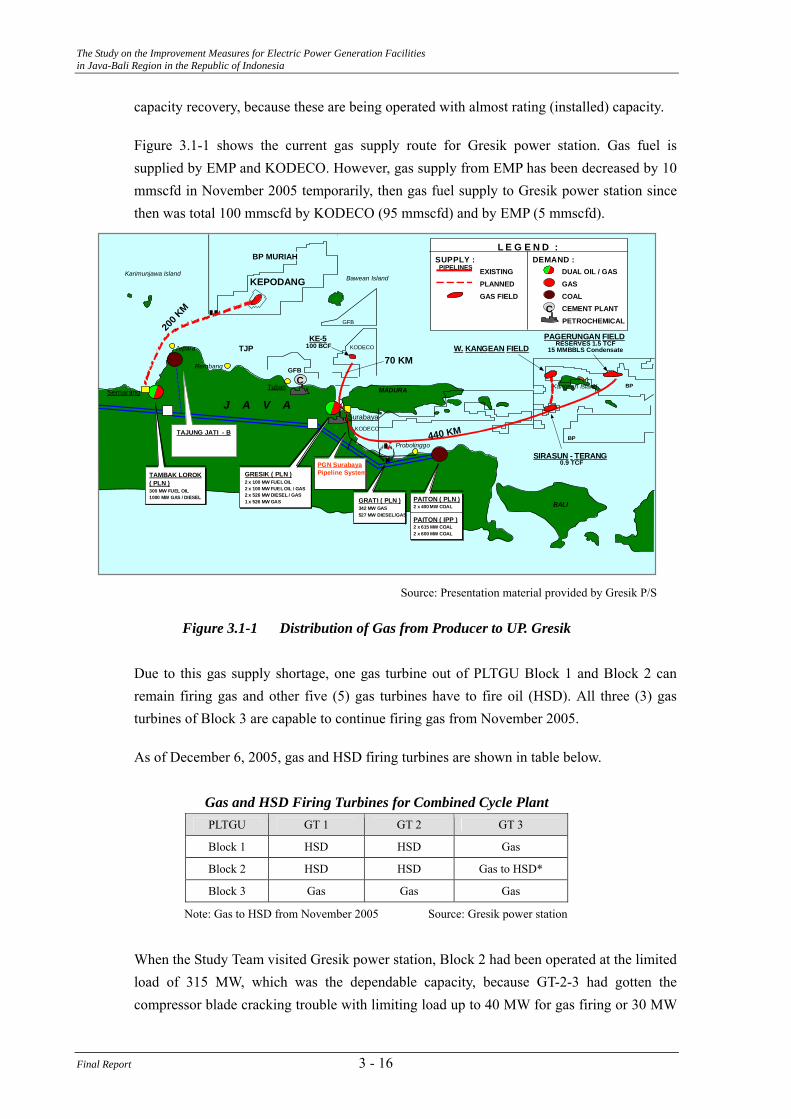
Figure 3.1-1 shows the current gas supply route for Gresik power station. Gas fuel is supplied by EMP and KODECO. However, gas supply from EMP has been decreased by 10 mmscfd in November 2005 temporarily, then gas fuel supply to Gresik power station since then was total 100 mmscfd by KODECO (95 mmscfd) and by EMP (5 mmscfd).
Karimunjawa Island
Jepara
Rembang
Semarang
200 K
M
.
Tuban
GFB
GFB
KODECO
MADURA
KODECO
Surabaya
KEPODANG
BP MURIAH
Bawean Island
TJP
BP
BP
W. KANGEAN FIELDPAGERUNGAN FIELD
RESERVES 1.5 TCF15 MMBBLS Condensate
Kangean Island
SIRASUN - TERANG0.9 TCF
KE-5100 BCF
70 KM
440 KM
C
J A V A
BALIPAITON ( PLN )2 x 400 MW COAL
L E G E N D :SUPPLY : DEMAND :
PIPELINES EXISTINGPLANNEDGAS FIELD
DUAL OIL / GASGASCOALCEMENT PLANTPETROCHEMICAL
C
PAITON ( IPP )2 x 615 MW COAL2 x 600 MW COAL
Probolinggo
GRESIK ( PLN )2 x 100 MW FUELOIL2 x 100 MW FUELOIL / GAS2 x 526 MW DIESEL / GAS1 x 526 MW GAS GRATI ( PLN )
342 MW GAS527 MW DIESEL/GAS
TAMBAK LOROK( PLN )300 MW FUEL OIL1000 MW GAS / DIESEL
TAJUNG JATI - B
PGN SurabayaPipeline System
Source: Presentation material provided by Gresik P/S
Figure 3.1-1 Distribution of Gas from Producer to UP. Gresik
Due to this gas supply shortage, one gas turbine out of PLTGU Block 1 and Block 2 can remain firing gas and other five (5) gas turbines have to fire oil (HSD). All three (3) gas turbines of Block 3 are capable to continue firing gas from November 2005.
As of December 6, 2005, gas and HSD firing turbines are shown in table below.
Gas and HSD Firing Turbines for Combined Cycle Plant PLTGU GT 1 GT 2 GT 3
Block 1 HSD HSD Gas
Block 2 HSD HSD Gas to HSD*
Block 3 Gas Gas Gas
Note: Gas to HSD from November 2005 Source: Gresik power station
When the Study Team visited Gresik power station, Block 2 had been operated at the limited load of 315 MW, which was the dependable capacity, because GT-2-3 had gotten the compressor blade cracking trouble with limiting load up to 40 MW for gas firing or 30 MW
Final Report 3 - 16
The Study on the Improvement Measures for Electric Power Generation Facilities in Java-Bali Region in the Republic of Indonesia
for oil firing. This trouble had been continuing since March 2005 and will continue till parts arrival to the site on March 2006. Then, this had already been occurring during the time when the serious power supply shortage occurred in June 2005. This means 145 MW derating. They explained that the period for part delivery of this kind from oversea usually requires one year.
The following improvement plan would be considered; Part delivery shortening plan to a half of the usual period
Note. This plan benefits the recovery of equivalent derating of about half of the available capacity.
The following repowering plan to PLTU #1 and PLTU #2 would be considered; Two blocks of combined cycle installation (PLTGU 1-1-1 × 2 blocks) by adding two (2) 200 MW class gas turbines, two (2) HRSGs and using two (2) existing steam turbine / generators.
(3) Paiton Power Station
Paiton power station locates 142 km East from Surabaya City and Paiton coal firing power complex consists of PJB (PLTU #1 & #2) and IPP (PLTU #5 ~ #8) portions. The expansion space for unit 3 & 4 is already prepared and common facilities are also constructed in the complex area. Boilers for PLTU #1 & #2 are manufactured by CE (Combustion Engineering), and turbines/generators are manufactured by Toshiba. Design coal has HHV (High Heating Value) of 5,200 Kcal/kg, whereas the current coal of three kinds from Kalimantan Island is lower ranked with HHV 4,800 kcal/kg. This causes requiring five (5) mills operation including a spare mill.
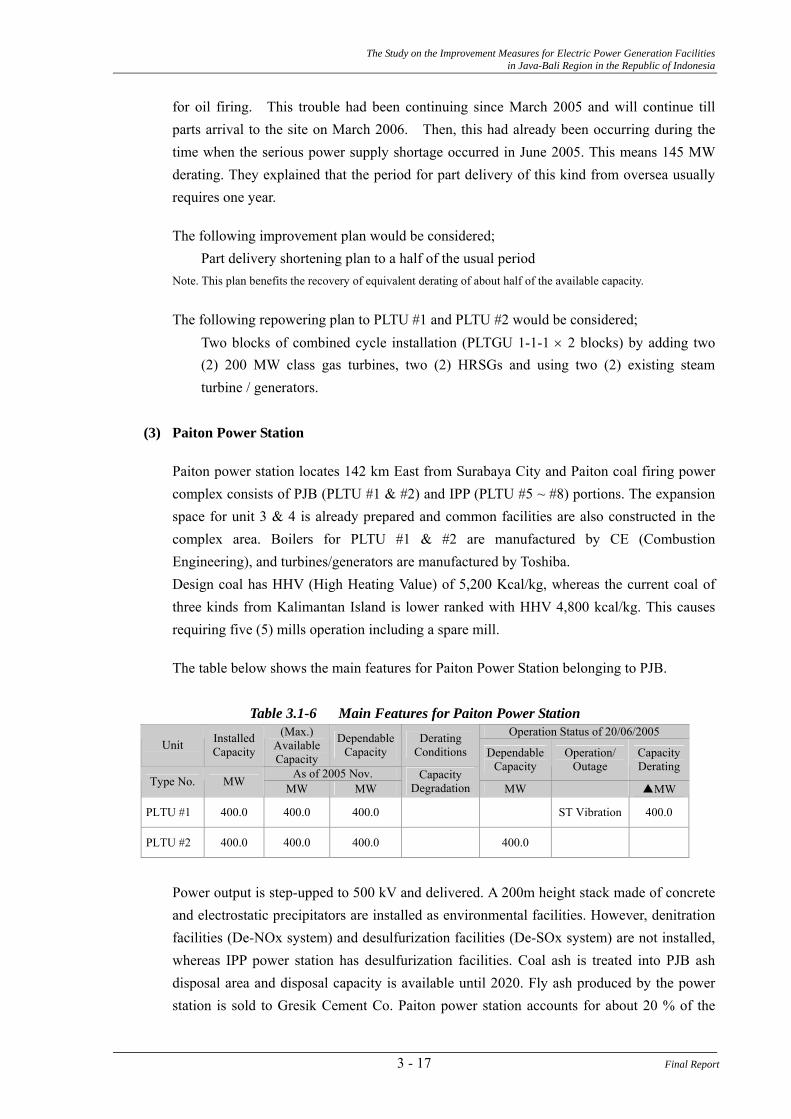
The table below shows the main features for Paiton Power Station belonging to PJB.
Table 3.1-6 Main Features for Paiton Power Station Operation Status of 20/06/2005
Unit Installed Capacity
(Max.) Available Capacity
Dependable Capacity
Derating Conditions
As of 2005 Nov.
Dependable Capacity
Operation/ Outage
Capacity Derating
Type No. MW MW MW Capacity
Degradation MW ▲MW
PLTU #1 400.0 400.0 400.0 ST Vibration 400.0
PLTU #2 400.0 400.0 400.0 400.0
Power output is step-upped to 500 kV and delivered. A 200m height stack made of concrete and electrostatic precipitators are installed as environmental facilities. However, denitration facilities (De-NOx system) and desulfurization facilities (De-SOx system) are not installed, whereas IPP power station has desulfurization facilities. Coal ash is treated into PJB ash disposal area and disposal capacity is available until 2020. Fly ash produced by the power station is sold to Gresik Cement Co. Paiton power station accounts for about 20 % of the
3 - 17 Final Report
The Study on the Improvement Measures for Electric Power Generation Facilities in Java-Bali Region in the Republic of Indonesia
total generation of PJB power stations. HSD is used for warm up operation up to 25 % load, although the main fuel is coal.
Firing current lower ranked coal having HHV of 4,800 kcal/kg, which means more moisture in it than design coal, requires all five (5) mills (pulverizers) including one (1) spare and has to force less operability or less marginal operation of these PLTUs.
Both PLTU #1 and #2 are suffering very heavy efficiency deterioration or heat rate derating which is considered to be caused by turbine blade erosion. Especially, PLTU #1 have available capacity of 390 MW, which means well about 10% less capacity from marginal boiler MCR (maximum continuous rating) and/or turbine guaranteed flow. PLTU #2 has available capacity of 400 MW, however, it has almost no marginal capability. But, now both dependable capacities have gotten back to 400 MW as described in the table above. PLTU #1 had been stopped for vibration adjustment maintenance on 20/06/2005 since February 2005. However, both units of PLTU #1 and PLTU #2 were being operated without any turbine vibration trouble.
PLTU #1 & #2 have had experienced nine (9) times RH tube leakage troubles for last three (3) years. They explained these tube leakage troubles occurred on the same location of final RH (reheater) tube panels and four(4) panels of each final RH tube would be replaced to higher temperature material of T21 (9% Cr Steel). These troubles have occurred after starting firing low rank coal which was considered to affect coal firing conditions.
The following rehabilitation/modification plans of PLTU #1 & #2 would be considered; 1) Mill capacity uprating plan, including primary air temperature increasing plan 2) Turbine higher efficient blade replacement plan 3) Higher quality re-tubing plan of final RH tube panels (four (4) panels)
Note: Items of 1) & 2) are already included in PLN’s upgrading modification plan scheduled to commit to JBIC Export Credit.
(4) Perak Power Station
Perak power station belongs to Perak-Grati Generating Business Unit, which has the total capacity of 864 MW, although the location of Perak power station is different from Grati power station. The main features for Perak power station are shown in the following table . Units 1 & 2 have been retired since 1996 due to the economic reason. Boilers and turbines for PLTU #3 & #4 are manufactured by Mitsubishi Heavy Industry (MHI).
Main fuel is MFO (Marine Fuel Oil) and transported by a pipe line from Pertamina oil tanks, which locate 1 km from the power station. Any troubles relating to fuel supply have not happened.
Final Report 3 - 18
The Study on the Improvement Measures for Electric Power Generation Facilities in Java-Bali Region in the Republic of Indonesia
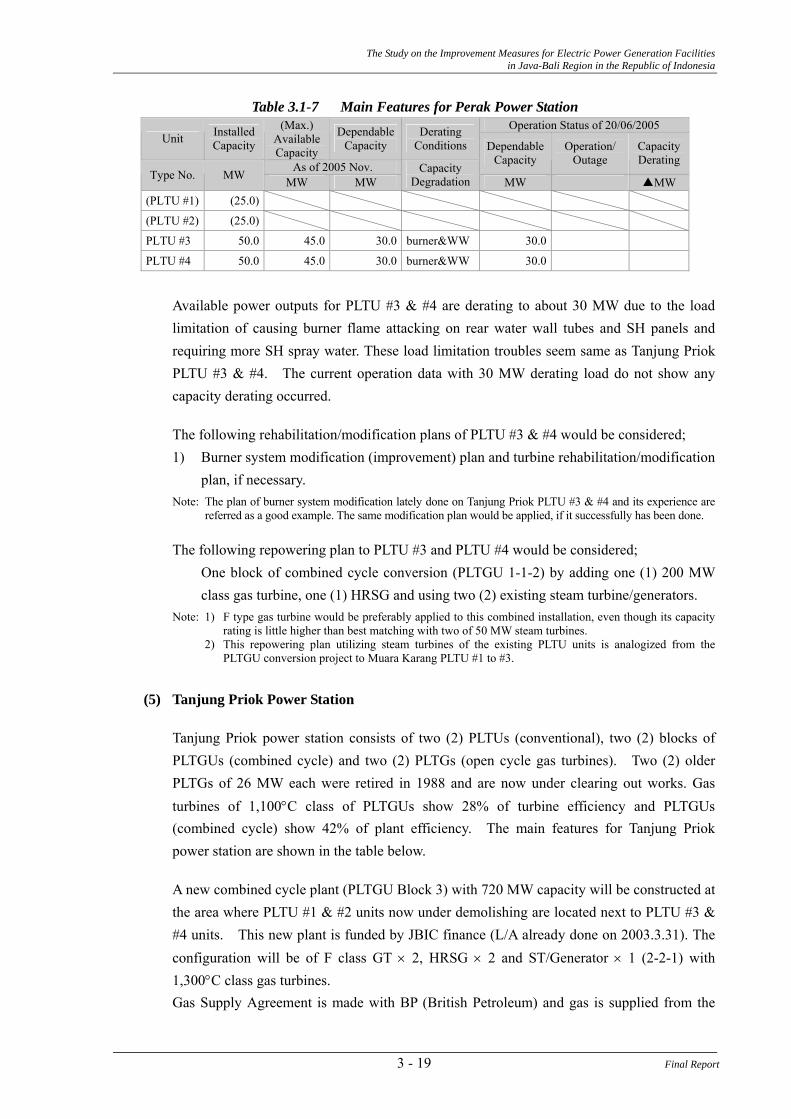
Table 3.1-7 Main Features for Perak Power Station Operation Status of 20/06/2005
Unit Installed Capacity
(Max.) Available Capacity
Dependable Capacity
Derating Conditions
As of 2005 Nov.
Dependable Capacity
Operation/ Outage
Capacity Derating
Type No. MW MW MW Capacity
Degradation MW ▲MW
(PLTU #1) (25.0)
(PLTU #2) (25.0)
PLTU #3 50.0 45.0 30.0 burner&WW 30.0
PLTU #4 50.0 45.0 30.0 burner&WW 30.0
Available power outputs for PLTU #3 & #4 are derating to about 30 MW due to the load limitation of causing burner flame attacking on rear water wall tubes and SH panels and requiring more SH spray water. These load limitation troubles seem same as Tanjung Priok PLTU #3 & #4. The current operation data with 30 MW derating load do not show any capacity derating occurred.
The following rehabilitation/modification plans of PLTU #3 & #4 would be considered; 1) Burner system modification (improvement) plan and turbine rehabilitation/modification
plan, if necessary. Note: The plan of burner system modification lately done on Tanjung Priok PLTU #3 & #4 and its experience are
referred as a good example. The same modification plan would be applied, if it successfully has been done.
The following repowering plan to PLTU #3 and PLTU #4 would be considered; One block of combined cycle conversion (PLTGU 1-1-2) by adding one (1) 200 MW class gas turbine, one (1) HRSG and using two (2) existing steam turbine/generators.
Note: 1) F type gas turbine would be preferably applied to this combined installation, even though its capacity rating is little higher than best matching with two of 50 MW steam turbines.
2) This repowering plan utilizing steam turbines of the existing PLTU units is analogized from the PLTGU conversion project to Muara Karang PLTU #1 to #3.
(5) Tanjung Priok Power Station
Tanjung Priok power station consists of two (2) PLTUs (conventional), two (2) blocks of PLTGUs (combined cycle) and two (2) PLTGs (open cycle gas turbines). Two (2) older PLTGs of 26 MW each were retired in 1988 and are now under clearing out works. Gas turbines of 1,100°C class of PLTGUs show 28% of turbine efficiency and PLTGUs (combined cycle) show 42% of plant efficiency. The main features for Tanjung Priok power station are shown in the table below.
A new combined cycle plant (PLTGU Block 3) with 720 MW capacity will be constructed at the area where PLTU #1 & #2 units now under demolishing are located next to PLTU #3 & #4 units. This new plant is funded by JBIC finance (L/A already done on 2003.3.31). The configuration will be of F class GT × 2, HRSG × 2 and ST/Generator × 1 (2-2-1) with 1,300°C class gas turbines. Gas Supply Agreement is made with BP (British Petroleum) and gas is supplied from the
3 - 19 Final Report
The Study on the Improvement Measures for Electric Power Generation Facilities in Java-Bali Region in the Republic of Indonesia
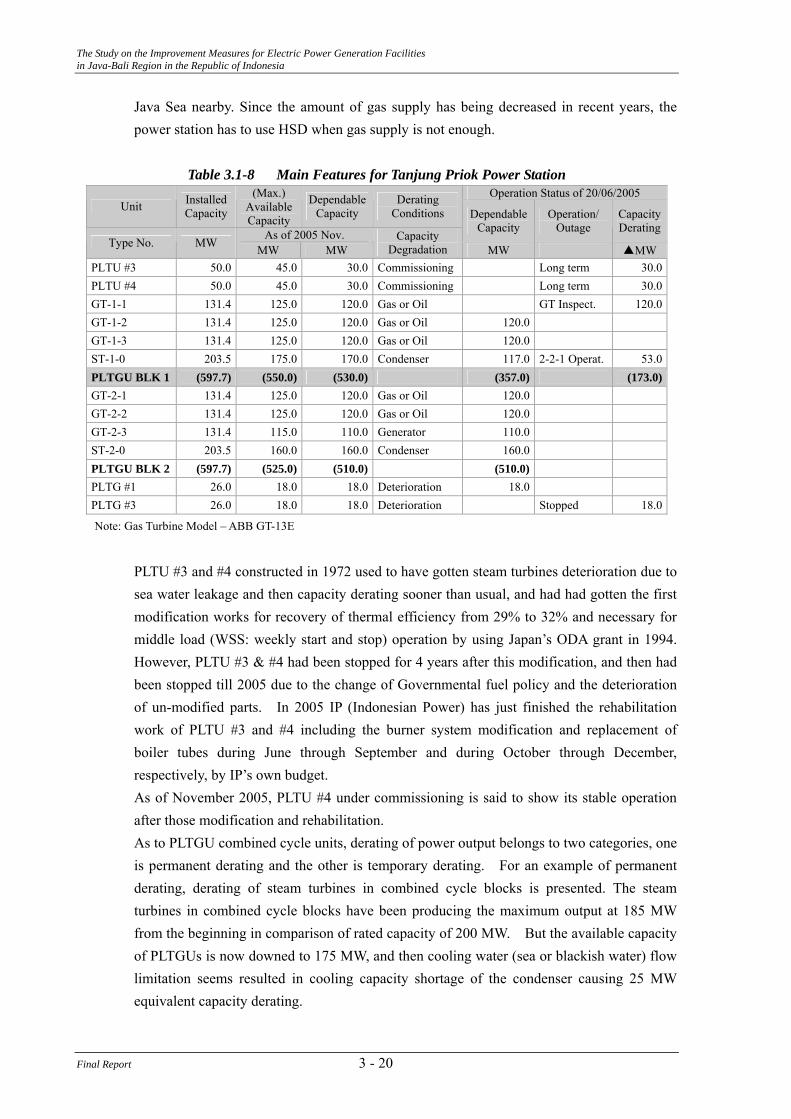
Java Sea nearby. Since the amount of gas supply has being decreased in recent years, the power station has to use HSD when gas supply is not enough.
Table 3.1-8 Main Features for Tanjung Priok Power Station
Operation Status of 20/06/2005 Unit Installed
Capacity
(Max.) Available Capacity
Dependable Capacity
Derating Conditions
As of 2005 Nov.
Dependable Capacity
Operation/ Outage
Capacity Derating
Type No. MW MW MW Capacity
Degradation MW ▲MWPLTU #3 50.0 45.0 30.0 Commissioning Long term 30.0 PLTU #4 50.0 45.0 30.0 Commissioning Long term 30.0 GT-1-1 131.4 125.0 120.0 Gas or Oil GT Inspect. 120.0 GT-1-2 131.4 125.0 120.0 Gas or Oil 120.0 GT-1-3 131.4 125.0 120.0 Gas or Oil 120.0 ST-1-0 203.5 175.0 170.0 Condenser 117.0 2-2-1 Operat. 53.0 PLTGU BLK 1 (597.7) (550.0) (530.0) (357.0) (173.0)GT-2-1 131.4 125.0 120.0 Gas or Oil 120.0 GT-2-2 131.4 125.0 120.0 Gas or Oil 120.0 GT-2-3 131.4 115.0 110.0 Generator 110.0 ST-2-0 203.5 160.0 160.0 Condenser 160.0 PLTGU BLK 2 (597.7) (525.0) (510.0) (510.0) PLTG #1 26.0 18.0 18.0 Deterioration 18.0 PLTG #3 26.0 18.0 18.0 Deterioration Stopped 18.0
Note: Gas Turbine Model – ABB GT-13E
PLTU #3 and #4 constructed in 1972 used to have gotten steam turbines deterioration due to sea water leakage and then capacity derating sooner than usual, and had had gotten the first modification works for recovery of thermal efficiency from 29% to 32% and necessary for middle load (WSS: weekly start and stop) operation by using Japan’s ODA grant in 1994. However, PLTU #3 & #4 had been stopped for 4 years after this modification, and then had been stopped till 2005 due to the change of Governmental fuel policy and the deterioration of un-modified parts. In 2005 IP (Indonesian Power) has just finished the rehabilitation work of PLTU #3 and #4 including the burner system modification and replacement of boiler tubes during June through September and during October through December, respectively, by IP’s own budget. As of November 2005, PLTU #4 under commissioning is said to show its stable operation after those modification and rehabilitation. As to PLTGU combined cycle units, derating of power output belongs to two categories, one is permanent derating and the other is temporary derating. For an example of permanent derating, derating of steam turbines in combined cycle blocks is presented. The steam turbines in combined cycle blocks have been producing the maximum output at 185 MW from the beginning in comparison of rated capacity of 200 MW. But the available capacity of PLTGUs is now downed to 175 MW, and then cooling water (sea or blackish water) flow limitation seems resulted in cooling capacity shortage of the condenser causing 25 MW equivalent capacity derating.
Final Report 3 - 20
The Study on the Improvement Measures for Electric Power Generation Facilities in Java-Bali Region in the Republic of Indonesia
For an example of temporary derating, derating of gas turbines (5 MW derating each) with HSD fuel in combined cycle blocks is presented. And the depressing power output (10 MW) due to the trouble of generator GT-2-3 for PLTGU block 2 is also one of the temporary deratings. The generator GT-2-3 had to be depressed its output by 10 MW because of the initial defect in generator winding. The countermeasures on this defect of GT-2-3 had been worked and now its available capacity recovers up to 115 MW. Gas turbines output is restored by the timely vane cleanings although gas turbines generally trends to decrease their output due to the sticking dirt in an air compressor.
The following rehabilitation plan would be considered: Block 1&2 ST-1-0 & ST-2-0 Condenser and cooling system rehabilitation
Note: This plan requires detailed study and analysis of the cooling water flow limitation factors. The remedy rehabilitation plan would gain the capacity recovery of 25 MW × 2.
The following repowering plan would be considered: One block of combined cycle conversion (PLTGU 1-1-2) by adding one (1) 200 MW class gas turbine, one (1) HRSG and using two (2) existing steam turbine/generators (ST-1-0 & ST-2-0).
Note: 1) F type gas turbine would be preferably applied to this combined installation, even though its capacity rating is little higher than best matching with two of 50 MW steam turbines.
2) This repowering plan utilizing existing steam turbines (ST-1-0 & ST-2-0)of the existing PLTU is almost same as proposed to Perak power station.
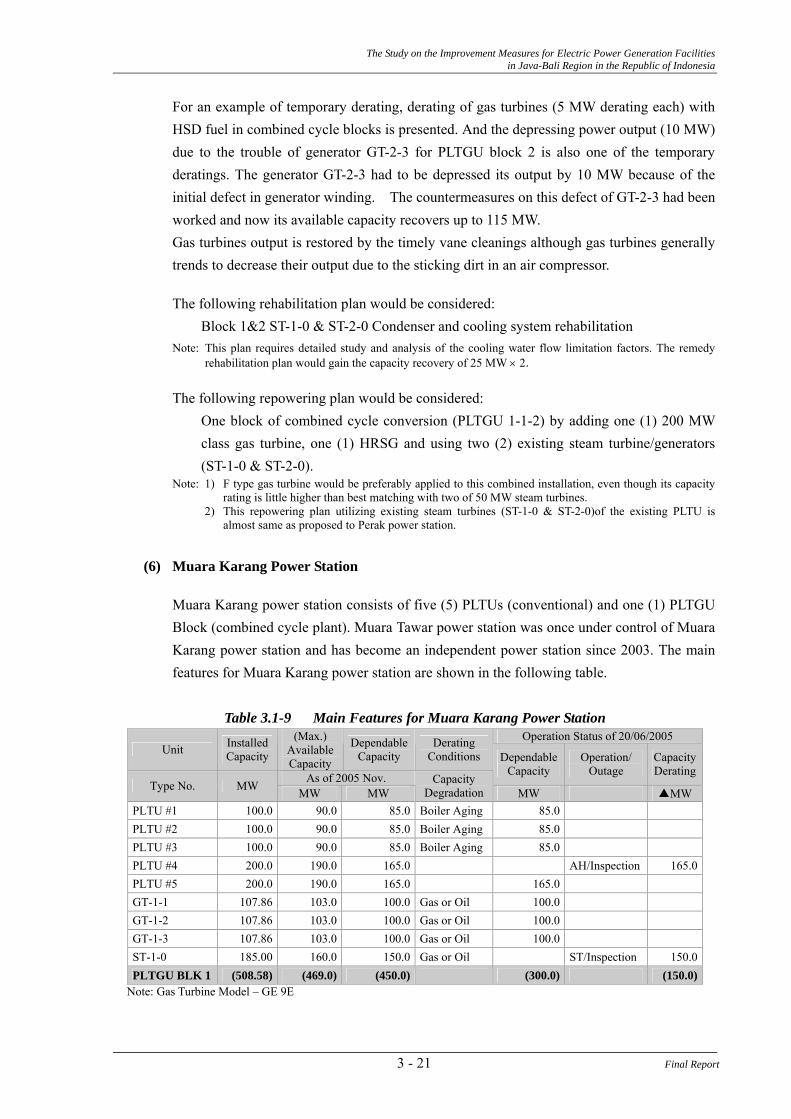
(6) Muara Karang Power Station
Muara Karang power station consists of five (5) PLTUs (conventional) and one (1) PLTGU Block (combined cycle plant). Muara Tawar power station was once under control of Muara Karang power station and has become an independent power station since 2003. The main features for Muara Karang power station are shown in the following table.
Table 3.1-9 Main Features for Muara Karang Power Station
Operation Status of 20/06/2005 Unit Installed
Capacity
(Max.) Available Capacity
Dependable Capacity
Derating Conditions
As of 2005 Nov.
Dependable Capacity
Operation/ Outage
Capacity Derating
Type No. MW MW MW Capacity
Degradation MW ▲MWPLTU #1 100.0 90.0 85.0 Boiler Aging 85.0 PLTU #2 100.0 90.0 85.0 Boiler Aging 85.0 PLTU #3 100.0 90.0 85.0 Boiler Aging 85.0 PLTU #4 200.0 190.0 165.0 AH/Inspection 165.0 PLTU #5 200.0 190.0 165.0 165.0 GT-1-1 107.86 103.0 100.0 Gas or Oil 100.0 GT-1-2 107.86 103.0 100.0 Gas or Oil 100.0 GT-1-3 107.86 103.0 100.0 Gas or Oil 100.0 ST-1-0 185.00 160.0 150.0 Gas or Oil ST/Inspection 150.0 PLTGU BLK 1 (508.58) (469.0) (450.0) (300.0) (150.0)
Note: Gas Turbine Model – GE 9E
3 - 21 Final Report
The Study on the Improvement Measures for Electric Power Generation Facilities in Java-Bali Region in the Republic of Indonesia
Three (3) steam turbines of PLTU #1, #2 and #3 units have been decided to be utilized for a new combined cycle plant accompanied with two (2) additional gas turbines of 250 MW class and two (2) HRSGs by JBIC finance (L/A already done on 2003.7.22). The operation of the two (2) gas turbines will start in 2007 firstly in open cycle mode and then the current PLTU units 1 to 3 will stop the operation for the demolishing of boilers and then the modification work of existing three (3) steam turbines into the combined cycle block (2-2-3 type) will follow.
At this moment the available power output of the current units #1 to #3 is derating to 90 MW in comparison with the rated capacity of 100 MW each. 10 MW each derating of PLTU #1 to #3 seem caused mostly by the aging of their boilers, so any countermeasures against the derating seem to be not necessary because their output will be reinforced by the above repowering plan.
The rehabilitation work of gas firing (gas/oil dual firing) and others including boiler tube replacement, AH element replacement, etc. had been done to PLTU #4 and #5 lately. Moreover, a new major rehabilitation work has been decided to commit to JBIC export credit. This rehabilitation includes steam turbine re-blading, condenser and pumps, exciter and transformers, boiler re-tubing.
When the Study Team visited PJB head office, they requested us that the cooling water pumps of Muara Karang PLTU #4 and #5 shall be modified to extend the main shaft by one (1) meter in order to avoid submerging against sea level increasing in the pump house. This was confirmed when the Study Team visited the plant tour at Muara Karang power station thereafter. PLTU #5 was under annual inspection. Even with two (2) CWP under repair PLTU #4 was operating by using the common CWP for two units.
PLTGU Block 1 was designed for dual firing (gas/HSD) and the installed capacity of steam turbine ST-1-0 has big number of 185 MW derived from peak load operation of gas turbine. Now its available capacity is around 160 MW due to the decrease of heat absorption of HRSGs and related deterioration. Gas Supply Agreement is made with BP (British Petroleum) and gas is supplied from the Java Sea nearby. Gas supply has been done well and the power station seldom uses HSD instead of gas.
On the day of 20/06/05 when the serious power supply shortage occurred, PLTU #4 was stopped for the air heater inspection, and ST -1-0 of PLTGU Block was under inspection and then PLTGU was being operated as 3-3-0 simple cycle operation mode. No new rehabilitation/modification plan and repowering plan would be considered.
Final Report 3 - 22
The Study on the Improvement Measures for Electric Power Generation Facilities in Java-Bali Region in the Republic of Indonesia
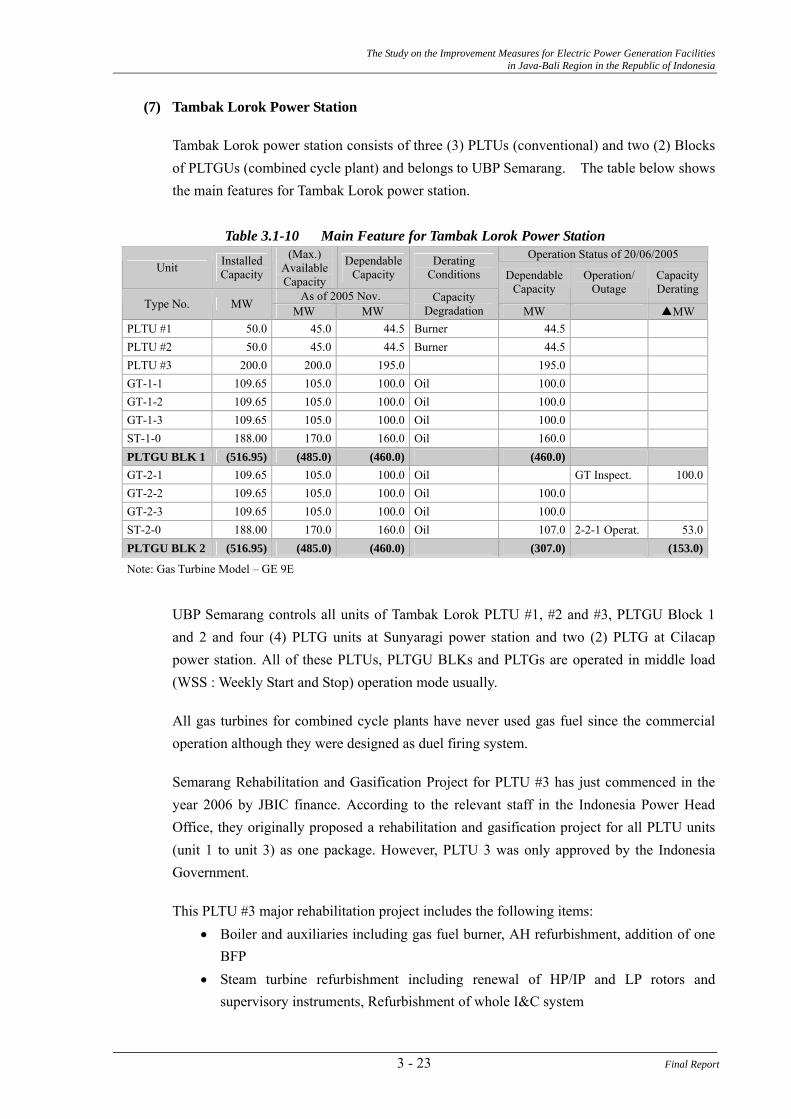
(7) Tambak Lorok Power Station
Tambak Lorok power station consists of three (3) PLTUs (conventional) and two (2) Blocks of PLTGUs (combined cycle plant) and belongs to UBP Semarang. The table below shows the main features for Tambak Lorok power station.
Table 3.1-10 Main Feature for Tambak Lorok Power Station
Operation Status of 20/06/2005 Unit Installed
Capacity
(Max.) Available Capacity
Dependable Capacity
Derating Conditions
As of 2005 Nov.
Dependable Capacity
Operation/ Outage
Capacity Derating
Type No. MW MW MW Capacity
Degradation MW ▲MW
PLTU #1 50.0 45.0 44.5 Burner 44.5 PLTU #2 50.0 45.0 44.5 Burner 44.5 PLTU #3 200.0 200.0 195.0 195.0 GT-1-1 109.65 105.0 100.0 Oil 100.0 GT-1-2 109.65 105.0 100.0 Oil 100.0 GT-1-3 109.65 105.0 100.0 Oil 100.0 ST-1-0 188.00 170.0 160.0 Oil 160.0 PLTGU BLK 1 (516.95) (485.0) (460.0) (460.0) GT-2-1 109.65 105.0 100.0 Oil GT Inspect. 100.0 GT-2-2 109.65 105.0 100.0 Oil 100.0 GT-2-3 109.65 105.0 100.0 Oil 100.0 ST-2-0 188.00 170.0 160.0 Oil 107.0 2-2-1 Operat. 53.0 PLTGU BLK 2 (516.95) (485.0) (460.0) (307.0) (153.0)
Note: Gas Turbine Model – GE 9E
UBP Semarang controls all units of Tambak Lorok PLTU #1, #2 and #3, PLTGU Block 1 and 2 and four (4) PLTG units at Sunyaragi power station and two (2) PLTG at Cilacap power station. All of these PLTUs, PLTGU BLKs and PLTGs are operated in middle load (WSS : Weekly Start and Stop) operation mode usually.
All gas turbines for combined cycle plants have never used gas fuel since the commercial operation although they were designed as duel firing system.
Semarang Rehabilitation and Gasification Project for PLTU #3 has just commenced in the year 2006 by JBIC finance. According to the relevant staff in the Indonesia Power Head Office, they originally proposed a rehabilitation and gasification project for all PLTU units (unit 1 to unit 3) as one package. However, PLTU 3 was only approved by the Indonesia Government.
This PLTU #3 major rehabilitation project includes the following items: • Boiler and auxiliaries including gas fuel burner, AH refurbishment, addition of one
BFP • Steam turbine refurbishment including renewal of HP/IP and LP rotors and
supervisory instruments, Refurbishment of whole I&C system
3 - 23 Final Report
The Study on the Improvement Measures for Electric Power Generation Facilities in Java-Bali Region in the Republic of Indonesia
• Generator and auxiliaries including rehabilitation and renewal of seal oil unit, etc.
As to SH/RH re-tubing of PLTU #3, they already made the replacement of relevant SH/RH tubes during the last inspection period of 2005. The total available capacity of PLTU #1 and #2 is around 90 MW with 10 MW derating in comparison with 100 MW rating (installed) capacity due to flame impingement on SH since 1984. The performance test report says quite big heat rate deterioration has occurred on these PLTU #1 and #2. Then PLTU #1 and #2 units seem substantially suffered by performance derating equivalent to 15 to 20 MW capacity derating.
Without any gas firing at Tambak Lorok power station, HRSGs of PLTGU Block 1 and 2 get some contamination (soot dust) on their heating bank tubes and then cause less heat absorption, and their stack gas temperature gets higher. This results in steam turbine (ST-1-0, ST-2-0) derating.
The following rehabilitation plan of PLTU #1 & #2 would be considered • Boiler and auxiliaries refurbishment including gas fuel burner system • Steam turbine refurbishment including renewal of HP/IP and LP rotors • Generator and auxiliaries including rehabilitation and renewal of seal oil unit, etc.
Note: The whole rehabilitation plan is almost same as the one to PLTU #3.
The following repowering plan of PLTU #1 & #2 would be considered: One block of combined cycle conversion (PLTGU 1-1-2) by adding one (1) 200 MW class gas turbine, one (1) HRSG and using two (2) existing steam turbine/generators.
Note: 1) F type gas turbine would be preferably applied to this combined installation, even though its capacity rating is little higher than best matching with two of 50 MW steam turbines.
2) This repowering plan utilizing steam turbines (ST-1-0 & ST-2-0) of the existing PLTUs is almost same as proposed to Perak power station.
(8) Grati Power Station
Grati power station consists of PLTGU combined cycle and PLTG open cycle gas turbine plants. Perak - Grati Generating Business Unit Office is in the site of Grati Power Station. The following table shows the main features for Grati power station.
Gas turbines were with three (3) rating capacities, base load gas firing 112.45 MW and peak load gas firing 118.592 MW and base and peak load oil firing 100.75 MW. Whereas, the steam turbine ST-1-0 was designed with a rating of 198.873 MW and its available capacity for oil firing is 159.58 MW. Then, PLTGU Block 1 has the oil firing rating of 462 MW and PLTG Block 2 has total 306 MW rating capacity.
2 Please refer to Table 3.1-3 Capacity Derating Summaries on PLTGUs/PLTGs 3 198.87 MW is a rating capacity corresponding to 118.59 MW.
Final Report 3 - 24
The Study on the Improvement Measures for Electric Power Generation Facilities in Java-Bali Region in the Republic of Indonesia
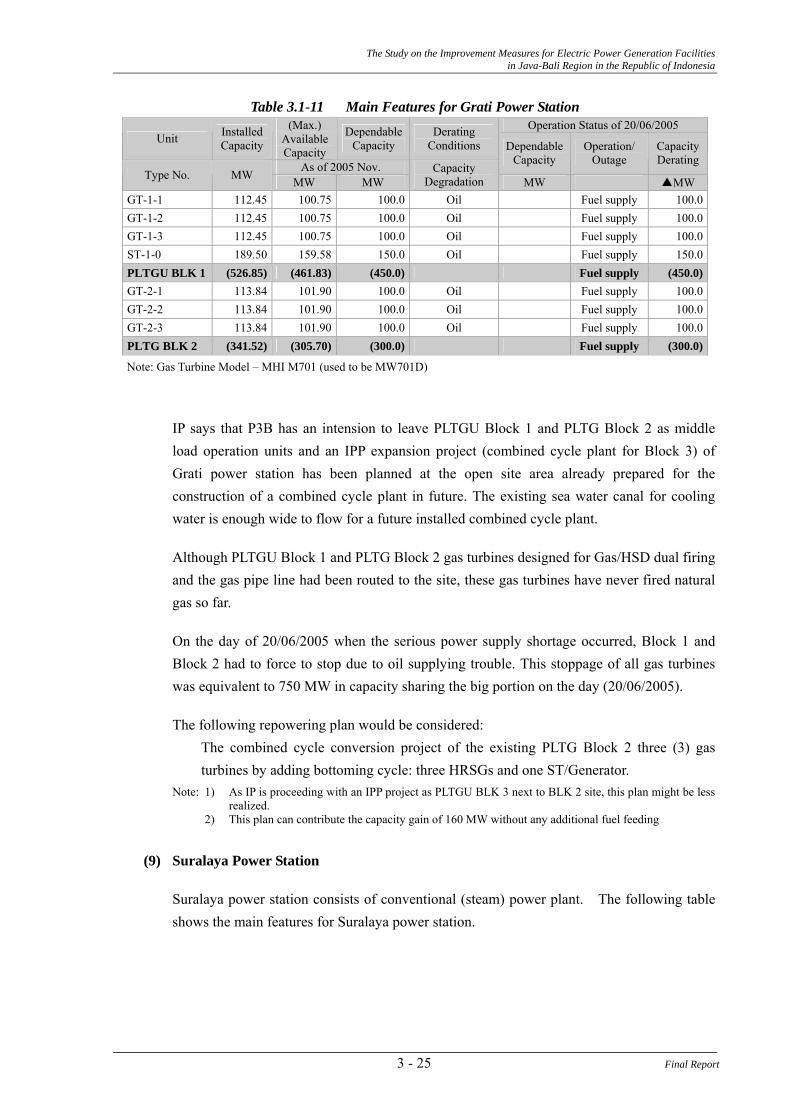
Table 3.1-11 Main Features for Grati Power Station Operation Status of 20/06/2005
Unit Installed Capacity
(Max.) Available Capacity
Dependable Capacity
Derating Conditions
As of 2005 Nov.
Dependable Capacity
Operation/ Outage
Capacity Derating
Type No. MW MW MW Capacity
Degradation MW ▲MW
GT-1-1 112.45 100.75 100.0 Oil Fuel supply 100.0 GT-1-2 112.45 100.75 100.0 Oil Fuel supply 100.0 GT-1-3 112.45 100.75 100.0 Oil Fuel supply 100.0 ST-1-0 189.50 159.58 150.0 Oil Fuel supply 150.0 PLTGU BLK 1 (526.85) (461.83) (450.0) Fuel supply (450.0)GT-2-1 113.84 101.90 100.0 Oil Fuel supply 100.0 GT-2-2 113.84 101.90 100.0 Oil Fuel supply 100.0 GT-2-3 113.84 101.90 100.0 Oil Fuel supply 100.0 PLTG BLK 2 (341.52) (305.70) (300.0) Fuel supply (300.0)
Note: Gas Turbine Model – MHI M701 (used to be MW701D)
IP says that P3B has an intension to leave PLTGU Block 1 and PLTG Block 2 as middle load operation units and an IPP expansion project (combined cycle plant for Block 3) of Grati power station has been planned at the open site area already prepared for the construction of a combined cycle plant in future. The existing sea water canal for cooling water is enough wide to flow for a future installed combined cycle plant.
Although PLTGU Block 1 and PLTG Block 2 gas turbines designed for Gas/HSD dual firing and the gas pipe line had been routed to the site, these gas turbines have never fired natural gas so far.
On the day of 20/06/2005 when the serious power supply shortage occurred, Block 1 and Block 2 had to force to stop due to oil supplying trouble. This stoppage of all gas turbines was equivalent to 750 MW in capacity sharing the big portion on the day (20/06/2005).
The following repowering plan would be considered: The combined cycle conversion project of the existing PLTG Block 2 three (3) gas turbines by adding bottoming cycle: three HRSGs and one ST/Generator.
Note: 1) As IP is proceeding with an IPP project as PLTGU BLK 3 next to BLK 2 site, this plan might be less realized.
2) This plan can contribute the capacity gain of 160 MW without any additional fuel feeding
(9) Suralaya Power Station
Suralaya power station consists of conventional (steam) power plant. The following table shows the main features for Suralaya power station.
3 - 25 Final Report
The Study on the Improvement Measures for Electric Power Generation Facilities in Java-Bali Region in the Republic of Indonesia
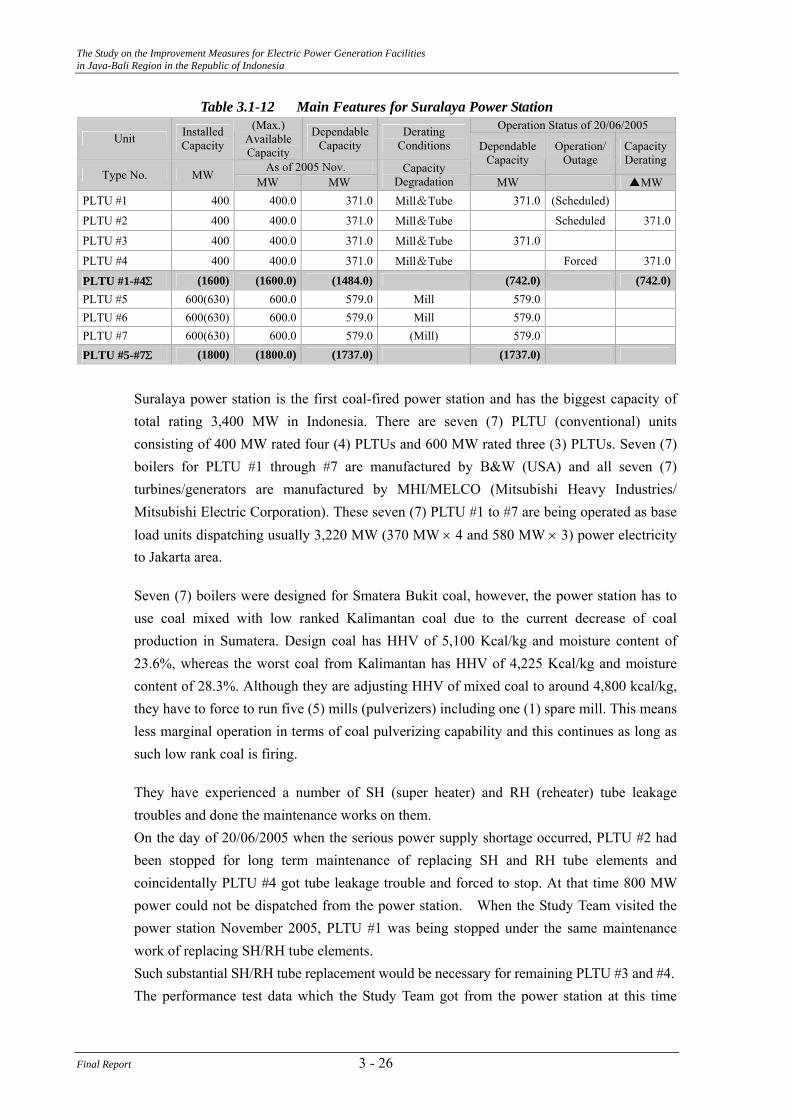
Table 3.1-12 Main Features for Suralaya Power Station Operation Status of 20/06/2005
Unit Installed Capacity
(Max.) Available Capacity
Dependable Capacity
Derating Conditions
As of 2005 Nov.
Dependable Capacity
Operation/ Outage
Capacity Derating
Type No. MW MW MW Capacity
Degradation MW ▲MW
PLTU #1 400 400.0 371.0 Mill&Tube 371.0 (Scheduled)
PLTU #2 400 400.0 371.0 Mill&Tube Scheduled 371.0
PLTU #3 400 400.0 371.0 Mill&Tube 371.0
PLTU #4 400 400.0 371.0 Mill&Tube Forced 371.0
PLTU #1-#4Σ (1600) (1600.0) (1484.0) (742.0) (742.0)PLTU #5 600(630) 600.0 579.0 Mill 579.0 PLTU #6 600(630) 600.0 579.0 Mill 579.0 PLTU #7 600(630) 600.0 579.0 (Mill) 579.0 PLTU #5-#7Σ (1800) (1800.0) (1737.0) (1737.0)
Suralaya power station is the first coal-fired power station and has the biggest capacity of total rating 3,400 MW in Indonesia. There are seven (7) PLTU (conventional) units consisting of 400 MW rated four (4) PLTUs and 600 MW rated three (3) PLTUs. Seven (7) boilers for PLTU #1 through #7 are manufactured by B&W (USA) and all seven (7) turbines/generators are manufactured by MHI/MELCO (Mitsubishi Heavy Industries/ Mitsubishi Electric Corporation). These seven (7) PLTU #1 to #7 are being operated as base load units dispatching usually 3,220 MW (370 MW × 4 and 580 MW × 3) power electricity to Jakarta area.
Seven (7) boilers were designed for Smatera Bukit coal, however, the power station has to use coal mixed with low ranked Kalimantan coal due to the current decrease of coal production in Sumatera. Design coal has HHV of 5,100 Kcal/kg and moisture content of 23.6%, whereas the worst coal from Kalimantan has HHV of 4,225 Kcal/kg and moisture content of 28.3%. Although they are adjusting HHV of mixed coal to around 4,800 kcal/kg, they have to force to run five (5) mills (pulverizers) including one (1) spare mill. This means less marginal operation in terms of coal pulverizing capability and this continues as long as such low rank coal is firing.
They have experienced a number of SH (super heater) and RH (reheater) tube leakage troubles and done the maintenance works on them. On the day of 20/06/2005 when the serious power supply shortage occurred, PLTU #2 had been stopped for long term maintenance of replacing SH and RH tube elements and coincidentally PLTU #4 got tube leakage trouble and forced to stop. At that time 800 MW power could not be dispatched from the power station. When the Study Team visited the power station November 2005, PLTU #1 was being stopped under the same maintenance work of replacing SH/RH tube elements. Such substantial SH/RH tube replacement would be necessary for remaining PLTU #3 and #4. The performance test data which the Study Team got from the power station at this time
Final Report 3 - 26
The Study on the Improvement Measures for Electric Power Generation Facilities in Java-Bali Region in the Republic of Indonesia
showed small steam turbine heat rate deterioration and then its related small capacity derating. However, in case of considering uprating of 5% over load operation as the spinning reserve, it is necessary to replace turbine blades to higher efficiency.
The Study Team would like to consider the following rehabilitation/modification plans for PLTU #1 through #4 possible: 1) Mill capacity increasing modification plan, including primary air temperature
increasing measures 2) Turbine upgrading plan, including higher efficient turbine blade replacement 3) SH/RH replacement rehabilitation plan, especially for PLTU #3 and #4
All above rehabilitation/modification items are included in the plan already committed by PLN to JBIC export credit. Then, JICA Study Team has no more proposal to Suralaya #1 through #4 at this time.
(10) Pesanggaran Power Station
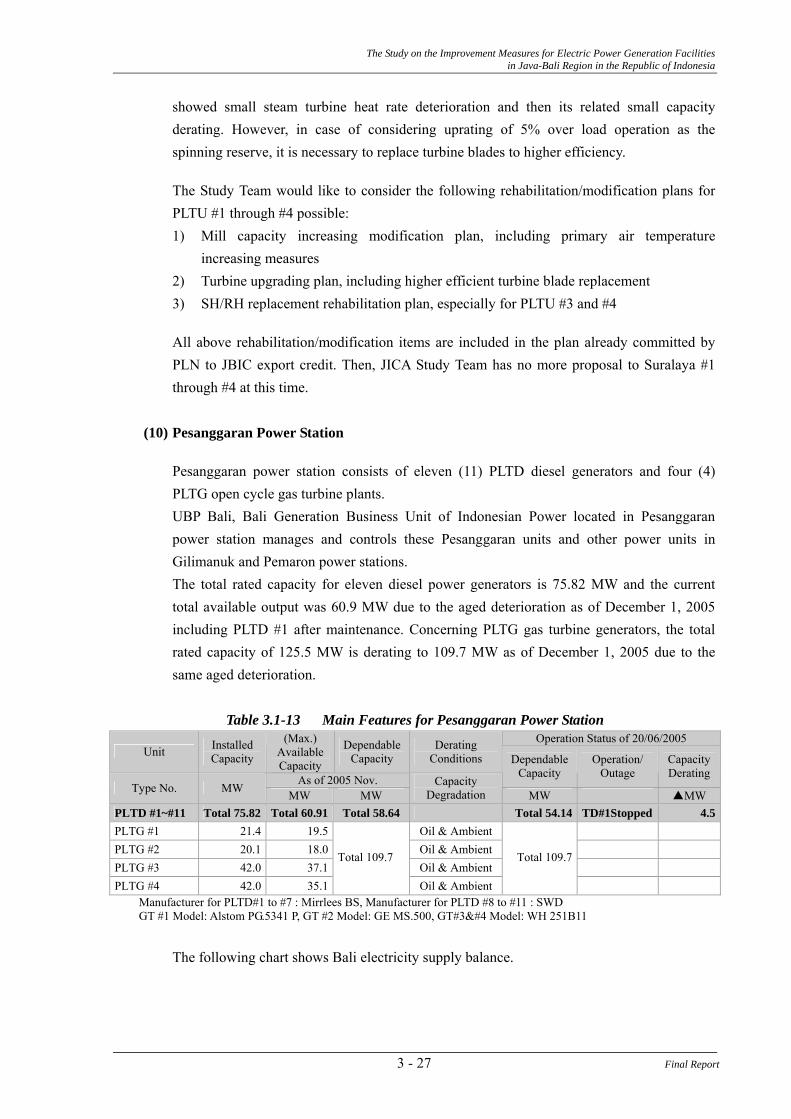
Pesanggaran power station consists of eleven (11) PLTD diesel generators and four (4) PLTG open cycle gas turbine plants. UBP Bali, Bali Generation Business Unit of Indonesian Power located in Pesanggaran power station manages and controls these Pesanggaran units and other power units in Gilimanuk and Pemaron power stations. The total rated capacity for eleven diesel power generators is 75.82 MW and the current total available output was 60.9 MW due to the aged deterioration as of December 1, 2005 including PLTD #1 after maintenance. Concerning PLTG gas turbine generators, the total rated capacity of 125.5 MW is derating to 109.7 MW as of December 1, 2005 due to the same aged deterioration.
Table 3.1-13 Main Features for Pesanggaran Power Station
Operation Status of 20/06/2005 Unit Installed
Capacity
(Max.) Available Capacity
Dependable Capacity
Derating Conditions
As of 2005 Nov.
Dependable Capacity
Operation/ Outage
Capacity Derating
Type No. MW MW MW Capacity
Degradation MW ▲MW
PLTD #1~#11 Total 75.82 Total 60.91 Total 58.64 Total 54.14 TD#1Stopped 4.5 PLTG #1 21.4 19.5 Oil & Ambient PLTG #2 20.1 18.0 Oil & Ambient PLTG #3 42.0 37.1 Oil & Ambient PLTG #4 42.0 35.1
Total 109.7
Oil & Ambient
Total 109.7
Manufacturer for PLTD#1 to #7 : Mirrlees BS, Manufacturer for PLTD #8 to #11 : SWD GT #1 Model: Alstom PG.5341 P, GT #2 Model: GE MS.500, GT#3 Model: WH 251B11
The following chart shows Bali electricity supply balance.
3 - 27 Final Report
The Study on the Improvement Measures for Electric Power Generation Facilities in Java-Bali Region in the Republic of Indonesia
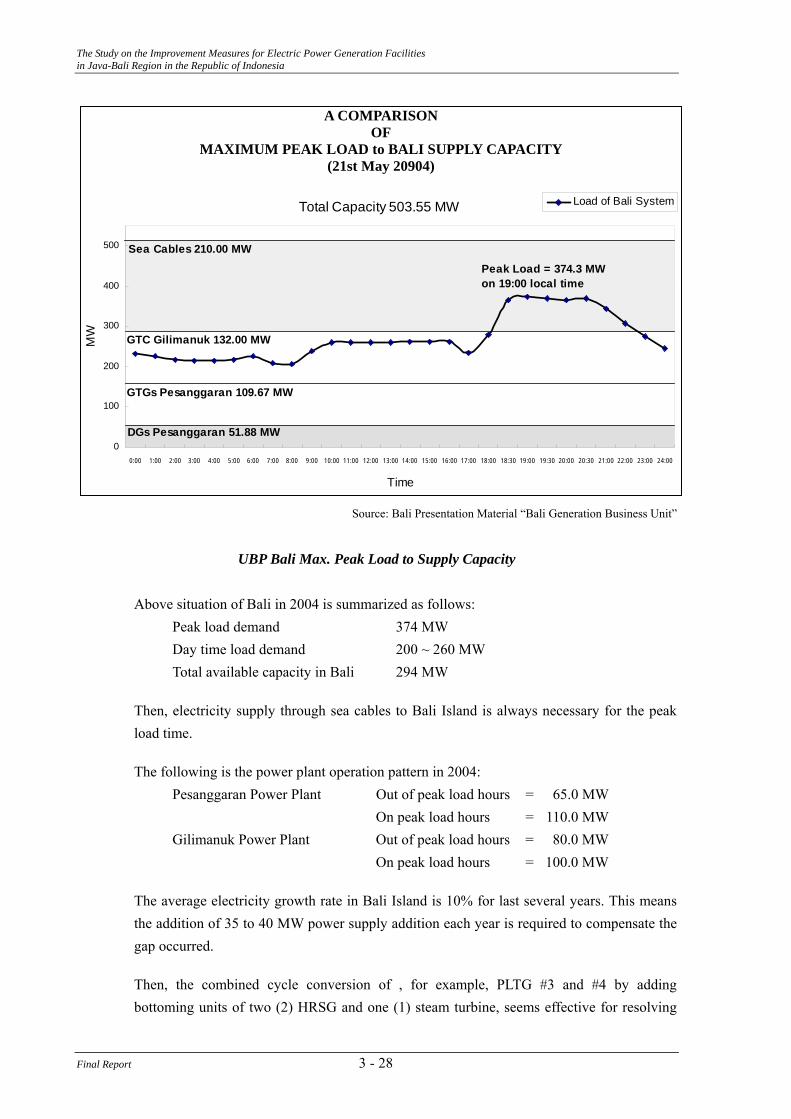
A COMPARISON OF
MAXIMUM PEAK LOAD to BALI SUPPLY CAPACITY (21st May 20904)
Source: Bali Presentation Material “Bali Generation Business Unit”
UBP Bali Max. Peak Load to Supply Capacity Above situation of Bali in 2004 is summarized as follows: Peak load demand 374 MW Day time load demand 200 ~ 260 MW Total available capacity in Bali 294 MW
Then, electricity supply through sea cables to Bali Island is always necessary for the peak load time.
The following is the power plant operation pattern in 2004: Pesanggaran Power Plant Out of peak load hours = 65.0 MW On peak load hours = 110.0 MW Gilimanuk Power Plant Out of peak load hours = 80.0 MW On peak load hours = 100.0 MW
The average electricity growth rate in Bali Island is 10% for last several years. This means the addition of 35 to 40 MW power supply addition each year is required to compensate the gap occurred.
Then, the combined cycle conversion of , for example, PLTG #3 and #4 by adding bottoming units of two (2) HRSG and one (1) steam turbine, seems effective for resolving
Total Capacity 503.55 MW
0
100
200
300
400
500
0:00 1:00 2:00 3:00 4:00 5:00 6:00 7:00 8:00 9:00 10:00 11:00 12:00 00 14:00 15:00 16:00 17:00 18:00 18:30 19:00 19:30 20:00 20:30 21:00 22:00 23:00 24:00
Time
MW
Load of Bali System
DGs Pesanggaran 51.88 MW
GTGs Pesanggaran 109.67 MW
GTC Gilimanuk 132.00 MW
Sea Cables 210.00 MW
Peak Load = 374.3 MWon 19:00 local time
13:
Final Report 3 - 28
The Study on the Improvement Measures for Electric Power Generation Facilities in Java-Bali Region in the Republic of Indonesia
the electricity supply shortage in Bali Island.
The following repowering plan of PLTG #3 and #4 would be considered: Combined cycle plan (2-2-1) conversion of PLTG #3 & #4 by adding a 35 MW class bottoming plant of two (2) HRSGs and one (1) steam turbine.
(11) Gilimanuk Power Station
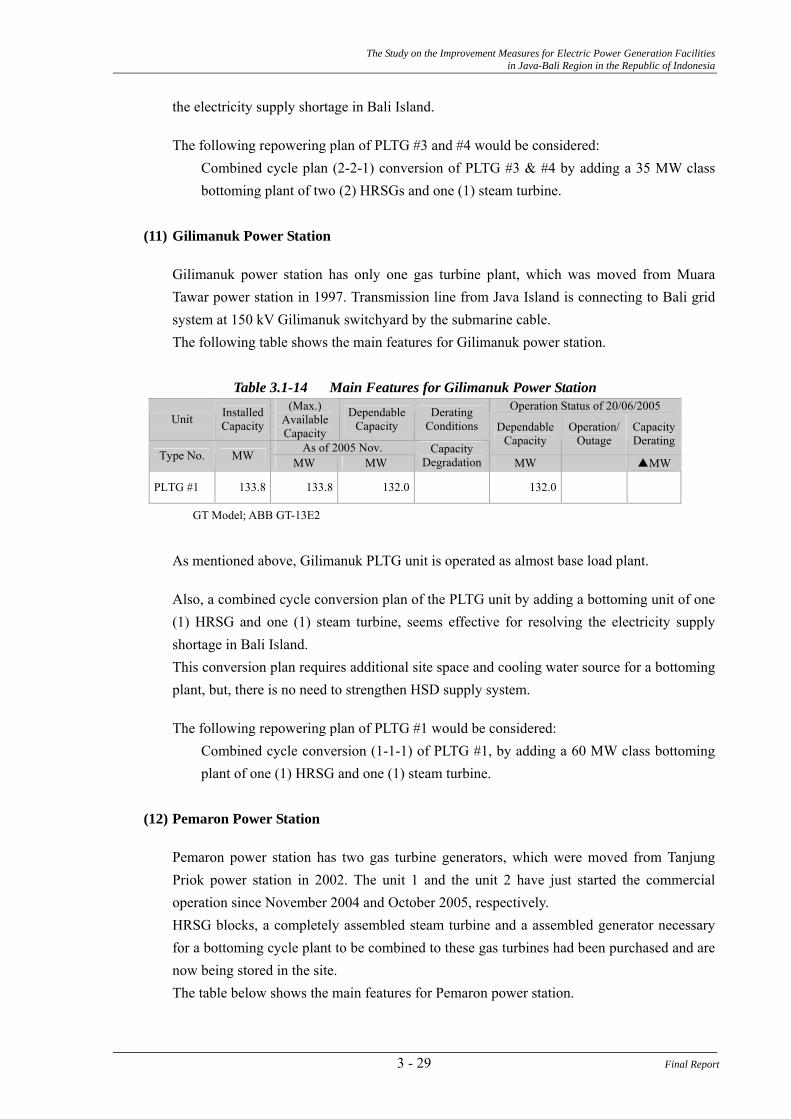
Gilimanuk power station has only one gas turbine plant, which was moved from Muara Tawar power station in 1997. Transmission line from Java Island is connecting to Bali grid system at 150 kV Gilimanuk switchyard by the submarine cable. The following table shows the main features for Gilimanuk power station.
Table 3.1-14 Main Features for Gilimanuk Power Station
Operation Status of 20/06/2005 Unit Installed
Capacity
(Max.) Available Capacity
Dependable Capacity
Derating Conditions
As of 2005 Nov.
Dependable Capacity
Operation/ Outage
Capacity Derating
Type No. MW MW MW Capacity
Degradation MW ▲MW
PLTG #1 133.8 133.8 132.0 132.0
GT Model; ABB GT-13E2
As mentioned above, Gilimanuk PLTG unit is operated as almost base load plant.
Also, a combined cycle conversion plan of the PLTG unit by adding a bottoming unit of one (1) HRSG and one (1) steam turbine, seems effective for resolving the electricity supply shortage in Bali Island. This conversion plan requires additional site space and cooling water source for a bottoming plant, but, there is no need to strengthen HSD supply system.
The following repowering plan of PLTG #1 would be considered: Combined cycle conversion (1-1-1) of PLTG #1, by adding a 60 MW class bottoming plant of one (1) HRSG and one (1) steam turbine.
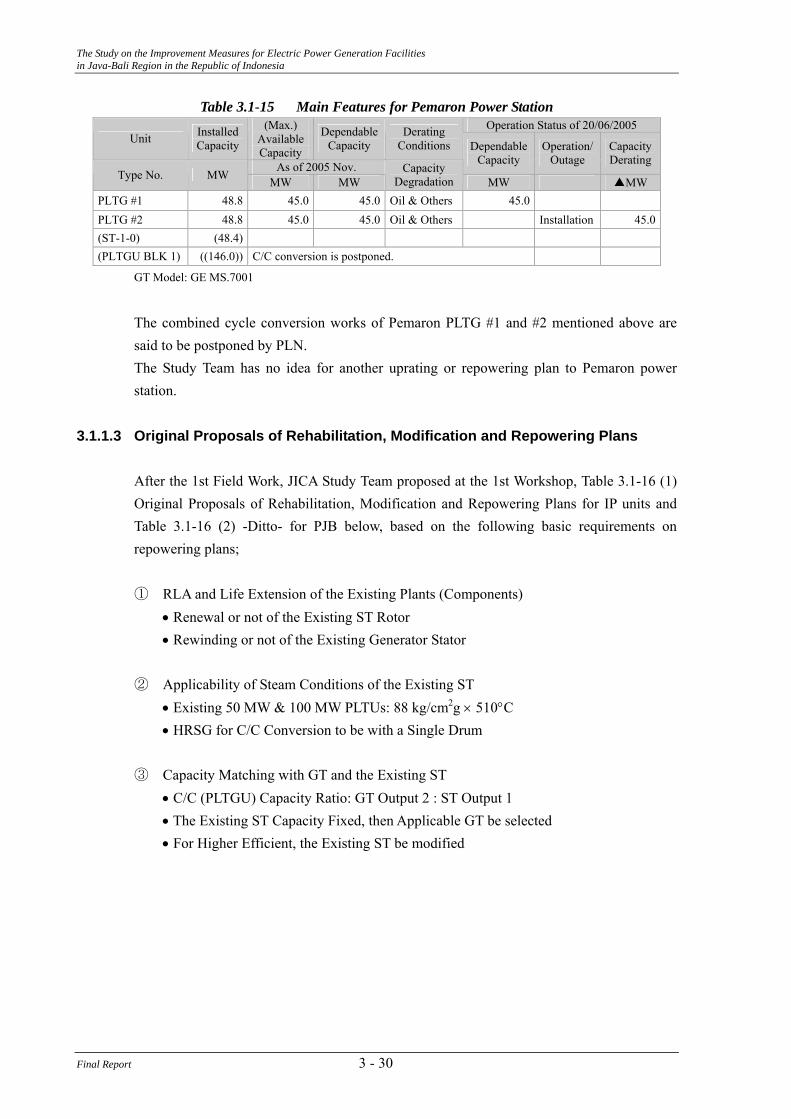
(12) Pemaron Power Station
Pemaron power station has two gas turbine generators, which were moved from Tanjung Priok power station in 2002. The unit 1 and the unit 2 have just started the commercial operation since November 2004 and October 2005, respectively. HRSG blocks, a completely assembled steam turbine and a assembled generator necessary for a bottoming cycle plant to be combined to these gas turbines had been purchased and are now being stored in the site. The table below shows the main features for Pemaron power station.
3 - 29 Final Report
The Study on the Improvement Measures for Electric Power Generation Facilities in Java-Bali Region in the Republic of Indonesia
Table 3.1-15 Main Features for Pemaron Power Station Operation Status of 20/06/2005
Unit Installed Capacity
(Max.) Available Capacity
Dependable Capacity
Derating Conditions
As of 2005 Nov.
Dependable Capacity
Operation/ Outage
Capacity Derating
Type No. MW MW MW Capacity
Degradation MW ▲MW
PLTG #1 48.8 45.0 45.0 Oil & Others 45.0
PLTG #2 48.8 45.0 45.0 Oil & Others Installation 45.0 (ST-1-0) (48.4) (PLTGU BLK 1) ((146.0)) C/C conversion is postponed.
GT Model: GE MS.7001
The combined cycle conversion works of Pemaron PLTG #1 and #2 mentioned above are said to be postponed by PLN. The Study Team has no idea for another uprating or repowering plan to Pemaron power station.
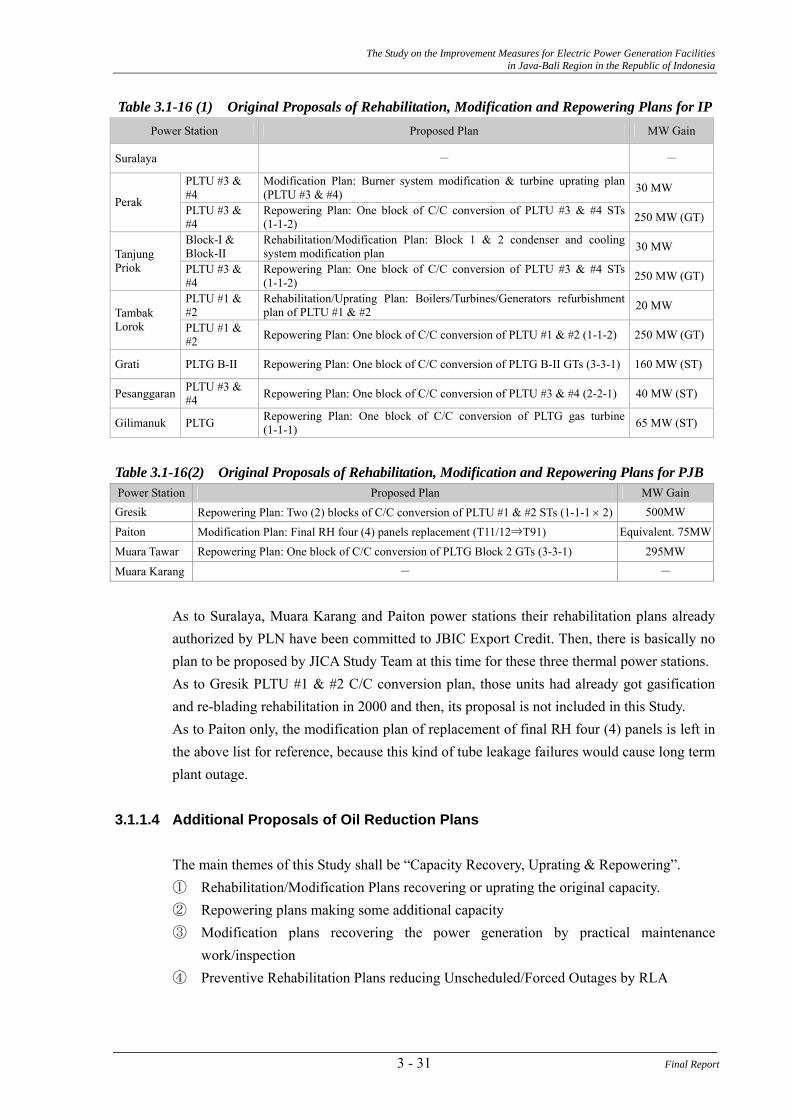
3.1.1.3 Original Proposals of Rehabilitation, Modification and Repowering Plans After the 1st Field Work, JICA Study Team proposed at the 1st Workshop, Table 3.1-16 (1) Original Proposals of Rehabilitation, Modification and Repowering Plans for IP units and Table 3.1-16 (2) -Ditto- for PJB below, based on the following basic requirements on repowering plans; ① RLA and Life Extension of the Existing Plants (Components) • Renewal or not of the Existing ST Rotor • Rewinding or not of the Existing Generator Stator ② Applicability of Steam Conditions of the Existing ST • Existing 50 MW & 100 MW PLTUs: 88 kg/cm2g × 510°C • HRSG for C/C Conversion to be with a Single Drum ③ Capacity Matching with GT and the Existing ST • C/C (PLTGU) Capacity Ratio: GT Output 2 : ST Output 1 • The Existing ST Capacity Fixed, then Applicable GT be selected • For Higher Efficient, the Existing ST be modified
Final Report 3 - 30
The Study on the Improvement Measures for Electric Power Generation Facilities in Java-Bali Region in the Republic of Indonesia
Table 3.1-16 (1) Original Proposals of Rehabilitation, Modification and Repowering Plans for IP Power Station Proposed Plan MW Gain
Suralaya - -
PLTU #3 & #4
Modification Plan: Burner system modification & turbine uprating plan (PLTU #3 & #4) 30 MW
Perak PLTU #3 & #4
Repowering Plan: One block of C/C conversion of PLTU #3 & #4 STs (1-1-2) 250 MW (GT)
Block-I & Block-II
Rehabilitation/Modification Plan: Block 1 & 2 condenser and cooling system modification plan 30 MW Tanjung
Priok PLTU #3 & #4
Repowering Plan: One block of C/C conversion of PLTU #3 & #4 STs (1-1-2) 250 MW (GT)
PLTU #1 & #2
Rehabilitation/Uprating Plan: Boilers/Turbines/Generators refurbishment plan of PLTU #1 & #2 20 MW Tambak
Lorok PLTU #1 & #2 Repowering Plan: One block of C/C conversion of PLTU #1 & #2 (1-1-2) 250 MW (GT)
Grati PLTG B-II Repowering Plan: One block of C/C conversion of PLTG B-II GTs (3-3-1) 160 MW (ST)
Pesanggaran PLTU #3 & #4 Repowering Plan: One block of C/C conversion of PLTU #3 & #4 (2-2-1) 40 MW (ST)
Gilimanuk PLTG Repowering Plan: One block of C/C conversion of PLTG gas turbine (1-1-1) 65 MW (ST)
Table 3.1-16(2) Original Proposals of Rehabilitation, Modification and Repowering Plans for PJB Power Station Proposed Plan MW Gain Gresik Repowering Plan: Two (2) blocks of C/C conversion of PLTU #1 & #2 STs (1-1-1 × 2) 500MW
Paiton Modification Plan: Final RH four (4) panels replacement (T11/12⇒T91) Equivalent. 75MW
Muara Tawar Repowering Plan: One block of C/C conversion of PLTG Block 2 GTs (3-3-1) 295MW
Muara Karang - -
As to Suralaya, Muara Karang and Paiton power stations their rehabilitation plans already authorized by PLN have been committed to JBIC Export Credit. Then, there is basically no plan to be proposed by JICA Study Team at this time for these three thermal power stations. As to Gresik PLTU #1 & #2 C/C conversion plan, those units had already got gasification and re-blading rehabilitation in 2000 and then, its proposal is not included in this Study. As to Paiton only, the modification plan of replacement of final RH four (4) panels is left in the above list for reference, because this kind of tube leakage failures would cause long term plant outage.
3.1.1.4 Additional Proposals of Oil Reduction Plans
The main themes of this Study shall be “Capacity Recovery, Uprating & Repowering”. ① Rehabilitation/Modification Plans recovering or uprating the original capacity. ② Repowering plans making some additional capacity ③ Modification plans recovering the power generation by practical maintenance
work/inspection ④ Preventive Rehabilitation Plans reducing Unscheduled/Forced Outages by RLA
3 - 31 Final Report
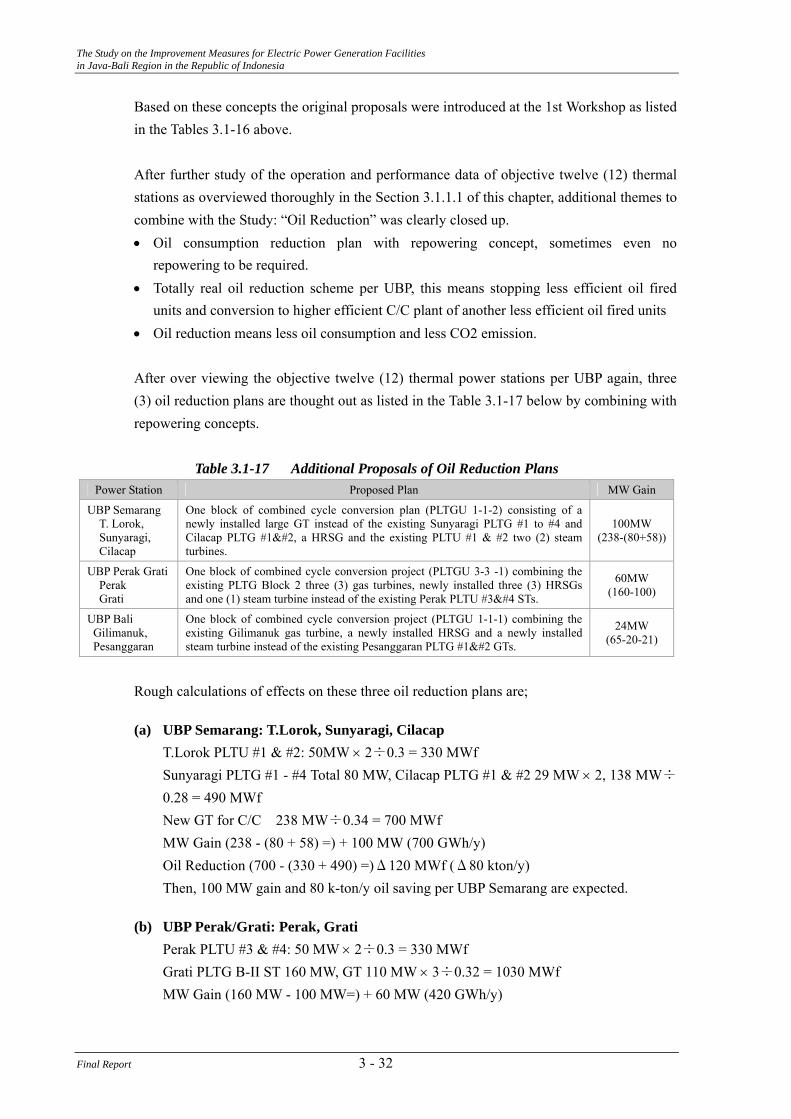
The Study on the Improvement Measures for Electric Power Generation Facilities in Java-Bali Region in the Republic of Indonesia
Based on these concepts the original proposals were introduced at the 1st Workshop as listed in the Tables 3.1-16 above. After further study of the operation and performance data of objective twelve (12) thermal stations as overviewed thoroughly in the Section 3.1.1.1 of this chapter, additional themes to combine with the Study: “Oil Reduction” was clearly closed up. • Oil consumption reduction plan with repowering concept, sometimes even no
repowering to be required. • Totally real oil reduction scheme per UBP, this means stopping less efficient oil fired
units and conversion to higher efficient C/C plant of another less efficient oil fired units • Oil reduction means less oil consumption and less CO2 emission. After over viewing the objective twelve (12) thermal power stations per UBP again, three (3) oil reduction plans are thought out as listed in the Table 3.1-17 below by combining with repowering concepts.
Table 3.1-17 Additional Proposals of Oil Reduction Plans Power Station Proposed Plan MW Gain
UBP Semarang T. Lorok, Sunyaragi, Cilacap
One block of combined cycle conversion plan (PLTGU 1-1-2) consisting of a newly installed large GT instead of the existing Sunyaragi PLTG #1 to #4 and Cilacap PLTG #1, a HRSG and the existing PLTU #1 & #2 two (2) steam turbines.
100MW (238-(80+58))
UBP Perak Grati Perak Grati
One block of combined cycle conversion project (PLTGU 3-3 -1) combining the existing PLTG Block 2 three (3) gas turbines, newly installed three (3) HRSGs and one (1) steam turbine instead of the existing Perak PLTU #3 STs.
60MW (160-100)
UBP Bali Gilimanuk, Pesanggaran
One block of combined cycle conversion project (PLTGU 1-1-1) combining the existing Gilimanuk gas turbine, a newly installed HRSG and a newly installed steam turbine instead of the existing Pesanggaran PLTG #1 GTs.
24MW (65-20-21)
Rough calculations of effects on these three oil reduction plans are;
(a) UBP Semarang: T.Lorok, Sunyaragi, Cilacap T.Lorok PLTU #1 & #2: 50MW × 2÷0.3 = 330 MWf Sunyaragi PLTG #1 - #4 Total 80 MW, Cilacap PLTG #1 & #2 29 MW × 2, 138 MW÷
0.28 = 490 MWf New GT for C/C 238 MW÷0.34 = 700 MWf MW Gain (238 - (80 + 58) =) + 100 MW (700 GWh/y) Oil Reduction (700 - (330 + 490) =)Δ120 MWf (Δ80 kton/y) Then, 100 MW gain and 80 k-ton/y oil saving per UBP Semarang are expected.
(b) UBP Perak/Grati: Perak, Grati Perak PLTU #3 & #4: 50 MW × 2÷0.3 = 330 MWf Grati PLTG B-II ST 160 MW, GT 110 MW × 3÷0.32 = 1030 MWf MW Gain (160 MW - 100 MW=) + 60 MW (420 GWh/y)
Final Report 3 - 32
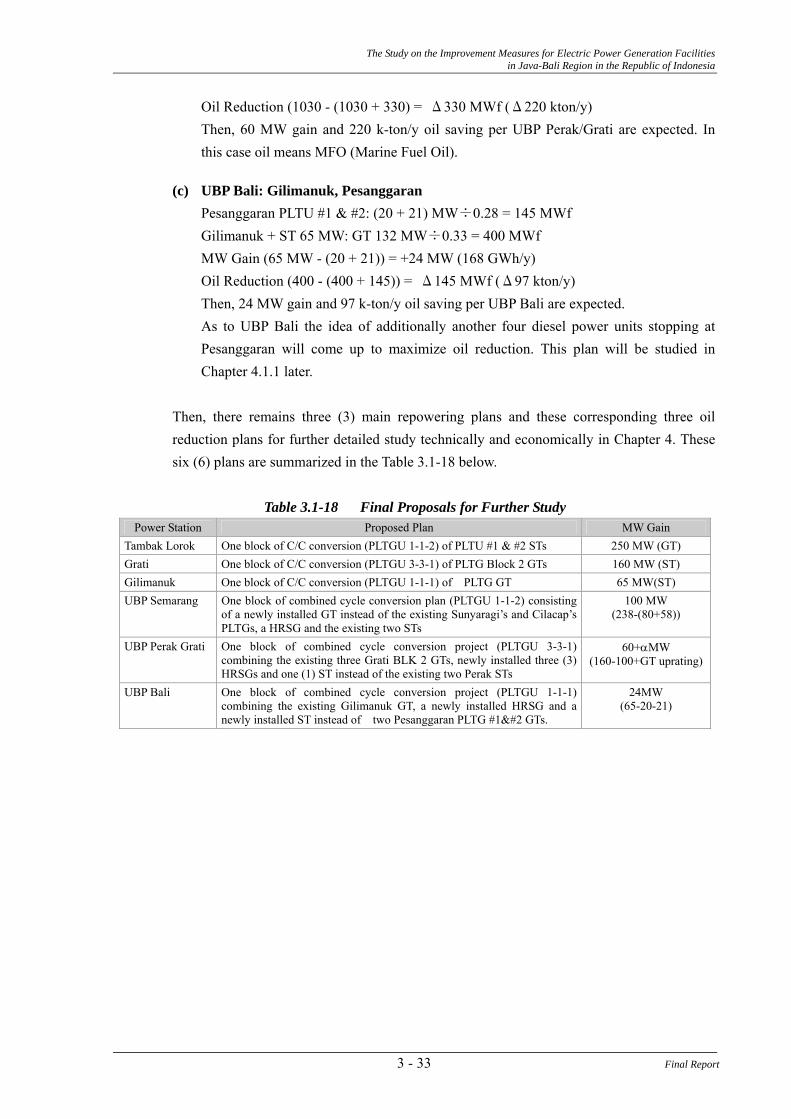
The Study on the Improvement Measures for Electric Power Generation Facilities in Java-Bali Region in the Republic of Indonesia
Oil Reduction (1030 - (1030 + 330) = Δ330 MWf (Δ220 kton/y) Then, 60 MW gain and 220 k-ton/y oil saving per UBP Perak/Grati are expected. In
this case oil means MFO (Marine Fuel Oil).
(c) UBP Bali: Gilimanuk, Pesanggaran Pesanggaran PLTU #1 & #2: (20 + 21) MW÷0.28 = 145 MWf Gilimanuk + ST 65 MW: GT 132 MW÷0.33 = 400 MWf MW Gain (65 MW - (20 + 21)) = +24 MW (168 GWh/y) Oil Reduction (400 - (400 + 145)) = Δ145 MWf (Δ97 kton/y) Then, 24 MW gain and 97 k-ton/y oil saving per UBP Bali are expected. As to UBP Bali the idea of additionally another four diesel power units stopping at
Pesanggaran will come up to maximize oil reduction. This plan will be studied in Chapter 4.1.1 later.
Then, there remains three (3) main repowering plans and these corresponding three oil reduction plans for further detailed study technically and economically in Chapter 4. These six (6) plans are summarized in the Table 3.1-18 below.
Table 3.1-18 Final Proposals for Further Study
Power Station Proposed Plan MW Gain Tambak Lorok One block of C/C conversion (PLTGU 1-1-2) of PLTU #1 & #2 STs 250 MW (GT) Grati One block of C/C conversion (PLTGU 3-3-1) of PLTG Block 2 GTs 160 MW (ST) Gilimanuk One block of C/C conversion (PLTGU 1-1-1) of PLTG GT 65 MW(ST) UBP Semarang One block of combined cycle conversion plan (PLTGU 1-1-2) consisting
of a newly installed GT instead of the existing Sunyaragi’s and Cilacap’s PLTGs, a HRSG and the existing two STs
100 MW (238-(80+58))
UBP Perak Grati
One block of combined cycle conversion project (PLTGU 3-3-1) combining the existing three Grati BLK 2 GTs, newly installed three (3) HRSGs and one (1) ST instead of the existing two Perak STs
60+αMW (160-100+GT uprating)
UBP Bali One block of combined cycle conversion project (PLTGU 1-1-1) combining the existing Gilimanuk GT, a newly installed HRSG and a newly installed ST instead of two Pesanggaran PLTG #1 GTs.
24MW (65-20-21)
3 - 33 Final Report
The Study on the Improvement Measures for Electric Power Generation Facilities in Java-Bali Region in the Republic of Indonesia
3.1.2. Hydropower Stations 3.1.2.1. Location of the Investigated Hydropower Stations
(1) Saguling
Saguling hydro power station is located on the west side of Java Island Indonesia, upstream of the Citarum River approximately 25 km west side of Bandung city. Location is shown in Appendix HY-1 (Location map)
(2) Cirata
Cirata hydro power station is located on the west side of Java Island Indonesia, midstream of the Citarum River approximately 30 km north west side of Bandung city. Location is shown in Appendix HY-1 (Location map).
(3) Soedirman
Soedirman hydro power station is located on the central of Java Island Indonesia, midstream of the Serayu River approximately 90 km north west side of Yogyakarta city. Location is shown in Appendix HY-2 (Location map).
(4) Sutami
Sutami hydro power station is located on the east side of Java Island Indonesia, upstream of the Brantas River approximately 40 km southwest side of Malang city. Location is shown in Appendix HY-3 (Location map).
3.1.2.2. Main Features of Objective Power Stations The main features of the objective power stations are shown in the Table 3.1-19. The single line diagram of four (4) power stations are shown in Appendix HY-4 ~ HY-7.
Final Report 3 - 34
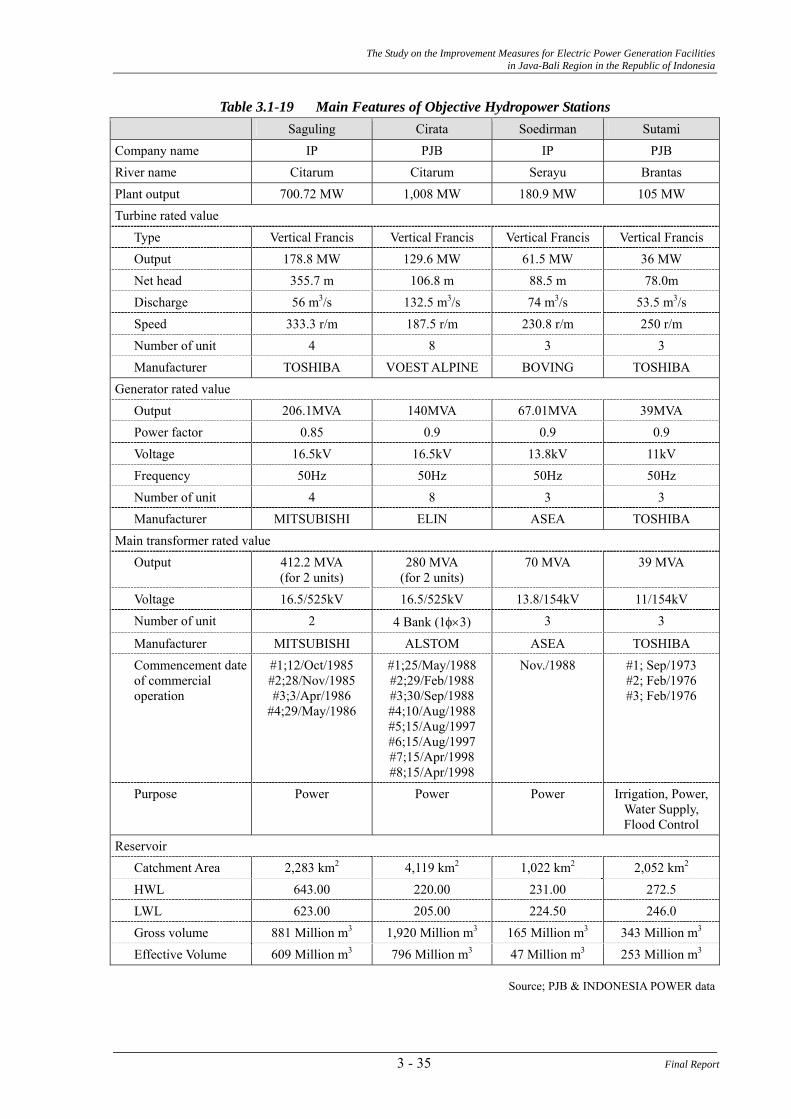
The Study on the Improvement Measures for Electric Power Generation Facilities in Java-Bali Region in the Republic of Indonesia
Table 3.1-19 Main Features of Objective Hydropower Stations Saguling Cirata Soedirman Sutami
Company name IP PJB IP PJB River name Citarum Citarum Serayu Brantas Plant output 700.72 MW 1,008 MW 180.9 MW 105 MW Turbine rated value
Type Vertical Francis Vertical Francis Vertical Francis Vertical Francis Output 178.8 MW 129.6 MW 61.5 MW 36 MW Net head 355.7 m 106.8 m 88.5 m 78.0m Discharge 56 m3/s 132.5 m3/s 74 m3/s 53.5 m3/s Speed 333.3 r/m 187.5 r/m 230.8 r/m 250 r/m Number of unit 4 8 3 3 Manufacturer TOSHIBA VOEST ALPINE BOVING TOSHIBA
Generator rated value Output 206.1MVA 140MVA 67.01MVA 39MVA Power factor 0.85 0.9 0.9 0.9 Voltage 16.5kV 16.5kV 13.8kV 11kV Frequency 50Hz 50Hz 50Hz 50Hz Number of unit 4 8 3 3 Manufacturer MITSUBISHI ELIN ASEA TOSHIBA
Main transformer rated value Output 412.2 MVA
(for 2 units) 280 MVA
(for 2 units) 70 MVA 39 MVA
Voltage 16.5/525kV 16.5/525kV 13.8/154kV 11/154kV Number of unit 2 4 Bank (1φ×3) 3 3
Manufacturer MITSUBISHI ALSTOM ASEA TOSHIBA Commencement date of commercial operation
#1;12/Oct/1985 #2;28/Nov/1985 #3;3/Apr/1986
#4;29/May/1986
#1;25/May/1988 #2;29/Feb/1988 #3;30/Sep/1988 #4;10/Aug/1988 #5;15/Aug/1997 #6;15/Aug/1997 #7;15/Apr/1998 #8;15/Apr/1998
Nov./1988
#1; Sep/1973 #2; Feb/1976 #3; Feb/1976
Purpose Power Power Power Irrigation, Power, Water Supply, Flood Control
Reservoir Catchment Area 2,283 km2 4,119 km2 1,022 km2 2,052 km2
HWL 643.00 220.00 231.00 272.5 LWL 623.00 205.00 224.50 246.0 Gross volume 881 Million m3 1,920 Million m3 165 Million m3 343 Million m3
Effective Volume 609 Million m3 796 Million m3 47 Million m3 253 Million m3
Source; PJB & INDONESIA POWER data
3 - 35 Final Report
The Study on the Improvement Measures for Electric Power Generation Facilities in Java-Bali Region in the Republic of Indonesia
3.1.2.3. Current Situation of Power Output Performance
(1) Saguling
Any derating of power output for every unit is not reported at the moment. For unit No.3, minimum output is restricted to 100 MW due to the reason that the thrust bearing temperature has risen abnormally during the operation at less than 100 MW since the last 3 years. Regarding the above mentioned issue, the runner gap measurement and the main shaft aliment were carried out at the previous overhaul (2004), however these values were just normal and the issue has not been solved yet. The control module cards of the automatic voltage control system (AVR) and the governor system (GOV) seem to be out of date. Saguling has the LFC (load frequency control) function to adjust the frequency of the Java Bali Power Grid System. Units start, stop and output are controlled from the power house control room operator following P3B Gandul Dispatching Center’s instruction. The output control is carried out manually by the operator according to the LFC output signal. The units are usually operated under LFC mode, therefore the unit output is usually kept partial load to respond the load change request quickly. Consequently, the unit operation output is usually 50~60% load and from the viewpoint of turbine efficiency, the units are operated under lower efficiency. (Maximum point of the turbine efficiency is usually designed at the 90~95% output point, therefore at the low load point, turbine efficiency is rather low.) Due to the deterioration of the reservoir water quality, there are some troubles in the cooling system (water leakage, corrosion in the piping) and replacement of the cooling system has being carried out step by step. Small water leakage is found out at Unit 1 draft manhole area, however this is minor issue. Periodical maintenance (clean up work for the relay contact surface) is conducted in the power house because of H2S gas which may cause the relay contact or/and connection point failure. The main transformer no. 1 was broken down in 2002, and one (1) phase of the transformer was replaced. The turbine runner of Unit 4 was replaced in 2004. And the old runner is stored for the spare runner. The historical record of annual scheduled outage and forced outage hours are shown in the table.
Final Report 3 - 36
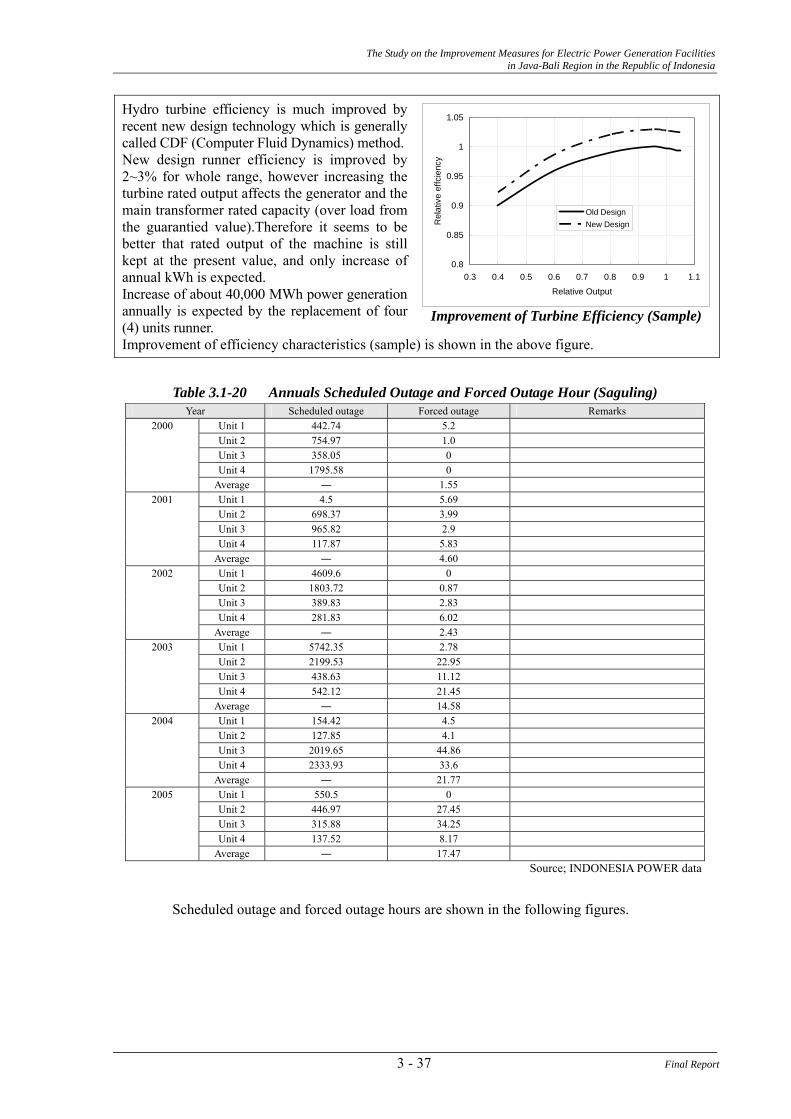
The Study on the Improvement Measures for Electric Power Generation Facilities in Java-Bali Region in the Republic of Indonesia
Hydro turbine efficiency is much improved by recent new design technology which is generally called CDF (Computer Fluid Dynamics) method. New design runner efficiency is improved by 2~3% for whole range, however increasing the turbine rated output affects the generator and the main transformer rated capacity (over load from the guarantied value).Therefore it seems to be better that rated output of the machine is still kept at the present value, and only increase of annual kWh is expected. Increase of about 40,000 MWh power generation annually is expected by the replacement of four (4) units runner. Improvement of efficiency characteristics (sample) is shown in the above figure.
Improvement of Turbine Efficiency (Sample)
0.8
0.85
0.9
0.95
1
1.05
0.3 0.4 0.5 0.6 0.7 0.8 0.9 1 1.1
Relative Output
Rel
ativ
e ef
fcie
ncy
Old DesignNew Design
Table 3.1-20 Annuals Scheduled Outage and Forced Outage Hour (Saguling)
Year Scheduled outage Forced outage Remarks Unit 1 442.74 5.2 Unit 2 754.97 1.0 Unit 3 358.05 0 Unit 4 1795.58 0
2000
Average ― 1.55 Unit 1 4.5 5.69 Unit 2 698.37 3.99 Unit 3 965.82 2.9 Unit 4 117.87 5.83
2001
Average ― 4.60 Unit 1 4609.6 0 Unit 2 1803.72 0.87 Unit 3 389.83 2.83 Unit 4 281.83 6.02
2002
Average ― 2.43 Unit 1 5742.35 2.78 Unit 2 2199.53 22.95 Unit 3 438.63 11.12 Unit 4 542.12 21.45
2003
Average ― 14.58 Unit 1 154.42 4.5 Unit 2 127.85 4.1 Unit 3 2019.65 44.86 Unit 4 2333.93 33.6
2004
Average ― 21.77 Unit 1 550.5 0 Unit 2 446.97 27.45 Unit 3 315.88 34.25 Unit 4 137.52 8.17
2005
Average ― 17.47 Source; INDONESIA POWER data
Scheduled outage and forced outage hours are shown in the following figures.
3 - 37 Final Report
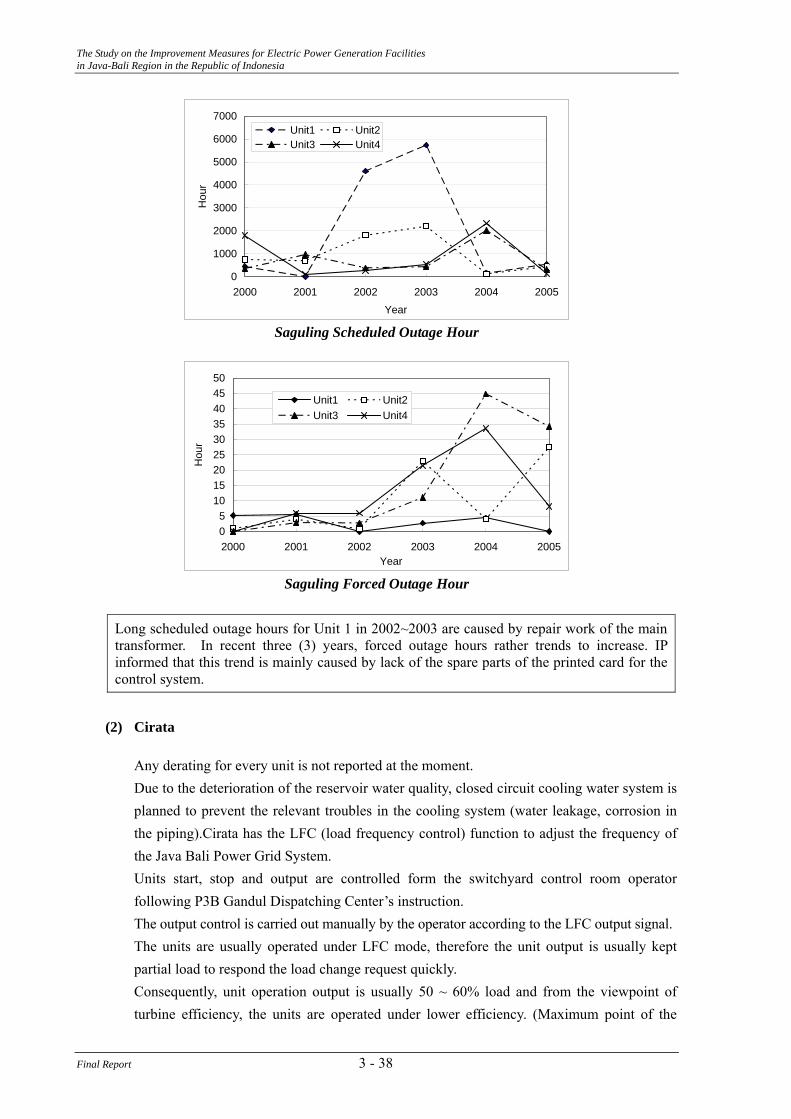
The Study on the Improvement Measures for Electric Power Generation Facilities in Java-Bali Region in the Republic of Indonesia
0
1000
2000
3000
4000
5000
6000
7000
2000 2001 2002 2003 2004 2005Year
Hou
r
Unit1 Unit2Unit3 Unit4
Saguling Scheduled Outage Hour
05
101520253035404550
2000 2001 2002 2003 2004 2005Year
Hou
r
Unit1 Unit2Unit3 Unit4
Saguling Forced Outage Hour
Long scheduled outage hours for Unit 1 in 2002~2003 are caused by repair work of the main transformer. In recent three (3) years, forced outage hours rather trends to increase. IP informed that this trend is mainly caused by lack of the spare parts of the printed card for the control system.
(2) Cirata
Any derating for every unit is not reported at the moment. Due to the deterioration of the reservoir water quality, closed circuit cooling water system is planned to prevent the relevant troubles in the cooling system (water leakage, corrosion in the piping).Cirata has the LFC (load frequency control) function to adjust the frequency of the Java Bali Power Grid System. Units start, stop and output are controlled form the switchyard control room operator following P3B Gandul Dispatching Center’s instruction. The output control is carried out manually by the operator according to the LFC output signal. The units are usually operated under LFC mode, therefore the unit output is usually kept partial load to respond the load change request quickly. Consequently, unit operation output is usually 50 ~ 60% load and from the viewpoint of turbine efficiency, the units are operated under lower efficiency. (Maximum point of the
Final Report 3 - 38
The Study on the Improvement Measures for Electric Power Generation Facilities in Java-Bali Region in the Republic of Indonesia
turbine efficiency is usually designed at the 90~95% output point, therefore at the low load point, turbine efficiency is rather low.)For better efficient operation, PJB Cirata offers to P3B that number of operating units better be decreased in order to increase the units load. Several serious troubles occurred in the past at the generator stator winding. And the repairs of winding connection and/or winding replacement were carried out for Units 1, 2, 3, 4, and 8. Unit 8 is operated under guide vane servo motor spring trouble and PJB Cirata is anxious about the possibility of the occurrence of the same kind of trouble for other units. Repair of the runner has not been carried out up to now because cavitation pitting on the runner vane is still slight. The Study Team had an opportunity to inspect the inside of Unit 5 turbine. There was noting any serious issues on the spiral case, guide vanes, stay vanes, runner, draft tube, and inlet valve and also any cavitation pitting was not found out on the runner, draft tube and guide vanes. Forced outage hours have been much reduced recently in comparison with years 1997 and 1998. This phenomenon probably means that the “teething troubles” period of 2nd stage units was over and all units enter to the stable period.
One of the weak points in Cirata machinery seems to be connection of the stator winding. (PJB informed that regarding the stator winding connection, units 1 ~ 4 ware already repaired from soldering to brazing type and units 5 ~ 8 ware already applied brazing type.) Periodical measurement of partial discharge (corona discharge) is probably useful to check the stator winding condition.
The historical record of annual scheduled outage and forced outage hours are shown in the following table.
Table 3.1-21 Analysis Scheduled Outage and Forced Outage Hour (Cirata)
Year Scheduled outage Forced outage Remarks Unit 1 1556.24 13.33 Unit 2 904.42 23.23 Unit 3 1391.23 34.1 Unit 4 1174.18 19.75 Unit 5 672.95 209.45 Unit 6 308.74 107.35 Unit 7 - - Unit 8 - -
1997
Average 62.7 Unit 1 156.43 41.07 Unit 2 258.92 3.21 Unit 3 0 40.26 Unit 4 6600 0 Repair the stator winding Unit 5 576.08 76.2 Unit 6 395.68 504.11 Unit 7 302.17 0 Unit 8 312.42 0
1998
Average - 83.11 Unit 1 417.83 56.15 Unit 2 404.0 0
1999
Unit 3 1271.33 2.23
3 - 39 Final Report
The Study on the Improvement Measures for Electric Power Generation Facilities in Java-Bali Region in the Republic of Indonesia
Year Scheduled outage Forced outage Remarks Unit 4 415.8 0 Unit 5 653.55 0 Unit 6 524.05 0.55 Unit 7 792.5 8.87 Unit 8 656.48 0
Average - 59.04 Unit 1 3001 22.73 Repair the stator winding Unit 2 0 15.55 Unit 3 2752.04 11.77 Repair the stator winding Unit 4 419 8.53 Unit 5 0 45.33 Unit 6 0 38.0 Unit 7 0 59.68 Unit 8 374.72 29.9
2000
Average - 28.94 Unit 1 4577.45 8.64 Repair the stator winding Unit 2 2618.01 0 Repair the stator winding Unit 3 6658.5 3.93 Repair the stator winding Unit 4 259.48 2.97 Unit 5 252.17 7.08 Unit 6 47.5h 0 Unit 7 142.85 18.01 Unit 8 112.25 5.93
2001
Average - 4.74 Unit 1 677.41 0 Unit 2 2075.86 6.0 Repair the stator winding Unit 3 4498 64.76 Repair the stator winding Unit 4 450.08 5.4 Unit 5 427.53 9.58 Unit 6 370.37 3.61 Unit 7 344.5h 3.78 Unit 8 373.25 0.55
2002
Average - 11.71 Unit 1 0 2.25 Unit 2 0 0 Unit 3 8760 0 Repair the stator winding Unit 4 748.8 24.43 Unit 5 965.95 34.57 Unit 6 752.17 4.38 Unit 7 0 1.42 Unit 8 778.42 2.37
2003
Average - 8.68 Unit 1 465.76 5.27 Unit 2 774.68 0.47 Unit 3 1488.01 22.7 Repair the stator winding Unit 4 0 0 Unit 5 272.6 0 Unit 6 347.5 9.0 Unit 7 1032.58 0.48 Unit 8 650 14.68 Repair the stator winding
2004
Average - 6.58 Unit 1 224.67 37.64 Unit 2 202.03 9.97 Unit 3 509.21 26.38 Unit 4 561.18 1.95 Unit 5 0 0.37 Unit 6 0 18.19 Unit 7 417.12 17.26 Unit 8 3652.06 0 Repair the stator winding
2005
Average - 13.97 Source; PJB data
Final Report 3 - 40
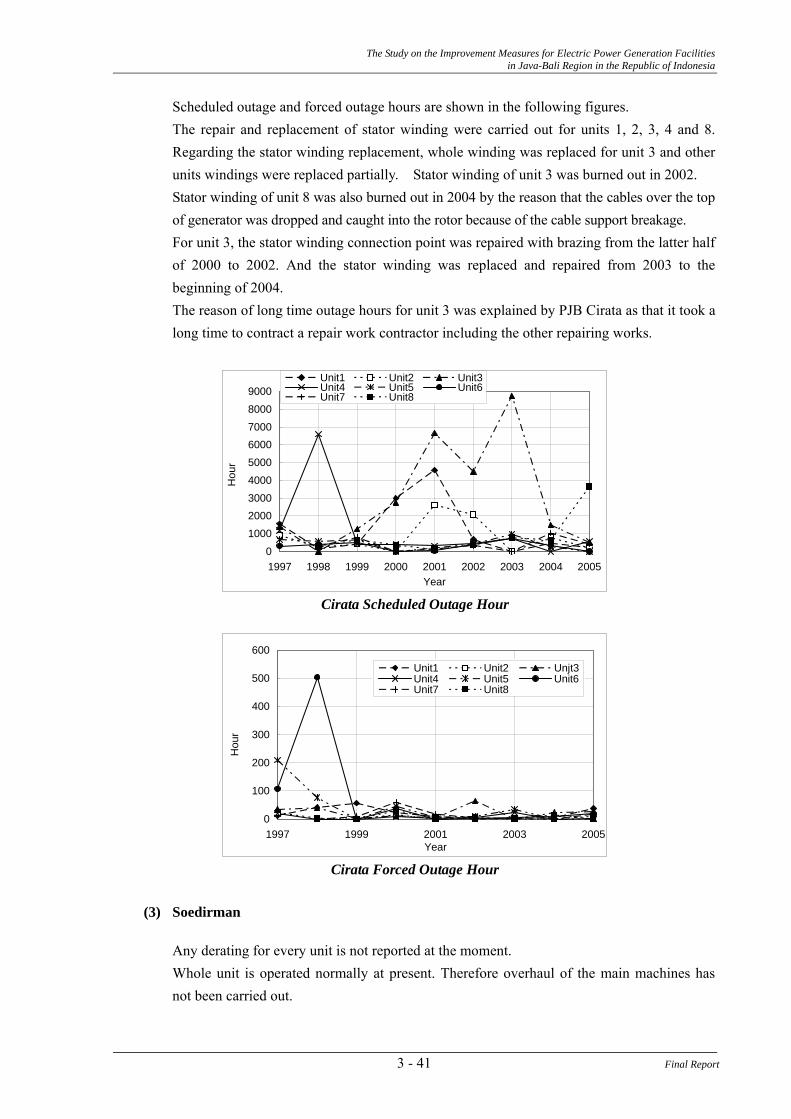
The Study on the Improvement Measures for Electric Power Generation Facilities in Java-Bali Region in the Republic of Indonesia
Scheduled outage and forced outage hours are shown in the following figures. The repair and replacement of stator winding were carried out for units 1, 2, 3, 4 and 8. Regarding the stator winding replacement, whole winding was replaced for unit 3 and other units windings were replaced partially. Stator winding of unit 3 was burned out in 2002. Stator winding of unit 8 was also burned out in 2004 by the reason that the cables over the top of generator was dropped and caught into the rotor because of the cable support breakage. For unit 3, the stator winding connection point was repaired with brazing from the latter half of 2000 to 2002. And the stator winding was replaced and repaired from 2003 to the beginning of 2004. The reason of long time outage hours for unit 3 was explained by PJB Cirata as that it took a long time to contract a repair work contractor including the other repairing works.
0
1000200030004000
5000600070008000
9000
1997 1998 1999 2000 2001 2002 2003 2004 2005Year
Hou
r
Unit1 Unit2 Unit3Unit4 Unit5 Unit6Unit7 Unit8
Cirata Scheduled Outage Hour
0
100
200
300
400
500
600
1997 1999 2001 2003 2005Year
Hou
r
Unit1 Unit2 Unjt3Unit4 Unit5 Unit6Unit7 Unit8
Cirata Forced Outage Hour
(3) Soedirman
Any derating for every unit is not reported at the moment. Whole unit is operated normally at present. Therefore overhaul of the main machines has not been carried out.
3 - 41 Final Report
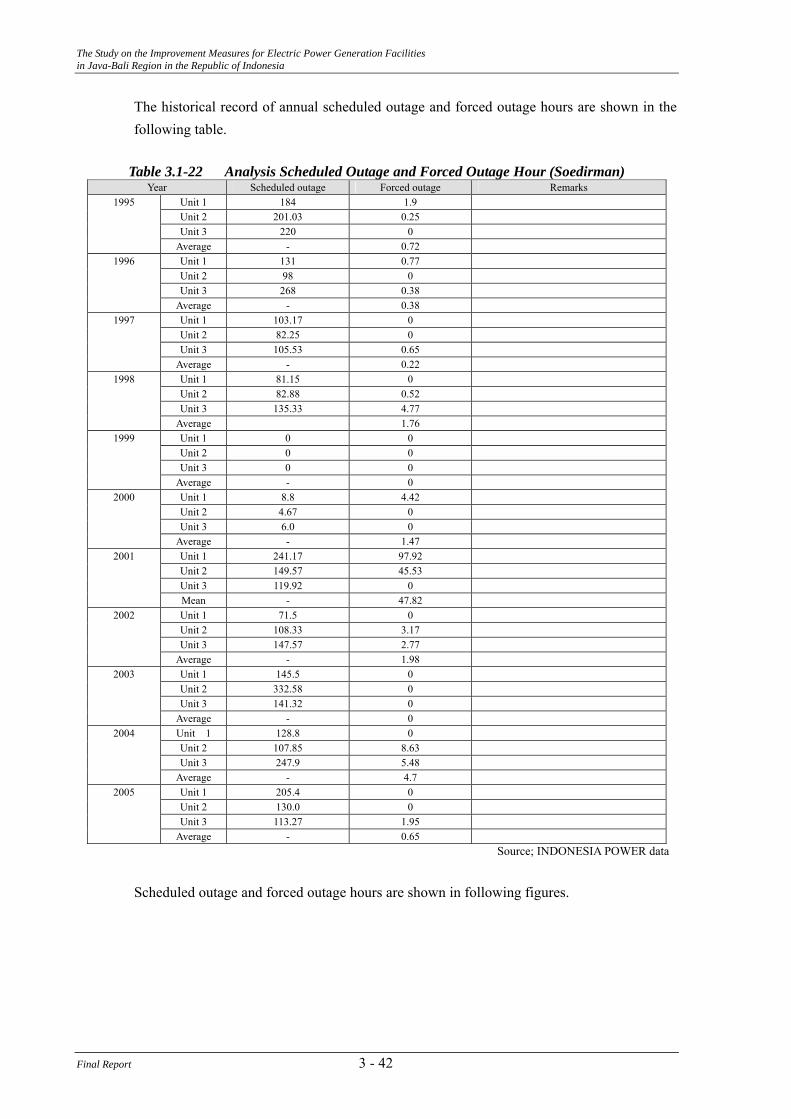
The Study on the Improvement Measures for Electric Power Generation Facilities in Java-Bali Region in the Republic of Indonesia
The historical record of annual scheduled outage and forced outage hours are shown in the following table.
Table 3.1-22 Analysis Scheduled Outage and Forced Outage Hour (Soedirman)
Year Scheduled outage Forced outage Remarks Unit 1 184 1.9 Unit 2 201.03 0.25 Unit 3 220 0
1995
Average - 0.72 Unit 1 131 0.77 Unit 2 98 0 Unit 3 268 0.38
1996
Average - 0.38 Unit 1 103.17 0 Unit 2 82.25 0 Unit 3 105.53 0.65
1997
Average - 0.22 Unit 1 81.15 0 Unit 2 82.88 0.52 Unit 3 135.33 4.77
1998
Average 1.76 Unit 1 0 0 Unit 2 0 0 Unit 3 0 0
1999
Average - 0 Unit 1 8.8 4.42 Unit 2 4.67 0 Unit 3 6.0 0
2000
Average - 1.47 Unit 1 241.17 97.92 Unit 2 149.57 45.53 Unit 3 119.92 0
2001
Mean - 47.82 Unit 1 71.5 0 Unit 2 108.33 3.17 Unit 3 147.57 2.77
2002
Average - 1.98 Unit 1 145.5 0 Unit 2 332.58 0 Unit 3 141.32 0
2003
Average - 0 Unit 1 128.8 0 Unit 2 107.85 8.63 Unit 3 247.9 5.48
2004
Average - 4.7 Unit 1 205.4 0 Unit 2 130.0 0 Unit 3 113.27 1.95
2005
Average - 0.65 Source; INDONESIA POWER data
Scheduled outage and forced outage hours are shown in following figures.
Final Report 3 - 42
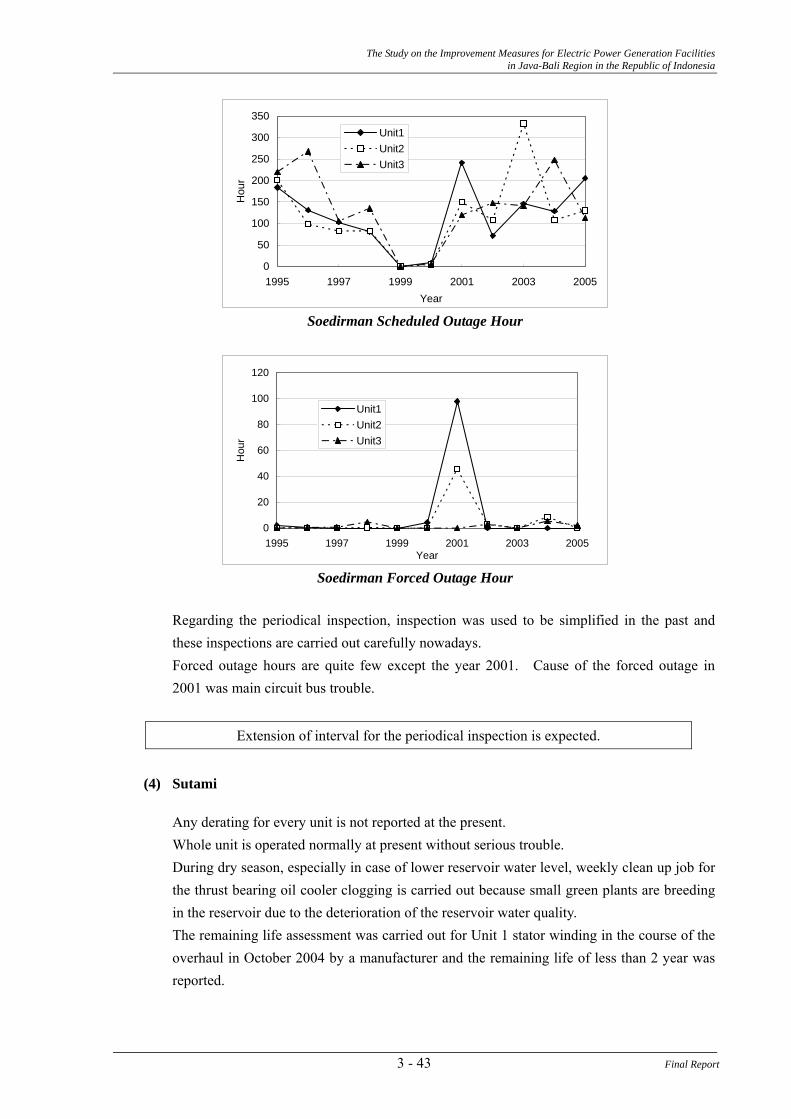
The Study on the Improvement Measures for Electric Power Generation Facilities in Java-Bali Region in the Republic of Indonesia
0
50
100
150
200
250
300
350
1995 1997 1999 2001 2003 2005Year
Hou
r
Unit1Unit2Unit3
Soedirman Scheduled Outage Hour
0
20
40
60
80
100
120
1995 1997 1999 2001 2003 2005Year
Hou
r
Unit1Unit2Unit3
Soedirman Forced Outage Hour
Regarding the periodical inspection, inspection was used to be simplified in the past and these inspections are carried out carefully nowadays. Forced outage hours are quite few except the year 2001. Cause of the forced outage in 2001 was main circuit bus trouble.
Extension of interval for the periodical inspection is expected.
(4) Sutami
Any derating for every unit is not reported at the present. Whole unit is operated normally at present without serious trouble. During dry season, especially in case of lower reservoir water level, weekly clean up job for the thrust bearing oil cooler clogging is carried out because small green plants are breeding in the reservoir due to the deterioration of the reservoir water quality. The remaining life assessment was carried out for Unit 1 stator winding in the course of the overhaul in October 2004 by a manufacturer and the remaining life of less than 2 year was reported.
3 - 43 Final Report
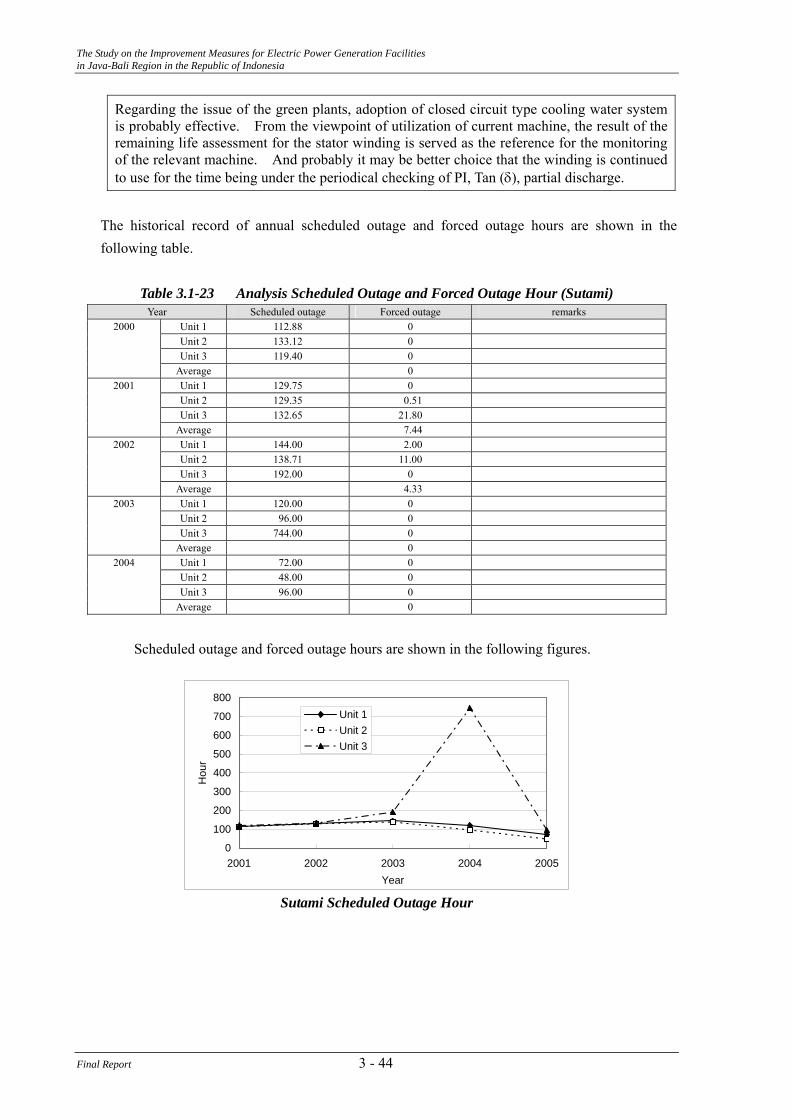
The Study on the Improvement Measures for Electric Power Generation Facilities in Java-Bali Region in the Republic of Indonesia
Regarding the issue of the green plants, adoption of closed circuit type cooling water system is probably effective. From the viewpoint of utilization of current machine, the result of the remaining life assessment for the stator winding is served as the reference for the monitoring of the relevant machine. And probably it may be better choice that the winding is continued to use for the time being under the periodical checking of PI, Tan (δ), partial discharge.
The historical record of annual scheduled outage and forced outage hours are shown in the following table.
Table 3.1-23 Analysis Scheduled Outage and Forced Outage Hour (Sutami)
Year Scheduled outage Forced outage remarks Unit 1 112.88 0 Unit 2 133.12 0 Unit 3 119.40 0
2000
Average 0 Unit 1 129.75 0 Unit 2 129.35 0.51 Unit 3 132.65 21.80
2001
Average 7.44 Unit 1 144.00 2.00 Unit 2 138.71 11.00 Unit 3 192.00 0
2002
Average 4.33 Unit 1 120.00 0 Unit 2 96.00 0 Unit 3 744.00 0
2003
Average 0 Unit 1 72.00 0 Unit 2 48.00 0 Unit 3 96.00 0
2004
Average 0
Scheduled outage and forced outage hours are shown in the following figures.
0
100
200
300
400
500
600
700
800
2001 2002 2003 2004 2005Year
Hou
r
Unit 1Unit 2Unit 3
Sutami Scheduled Outage Hour
Final Report 3 - 44
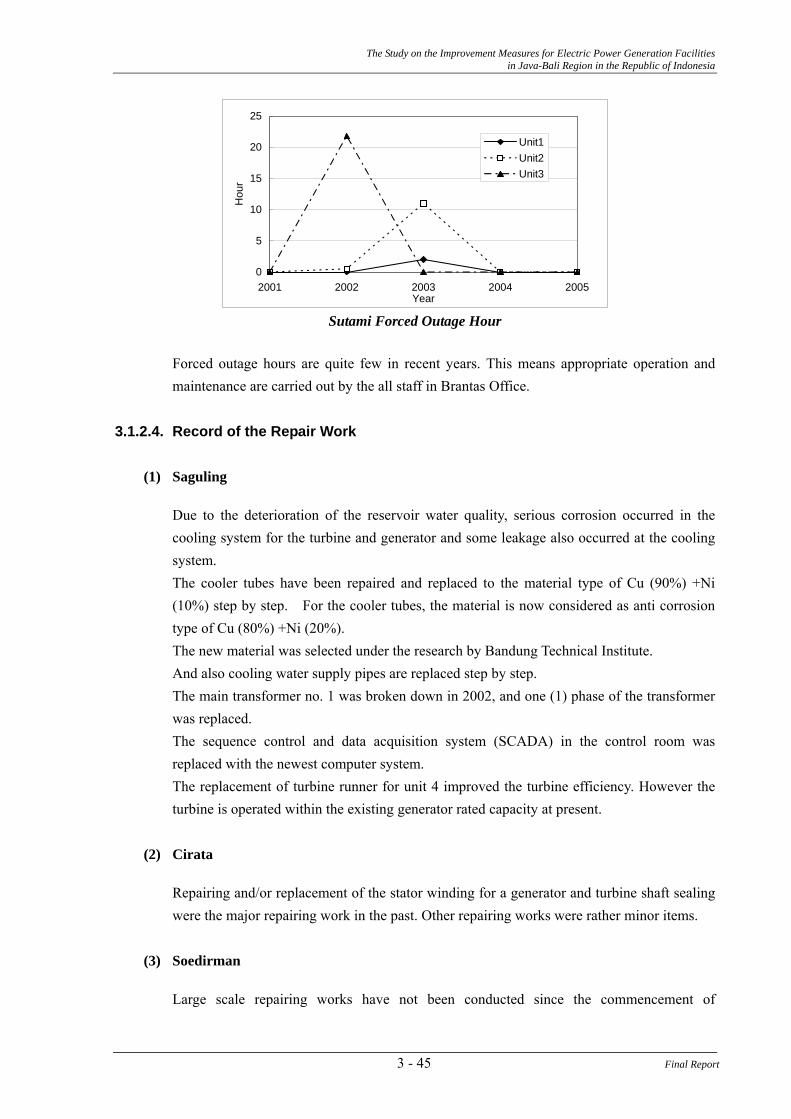
The Study on the Improvement Measures for Electric Power Generation Facilities in Java-Bali Region in the Republic of Indonesia
0
5
10
15
20
25
2001 2002 2003 2004 2005Year
Hou
r
Unit1Unit2Unit3
Sutami Forced Outage Hour
Forced outage hours are quite few in recent years. This means appropriate operation and maintenance are carried out by the all staff in Brantas Office.
3.1.2.4. Record of the Repair Work
(1) Saguling
Due to the deterioration of the reservoir water quality, serious corrosion occurred in the cooling system for the turbine and generator and some leakage also occurred at the cooling system. The cooler tubes have been repaired and replaced to the material type of Cu (90%) +Ni (10%) step by step. For the cooler tubes, the material is now considered as anti corrosion type of Cu (80%) +Ni (20%). The new material was selected under the research by Bandung Technical Institute. And also cooling water supply pipes are replaced step by step. The main transformer no. 1 was broken down in 2002, and one (1) phase of the transformer was replaced. The sequence control and data acquisition system (SCADA) in the control room was replaced with the newest computer system. The replacement of turbine runner for unit 4 improved the turbine efficiency. However the turbine is operated within the existing generator rated capacity at present.
(2) Cirata
Repairing and/or replacement of the stator winding for a generator and turbine shaft sealing were the major repairing work in the past. Other repairing works were rather minor items.
(3) Soedirman
Large scale repairing works have not been conducted since the commencement of
3 - 45 Final Report
The Study on the Improvement Measures for Electric Power Generation Facilities in Java-Bali Region in the Republic of Indonesia
commercial operation because whole units are kept in good condition and operated normally. For turbine cavitation pitting, a repair work with welding was carried out because pitting depth was more than 5 mm. However, welding volume has been small one up to now. Annual missing volume caused by the cavitation pitting is estimated to about 0.5 kg.
(4) Sutami
On the whole, the original facilities have been used up to now and repair works relating to major components were only welding at the runner cavitation pitting. Repairing of the runner, basically coat painting (cold welding) is carried out for the purpose of protection for runner surface and also welding is carried out when cavitation pitting becomes rather deep. The Study Team had an opportunity to inspect the spare turbine runner. The spare turbine runner seems to be kept in good condition enough to use still long time and cavitation pitting is negligible small according to the visual observation.
3.1.2.5. Repairing Planning in the Future
(1) Saguling
Repairing and replacement of the cooler tube and cooling pipe are planned step by step. The replacement of relays in the power house is planned to convert to non contact type relays to prevent relays from the contact trouble caused by H2S gas. The replacement of control module cards of AVR (automatic voltage regulation) and GOV (governor) system is also planned to be replaced with new ones because the obtaining of spare parts has been difficult due to out of date products.
(2) Cirata
Due to the deterioration of the reservoir water quality, the conversion of cooling system to closed circuit system is planned to prevent the system from the corrosion. The control computer system installed in the switch yard control room is planned to be replaced with the newest computer system because the obtaining of spare parts has been difficult due to out of date products. And supervising board is also planned to be replaced at the same time.
(3) Soedirman
There is nothing any serious trouble for all equipment, however the conversion of control module cards of AVR (automatic voltage regulation), GOV (governor) and sequence control system to new module cards from 2006 is planned because the obtaining of spare parts has
Final Report 3 - 46
The Study on the Improvement Measures for Electric Power Generation Facilities in Java-Bali Region in the Republic of Indonesia
been difficult due to out of date products.
(4) Sutami
Since the 154 kV synchronizing circuit breaker (air blast type CB) has been operated more than 30 years, air leakage trouble occurs sometimes and also procurement of spare parts becomes difficult due to out of date products. For the above condition, replacement of the CB is necessary to be replaced as soon as possible. P3B’s CBs installed in the same switchyard area are already replaced with new type CB (SF6 gas insulated type CB). Due to the deterioration of the reservoir water quality, replacement of the cooling system pipes is considered. And relocation of the generator bearing oil cooler from inside of the generator housing to outside of the generator room is also considered for the purpose of easier maintenance, especially in dry season because frequent clean up work is required. Since the replacement of turbine runner is expected to increase the turbine efficiency, the possibility of increase of power output of the generator by means of the replacement of the stator winding is considered. The replacement of automatic voltage control system (AVR) and the governor equipment (GOV) are considered due to the equipment being out of date.
The air blast type CB installed in Sutami is very old type. In case of the CB trouble, the unit is impossible to startup and synchronizing. Therefore replacement of the CB is needed as soon as possible. New designed runner efficiency is improved by 2~3% for whole operation range. However increase of the rated output of the turbine influence the rated capacities of the generator and the main transformer (over load from the guarantied value).Therefore it seems to be better that rated output of the machine is still kept at the present value, and only increase of annual kWh is estimated. Increase of about 9,000~ 13,500 MWh per annum is expected by means of the replacement of 3 units runners.
3.1.2.6. Present Conditions and Issues in the Reservoir
(1) Saguling
The Citarum River is the biggest river in the West Java with the catchment area of 6,080 km2, which flows in southeast to northwest and into the Java Sea at just east of Jakarta. The river originates from the high volcanic mountains surrounding Bandung. The Saguling hydropower station was developed in 1986 as one of hydropower stations on the Citarum River in series, which is located in the most upstream reaches out of three projects constructed on the river. The other hydropower stations are Cirata in just downstream of Saguling and Jatilhur in the most downstream, which were put into operation in 1988 and 1965, respectively. Saguling and Cirata were developed for power oriented and Jatilhur for multi-purposes such as irrigation, water supply, flood control and power.
3 - 47 Final Report
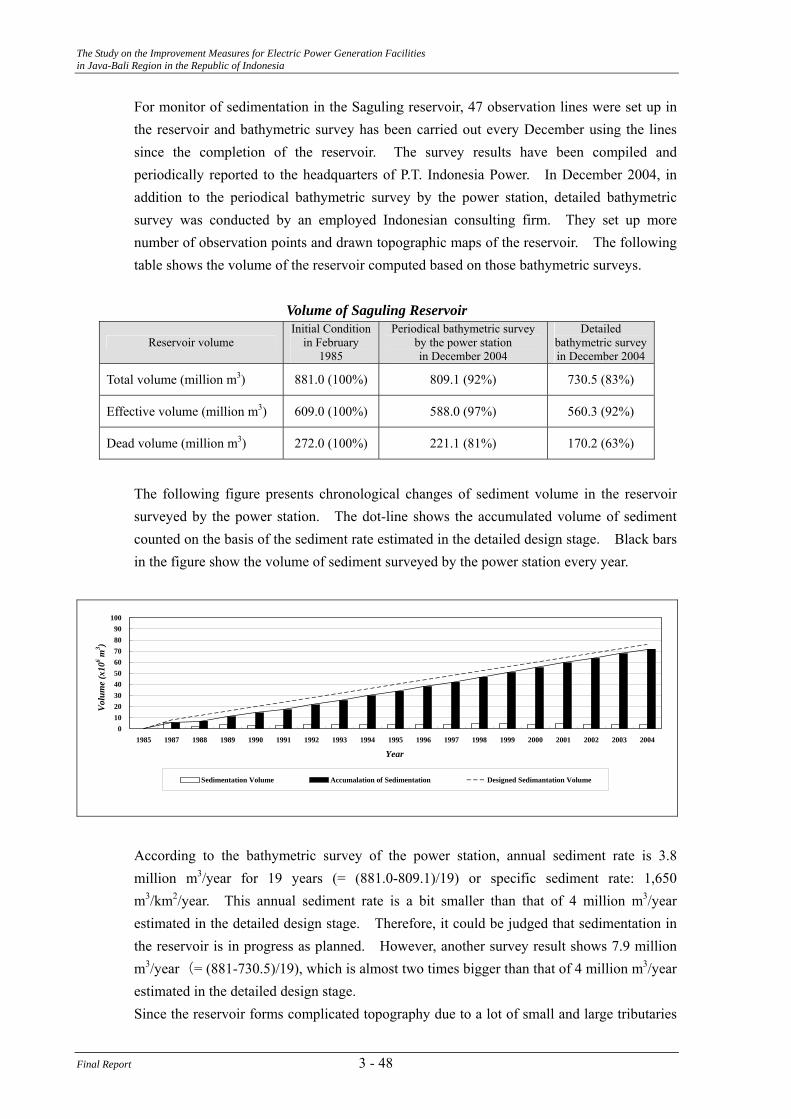
The Study on the Improvement Measures for Electric Power Generation Facilities in Java-Bali Region in the Republic of Indonesia
For monitor of sedimentation in the Saguling reservoir, 47 observation lines were set up in the reservoir and bathymetric survey has been carried out every December using the lines since the completion of the reservoir. The survey results have been compiled and periodically reported to the headquarters of P.T. Indonesia Power. In December 2004, in addition to the periodical bathymetric survey by the power station, detailed bathymetric survey was conducted by an employed Indonesian consulting firm. They set up more number of observation points and drawn topographic maps of the reservoir. The following table shows the volume of the reservoir computed based on those bathymetric surveys.
Volume of Saguling Reservoir
Reservoir volume Initial Condition
in February 1985
Periodical bathymetric survey by the power station in December 2004
Detailed bathymetric survey in December 2004
Total volume (million m3) 881.0 (100%) 809.1 (92%) 730.5 (83%)
Effective volume (million m3) 609.0 (100%) 588.0 (97%) 560.3 (92%)
Dead volume (million m3) 272.0 (100%) 221.1 (81%) 170.2 (63%)
The following figure presents chronological changes of sediment volume in the reservoir surveyed by the power station. The dot-line shows the accumulated volume of sediment counted on the basis of the sediment rate estimated in the detailed design stage. Black bars in the figure show the volume of sediment surveyed by the power station every year.
0102030405060708090
100
1985 1987 1988 1989 1990 1991 1992 1993 1994 1995 1996 1997 1998 1999 2000 2001 2002 2003 2004
Year
Vol
ume
(x10
6 m3 )
Sedimentation Volume Accumalation of Sedimentation Designed Sedimantation Volume
According to the bathymetric survey of the power station, annual sediment rate is 3.8 million m3/year for 19 years (= (881.0-809.1)/19) or specific sediment rate: 1,650 m3/km2/year. This annual sediment rate is a bit smaller than that of 4 million m3/year estimated in the detailed design stage. Therefore, it could be judged that sedimentation in the reservoir is in progress as planned. However, another survey result shows 7.9 million m3/year(= (881-730.5)/19), which is almost two times bigger than that of 4 million m3/year estimated in the detailed design stage. Since the reservoir forms complicated topography due to a lot of small and large tributaries
Final Report 3 - 48
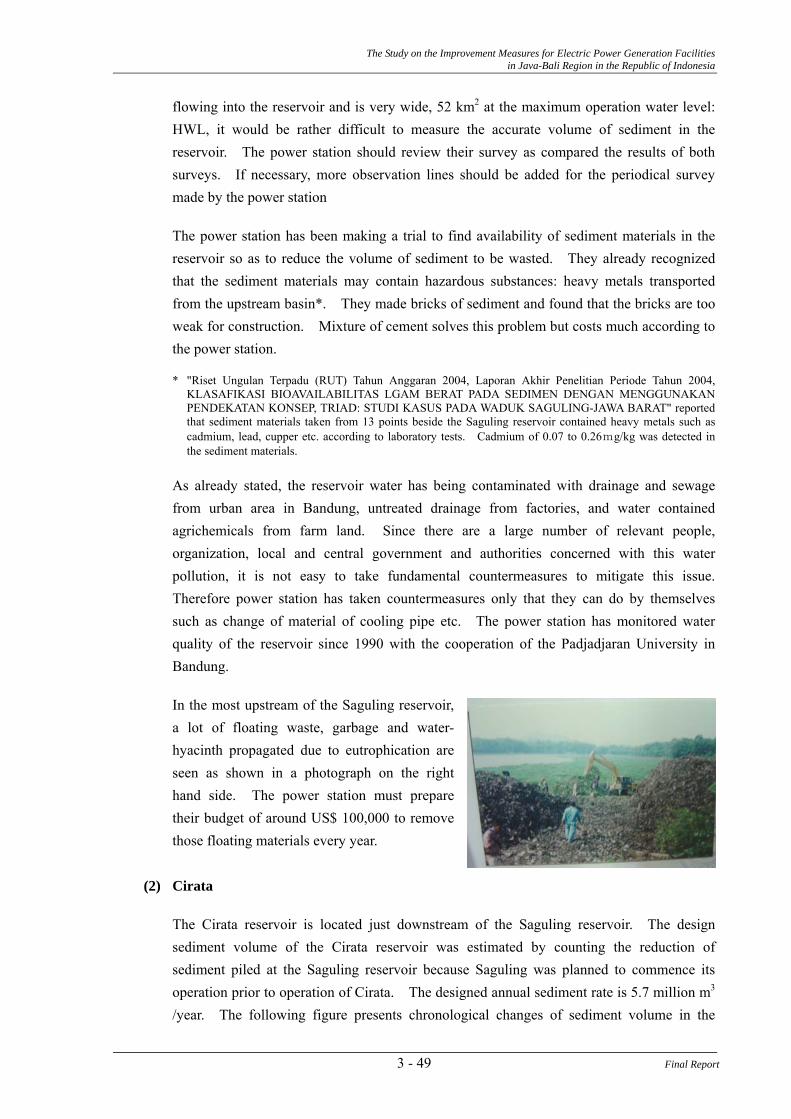
The Study on the Improvement Measures for Electric Power Generation Facilities in Java-Bali Region in the Republic of Indonesia
flowing into the reservoir and is very wide, 52 km2 at the maximum operation water level: HWL, it would be rather difficult to measure the accurate volume of sediment in the reservoir. The power station should review their survey as compared the results of both surveys. If necessary, more observation lines should be added for the periodical survey made by the power station
The power station has been making a trial to find availability of sediment materials in the reservoir so as to reduce the volume of sediment to be wasted. They already recognized that the sediment materials may contain hazardous substances: heavy metals transported from the upstream basin*. They made bricks of sediment and found that the bricks are too weak for construction. Mixture of cement solves this problem but costs much according to the power station. * "Riset Ungulan Terpadu (RUT) Tahun Anggaran 2004, Laporan Akhir Penelitian Periode Tahun 2004,
KLASAFIKASI BIOAVAILABILITAS LGAM BERAT PADA SEDIMEN DENGAN MENGGUNAKAN PENDEKATAN KONSEP, TRIAD: STUDI KASUS PADA WADUK SAGULING-JAWA BARAT" reported that sediment materials taken from 13 points beside the Saguling reservoir contained heavy metals such as cadmium, lead, cupper etc. according to laboratory tests. Cadmium of 0.07 to 0.26mg/kg was detected in the sediment materials.
As already stated, the reservoir water has being contaminated with drainage and sewage from urban area in Bandung, untreated drainage from factories, and water contained agrichemicals from farm land. Since there are a large number of relevant people, organization, local and central government and authorities concerned with this water pollution, it is not easy to take fundamental countermeasures to mitigate this issue. Therefore power station has taken countermeasures only that they can do by themselves such as change of material of cooling pipe etc. The power station has monitored water quality of the reservoir since 1990 with the cooperation of the Padjadjaran University in Bandung.
In the most upstream of the Saguling reservoir, a lot of floating waste, garbage and water- hyacinth propagated due to eutrophication are seen as shown in a photograph on the right hand side. The power station must prepare their budget of around US$ 100,000 to remove those floating materials every year.
(2) Cirata
The Cirata reservoir is located just downstream of the Saguling reservoir. The design sediment volume of the Cirata reservoir was estimated by counting the reduction of sediment piled at the Saguling reservoir because Saguling was planned to commence its operation prior to operation of Cirata. The designed annual sediment rate is 5.7 million m3 /year. The following figure presents chronological changes of sediment volume in the
3 - 49 Final Report
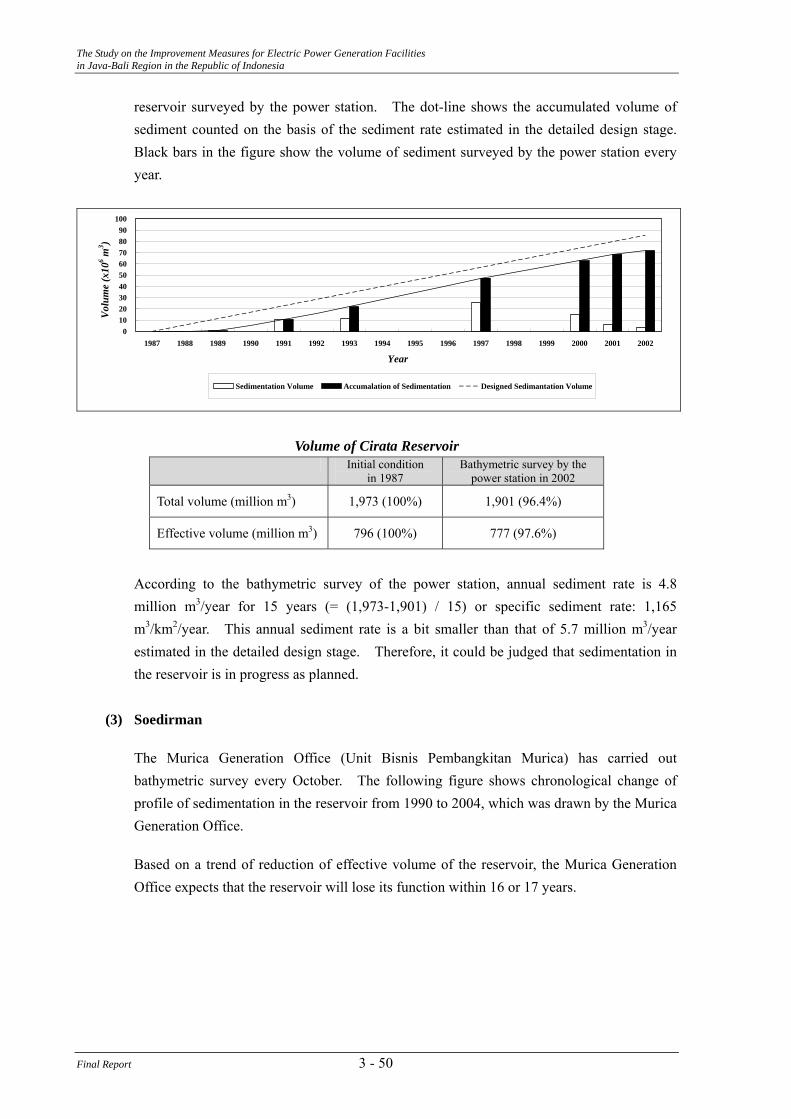
The Study on the Improvement Measures for Electric Power Generation Facilities in Java-Bali Region in the Republic of Indonesia
reservoir surveyed by the power station. The dot-line shows the accumulated volume of sediment counted on the basis of the sediment rate estimated in the detailed design stage. Black bars in the figure show the volume of sediment surveyed by the power station every year.
0102030405060708090
100
1987 1988 1989 1990 1991 1992 1993 1994 1995 1996 1997 1998 1999 2000 2001 2002
Year
Vol
ume
(x10
6 m3 )
Sedimentation Volume Accumalation of Sedimentation Designed Sedimantation Volume
Volume of Cirata Reservoir Initial condition
in 1987 Bathymetric survey by the
power station in 2002
Total volume (million m3) 1,973 (100%) 1,901 (96.4%)
Effective volume (million m3) 796 (100%) 777 (97.6%)
According to the bathymetric survey of the power station, annual sediment rate is 4.8 million m3/year for 15 years (= (1,973-1,901) / 15) or specific sediment rate: 1,165 m3/km2/year. This annual sediment rate is a bit smaller than that of 5.7 million m3/year estimated in the detailed design stage. Therefore, it could be judged that sedimentation in the reservoir is in progress as planned.
(3) Soedirman
The Murica Generation Office (Unit Bisnis Pembangkitan Murica) has carried out bathymetric survey every October. The following figure shows chronological change of profile of sedimentation in the reservoir from 1990 to 2004, which was drawn by the Murica Generation Office.
Based on a trend of reduction of effective volume of the reservoir, the Murica Generation Office expects that the reservoir will lose its function within 16 or 17 years.
Final Report 3 - 50
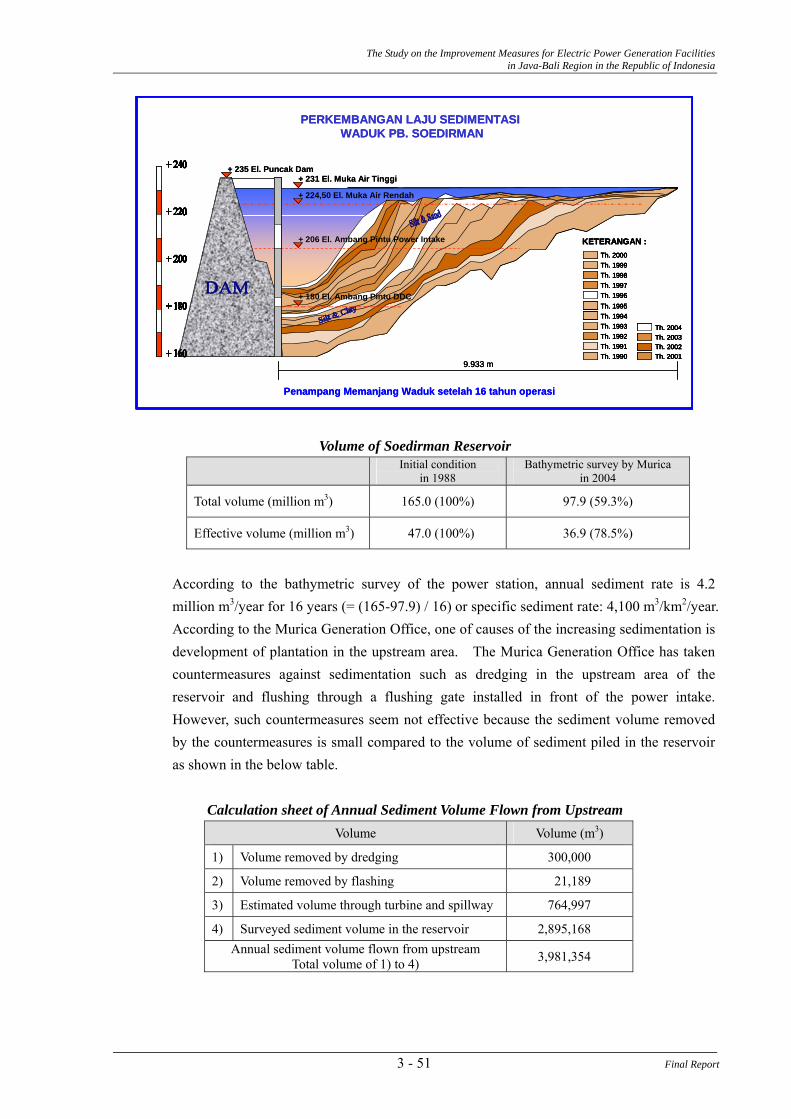
The Study on the Improvement Measures for Electric Power Generation Facilities in Java-Bali Region in the Republic of Indonesia
+ 231 El. Muka Air Tinggi
+ 224,50 El. Muka Air Rendah
+ 206 El. Ambang Pintu Power Intake
+ 180 El. Ambang Pintu DDC
+ 235 El. Puncak Dam
9.933 m
Penampang Memanjang Waduk setelah 16 tahun operasi
PERKEMBANGAN LAJU SEDIMENTASIWADUK PB. SOEDIRMAN
KETERANGAN :Th. 2000Th. 1999Th. 1998Th. 1997Th. 1996Th. 1995Th. 1994Th. 1993Th. 1992Th. 1991Th. 1990 Th. 2001
Th. 2002Th. 2003Th. 2004
+ 231 El. Muka Air Tinggi
+ 224,50 El. Muka Air Rendah
+ 206 El. Ambang Pintu Power Intake
+ 180 El. Ambang Pintu DDC
+ 235 El. Puncak Dam
9.933 m9.933 m
Penampang Memanjang Waduk setelah 16 tahun operasi
PERKEMBANGAN LAJU SEDIMENTASIWADUK PB. SOEDIRMAN
KETERANGAN :Th. 2000Th. 1999Th. 1998Th. 1997Th. 1996Th. 1995Th. 1994Th. 1993Th. 1992Th. 1991Th. 1990 Th. 2001
Th. 2002Th. 2003Th. 2004
KETERANGAN :Th. 2000Th. 1999Th. 1998Th. 1997Th. 1996Th. 1995Th. 1994Th. 1993Th. 1992Th. 1991Th. 1990
KETERANGAN :Th. 2000Th. 1999Th. 1998Th. 1997Th. 1996Th. 1995Th. 1994Th. 1993Th. 1992Th. 1991Th. 1990
Th. 2000Th. 1999Th. 1998Th. 1997Th. 1996Th. 1995Th. 1994Th. 1993Th. 1992Th. 1991Th. 1990 Th. 2001
Th. 2002Th. 2003Th. 2004
Th. 2001Th. 2001Th. 2002Th. 2002Th. 2003Th. 2003Th. 2004Th. 2004
Volume of Soedirman Reservoir Initial condition Bathymetric survey by Murica
in 2004 in 1988
Total volume (million m3) 165.0 (100%) 97.9 (59.3%)
Effective volume (million m3) 47.0 (100%) 36.9 (78.5%)
According to the bathymetric survey of the power station, annual sediment rate is 4.2 million m3/year for 16 years (= (165-97.9) / 16) or specific sediment rate: 4,100 m3/km2/year. According to the Murica Generation Office, one of causes of the increasing sedimentation is development of plantation in the upstream area. The Murica Generation Office has taken countermeasures against sedimentation such as dredging in the upstream area of the reservoir and flushing through a flushing gate installed in front of the power intake. However, such countermeasures seem not effective because the sediment volume removed by the countermeasures is small compared to the volume of sediment piled in the reservoir as shown in the below table.
Calculation sheet of Annual Sediment Volume Flown from Upstream Volume Volume (m3)
1) Volume removed by dredging 300,000
2) Volume removed by flashing 21,189
3) Estimated volume through turbine and spillway 764,997
4) Surveyed sediment volume in the reservoir 2,895,168 Annual sediment volume flown from upstream 3,981,354 Total volume of 1) to 4)
3 - 51 Final Report
The Study on the Improvement Measures for Electric Power Generation Facilities in Java-Bali Region in the Republic of Indonesia
Only sand and coarser materials of sediment dredged from the reservoir is available for construction materials. The others are dumped. However, according to the Murica Generation Office, it has become difficult to find new dump areas near the reservoir.
Reference Manual made by the Consultant in the design stage said that the life span of the reservoir would be 30 to 60 years. The Consultant probably expected high rate of sediment volume in future. The Manual also instructs that the flushing gate should firstly open when spilled water is expected.
(4) Sutami
The Sutami hydropower station was developed on the Brantas River with catchment area of 11,800 km2 which is the second largest in Indonesia. The Brantas River flows from the Malang region winding clockwise around the foot of volcanic mountains such as Mt. Arjuno, Mt. Kawi, Mt. Kelud. Since the Brantas flows through such volcanic areas, annual sediment yield of the basin is rather large.
The situation of the Sutami reservoir is reported in "The Study on Comprehensive Management Plan for the Water Resources of the Brantas River Basin in the Republic of Indonesia, December 1996, JICA". According to this report, almost half of the Sutami reservoir was already filled with sediment for 25 years after completion of the reservoir.
Volume of Sutami Reservoir
Initial condition in 1972
Bathymetric survey by Brantas Office in August 1997
Total volume (million m3) 343.00 (100%) 183.42 (53.5%)
Effective volume (million m3) 253.00 (100%) 146.63 (58.0%)
The report also said that reservoir sedimentation had proceeded by the annual sediment rate of 7 million m3/year (3,410 m3/km2/year) since completion of the reservoir and declined for 5 years since 1988 when the Sengguruh pondage was constructed at the upstream of Sutami. However, the sedimentation in the Sutami reservoir has been in progress since the Sengguruh pondage became almost full.
The Brantas River has urban area in its most upstream basin that is Malang, 8th largest city in Indonesia. Therefore, like Citarum River, the Brantas River seems to be suffering from water pollution. As shown in the following photographs, a lot of floating waste, garbage and water-hyacinth propagated due to eutrophication are seen in the Sengguruh pondage.
These reservoir, pondage and spillways are owned and managed by PJT (Perum Jasa Tirta), which is responsible for management of water resources in the Brantas River Basin.
Final Report 3 - 52
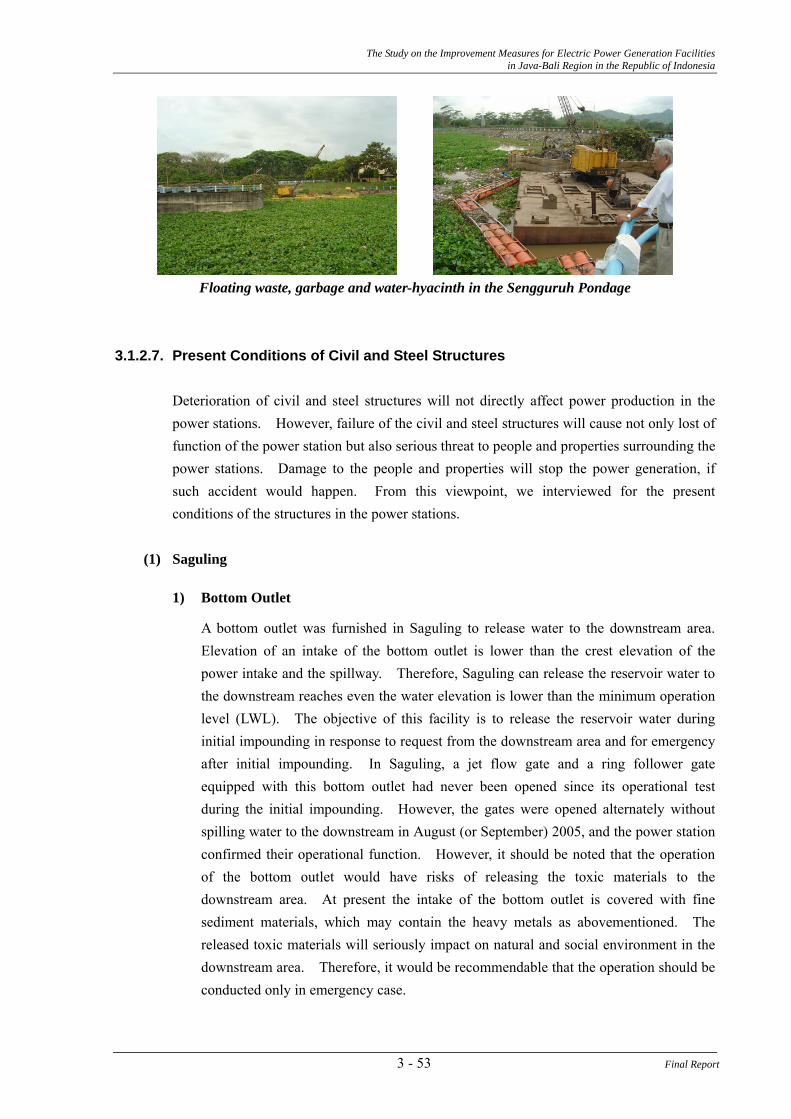
The Study on the Improvement Measures for Electric Power Generation Facilities in Java-Bali Region in the Republic of Indonesia
Floating waste, garbage and water-hyacinth in the Sengguruh Pondage
3.1.2.7. Present Conditions of Civil and Steel Structures
Deterioration of civil and steel structures will not directly affect power production in the power stations. However, failure of the civil and steel structures will cause not only lost of function of the power station but also serious threat to people and properties surrounding the power stations. Damage to the people and properties will stop the power generation, if such accident would happen. From this viewpoint, we interviewed for the present conditions of the structures in the power stations.
(1) Saguling
1) Bottom Outlet
A bottom outlet was furnished in Saguling to release water to the downstream area. Elevation of an intake of the bottom outlet is lower than the crest elevation of the power intake and the spillway. Therefore, Saguling can release the reservoir water to the downstream reaches even the water elevation is lower than the minimum operation level (LWL). The objective of this facility is to release the reservoir water during initial impounding in response to request from the downstream area and for emergency after initial impounding. In Saguling, a jet flow gate and a ring follower gate equipped with this bottom outlet had never been opened since its operational test during the initial impounding. However, the gates were opened alternately without spilling water to the downstream in August (or September) 2005, and the power station confirmed their operational function. However, it should be noted that the operation of the bottom outlet would have risks of releasing the toxic materials to the downstream area. At present the intake of the bottom outlet is covered with fine sediment materials, which may contain the heavy metals as abovementioned. The released toxic materials will seriously impact on natural and social environment in the downstream area. Therefore, it would be recommendable that the operation should be conducted only in emergency case.
3 - 53 Final Report
The Study on the Improvement Measures for Electric Power Generation Facilities in Java-Bali Region in the Republic of Indonesia
2) Steel Penstock
Water leakage was found in March 2002 at the expansion joint of the anchor block No.3 of the penstock No.2. This leakage seemed to be caused by deterioration of the seal packing and the power station replaced it with new one. As the result, no more leakage have not seen at this expansion joint.
3) Monitoring
Instruments were installed in the dam body and main excavated slopes to monitor their behavior and stability during and after construction. The bathymetric survey in the reservoir is one of the monitoring activities. The monitoring has been carried out and reported to the head office following a manual made in the construction stage. According to the monitoring report in 2004, quantities of seepage measured at the foot of dam downstream slope are ranging from 122 litter per minute in October to 455 in April. Since the quantity measured in dry season does not include rainfall fallen on the dam downstream slope, 122 litter per minute or 2.0 litter per second might be actual volume of seepage from the dam body. This volume in October 2004 seems small. However it had better confirm if this 122 litter per minute is larger or smaller than the seepage in the previous year and know the tendency of seepage volume in the long term, which is one of essential point in the monitoring. Once the tendency is observed it might easily detect some abnormal behavior by the periodical monitoring. Some instruments have already been out of order. Most instruments of them have finished their roles and are not necessary to be replaced with new ones. However, some monitoring had better be continued such as seepage monitoring, a target survey to measure movement of the dam body and observation of earthquake. Those are fundamental monitoring items to observe the behavior/stability of the dam and to confirm the safety.
4) Telemetering System
A telemetering system was set up in the construction stage, which linked Saguling and DPMA in Bandung, which is a institute under the Ministry of Public Works. The system was designed to control a flood effectively and generate power efficiently by instantaneously remitting the rainfall and discharge data in the upstream area to the power station. At present the data from the upstream area is sent to only the power station and stored in a UPPO management computer system developed by the power station.
(2) Cirata
1) Monitoring
The situation is similar to Saguling. They have continued their periodical monitoring
Final Report 3 - 54
The Study on the Improvement Measures for Electric Power Generation Facilities in Java-Bali Region in the Republic of Indonesia
and reported to the head office periodically as stated in a manual. Although there had been only annual monitoring reports without evaluation on behavior and stability of the structures, Cirata is conducting Major Inspection for Cirata Dam by the regulation of the Ministry of Public Works, by which large dams are obliged to carry out such inspection every 5 years. In this connection, Cirata is compiling their long-term monitoring record and evaluating the safety of the structures. According to the regulation, they are finally requested to ask approval of Dam Safety Committee consisting of experts called by the Ministry of Public Works. At present Cirata has restored the monitoring equipment installed in a cavern of the underground powerhouse and continued their measurement with a new recording system to monitor the behavior and stability of the cavern.
2) Seismograph
Four (4) sets of seismograph installed in the dam body and the dam foundation have been broken in Cirata. Objectives of the seismographs are to examine effect to the dam body due to earthquake by indicating scale of acceleration of the dam and to record the behavior of the dam by the earthquake for design of dams in future. Especially, the Cirata dam is unique type in Indonesia, namely Concrete Facing Rockfill Dam: CFRD. For these objectives, early restoration of the seismographs is preferable.
3) Downstream Warning System
A downstream warning system has been out of order since April 2004. The system was installed to warn people in the downstream area not to approach the river when the power station starts operation or opening the spillway gates in order to avoid an accident due to sudden increase and rapid river flow. Power discharge at present is 1,080 m3/s, which is two times bigger than the previous power discharge and similar to flood scale since 1996 due to the additional installation of power facilities. It is recommendable to restore the downstream warning system as soon as possible to avoid an accident in the downstream reaches.
4) Telemtering System
Although rainfall and water level gauging stations distributed in the basin are working at present, a system to send the record to the power station by radio has been out of order. Early restoration is desirable because the system will assist the power station in effective flood control and effective power generation.
(3) Soedirman
Monitoring record has been compiled and reported to the head office every year. According to the power station, no abnormal behavior has been reported. For example,
3 - 55 Final Report
The Study on the Improvement Measures for Electric Power Generation Facilities in Java-Bali Region in the Republic of Indonesia
volume of seepage of the dam is 300 litter per minute in wet season and zero in dry season. The downstream warning system was replaced in 1999 and has been functioning. Although telemetering system has been out of order, three (3) water level gauging stations and three (3) rainfall gauging stations are working and the record has periodically been sent to the power station.
(4) Sutami
No information is available regarding the civil and steel structures so far because the dam and its auxiliary facilities are owned and managed by PJT (Perum Jasa Tirta).
Final Report 3 - 56
![Environmental Report 2016 - メック株式会社 wastewater treatment facilities to the Safety & Sanitation Committee [R & D Center] 30 proposals for measures to reduce environmental](https://img.pdfslide.tips/doc/110x75/5b09fd227f8b9a45518b8eac/environmental-report-2016-wastewater-treatment-facilities.jpg)