Embed Size (px)
Citation preview
Research ArticleProjecting Future Climate Change ScenariosUsing Three Bias-Correction Methods
Donghyuk Kum1 Kyoung Jae Lim1 Chun Hwa Jang1 Jichul Ryu2 Jae E Yang3
Seong Joon Kim4 Dong Soo Kong5 and Younghun Jung1
1Department of Regional Infrastructure Engineering Kangwon National University Chuncheon Gangwon 200-701 Republic of Korea2National Institute of Environmental Research Incheon 404-708 Republic of Korea3Department of Biological Environment Kangwon National University Chuncheon Gangwon 200-701 Republic of Korea4Department of Civil amp Environmental System Engineering Konkuk University Seoul 143-701 Republic of Korea5Department of Life Science Kyonggi University Suwon 443-760 Republic of Korea
Correspondence should be addressed to Younghun Jung jungyounghungmailcom
Received 22 August 2014 Revised 8 November 2014 Accepted 25 November 2014 Published 14 December 2014
Academic Editor Klaus Dethloff
Copyright copy 2014 Donghyuk Kum et alThis is an open access article distributed under theCreativeCommonsAttribution Licensewhich permits unrestricted use distribution and reproduction in any medium provided the original work is properly cited
We performed bias correction in future climate change scenarios to provide better accuracy of models through adaptation to futureclimate changeThe proposed combination of the change factor (CF) and quantilemapping (QM)methods combines the individualadvantages of bothmethods for adjusting the bias in global circulationmodels (GCMs) and regional circulationmodels (RCMs)Weselected a study site in Songwol-dong Seoul Republic of Korea to test and assess our proposed method Our results show that thecombined CF + QMmethod delivers better performance in terms of correcting the bias in GCMsRCMs than when both methodsare applied individually In particular our proposed method considerably improved the bias-corrected precipitation by capturingboth the high peaks and amounts of precipitation as compared to that from the CF-only andQM-onlymethodsThus our proposedmethod can provide high-accuracy bias-corrected precipitation data which could prove to be highly useful in interdisciplinarystudies across the world
1 Introduction
With the increase in industrialization around the worldthe quality of human life has improved in various aspectsthrough advancement in scientific technology profession-alism in occupations level of consumption and so forthHowever these improvements have caused an excessive useof fossil fuels (coal petroleum natural gas etc) [1] and anincrease in global temperatures triggered by the increase ingreenhouse gases (carbon dioxide nitrogen dioxide etc) inthe troposphere [2]
In general human activity in agriculture industry andcommerce influences global ecosystems through factors suchas aerosol effects land use change and deforestation Thiscan lead to negative impacts such as increase in air tem-perature and changes in precipitation patterns [3] whichmainly influence climate change globally [4] According tothe 4th Assessment Report (AR4) Intergovernmental Panel
on Climate Change (IPCC) [5] the number of days withprecipitation and flood occurrence frequencies has steadilyand gradually increased due to unusual climate changesindicating that natural disasters will occur more frequentlyand intensely in the future than before [5]
Republic of Korea has mountainous terrain acrossapproximately 70of its area andmore than 70of the coun-tryrsquos precipitation occurs during the summer period (Julyto September) [6] Thus significant amount of water fromrainfall is usually discharged into streams as direct runoffand the topographical characteristics of the land aid thisdischarge Republic of Korea has suffered from both frequentfloods aided by the direct runoff in the summer period anddroughts caused by water scarcity due to unbalanced rainfallduring the crop growing seasons These repetitive naturaldisasters have caused great economic losses and uncertaintiesin sustainable water resources management plans across thecountry every year [7]
Hindawi Publishing CorporationAdvances in MeteorologyVolume 2014 Article ID 704151 12 pageshttpdxdoiorg1011552014704151
2 Advances in Meteorology
For these reasons the Korean government has beenstriving to reduce the potential risks (ie drought floodetc) of effects from climate change and recently suggestedthe Four Major Rivers Restoration Project as one solution[8] In order to verify the effects of this project at thefield level various factors such as the dynamic interactionsbetween meteorological and hydrological processes acrossthe land surface rainfall-runoff processes seasonal weatherpredictions ecosystem dynamics and alteration and regionalcharacteristics need to be studied
In Republic of Korea Korea Meteorological Administra-tion (KMA) provides weather predictions based on variousclimate change scenarios [3] Kim et al [9] and Lee et al[10] assessed flood vulnerability at watershed-scales usingKMA-based climate predictions Kwon et al [11] explored theboundary changes in a subtropical climate region (Republicof Korea) using the A1B emission scenario Park et al [12]evaluated the impacts of climate change on river water qualityat the Chungju-dam watershed using a soil water assessmenttool (SWAT) [13] model These studies show that climatechange scenarios have been used to predict and assess long-term sustainable development and management of waterresources
The use of weather prediction has been steadily increas-ing but global circulation models (GCMs)regional scalemodels (RCMs) provided by the KMA still have limita-tions for application at localregional scales due to thediscrepancy in scale between GCMsRCMs and field-scale(or modeling) resolutions [14] These drawbacks may causelarge uncertainties when planning for sustainable waterresources management for the future For these reasons biasin the GCMsRCMs needs to be corrected by comparing theweather history of local regions
Currently several bias-correction schemes such aschange factor (CF) [15] quantile mapping (QM) [16] andmultiple linear regression [17] which have been developedand improved since a few decades ago exist CF is a simpledownscaling method that uses the average values of observa-tions and predictions This method is conducted by simplyscaling the average change factor to each day [18] Due toits simplicity this concept has been used in many climaterelated bias-correction applications [19ndash23]The QM schemecorrects GCMsRCMs based on the cumulative distributionfunction (CDF) with a statistically good match [24] TheQM method has been widely employed to correct the biasof GCMsRCMs (eg [18 25ndash27]) Both CF and QM havetheir main advantage in that the statistical approach to biascorrections has better computational efficiency than otherphysical-based approaches [18 23] However bias correctionusing the CF method changes only the average maximaand minima of the climatic index in scenarios while all theother properties such as the number of wetdry days and thevariance of temperature remain unchanged [28 29] QM haslimitations in capturing extreme values beyond the range ofobservations (eg [24 30]) Since CF andQMboth have theiradvantagesdisadvantages for bias correction a linkedCF andQM approach that can overcome both of their disadvantagesmay perform better in correcting GCMRCM data to getthem closer to historical observations
0
500
1000
1500
2000
2500
1971
1973
1975
1977
1979
1981
1983
1985
1987
1989
1991
1993
1995
1997
1999
2001
2003
Prec
ipita
tion
(mm
)
Year
ObservationScenario before bias correctionScenario after bias correction
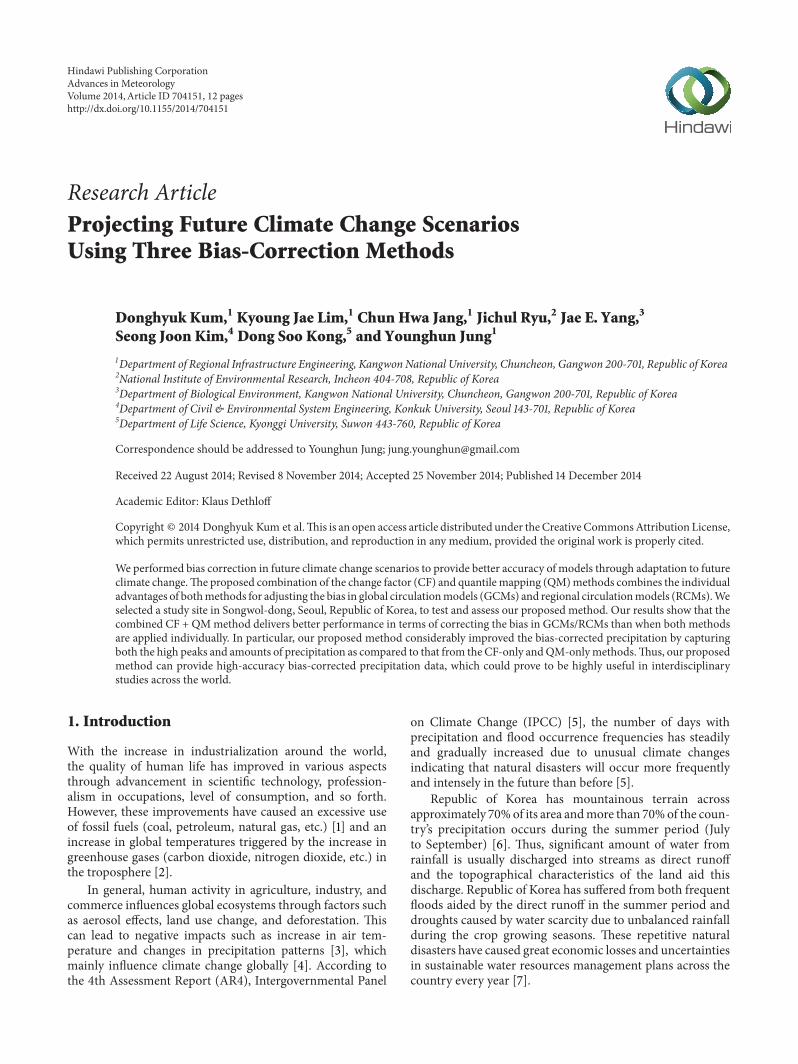
Figure 1 Bias correction using the change factor
Thus we explored an enhanced bias-correction approachfor improving the applicability of GCMs and RCMs to localregions The objectives of this study were twofold (1) topropose an enhanced bias-correction method linking CFand QM and (2) to assess the performance of our approachat field level Our proposed approach can be substantiallymore useful for providing realistic bias-correctedGCMRCMprojections that are closer to the weather history and forcreation and implementation of sustainable long-term waterresources management plans for the future
2 Experimental Section
21 Literature Review
211 Bias-Correction Methods The change factor (CF)method has been widely used for bias corrections because ofits simplified approach Equation (1) describes how the CFcorrects the bias between observations and predictions
1198751015840
RCMfut = 119875RCM times (119875meashis
119875RCMhis) (1)
where 1198751015840RCMfut is the transformed future precipitation 119875RCMis the predicted future precipitation 119875meashis is the averageof observed precipitation and 119875RCMhis is the average ofhistorical A1B precipitation
The CF approach calculates the average values of themonthlyyearly observations and predictions Then the CFestimates the bias-correction coefficients indicating the dif-ferences between the observations and predictions and shiftsthe predicted results to the observation data based on thecalculated coefficients (Figure 1)
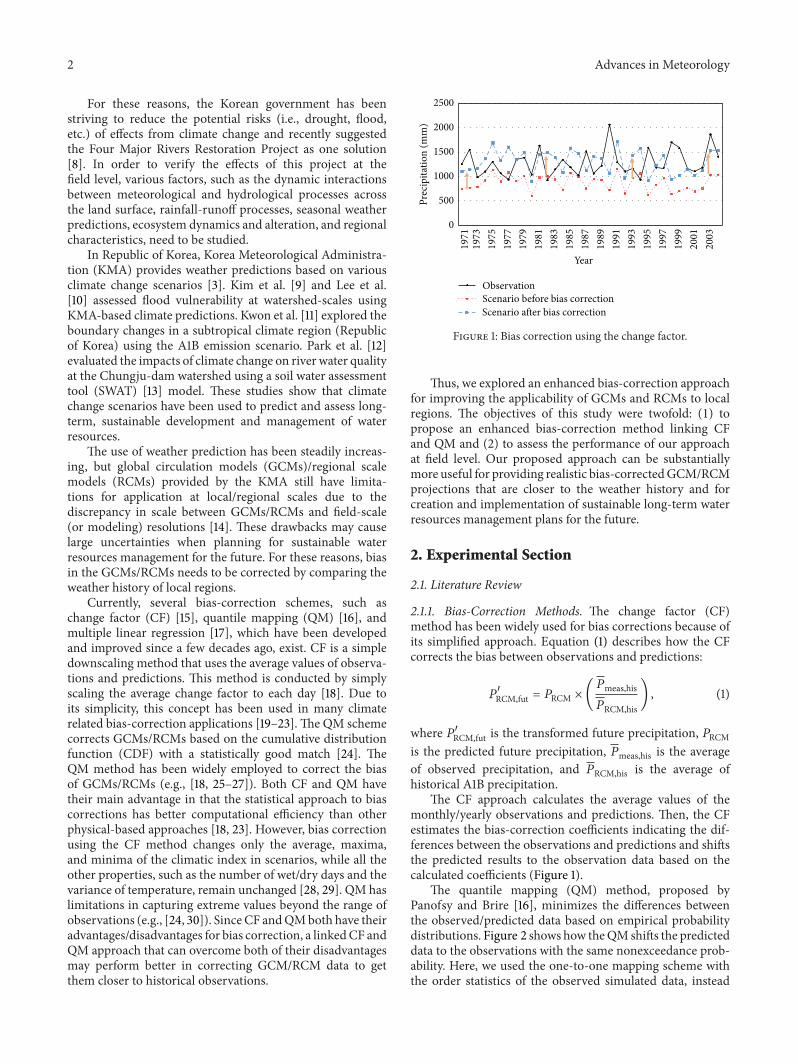
The quantile mapping (QM) method proposed byPanofsy and Brire [16] minimizes the differences betweenthe observedpredicted data based on empirical probabilitydistributions Figure 2 shows how theQMshifts the predicteddata to the observations with the same nonexceedance prob-ability Here we used the one-to-one mapping scheme withthe order statistics of the observed simulated data instead
Advances in Meteorology 3
0010203040506070809
1
0 50 100 150 200 250 300 350 400 450
CDF
Observation
0
02
04
06
08
1
0 50 100 150 200 250 300 350 400 450
CDF
Simulation
Figure 2 Schematics of the quantile mapping method
of fitting the mathematical model based on the cumulativedistribution functions
119875 (119886 le 119909 le 119887) = sum119886le119909119894lele119887
119875 (119909119894)
119865 (119909) = 119875 (119883 le 119909) = sum119883le119909119894
119875 (119909119894)
119885119894= 119865119900119894
minus1(119865119904119894(119894))
(2)
where 119865119900119894
is the cumulative distribution function of theobserved daily data for day 119894119865
119904119894is the cumulative distribution
function of the simulated data from historical simulationsand
119894and 119885
119894are the simulated and transformed (bias-
corrected) data respectively for day 119894 (2)The transformed predictions have the same probability
distributionwith the observations butQMhas a limitation ingenerating distributions on a monthly basis due to the smallamount of data points available [31ndash34]
212 Climate Change Scenarios The IntergovernmentalPanel on Climate Change (IPCC) provides past and futureweather scenarios based on various meteorological socioe-conomic and environmental data for assessing the impactsof climate changes [5] Based on these scenarios from theIPCC the KMA has generated global circulation model(GCM) and regional climate model (RCM) outputs RCMpredictions have relatively finer-scale resolutions (27 km times27 km) compared to GCMs (ie 375∘times 375∘ approximatelysim400 km)The Special Report on Emissions Scenarios (SRESthe 3rd Assessment Report) by the IPCC provides fourdifferent storylines (A1 A2 B1 and B2) based on differentdemographic social economic technological and environ-mental developments The A1B (balanced emphasis on allenergy sources) scenario is one of the most realistic futureclimate scenarios provided by the KMA
The KMA used the A1B scenario as the input datato a GCM (ECHO-G) that included the Coupled Climatemodel comprised of the Atmosphere model (ECHAM4)the Thawing-Ocean model (HOPE-G) and the Atmosphere
Ocean Coupled model (OASIS) for generating GCM sce-narios In addition high-resolution climate change scenariosin Republic of Korea were provided by the KMA using theMM5 (5th Generation Mesoscale Model) [35] based regionalclimate model (Figure 3) The KMA climate scenarios usingGCM (ECHO-G)RCM (MM5) reflect the Korean climatefeatures well [36] For this reason KMA recommends theuse and integration of their scenarios as national standardscience information in policies projects and studies relatedto climate change in Republic of Korea In this regardnumerous studies have used KMA scenarios for climatechange applications in Republic of Korea [37ndash44] Thus weselected the KMA climate change scenarios using the A1Bscenario for assessing our proposed approach
22 Materials and Method
221 Enhanced Bias-Correction Approach Linking the CF andQM Methods Both the CF and QM methods have theiradvantages and disadvantages in the bias-correction processBias-corrected (transformed) precipitation of the future willvary based on the selection of either CF or QM In gen-eral rainfall quantitiesfrequencies considerably influencethe occurrence of floodsdroughts Asmentioned in Section 1heavy rainfall eventsamounts such as the 9415mm rainfallfrom July to September in 2004 [23] have been generatedduring the summer period indicating that small uncertainties(especially for rainfall amounts) in bias-correction methodsand inherently ill-posed GCM data may lead to disastrousdamages across the country Thus these uncertainties needto be reduced for efficient water resources managementby policydecision makers Although the linked CF andQM method can contribute to a reduction in uncertaintiesin the bias-correction methods (CF or QM) the inherentuncertainty caused by drawbacks within the GCMRCMdata provided by the IPCCKMA is unavoidable To datecorrecting daily GCMRCM data is still a challenge globallyTherefore we corrected the bias of monthly (precipitation)predictions using CF and then using the QM scheme shiftedthe CF-based bias-corrected predictions to the historicalobservations as shown in Figure 4
4 Advances in Meteorology
ECHAM4(Atmosphere model)
OASIS(Atmosphere Ocean
Coupled model)
HOPE -G(Thawing-Ocean model)
GCM(ECHO-G)
MM5(Atmosphere model)
Dynamical downscaling
IPCC
SRES A1B A2 B1Greenhouse
gas scenarios
KMA climate change scenario
RCM
Figure 3 Generation of the climate predictions using the SRES A1B scenarios retrieved from KMA
222 Application of the CF QM and CF + QM Bias Correc-tion In this study the Songwol-dong site in Seoul Republicof Korea shown in Figure 5 was selected to assess the biascorrection of the A1B precipitation scenario using threemethods (CF QM and CF + QM) against the observed pre-cipitation data during a baseline period The bias-correctioncoefficients (change factors for the CFmethod and a CDF forthe QM method) obtained from the bias correction duringthe baseline period were applied to the A1B precipitationscenario Twelve change factors one for each month wereestimated and aCDFwas estimated based on the relationshipbetween the observed precipitation data and the A1B precip-itation scenario during a baseline period
For evaluation of the bias correction by the three meth-ods we divided the observation period (1983ndash2012) intotwo groups the baseline period (1983ndash1997) and the vali-dation period (1998ndash2012) We obtained the bias-correctioncoefficients of CF and QM between the A1B precipitationscenario (1983ndash1997) and the observed precipitation datathrough bias correction during a baseline period (1983ndash1997)Then the bias-correction coefficients were applied to the A1Bprecipitation scenario (1998ndash2012) for comparison with theobserved precipitation (1998ndash2012) for validation
Theweather in Republic of Korea shows seasonal changesdue to the monsoon climate For this reason we classi-fied the monthly averaged precipitation into four categories(JanuaryndashMarch AprilndashJune JulyndashSeptember and OctoberndashDecember) and assessed the bias-corrected data using thecoefficient of determination (1198772) Nash-Sutcliffe efficiency(NSE) and root mean square error (RMSE) Then we esti-mated the bias-correction coefficients of the A1B precipita-tion scenario relative to the observed precipitation data usinganother baseline period (1983 to 2012) for bias correctionof future climate change scenario We corrected the A1Bprecipitation projections for the future (2016ndash2100) based onthe derived bias-correction coefficients from 1983 to 2012 andtheir characteristicsstatistics were analyzed
The 1198772 measures the degree of collinearity betweenobservations and simulations
1198772=(sum119899
119894=1(119910obs119894 minus 119884obs) (119910sim119894 minus 119884sim))
2
sum119899
119894=1(119910obs119894 minus 119884obs)
2
sum119899
119894=1(119910sim119894 minus 119884sim)
2 (3)
where 119910obs119894 is the 119894th observation 119910sim119894 is the 119894th simulation119884obs is the mean of the observations 119884sim is the mean of thesimulations and 119899 is the total number of observations
The NSE is a normalized statistic that gives the relativemagnitude of the residual variance compared to the observedvariance [45] as shown in
NSE = 1 minus (sum119899
119894=1(119910obs119894 minus 119910sim119894)
2
sum119899
119894=1(119910obs119894 minus 119884obs)
2) (4)
where an NSE value of 1 indicates perfect agreement betweenobservations and simulations
The RMSE is one of the commonly used error indexstatistics for observed and simulated data [46] as shown in
RMSE = radicsum119899
119894=1(119910obs119894 minus 119910sim119894)
2
119899 (5)
where an RMSE of zero indicates perfect agreement betweenobservations and simulations
3 Results and Discussion
31 Evaluation of Bias Correction Using theThreeMethods InRepublic of Korea 60ndash70of the yearly precipitation amount[47] is usually generated during the summer period (July toSeptember) To be prepared for natural disasters (droughtflood etc) and ensuring sustainability of water resourcesefficient water management plans need to be formulated
Advances in Meteorology 5
RCM simulationclimate change scenarios
based on MM5 (A1B)
Baselineobserved precipitation data
Bias-correctedclimate change data based
Quantile mapping done
Linked CF + QM method
Bias-correctedclimate change data based on CF
Change factor calculated on a monthly basis (see Equation (1))
CF + QM
on a daily basis (see Equation (2))
on
Figure 4 Procedure of the linked CF + QMmethod for bias corrections
Table 1 Statistical analysis of the observed and bias-corrected daily precipitation for bias correction and validation
Baseline period (1983ndash1997) Validation period (1998ndash2012)CF QM CF + QM CF QM CF + QM
JanndashMar1198772 0899 0939 0914 0972 0984 0986NSE 0855 0877 0904 0939 0510 0879RMSE (mm) 1659 1527 1352 0928 2630 1306
AprndashJun1198772 0977 0991 0994 0990 0969 0983NSE 0971 0502 0993 0839 0931 0887RMSE (mm) 1817 7546 0899 4676 3067 3919
JulndashSep1198772 0958 0916 0998 0859 0852 0922
NSE 0887 0860 0998 0703 0700 0916RMSE (mm) 8166 9113 1176 17501 17579 9287
OctndashDec1198772 0975 0978 0969 0981 0990 0990
NSE 0968 0508 0966 0709 minus1708 0496RMSE (mm) 1072 4180 1097 2055 6273 2708
for the heavy rainfall period The selection of precise bias-correction methods can help in obtaining reliable projectedprecipitation changes across the Korean peninsula for thesummer period in the future which can help in mitigatingpotential risks from natural disasters
Table 1 presents the statistical analysis of the bias-corrected precipitation using the three methods The bias-corrected precipitation results of the combined CF + QMmethod were considerably improved for baseline period(1983ndash1997) and validation period (1998ndash2012) as comparedto those of the CF-only or QM-only methods however there
were no significant differences between the results of the CFQM and CF + QM methods for the dry seasons (Januaryto March April to June and October to December) The CFmethod overestimated the bias-corrected A1B precipitationscenarios as compared to the baseline precipitation datawhile the bias-corrected precipitation by the QM scheme wasunderestimated for baseline and validation periods The factthat the CF + QM method performed better at correctingthe A1B precipitation scenarios relative to the baseline pre-cipitation data for the bias correction and validation of thesummer period (July to September) supports the robustness
6 Advances in Meteorology
Figure 5 Location of the Songwol-dong site in Republic of Korea
of our proposed bias-correction method (combined CF +QM) for application to heavy rainfall seasons Even thoughuncertainties exist in the bias correctionvalidation periodsthe bias-corrected results of the CF + QM method are closerto the observations than those of the CF-only or QM-onlymethods as shown in Figures 6 and 7
32 Bias Corrections of the A1B Precipitation Projections forthe Future Since the CF + QMmethod showed good resultsin validation we corrected the A1B precipitation scenariofrom 1983 to 2100 at the identical region Note that weconducted bias correction using the three methods for thecomparison using the baseline precipitation forcings (1983 to2012) and then the bias-correction coefficients were appliedto the precipitation projections from 2016 to 2100
Figure 8 shows the comparison of the observations andtransformed (bias-corrected) predictions based on the threemethods Comparison of the results of the CF QM andCF + QM methods shows that the monthly distribution ofthe transformed daily precipitation (5th25th50th75th95thpercentiles and mean) from the QM is considerably differentfrom the observations These results imply that the QM islimited in correcting monsoon climatic predictions becauseintensive rainfall frequenciesamounts during heavy rainfallperiods might cause over-underestimations in correctingbias
The results of the CF and CF + QM methods havesimilar distributions as shown in Figure 8 The CF methodperformed better in correcting the bias of the monthlyprecipitation data but the CF had a limitation in that itwas highly dependent on the distribution of the predictedprecipitation data
Table 2 shows the comparison of the monthly maximumprecipitation data from the observations and transformeddata using the CF and CF +QMmethodsWith respect to themonthly observation of 11310mm (the monthly maximumprecipitation) in July the CFmethod generated an amount of15403mm (362 difference) while the CF + QM methodgenerated 13194mm a 167 lower deviation than the CF
Table 2 Comparison of the maximum monthly precipitation from1983 to 2012
Month Obs(mm)
CF(mm)
Diff()
CF + QM(mm)
Diff()
Jan 622 503 minus191 549 minus117Feb 695 675 minus29 794 142Mar 1235 1002 minus189 1133 minus83Apr 1570 1456 minus73 1662 59May 2913 2224 minus237 2475 minus150Jun 4972 4611 minus73 47426 minus46Jul 11310 15403 362 13194 167Aug 12378 15356 241 12710 27Sep 6715 5062 minus246 4636 minus310Oct 2145 2044 minus47 2359 100Nov 1545 1040 minus327 1187 minus232Dec 714 673 minus57 743 41
However the monthly averages of the observed and trans-formed precipitation data in July were identical at 425mm(Figure 8) In August the maximum precipitation using theCF method was 15356mm (241 difference as comparedwith the observedmaximumprecipitation of 12378mm) Onthe contrary the CF + QM method generated a monthlymaximum precipitation of 12710mm a difference of only27 as compared with the observation data (Table 2)
Table 3 shows the number of dayswith the statistics (max-imum and minimum sum average and standard deviation)of the weather history and the bias-correcteduncorrectedpredictions The daily maximum transformed precipitationbased on the CF method is 8231mm (July 2004) whilethe maximum daily precipitation of the observation datais 3328mm The total precipitation in 2004 was 1020mmwhich is approximately 20 less than the annual averageprecipitation in Republic of Korea The use of a correctionfactor for long periods and in dry years might overesti-mate the daily precipitation in bias correction These resultsdemonstrate that the CFmethod can yield inaccuracies whenused for dry years because correction factors may have theirlimitations in reflecting the variations in yearly precipitationdata The CF method corrected well the monthlyyearlyprecipitation amounts as well as the number of predictedprecipitation occurrences when compared to the baselineprecipitation data However this method showed high uncer-tainties in matching the daily outputs as shown in thestatistics (maximum average and standard deviation seeTable 2) However the proposed CF + QMmethod providedbetter bias-corrected predictions than the others because itreduced the limitations of both the CF and QMmethods
The bias-uncorrected predictions generated a total pre-cipitation amount of 68528mm for the future period (2016ndash2100) but the bias-corrected results of the CF QM andCF + QM methods were 141613mm 146637mm and140665mm respectively Although the total quantities of the
Advances in Meteorology 7
0
250
250
500
0 500Observed precipitation (mm)
11
Y = 12171x minus 19387
R2= 09577
Bias
-cor
rect
ed p
reci
pita
tion
(mm
)
(a) CF
0
250
500
2500 500
11
Y = 0756x minus 19331
R2= 09163
Bias
-cor
rect
ed p
reci
pita
tion
(mm
)
Observed precipitation (mm)
(b) QM
11
0
250
500
2500 500
Y = 10107x minus 04609
R2= 09981
Bias
-cor
rect
ed p
reci
pita
tion
(mm
)
Observed precipitation (mm)
(c) CF + QM
Figure 6 Scatter plots of the observed and bias-corrected precipitation during the heavy rain season (JulyndashSeptember) from 1983 to 1997
bias-corrected precipitation during the entire period are sim-ilar the temporal distributions of the transformed future pre-cipitation data showed large differences as shown in Figures9 10 and 11 The yearly precipitations have extremely highfrequencies from 2050 to 2070 for CF and 2070 to 2090 forQMHowever the degree of high frequencies corrected by theCF + QMmethod was relatively lower than those by the CF-only and QM-only methods as shown in the bias-correctedresults of bias correction and validation This demonstratesthat the CF + QMmethod can improve the limitations of theindividual CF and QM methods Figure 12 shows the rangesof the yearly precipitation predictions transformed by CF
QM and CF + QM with five-year intervals Figure 12 showsthat the bias-corrected predictions based on the CF + QMare usually located near the center between those of the CFand QMThus using a single bias-correction method (CF orQM) has relatively higher uncertainties in providing accuratefuture precipitation projections as compared to the combinedCF + QM method Furthermore errors incorporated withinbias-correction methods might be propagated into futureprojections that may be used by decision makers Thereforeappropriate bias-correction methods that reduce errors infuture precipitation projections should be used Our resultsshow that the CF + QM method which can improve the
8 Advances in Meteorology
11
0
500
1000
0 250 1000
Y = 12233x minus 37259
R2 = 08586Y = 12233x minus 37259
R2 = 08586
Bias
-cor
rect
ed p
reci
pita
tion
(mm
)
Observed precipitation (mm)
(a) CF
11
0
500
1000
0 1000
Y = 05559x minus 17235
R2= 08519
Bias
-cor
rect
ed p
reci
pita
tion
(mm
)
250Observed precipitation (mm)
(b) QM
11
0
500
1000
0 1000
Y = 09604x minus 15007
R2= 09217
Bias
-cor
rect
ed p
reci
pita
tion
(mm
)
250Observed precipitation (mm)
(c) CF + QM
Figure 7 Scatter plots of the observed and validated precipitation during the heavy rain season (JulyndashSeptember) from 1998 to 2012
limitations of the CF and QM methods can be appropriatefor generating transformed precipitation data using variousclimate change scenarios
4 Conclusions
Preparations for and adaptations to climate change areplanned or ongoing throughout the world This study sug-gests a combined bias-correction (CF + QM) method thatcombines the existing CF and QM methods to help preparefor the negative effects of climate change
To assess the performance of the proposed method forbias correction for long time periods bias corrections wereconducted for the study period (1983ndash2012) for the Songwol-dong site in Republic of Korea The first 15 years (1983ndash1997)were used as a baseline period for estimating bias-correctioncoefficients and we validated three methods for the latter 15years (1998ndash2012) We classified the study period into fourcategories (JanuaryndashMarch AprilndashJune JulyndashSeptemberand OctoberndashDecember) for assessing the characteristicsof seasonality when correcting projected precipitation biasThen we testedcompared the performance of the CF-onlyQM-only and CF + QM methods for the bias correction
Advances in Meteorology 9
Prec
ipita
tion
(mm
)
0
20
40
60
80
100
120
Obs CF QM CF + QM
(a) January
Prec
ipita
tion
(mm
)
0
20
40
60
80
100
120
Obs CF QM CF + QM
(b) February
Prec
ipita
tion
(mm
)
0
50
100
150
200
Obs CF QM CF + QM
(c) March
Prec
ipita
tion
(mm
)
050
100150200250300350
Obs CF QM CF + QM
(d) April
Prec
ipita
tion
(mm
)
0100200300400500600700
Obs CF QM CF + QM
(e) May
Prec
ipita
tion
(mm
)
0100200300400500600700
Obs CF QM CF + QM
(f) June
Prec
ipita
tion
(mm
)
0200400600800
100012001400
Obs CF QM CF + QM
(g) July
Prec
ipita
tion
(mm
)
0200400600800
100012001400
Obs CF QM CF + QM
(h) August
Prec
ipita
tion
(mm
)
0100200300400500600700
Obs CF QM CF + QM
(i) September
Prec
ipita
tion
(mm
)
050
100150200250300350400
Obs CF QM CF + QM
75th percentileMean lineMedian25th percentile5th percentile
95th percentile
(j) October
Prec
ipita
tion
(mm
)
0
50
100
150
200
250
Obs CF QM CF + QM
75th percentileMean lineMedian25th percentile5th percentile
95th percentile
(k) November
Prec
ipita
tion
(mm
)
0
50
100
150
200
Obs CF QM CF + QM
75th percentileMean lineMedian25th percentile5th percentile
95th percentile
(l) December
Figure 8 Distribution of the monthly precipitation from 1983 to 2012
and validation periods Although the CF + QM methodcorrected the projected precipitation bias to the baselineprecipitation data slightly better than the others there existnolittle significant differences for the dry periods (JanuaryndashMarch AprilndashJune and OctoberndashDecember) However
the CF + QMmethod (R2 09900990 and NSE 09200916for bias correctionvalidation) considerably improved thebias-corrected precipitation during the heavy rainfall season(JulyndashSeptember) compared to the CF-only (R2 09580859and NSE 08870703 for bias correctionvalidation)
10 Advances in Meteorology
Table 3 Statistical analysis of the observed and bias-correcteduncorrected daily precipitation (1983ndash2012)
119873lowast Minlowastlowast Maxlowastlowastlowast Sumlowastlowastlowastlowast Avglowastlowastlowastlowastlowast SDlowastlowastlowastlowastlowastlowast
Observation 3293 lt1 3328 450345 137 272Before bias-correction scenario 4218 lt1 1524 215109 51 96CF 4218 lt1 8231 450335 107 307QM 3377 lt1 3328 451931 134 269CF + QM 3279 lt1 3328 448901 137 272lowastThe number of days with precipitationlowastlowastMinimum daily precipitation in mmlowastlowastlowastMaximum daily precipitation in mmlowastlowastlowastlowastSum of daily precipitation for the entire period in mmlowastlowastlowastlowastlowastAverage of daily average precipitation in mmlowastlowastlowastlowastlowastlowastStandard deviation of daily average precipitation in mm
Year2000 2020 2040 2060 2080 2100
Year
ly p
reci
pita
tion
(mm
)
0
500
1000
1500
2000
2500
3000
3500
Before bias correctionAfter bias correction
Baseline (1983ndash2012)
Figure 9 Bias-corrected yearly precipitation data using the changefactor method
Year2000 2020 2040 2060 2080 2100
Year
ly p
reci
pita
tion
(mm
)
0
500
1000
1500
2000
2500
3000
3500
Before bias correctionAfter bias correction
Baseline (1983ndash2012)
Figure 10 Bias-corrected yearly precipitation data using the quan-tile mapping method
Year2000 2020 2040 2060 2080 2100
Year
ly p
reci
pita
tion
(mm
)
0
500
1000
1500
2000
2500
3000
3500
Before bias correctionAfter bias correction
Baseline (1983ndash2012)
Figure 11 Bias-corrected yearly precipitation data using the CF +QMmethod
and QM-only (R2 09160852 and NSE 08600700 for biascorrectionvalidation) methods
After comparing the three methods for bias correctionwe derived the bias-correction coefficients using the CF-only QM-only and CF + QM methods for the entireperiod (1983ndash2012)Then we corrected the A1B precipitationscenario based on the estimated coefficients for the futureperiod (2016ndash2100) The CF + QM method gives better bias-corrected predictions with respect to statistics In partic-ular the suggested CF + QM method is appropriate formonsoon climatic conditions when torrential precipitationoccurs during the wet season Furthermore our proposedapproach can contribute to a reduction in weather predictionuncertainties and the establishment of sustainable waterresources management plans for mitigating natural disasterscaused by future climate changes We plan to extend theapplicability and accessibility of the suggested method to theweb whichwill contribute considerably to the preparation forand adaptation to uncertain climate changes
Advances in Meteorology 11
Year
Year
ly p
reci
pita
tion
(mm
)
800
1000
1200
1400
1600
1800
2000
2200
2400
2016
ndash2021
2021
ndash2026
2026
ndash2031
2031
ndash2036
2036
ndash2041
2041
ndash2046
2046
ndash2051
2051
ndash2056
2056
ndash2061
2061
ndash2066
2066
ndash2071
2071
ndash2076
2076
ndash2081
2081
ndash2086
2086
ndash2091
2091
ndash2096
2096
ndash2100
Change factor (CF)Quantile mapping (QM)CF + QM
Figure 12 Comparison of the yearly precipitation for each 5-yearinterval using the CF QM and CF + QM bias-correction methods
Conflict of Interests
The authors declare that there is no conflict of interestsregarding the publication of this paper
Acknowledgment
This research was supported by the Geo-Advanced Innova-tive Action (GAIA) Project (no RE201402074 Surface SoilResources Inventory amp Integration SSORII Research Group)in Republic of Korea
References
[1] K Aleklett ldquoReserve driven forecasts for oil gas amp coaland limits in carbon dioxide emissions Peak Oil Peak GasPeak Coal and Peak CO
2rdquo Joint Transport Research Centre
discussion paper no 2007-18 2007[2] EPA Climate Change Science Facts Office of Air and Radiation
2010[3] Korea Meteorological Administration (KMA) 2014 http
wwwkmagokr[4] IPCC Climate Change 2001 Impacts Adaptation and Vulnera-
bility Contribution of Working Group II to the Third AssessmentReport of the Intergovernmental Panel on Climate ChangeCambridge University Press Cambridge UK 2001
[5] IPCC Climate Change 2007 Impacts Adaptation and Vulnera-bility Contribution ofWorking Group II to the Fourth AssessmentReport of the Intergovernmental Panel on Climate ChangeCambridge University Press Cambridge UK 2007
[6] M H Shin Y C Shin S G Heo K J Lim and J D ChoildquoCharacteristics of nonpoint source pollutant loads from forestwatershed with various water quality sampling frequenciesrdquoJournal of the Korean Society of Agricultural Engineers vol 50no 2 pp 65ndash71 2008
[7] T J Kwon ldquoReframing sustainability in consideration of climatechange and natural hazards focusing on the US naturalhazards mitigation trend and case analysisrdquo Journal of theKorean Society of Civil Engineers vol 33 no 2 pp 801ndash810 2013
[8] B Kang J H Lee E S Chung D Kim and Y D Kim ldquoAsensitivity analysis approach ofmulti-attribute decisionmakingtechnique to rank flood mitigation projectsrdquo KSCE Journal ofCivil Engineering vol 17 no 6 pp 1529ndash1539 2013
[9] H S Kim G J Park and S D Kim ldquoAssessment of floodvulnerability considering climate change and large-scale riverrestoration projectrdquo Journal of the Korean Society of HazardMitigation vol 12 no 2 pp 107ndash113 2012
[10] M H Lee L W Jung and D H Bae ldquoKorean flood vulner-ability assessment on climate changerdquo Journal of Korea WaterResources Association vol 44 no 8 pp 653ndash666 2011
[11] Y A Kwon W T Kwon K O Boo and Y Choi ldquoFutureprojections on subtropical climate regions over South Koreausingrdquo Journal of the Korean Geographic Society vol 42 no 3pp 355ndash367 2007
[12] J Y Park M J Park S R Ahn and S J Kim ldquoWatershedmodeling for assessing climate change impact on stream waterquality of Chungju Dam watershedrdquo Journal of Korea WaterResources Association vol 42 no 10 pp 877ndash889 2009
[13] J G Arnold Spatial scale variability in model developmentand parameterization [PhD thesis] Purdue University WestLafayette Ind USA 1992
[14] M J Muerth B Gauvin St-Denis S Ricard et al ldquoOn the needfor bias correction in regional climate scenarios to assess climatechange impacts on river runoffrdquo Hydrology and Earth SystemSciences vol 17 no 3 pp 1189ndash1204 2013
[15] J Alcamo P Doll F Kaspar and S Siebert ldquoGlobal change andglobal scenarios of water use and availability an application ofWater Cap 10rdquo Report A9701 Center for Environmental SystemResearch University of Kassel Kassel Germany 1997
[16] H A Panofsy and G W Brire Some Application of Statisticsto Meteorology Pennsylvania State University University ParkPennsylvania Pa USA 1963
[17] L E Hay and M P Clark ldquoUse of statistically and dynamicallydownscaled atmospheric model output for hydrologic simula-tions in threemountainous basins in the western United StatesrdquoJournal of Hydrology vol 282 no 1ndash4 pp 56ndash75 2003
[18] H J Fowler S Blenkinsop and C Tebaldi ldquoLinking climatechange modelling to impacts studies recent advances in down-scaling techniques for hydrological modellingrdquo InternationalJournal of Climatology vol 27 no 12 pp 1547ndash1578 2007
[19] J Diaz-Nieto and R L Wilby ldquoA comparison of statisticaldownscaling and climate change factor methods Impacts onlow flows in the River Thames United Kingdomrdquo ClimaticChange vol 69 no 2-3 pp 245ndash268 2005
[20] C Prudhomme S Crooks A L Kay and N Reynard ldquoClimatechange and river flooding part 1 classifying the sensitivity ofBritish catchmentsrdquo Climatic Change vol 119 no 3-4 pp 933ndash948 2013
[21] T Sato F Kimura and A Kitoh ldquoProjection of global warmingonto regional precipitation over Mongolia using a regionalclimatemodelrdquo Journal of Hydrology vol 333 no 1 pp 144ndash1542007
[22] E Tate J Sutcliffe D Conway and F Farquharson ldquoWaterbalance of Lake Victoria update to 2000 and climate changemodelling to 2100rdquo Hydrological Sciences Journal vol 49 no 4pp 563ndash574 2004
12 Advances in Meteorology
[23] R L Wilby J Troni Y Biot et al ldquoA review of climaterisk information for adaptation and development planningrdquoInternational Journal of Climatology vol 29 no 9 pp 1193ndash12152009
[24] M J Themeszligl A Gobiet and A Leuprecht ldquoEmpirical-statistical downscaling and error correction of daily precipi-tation from regional climate modelsrdquo International Journal ofClimatology vol 31 no 10 pp 1530ndash1544 2011
[25] L Gudmundsson J B Bremnes J E Haugen and T ESkaugen ldquoTechnical note downscaling RCM precipitation tothe station scale using quantile mapping-a comparison ofmethodsrdquoHydrology and Earth System Sciences Discussions vol9 no 9 pp 6185ndash6201 2012
[26] D Maraun ldquoBias correction quantile mapping and downscal-ing revisiting the inflation issuerdquo Journal of Climate vol 26 no6 pp 2137ndash2143 2013
[27] B Thrasher E P Maurer C McKellar and P B DuffyldquoTechnical Note bias correcting climate model simulated dailytemperature extremes with quantile mappingrdquo Hydrology andEarth System Sciences vol 16 no 9 pp 3309ndash3314 2012
[28] J Chen F P Brissette D Chaumont and M Braun ldquoPer-formance and uncertainty evaluation of empirical downscal-ing methods in quantifying the climate change impacts onhydrology over two North American river basinsrdquo Journal ofHydrology vol 479 pp 200ndash214 2013
[29] F S Mpelasoka and F H S Chiew ldquoInfluence of rainfallscenario construction methods on runoff projectionsrdquo Journalof Hydrometeorology vol 10 no 5 pp 1168ndash1183 2009
[30] J Boe L Terray F Habets and E Martin ldquoStatistical anddynamical downscaling of the Seine basin climate for hydro-meteorological studiesrdquo International Journal of Climatologyvol 27 no 12 pp 1643ndash1655 2007
[31] T Hashino A A Bradley and S S Schwartz ldquoEvaluationof bias-correction methods for ensemble streamflow volumeforecastsrdquo Hydrology and Earth System Sciences vol 11 no 2pp 939ndash950 2007
[32] B Kang and S Moon ldquoRealtime streamflow prediction usingquantitative precipitation model outputrdquo Journal of the KoreanSociety of Civil Engineers vol 30 no 6b pp 579ndash587 2010
[33] L R Leung A F Hamlet D P Lettenmaier and A KumarldquoSimulations of the ENSO hydroclimate signals in the PacificNorthwest Columbia River Basinrdquo Bulletin of the AmericanMeteorological Society vol 80 no 11 pp 2313ndash2329 1999
[34] A W Wood E P Maurer A Kumar and D P Letten-maier ldquoLong-range experimental hydrologic forecasting forthe Eastern United Statesrdquo Journal of Geophysical Research DAtmospheres vol 107 no 20 pp 1ndash15 2002
[35] G A Grell J Dudhia and D R Stauffer A Description ofthe Fifth-Generation Penn StateNCARMesoscaleModel (MM5)Mesoscale and Microscale Meteorology Division 1994
[36] T Q Murdock and D L Spottlehouse ldquoSelecting and usingclimate change scenarios for British Columbiardquo in PacificClimate Impacts Consortium pp 1ndash27 University of VictoriaVictoria BC Canada 2011
[37] J H Lee andC J Kim ldquoAmultimodel assessment of the climatechange effect on the drought severity-duration-frequency rela-tionshiprdquo Hydrological Processes vol 27 no 19 pp 2800ndash28132013
[38] C J Kim M J Park and J H Lee ldquoAnalysis of climate changeimpacts on the spatial and frequency patterns of drought usinga potential drought hazard mapping approachrdquo InternationalJournal of Climatology vol 34 no 1 pp 61ndash80 2014
[39] S J Hong B S Kim and S R Ha ldquoClimate change impactassessment onHanRiver long term runoff in SouthKorea basedon RCP climate change Scenariordquo Terrestrial Atmospheric andOceanic Sciences vol 25 no 5 pp 689ndash701 2014
[40] Y Seung-Hwan C Jin-Yong L Sang-Hyun O Yun-Gyeongand Y Dong Koun ldquoClimate change impacts on water storagerequirements of an agricultural reservoir considering changesin land use and rice growing season in Koreardquo AgriculturalWater Management vol 117 pp 43ndash54 2013
[41] J Kim J Choi C Choi and S Park ldquoImpacts of changes inclimate and land useland cover under IPCC RCP scenarios onstreamflow in theHoeya River Basin Koreardquo Science of the TotalEnvironment vol 452-453 pp 181ndash195 2013
[42] T Lee and C Jeong ldquoNonparametric statistical temporaldownscaling of daily precipitation to hourly precipitation andimplications for climate change scenariosrdquo Journal ofHydrologyvol 510 pp 182ndash196 2014
[43] I W Jung D H Bae and B J Lee ldquoPossible change inKorean streamflow seasonality based on multi-model climateprojectionsrdquoHydrological Processes vol 27 no 7 pp 1033ndash10452013
[44] J-W Lee and S-Y Hong ldquoPotential for added value to down-scaled climate extremes over Korea by increased resolution ofa regional climate modelrdquoTheoretical and Applied Climatologyvol 117 no 3-4 pp 667ndash677 2013
[45] J E Nash and J V Sutcliffe ldquoRiver flow forecasting throughconceptual models part Imdasha discussion of principlesrdquo Journalof Hydrology vol 10 no 3 pp 282ndash290 1970
[46] T W Chu and A Shirmohammadi ldquoEvaluation of the SWATmodelrsquos hydrology component in the Piedmont physiographicregion of Marylandrdquo Transactions of the ASAE vol 47 no 4pp 1057ndash1073 2004
[47] Y C Shin J D Choi K J Lim et al ldquoPollutant load charac-teristics from a small mountainous agricultural watershed inthe north Han river basinrdquo Journal of the Korean Society ofAgricultural Engineers vol 47 no 6 pp 83ndash92 2005
Submit your manuscripts athttpwwwhindawicom
Hindawi Publishing Corporationhttpwwwhindawicom Volume 2014
ClimatologyJournal of
EcologyInternational Journal of
Hindawi Publishing Corporationhttpwwwhindawicom Volume 2014
EarthquakesJournal of
Hindawi Publishing Corporationhttpwwwhindawicom Volume 2014
Hindawi Publishing Corporationhttpwwwhindawicom
Applied ampEnvironmentalSoil Science
Volume 2014
Mining
Hindawi Publishing Corporationhttpwwwhindawicom Volume 2014
Journal of
Hindawi Publishing Corporation httpwwwhindawicom Volume 2014
International Journal of
Geophysics
OceanographyInternational Journal of
Hindawi Publishing Corporationhttpwwwhindawicom Volume 2014
Journal of Computational Environmental SciencesHindawi Publishing Corporationhttpwwwhindawicom Volume 2014
Journal ofPetroleum Engineering
Hindawi Publishing Corporationhttpwwwhindawicom Volume 2014
GeochemistryHindawi Publishing Corporationhttpwwwhindawicom Volume 2014
Journal of
Atmospheric SciencesInternational Journal of
Hindawi Publishing Corporationhttpwwwhindawicom Volume 2014
OceanographyHindawi Publishing Corporationhttpwwwhindawicom Volume 2014
Advances in
Hindawi Publishing Corporationhttpwwwhindawicom Volume 2014
MineralogyInternational Journal of
Hindawi Publishing Corporationhttpwwwhindawicom Volume 2014
MeteorologyAdvances in
The Scientific World JournalHindawi Publishing Corporation httpwwwhindawicom Volume 2014
Paleontology JournalHindawi Publishing Corporationhttpwwwhindawicom Volume 2014
ScientificaHindawi Publishing Corporationhttpwwwhindawicom Volume 2014
Hindawi Publishing Corporationhttpwwwhindawicom Volume 2014
Geological ResearchJournal of
Hindawi Publishing Corporationhttpwwwhindawicom Volume 2014
Geology Advances in
2 Advances in Meteorology
For these reasons the Korean government has beenstriving to reduce the potential risks (ie drought floodetc) of effects from climate change and recently suggestedthe Four Major Rivers Restoration Project as one solution[8] In order to verify the effects of this project at thefield level various factors such as the dynamic interactionsbetween meteorological and hydrological processes acrossthe land surface rainfall-runoff processes seasonal weatherpredictions ecosystem dynamics and alteration and regionalcharacteristics need to be studied
In Republic of Korea Korea Meteorological Administra-tion (KMA) provides weather predictions based on variousclimate change scenarios [3] Kim et al [9] and Lee et al[10] assessed flood vulnerability at watershed-scales usingKMA-based climate predictions Kwon et al [11] explored theboundary changes in a subtropical climate region (Republicof Korea) using the A1B emission scenario Park et al [12]evaluated the impacts of climate change on river water qualityat the Chungju-dam watershed using a soil water assessmenttool (SWAT) [13] model These studies show that climatechange scenarios have been used to predict and assess long-term sustainable development and management of waterresources
The use of weather prediction has been steadily increas-ing but global circulation models (GCMs)regional scalemodels (RCMs) provided by the KMA still have limita-tions for application at localregional scales due to thediscrepancy in scale between GCMsRCMs and field-scale(or modeling) resolutions [14] These drawbacks may causelarge uncertainties when planning for sustainable waterresources management for the future For these reasons biasin the GCMsRCMs needs to be corrected by comparing theweather history of local regions
Currently several bias-correction schemes such aschange factor (CF) [15] quantile mapping (QM) [16] andmultiple linear regression [17] which have been developedand improved since a few decades ago exist CF is a simpledownscaling method that uses the average values of observa-tions and predictions This method is conducted by simplyscaling the average change factor to each day [18] Due toits simplicity this concept has been used in many climaterelated bias-correction applications [19ndash23]The QM schemecorrects GCMsRCMs based on the cumulative distributionfunction (CDF) with a statistically good match [24] TheQM method has been widely employed to correct the biasof GCMsRCMs (eg [18 25ndash27]) Both CF and QM havetheir main advantage in that the statistical approach to biascorrections has better computational efficiency than otherphysical-based approaches [18 23] However bias correctionusing the CF method changes only the average maximaand minima of the climatic index in scenarios while all theother properties such as the number of wetdry days and thevariance of temperature remain unchanged [28 29] QM haslimitations in capturing extreme values beyond the range ofobservations (eg [24 30]) Since CF andQMboth have theiradvantagesdisadvantages for bias correction a linkedCF andQM approach that can overcome both of their disadvantagesmay perform better in correcting GCMRCM data to getthem closer to historical observations
0
500
1000
1500
2000
2500
1971
1973
1975
1977
1979
1981
1983
1985
1987
1989
1991
1993
1995
1997
1999
2001
2003
Prec
ipita
tion
(mm
)
Year
ObservationScenario before bias correctionScenario after bias correction
Figure 1 Bias correction using the change factor
Thus we explored an enhanced bias-correction approachfor improving the applicability of GCMs and RCMs to localregions The objectives of this study were twofold (1) topropose an enhanced bias-correction method linking CFand QM and (2) to assess the performance of our approachat field level Our proposed approach can be substantiallymore useful for providing realistic bias-correctedGCMRCMprojections that are closer to the weather history and forcreation and implementation of sustainable long-term waterresources management plans for the future
2 Experimental Section
21 Literature Review
211 Bias-Correction Methods The change factor (CF)method has been widely used for bias corrections because ofits simplified approach Equation (1) describes how the CFcorrects the bias between observations and predictions
1198751015840
RCMfut = 119875RCM times (119875meashis
119875RCMhis) (1)
where 1198751015840RCMfut is the transformed future precipitation 119875RCMis the predicted future precipitation 119875meashis is the averageof observed precipitation and 119875RCMhis is the average ofhistorical A1B precipitation
The CF approach calculates the average values of themonthlyyearly observations and predictions Then the CFestimates the bias-correction coefficients indicating the dif-ferences between the observations and predictions and shiftsthe predicted results to the observation data based on thecalculated coefficients (Figure 1)
The quantile mapping (QM) method proposed byPanofsy and Brire [16] minimizes the differences betweenthe observedpredicted data based on empirical probabilitydistributions Figure 2 shows how theQMshifts the predicteddata to the observations with the same nonexceedance prob-ability Here we used the one-to-one mapping scheme withthe order statistics of the observed simulated data instead
Advances in Meteorology 3
0010203040506070809
1
0 50 100 150 200 250 300 350 400 450
CDF
Observation
0
02
04
06
08
1
0 50 100 150 200 250 300 350 400 450
CDF
Simulation
Figure 2 Schematics of the quantile mapping method
of fitting the mathematical model based on the cumulativedistribution functions
119875 (119886 le 119909 le 119887) = sum119886le119909119894lele119887
119875 (119909119894)
119865 (119909) = 119875 (119883 le 119909) = sum119883le119909119894
119875 (119909119894)
119885119894= 119865119900119894
minus1(119865119904119894(119894))
(2)
where 119865119900119894
is the cumulative distribution function of theobserved daily data for day 119894119865
119904119894is the cumulative distribution
function of the simulated data from historical simulationsand
119894and 119885
119894are the simulated and transformed (bias-
corrected) data respectively for day 119894 (2)The transformed predictions have the same probability
distributionwith the observations butQMhas a limitation ingenerating distributions on a monthly basis due to the smallamount of data points available [31ndash34]
212 Climate Change Scenarios The IntergovernmentalPanel on Climate Change (IPCC) provides past and futureweather scenarios based on various meteorological socioe-conomic and environmental data for assessing the impactsof climate changes [5] Based on these scenarios from theIPCC the KMA has generated global circulation model(GCM) and regional climate model (RCM) outputs RCMpredictions have relatively finer-scale resolutions (27 km times27 km) compared to GCMs (ie 375∘times 375∘ approximatelysim400 km)The Special Report on Emissions Scenarios (SRESthe 3rd Assessment Report) by the IPCC provides fourdifferent storylines (A1 A2 B1 and B2) based on differentdemographic social economic technological and environ-mental developments The A1B (balanced emphasis on allenergy sources) scenario is one of the most realistic futureclimate scenarios provided by the KMA
The KMA used the A1B scenario as the input datato a GCM (ECHO-G) that included the Coupled Climatemodel comprised of the Atmosphere model (ECHAM4)the Thawing-Ocean model (HOPE-G) and the Atmosphere
Ocean Coupled model (OASIS) for generating GCM sce-narios In addition high-resolution climate change scenariosin Republic of Korea were provided by the KMA using theMM5 (5th Generation Mesoscale Model) [35] based regionalclimate model (Figure 3) The KMA climate scenarios usingGCM (ECHO-G)RCM (MM5) reflect the Korean climatefeatures well [36] For this reason KMA recommends theuse and integration of their scenarios as national standardscience information in policies projects and studies relatedto climate change in Republic of Korea In this regardnumerous studies have used KMA scenarios for climatechange applications in Republic of Korea [37ndash44] Thus weselected the KMA climate change scenarios using the A1Bscenario for assessing our proposed approach
22 Materials and Method
221 Enhanced Bias-Correction Approach Linking the CF andQM Methods Both the CF and QM methods have theiradvantages and disadvantages in the bias-correction processBias-corrected (transformed) precipitation of the future willvary based on the selection of either CF or QM In gen-eral rainfall quantitiesfrequencies considerably influencethe occurrence of floodsdroughts Asmentioned in Section 1heavy rainfall eventsamounts such as the 9415mm rainfallfrom July to September in 2004 [23] have been generatedduring the summer period indicating that small uncertainties(especially for rainfall amounts) in bias-correction methodsand inherently ill-posed GCM data may lead to disastrousdamages across the country Thus these uncertainties needto be reduced for efficient water resources managementby policydecision makers Although the linked CF andQM method can contribute to a reduction in uncertaintiesin the bias-correction methods (CF or QM) the inherentuncertainty caused by drawbacks within the GCMRCMdata provided by the IPCCKMA is unavoidable To datecorrecting daily GCMRCM data is still a challenge globallyTherefore we corrected the bias of monthly (precipitation)predictions using CF and then using the QM scheme shiftedthe CF-based bias-corrected predictions to the historicalobservations as shown in Figure 4
4 Advances in Meteorology
ECHAM4(Atmosphere model)
OASIS(Atmosphere Ocean
Coupled model)
HOPE -G(Thawing-Ocean model)
GCM(ECHO-G)
MM5(Atmosphere model)
Dynamical downscaling
IPCC
SRES A1B A2 B1Greenhouse
gas scenarios
KMA climate change scenario
RCM
Figure 3 Generation of the climate predictions using the SRES A1B scenarios retrieved from KMA
222 Application of the CF QM and CF + QM Bias Correc-tion In this study the Songwol-dong site in Seoul Republicof Korea shown in Figure 5 was selected to assess the biascorrection of the A1B precipitation scenario using threemethods (CF QM and CF + QM) against the observed pre-cipitation data during a baseline period The bias-correctioncoefficients (change factors for the CFmethod and a CDF forthe QM method) obtained from the bias correction duringthe baseline period were applied to the A1B precipitationscenario Twelve change factors one for each month wereestimated and aCDFwas estimated based on the relationshipbetween the observed precipitation data and the A1B precip-itation scenario during a baseline period
For evaluation of the bias correction by the three meth-ods we divided the observation period (1983ndash2012) intotwo groups the baseline period (1983ndash1997) and the vali-dation period (1998ndash2012) We obtained the bias-correctioncoefficients of CF and QM between the A1B precipitationscenario (1983ndash1997) and the observed precipitation datathrough bias correction during a baseline period (1983ndash1997)Then the bias-correction coefficients were applied to the A1Bprecipitation scenario (1998ndash2012) for comparison with theobserved precipitation (1998ndash2012) for validation
Theweather in Republic of Korea shows seasonal changesdue to the monsoon climate For this reason we classi-fied the monthly averaged precipitation into four categories(JanuaryndashMarch AprilndashJune JulyndashSeptember and OctoberndashDecember) and assessed the bias-corrected data using thecoefficient of determination (1198772) Nash-Sutcliffe efficiency(NSE) and root mean square error (RMSE) Then we esti-mated the bias-correction coefficients of the A1B precipita-tion scenario relative to the observed precipitation data usinganother baseline period (1983 to 2012) for bias correctionof future climate change scenario We corrected the A1Bprecipitation projections for the future (2016ndash2100) based onthe derived bias-correction coefficients from 1983 to 2012 andtheir characteristicsstatistics were analyzed
The 1198772 measures the degree of collinearity betweenobservations and simulations
1198772=(sum119899
119894=1(119910obs119894 minus 119884obs) (119910sim119894 minus 119884sim))
2
sum119899
119894=1(119910obs119894 minus 119884obs)
2
sum119899
119894=1(119910sim119894 minus 119884sim)
2 (3)
where 119910obs119894 is the 119894th observation 119910sim119894 is the 119894th simulation119884obs is the mean of the observations 119884sim is the mean of thesimulations and 119899 is the total number of observations
The NSE is a normalized statistic that gives the relativemagnitude of the residual variance compared to the observedvariance [45] as shown in
NSE = 1 minus (sum119899
119894=1(119910obs119894 minus 119910sim119894)
2
sum119899
119894=1(119910obs119894 minus 119884obs)
2) (4)
where an NSE value of 1 indicates perfect agreement betweenobservations and simulations
The RMSE is one of the commonly used error indexstatistics for observed and simulated data [46] as shown in
RMSE = radicsum119899
119894=1(119910obs119894 minus 119910sim119894)
2
119899 (5)
where an RMSE of zero indicates perfect agreement betweenobservations and simulations
3 Results and Discussion
31 Evaluation of Bias Correction Using theThreeMethods InRepublic of Korea 60ndash70of the yearly precipitation amount[47] is usually generated during the summer period (July toSeptember) To be prepared for natural disasters (droughtflood etc) and ensuring sustainability of water resourcesefficient water management plans need to be formulated
Advances in Meteorology 5
RCM simulationclimate change scenarios
based on MM5 (A1B)
Baselineobserved precipitation data
Bias-correctedclimate change data based
Quantile mapping done
Linked CF + QM method
Bias-correctedclimate change data based on CF
Change factor calculated on a monthly basis (see Equation (1))
CF + QM
on a daily basis (see Equation (2))
on
Figure 4 Procedure of the linked CF + QMmethod for bias corrections
Table 1 Statistical analysis of the observed and bias-corrected daily precipitation for bias correction and validation
Baseline period (1983ndash1997) Validation period (1998ndash2012)CF QM CF + QM CF QM CF + QM
JanndashMar1198772 0899 0939 0914 0972 0984 0986NSE 0855 0877 0904 0939 0510 0879RMSE (mm) 1659 1527 1352 0928 2630 1306
AprndashJun1198772 0977 0991 0994 0990 0969 0983NSE 0971 0502 0993 0839 0931 0887RMSE (mm) 1817 7546 0899 4676 3067 3919
JulndashSep1198772 0958 0916 0998 0859 0852 0922
NSE 0887 0860 0998 0703 0700 0916RMSE (mm) 8166 9113 1176 17501 17579 9287
OctndashDec1198772 0975 0978 0969 0981 0990 0990
NSE 0968 0508 0966 0709 minus1708 0496RMSE (mm) 1072 4180 1097 2055 6273 2708
for the heavy rainfall period The selection of precise bias-correction methods can help in obtaining reliable projectedprecipitation changes across the Korean peninsula for thesummer period in the future which can help in mitigatingpotential risks from natural disasters
Table 1 presents the statistical analysis of the bias-corrected precipitation using the three methods The bias-corrected precipitation results of the combined CF + QMmethod were considerably improved for baseline period(1983ndash1997) and validation period (1998ndash2012) as comparedto those of the CF-only or QM-only methods however there
were no significant differences between the results of the CFQM and CF + QM methods for the dry seasons (Januaryto March April to June and October to December) The CFmethod overestimated the bias-corrected A1B precipitationscenarios as compared to the baseline precipitation datawhile the bias-corrected precipitation by the QM scheme wasunderestimated for baseline and validation periods The factthat the CF + QM method performed better at correctingthe A1B precipitation scenarios relative to the baseline pre-cipitation data for the bias correction and validation of thesummer period (July to September) supports the robustness
6 Advances in Meteorology
Figure 5 Location of the Songwol-dong site in Republic of Korea
of our proposed bias-correction method (combined CF +QM) for application to heavy rainfall seasons Even thoughuncertainties exist in the bias correctionvalidation periodsthe bias-corrected results of the CF + QM method are closerto the observations than those of the CF-only or QM-onlymethods as shown in Figures 6 and 7
32 Bias Corrections of the A1B Precipitation Projections forthe Future Since the CF + QMmethod showed good resultsin validation we corrected the A1B precipitation scenariofrom 1983 to 2100 at the identical region Note that weconducted bias correction using the three methods for thecomparison using the baseline precipitation forcings (1983 to2012) and then the bias-correction coefficients were appliedto the precipitation projections from 2016 to 2100
Figure 8 shows the comparison of the observations andtransformed (bias-corrected) predictions based on the threemethods Comparison of the results of the CF QM andCF + QM methods shows that the monthly distribution ofthe transformed daily precipitation (5th25th50th75th95thpercentiles and mean) from the QM is considerably differentfrom the observations These results imply that the QM islimited in correcting monsoon climatic predictions becauseintensive rainfall frequenciesamounts during heavy rainfallperiods might cause over-underestimations in correctingbias
The results of the CF and CF + QM methods havesimilar distributions as shown in Figure 8 The CF methodperformed better in correcting the bias of the monthlyprecipitation data but the CF had a limitation in that itwas highly dependent on the distribution of the predictedprecipitation data
Table 2 shows the comparison of the monthly maximumprecipitation data from the observations and transformeddata using the CF and CF +QMmethodsWith respect to themonthly observation of 11310mm (the monthly maximumprecipitation) in July the CFmethod generated an amount of15403mm (362 difference) while the CF + QM methodgenerated 13194mm a 167 lower deviation than the CF
Table 2 Comparison of the maximum monthly precipitation from1983 to 2012
Month Obs(mm)
CF(mm)
Diff()
CF + QM(mm)
Diff()
Jan 622 503 minus191 549 minus117Feb 695 675 minus29 794 142Mar 1235 1002 minus189 1133 minus83Apr 1570 1456 minus73 1662 59May 2913 2224 minus237 2475 minus150Jun 4972 4611 minus73 47426 minus46Jul 11310 15403 362 13194 167Aug 12378 15356 241 12710 27Sep 6715 5062 minus246 4636 minus310Oct 2145 2044 minus47 2359 100Nov 1545 1040 minus327 1187 minus232Dec 714 673 minus57 743 41
However the monthly averages of the observed and trans-formed precipitation data in July were identical at 425mm(Figure 8) In August the maximum precipitation using theCF method was 15356mm (241 difference as comparedwith the observedmaximumprecipitation of 12378mm) Onthe contrary the CF + QM method generated a monthlymaximum precipitation of 12710mm a difference of only27 as compared with the observation data (Table 2)
Table 3 shows the number of dayswith the statistics (max-imum and minimum sum average and standard deviation)of the weather history and the bias-correcteduncorrectedpredictions The daily maximum transformed precipitationbased on the CF method is 8231mm (July 2004) whilethe maximum daily precipitation of the observation datais 3328mm The total precipitation in 2004 was 1020mmwhich is approximately 20 less than the annual averageprecipitation in Republic of Korea The use of a correctionfactor for long periods and in dry years might overesti-mate the daily precipitation in bias correction These resultsdemonstrate that the CFmethod can yield inaccuracies whenused for dry years because correction factors may have theirlimitations in reflecting the variations in yearly precipitationdata The CF method corrected well the monthlyyearlyprecipitation amounts as well as the number of predictedprecipitation occurrences when compared to the baselineprecipitation data However this method showed high uncer-tainties in matching the daily outputs as shown in thestatistics (maximum average and standard deviation seeTable 2) However the proposed CF + QMmethod providedbetter bias-corrected predictions than the others because itreduced the limitations of both the CF and QMmethods
The bias-uncorrected predictions generated a total pre-cipitation amount of 68528mm for the future period (2016ndash2100) but the bias-corrected results of the CF QM andCF + QM methods were 141613mm 146637mm and140665mm respectively Although the total quantities of the
Advances in Meteorology 7
0
250
250
500
0 500Observed precipitation (mm)
11
Y = 12171x minus 19387
R2= 09577
Bias
-cor
rect
ed p
reci
pita
tion
(mm
)
(a) CF
0
250
500
2500 500
11
Y = 0756x minus 19331
R2= 09163
Bias
-cor
rect
ed p
reci
pita
tion
(mm
)
Observed precipitation (mm)
(b) QM
11
0
250
500
2500 500
Y = 10107x minus 04609
R2= 09981
Bias
-cor
rect
ed p
reci
pita
tion
(mm
)
Observed precipitation (mm)
(c) CF + QM
Figure 6 Scatter plots of the observed and bias-corrected precipitation during the heavy rain season (JulyndashSeptember) from 1983 to 1997
bias-corrected precipitation during the entire period are sim-ilar the temporal distributions of the transformed future pre-cipitation data showed large differences as shown in Figures9 10 and 11 The yearly precipitations have extremely highfrequencies from 2050 to 2070 for CF and 2070 to 2090 forQMHowever the degree of high frequencies corrected by theCF + QMmethod was relatively lower than those by the CF-only and QM-only methods as shown in the bias-correctedresults of bias correction and validation This demonstratesthat the CF + QMmethod can improve the limitations of theindividual CF and QM methods Figure 12 shows the rangesof the yearly precipitation predictions transformed by CF
QM and CF + QM with five-year intervals Figure 12 showsthat the bias-corrected predictions based on the CF + QMare usually located near the center between those of the CFand QMThus using a single bias-correction method (CF orQM) has relatively higher uncertainties in providing accuratefuture precipitation projections as compared to the combinedCF + QM method Furthermore errors incorporated withinbias-correction methods might be propagated into futureprojections that may be used by decision makers Thereforeappropriate bias-correction methods that reduce errors infuture precipitation projections should be used Our resultsshow that the CF + QM method which can improve the
8 Advances in Meteorology
11
0
500
1000
0 250 1000
Y = 12233x minus 37259
R2 = 08586Y = 12233x minus 37259
R2 = 08586
Bias
-cor
rect
ed p
reci
pita
tion
(mm
)
Observed precipitation (mm)
(a) CF
11
0
500
1000
0 1000
Y = 05559x minus 17235
R2= 08519
Bias
-cor
rect
ed p
reci
pita
tion
(mm
)
250Observed precipitation (mm)
(b) QM
11
0
500
1000
0 1000
Y = 09604x minus 15007
R2= 09217
Bias
-cor
rect
ed p
reci
pita
tion
(mm
)
250Observed precipitation (mm)
(c) CF + QM
Figure 7 Scatter plots of the observed and validated precipitation during the heavy rain season (JulyndashSeptember) from 1998 to 2012
limitations of the CF and QM methods can be appropriatefor generating transformed precipitation data using variousclimate change scenarios
4 Conclusions
Preparations for and adaptations to climate change areplanned or ongoing throughout the world This study sug-gests a combined bias-correction (CF + QM) method thatcombines the existing CF and QM methods to help preparefor the negative effects of climate change
To assess the performance of the proposed method forbias correction for long time periods bias corrections wereconducted for the study period (1983ndash2012) for the Songwol-dong site in Republic of Korea The first 15 years (1983ndash1997)were used as a baseline period for estimating bias-correctioncoefficients and we validated three methods for the latter 15years (1998ndash2012) We classified the study period into fourcategories (JanuaryndashMarch AprilndashJune JulyndashSeptemberand OctoberndashDecember) for assessing the characteristicsof seasonality when correcting projected precipitation biasThen we testedcompared the performance of the CF-onlyQM-only and CF + QM methods for the bias correction
Advances in Meteorology 9
Prec
ipita
tion
(mm
)
0
20
40
60
80
100
120
Obs CF QM CF + QM
(a) January
Prec
ipita
tion
(mm
)
0
20
40
60
80
100
120
Obs CF QM CF + QM
(b) February
Prec
ipita
tion
(mm
)
0
50
100
150
200
Obs CF QM CF + QM
(c) March
Prec
ipita
tion
(mm
)
050
100150200250300350
Obs CF QM CF + QM
(d) April
Prec
ipita
tion
(mm
)
0100200300400500600700
Obs CF QM CF + QM
(e) May
Prec
ipita
tion
(mm
)
0100200300400500600700
Obs CF QM CF + QM
(f) June
Prec
ipita
tion
(mm
)
0200400600800
100012001400
Obs CF QM CF + QM
(g) July
Prec
ipita
tion
(mm
)
0200400600800
100012001400
Obs CF QM CF + QM
(h) August
Prec
ipita
tion
(mm
)
0100200300400500600700
Obs CF QM CF + QM
(i) September
Prec
ipita
tion
(mm
)
050
100150200250300350400
Obs CF QM CF + QM
75th percentileMean lineMedian25th percentile5th percentile
95th percentile
(j) October
Prec
ipita
tion
(mm
)
0
50
100
150
200
250
Obs CF QM CF + QM
75th percentileMean lineMedian25th percentile5th percentile
95th percentile
(k) November
Prec
ipita
tion
(mm
)
0
50
100
150
200
Obs CF QM CF + QM
75th percentileMean lineMedian25th percentile5th percentile
95th percentile
(l) December
Figure 8 Distribution of the monthly precipitation from 1983 to 2012
and validation periods Although the CF + QM methodcorrected the projected precipitation bias to the baselineprecipitation data slightly better than the others there existnolittle significant differences for the dry periods (JanuaryndashMarch AprilndashJune and OctoberndashDecember) However
the CF + QMmethod (R2 09900990 and NSE 09200916for bias correctionvalidation) considerably improved thebias-corrected precipitation during the heavy rainfall season(JulyndashSeptember) compared to the CF-only (R2 09580859and NSE 08870703 for bias correctionvalidation)
10 Advances in Meteorology
Table 3 Statistical analysis of the observed and bias-correcteduncorrected daily precipitation (1983ndash2012)
119873lowast Minlowastlowast Maxlowastlowastlowast Sumlowastlowastlowastlowast Avglowastlowastlowastlowastlowast SDlowastlowastlowastlowastlowastlowast
Observation 3293 lt1 3328 450345 137 272Before bias-correction scenario 4218 lt1 1524 215109 51 96CF 4218 lt1 8231 450335 107 307QM 3377 lt1 3328 451931 134 269CF + QM 3279 lt1 3328 448901 137 272lowastThe number of days with precipitationlowastlowastMinimum daily precipitation in mmlowastlowastlowastMaximum daily precipitation in mmlowastlowastlowastlowastSum of daily precipitation for the entire period in mmlowastlowastlowastlowastlowastAverage of daily average precipitation in mmlowastlowastlowastlowastlowastlowastStandard deviation of daily average precipitation in mm
Year2000 2020 2040 2060 2080 2100
Year
ly p
reci
pita
tion
(mm
)
0
500
1000
1500
2000
2500
3000
3500
Before bias correctionAfter bias correction
Baseline (1983ndash2012)
Figure 9 Bias-corrected yearly precipitation data using the changefactor method
Year2000 2020 2040 2060 2080 2100
Year
ly p
reci
pita
tion
(mm
)
0
500
1000
1500
2000
2500
3000
3500
Before bias correctionAfter bias correction
Baseline (1983ndash2012)
Figure 10 Bias-corrected yearly precipitation data using the quan-tile mapping method
Year2000 2020 2040 2060 2080 2100
Year
ly p
reci
pita
tion
(mm
)
0
500
1000
1500
2000
2500
3000
3500
Before bias correctionAfter bias correction
Baseline (1983ndash2012)
Figure 11 Bias-corrected yearly precipitation data using the CF +QMmethod
and QM-only (R2 09160852 and NSE 08600700 for biascorrectionvalidation) methods
After comparing the three methods for bias correctionwe derived the bias-correction coefficients using the CF-only QM-only and CF + QM methods for the entireperiod (1983ndash2012)Then we corrected the A1B precipitationscenario based on the estimated coefficients for the futureperiod (2016ndash2100) The CF + QM method gives better bias-corrected predictions with respect to statistics In partic-ular the suggested CF + QM method is appropriate formonsoon climatic conditions when torrential precipitationoccurs during the wet season Furthermore our proposedapproach can contribute to a reduction in weather predictionuncertainties and the establishment of sustainable waterresources management plans for mitigating natural disasterscaused by future climate changes We plan to extend theapplicability and accessibility of the suggested method to theweb whichwill contribute considerably to the preparation forand adaptation to uncertain climate changes
Advances in Meteorology 11
Year
Year
ly p
reci
pita
tion
(mm
)
800
1000
1200
1400
1600
1800
2000
2200
2400
2016
ndash2021
2021
ndash2026
2026
ndash2031
2031
ndash2036
2036
ndash2041
2041
ndash2046
2046
ndash2051
2051
ndash2056
2056
ndash2061
2061
ndash2066
2066
ndash2071
2071
ndash2076
2076
ndash2081
2081
ndash2086
2086
ndash2091
2091
ndash2096
2096
ndash2100
Change factor (CF)Quantile mapping (QM)CF + QM
Figure 12 Comparison of the yearly precipitation for each 5-yearinterval using the CF QM and CF + QM bias-correction methods
Conflict of Interests
The authors declare that there is no conflict of interestsregarding the publication of this paper
Acknowledgment
This research was supported by the Geo-Advanced Innova-tive Action (GAIA) Project (no RE201402074 Surface SoilResources Inventory amp Integration SSORII Research Group)in Republic of Korea
References
[1] K Aleklett ldquoReserve driven forecasts for oil gas amp coaland limits in carbon dioxide emissions Peak Oil Peak GasPeak Coal and Peak CO
2rdquo Joint Transport Research Centre
discussion paper no 2007-18 2007[2] EPA Climate Change Science Facts Office of Air and Radiation
2010[3] Korea Meteorological Administration (KMA) 2014 http
wwwkmagokr[4] IPCC Climate Change 2001 Impacts Adaptation and Vulnera-
bility Contribution of Working Group II to the Third AssessmentReport of the Intergovernmental Panel on Climate ChangeCambridge University Press Cambridge UK 2001
[5] IPCC Climate Change 2007 Impacts Adaptation and Vulnera-bility Contribution ofWorking Group II to the Fourth AssessmentReport of the Intergovernmental Panel on Climate ChangeCambridge University Press Cambridge UK 2007
[6] M H Shin Y C Shin S G Heo K J Lim and J D ChoildquoCharacteristics of nonpoint source pollutant loads from forestwatershed with various water quality sampling frequenciesrdquoJournal of the Korean Society of Agricultural Engineers vol 50no 2 pp 65ndash71 2008
[7] T J Kwon ldquoReframing sustainability in consideration of climatechange and natural hazards focusing on the US naturalhazards mitigation trend and case analysisrdquo Journal of theKorean Society of Civil Engineers vol 33 no 2 pp 801ndash810 2013
[8] B Kang J H Lee E S Chung D Kim and Y D Kim ldquoAsensitivity analysis approach ofmulti-attribute decisionmakingtechnique to rank flood mitigation projectsrdquo KSCE Journal ofCivil Engineering vol 17 no 6 pp 1529ndash1539 2013
[9] H S Kim G J Park and S D Kim ldquoAssessment of floodvulnerability considering climate change and large-scale riverrestoration projectrdquo Journal of the Korean Society of HazardMitigation vol 12 no 2 pp 107ndash113 2012
[10] M H Lee L W Jung and D H Bae ldquoKorean flood vulner-ability assessment on climate changerdquo Journal of Korea WaterResources Association vol 44 no 8 pp 653ndash666 2011
[11] Y A Kwon W T Kwon K O Boo and Y Choi ldquoFutureprojections on subtropical climate regions over South Koreausingrdquo Journal of the Korean Geographic Society vol 42 no 3pp 355ndash367 2007
[12] J Y Park M J Park S R Ahn and S J Kim ldquoWatershedmodeling for assessing climate change impact on stream waterquality of Chungju Dam watershedrdquo Journal of Korea WaterResources Association vol 42 no 10 pp 877ndash889 2009
[13] J G Arnold Spatial scale variability in model developmentand parameterization [PhD thesis] Purdue University WestLafayette Ind USA 1992
[14] M J Muerth B Gauvin St-Denis S Ricard et al ldquoOn the needfor bias correction in regional climate scenarios to assess climatechange impacts on river runoffrdquo Hydrology and Earth SystemSciences vol 17 no 3 pp 1189ndash1204 2013
[15] J Alcamo P Doll F Kaspar and S Siebert ldquoGlobal change andglobal scenarios of water use and availability an application ofWater Cap 10rdquo Report A9701 Center for Environmental SystemResearch University of Kassel Kassel Germany 1997
[16] H A Panofsy and G W Brire Some Application of Statisticsto Meteorology Pennsylvania State University University ParkPennsylvania Pa USA 1963
[17] L E Hay and M P Clark ldquoUse of statistically and dynamicallydownscaled atmospheric model output for hydrologic simula-tions in threemountainous basins in the western United StatesrdquoJournal of Hydrology vol 282 no 1ndash4 pp 56ndash75 2003
[18] H J Fowler S Blenkinsop and C Tebaldi ldquoLinking climatechange modelling to impacts studies recent advances in down-scaling techniques for hydrological modellingrdquo InternationalJournal of Climatology vol 27 no 12 pp 1547ndash1578 2007
[19] J Diaz-Nieto and R L Wilby ldquoA comparison of statisticaldownscaling and climate change factor methods Impacts onlow flows in the River Thames United Kingdomrdquo ClimaticChange vol 69 no 2-3 pp 245ndash268 2005
[20] C Prudhomme S Crooks A L Kay and N Reynard ldquoClimatechange and river flooding part 1 classifying the sensitivity ofBritish catchmentsrdquo Climatic Change vol 119 no 3-4 pp 933ndash948 2013
[21] T Sato F Kimura and A Kitoh ldquoProjection of global warmingonto regional precipitation over Mongolia using a regionalclimatemodelrdquo Journal of Hydrology vol 333 no 1 pp 144ndash1542007
[22] E Tate J Sutcliffe D Conway and F Farquharson ldquoWaterbalance of Lake Victoria update to 2000 and climate changemodelling to 2100rdquo Hydrological Sciences Journal vol 49 no 4pp 563ndash574 2004
12 Advances in Meteorology
[23] R L Wilby J Troni Y Biot et al ldquoA review of climaterisk information for adaptation and development planningrdquoInternational Journal of Climatology vol 29 no 9 pp 1193ndash12152009
[24] M J Themeszligl A Gobiet and A Leuprecht ldquoEmpirical-statistical downscaling and error correction of daily precipi-tation from regional climate modelsrdquo International Journal ofClimatology vol 31 no 10 pp 1530ndash1544 2011
[25] L Gudmundsson J B Bremnes J E Haugen and T ESkaugen ldquoTechnical note downscaling RCM precipitation tothe station scale using quantile mapping-a comparison ofmethodsrdquoHydrology and Earth System Sciences Discussions vol9 no 9 pp 6185ndash6201 2012
[26] D Maraun ldquoBias correction quantile mapping and downscal-ing revisiting the inflation issuerdquo Journal of Climate vol 26 no6 pp 2137ndash2143 2013
[27] B Thrasher E P Maurer C McKellar and P B DuffyldquoTechnical Note bias correcting climate model simulated dailytemperature extremes with quantile mappingrdquo Hydrology andEarth System Sciences vol 16 no 9 pp 3309ndash3314 2012
[28] J Chen F P Brissette D Chaumont and M Braun ldquoPer-formance and uncertainty evaluation of empirical downscal-ing methods in quantifying the climate change impacts onhydrology over two North American river basinsrdquo Journal ofHydrology vol 479 pp 200ndash214 2013
[29] F S Mpelasoka and F H S Chiew ldquoInfluence of rainfallscenario construction methods on runoff projectionsrdquo Journalof Hydrometeorology vol 10 no 5 pp 1168ndash1183 2009
[30] J Boe L Terray F Habets and E Martin ldquoStatistical anddynamical downscaling of the Seine basin climate for hydro-meteorological studiesrdquo International Journal of Climatologyvol 27 no 12 pp 1643ndash1655 2007
[31] T Hashino A A Bradley and S S Schwartz ldquoEvaluationof bias-correction methods for ensemble streamflow volumeforecastsrdquo Hydrology and Earth System Sciences vol 11 no 2pp 939ndash950 2007
[32] B Kang and S Moon ldquoRealtime streamflow prediction usingquantitative precipitation model outputrdquo Journal of the KoreanSociety of Civil Engineers vol 30 no 6b pp 579ndash587 2010
[33] L R Leung A F Hamlet D P Lettenmaier and A KumarldquoSimulations of the ENSO hydroclimate signals in the PacificNorthwest Columbia River Basinrdquo Bulletin of the AmericanMeteorological Society vol 80 no 11 pp 2313ndash2329 1999
[34] A W Wood E P Maurer A Kumar and D P Letten-maier ldquoLong-range experimental hydrologic forecasting forthe Eastern United Statesrdquo Journal of Geophysical Research DAtmospheres vol 107 no 20 pp 1ndash15 2002
[35] G A Grell J Dudhia and D R Stauffer A Description ofthe Fifth-Generation Penn StateNCARMesoscaleModel (MM5)Mesoscale and Microscale Meteorology Division 1994
[36] T Q Murdock and D L Spottlehouse ldquoSelecting and usingclimate change scenarios for British Columbiardquo in PacificClimate Impacts Consortium pp 1ndash27 University of VictoriaVictoria BC Canada 2011
[37] J H Lee andC J Kim ldquoAmultimodel assessment of the climatechange effect on the drought severity-duration-frequency rela-tionshiprdquo Hydrological Processes vol 27 no 19 pp 2800ndash28132013
[38] C J Kim M J Park and J H Lee ldquoAnalysis of climate changeimpacts on the spatial and frequency patterns of drought usinga potential drought hazard mapping approachrdquo InternationalJournal of Climatology vol 34 no 1 pp 61ndash80 2014
[39] S J Hong B S Kim and S R Ha ldquoClimate change impactassessment onHanRiver long term runoff in SouthKorea basedon RCP climate change Scenariordquo Terrestrial Atmospheric andOceanic Sciences vol 25 no 5 pp 689ndash701 2014
[40] Y Seung-Hwan C Jin-Yong L Sang-Hyun O Yun-Gyeongand Y Dong Koun ldquoClimate change impacts on water storagerequirements of an agricultural reservoir considering changesin land use and rice growing season in Koreardquo AgriculturalWater Management vol 117 pp 43ndash54 2013
[41] J Kim J Choi C Choi and S Park ldquoImpacts of changes inclimate and land useland cover under IPCC RCP scenarios onstreamflow in theHoeya River Basin Koreardquo Science of the TotalEnvironment vol 452-453 pp 181ndash195 2013
[42] T Lee and C Jeong ldquoNonparametric statistical temporaldownscaling of daily precipitation to hourly precipitation andimplications for climate change scenariosrdquo Journal ofHydrologyvol 510 pp 182ndash196 2014
[43] I W Jung D H Bae and B J Lee ldquoPossible change inKorean streamflow seasonality based on multi-model climateprojectionsrdquoHydrological Processes vol 27 no 7 pp 1033ndash10452013
[44] J-W Lee and S-Y Hong ldquoPotential for added value to down-scaled climate extremes over Korea by increased resolution ofa regional climate modelrdquoTheoretical and Applied Climatologyvol 117 no 3-4 pp 667ndash677 2013
[45] J E Nash and J V Sutcliffe ldquoRiver flow forecasting throughconceptual models part Imdasha discussion of principlesrdquo Journalof Hydrology vol 10 no 3 pp 282ndash290 1970
[46] T W Chu and A Shirmohammadi ldquoEvaluation of the SWATmodelrsquos hydrology component in the Piedmont physiographicregion of Marylandrdquo Transactions of the ASAE vol 47 no 4pp 1057ndash1073 2004
[47] Y C Shin J D Choi K J Lim et al ldquoPollutant load charac-teristics from a small mountainous agricultural watershed inthe north Han river basinrdquo Journal of the Korean Society ofAgricultural Engineers vol 47 no 6 pp 83ndash92 2005
Submit your manuscripts athttpwwwhindawicom
Hindawi Publishing Corporationhttpwwwhindawicom Volume 2014
ClimatologyJournal of
EcologyInternational Journal of
Hindawi Publishing Corporationhttpwwwhindawicom Volume 2014
EarthquakesJournal of
Hindawi Publishing Corporationhttpwwwhindawicom Volume 2014
Hindawi Publishing Corporationhttpwwwhindawicom
Applied ampEnvironmentalSoil Science
Volume 2014
Mining
Hindawi Publishing Corporationhttpwwwhindawicom Volume 2014
Journal of
Hindawi Publishing Corporation httpwwwhindawicom Volume 2014
International Journal of
Geophysics
OceanographyInternational Journal of
Hindawi Publishing Corporationhttpwwwhindawicom Volume 2014
Journal of Computational Environmental SciencesHindawi Publishing Corporationhttpwwwhindawicom Volume 2014
Journal ofPetroleum Engineering
Hindawi Publishing Corporationhttpwwwhindawicom Volume 2014
GeochemistryHindawi Publishing Corporationhttpwwwhindawicom Volume 2014
Journal of
Atmospheric SciencesInternational Journal of
Hindawi Publishing Corporationhttpwwwhindawicom Volume 2014
OceanographyHindawi Publishing Corporationhttpwwwhindawicom Volume 2014
Advances in
Hindawi Publishing Corporationhttpwwwhindawicom Volume 2014
MineralogyInternational Journal of
Hindawi Publishing Corporationhttpwwwhindawicom Volume 2014
MeteorologyAdvances in
The Scientific World JournalHindawi Publishing Corporation httpwwwhindawicom Volume 2014
Paleontology JournalHindawi Publishing Corporationhttpwwwhindawicom Volume 2014
ScientificaHindawi Publishing Corporationhttpwwwhindawicom Volume 2014
Hindawi Publishing Corporationhttpwwwhindawicom Volume 2014
Geological ResearchJournal of
Hindawi Publishing Corporationhttpwwwhindawicom Volume 2014
Geology Advances in
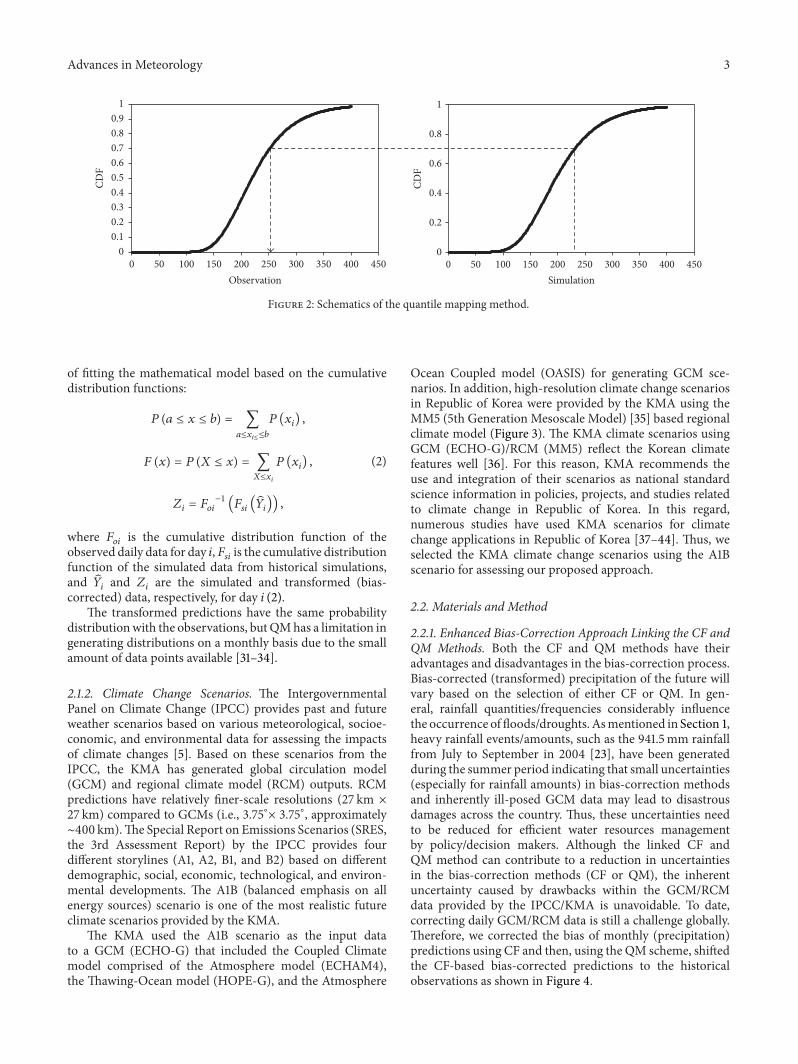
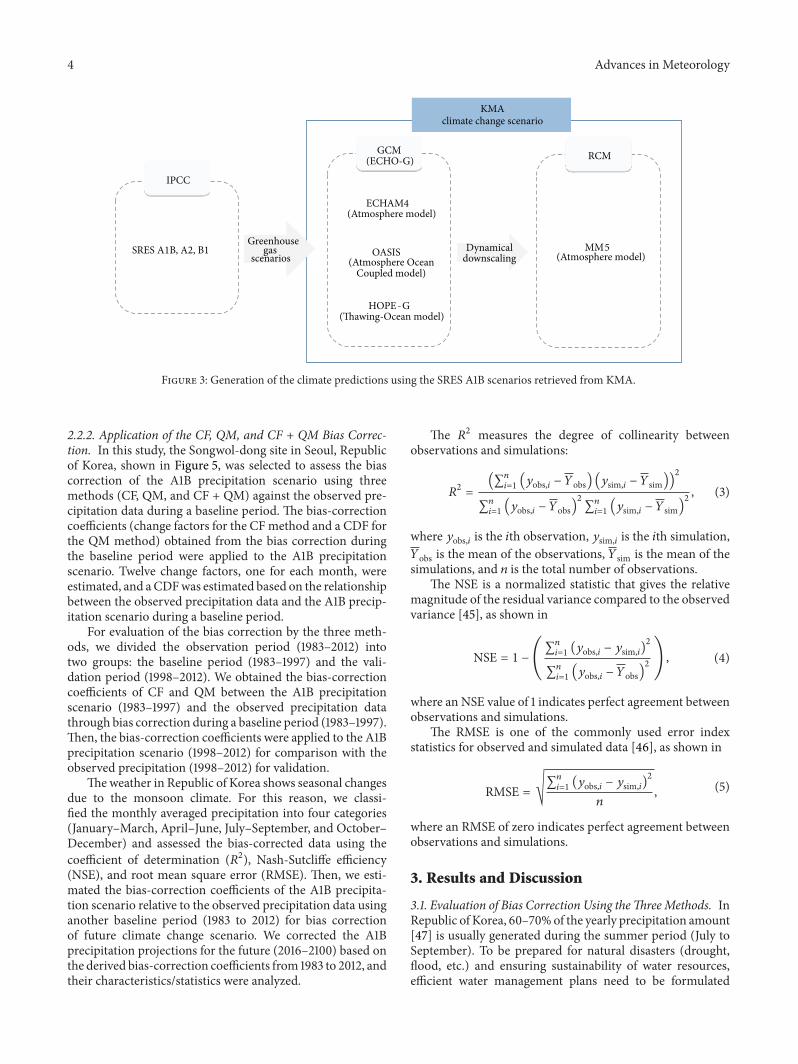
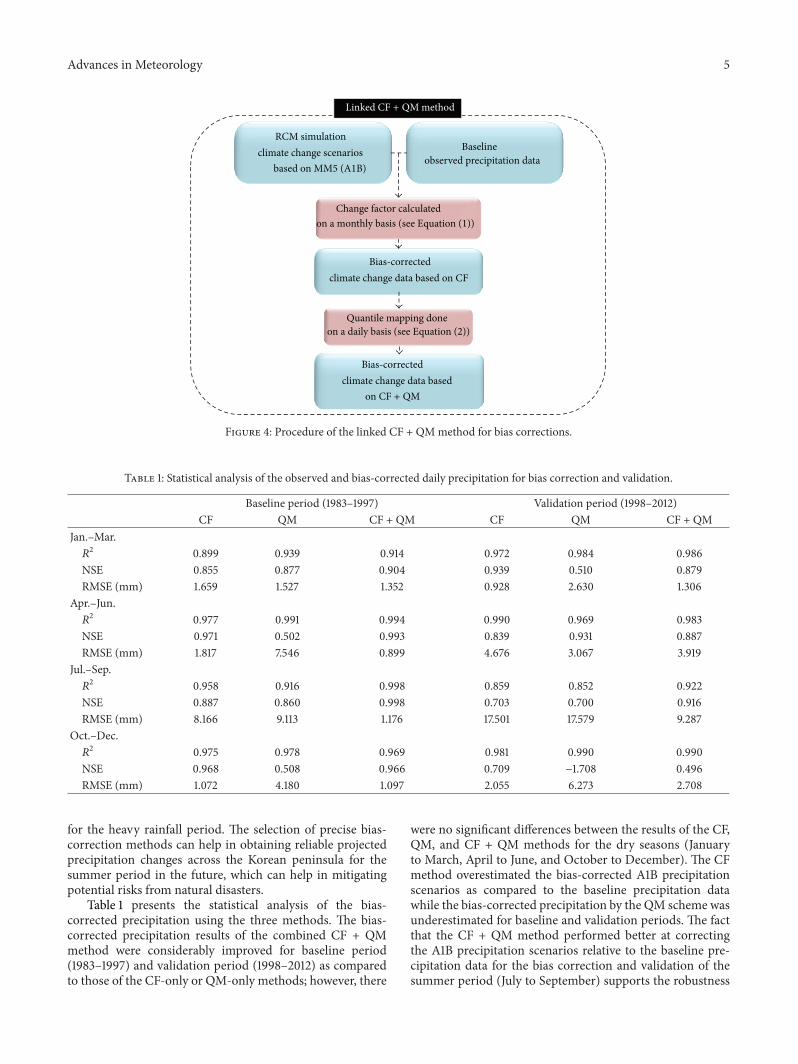
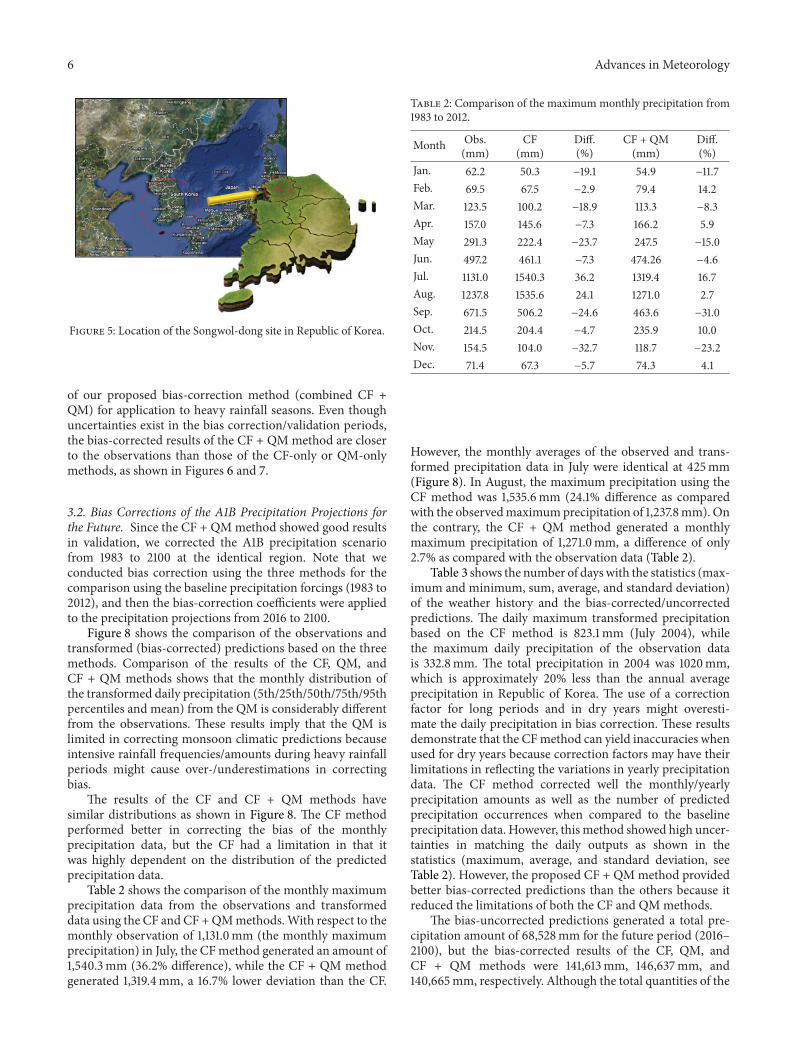
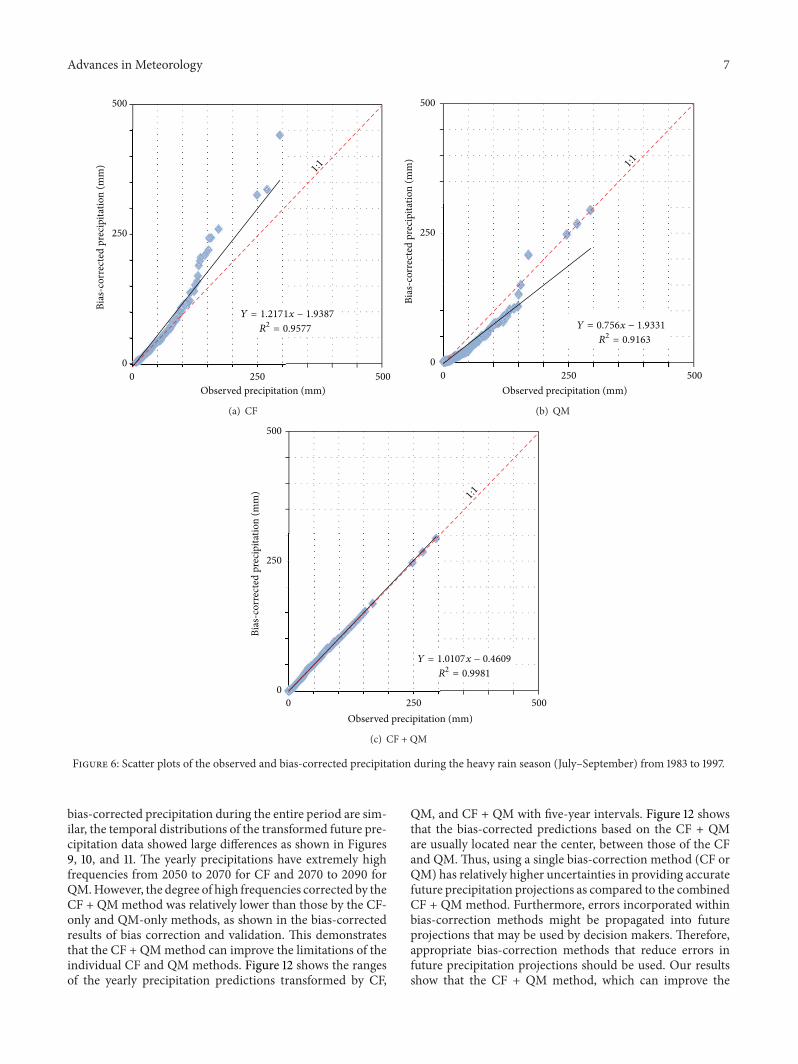
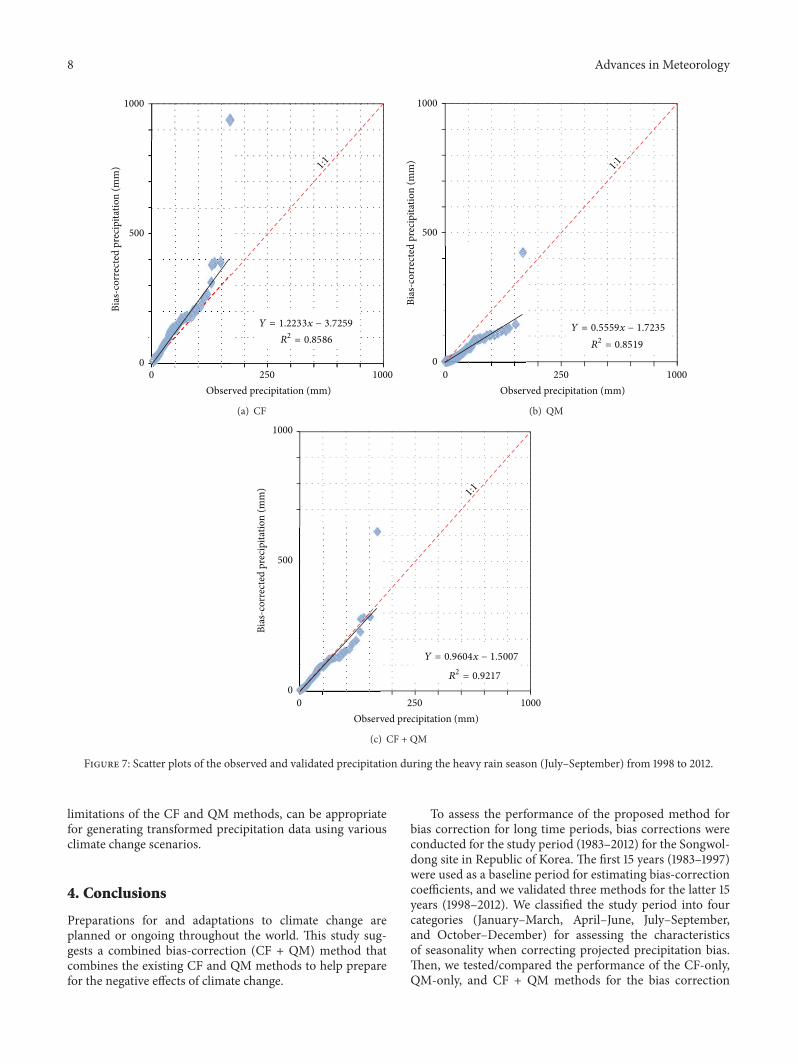
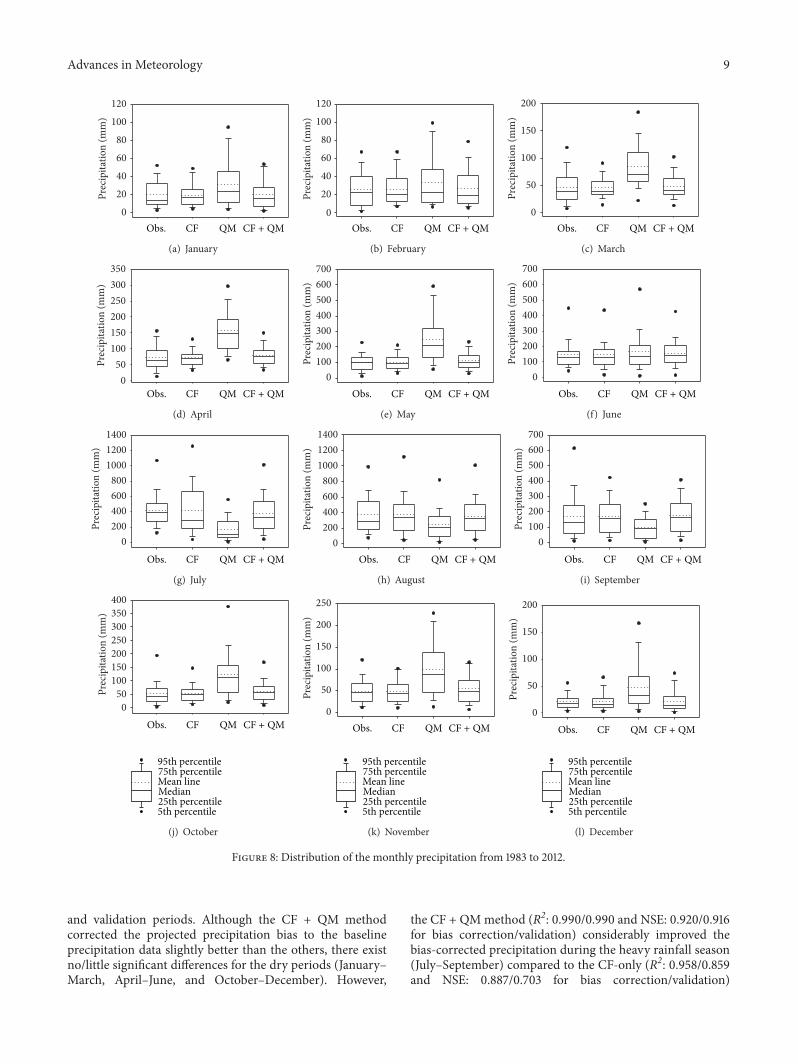
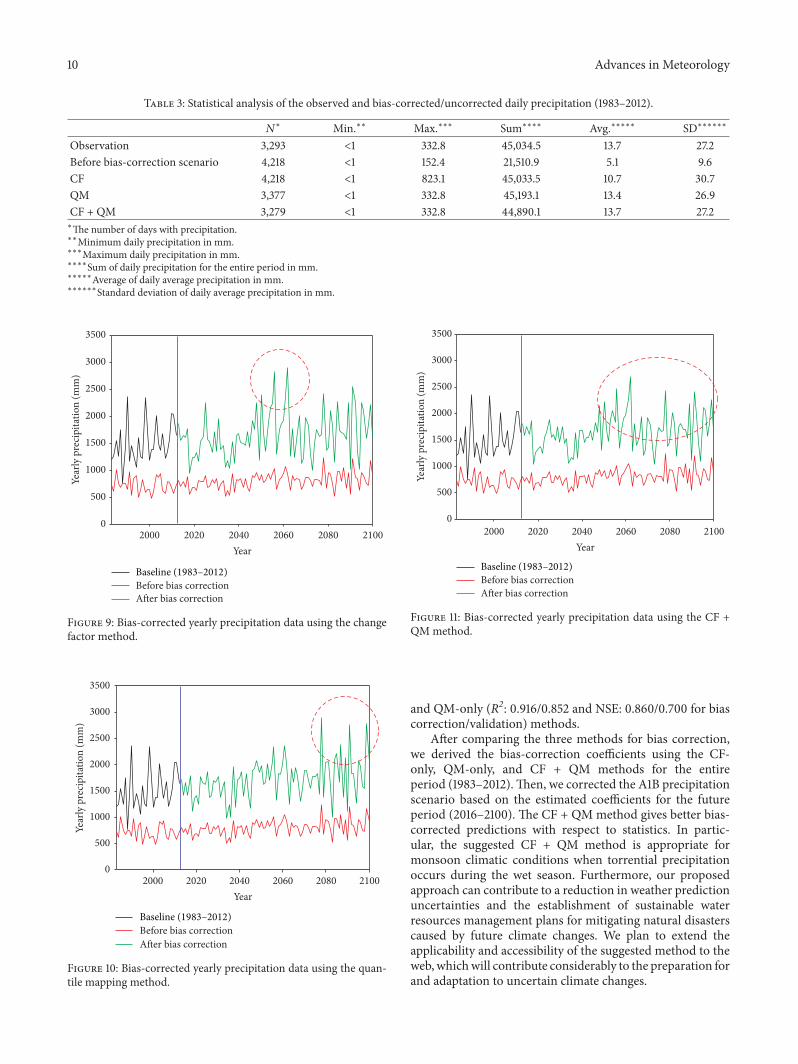
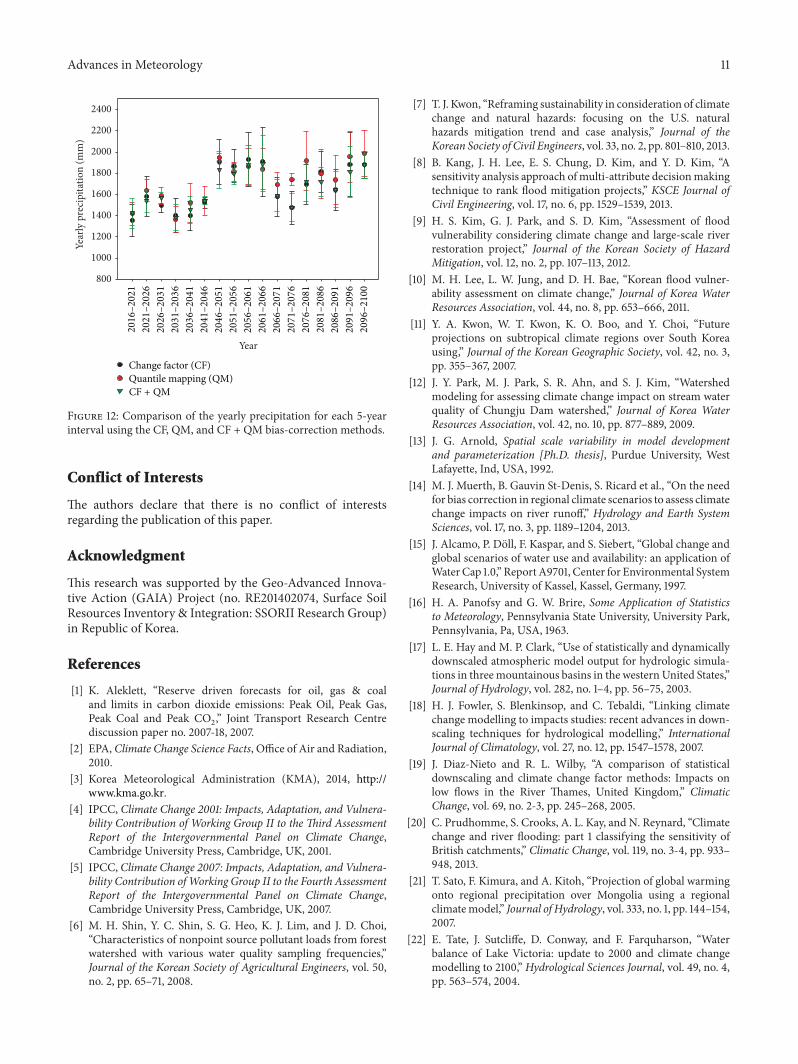