Embed Size (px)
Citation preview
Research ArticleUrea Formaldehyde Composites Reinforced withSago Fibres Analysis by FTIR, TGA, and DSC
Tay Chen Chiang,1 Sinin Hamdan,1 and Mohd Shahril Osman2
1Faculty of Engineering, Universiti Malaysia Sarawak, Jln Meranti, 94300 Kota Samarahan, Sarawak, Malaysia2University College of Technology Sarawak, Persiaran Brooke, 96000 Sibu, Sarawak, Malaysia
Correspondence should be addressed to Tay Chen Chiang; [email protected]
Received 15 October 2015; Revised 1 December 2015; Accepted 7 December 2015
Academic Editor: Peter Majewski
Copyright © 2016 Tay Chen Chiang et al. This is an open access article distributed under the Creative Commons AttributionLicense, which permits unrestricted use, distribution, and reproduction in any medium, provided the original work is properlycited.
Agricultural material or biomaterial plays an important role in the field of fibre-reinforced polymericmaterials with their new rangeof applications and achieves the ecological objective. Composition and structure of the nature fibre and matrix must be taken intoconsideration for the end use. In this project, Sago fibre particleboard bonds with Urea Formaldehyde to form composite. FourierTransform Infrared (FTIR) spectra are used to characterize the Sago/Urea Formaldehyde composite in terms of their functionalgroup and bonding. Sago/UF composite with smaller particle and higher loading of fibre with 15 wt% of UF matrix has the highercuring properties. The composite will have a denser structure by adopting bigger particle and higher loading of UF matrix. TheSago/UF composite only endures a single stage of decomposition.Thermal stability results indicate that particle size, particle/matrixinterface adhesion, and particle loading have great influence on the thermal properties of the composites.
1. Introduction
Sago palm is the primary source of Sago. Sarawak, Malaysia,is a state that produces the most Sago plant and is the world’sbiggest exporter for Sago starch. The demand for Sago isincreasing from year to year and the Sago pith waste increasesafter starch process. It is estimated that approximately 7 tonsof Sago pith waste is produced daily from a single starchprocessingmill [1]. Improper disposal of Sagowastewill causenegative impacts to the environment. To avoid this environ-mental issue, Sago waste is mixed with Urea Formaldehydethrough hot pressing process to produce a particleboard.The production of particleboards involves large amount ofbinders (Urea Formaldehyde) which accounts for up to 32%of manufacturing cost in the glue-wood composite industry[2]. Hence, Sago/UF particleboards have become the newcomposite material in reducing the demand in the furnitureindustries.
In general, composite materials are used in the industrydue to their attractive characteristics such as optimized
performance, minimized weight and volume, and cost savingas well as chemical and biodegradation resistance [3].
The final properties of a composite are influenced by theproperties of the fibre and the interfacial bonding of fibre andmatrix [4]. The chemical bonding plays an important role inthe bonding process between the matrix and fibre in a com-posite [4]. Researchers have reported that the critical particlessize, particle-matrix interface adhesion, and particles loadingon composite have notable effects on the mechanical proper-ties [5]. Although natural fibres are frequently used as rein-forcement, there are some drawbacks, such as poor compat-ibility with thermoplastic matrix, high moisture absorption,high probability of deterioration by biological organisms, andlow thermal stability [6]. A thermal analysis was performedon the Sago particleboard to qualify the gravimetric responseand specific heat capacity at elevated temperature. TGA wasused to analyze the thermal stability of materials throughdecomposition stage as well as under a variety of condi-tions and examine the kinetics of physicochemical processesoccurring in the sample [7]. Temperature also influences
Hindawi Publishing CorporationAdvances in Materials Science and EngineeringVolume 2016, Article ID 5954636, 10 pageshttp://dx.doi.org/10.1155/2016/5954636
2 Advances in Materials Science and Engineering
the thermal stability of natural fibre composite. It causes ther-mal expansion or contraction and high hygroscopicity thatlead to fibre swelling and deformation [8]. Moreover, DSCprovides the quantitative and qualitative data on endother-mic and exothermic process of materials during physicaltransitions that are caused by phase change, melting, glasstransitions, thermodynamic process, kinetic events, crystal-lization, and oxidation.
To developmaterials with lower environment impact, thesolution proposed here is to associate Sago particles and UFmatrix. The previous work was conducted to characterizethe mechanical properties of particleboard made from Sagowith different loading of UF matrix and particles size [9]. Anunderstanding of adhesives and how they react to differentparticles size and weight fraction will help us understand thebehaviour of Sago composite materials and design based onthe desired function.
The objective of this project is to understand the thermaldegradation behaviour of natural fibre/polymer compositesubjected to thermal exposure and its constituents. Thermalsensitivities of various particle size and weight fraction arecompared before it is applicable in the field.
2. Materials and Methods
2.1. Sago and Matrix Preparation. The particleboards wereproduced using Sago waste and Urea Formaldehyde as thematrix. Sago waste particles were collected fromMukah.TheSago waste went through the sieving process for size separa-tion. Particles of less than 0.6mm, 1.18mm, and 2mm sizeswere selected and used in this experiment. After the sievingprocess, the particles were subjected to the drying processunder the sun. The particles were dried in the oven with atemperature of 105∘C for 24 hours to achievemoisture contentof less than 5%. 51.5% of Urea Formaldehyde (UF) resin wasobtained from Hexzachem Sarawak Sdn Bhd and served as aparticle binder.
2.2. Particleboard Fabrication. Sago particles and UreaFormaldehyde (UF) were weighed to the desired weight andplaced in the mixing drum for the mixing process. The coreparticles were mixed by spraying them with Urea Formalde-hyde and hardener to achieve a homogeneous distribution ofadhesives. After the blending process, the Sago particles werespread evenly into the 30 cm × 30 cm wooden mold using astainless steel plate as base.
A thin layer of silicon glass mat was placed onto the caulplate to prevent the panel from being attached to the plateduring hot press process. The mat was prepressed manuallyto consolidate the thickness. During hot press process, thedistance bars were placed at both sides of the mat to obtainthe desired thickness of the board. The mat then wentthrough hot press process under the temperature of 160∘C.The pressure of the hot press machine was set at 40 bar for2 minutes and then gradually decreased to 20 bar and 10 barfor 2 minutes, respectively. After the hot press process, theboardswere kept in the chamberwith humidity of 65±5%and25±2∘C for 2-day curing process.Themain purpose of curing
is to stabilize the particleboards for constant evaluation.
Two categories of the samples are prepared for TGA,DSC,and FTIR:
(i) Sample prepared according to the particles size: sam-ple A = 0.6mm, sample B = 1.18mm, and sample C =2mm with 15wt% of UF matrix.
(ii) Sample prepared according to the weight fraction:sample D = 90wt% Sago fibre + 10wt% UF, sampleE = 80wt% Sago fibre + 20wt% UF, and sample F =70wt% Sago fibre + 30wt% UF.
2.3. Mechanical Test (Internal Bonding and Screw Test).Japanese Industrial Standard (JIS A 5908) for particleboardswas used to evaluate the properties of the Sago particleboards[10]. Specimens with the dimension of 50mm × 50mm ×10mm were prepared from each sample board for InternalBonding and Screw Test. A screw with Ø 2.7mm was driveninto the center of specimen until the head of screw is parallelto the surface of the specimen. Specimens for Internal Bond-ing and Screw Test were tested by using the Instron machine(model 5566) with a loading speed of 2mm/min.
2.4.Thermogravimetric Analysis (TGA) and Differential Scan-ningCalorimetry (DSC). Thepowder sample of particleboardwas prepared.The thermal analysis of the sample was carriedout using TGA/DSCI STAR System, Mettler Toledo thermalanalyser according to ASTM E1131. Approximately 10mg ofthe powder sample was placed in an aluminium pan andheated constantly at a rate of 10∘C/min from 50∘C to 800∘Cunder 30mL/min of nitrogen gas atmosphere. The weightloss and temperature were recorded and analysed to deter-mine the following TGA parameters: weight loss %, initialdegradation temperature, volatiles in sample, and the residualweight %. For DSC, the heat given off during a reactionwas called an exotherm while the heat absorbed by materialis called an endotherm. By measuring the exotherms andendotherms, it is possible to determine all the chemical andphysical state changes that occurred in the sample.
2.5. Fourier Transform Infrared (FTIR). The functionalgroups and chemical characteristics of Sago/UF particle-boards were obtained using a Fourier Transform InfraredSpectroscopy (Shimadzu, IRAFFINITY-1) with a resolutionof 4000–600 cm−1 using 20 scans per sample.
3. Results and Discussion
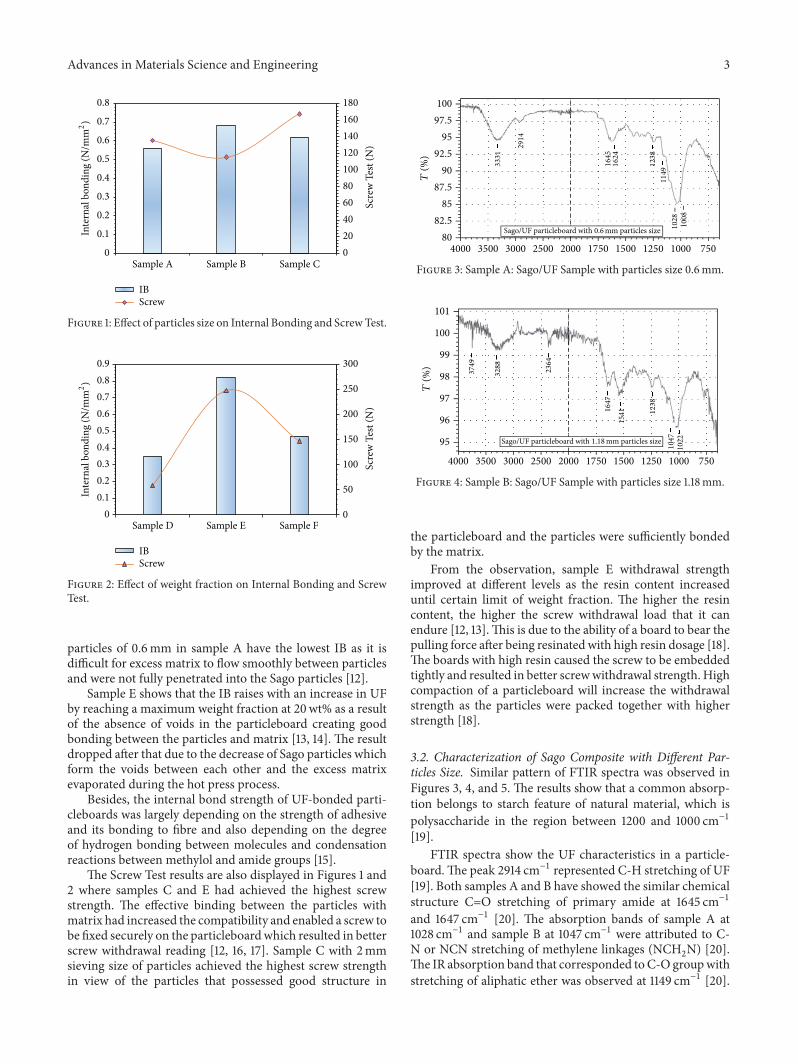
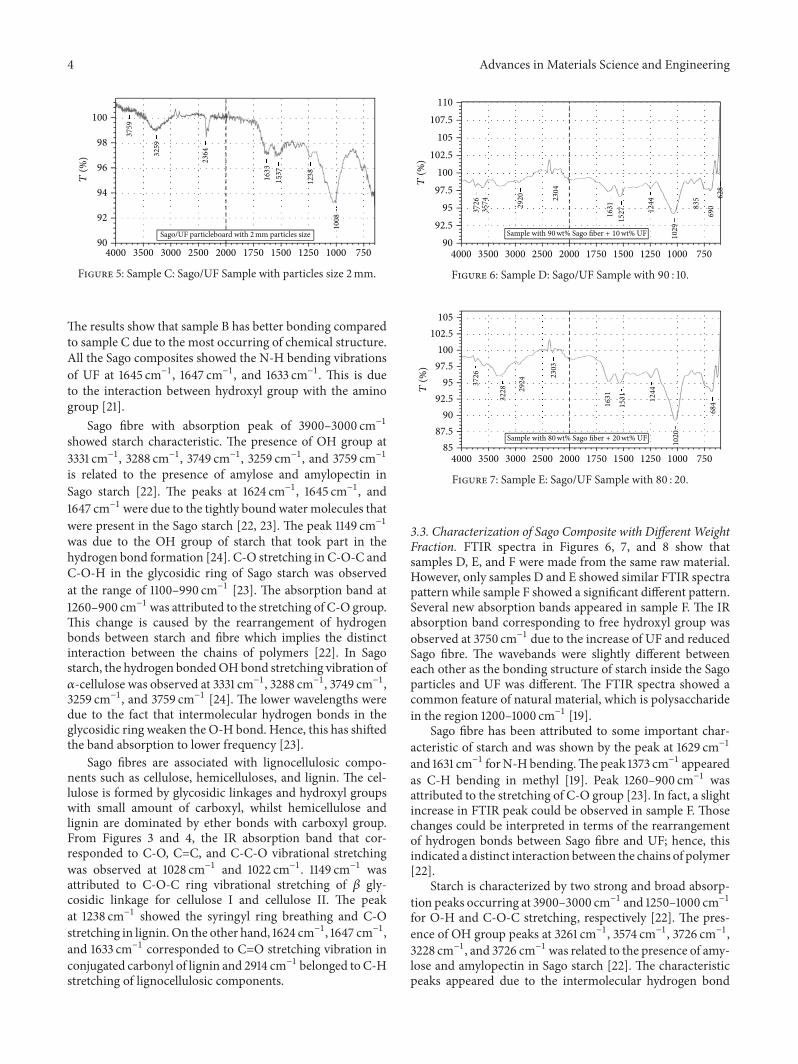
3.1. Mechanical Properties of Sago Composite (Internal Bond-ing and Screw Test). Figures 1 and 2 show the effect of Sagoparticles size and weight fraction on the Internal Bondingand Screw Test. The result shows that sample B with particlesize of 1.18mm and sample E with 20wt% of matrix havehighest internal bonding strength. This is due to the fact thatparticle 1.18mm has better bonding with the matrix in theparticleboard where the particles andmatrix had filled up thevoids and increased the IB strength [11].
Sample C with coarse particles of 2mm was not fullybonded with the matrix as there were voids around the Sagoparticles where the particle can pull out easily while fine
Advances in Materials Science and Engineering 3
0
0.1
0.2
0.3
0.4
0.5
0.6
0.7
0.8
Sample A Sample B Sample C020406080100120140160180
Scre
w T
est (
N)
IBScrew
Inte
rnal
bon
ding
(N/m
m2)
Figure 1: Effect of particles size on Internal Bonding and ScrewTest.
0
50
100
150
200
250
300
00.10.20.30.40.50.60.7
0.90.8
Sample D Sample E Sample F
Scre
w T
est (
N)
IBScrew
Inte
rnal
bon
ding
(N/m
m2)
Figure 2: Effect of weight fraction on Internal Bonding and ScrewTest.
particles of 0.6mm in sample A have the lowest IB as it isdifficult for excess matrix to flow smoothly between particlesand were not fully penetrated into the Sago particles [12].
Sample E shows that the IB raises with an increase in UFby reaching a maximum weight fraction at 20wt% as a resultof the absence of voids in the particleboard creating goodbonding between the particles and matrix [13, 14]. The resultdropped after that due to the decrease of Sago particles whichform the voids between each other and the excess matrixevaporated during the hot press process.
Besides, the internal bond strength of UF-bonded parti-cleboards was largely depending on the strength of adhesiveand its bonding to fibre and also depending on the degreeof hydrogen bonding between molecules and condensationreactions between methylol and amide groups [15].
The Screw Test results are also displayed in Figures 1 and2 where samples C and E had achieved the highest screwstrength. The effective binding between the particles withmatrix had increased the compatibility and enabled a screw tobe fixed securely on the particleboardwhich resulted in betterscrew withdrawal reading [12, 16, 17]. Sample C with 2mmsieving size of particles achieved the highest screw strengthin view of the particles that possessed good structure in
100
97.5
95
92.5
90
87.5
85
82.5
80
4000 3500 3000 2500 2000 1750 1500 1250 1000 750
T(%
)
3331
2914
1645
1624
1238
1149
1028
1008
Sago/UF particleboard with 0.6mm particles size
Figure 3: Sample A: Sago/UF Sample with particles size 0.6mm.
101
100
97
98
99
95
96
4000 3500 3000 2500 2000 1750 1500 1250 1000 750
T(%
)
3749
3288
2364
1647
1541 1238
1047
1022Sago/UF particleboard with 1.18mm particles size
Figure 4: Sample B: Sago/UF Sample with particles size 1.18mm.
the particleboard and the particles were sufficiently bondedby the matrix.
From the observation, sample E withdrawal strengthimproved at different levels as the resin content increaseduntil certain limit of weight fraction. The higher the resincontent, the higher the screw withdrawal load that it canendure [12, 13].This is due to the ability of a board to bear thepulling force after being resinated with high resin dosage [18].The boards with high resin caused the screw to be embeddedtightly and resulted in better screwwithdrawal strength. Highcompaction of a particleboard will increase the withdrawalstrength as the particles were packed together with higherstrength [18].
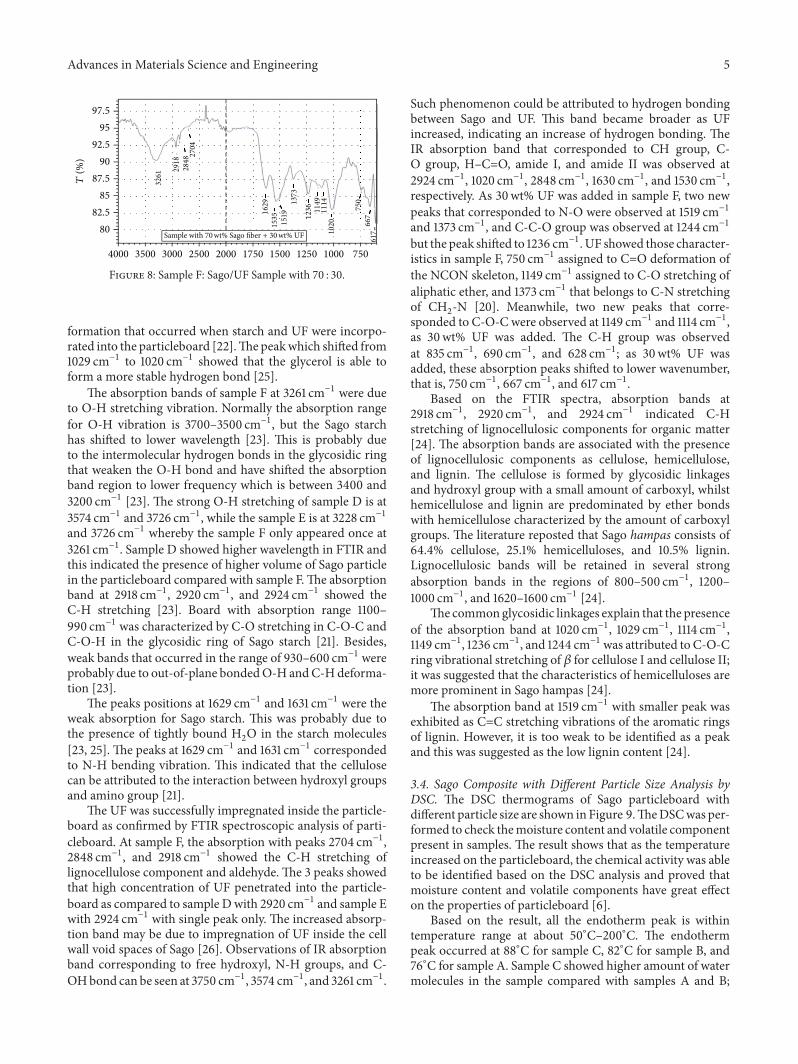
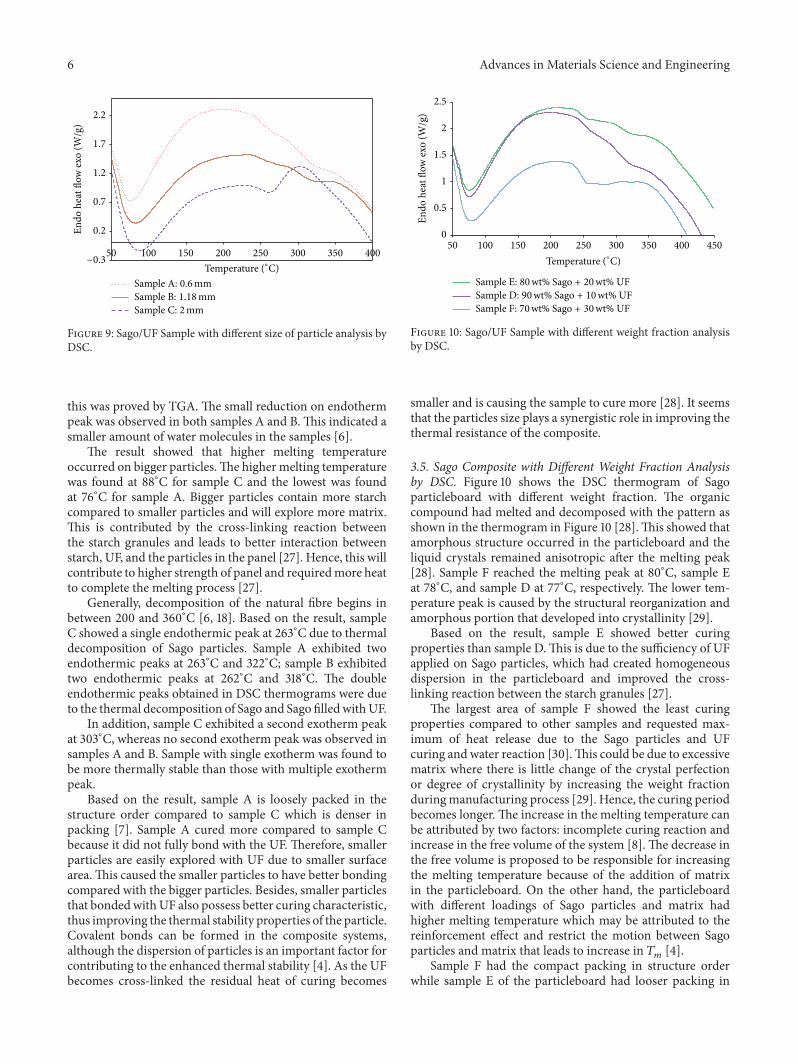
3.2. Characterization of Sago Composite with Different Par-ticles Size. Similar pattern of FTIR spectra was observed inFigures 3, 4, and 5. The results show that a common absorp-tion belongs to starch feature of natural material, which ispolysaccharide in the region between 1200 and 1000 cm−1[19].
FTIR spectra show the UF characteristics in a particle-board.The peak 2914 cm−1 represented C-H stretching of UF[19]. Both samples A and B have showed the similar chemicalstructure C=O stretching of primary amide at 1645 cm−1
and 1647 cm−1 [20]. The absorption bands of sample A at1028 cm−1 and sample B at 1047 cm−1 were attributed to C-N or NCN stretching of methylene linkages (NCH
2N) [20].
The IR absorption band that corresponded toC-O groupwithstretching of aliphatic ether was observed at 1149 cm−1 [20].
4 Advances in Materials Science and Engineering
100
98
96
94
92
90
4000 3500 3000 2500 2000 1750 1500 1250 1000 750
T(%
)
3759
3259
2364
1633
1537
1238
1008
Sago/UF particleboard with 2mm particles size
Figure 5: Sample C: Sago/UF Sample with particles size 2mm.
The results show that sample B has better bonding comparedto sample C due to the most occurring of chemical structure.All the Sago composites showed the N-H bending vibrationsof UF at 1645 cm−1, 1647 cm−1, and 1633 cm−1. This is dueto the interaction between hydroxyl group with the aminogroup [21].
Sago fibre with absorption peak of 3900–3000 cm−1showed starch characteristic. The presence of OH group at3331 cm−1, 3288 cm−1, 3749 cm−1, 3259 cm−1, and 3759 cm−1is related to the presence of amylose and amylopectin inSago starch [22]. The peaks at 1624 cm−1, 1645 cm−1, and1647 cm−1 were due to the tightly bound water molecules thatwere present in the Sago starch [22, 23]. The peak 1149 cm−1was due to the OH group of starch that took part in thehydrogen bond formation [24]. C-O stretching in C-O-C andC-O-H in the glycosidic ring of Sago starch was observedat the range of 1100–990 cm−1 [23]. The absorption band at1260–900 cm−1 was attributed to the stretching of C-O group.This change is caused by the rearrangement of hydrogenbonds between starch and fibre which implies the distinctinteraction between the chains of polymers [22]. In Sagostarch, the hydrogen bondedOHbond stretching vibration of𝛼-cellulose was observed at 3331 cm−1, 3288 cm−1, 3749 cm−1,3259 cm−1, and 3759 cm−1 [24]. The lower wavelengths weredue to the fact that intermolecular hydrogen bonds in theglycosidic ring weaken the O-H bond. Hence, this has shiftedthe band absorption to lower frequency [23].
Sago fibres are associated with lignocellulosic compo-nents such as cellulose, hemicelluloses, and lignin. The cel-lulose is formed by glycosidic linkages and hydroxyl groupswith small amount of carboxyl, whilst hemicellulose andlignin are dominated by ether bonds with carboxyl group.From Figures 3 and 4, the IR absorption band that cor-responded to C-O, C=C, and C-C-O vibrational stretchingwas observed at 1028 cm−1 and 1022 cm−1. 1149 cm−1 wasattributed to C-O-C ring vibrational stretching of 𝛽 gly-cosidic linkage for cellulose I and cellulose II. The peakat 1238 cm−1 showed the syringyl ring breathing and C-Ostretching in lignin.On the other hand, 1624 cm−1, 1647 cm−1,and 1633 cm−1 corresponded to C=O stretching vibration inconjugated carbonyl of lignin and 2914 cm−1 belonged to C-Hstretching of lignocellulosic components.
110
107.5
105
102.5
97.5
95
100
92.5
90
4000 3500 3000 2500 2000 1750 1500 1250 1000 750
T(%
)
1029
1244
1527
1631
2304
2920
3574
3726 628
690835
Sample with 90wt% Sago fiber + 10wt% UF
Figure 6: Sample D: Sago/UF Sample with 90 : 10.
105
102.5
97.5
95
100
92.5
87.5
85
90
4000 3500 3000 2500 2000 1750 1500 1250 1000 750
T(%
)
1020
1244
1531
1631
2303
2924
3228
3726
684
Sample with 80wt% Sago fiber + 20wt% UF
Figure 7: Sample E: Sago/UF Sample with 80 : 20.
3.3. Characterization of Sago Composite with Different WeightFraction. FTIR spectra in Figures 6, 7, and 8 show thatsamples D, E, and F were made from the same raw material.However, only samples D and E showed similar FTIR spectrapattern while sample F showed a significant different pattern.Several new absorption bands appeared in sample F. The IRabsorption band corresponding to free hydroxyl group wasobserved at 3750 cm−1 due to the increase of UF and reducedSago fibre. The wavebands were slightly different betweeneach other as the bonding structure of starch inside the Sagoparticles and UF was different. The FTIR spectra showed acommon feature of natural material, which is polysaccharidein the region 1200–1000 cm−1 [19].
Sago fibre has been attributed to some important char-acteristic of starch and was shown by the peak at 1629 cm−1and 1631 cm−1 forN-Hbending.Thepeak 1373 cm−1 appearedas C-H bending in methyl [19]. Peak 1260–900 cm−1 wasattributed to the stretching of C-O group [23]. In fact, a slightincrease in FTIR peak could be observed in sample F. Thosechanges could be interpreted in terms of the rearrangementof hydrogen bonds between Sago fibre and UF; hence, thisindicated a distinct interaction between the chains of polymer[22].
Starch is characterized by two strong and broad absorp-tion peaks occurring at 3900–3000 cm−1 and 1250–1000 cm−1for O-H and C-O-C stretching, respectively [22]. The pres-ence of OH group peaks at 3261 cm−1, 3574 cm−1, 3726 cm−1,3228 cm−1, and 3726 cm−1 was related to the presence of amy-lose and amylopectin in Sago starch [22]. The characteristicpeaks appeared due to the intermolecular hydrogen bond
Advances in Materials Science and Engineering 5
97.5
95
92.5
87.5
85
82.5
80
90
4000 3500 3000 2500 2000 1750 1500 1250 1000 750
T(%
)
10201519
1373
1236
1149
1114
15351629
2704
2918
3261
2848
750
667
617Sample with 70wt% Sago fiber + 30wt% UF
Figure 8: Sample F: Sago/UF Sample with 70 : 30.
formation that occurred when starch and UF were incorpo-rated into the particleboard [22].Thepeakwhich shifted from1029 cm−1 to 1020 cm−1 showed that the glycerol is able toform a more stable hydrogen bond [25].
The absorption bands of sample F at 3261 cm−1 were dueto O-H stretching vibration. Normally the absorption rangefor O-H vibration is 3700–3500 cm−1, but the Sago starchhas shifted to lower wavelength [23]. This is probably dueto the intermolecular hydrogen bonds in the glycosidic ringthat weaken the O-H bond and have shifted the absorptionband region to lower frequency which is between 3400 and3200 cm−1 [23]. The strong O-H stretching of sample D is at3574 cm−1 and 3726 cm−1, while the sample E is at 3228 cm−1and 3726 cm−1 whereby the sample F only appeared once at3261 cm−1. Sample D showed higher wavelength in FTIR andthis indicated the presence of higher volume of Sago particlein the particleboard compared with sample F.The absorptionband at 2918 cm−1, 2920 cm−1, and 2924 cm−1 showed theC-H stretching [23]. Board with absorption range 1100–990 cm−1 was characterized by C-O stretching in C-O-C andC-O-H in the glycosidic ring of Sago starch [21]. Besides,weak bands that occurred in the range of 930–600 cm−1 wereprobably due to out-of-plane bondedO-H andC-Hdeforma-tion [23].
The peaks positions at 1629 cm−1 and 1631 cm−1 were theweak absorption for Sago starch. This was probably due tothe presence of tightly bound H
2O in the starch molecules
[23, 25]. The peaks at 1629 cm−1 and 1631 cm−1 correspondedto N-H bending vibration. This indicated that the cellulosecan be attributed to the interaction between hydroxyl groupsand amino group [21].
The UF was successfully impregnated inside the particle-board as confirmed by FTIR spectroscopic analysis of parti-cleboard. At sample F, the absorption with peaks 2704 cm−1,2848 cm−1, and 2918 cm−1 showed the C-H stretching oflignocellulose component and aldehyde. The 3 peaks showedthat high concentration of UF penetrated into the particle-board as compared to sample Dwith 2920 cm−1 and sample Ewith 2924 cm−1 with single peak only. The increased absorp-tion band may be due to impregnation of UF inside the cellwall void spaces of Sago [26]. Observations of IR absorptionband corresponding to free hydroxyl, N-H groups, and C-OHbond can be seen at 3750 cm−1, 3574 cm−1, and 3261 cm−1.
Such phenomenon could be attributed to hydrogen bondingbetween Sago and UF. This band became broader as UFincreased, indicating an increase of hydrogen bonding. TheIR absorption band that corresponded to CH group, C-O group, H–C=O, amide I, and amide II was observed at2924 cm−1, 1020 cm−1, 2848 cm−1, 1630 cm−1, and 1530 cm−1,respectively. As 30wt% UF was added in sample F, two newpeaks that corresponded to N-O were observed at 1519 cm−1and 1373 cm−1, and C-C-O group was observed at 1244 cm−1but the peak shifted to 1236 cm−1. UF showed those character-istics in sample F, 750 cm−1 assigned to C=O deformation ofthe NCON skeleton, 1149 cm−1 assigned to C-O stretching ofaliphatic ether, and 1373 cm−1 that belongs to C-N stretchingof CH
2-N [20]. Meanwhile, two new peaks that corre-
sponded to C-O-C were observed at 1149 cm−1 and 1114 cm−1,as 30wt% UF was added. The C-H group was observedat 835 cm−1, 690 cm−1, and 628 cm−1; as 30wt% UF wasadded, these absorption peaks shifted to lower wavenumber,that is, 750 cm−1, 667 cm−1, and 617 cm−1.
Based on the FTIR spectra, absorption bands at2918 cm−1, 2920 cm−1, and 2924 cm−1 indicated C-Hstretching of lignocellulosic components for organic matter[24]. The absorption bands are associated with the presenceof lignocellulosic components as cellulose, hemicellulose,and lignin. The cellulose is formed by glycosidic linkagesand hydroxyl group with a small amount of carboxyl, whilsthemicellulose and lignin are predominated by ether bondswith hemicellulose characterized by the amount of carboxylgroups. The literature reposted that Sago hampas consists of64.4% cellulose, 25.1% hemicelluloses, and 10.5% lignin.Lignocellulosic bands will be retained in several strongabsorption bands in the regions of 800–500 cm−1, 1200–1000 cm−1, and 1620–1600 cm−1 [24].
The commonglycosidic linkages explain that the presenceof the absorption band at 1020 cm−1, 1029 cm−1, 1114 cm−1,1149 cm−1, 1236 cm−1, and 1244 cm−1 was attributed to C-O-Cring vibrational stretching of 𝛽 for cellulose I and cellulose II;it was suggested that the characteristics of hemicelluloses aremore prominent in Sago hampas [24].
The absorption band at 1519 cm−1 with smaller peak wasexhibited as C=C stretching vibrations of the aromatic ringsof lignin. However, it is too weak to be identified as a peakand this was suggested as the low lignin content [24].
3.4. Sago Composite with Different Particle Size Analysis byDSC. The DSC thermograms of Sago particleboard withdifferent particle size are shown in Figure 9.TheDSCwas per-formed to check themoisture content and volatile componentpresent in samples. The result shows that as the temperatureincreased on the particleboard, the chemical activity was ableto be identified based on the DSC analysis and proved thatmoisture content and volatile components have great effecton the properties of particleboard [6].
Based on the result, all the endotherm peak is withintemperature range at about 50∘C–200∘C. The endothermpeak occurred at 88∘C for sample C, 82∘C for sample B, and76∘C for sample A. Sample C showed higher amount of watermolecules in the sample compared with samples A and B;
6 Advances in Materials Science and Engineering
0.2
0.7
1.2
1.7
2.2
50 100 150 200 250 300 350 400
Endo
hea
t flow
exo
(W/g
)
Temperature (∘C)−0.3
Sample C: 2mmSample B: 1.18mmSample A: 0.6mm
Figure 9: Sago/UF Sample with different size of particle analysis byDSC.
this was proved by TGA. The small reduction on endothermpeak was observed in both samples A and B.This indicated asmaller amount of water molecules in the samples [6].
The result showed that higher melting temperatureoccurred on bigger particles.The higher melting temperaturewas found at 88∘C for sample C and the lowest was foundat 76∘C for sample A. Bigger particles contain more starchcompared to smaller particles and will explore more matrix.This is contributed by the cross-linking reaction betweenthe starch granules and leads to better interaction betweenstarch, UF, and the particles in the panel [27]. Hence, this willcontribute to higher strength of panel and requiredmore heatto complete the melting process [27].
Generally, decomposition of the natural fibre begins inbetween 200 and 360∘C [6, 18]. Based on the result, sampleC showed a single endothermic peak at 263∘C due to thermaldecomposition of Sago particles. Sample A exhibited twoendothermic peaks at 263∘C and 322∘C; sample B exhibitedtwo endothermic peaks at 262∘C and 318∘C. The doubleendothermic peaks obtained in DSC thermograms were dueto the thermal decomposition of Sago and Sago filledwithUF.
In addition, sample C exhibited a second exotherm peakat 303∘C, whereas no second exotherm peak was observed insamples A and B. Sample with single exotherm was found tobe more thermally stable than those with multiple exothermpeak.
Based on the result, sample A is loosely packed in thestructure order compared to sample C which is denser inpacking [7]. Sample A cured more compared to sample Cbecause it did not fully bond with the UF. Therefore, smallerparticles are easily explored with UF due to smaller surfacearea.This caused the smaller particles to have better bondingcompared with the bigger particles. Besides, smaller particlesthat bondedwithUF also possess better curing characteristic,thus improving the thermal stability properties of the particle.Covalent bonds can be formed in the composite systems,although the dispersion of particles is an important factor forcontributing to the enhanced thermal stability [4]. As the UFbecomes cross-linked the residual heat of curing becomes
0
0.5
1
1.5
2
2.5
Endo
hea
t flow
exo
(W/g
)
50 100 150 200 250 300 350 450400Temperature (∘C)
Sample E: 80wt% Sago + 20wt% UFSample D: 90wt% Sago + 10wt% UFSample F: 70wt% Sago + 30wt% UF
Figure 10: Sago/UF Sample with different weight fraction analysisby DSC.
smaller and is causing the sample to cure more [28]. It seemsthat the particles size plays a synergistic role in improving thethermal resistance of the composite.
3.5. Sago Composite with Different Weight Fraction Analysisby DSC. Figure 10 shows the DSC thermogram of Sagoparticleboard with different weight fraction. The organiccompound had melted and decomposed with the pattern asshown in the thermogram in Figure 10 [28].This showed thatamorphous structure occurred in the particleboard and theliquid crystals remained anisotropic after the melting peak[28]. Sample F reached the melting peak at 80∘C, sample Eat 78∘C, and sample D at 77∘C, respectively. The lower tem-perature peak is caused by the structural reorganization andamorphous portion that developed into crystallinity [29].
Based on the result, sample E showed better curingproperties than sample D.This is due to the sufficiency of UFapplied on Sago particles, which had created homogeneousdispersion in the particleboard and improved the cross-linking reaction between the starch granules [27].
The largest area of sample F showed the least curingproperties compared to other samples and requested max-imum of heat release due to the Sago particles and UFcuring and water reaction [30].This could be due to excessivematrix where there is little change of the crystal perfectionor degree of crystallinity by increasing the weight fractionduringmanufacturing process [29]. Hence, the curing periodbecomes longer. The increase in the melting temperature canbe attributed by two factors: incomplete curing reaction andincrease in the free volume of the system [8]. The decrease inthe free volume is proposed to be responsible for increasingthe melting temperature because of the addition of matrixin the particleboard. On the other hand, the particleboardwith different loadings of Sago particles and matrix hadhigher melting temperature which may be attributed to thereinforcement effect and restrict the motion between Sagoparticles and matrix that leads to increase in 𝑇
𝑚[4].
Sample F had the compact packing in structure orderwhile sample E of the particleboard had looser packing in
Advances in Materials Science and Engineering 7
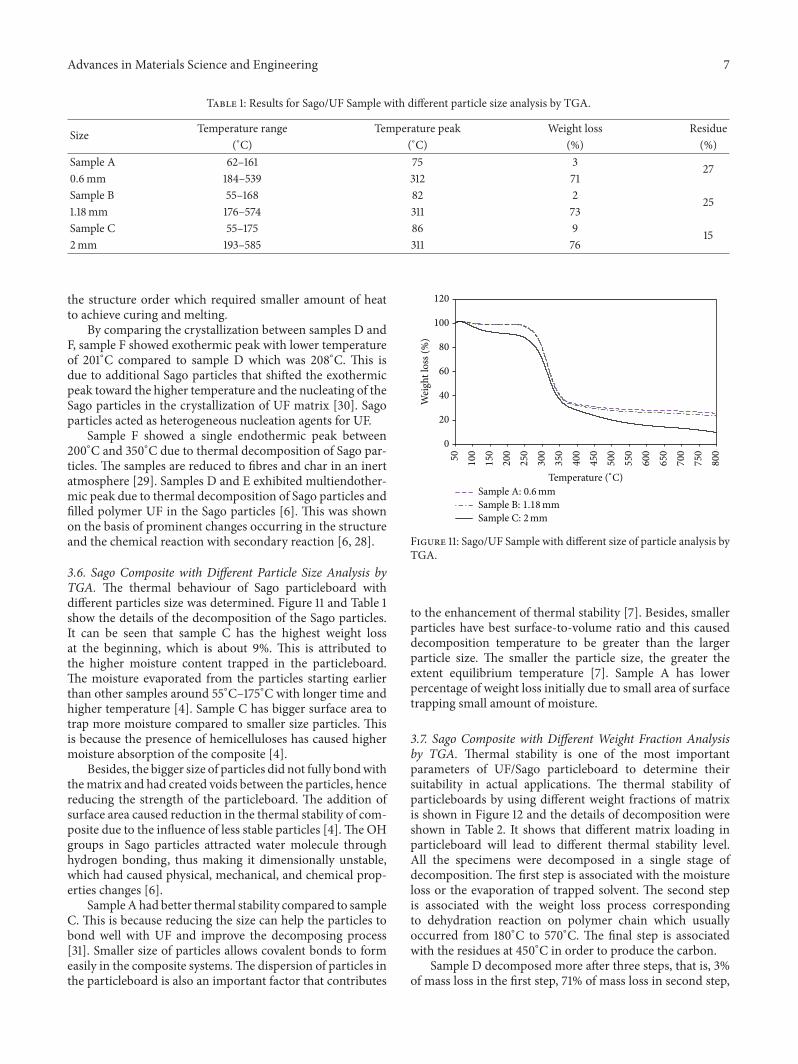
Table 1: Results for Sago/UF Sample with different particle size analysis by TGA.
Size Temperature range Temperature peak Weight loss Residue(∘C) (∘C) (%) (%)
Sample A 62–161 75 3 270.6mm 184–539 312 71Sample B 55–168 82 2 251.18mm 176–574 311 73Sample C 55–175 86 9 152mm 193–585 311 76
the structure order which required smaller amount of heatto achieve curing and melting.
By comparing the crystallization between samples D andF, sample F showed exothermic peak with lower temperatureof 201∘C compared to sample D which was 208∘C. This isdue to additional Sago particles that shifted the exothermicpeak toward the higher temperature and the nucleating of theSago particles in the crystallization of UF matrix [30]. Sagoparticles acted as heterogeneous nucleation agents for UF.
Sample F showed a single endothermic peak between200∘C and 350∘C due to thermal decomposition of Sago par-ticles. The samples are reduced to fibres and char in an inertatmosphere [29]. Samples D and E exhibited multiendother-mic peak due to thermal decomposition of Sago particles andfilled polymer UF in the Sago particles [6]. This was shownon the basis of prominent changes occurring in the structureand the chemical reaction with secondary reaction [6, 28].
3.6. Sago Composite with Different Particle Size Analysis byTGA. The thermal behaviour of Sago particleboard withdifferent particles size was determined. Figure 11 and Table 1show the details of the decomposition of the Sago particles.It can be seen that sample C has the highest weight lossat the beginning, which is about 9%. This is attributed tothe higher moisture content trapped in the particleboard.The moisture evaporated from the particles starting earlierthan other samples around 55∘C–175∘C with longer time andhigher temperature [4]. Sample C has bigger surface area totrap more moisture compared to smaller size particles. Thisis because the presence of hemicelluloses has caused highermoisture absorption of the composite [4].
Besides, the bigger size of particles did not fully bondwiththematrix and had created voids between the particles, hencereducing the strength of the particleboard. The addition ofsurface area caused reduction in the thermal stability of com-posite due to the influence of less stable particles [4].The OHgroups in Sago particles attracted water molecule throughhydrogen bonding, thus making it dimensionally unstable,which had caused physical, mechanical, and chemical prop-erties changes [6].
SampleAhad better thermal stability compared to sampleC. This is because reducing the size can help the particles tobond well with UF and improve the decomposing process[31]. Smaller size of particles allows covalent bonds to formeasily in the composite systems.The dispersion of particles inthe particleboard is also an important factor that contributes
0
20
40
60
80
100
120
Wei
ght l
oss (
%)
80050 100
150
200
250
300
350
400
450
500
550
600
650
700
750
Temperature (∘C)
Sample C: 2mmSample B: 1.18mmSample A: 0.6mm
Figure 11: Sago/UF Sample with different size of particle analysis byTGA.
to the enhancement of thermal stability [7]. Besides, smallerparticles have best surface-to-volume ratio and this causeddecomposition temperature to be greater than the largerparticle size. The smaller the particle size, the greater theextent equilibrium temperature [7]. Sample A has lowerpercentage of weight loss initially due to small area of surfacetrapping small amount of moisture.
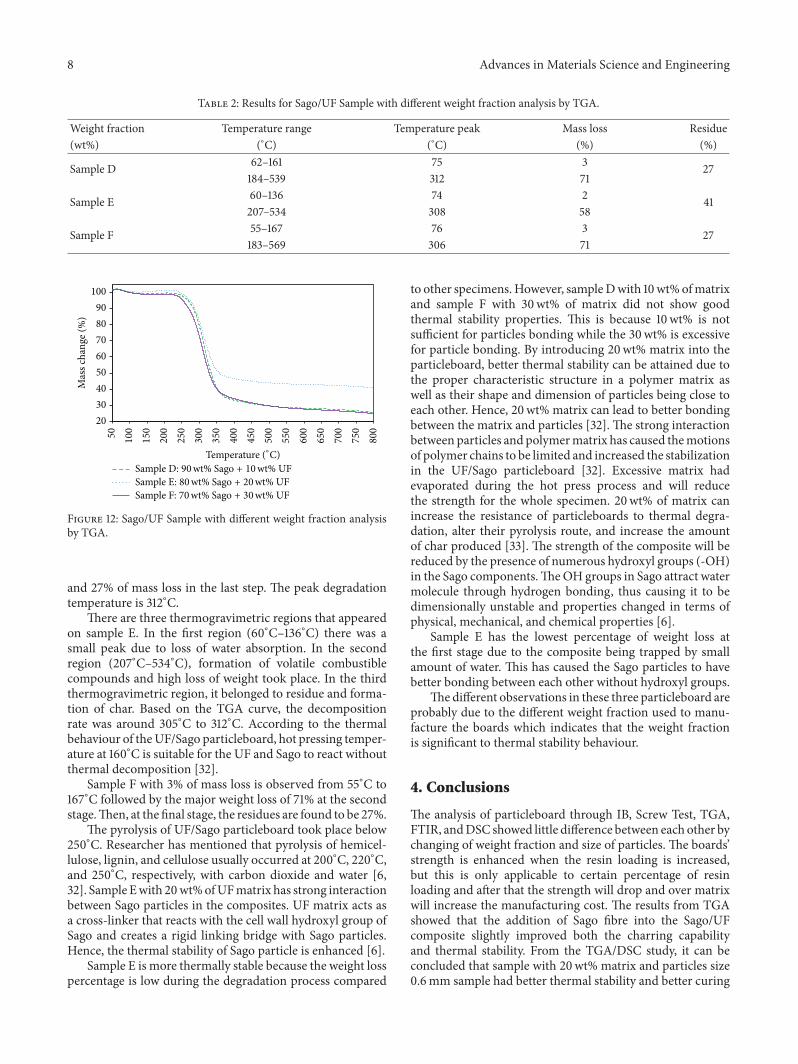
3.7. Sago Composite with Different Weight Fraction Analysisby TGA. Thermal stability is one of the most importantparameters of UF/Sago particleboard to determine theirsuitability in actual applications. The thermal stability ofparticleboards by using different weight fractions of matrixis shown in Figure 12 and the details of decomposition wereshown in Table 2. It shows that different matrix loading inparticleboard will lead to different thermal stability level.All the specimens were decomposed in a single stage ofdecomposition. The first step is associated with the moistureloss or the evaporation of trapped solvent. The second stepis associated with the weight loss process correspondingto dehydration reaction on polymer chain which usuallyoccurred from 180∘C to 570∘C. The final step is associatedwith the residues at 450∘C in order to produce the carbon.
Sample D decomposed more after three steps, that is, 3%of mass loss in the first step, 71% of mass loss in second step,
8 Advances in Materials Science and Engineering
Table 2: Results for Sago/UF Sample with different weight fraction analysis by TGA.
Weight fraction Temperature range Temperature peak Mass loss Residue(wt%) (∘C) (∘C) (%) (%)
Sample D 62–161 75 3 27184–539 312 71
Sample E 60–136 74 2 41207–534 308 58
Sample F 55–167 76 3 27183–569 306 71
2030405060708090
100
Mas
s cha
nge (
%)
80050 100
150
200
250
300
350
400
450
500
550
600
650
700
750
Temperature (∘C)
Sample E: 80wt% Sago + 20wt% UFSample D: 90wt% Sago + 10wt% UF
Sample F: 70wt% Sago + 30wt% UF
Figure 12: Sago/UF Sample with different weight fraction analysisby TGA.
and 27% of mass loss in the last step. The peak degradationtemperature is 312∘C.
There are three thermogravimetric regions that appearedon sample E. In the first region (60∘C–136∘C) there was asmall peak due to loss of water absorption. In the secondregion (207∘C–534∘C), formation of volatile combustiblecompounds and high loss of weight took place. In the thirdthermogravimetric region, it belonged to residue and forma-tion of char. Based on the TGA curve, the decompositionrate was around 305∘C to 312∘C. According to the thermalbehaviour of theUF/Sago particleboard, hot pressing temper-ature at 160∘C is suitable for the UF and Sago to react withoutthermal decomposition [32].
Sample F with 3% of mass loss is observed from 55∘C to167∘C followed by the major weight loss of 71% at the secondstage.Then, at the final stage, the residues are found to be 27%.
The pyrolysis of UF/Sago particleboard took place below250∘C. Researcher has mentioned that pyrolysis of hemicel-lulose, lignin, and cellulose usually occurred at 200∘C, 220∘C,and 250∘C, respectively, with carbon dioxide and water [6,32]. Sample Ewith 20wt%ofUFmatrix has strong interactionbetween Sago particles in the composites. UF matrix acts asa cross-linker that reacts with the cell wall hydroxyl group ofSago and creates a rigid linking bridge with Sago particles.Hence, the thermal stability of Sago particle is enhanced [6].
Sample E is more thermally stable because the weight losspercentage is low during the degradation process compared
to other specimens.However, sampleDwith 10wt%ofmatrixand sample F with 30wt% of matrix did not show goodthermal stability properties. This is because 10wt% is notsufficient for particles bonding while the 30wt% is excessivefor particle bonding. By introducing 20wt% matrix into theparticleboard, better thermal stability can be attained due tothe proper characteristic structure in a polymer matrix aswell as their shape and dimension of particles being close toeach other. Hence, 20wt% matrix can lead to better bondingbetween the matrix and particles [32]. The strong interactionbetween particles and polymermatrix has caused themotionsof polymer chains to be limited and increased the stabilizationin the UF/Sago particleboard [32]. Excessive matrix hadevaporated during the hot press process and will reducethe strength for the whole specimen. 20wt% of matrix canincrease the resistance of particleboards to thermal degra-dation, alter their pyrolysis route, and increase the amountof char produced [33]. The strength of the composite will bereduced by the presence of numerous hydroxyl groups (-OH)in the Sago components.TheOH groups in Sago attract watermolecule through hydrogen bonding, thus causing it to bedimensionally unstable and properties changed in terms ofphysical, mechanical, and chemical properties [6].
Sample E has the lowest percentage of weight loss atthe first stage due to the composite being trapped by smallamount of water. This has caused the Sago particles to havebetter bonding between each other without hydroxyl groups.
Thedifferent observations in these three particleboard areprobably due to the different weight fraction used to manu-facture the boards which indicates that the weight fractionis significant to thermal stability behaviour.
4. Conclusions
The analysis of particleboard through IB, Screw Test, TGA,FTIR, andDSC showed little difference between each other bychanging of weight fraction and size of particles. The boards’strength is enhanced when the resin loading is increased,but this is only applicable to certain percentage of resinloading and after that the strength will drop and over matrixwill increase the manufacturing cost. The results from TGAshowed that the addition of Sago fibre into the Sago/UFcomposite slightly improved both the charring capabilityand thermal stability. From the TGA/DSC study, it can beconcluded that sample with 20wt% matrix and particles size0.6mm sample had better thermal stability and better curing
Advances in Materials Science and Engineering 9
properties. This is because the samples were fully bonded bythe UF matrix. Based on the TGA, the degradation of hemi-cellulose, cellulose, and lignin can be observed followed bya further slow degradation until a fixed carbon was achievedat 800∘C. FTIR analysis showed the concurrences of bondingbetween functional groups of Sago fibre and UF, which con-firmed that the reactions between all the components havebeen taking place in the composite system. All the particle-boards that met the M-0, M-1, M-2, and M-3 specification ofAmerican National Standard A208.1-2009 fulfilled the indus-trial and commercial application.
Conflict of Interests
The authors declare that there is no conflict of interestsregarding the publication of this paper.
Acknowledgments
The authors would like to acknowledge the Faculty of Engi-neering at Universiti Malaysia Sarawak, Hexzachem SarawakSdn Bhd, and The Forestry Sarawak for the use of their labfacilities and support.
References
[1] D. S. Awg-Adeni, S. Abd-Aziz, K. Bujang, and M. A. Hassan,“Bioconversion of sago residue into value added products,”African Journal of Biotechnology, vol. 9, no. 14, pp. 2016–2021,2010.
[2] P.A. P.Mamza, E. C. Ezeh, E. C.Gimba, andD. E.Arthur, “Com-parative study of phenol formaldehyde and urea formaldehydeparticleboards from wood waste for sustainable environment,”International Journal of Scientific & Technology Research, vol. 3,no. 9, pp. 53–61, 2014.
[3] S. Oza, R. Wang, and N. Lu, “Thermal and mechanical prop-erties of recycled high density polyethylene/hemp fiber com-posites,” International Journal of Applied Science andTechnology,vol. 1, no. 5, pp. 31–36, 2011.
[4] V. Chandra Sekhar, V. Pandurangadu, and T. Subba Rao, “TGA,DSC, DTG properties of epoxy composites reinforced withfeather fibers of ‘Emu’ bird,” International Journal of InnovativeResearch in Science, Engineering and Technology, vol. 3, no. 5, pp.13017–13023, 2014.
[5] S.-Y. Fu, X.-Q. Feng, B. Lauke, and Y.-W.Mai, “Effects of particlesize, particle/matrix interface adhesion and particle loadingon mechanical properties of particulate-polymer composites,”Composites Part B: Engineering, vol. 39, no. 6, pp. 933–961, 2008.
[6] M. S. Islam, S. Hamdan, H. R. Sobuz, R. Rahman, and A. S.Ahmed, “Thermal and decay-resistance properties of tropicalwood-plastic composites,” Journal of Composite Materials, vol.47, no. 12, pp. 1493–1500, 2012.
[7] T. Hatakeyama and F. X. Quinn,Thermal Analysis—Fundamen-tals and Applications to Polymer Science, John Wiley & Sons,1994.
[8] Z. N. Azwa and B. F. Yousif, “Thermal degradation study ofkenaf fibre/epoxy composites using thermos gravimetric analy-sis,” in Proceedings of the 3rdMalaysian Postgraduate Conference(MPC ’13), pp. 256–264, Sydney, Australia, July 2013.
[9] T. C. Chiang, S. Hamdan, and M. S. B. Osman, “The effect ofweight fraction and size on the properties of sago particles urea
formaldehyde particleboard,” Jurnal Teknologi, vol. 73, no. 1, pp.61–67, 2015.
[10] JIS A 5908, Japanese Industrial Standard Particle Boards,Japanese Standards Association, 1994.
[11] M. Jani and I. Kamal, “Mechanical and physical properties oflow density kenaf core particleboards bonded with differentresins,” Journal of Science and Technology, vol. 4, no. 1, 2012.
[12] Z. Pan, Y. Zheng, R. Zhang, and B. M. Jenkins, “Physicalproperties of thin particleboard made from saline eucalyptus,”Industrial Crops and Products, vol. 26, no. 2, pp. 185–194, 2007.
[13] S. M. Jani, M. P. Koh, M. Suffian, M. Rafeadah, and R. Salmiah,“Development of low density particleboard using kenaf core:mechanical and physical testing results,” Journal of Science andTechnology, 2010.
[14] M. Jawaid, H. P. S. Abdul Khalil, and A. Abu Bakar, “Hybridcomposites of oil palm empty fruit bunches/woven jute fiber:chemical resistance, physical, and impact properties,” Journal ofComposite Materials, vol. 45, no. 24, pp. 2515–2522, 2011.
[15] R. O. Ebewele, B. H. River, and G. E. Myers, “Behavior ofamine-modified urea-formaldehyde-bondedwood joints at lowformaldehyde/urea molar ratios,” Journal of Applied PolymerScience, vol. 52, no. 5, pp. 689–700, 1994.
[16] Z. Cai, Q. Wu, J. N. Lee, and S. Hiziroglu, “Influence of boarddensity, mat construction, and chip type on performance ofparticleboard made from eastern redcedar,” Forest ProductsJournal, vol. 54, no. 12, pp. 226–232, 2004.
[17] V. Vassiliou and I. Barboutis, “Screw withdrawal capacity usedin the eccentric joints of cabinet furniture connectors in parti-cleboard and MDF,” Journal of Wood Science, vol. 51, no. 6, pp.572–576, 2005.
[18] A. J. H. Ahmad, J. Kasim, and A. L. Mohmod, “Properties ofsingle-layer urea formaldehyde particleboard manufacturedfrom commonly utilized malaysian bamboo (Gigantochloascortechinii),” Journal of Bamboo and Rattan, vol. 1, no. 2, pp.109–117, 2002.
[19] M. E. Selamat, O. Sulaiman, R. Hashim et al., “Measurementof some particleboard properties bonded with modified car-boxymethyl starch of oil palm trunk,”Measurement, vol. 53, pp.251–259, 2014.
[20] J. Zhang, X. Wang, S. Zhang, Q. Gao, and J. Li, “Effectsof melamine addition stage on the performance and curingbehavior ofmelamine-urea-formaldehyde (MUF) resin,”BioRe-sources, vol. 8, no. 4, pp. 5500–5514, 2013.
[21] A. Gurses, S. Karagoz, F. Mindivan, K. Gunes, C. Dogar, andS. Akturk, “Preparation and characterization of urea/formalde-hyde/rosaCanina sp. seeds composites,” inProceedings of the 3rdInternational Advances in Applied Physics and Materials ScienceCongress (APMAS ’13), vol. 125, Antalya, Turkey, April 2013.
[22] N. Sarifuddin, H. Ismail, and Z. Ahmad, “The effect of kenafcore fibre loading on properties of low density polyethylene/thermoplastic sago starch/kenaf core fiber composites,” Journalof Physical Science, vol. 24, no. 2, pp. 97–115, 2013.
[23] B. Yaacob, M. C. I. M. Amin, K. Hashim, and B. A. Bakar,“Optimization of reaction conditions for carboxymethylatedsago starch,” Iranian Polymer Journal, vol. 20, no. 3, pp. 195–204,2011.
[24] S. F. Sim,M.Mohamed, N. A. L. M. I. Lu, N. S. P. Sarman, and S.N. S. Samsudin, “Computer-assisted analysis of fourier thrans-form infrared (FTIR) spectra for characterization of varioustreated and untreated agriculture biomas,” Bioresources, vol. 7,no. 4, pp. 5367–5380, 2012.
10 Advances in Materials Science and Engineering
[25] Z. Ahmad, H. Anuar, and Y. Yusof, “The study of biodegradablethermoplastics sago starch,”Key EngineeringMaterials, vol. 471-472, pp. 397–402, 2011.
[26] M. S. Islam, S. Hamdan, and M. R. Rahman, “Effects ofpolymer loading on tropical wood polymer composite (WPC),”Advanced Materials Research, vol. 264-265, pp. 631–635, 2011.
[27] N. S. Sulaiman, R. Hashim, M. H. M. Amini, O. Sulaiman,and S. Hiziroglu, “Evaluation of the properties of particleboardmade using oil palm starch modified with epichlorohydrin,”BioResources, vol. 8, no. 1, pp. 283–301, 2013.
[28] UserCom 1/2000, Chapter 11: Information for users of MettlerToledo thermal analysis systems, http://www.masontechnology.ie/x/Usercom 11.pdf.
[29] D. D. L. Chung, “Thermal analysis of carbon fiber polymer-matrix composites by electrical resistance measurement,”Ther-mochimica Acta, vol. 364, no. 1-2, pp. 121–132, 2000.
[30] H. Bouafif, A. Koubaa, P. Perre, A. Cloutier, and B. Riedl,“Wood particle/high-density polyethylene composites: thermalsensitivity and nucleating ability of wood particles,” Journal ofApplied Polymer Science, vol. 113, no. 1, pp. 593–600, 2009.
[31] T. W. Goodrich, The physical properties and microstructuralchanges of composite materials at elevated temperature [Masterof Science in Mechanical Engineering], 2009.
[32] C. E. Corcione andM. Frigione, “Characterization of nanocom-posites by thermal analysis,”Materials, vol. 5, no. 12, pp. 2960–2980, 2012.
[33] P. S. Karastergiou and J. L. Philippou, “Thermogravimetric anal-ysis of fire retardant treated particleboard,” in Wood and FireSafetry, pp. 385–394, 2000.

Submit your manuscripts athttp://www.hindawi.com
ScientificaHindawi Publishing Corporationhttp://www.hindawi.com Volume 2014
CorrosionInternational Journal of
Hindawi Publishing Corporationhttp://www.hindawi.com Volume 2014
Polymer ScienceInternational Journal of
Hindawi Publishing Corporationhttp://www.hindawi.com Volume 2014
Hindawi Publishing Corporationhttp://www.hindawi.com Volume 2014
CeramicsJournal of
Hindawi Publishing Corporationhttp://www.hindawi.com Volume 2014
CompositesJournal of
NanoparticlesJournal of
Hindawi Publishing Corporationhttp://www.hindawi.com Volume 2014
Hindawi Publishing Corporationhttp://www.hindawi.com Volume 2014
International Journal of
Biomaterials
Hindawi Publishing Corporationhttp://www.hindawi.com Volume 2014
NanoscienceJournal of
TextilesHindawi Publishing Corporation http://www.hindawi.com Volume 2014
Journal of
NanotechnologyHindawi Publishing Corporationhttp://www.hindawi.com Volume 2014
Journal of
CrystallographyJournal of
Hindawi Publishing Corporationhttp://www.hindawi.com Volume 2014
The Scientific World JournalHindawi Publishing Corporation http://www.hindawi.com Volume 2014
Hindawi Publishing Corporationhttp://www.hindawi.com Volume 2014
CoatingsJournal of
Advances in
Materials Science and EngineeringHindawi Publishing Corporationhttp://www.hindawi.com Volume 2014
Smart Materials Research
Hindawi Publishing Corporationhttp://www.hindawi.com Volume 2014
Hindawi Publishing Corporationhttp://www.hindawi.com Volume 2014
MetallurgyJournal of
Hindawi Publishing Corporationhttp://www.hindawi.com Volume 2014
BioMed Research International
MaterialsJournal of
Hindawi Publishing Corporationhttp://www.hindawi.com Volume 2014
Nano
materials
Hindawi Publishing Corporationhttp://www.hindawi.com Volume 2014
Journal ofNanomaterials


![Jurnal Politeknik Negeri Lhokseumawejurnal.pnl.ac.id/wp-content/plugins/Flutter/files...perekat urea formaldehyde nilai MOE belum memenuhi standar SNI [7]. ... Spatula, Neraca Analitik,](https://img.pdfslide.tips/doc/110x75/611d7fda22e4db004f57a805/jurnal-politeknik-negeri-perekat-urea-formaldehyde-nilai-moe-belum-memenuhi.jpg)