Embed Size (px)
Citation preview
page.
NUS: Research Methodology
Research Methodology 06-Writing Report-
Feb 18, 2016
Chihiro Shimizu (清水千弘)シンガポール国立大学
Professor, Institute of Real Estate Studies National University of Singapore
page.
NUS: Research MethodologyNUS: Research Methodology
page.
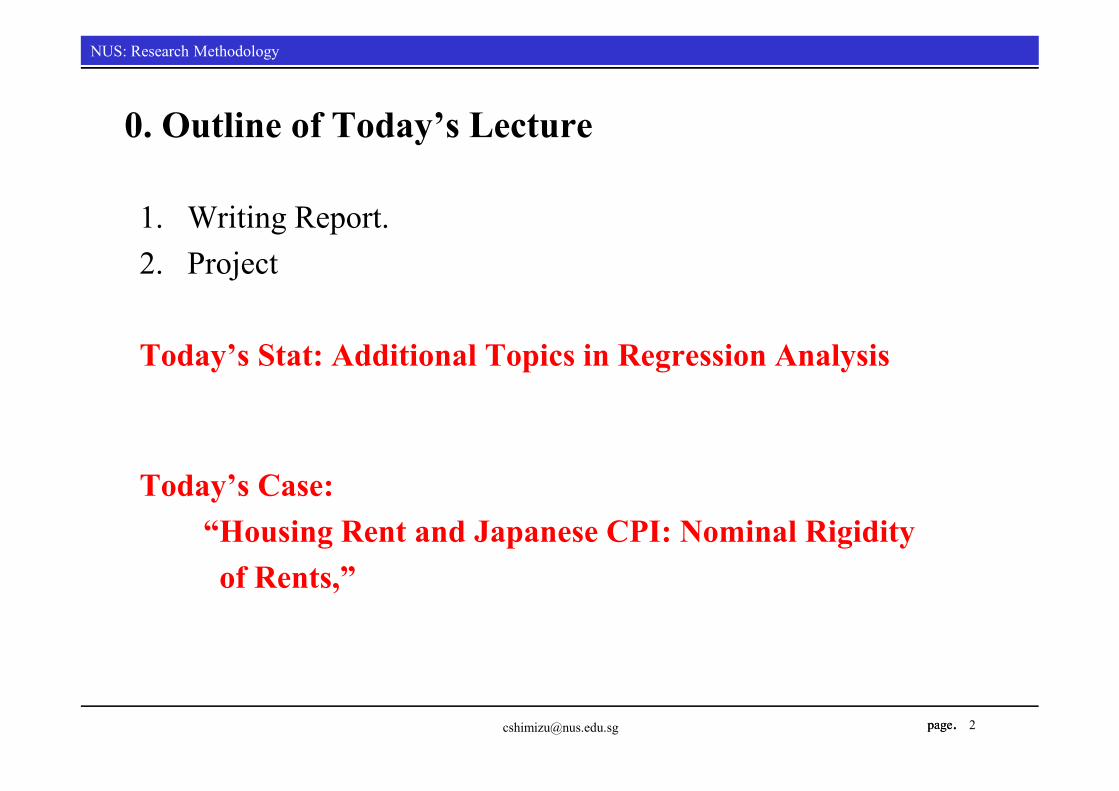
0. Outline of Today’s Lecture
1. Writing Report.2. Project
Today’s Stat: Additional Topics in Regression Analysis
Today’s Case: “Housing Rent and Japanese CPI: Nominal Rigidity of Rents,”

page.
NUS: Research MethodologyNUS: Research Methodology
page.
1. Writing Report
• How to structure a research report?• How to find your own writing style? • How to develop your skills in academic writing? • How to write to different audiences?
• The question of research writing has been discussed by many researchers during the past decades.
• Although there is no single answer to the question of how we should represent and write research, there are some common issues that we find relevant.
page.
NUS: Research MethodologyNUS: Research Methodology
page.
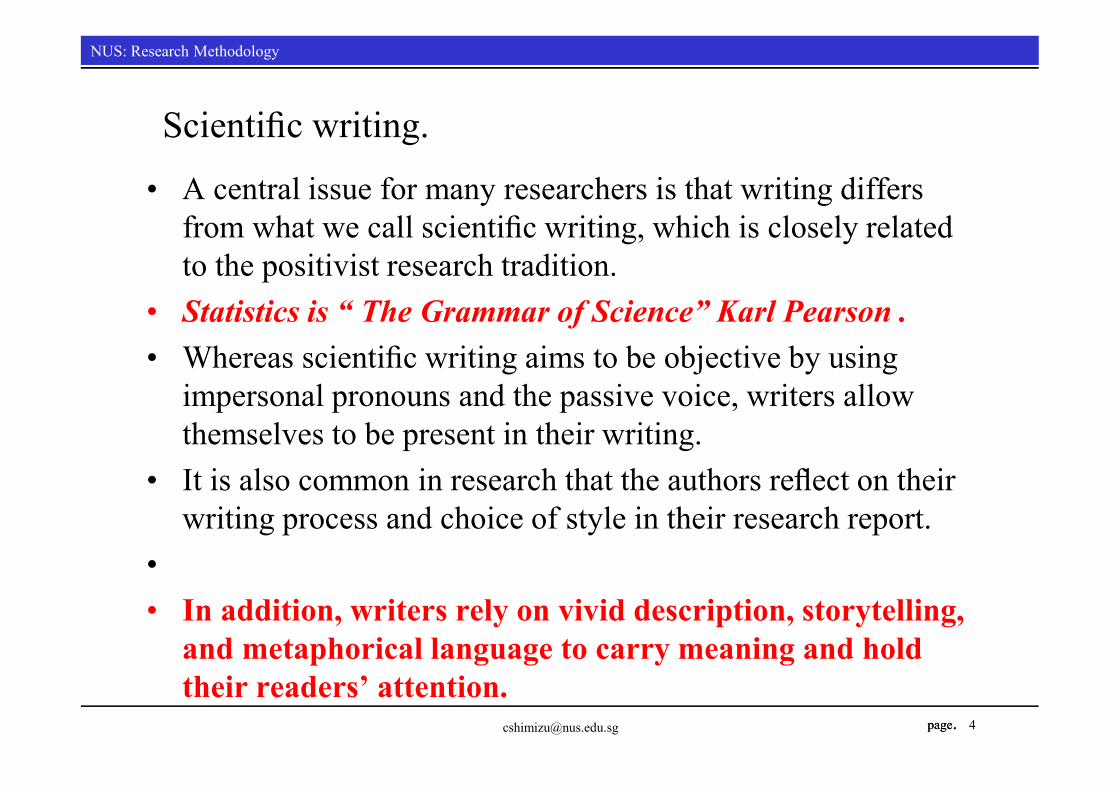
Scientific writing.• A central issue for many researchers is that writing differs
from what we call scientific writing, which is closely related to the positivist research tradition.
• Statistics is “ The Grammar of Science” Karl Pearson .• Whereas scientific writing aims to be objective by using
impersonal pronouns and the passive voice, writers allow themselves to be present in their writing.
• It is also common in research that the authors reflect on their writing process and choice of style in their research report.
•• In addition, writers rely on vivid description, storytelling,
and metaphorical language to carry meaning and hold their readers’ attention.
page.
NUS: Research MethodologyNUS: Research Methodology
page.
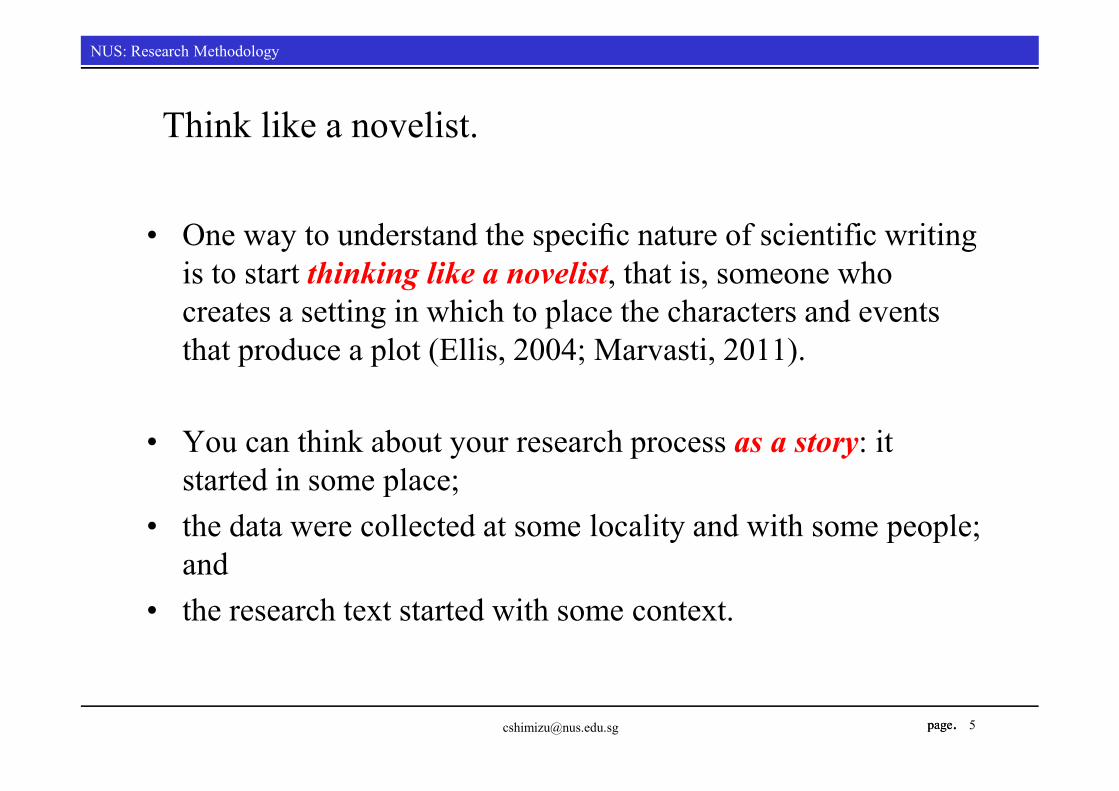
Think like a novelist.
• One way to understand the specific nature of scientific writing is to start thinking like a novelist, that is, someone who creates a setting in which to place the characters and events that produce a plot (Ellis, 2004; Marvasti, 2011).
• You can think about your research process as a story: it started in some place;
• the data were collected at some locality and with some people; and
• the research text started with some context.
page.
NUS: Research MethodologyNUS: Research Methodology
page.
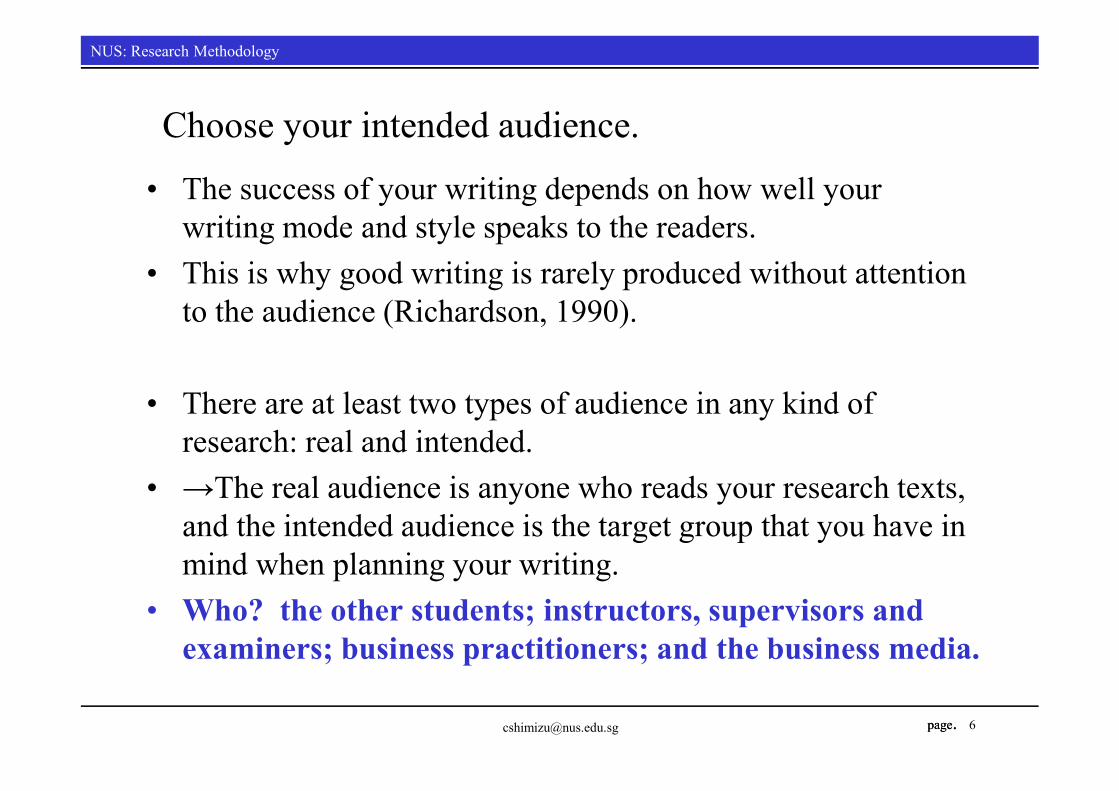
Choose your intended audience.• The success of your writing depends on how well your
writing mode and style speaks to the readers. • This is why good writing is rarely produced without attention
to the audience (Richardson, 1990).
• There are at least two types of audience in any kind of research: real and intended.
• →The real audience is anyone who reads your research texts, and the intended audience is the target group that you have in mind when planning your writing.
• Who? the other students; instructors, supervisors and examiners; business practitioners; and the business media.

page.
NUS: Research MethodologyNUS: Research Methodology
page.
The structure of the research report. • Many researchers begin to write a research report with
crafting an outline, including a table of contents. When writing these, it is necessary to make some decisions about the structure of the research report.
• It is common to make a distinction between the macro-and micro-structure of a research report.
• The macro-structure refers to how the main sections or chapters are organized in the report, and the micro-structure indicates what the more detailed structural choices are.

page.
NUS: Research MethodologyNUS: Research Methodology
page.
Good research report.• In the same way as any good research report, scientific
writing deals with the following tasks:
• a) introducing the purpose of the research, • b) critically reviewing and referring to the literature; • c) describing the methods used, analyses made, and• d) discoveries achieved, as well as providing discussion and • e) conclusions about the topic studied (Marvasti, 2011).
page.
NUS: Research MethodologyNUS: Research Methodology
page.
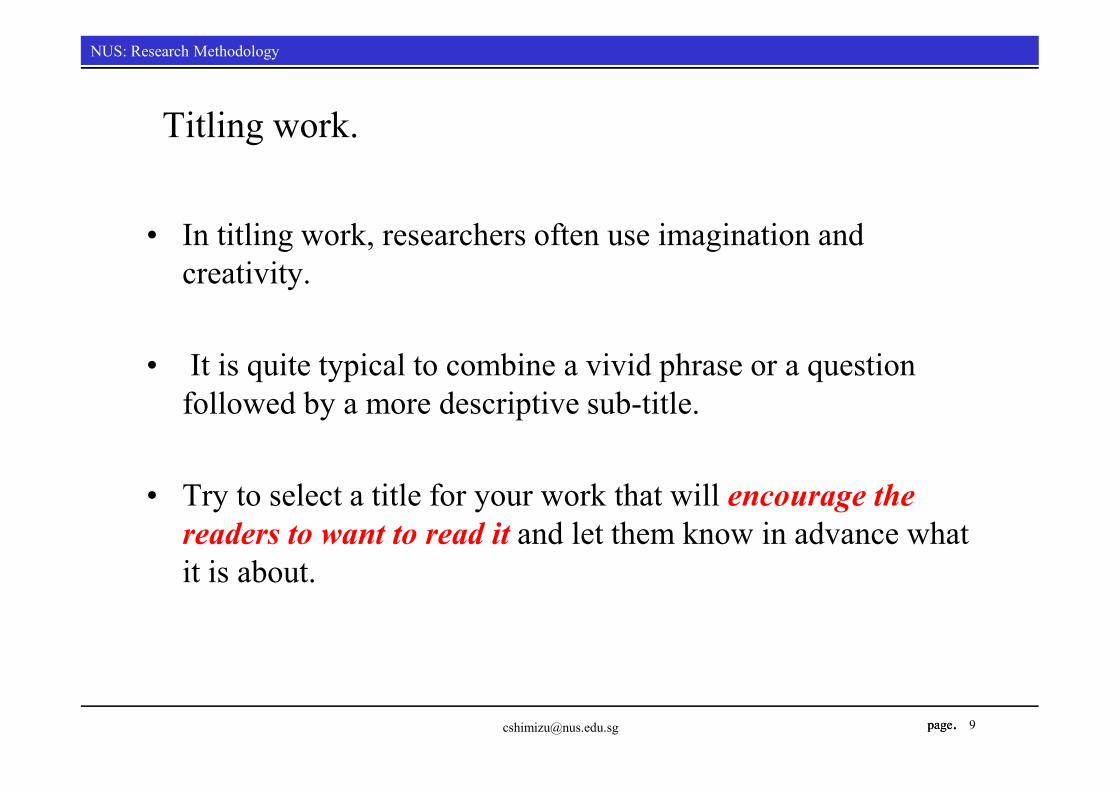
Titling work.
• In titling work, researchers often use imagination and creativity.
• It is quite typical to combine a vivid phrase or a question followed by a more descriptive sub-title.
• Try to select a title for your work that will encourage the readers to want to read it and let them know in advance what it is about.
page.
NUS: Research MethodologyNUS: Research Methodology
page.
(1) Introduction
• The introduction is where you give your intended audience reasons to read your research text.
• Therefore, you should be able to convince the reader that your research is important and relevant to them.
page.
NUS: Research MethodologyNUS: Research Methodology
page.
(2) Literature Review
• When introducing your research, you usually position your research within the prior research done by other researchers on the same topic, and within a specific theoretical approach (see Lecture 2).
• Wolcott (2009) argues, however, that the conventional organization of the literature in one separate section in the beginning of your research report is unhelpful to most qualitative researchers.
page.
NUS: Research MethodologyNUS: Research Methodology
page.
(3) Describing methodology and methods• A description of your methodology and methods should give a
detailed account of the research process: • a) what was done; • b) how and why. • This is most often done in a separate section outlining the
methodological approach and the specific methods used, the collection of empirical materials and their analysis, and the problems or issues that were raised during the study.
• Method : Hypothesis and Theory →Lecture 2• Data collecting→Lecture 3
page.
NUS: Research MethodologyNUS: Research Methodology
page.
(4) Presenting analysis • One central issue concerning the structure of your research
report is to decide how you want to present your empirical analysis and your findings.
• While there is no one answer to this, you need to consider which way of presenting is suitable to your research design and research questions, and which way of presenting would appeal to your audience.
• Analyzing data→Lecture 4• Interpretation and Validation→Lecture 5
page.
NUS: Research MethodologyNUS: Research Methodology
page.
(5) Conclusions• A conclusions section can be as short as a few paragraphs or
as long as several pages; the length will depend on the complexity of your focus and results.
• The conclusion often includes a discussion of any new insights the research can contribute to the broader literature.
• Additionally, any limitations of your research should be stated, as well as the suggestions;
• Suggestions that you would have for future research.
page.
NUS: Research MethodologyNUS: Research Methodology
page.
2. Project• Project1: A report on “Aging and Housing Prices”.
• Project2: Literature Review.
• Deadline: March 20, 2016 5:00pm.
• File Name: Student Matric No+Name.docx• Exp: 149076ChihiroShimizu.docx
• IVLE folder.
page.
NUS: Research MethodologyNUS: Research Methodology
page.
Project1: A report on “Aging and Housing Prices”.• 1. Motivation as Introduction
• 2. Literature Review (at least 10 papers)
• 3. Data collection• Pick up 10 countries from database. (Please pick up your
favorite 10 countries)• Data: T02_PanelData.csv•• If you need to add several variables to this data, please find
new variables and revise your data.(Not necessarily)• Ex. interest rate, housing starts, etc
page.
NUS: Research MethodologyNUS: Research Methodology
page.
• 4. Empirical Model• Make figures, Summary stat, run OLS model based;• Pit = αi + β1i GDPPCit + β2i OLDDEPit + β3i TPOPit + eit• Pit: land prices, • GDPPCit : per capita GDP • OLDDEPit: old age dependency ratio• TPOPit: total population,
• Interpretation and validation your empirical results.
• 5. Conclusion
page.
NUS: Research MethodologyNUS: Research Methodology
page.
Project2: Literature Review• 1. Find your research topic.• Write your motivation.
• 2. Identify 5 keywords.
• 3. Find 10 papers.
• 4. Make “References”.
• 5. Literature Review.
page.
NUS: Research MethodologyNUS: Research Methodology
page.
W01. Title Page
• Title: Aging and House Prices• See. P.15
• (N A M E)
• (Student Matric No.)
• Key words: 5 Key words
page.
NUS: Research MethodologyNUS: Research Methodology
page.
W02. Introduction-Motivation-• Motivation to study or importance of study for “Aging and
Housing Market”.Lec02: What is a research problem?
• All progress is born of inquiry. Doubt is any day better than over confidence. Doubt leads to inquiry and inquiry leads to invention.
• Thus invention is the out come of research. Research may be motivated by the desire to know for the sake of knowing or by the desire to solve the practical problems.
• In research process, the first and foremost step is selecting and defining a research problem.
page.
NUS: Research MethodologyNUS: Research Methodology
page.
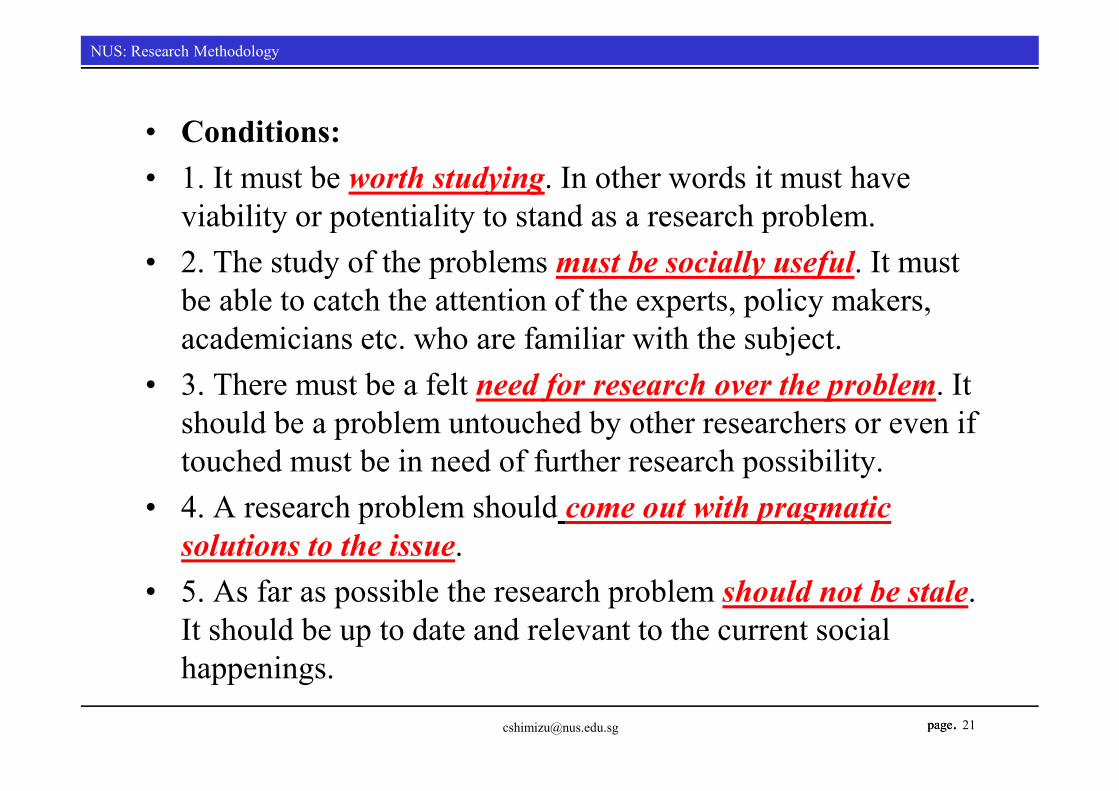
• Conditions: • 1. It must be worth studying. In other words it must have
viability or potentiality to stand as a research problem. • 2. The study of the problems must be socially useful. It must
be able to catch the attention of the experts, policy makers, academicians etc. who are familiar with the subject.
• 3. There must be a felt need for research over the problem. It should be a problem untouched by other researchers or even if touched must be in need of further research possibility.
• 4. A research problem should come out with pragmatic solutions to the issue.
• 5. As far as possible the research problem should not be stale. It should be up to date and relevant to the current social happenings.

page.
NUS: Research MethodologyNUS: Research Methodology
page.
W03: Literature Survey• Lec02 : Literature Survey & Tutorial 1.
• Positioning the study through literature• Find and read other’s work throughout your research process→The idea is to clarify and sharpen your research questions during the research process.
• Theories, theoretical concepts, and research findings that you read about will assist you with positioning your study in relation to prior knowledge.
→This positioning takes place with the help of prior research and through the development of your own research questions.
page.
NUS: Research MethodologyNUS: Research Methodology
page.
W04: Hypothesis & Theory • Lec02 : Hypothesis and Theory
• Although real estate studies emphasizes practical business problems, you must incorporate into the study some theoretical ideas and concepts.
• →In theory-driven research you pay a lot of attention to theoretical concepts right at the beginning of the study.
• In data-driven research you build the relationship between theoretical concepts and your data at later stages of the project. It is often helpful to make a distinction between theory (theoretical ideas and concepts) and prior research (studies dealing with empirical data).
page.
NUS: Research MethodologyNUS: Research Methodology
page.
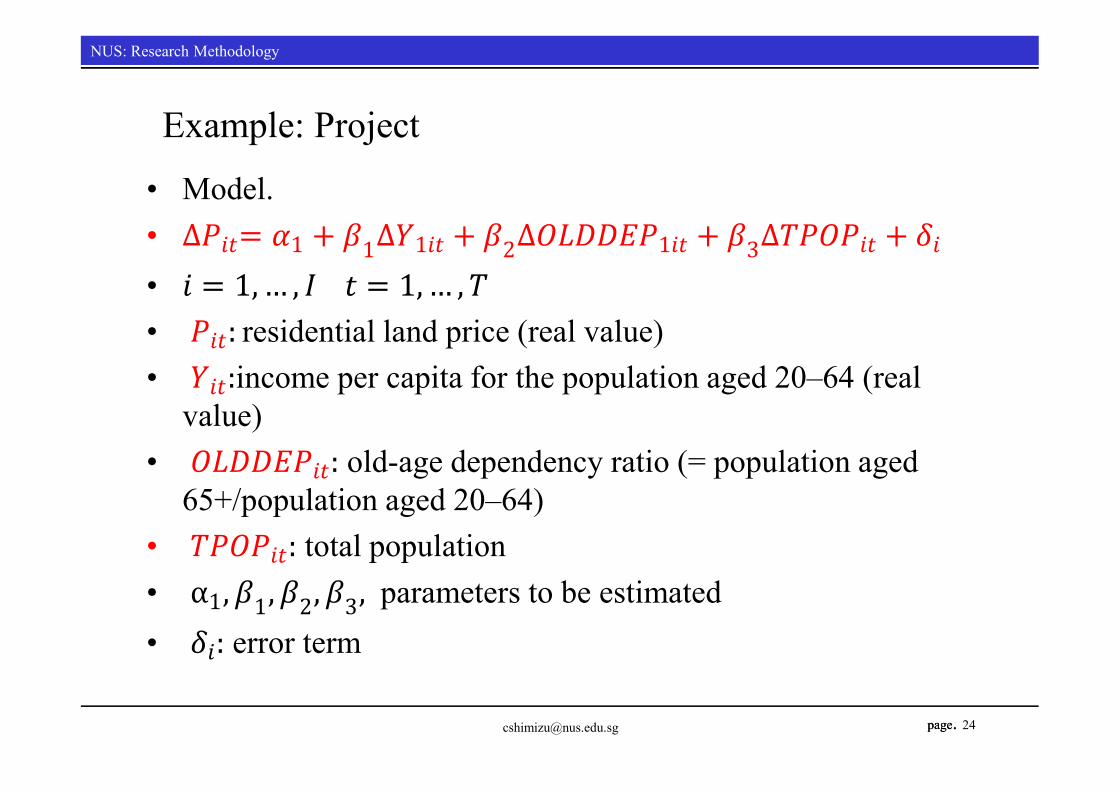
Example: Project• Model.• ∆ = 1 + 1∆ + 2∆ + 3∆ +• = 1, … , = 1, … ,• : residential land price (real value)• :income per capita for the population aged 20–64 (real
value)• : old-age dependency ratio (= population aged
65+/population aged 20–64)• : total population• α1, 1, 2, 3, parameters to be estimated • : error term
page.
NUS: Research MethodologyNUS: Research Methodology
page.
W05: Data • Lec03 : Data Collection• Lec04 : Research Question and Data• How to collect Data? Data source.• Primary data or secondary data.
• Primary data: The data which are collected from the field under the control and supervision of an investigator is known.
• Secondary data: If data are collected from journals, magazines, government publications, annual reports of companies, etc.
• The reliability of managerial decisions depends on the quality of data.
page.
NUS: Research MethodologyNUS: Research Methodology
page.
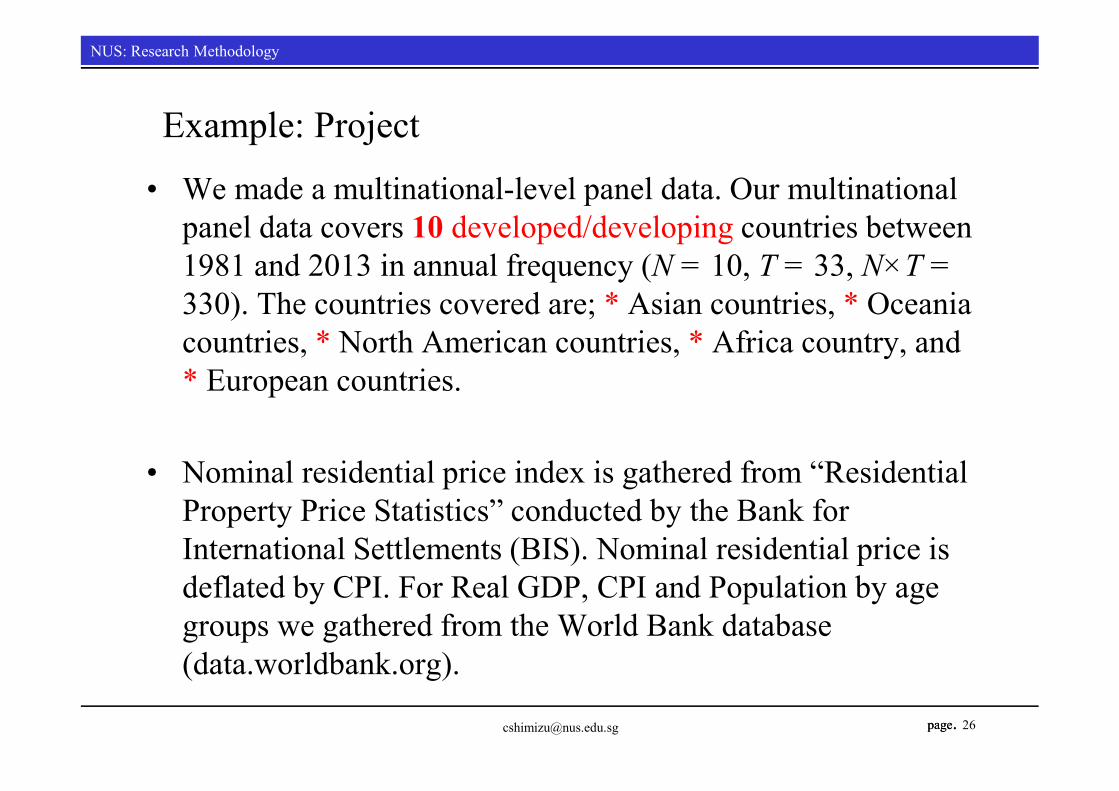
Example: Project• We made a multinational-level panel data. Our multinational
panel data covers 10 developed/developing countries between 1981 and 2013 in annual frequency (N = 10, T = 33, N×T = 330). The countries covered are; * Asian countries, * Oceania countries, * North American countries, * Africa country, and * European countries.
• Nominal residential price index is gathered from “Residential Property Price Statistics” conducted by the Bank for International Settlements (BIS). Nominal residential price is deflated by CPI. For Real GDP, CPI and Population by age groups we gathered from the World Bank database (data.worldbank.org).
page.
NUS: Research MethodologyNUS: Research Methodology
page.
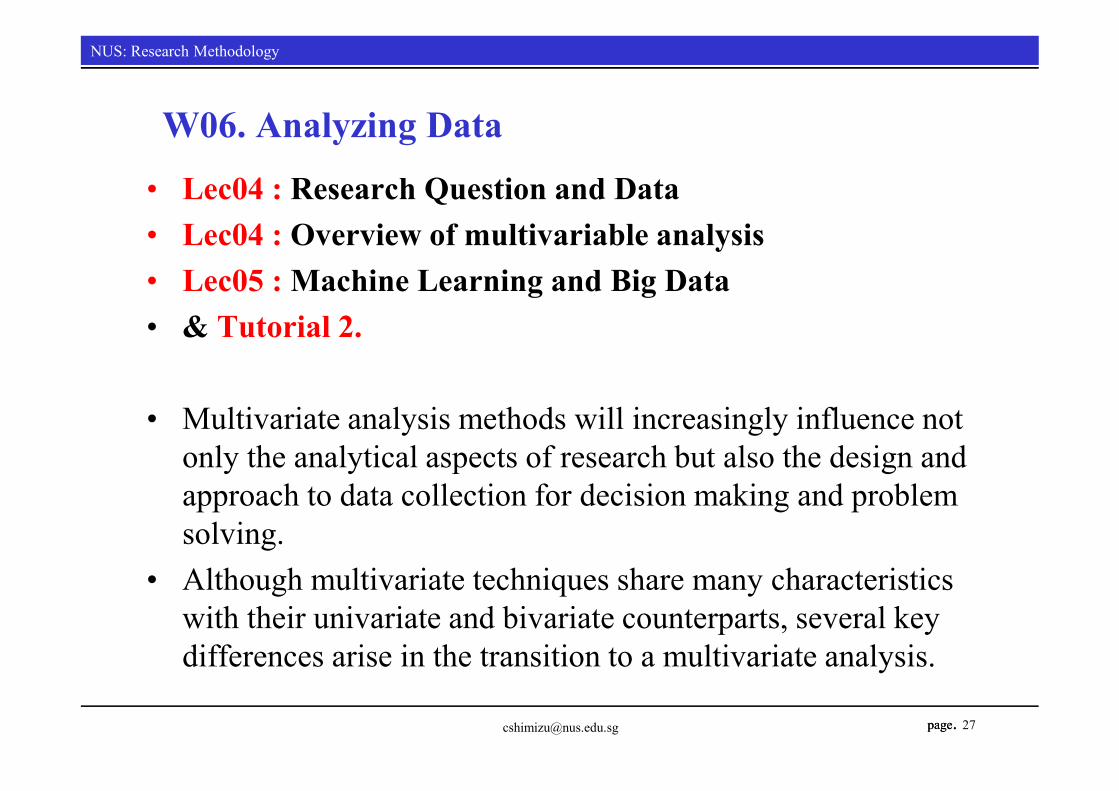
W06. Analyzing Data• Lec04 : Research Question and Data• Lec04 : Overview of multivariable analysis• Lec05 : Machine Learning and Big Data• & Tutorial 2.
• Multivariate analysis methods will increasingly influence not only the analytical aspects of research but also the design and approach to data collection for decision making and problem solving.
• Although multivariate techniques share many characteristics with their univariate and bivariate counterparts, several key differences arise in the transition to a multivariate analysis.
page.
NUS: Research MethodologyNUS: Research Methodology
page.
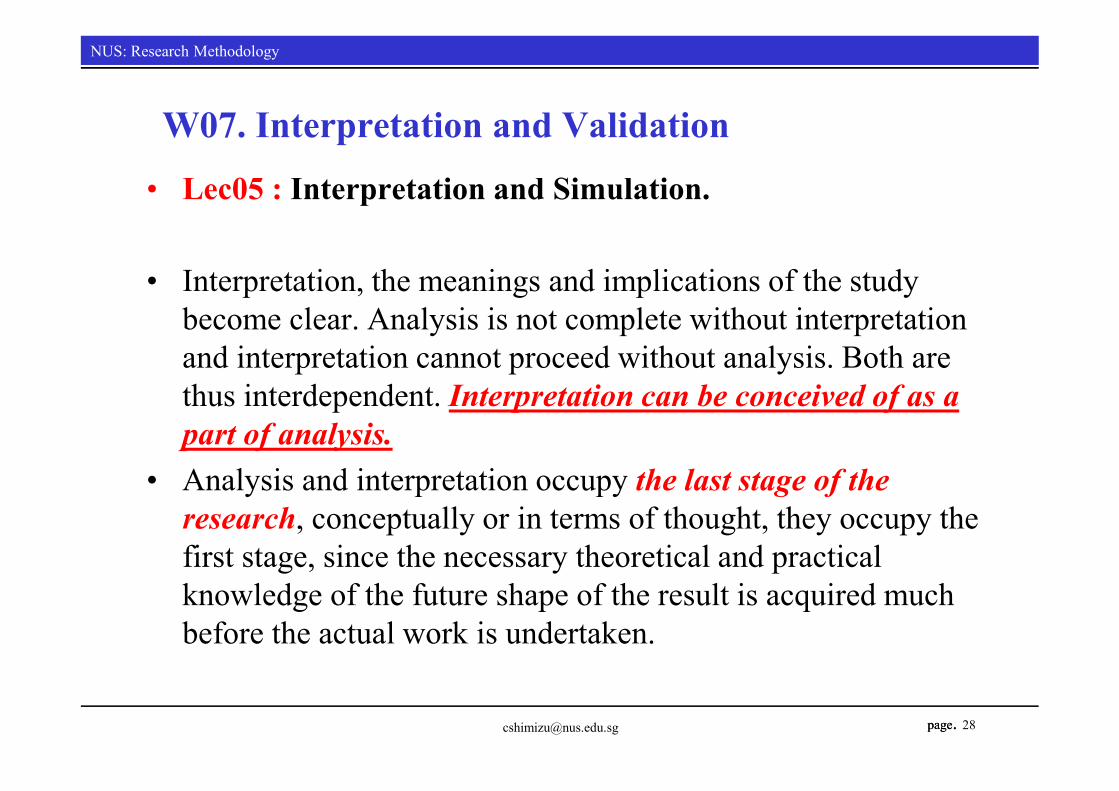
W07. Interpretation and Validation• Lec05 : Interpretation and Simulation.
• Interpretation, the meanings and implications of the study become clear. Analysis is not complete without interpretation and interpretation cannot proceed without analysis. Both are thus interdependent. Interpretation can be conceived of as a part of analysis.
• Analysis and interpretation occupy the last stage of the research, conceptually or in terms of thought, they occupy the first stage, since the necessary theoretical and practical knowledge of the future shape of the result is acquired much before the actual work is undertaken.
page.
NUS: Research MethodologyNUS: Research Methodology
page. 29
No. ofobserva
tionsAdj. R2
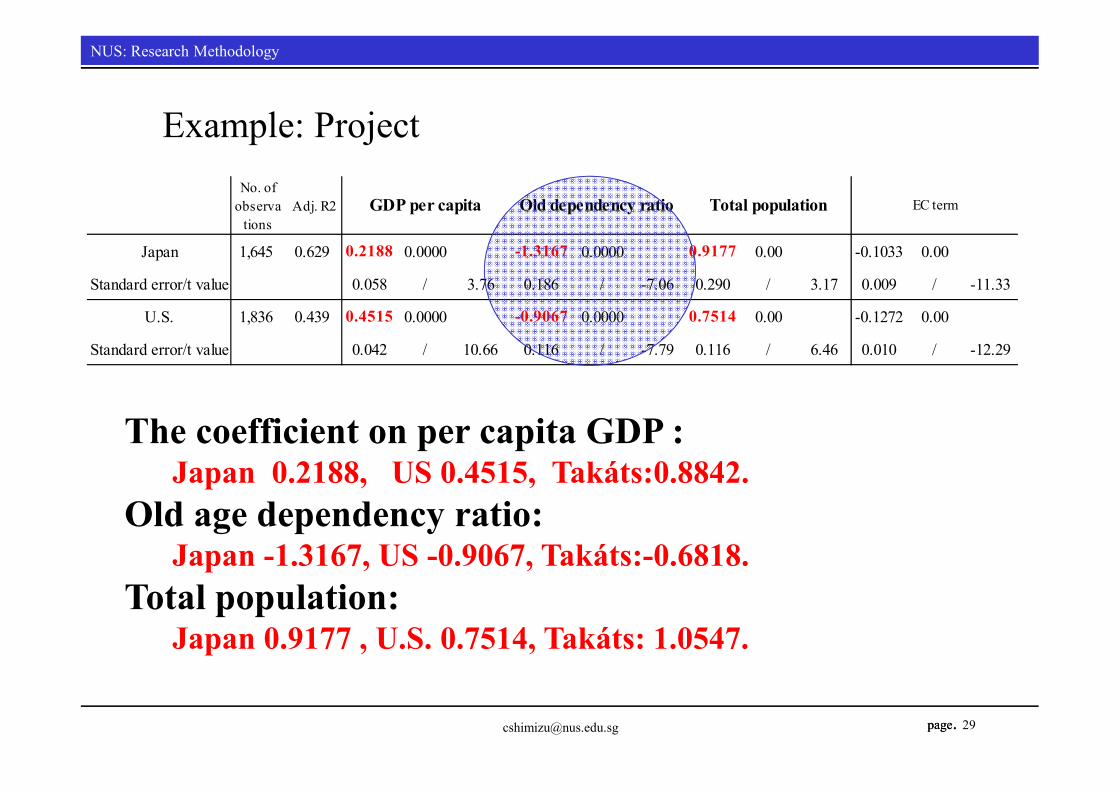
Japan 1,645 0.629 0.2188 0.0000 -1.3167 0.0000 0.9177 0.00 -0.1033 0.00
Standard error/t value 0.058 / 3.76 0.186 / -7.06 0.290 / 3.17 0.009 / -11.33
U.S. 1,836 0.439 0.4515 0.0000 -0.9067 0.0000 0.7514 0.00 -0.1272 0.00
Standard error/t value 0.042 / 10.66 0.116 / -7.79 0.116 / 6.46 0.010 / -12.29
Old dependency ratio Total population EC termGDP per capita
The coefficient on per capita GDP :Japan 0.2188, US 0.4515, Takáts:0.8842.
Old age dependency ratio:Japan -1.3167, US -0.9067, Takáts:-0.6818.
Total population: Japan 0.9177 , U.S. 0.7514, Takáts: 1.0547.
Example: Project
page.
NUS: Research MethodologyNUS: Research Methodology
page.
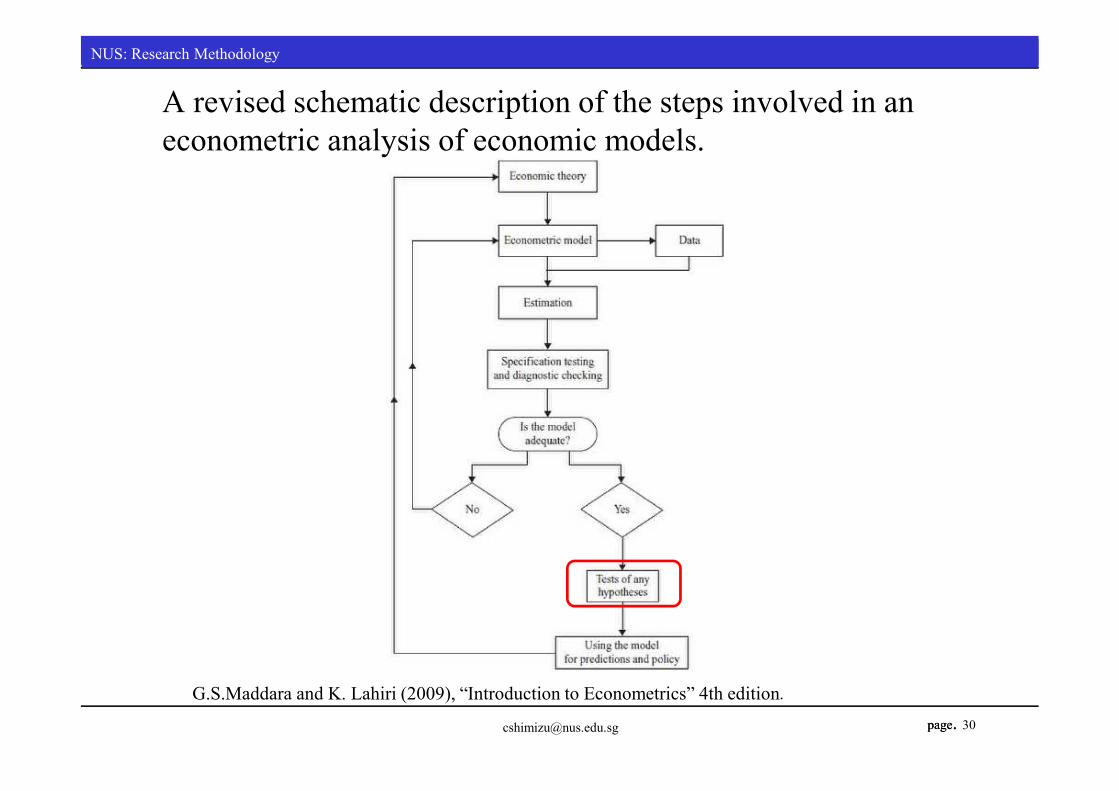
A revised schematic description of the steps involved in an econometric analysis of economic models.
G.S.Maddara and K. Lahiri (2009), “Introduction to Econometrics” 4th edition.
page.
NUS: Research MethodologyNUS: Research Methodology
page.
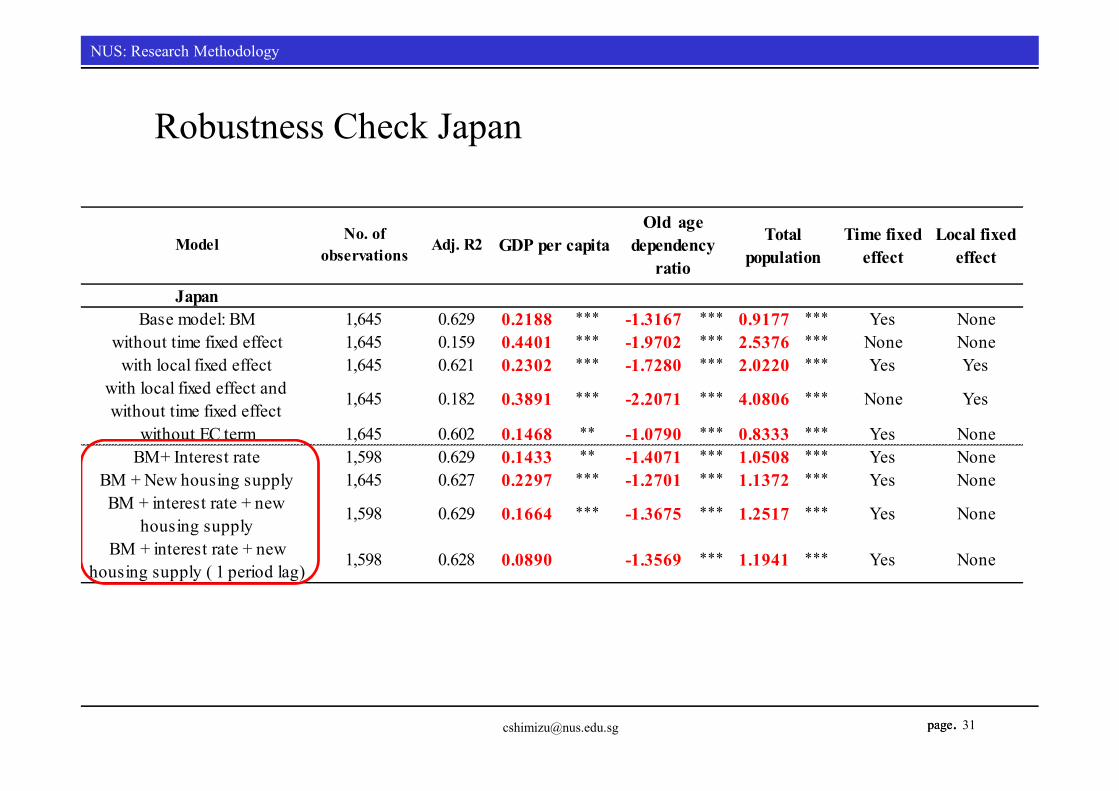
Robustness Check Japan
31
Model No. ofobservations Adj. R2 Time fixed
effectLocal fixed
effect
JapanBase model: BM 1,645 0.629 0.2188 *** -1.3167 *** 0.9177 *** Yes None
without time fixed effect 1,645 0.159 0.4401 *** -1.9702 *** 2.5376 *** None Nonewith local fixed effect 1,645 0.621 0.2302 *** -1.7280 *** 2.0220 *** Yes Yes
with local fixed effect andwithout time fixed effect
1,645 0.182 0.3891 *** -2.2071 *** 4.0806 *** None Yes
without EC term 1,645 0.602 0.1468 ** -1.0790 *** 0.8333 *** Yes NoneBM+ Interest rate 1,598 0.629 0.1433 ** -1.4071 *** 1.0508 *** Yes None
BM + New housing supply 1,645 0.627 0.2297 *** -1.2701 *** 1.1372 *** Yes NoneBM + interest rate + new
housing supply1,598 0.629 0.1664 *** -1.3675 *** 1.2517 *** Yes None
BM + interest rate + newhousing supply ( 1 period lag)
1,598 0.628 0.0890 -1.3569 *** 1.1941 *** Yes None
GDP per capitaOld age
dependencyratio
Totalpopulation

page.
NUS: Research MethodologyNUS: Research Methodology
page.
W08. Conclusion• Lec06 : Writing Report.
• A conclusions section can be as short as a few paragraphs or as long as several pages; the length will depend on the complexity of your focus and results.
• The conclusion often includes a discussion of any new insights the research can contribute to the broader literature.
• Additionally, any limitations of your research should be stated, as well as the suggestions;
• Suggestions that you would have for future research.
page.
NUS: Research MethodologyNUS: Research Methodology
page.
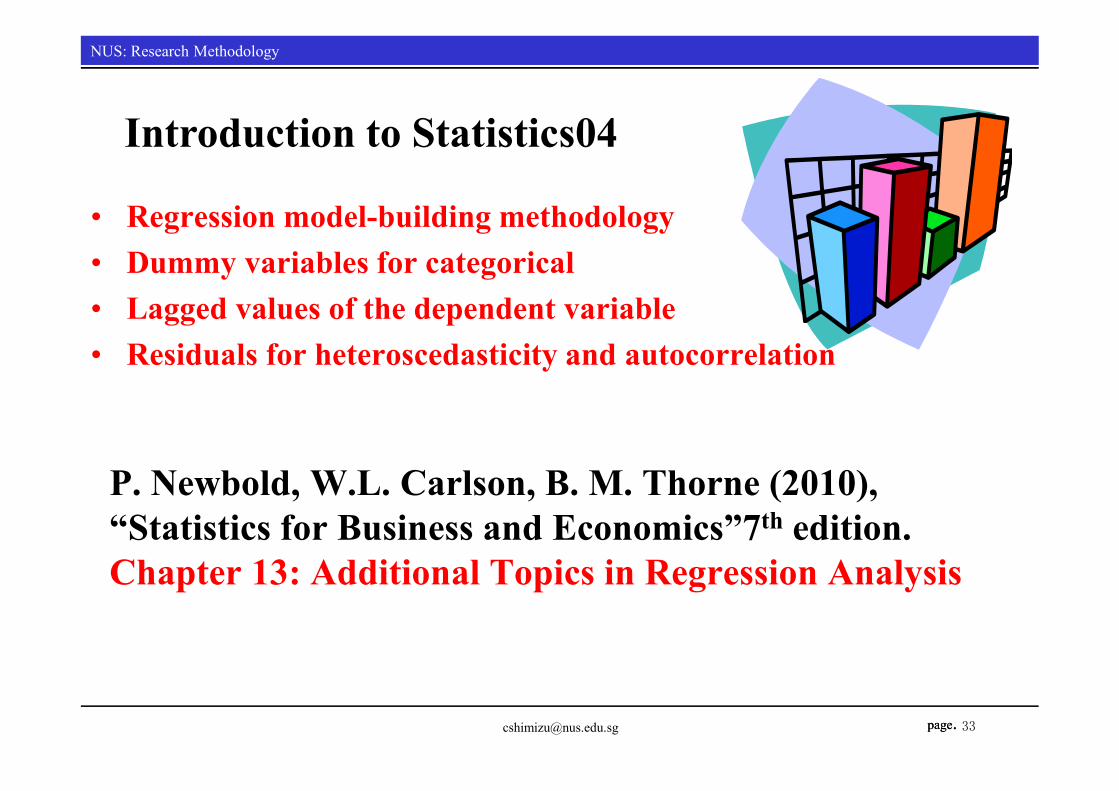
P. Newbold, W.L. Carlson, B. M. Thorne (2010), “Statistics for Business and Economics”7th edition.Chapter 13: Additional Topics in Regression Analysis
• Regression model-building methodology• Dummy variables for categorical • Lagged values of the dependent variable• Residuals for heteroscedasticity and autocorrelation
Introduction to Statistics04
page.
NUS: Research MethodologyNUS: Research Methodology
page.
Today’s Case:
• Shimizu, C., K. G. Nishimura and T. Watanabe (2010), “Residential Rents and Price Rigidity: Micro Structure and Macro Consequences,” Journal of Japanese and International Economy, 24, 282-299.
• Shimizu, C., W. E. Diewert and S. Imai (2015), “Housing Rent and Japanese CPI: Nominal Rigidity of Rents ”, IRES Working Paper(National University of Singapore), 2015-009.

page.
NUS: Research MethodologyNUS: Research Methodology
page. 35
2007-2009: the Financial Crisis
Figure 6: Hedonic estimate Rt*, R-age and Actual CPI
2013-: Abenomics
page.
NUS: Research MethodologyNUS: Research Methodology
page.
Outline or Questions• Why are housing rents sticky?
– Real estate prices and goods & services prices is linked through housing rents. But housing rents did not rise much, and consequently CPI inflation was stable even during the bubble period. This caused delay in monetary tightening
– How much and why are housing rents sticky?
• How should we estimate CPI more linked to asset price developments?– Defining as the opportunity cost of homeowners, we can estimate rent
index measuring the newly contracted rent instead of paying rent – The user cost method that many countries started to develop in these
days
36
1. Introduction
page.
NUS: Research MethodologyNUS: Research Methodology
page.
Background papers.• Rigidity of Housing Rent.• Shimizu, C., K. G. Nishimura and T. Watanabe (2010), “Residential Rents and
Price Rigidity: Micro Structure and Macro Consequences,” Journal of Japanese and International Economy, Vol.24, 282-299.
• Comparison of Residential Property Price Indexes.• Shimizu, C., K. G. Nishimura and T. Watanabe (2010), “House Prices in Tokyo -
A Comparison of Repeat-sales and Hedonic Measures-,” Journal of Economics and Statistics, Vol. 230 (6), 792-813.
• →Shimizu, C, and K.Karato (2014). “Estimation of Residential Property Price Indexes in Tokyo-,” Conference Paper for Hitotsubashi-RIETI International Workshop on Real Estate Markets and the Macro Economy.
•
page.
NUS: Research MethodologyNUS: Research Methodology
page.
W08. Conclusion• Lec05 : Interpretation and Simulation.
• Interpretation, the meanings and implications of the study become clear. Analysis is not complete without interpretation and interpretation cannot proceed without analysis. Both are thus interdependent. Interpretation can be conceived of as a part of analysis.
• Analysis and interpretation occupy the last stage of the research, conceptually or in terms of thought, they occupy the first stage, since the necessary theoretical and practical knowledge of the future shape of the result is acquired much before the actual work is undertaken.
page.
NUS: Research MethodologyNUS: Research Methodology
page.
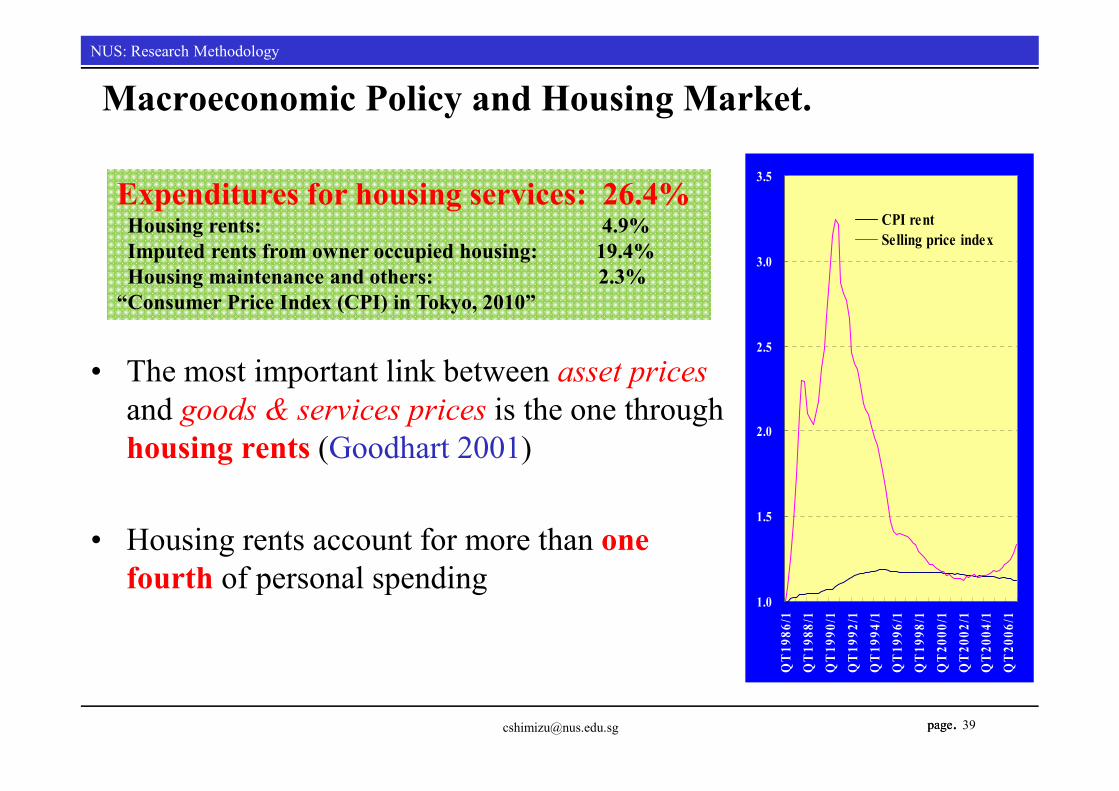
Macroeconomic Policy and Housing Market.
• The most important link between asset pricesand goods & services prices is the one through housing rents (Goodhart 2001)
• Housing rents account for more than one fourth of personal spending
1.0
1.5
2.0
2.5
3.0
3.5
QT1
986/
1Q
T198
8/1
QT1
990/
1Q
T199
2/1
QT1
994/
1Q
T199
6/1
QT1
998/
1Q
T200
0/1
QT2
002/
1Q
T200
4/1
QT2
006/
1
CPI rentSelling price index
39
Expenditures for housing services: 26.4%Housing rents: 4.9%Imputed rents from owner occupied housing: 19.4%Housing maintenance and others: 2.3%
“Consumer Price Index (CPI) in Tokyo, 2010”
page.
NUS: Research MethodologyNUS: Research Methodology
page.
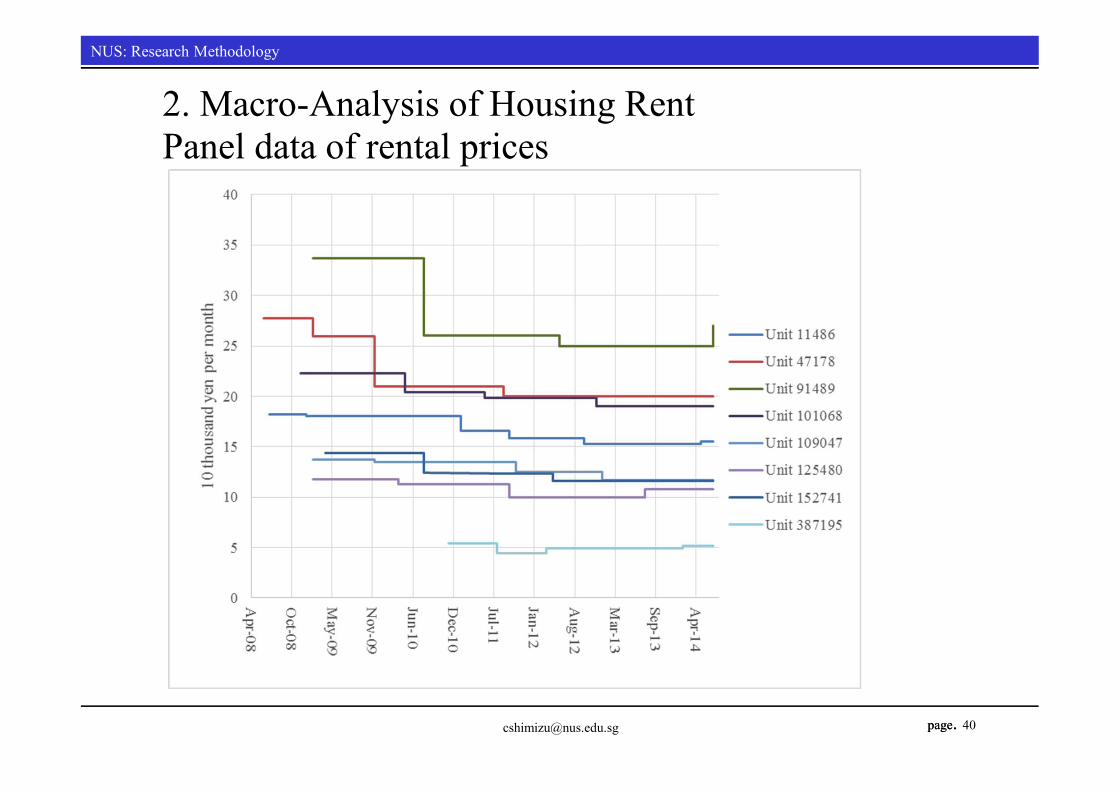
Panel data of rental prices
40
2. Macro-Analysis of Housing Rent
page.
NUS: Research MethodologyNUS: Research Methodology
page. 41
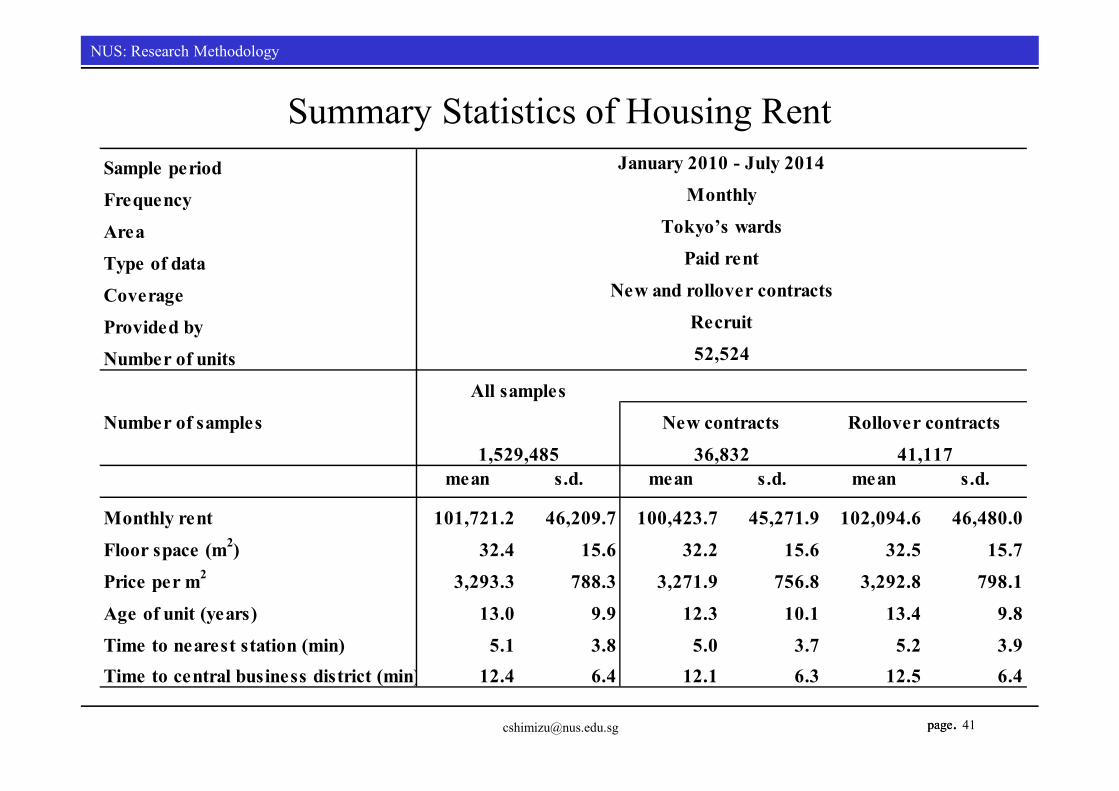
Summary Statistics of Housing RentSample periodFrequencyAreaType of dataCoverageProvided byNumber of units
Number of samples
mean s.d. mean s.d. mean s.d.
Monthly rent 101,721.2 46,209.7 100,423.7 45,271.9 102,094.6 46,480.0Floor space (m2) 32.4 15.6 32.2 15.6 32.5 15.7Price per m2 3,293.3 788.3 3,271.9 756.8 3,292.8 798.1Age of unit (years) 13.0 9.9 12.3 10.1 13.4 9.8Time to nearest station (min) 5.1 3.8 5.0 3.7 5.2 3.9Time to central business district (min) 12.4 6.4 12.1 6.3 12.5 6.4
Paid rentNew and rollover contracts
Recruit
January 2010 - July 2014Monthly
Tokyo’s wards
1,529,485 36,832 41,117
52,524
All samplesNew contracts Rollover contracts
page.
NUS: Research MethodologyNUS: Research Methodology
page.
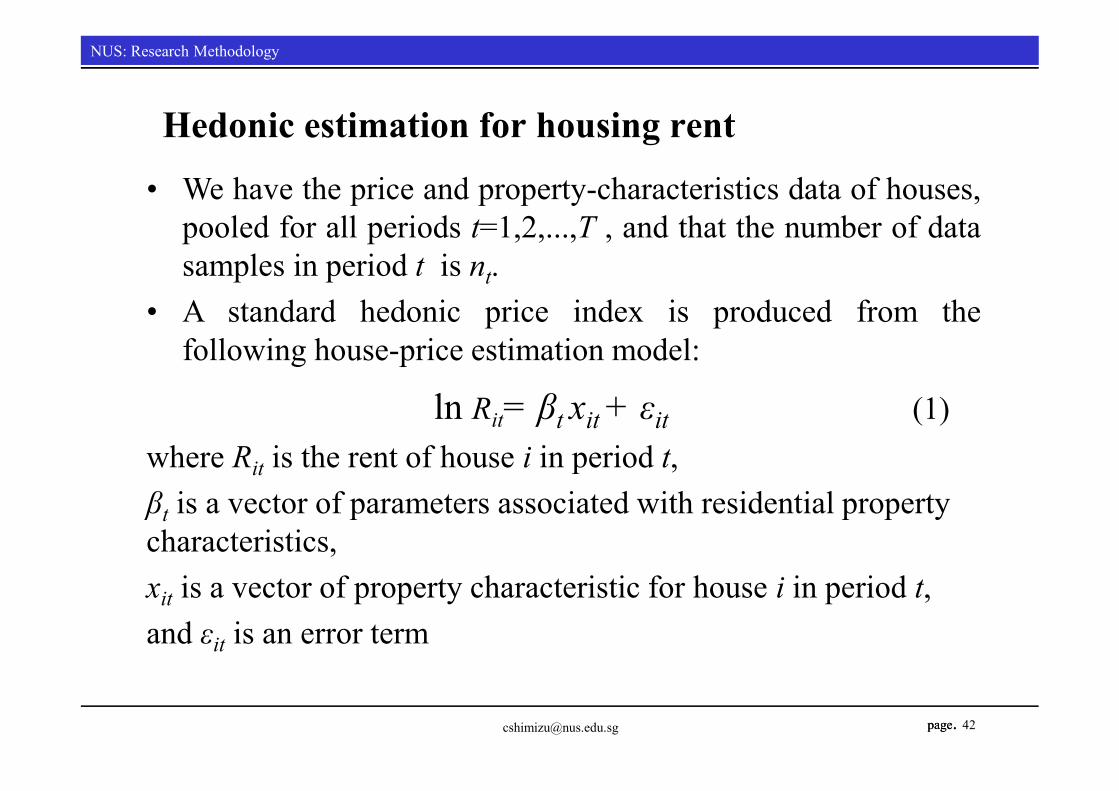
Hedonic estimation for housing rent• We have the price and property-characteristics data of houses,
pooled for all periods t=1,2,...,T , and that the number of datasamples in period t is nt.
• A standard hedonic price index is produced from thefollowing house-price estimation model:
ln Rit= βt xit + εit (1)where Rit is the rent of house i in period t, βt is a vector of parameters associated with residential property characteristics, xit is a vector of property characteristic for house i in period t,and εit is an error term
page.
NUS: Research MethodologyNUS: Research Methodology
page.
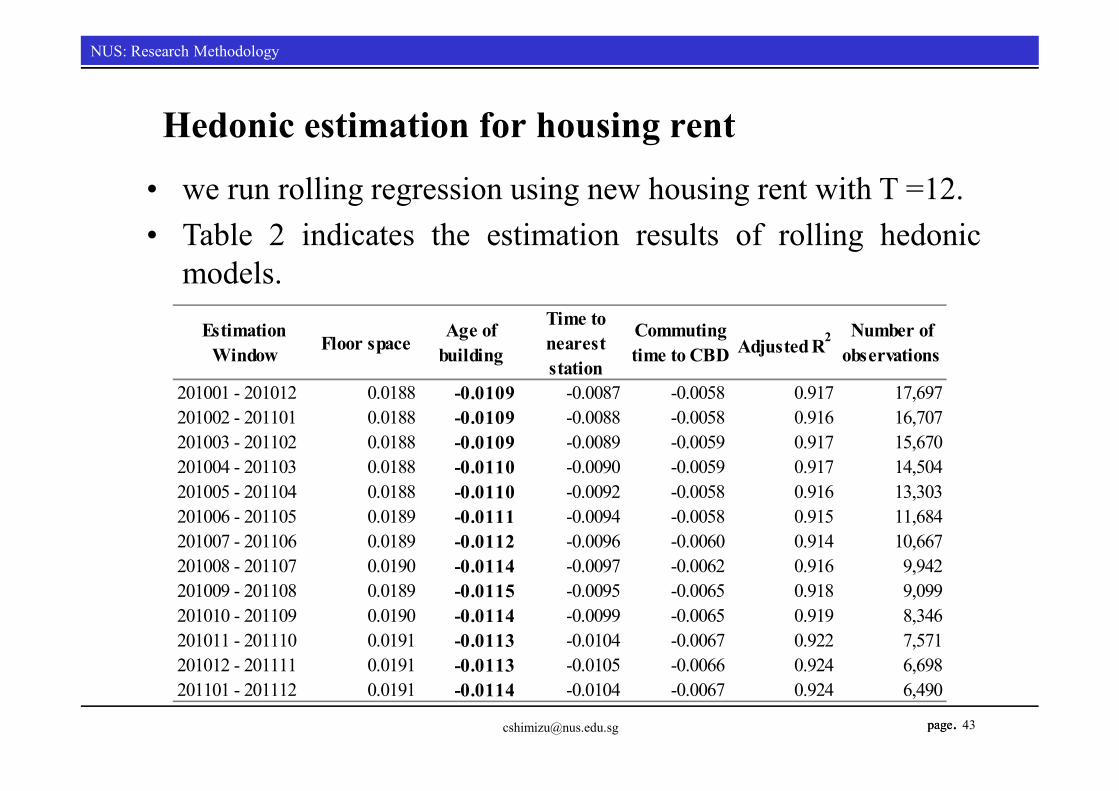
Hedonic estimation for housing rent• we run rolling regression using new housing rent with T =12.• Table 2 indicates the estimation results of rolling hedonic
models.
43
EstimationWindow Floor space Age of
building
Time toneareststation
Commutingtime to CBD Adjusted R2 Number of
observations
201001 - 201012 0.0188 -0.0109 -0.0087 -0.0058 0.917 17,697201002 - 201101 0.0188 -0.0109 -0.0088 -0.0058 0.916 16,707201003 - 201102 0.0188 -0.0109 -0.0089 -0.0059 0.917 15,670201004 - 201103 0.0188 -0.0110 -0.0090 -0.0059 0.917 14,504201005 - 201104 0.0188 -0.0110 -0.0092 -0.0058 0.916 13,303201006 - 201105 0.0189 -0.0111 -0.0094 -0.0058 0.915 11,684201007 - 201106 0.0189 -0.0112 -0.0096 -0.0060 0.914 10,667201008 - 201107 0.0190 -0.0114 -0.0097 -0.0062 0.916 9,942201009 - 201108 0.0189 -0.0115 -0.0095 -0.0065 0.918 9,099201010 - 201109 0.0190 -0.0114 -0.0099 -0.0065 0.919 8,346201011 - 201110 0.0191 -0.0113 -0.0104 -0.0067 0.922 7,571201012 - 201111 0.0191 -0.0113 -0.0105 -0.0066 0.924 6,698201101 - 201112 0.0191 -0.0114 -0.0104 -0.0067 0.924 6,490
page.
NUS: Research MethodologyNUS: Research Methodology
page.
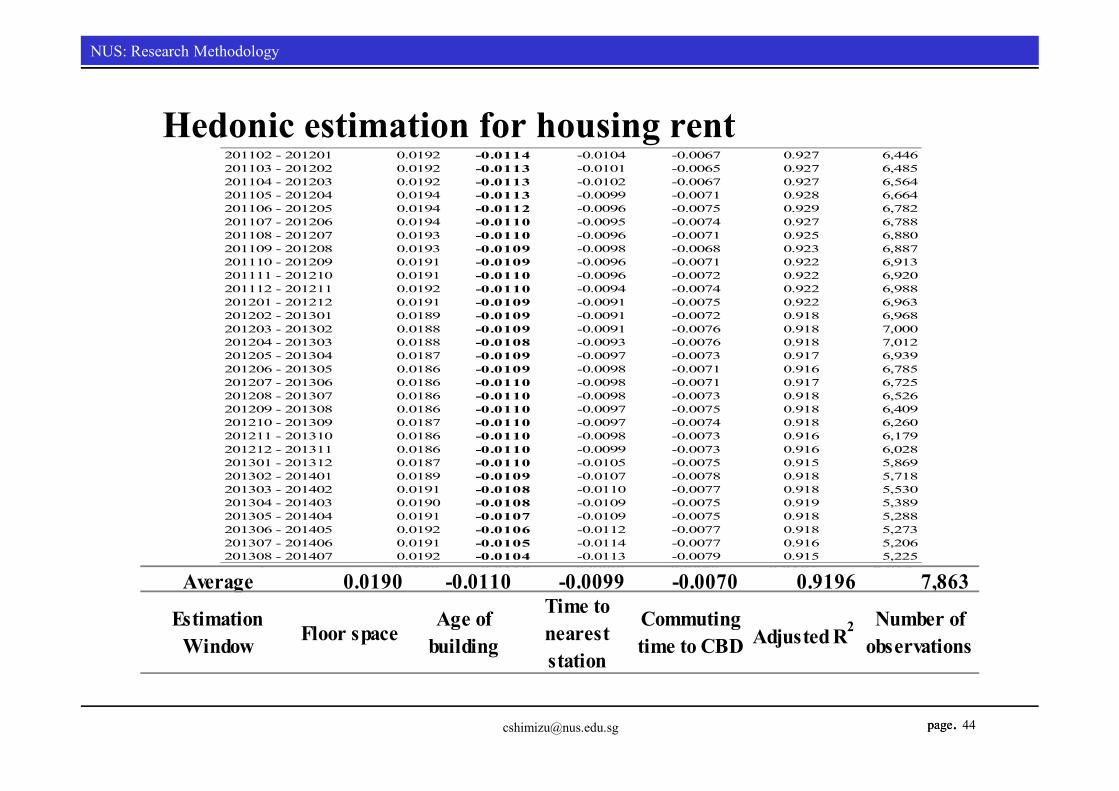
Hedonic estimation for housing rent201102 - 201201 0.0192 -0.0114 -0.0104 -0.0067 0.927 6,446201103 - 201202 0.0192 -0.0113 -0.0101 -0.0065 0.927 6,485201104 - 201203 0.0192 -0.0113 -0.0102 -0.0067 0.927 6,564201105 - 201204 0.0194 -0.0113 -0.0099 -0.0071 0.928 6,664201106 - 201205 0.0194 -0.0112 -0.0096 -0.0075 0.929 6,782201107 - 201206 0.0194 -0.0110 -0.0095 -0.0074 0.927 6,788201108 - 201207 0.0193 -0.0110 -0.0096 -0.0071 0.925 6,880201109 - 201208 0.0193 -0.0109 -0.0098 -0.0068 0.923 6,887201110 - 201209 0.0191 -0.0109 -0.0096 -0.0071 0.922 6,913201111 - 201210 0.0191 -0.0110 -0.0096 -0.0072 0.922 6,920201112 - 201211 0.0192 -0.0110 -0.0094 -0.0074 0.922 6,988201201 - 201212 0.0191 -0.0109 -0.0091 -0.0075 0.922 6,963201202 - 201301 0.0189 -0.0109 -0.0091 -0.0072 0.918 6,968201203 - 201302 0.0188 -0.0109 -0.0091 -0.0076 0.918 7,000201204 - 201303 0.0188 -0.0108 -0.0093 -0.0076 0.918 7,012201205 - 201304 0.0187 -0.0109 -0.0097 -0.0073 0.917 6,939201206 - 201305 0.0186 -0.0109 -0.0098 -0.0071 0.916 6,785201207 - 201306 0.0186 -0.0110 -0.0098 -0.0071 0.917 6,725201208 - 201307 0.0186 -0.0110 -0.0098 -0.0073 0.918 6,526201209 - 201308 0.0186 -0.0110 -0.0097 -0.0075 0.918 6,409201210 - 201309 0.0187 -0.0110 -0.0097 -0.0074 0.918 6,260201211 - 201310 0.0186 -0.0110 -0.0098 -0.0073 0.916 6,179201212 - 201311 0.0186 -0.0110 -0.0099 -0.0073 0.916 6,028201301 - 201312 0.0187 -0.0110 -0.0105 -0.0075 0.915 5,869201302 - 201401 0.0189 -0.0109 -0.0107 -0.0078 0.918 5,718201303 - 201402 0.0191 -0.0108 -0.0110 -0.0077 0.918 5,530201304 - 201403 0.0190 -0.0108 -0.0109 -0.0075 0.919 5,389201305 - 201404 0.0191 -0.0107 -0.0109 -0.0075 0.918 5,288201306 - 201405 0.0192 -0.0106 -0.0112 -0.0077 0.918 5,273201307 - 201406 0.0191 -0.0105 -0.0114 -0.0077 0.916 5,206201308 - 201407 0.0192 -0.0104 -0.0113 -0.0079 0.915 5,225
Average 0.0190 -0.0110 -0.0099 -0.0070 0.9196 7,863
44
Average 0.0190 -0.0110 -0.0099 -0.0070 0.9196 7,863Estimation
Window Floor spaceAge of
building
Time toneareststation
Commutingtime to CBD Adjusted R2 Number of
observations
page.
NUS: Research MethodologyNUS: Research Methodology
page.
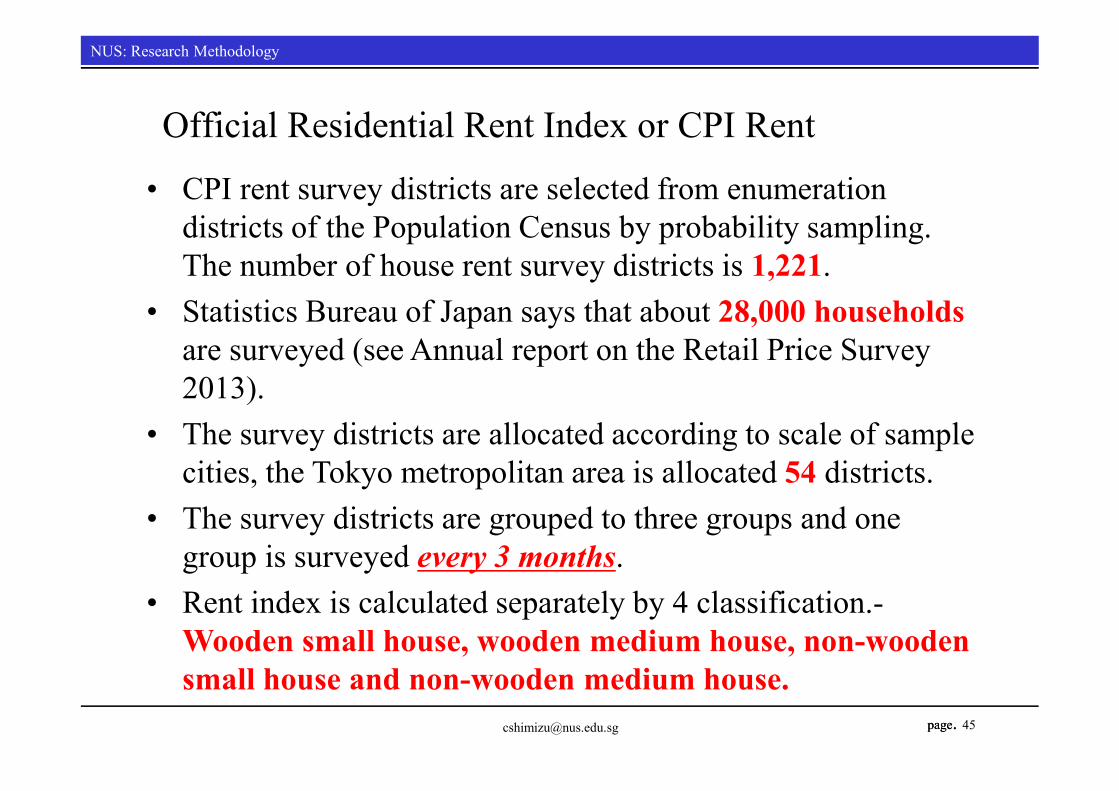
Official Residential Rent Index or CPI Rent• CPI rent survey districts are selected from enumeration
districts of the Population Census by probability sampling. The number of house rent survey districts is 1,221.
• Statistics Bureau of Japan says that about 28,000 households are surveyed (see Annual report on the Retail Price Survey 2013).
• The survey districts are allocated according to scale of sample cities, the Tokyo metropolitan area is allocated 54 districts.
• The survey districts are grouped to three groups and one group is surveyed every 3 months.
• Rent index is calculated separately by 4 classification.-Wooden small house, wooden medium house, non-wooden small house and non-wooden medium house.
page.
NUS: Research MethodologyNUS: Research Methodology
page. 46
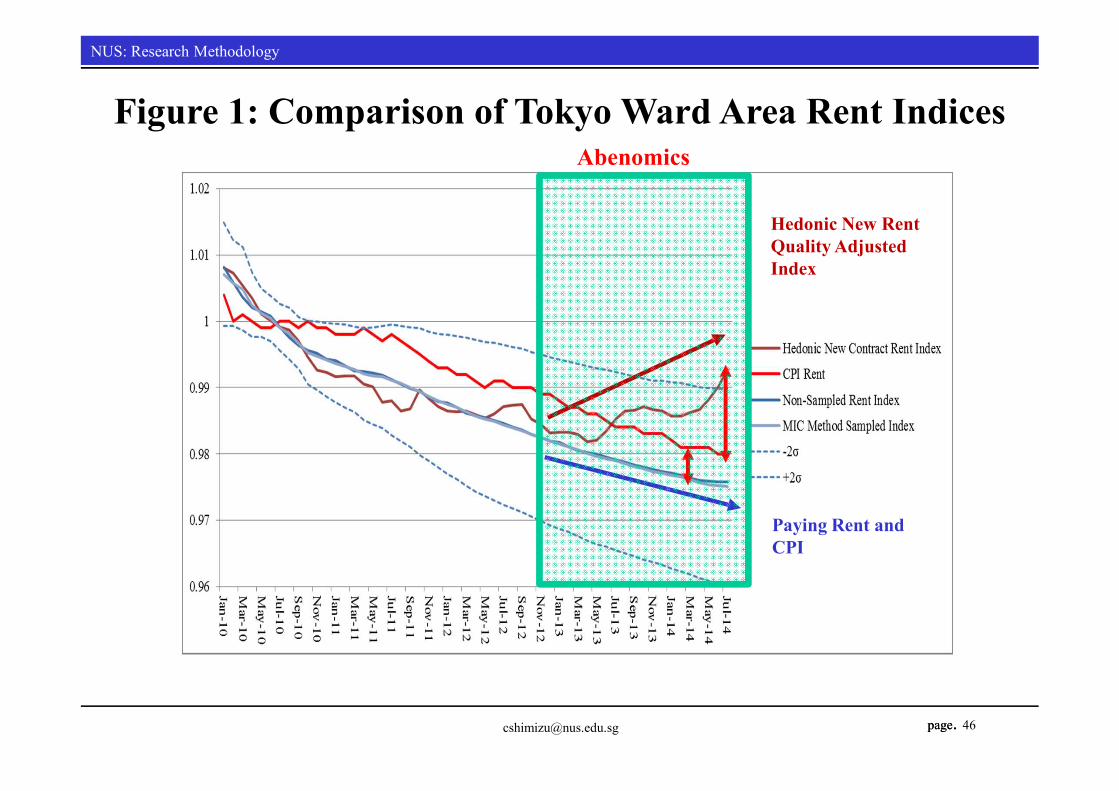
Figure 1: Comparison of Tokyo Ward Area Rent Indices
Hedonic New Rent Quality Adjusted Index
Paying Rent and CPI
Abenomics
page.
NUS: Research MethodologyNUS: Research Methodology
page. 47
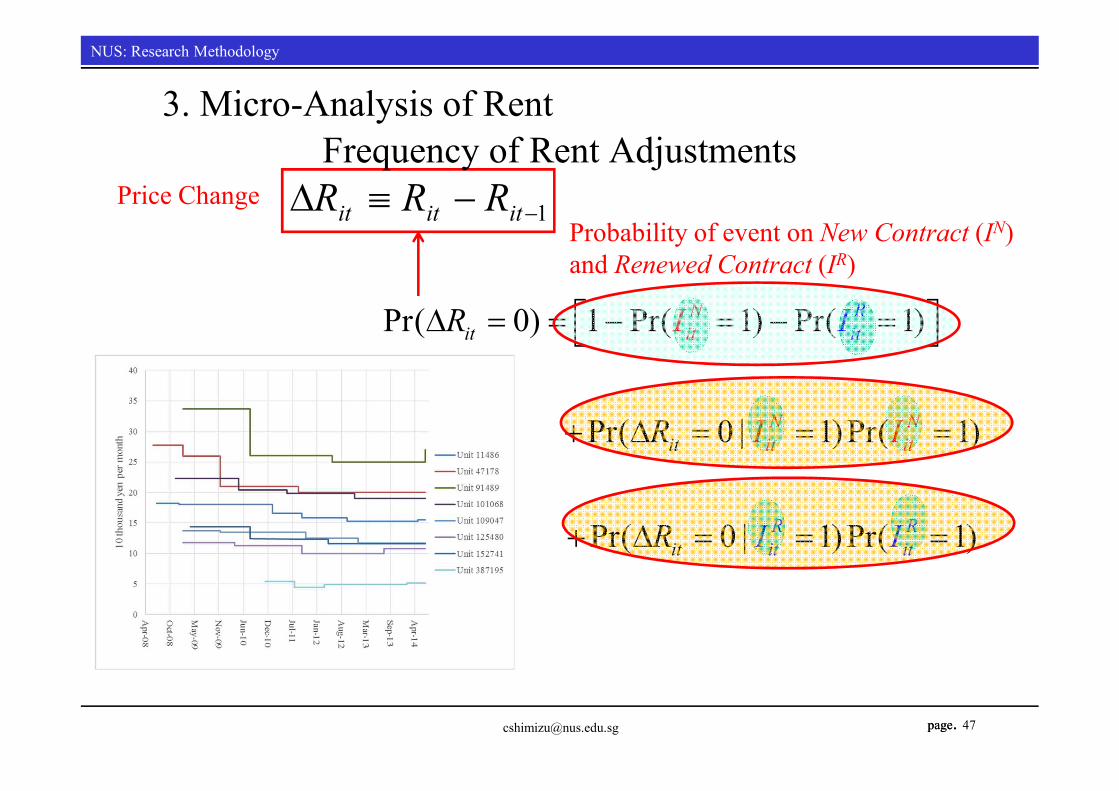
Pr( 0) 1 Pr( 1) Pr( 1)
Pr( 0 | 1)Pr( 1)
Pr( 0 | 1) Pr( 1)
it
it
Nit
Rit
R Rit
N Nit i
it
t
it
I
I I
R
R
I
IR I
1ititit RRRFrequency of Rent Adjustments
Price ChangeProbability of event on New Contract (IN) and Renewed Contract (IR)
3. Micro-Analysis of Rent
page.
NUS: Research MethodologyNUS: Research Methodology
page.
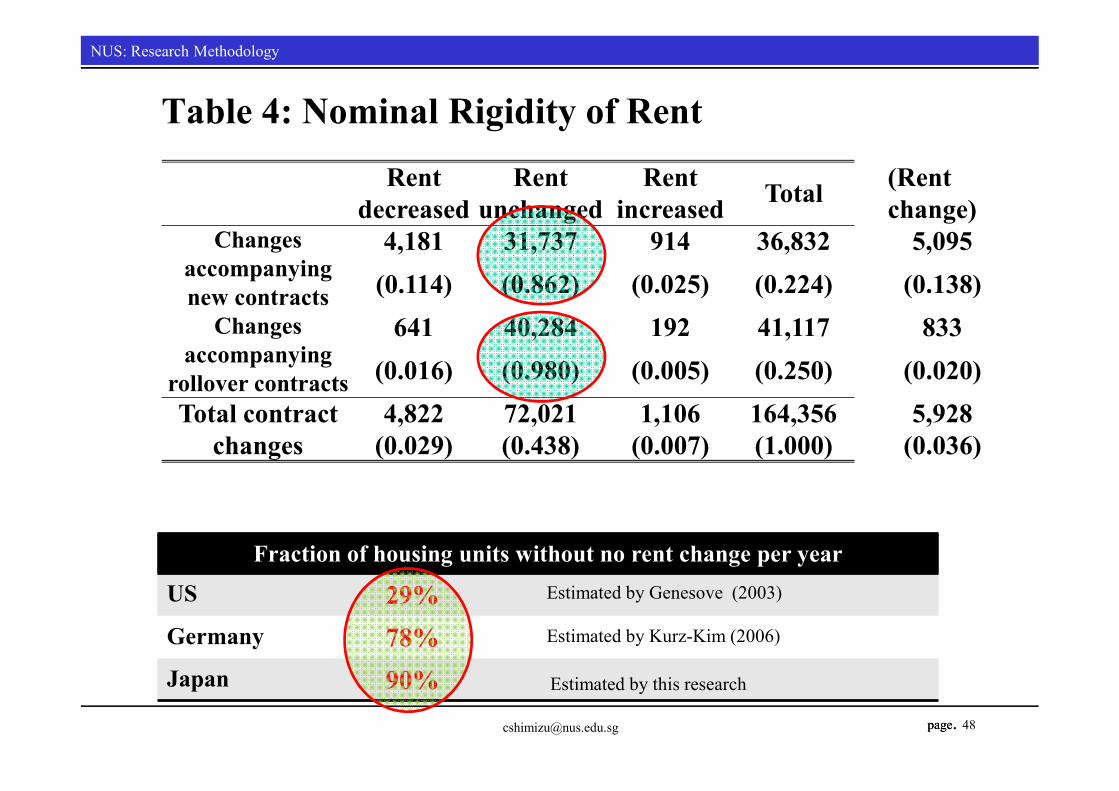
Rent decreased
Rent unchanged
Rent increased Total (Rent
change)Changes
accompanying new contracts
4,181 31,737 914 36,832 5,095(0.114) (0.862) (0.025) (0.224) (0.138)
Changes accompanying
rollover contracts
641 40,284 192 41,117 833(0.016) (0.980) (0.005) (0.250) (0.020)
Total contract changes
4,822 72,021 1,106 164,356 5,928(0.029) (0.438) (0.007) (1.000) (0.036)
Table 4: Nominal Rigidity of Rent
48
Fraction of housing units without no rent change per yearUS 29%Germany 78%Japan 90%
Estimated by Genesove (2003)
Estimated by Kurz-Kim (2006)
Estimated by this research
page.
NUS: Research MethodologyNUS: Research Methodology
page.
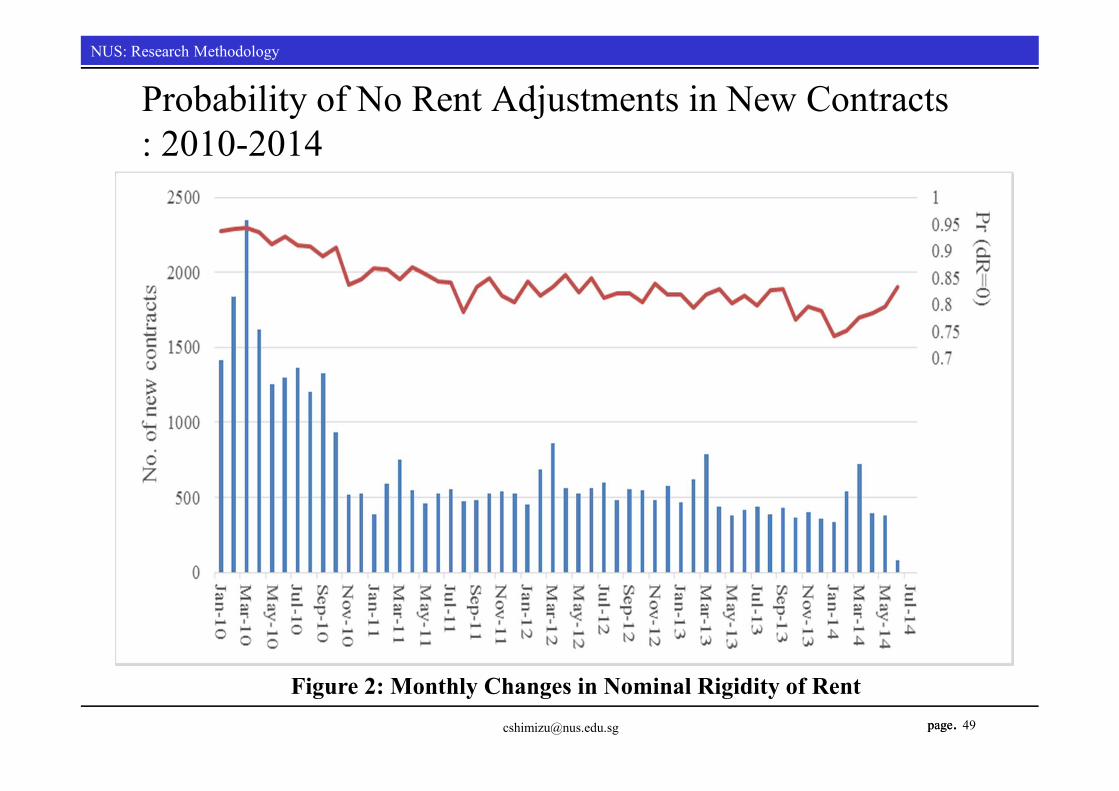
Probability of No Rent Adjustments in New Contracts : 2010-2014
49
Figure 2: Monthly Changes in Nominal Rigidity of [email protected]
page.
NUS: Research MethodologyNUS: Research Methodology
page. 50
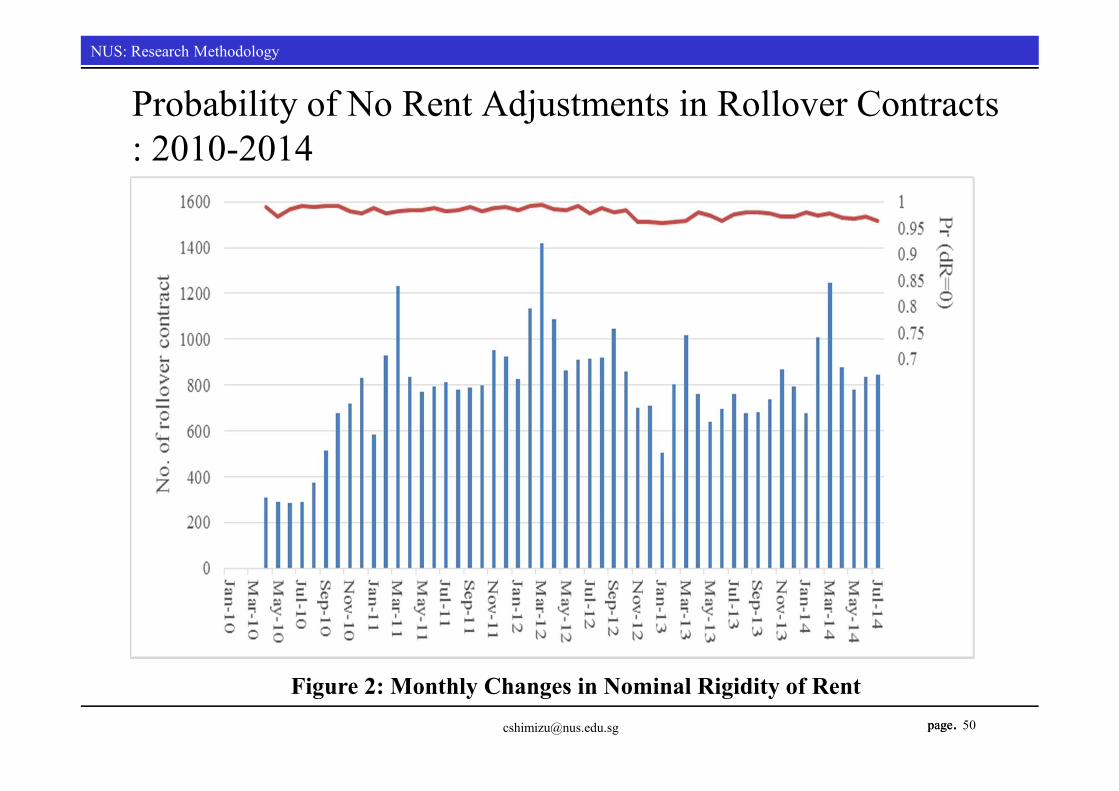
Probability of No Rent Adjustments in Rollover Contracts : 2010-2014
Figure 2: Monthly Changes in Nominal Rigidity of [email protected]
page.
NUS: Research MethodologyNUS: Research Methodology
page.
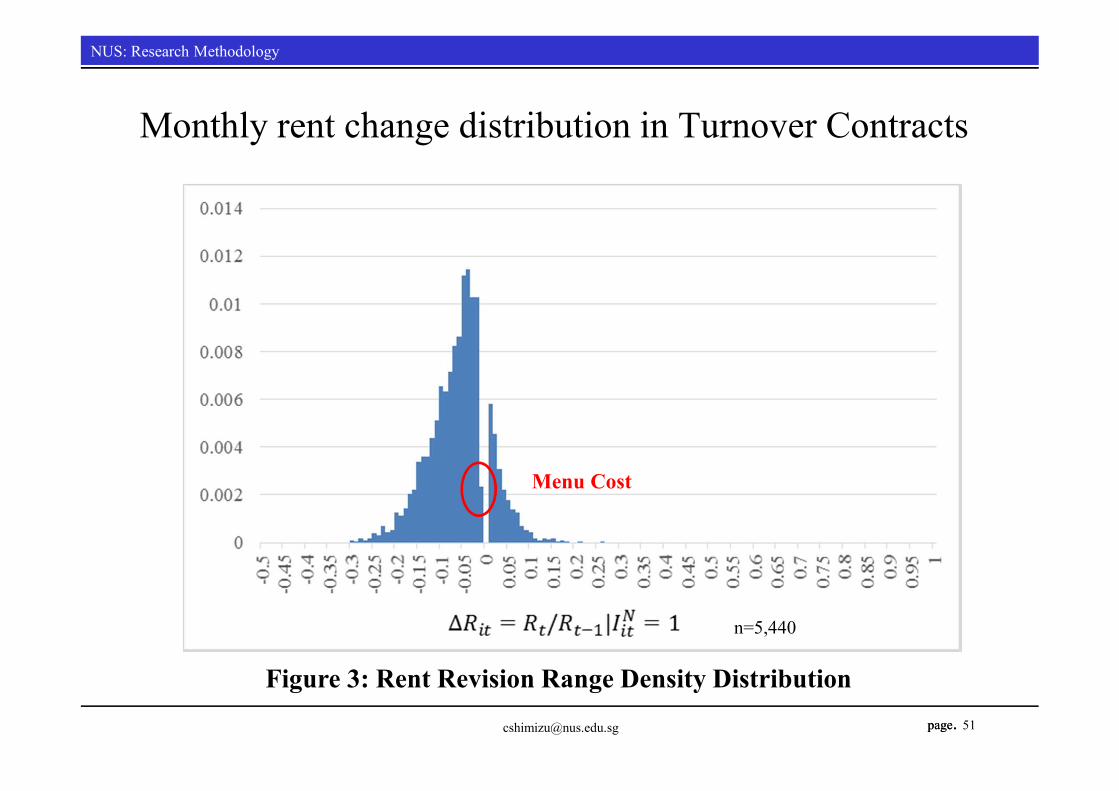
Monthly rent change distribution in Turnover Contracts
51
n=5,440
Menu Cost
Figure 3: Rent Revision Range Density [email protected]
page.
NUS: Research MethodologyNUS: Research Methodology
page.
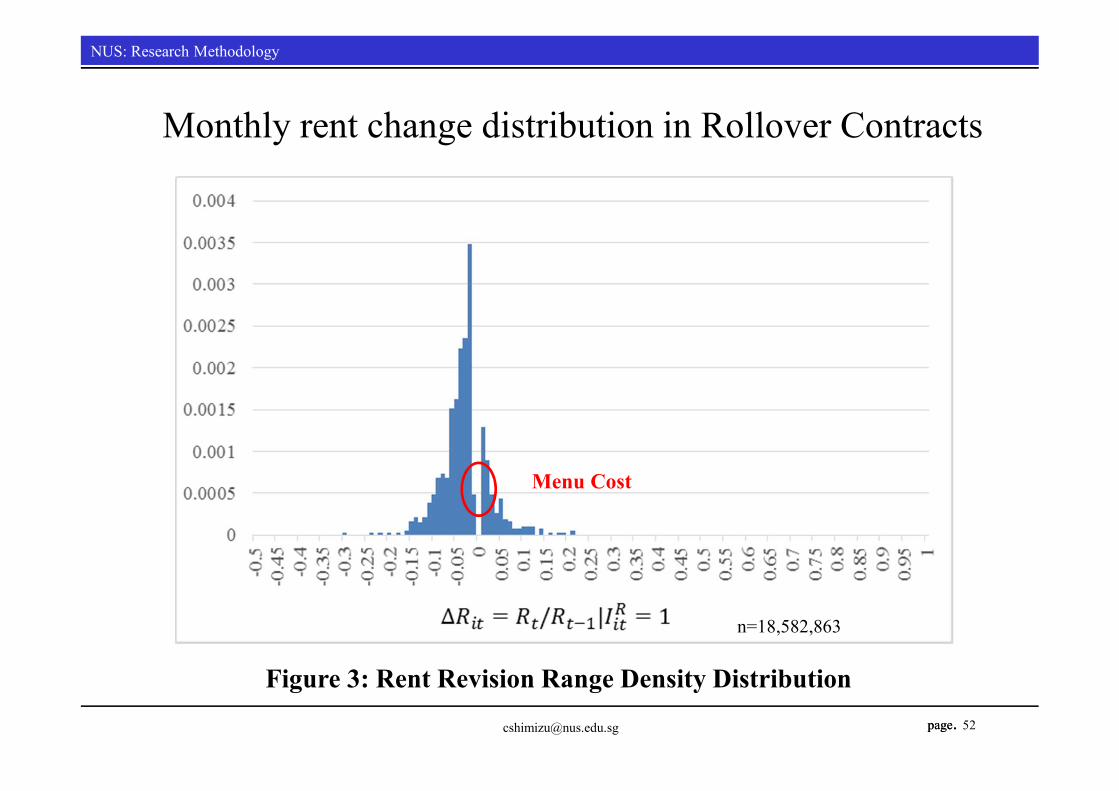
Monthly rent change distribution in Rollover Contracts
52
n=18,582,863
Menu Cost
Figure 3: Rent Revision Range Density [email protected]
page.
NUS: Research MethodologyNUS: Research Methodology
page. 53
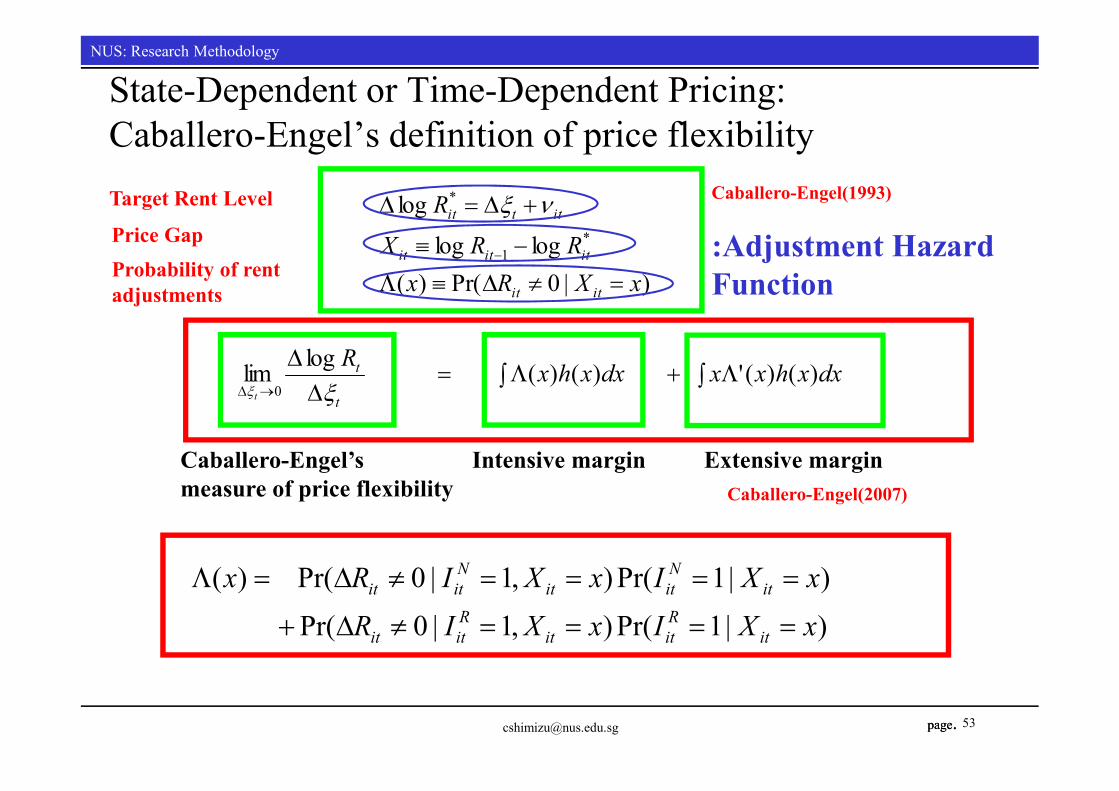
State-Dependent or Time-Dependent Pricing:Caballero-Engel’s definition of price flexibility
dxxhxxdxxhxR
xXRxRRX
R
t
t
itit
ititit
ittit
t
)()(' )()( loglim
)|0Pr()( loglog
log
0
*1
*
)|1Pr(),1|0Pr( )|1Pr(),1|0Pr( )(
xXIxXIRxXIxXIRx
itRitit
Ritit
itNitit
Nitit
Intensive margin Extensive marginCaballero-Engel’smeasure of price flexibility
Caballero-Engel(1993)
:Adjustment Hazard Function
Caballero-Engel(2007)
Target Rent LevelPrice GapProbability of rent adjustments
page.
NUS: Research MethodologyNUS: Research Methodology
page.
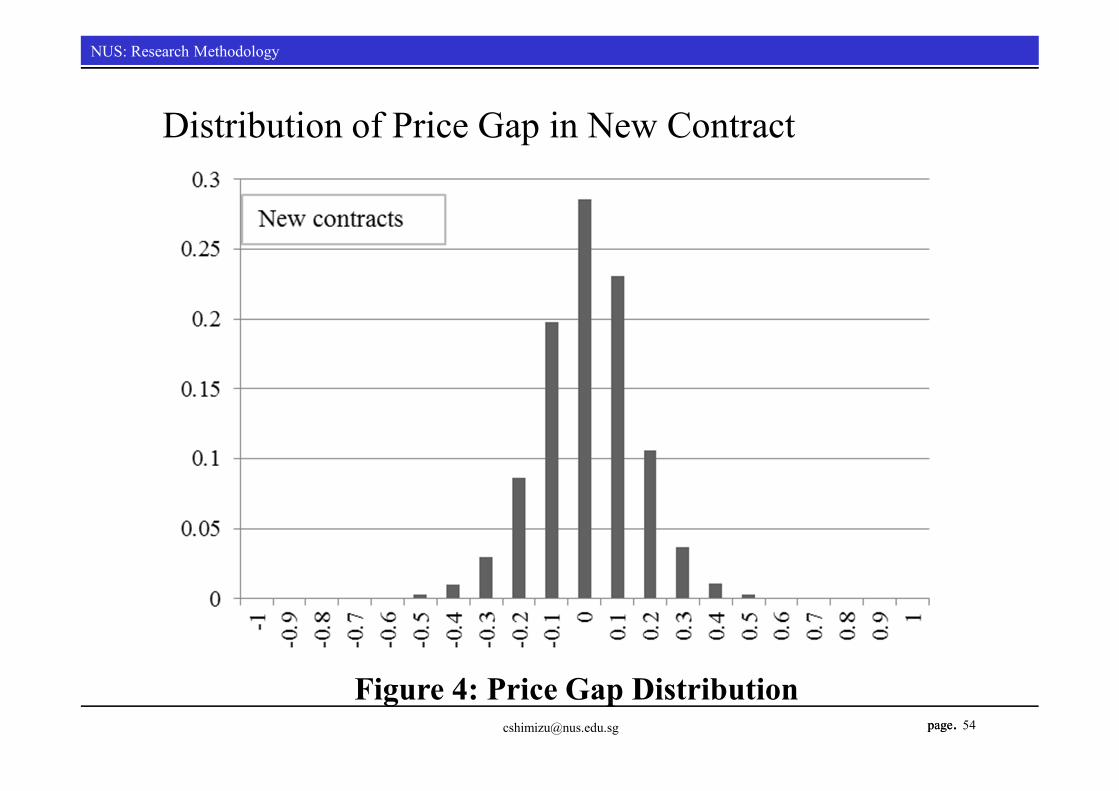
Distribution of Price Gap in New Contract
54
Figure 4: Price Gap [email protected]
page.
NUS: Research MethodologyNUS: Research Methodology
page.
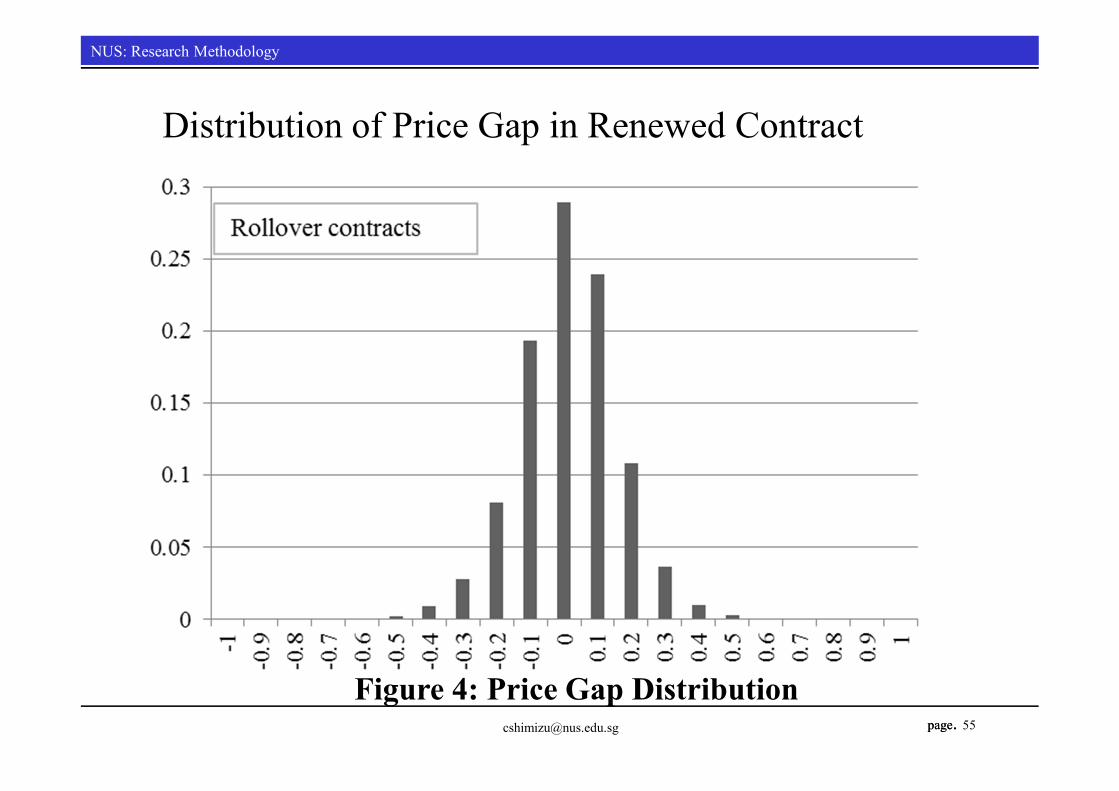
Distribution of Price Gap in Renewed Contract
55
Figure 4: Price Gap [email protected]
page.
NUS: Research MethodologyNUS: Research Methodology
page.
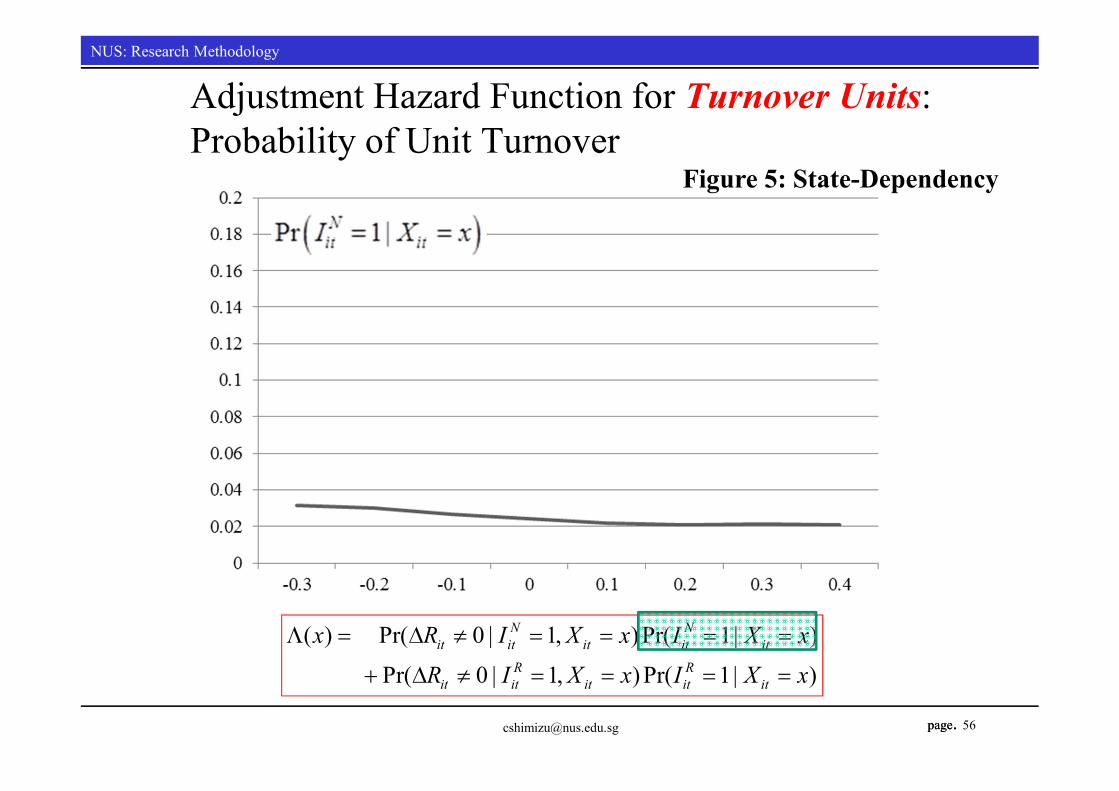
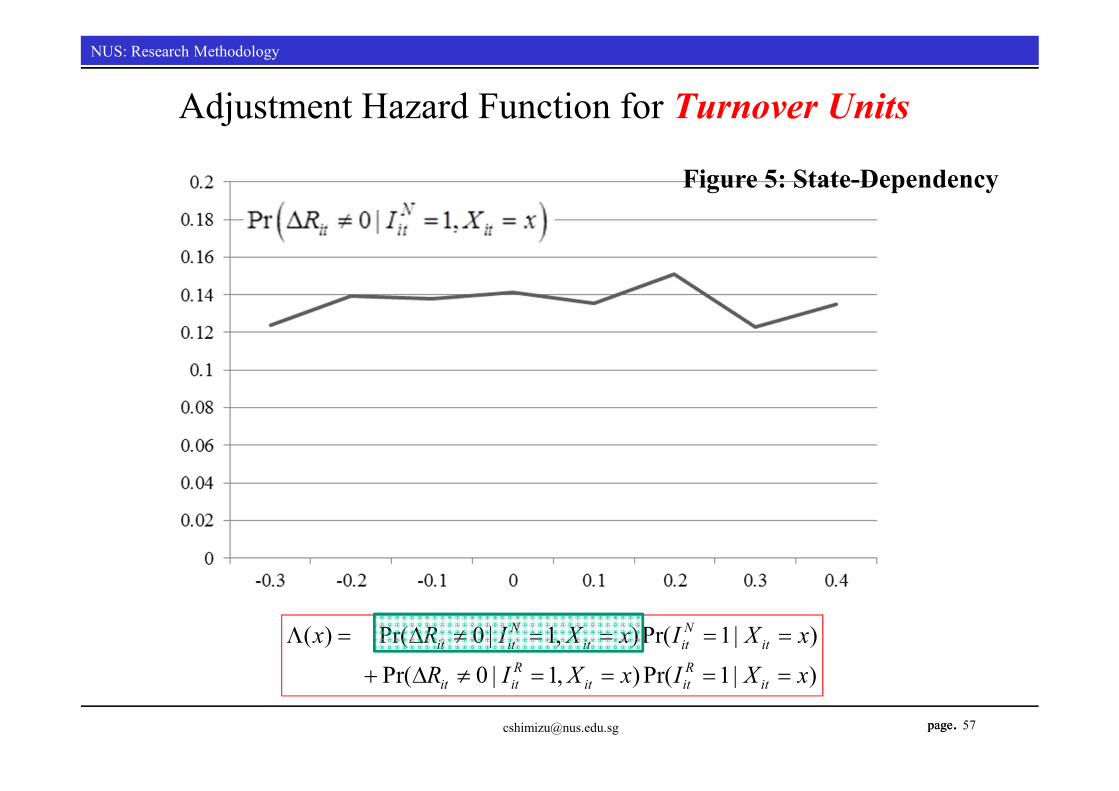
Adjustment Hazard Function for Turnover Units:Probability of Unit Turnover
56
( ) Pr( 0 | 1, ) Pr( 1| ) Pr( 0 | 1, ) Pr( 1| )
N Nit it it it it
R Rit it it it it
x R I X x I X x
R I X x I X x
Figure 5: State-Dependency
page.
NUS: Research MethodologyNUS: Research Methodology
page.
Adjustment Hazard Function for Turnover Units
57
( ) Pr( 0 | 1, ) Pr( 1| ) Pr( 0 | 1, ) Pr( 1| )
N Nit it it it it
R Rit it it it it
x R I X x I X x
R I X x I X x
Figure 5: State-Dependency
page.
NUS: Research MethodologyNUS: Research Methodology
page.
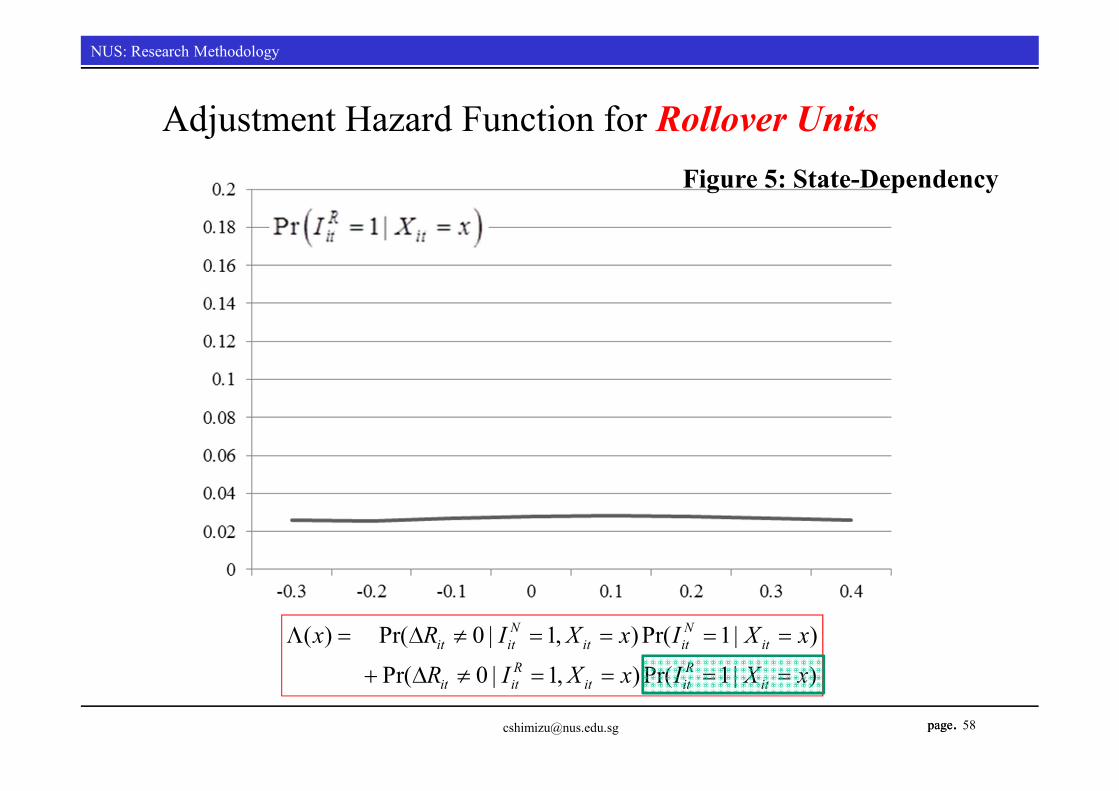
Adjustment Hazard Function for Rollover Units
58
( ) Pr( 0 | 1, ) Pr( 1| ) Pr( 0 | 1, ) Pr( 1| )
N Nit it it it it
R Rit it it it it
x R I X x I X x
R I X x I X x
Figure 5: State-Dependency
page.
NUS: Research MethodologyNUS: Research Methodology
page.
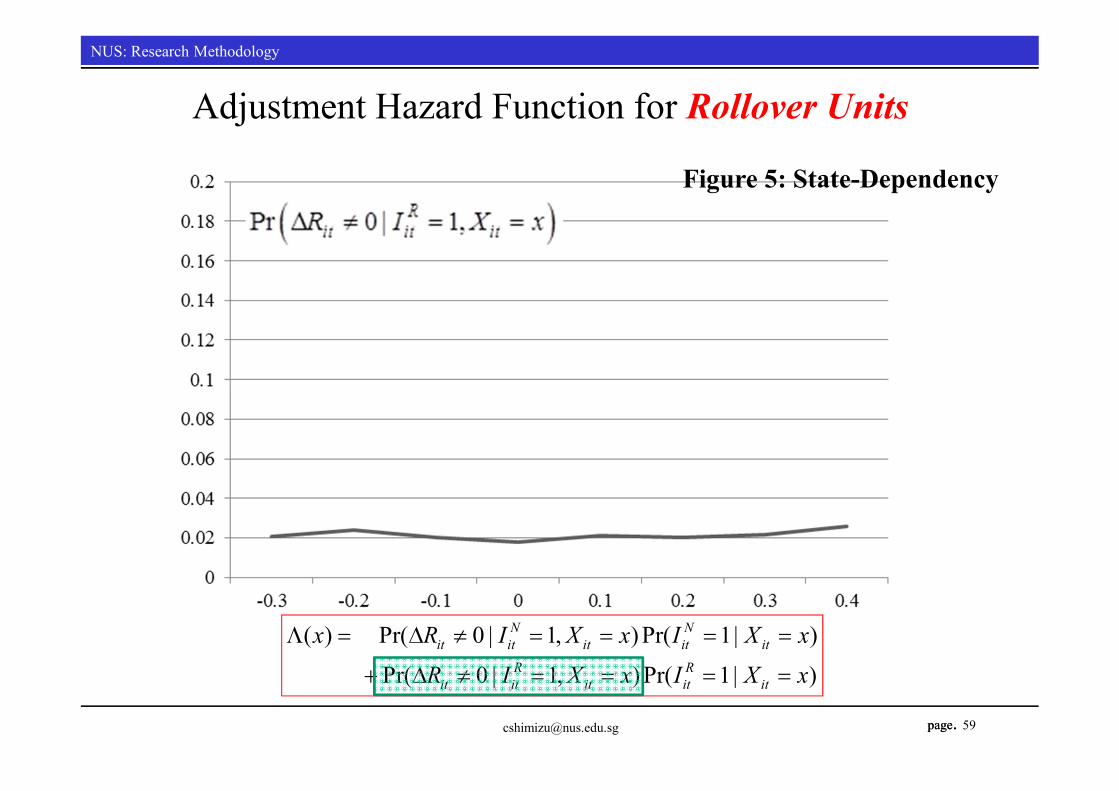
Adjustment Hazard Function for Rollover Units
59
( ) Pr( 0 | 1, ) Pr( 1| ) Pr( 0 | 1, ) Pr( 1| )
N Nit it it it it
R Rit it it it it
x R I X x I X x
R I X x I X x
Figure 5: State-Dependency
page.
NUS: Research MethodologyNUS: Research Methodology
page.
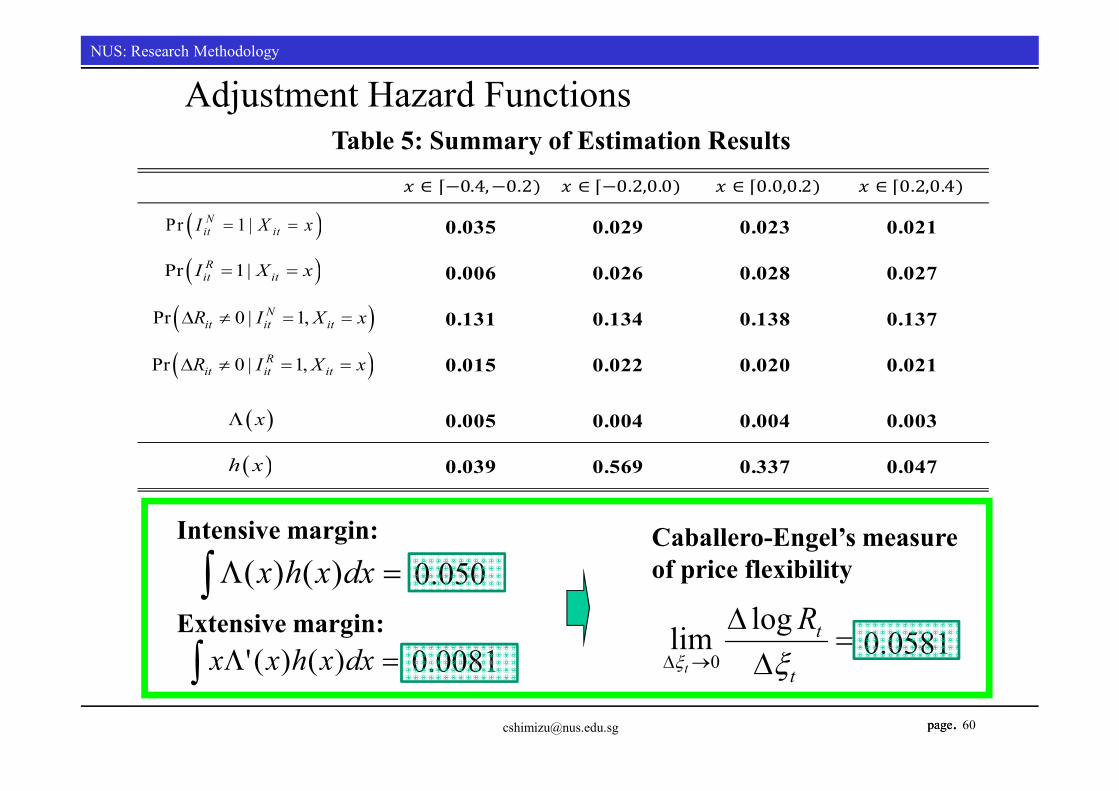
055.0)()( dxxhx
00580.0)()(' dxxhxx
Intensive margin:
Extensive margin:
Caballero-Engel’s measure of price flexibility0.050
60
Adjustment Hazard Functions
0607.0loglim0
t
tRt
0.035 0.029 0.023 0.021
0.006 0.026 0.028 0.027
0.131 0.134 0.138 0.137
0.015 0.022 0.020 0.021
0.005 0.004 0.004 0.003
0.039 0.569 0.337 0.047
Pr 1 |Nit itI X x
Pr 1|Rit itI X x
Pr 0 | 1,Nit it itR I X x
Pr 0 | 1,Rit it itR I X x
x
h x
∈ [0.0,0.2)∈ [−0.4,−0.2) ∈ [−0.2,0.0) ∈ [0.2,0.4)
0.0081 0.0581
Table 5: Summary of Estimation Results
page.
NUS: Research MethodologyNUS: Research Methodology
page. 61
Summary in “Sticky Housing Rent”
1. About ninety percent of the units in our dataset had no change in rents per year, indicating that rent stickiness is three times as high as in the US.
2. The probability of rent adjustment depends little on the deviation of the actual rent from its target level, suggesting that rent adjustments are not state dependent but time dependent.
3. These two results indicate that both intensive and extensive margins of rent adjustments are small, resulting in a slow response of the CPI rent to aggregate shocks.
page.
NUS: Research MethodologyNUS: Research Methodology
page.
4. Re-estimation of CPIHow should we estimate CPI more linked to asset price developments?
• We have seen in the previous sections that the probability of individual rent adjustments is very low and that it depends little on price imbalances.
• These two facts imply that price flexibility in terms of the impulse response function is low, thus causing the CPI for rent to respond only slowly to aggregate shocks.
• We simplify the model.• We replace the imputed rent for owner-occupied housing in
the CPI by our estimate of the market rent R*.• We also replace the imputed rent for OOH by our estimate of
the depreciation adjusted rent [email protected]
page.
NUS: Research MethodologyNUS: Research Methodology
page. 63
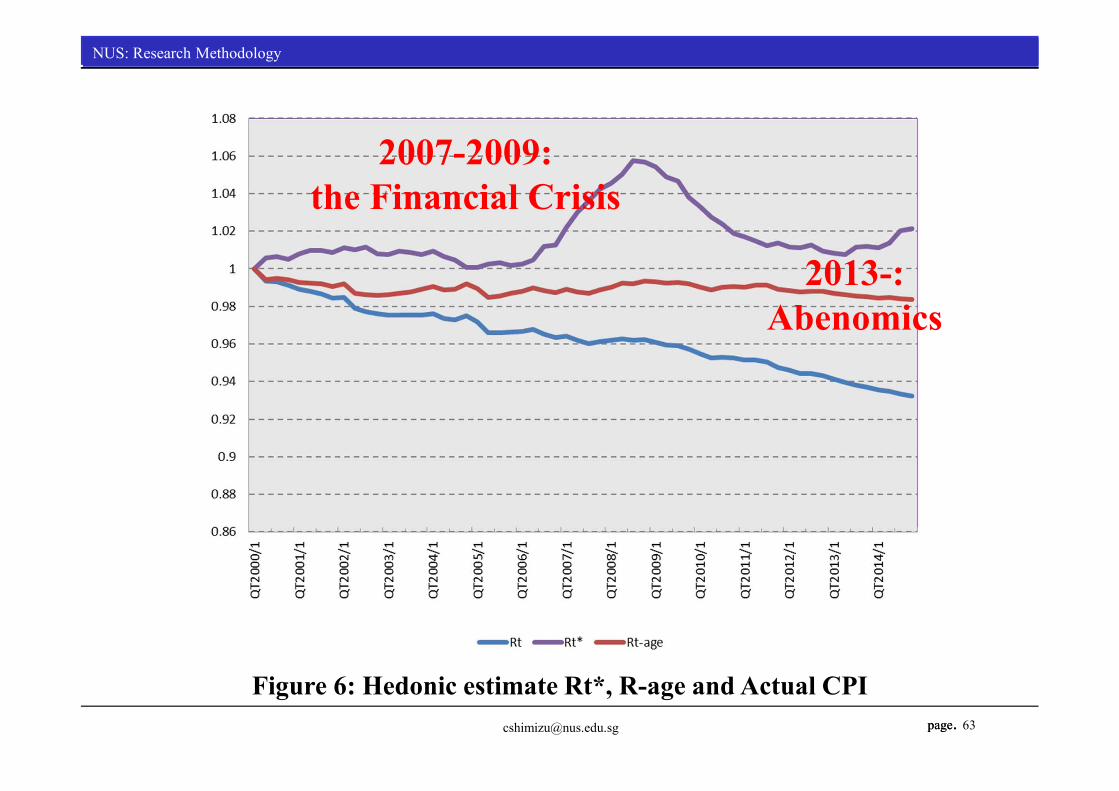
2007-2009: the Financial Crisis
Figure 6: Hedonic estimate Rt*, R-age and Actual CPI
2013-: Abenomics
page.
NUS: Research MethodologyNUS: Research Methodology
page. 64
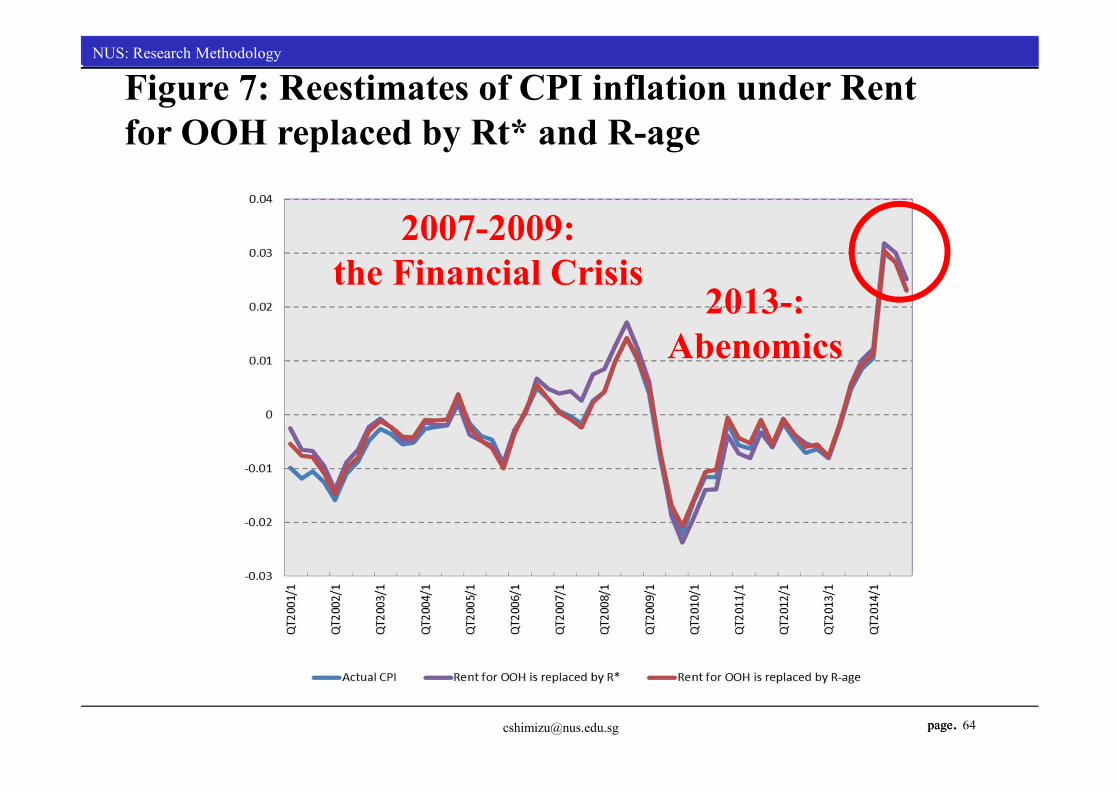
2007-2009: the Financial Crisis
2013-: Abenomics
Figure 7: Reestimates of CPI inflation under Rent for OOH replaced by Rt* and R-age
page.
NUS: Research MethodologyNUS: Research Methodology
page.
3. Conclusions:
• Goods and services prices, as represented by consumer price indexes and the like, have not changed all that much in response to fluctuations in asset prices.
• This lack of correlation means that management via fiscal policy and such is difficult.
• Focusing on rents,The obtained results showed that while rents based on new contracts change in an elastic manner, actual paid rents change only gradually, even when market shocks occur.
• In other words, average market rents, which are representative of consumer prices, have a strong tendency to change in a random manner, independently of changes in rents determined freely by the market.
page.
NUS: Research MethodologyNUS: Research Methodology
page.
3. Conclusions:
• Also, the rent index of actual CPI is pointed out the problems that aging depreciation is not adjusted properly. In other words, the actual CPI holds a strong downward bias due to mis-adjustment of this aging depreciation.
• However, we found that the effect of paying rent stickiness is much larger than the effect of aging depreciation.
• It is clear that the magnitude of the effect from paying rent stickiness enhances the stickiness of price index.
page.
NUS: Research MethodologyNUS: Research Methodology
page.
3. Conclusions:
To address with this problem, we have the following options.• First, we can consider the price index excluding the owner-
occupied housing rent for policy target. However, this way ignores the important factor of expenditure; the housing has the share from 25% to 30% in expenditure.
• Second, defining as the opportunity cost of homeowners, we can estimate rent index measuring the newly contracted rent instead of paying rent.
• Third one is the user cost method that many countries started to develop in these days.
page.
NUS: Research MethodologyNUS: Research Methodology
page.
3. Conclusions:
• the United Nations, IMF, OECD, BIS, and ILO have jointly put together international handbook on residential property price indices.
• Many countries in Europe finished this kind of indices and from March 2015,
• It also has been published through the test operation of three years in Japan.
• By using this index, we can estimate owner-occupied housing rent as the user cost base index.
page.
NUS: Research MethodologyNUS: Research Methodology
page.
清水千弘 : Chihiro Shimizu, PhD
シンガポール国立大学不動産研究センター 教授
Professor, Institute of Real Estate StudiesNational University of Singapore21 Heng Mui Keng Terrace, #04-02Singapore 119613Tel: (65) 6601 4925 Fax: (65) 6774 1003Email: [email protected]: www.ires.nus.edu.sg