Embed Size (px)
Citation preview
1
Research Update on Solar Polar Fields/Coronal Hole IMF and Large Earthquakes, and a Proposed Method for Quantifying Coronal Hole
Geoeffectiveness
Ben Davidson Space Weather News, LLC & The Mobile Observatory Project
Keywords: earthquake, sun, solar, interplanetary magnetic fields, coronal holes, solar polar fields
Key Points
The previously observed and statisticallymodelled patterns of solar polar fields (SPF) extremes and reversals triggering large earthquakes continued in 2014 and 2015.
Only one of the ten largest earthquakes failed to demonstrate any correlation with the activity of the sun’s interplanetary magnetic fields.
Coronal holes offer a promising candidate for future research into the mechanism by which the sun’s interplanetary magnetic fields may trigger earthquakes.
Introduction In October 2015, a study was published comparing the solar polar fields (SPF) data to the earthquake archives from the United States Geological Survey. (Davidson 2015[1]). The team found that a statistically significant relationship exists between both peaks in magnetism and
2
magnetic reversals of the SPF, and the largest (M8+) earthquakes during the data period of the SPF available at that time (19762013). The impetus to conduct that study was daily solar and seismic observations made for a solar/earth news program produced by Space Weather News (SWN). After three years of reporting on daily solar activity, extreme earth weather, and seismic activity, a pattern had become apparent to SWN, and to many of the viewers, whereby periods of increased earthquake activity (normally 24 days) seemed to occur during periods when coronal holes were crossing the center heliographic longitudes, and ended before the solar wind streams from those coronal holes arrived at earth. Currently, no quantitative coronal hole data exists, only qualitative lists of coronal hole numbers, dates, and polarity. Current methods do not attempt to measure the size and position of the coronal hole; larger, transequatorial coronal holes are more likely to be geoeffective. The only quantitative measure of coronal hole magnetic fields is the SPF data from Stanford’s Wilcox Solar Observatory (WSO), which is restricted to the IMF near the 55th latitude of the solar poles, measured at the heliographic longitude directly facing earth, and is given in 10day averages. We propose, and will conduct the implementation of, a method for quantifying the earthquake geoeffectiveness of a coronal hole based on its size and position. In a separate study, a shorter but significant peak in magnetism over a six day period, leading up to a M8.3 earthquake in Chile on September 16, 2015, was inferred from solar wind speed (SWS) data provided by the National Solar Observatory (NSO). (Davidson 2015 [2]). The SWS fluctuation took place within an earthfacing coronal hole opening, and was too short to be captured in SPF data that is averaged over ten days. While the mechanism of action that triggers these earthquakes is not exactly known, we can continue to evaluate the initial model in the time since the end of the analysis in Davidson 2015 [1], and we can further examine the solar phenomena associated with the IMF of coronal holes present on days when significant earthquakes occur. SPF, coronal holes, SWS, and large earthquakes during the operation of the Solar Dynamics Observatory (SDO) The SDO launched in February 2010 and began returning public data a few months later. The satellite revolutionized the way we are able to look at the sun, and has allowed for unprecedented detail in locating and tracking coronal holes. The first large earthquake to occur during the tenure of the SDO was in Japan in March 2011. Each of the following images of the sun is from NASA’s SDO/AIA in 211 Angstroms, accessed via helioviewer.org, and verified via NASA/SDO archives.
3
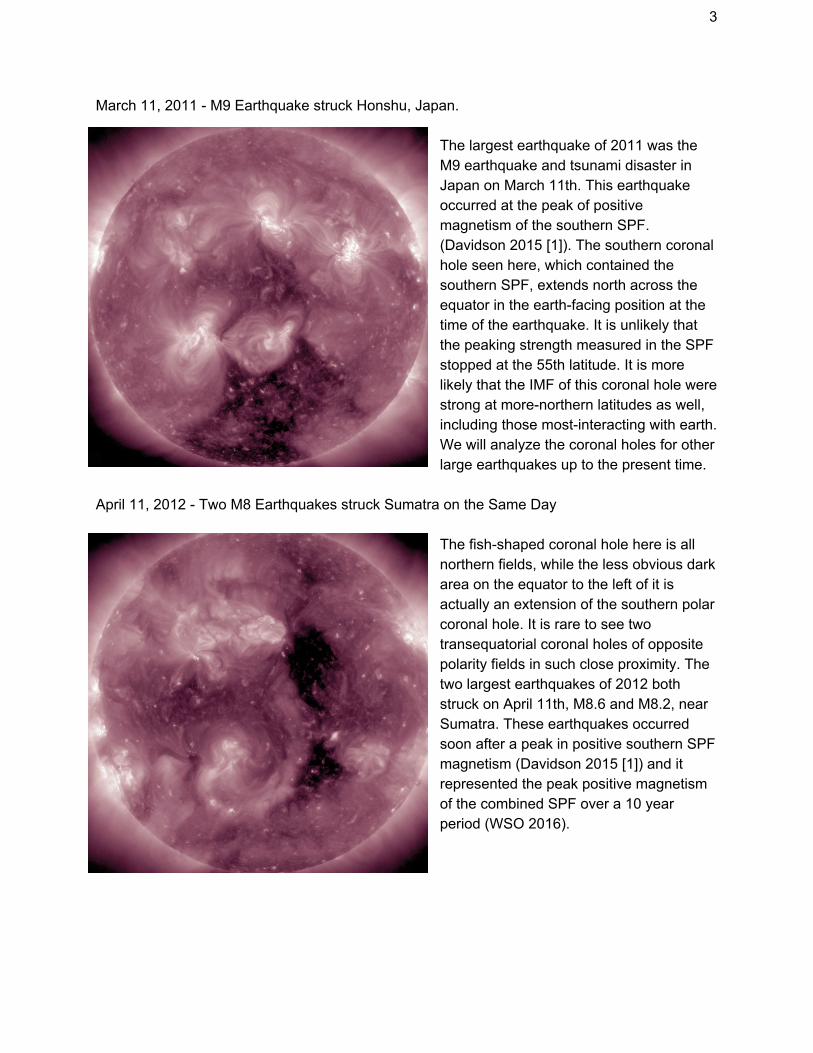
March 11, 2011 M9 Earthquake struck Honshu, Japan. The largest earthquake of 2011 was the M9 earthquake and tsunami disaster in Japan on March 11th. This earthquake occurred at the peak of positive magnetism of the southern SPF. (Davidson 2015 [1]). The southern coronal hole seen here, which contained the southern SPF, extends north across the equator in the earthfacing position at the time of the earthquake. It is unlikely that the peaking strength measured in the SPF stopped at the 55th latitude. It is more likely that the IMF of this coronal hole were strong at morenorthern latitudes as well, including those mostinteracting with earth. We will analyze the coronal holes for other large earthquakes up to the present time.
April 11, 2012 Two M8 Earthquakes struck Sumatra on the Same Day The fishshaped coronal hole here is all northern fields, while the less obvious dark area on the equator to the left of it is actually an extension of the southern polar coronal hole. It is rare to see two transequatorial coronal holes of opposite polarity fields in such close proximity. The two largest earthquakes of 2012 both struck on April 11th, M8.6 and M8.2, near Sumatra. These earthquakes occurred soon after a peak in positive southern SPF magnetism (Davidson 2015 [1]) and it represented the peak positive magnetism of the combined SPF over a 10 year period (WSO 2016).
4
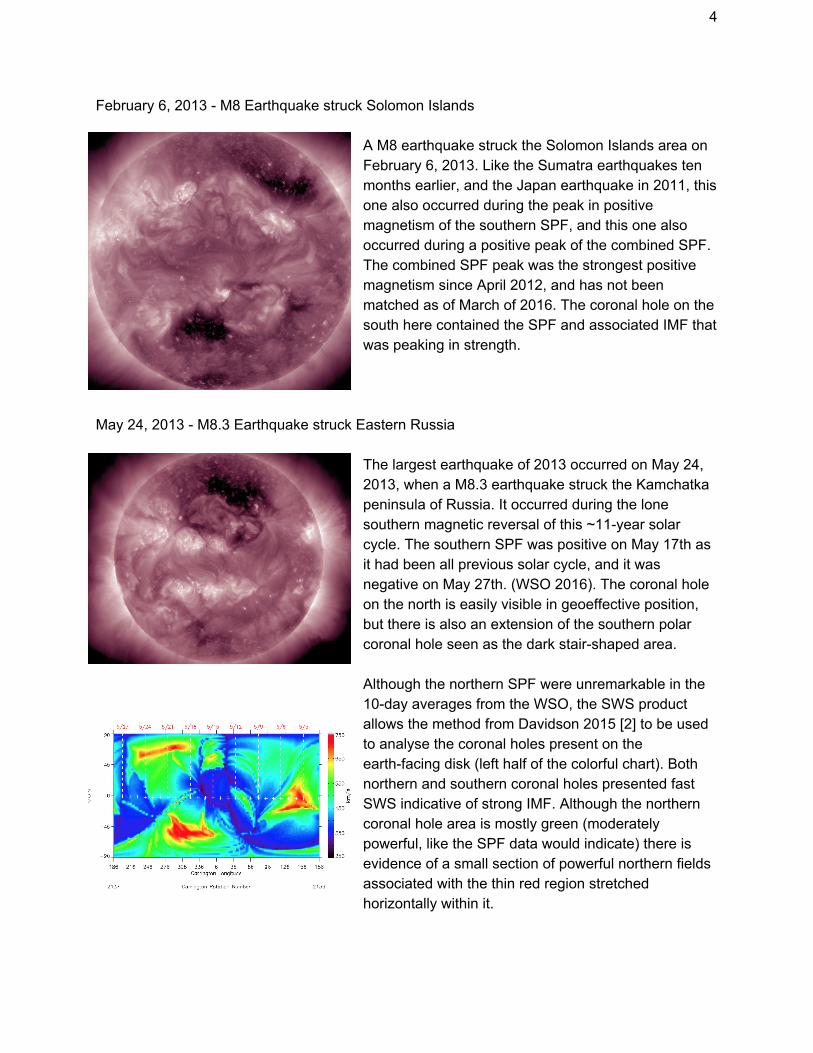
February 6, 2013 M8 Earthquake struck Solomon Islands A M8 earthquake struck the Solomon Islands area on February 6, 2013. Like the Sumatra earthquakes ten months earlier, and the Japan earthquake in 2011, this one also occurred during the peak in positive magnetism of the southern SPF, and this one also occurred during a positive peak of the combined SPF. The combined SPF peak was the strongest positive magnetism since April 2012, and has not been matched as of March of 2016. The coronal hole on the south here contained the SPF and associated IMF that was peaking in strength.
May 24, 2013 M8.3 Earthquake struck Eastern Russia The largest earthquake of 2013 occurred on May 24, 2013, when a M8.3 earthquake struck the Kamchatka peninsula of Russia. It occurred during the lone southern magnetic reversal of this ~11year solar cycle. The southern SPF was positive on May 17th as it had been all previous solar cycle, and it was negative on May 27th. (WSO 2016). The coronal hole on the north is easily visible in geoeffective position, but there is also an extension of the southern polar coronal hole seen as the dark stairshaped area. Although the northern SPF were unremarkable in the 10day averages from the WSO, the SWS product allows the method from Davidson 2015 [2] to be used to analyse the coronal holes present on the earthfacing disk (left half of the colorful chart). Both northern and southern coronal holes presented fast SWS indicative of strong IMF. Although the northern coronal hole area is mostly green (moderately powerful, like the SPF data would indicate) there is evidence of a small section of powerful northern fields associated with the thin red region stretched horizontally within it.
5
April 2, 2014 M8.2 Earthquake struck Chile
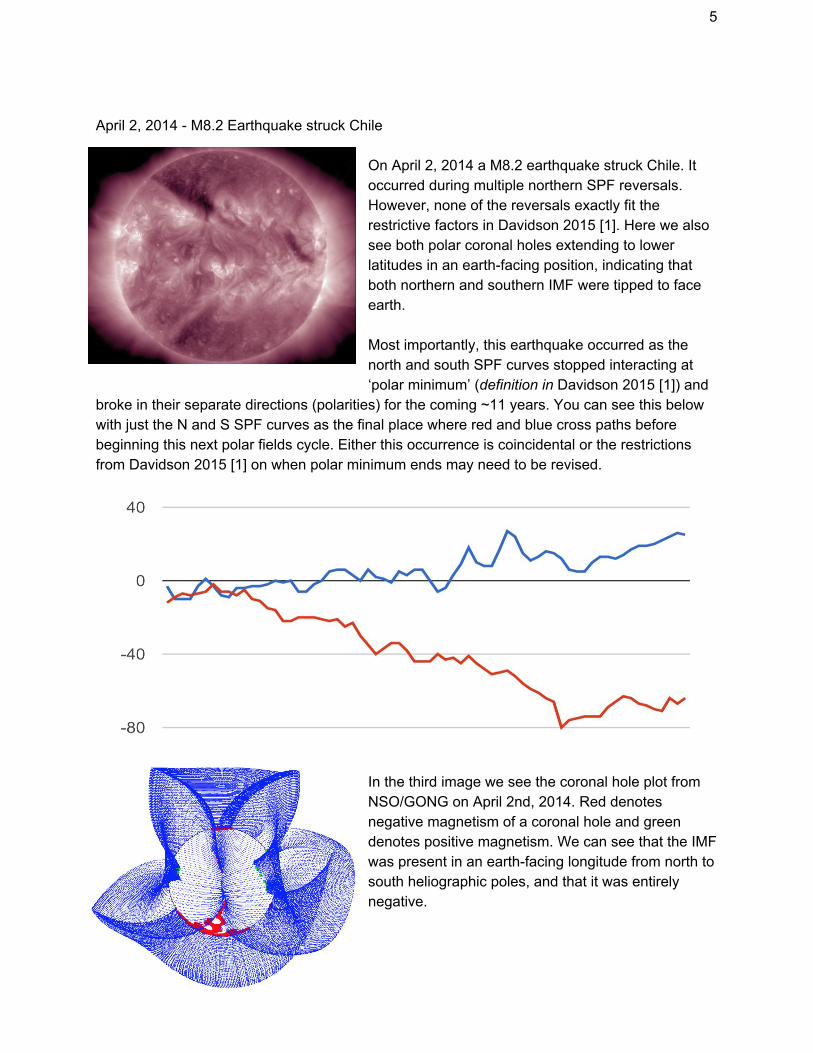
On April 2, 2014 a M8.2 earthquake struck Chile. It occurred during multiple northern SPF reversals. However, none of the reversals exactly fit the restrictive factors in Davidson 2015 [1]. Here we also see both polar coronal holes extending to lower latitudes in an earthfacing position, indicating that both northern and southern IMF were tipped to face earth. Most importantly, this earthquake occurred as the north and south SPF curves stopped interacting at ‘polar minimum’ (definition in Davidson 2015 [1]) and
broke in their separate directions (polarities) for the coming ~11 years. You can see this below with just the N and S SPF curves as the final place where red and blue cross paths before beginning this next polar fields cycle. Either this occurrence is coincidental or the restrictions from Davidson 2015 [1] on when polar minimum ends may need to be revised.
In the third image we see the coronal hole plot from NSO/GONG on April 2nd, 2014. Red denotes negative magnetism of a coronal hole and green denotes positive magnetism. We can see that the IMF was present in an earthfacing longitude from north to south heliographic poles, and that it was entirely negative.
6
June 23, 2014 a M7.9 Earthquake struck Alaska
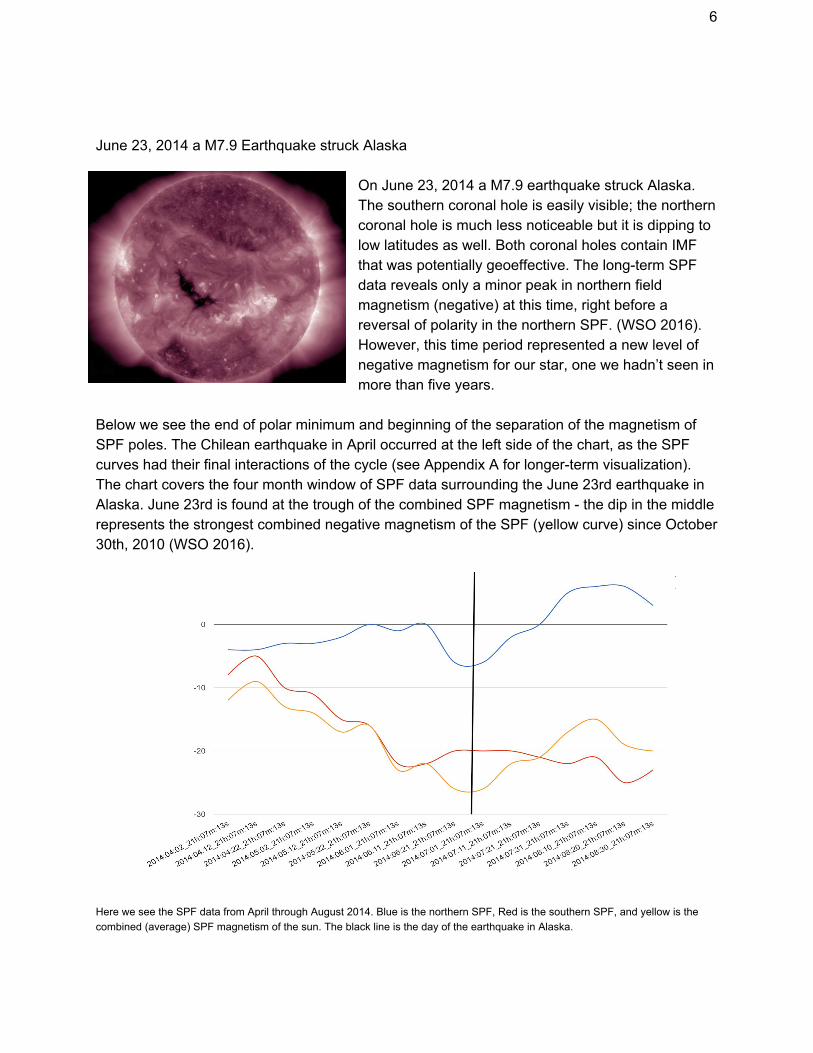
On June 23, 2014 a M7.9 earthquake struck Alaska. The southern coronal hole is easily visible; the northern coronal hole is much less noticeable but it is dipping to low latitudes as well. Both coronal holes contain IMF that was potentially geoeffective. The longterm SPF data reveals only a minor peak in northern field magnetism (negative) at this time, right before a reversal of polarity in the northern SPF. (WSO 2016). However, this time period represented a new level of negative magnetism for our star, one we hadn’t seen in more than five years.
Below we see the end of polar minimum and beginning of the separation of the magnetism of SPF poles. The Chilean earthquake in April occurred at the left side of the chart, as the SPF curves had their final interactions of the cycle (see Appendix A for longerterm visualization). The chart covers the four month window of SPF data surrounding the June 23rd earthquake in Alaska. June 23rd is found at the trough of the combined SPF magnetism the dip in the middle represents the strongest combined negative magnetism of the SPF (yellow curve) since October 30th, 2010 (WSO 2016).
Here we see the SPF data from April through August 2014. Blue is the northern SPF, Red is the southern SPF, and yellow is the combined (average) SPF magnetism of the sun. The black line is the day of the earthquake in Alaska.
7
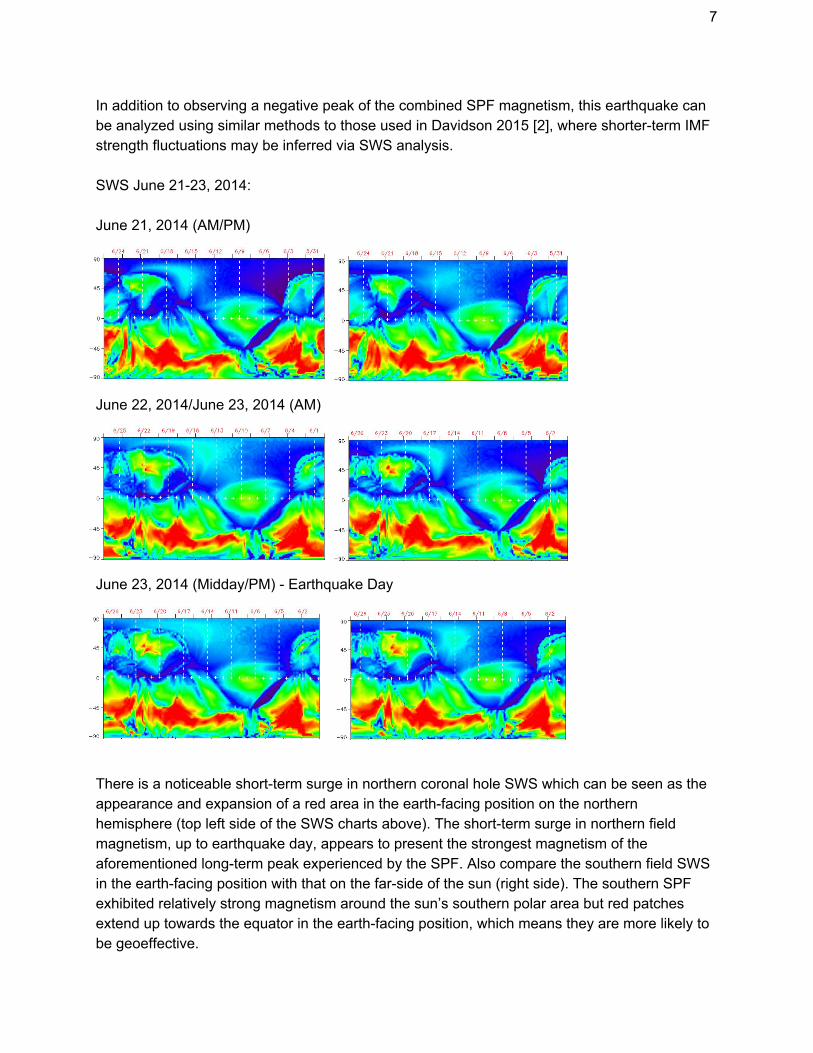
In addition to observing a negative peak of the combined SPF magnetism, this earthquake can be analyzed using similar methods to those used in Davidson 2015 [2], where shorterterm IMF strength fluctuations may be inferred via SWS analysis. SWS June 2123, 2014: June 21, 2014 (AM/PM)
June 22, 2014/June 23, 2014 (AM)
June 23, 2014 (Midday/PM) Earthquake Day
There is a noticeable shortterm surge in northern coronal hole SWS which can be seen as the appearance and expansion of a red area in the earthfacing position on the northern hemisphere (top left side of the SWS charts above). The shortterm surge in northern field magnetism, up to earthquake day, appears to present the strongest magnetism of the aforementioned longterm peak experienced by the SPF. Also compare the southern field SWS in the earthfacing position with that on the farside of the sun (right side). The southern SPF exhibited relatively strong magnetism around the sun’s southern polar area but red patches extend up towards the equator in the earthfacing position, which means they are more likely to be geoeffective.
8
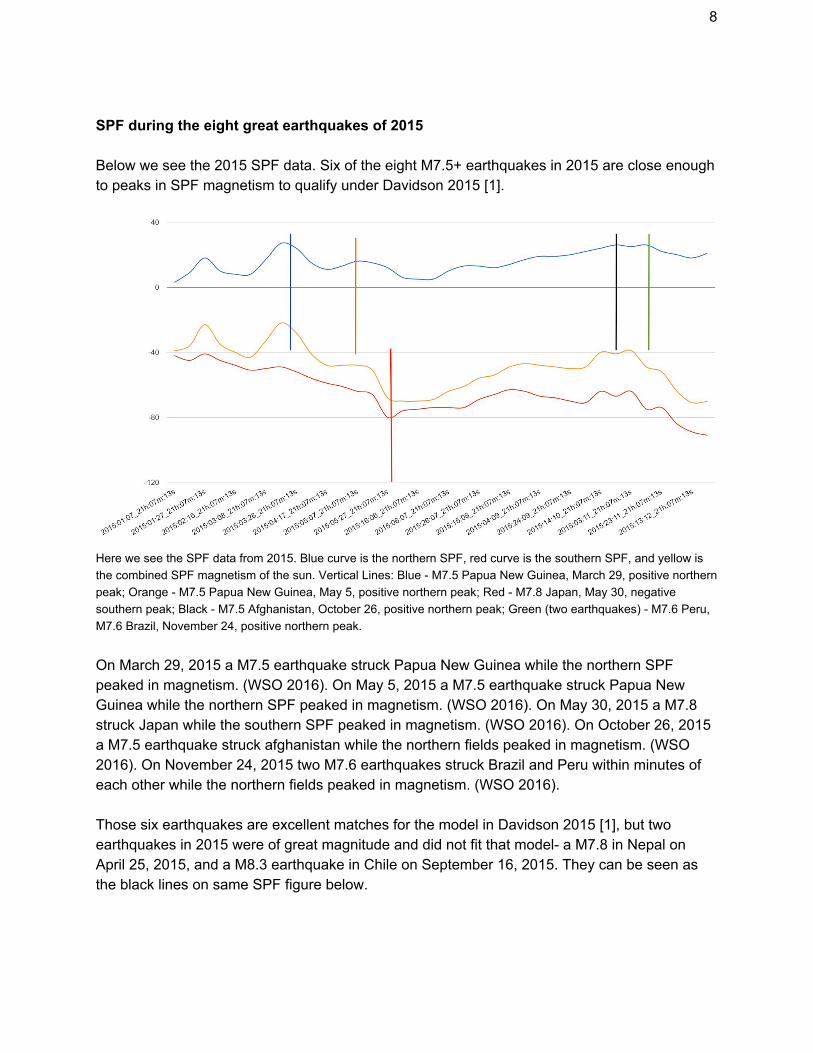
SPF during the eight great earthquakes of 2015 Below we see the 2015 SPF data. Six of the eight M7.5+ earthquakes in 2015 are close enough to peaks in SPF magnetism to qualify under Davidson 2015 [1].
Here we see the SPF data from 2015. Blue curve is the northern SPF, red curve is the southern SPF, and yellow is the combined SPF magnetism of the sun. Vertical Lines: Blue M7.5 Papua New Guinea, March 29, positive northern peak; Orange M7.5 Papua New Guinea, May 5, positive northern peak; Red M7.8 Japan, May 30, negative southern peak; Black M7.5 Afghanistan, October 26, positive northern peak; Green (two earthquakes) M7.6 Peru, M7.6 Brazil, November 24, positive northern peak. On March 29, 2015 a M7.5 earthquake struck Papua New Guinea while the northern SPF peaked in magnetism. (WSO 2016). On May 5, 2015 a M7.5 earthquake struck Papua New Guinea while the northern SPF peaked in magnetism. (WSO 2016). On May 30, 2015 a M7.8 struck Japan while the southern SPF peaked in magnetism. (WSO 2016). On October 26, 2015 a M7.5 earthquake struck afghanistan while the northern fields peaked in magnetism. (WSO 2016). On November 24, 2015 two M7.6 earthquakes struck Brazil and Peru within minutes of each other while the northern fields peaked in magnetism. (WSO 2016). Those six earthquakes are excellent matches for the model in Davidson 2015 [1], but two earthquakes in 2015 were of great magnitude and did not fit that model a M7.8 in Nepal on April 25, 2015, and a M8.3 earthquake in Chile on September 16, 2015. They can be seen as the black lines on same SPF figure below.
9
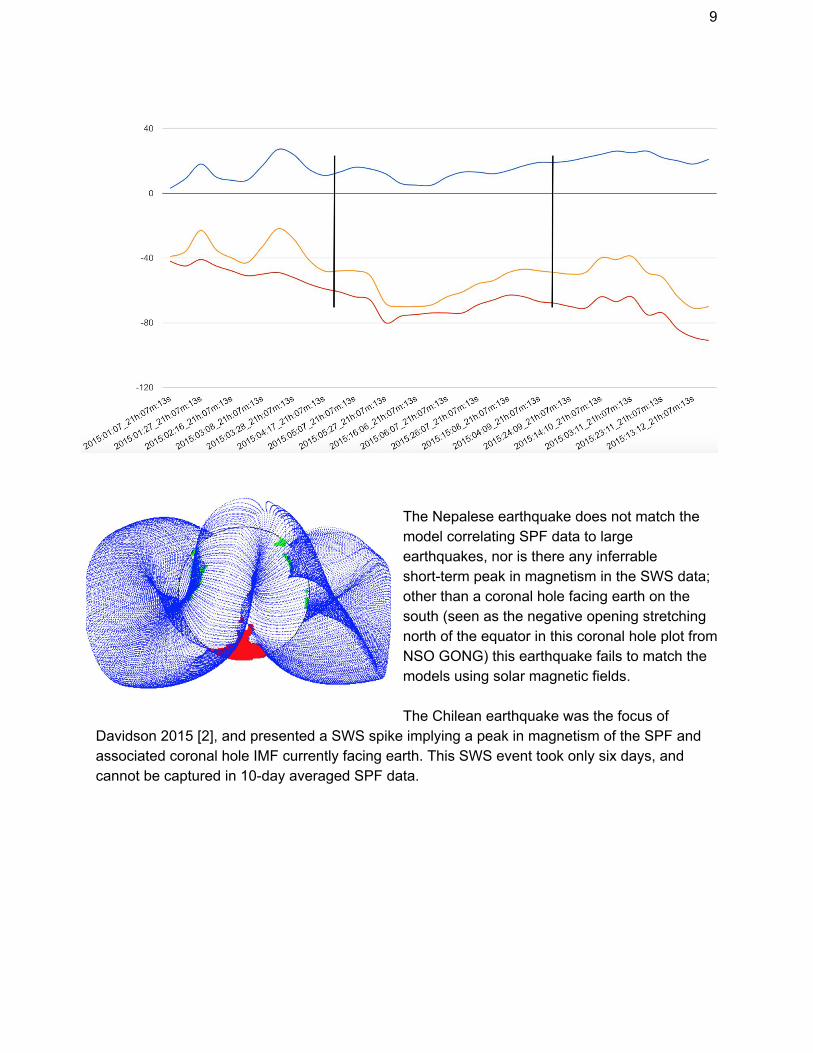
The Nepalese earthquake does not match the model correlating SPF data to large earthquakes, nor is there any inferrable shortterm peak in magnetism in the SWS data; other than a coronal hole facing earth on the south (seen as the negative opening stretching north of the equator in this coronal hole plot from NSO GONG) this earthquake fails to match the models using solar magnetic fields. The Chilean earthquake was the focus of
Davidson 2015 [2], and presented a SWS spike implying a peak in magnetism of the SPF and associated coronal hole IMF currently facing earth. This SWS event took only six days, and cannot be captured in 10day averaged SPF data.
10
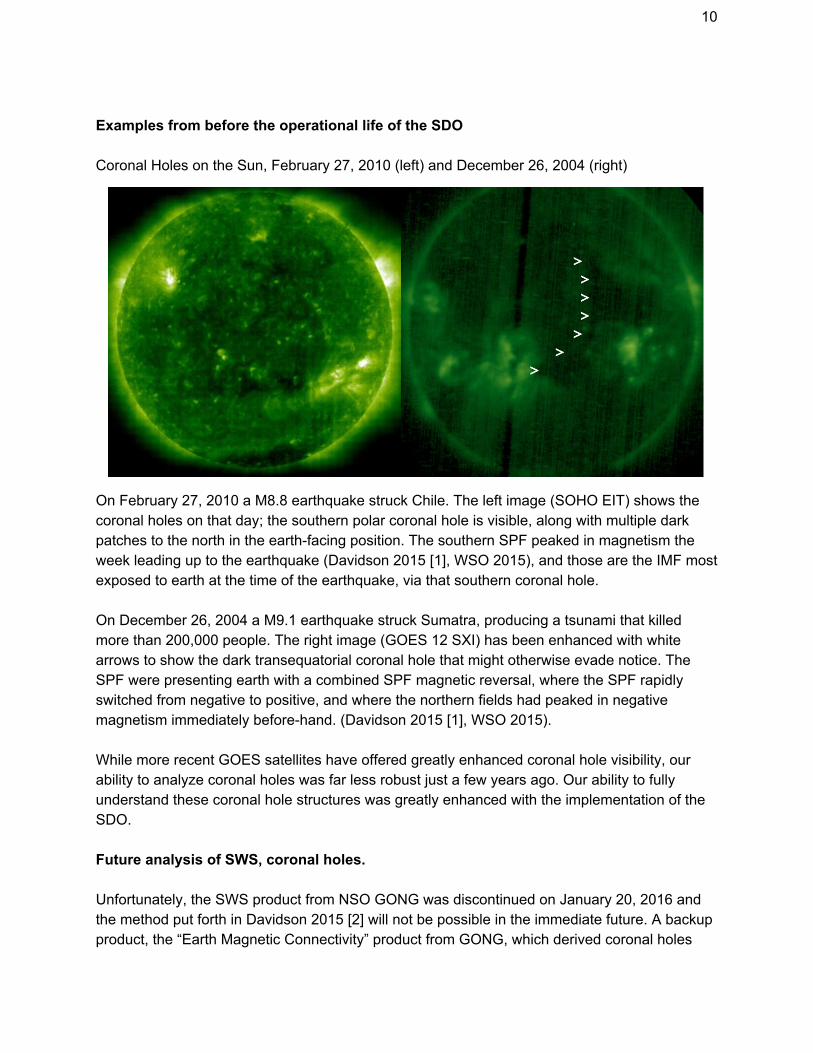
Examples from before the operational life of the SDO Coronal Holes on the Sun, February 27, 2010 (left) and December 26, 2004 (right)
On February 27, 2010 a M8.8 earthquake struck Chile. The left image (SOHO EIT) shows the coronal holes on that day; the southern polar coronal hole is visible, along with multiple dark patches to the north in the earthfacing position. The southern SPF peaked in magnetism the week leading up to the earthquake (Davidson 2015 [1], WSO 2015), and those are the IMF most exposed to earth at the time of the earthquake, via that southern coronal hole. On December 26, 2004 a M9.1 earthquake struck Sumatra, producing a tsunami that killed more than 200,000 people. The right image (GOES 12 SXI) has been enhanced with white arrows to show the dark transequatorial coronal hole that might otherwise evade notice. The SPF were presenting earth with a combined SPF magnetic reversal, where the SPF rapidly switched from negative to positive, and where the northern fields had peaked in negative magnetism immediately beforehand. (Davidson 2015 [1], WSO 2015). While more recent GOES satellites have offered greatly enhanced coronal hole visibility, our ability to analyze coronal holes was far less robust just a few years ago. Our ability to fully understand these coronal hole structures was greatly enhanced with the implementation of the SDO. Future analysis of SWS, coronal holes. Unfortunately, the SWS product from NSO GONG was discontinued on January 20, 2016 and the method put forth in Davidson 2015 [2] will not be possible in the immediate future. A backup product, the “Earth Magnetic Connectivity” product from GONG, which derived coronal holes
11
and solar wind speed, had been used periodically before it was discontinued in July 2015. Solar wind telemetry from STEREOA may act as a standin for a few years until it orbits close enough to earth to be functionally indistinguishable from ACE, DSCOVR, GOESR and other satellites set to be taking solar wind readings at that time, but it will only provide a narrow reading and is unlikely to provide useful data on solar wind at other heliospheric latitudes. STEREOA may be useful for gauging the strength of equatorial coronal holes a few days in advance. In 2016, coronal hole data will be greatly enhanced when size and position relative to the earthfacing position of the sun are tracked and catalogued, allowing for the first quantitative analysis of earthfacing coronal holes as an earthquake trigger to begin. The product will use SDO images at first, and may be complemented or supplemented as subsequent satellites become operational. Final Thoughts While further research and analysis is needed to confirm any results from this or previous papers cited here, 2014 and 2015 presented encouraging data for continuing to monitor solar activity and earthquake activity, and investigate the possible connections between the two spheres. 2014 resembled many years from the 1980s in terms of its mediocre SPF/earthquake correlation and the Nepal earthquake of 2015 showed no correlation at all, but 2015 overall was a standout among the 40 year observation period. Other than witnessing the end of the SWS products, the data available for future analysis is robust and will soon be enhanced with quantitative coronal hole data. See Following Pages For Acknowledgements, Citations, Appendices (Images by Ben Davidson, open usage rights granted, with credit.)
12
Acknowledgements. This note includes images provided courtesy of NASA’s Solar Dynamics Observatory, and the AIA, HMI, and EVE teams, as well as images from NSO/GONG, in association with the NSF and AURA. Helioviewer.org was used to access the SDO images. The author wishes to express continued appreciation for Dr.s Holloman and Uyen’s contributions to the foundation of this field of study, and to the journal New Concepts in Global Tectonics (ncgt.org) for publishing our initial works in this field. Citations. [1] Davidson, Uyen, Holloman (2015) Relationship Between M8+ Earthquake Occurrences and the Solar Polar Magnetic Fields. New Concepts in Global Tectonics Journal, V.3, No. 3, September 2015, pp. 310322 www.ncgt.org
[2] Davidson, B. (2015) A Surge and ShortTerm Peak in Northern Solar Polar Field Magnetism Prior to the M8.3 Earthquake Near Chile on September 16, 2015. New Concepts in Global Tectonics Journal, V.3, No. 3, September 2015, pp. 391393 www.ncgt.org
Both [1] and [2] can be read by downloading the September 2015 issue here: http://www.ncgt.org/newsletter.php
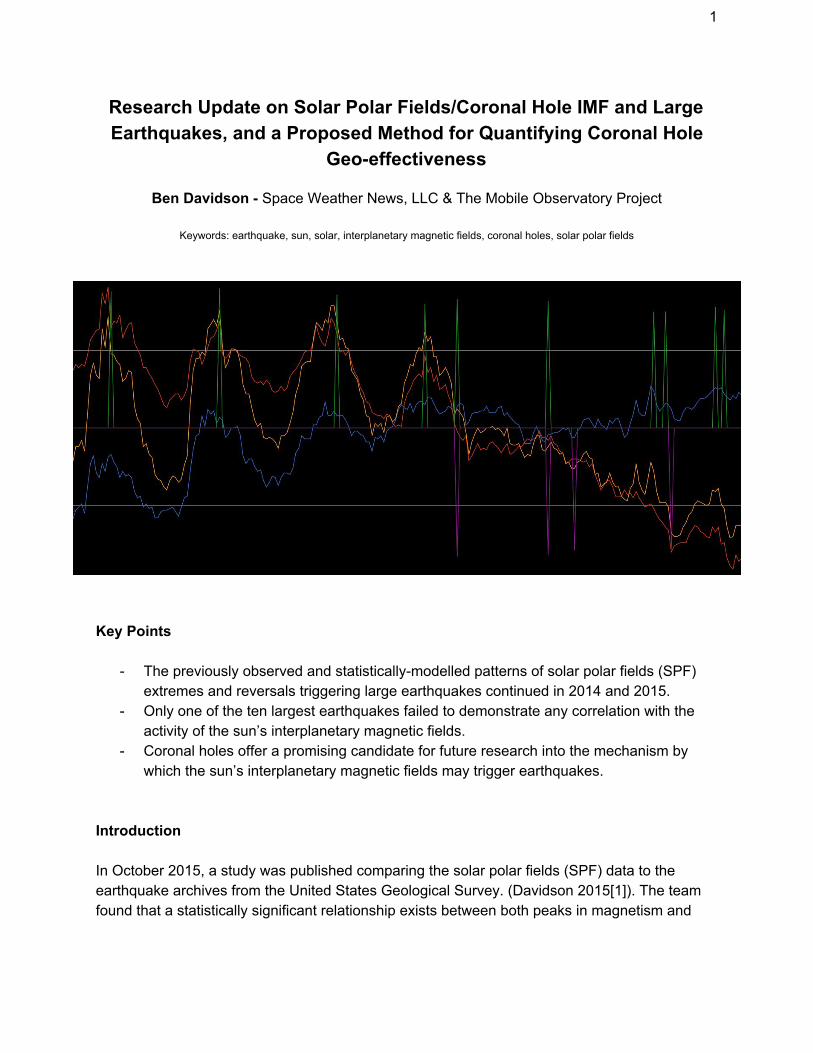
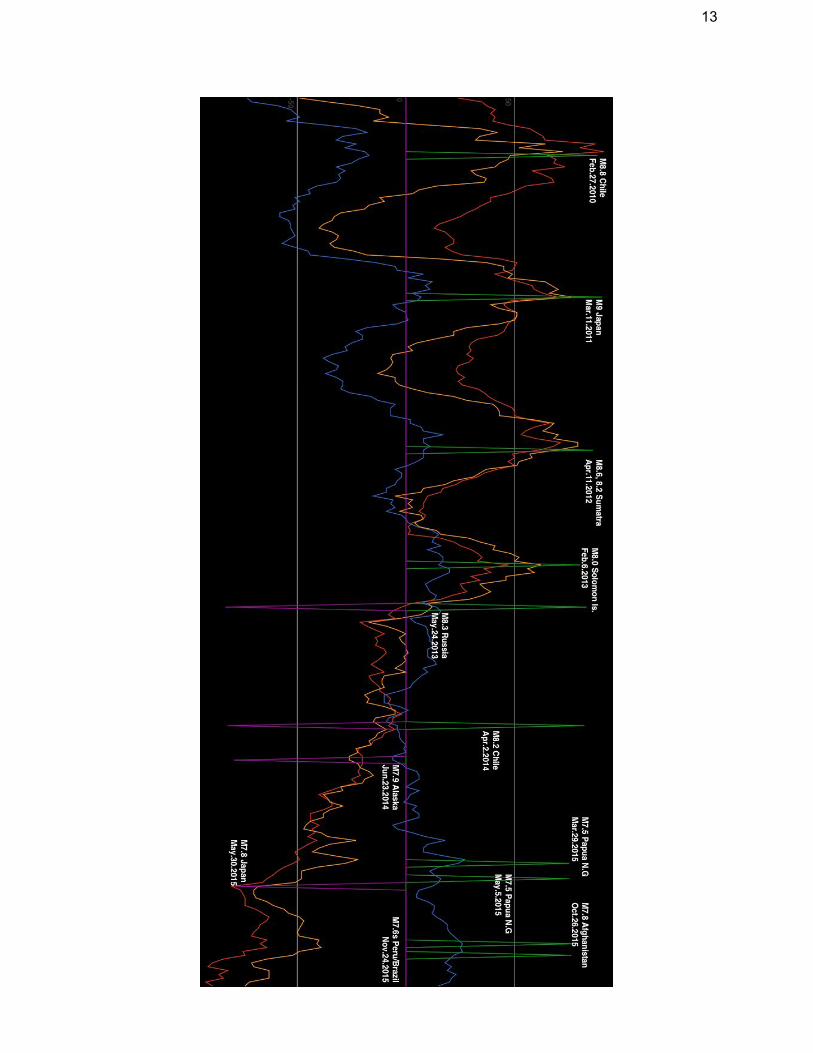
[3] 10day Average Solar Polar Fields Data from Stanford’s Wilcox Solar Observatory. http://wso.stanford.edu/Polar.html See Next Page For Annotated Graphic Appendix A, SPF and Large Earthquakes From 2010 through 2015. (Images by Ben Davidson, open usage rights granted, with credit.) The blue, red, and yellow curves are still the north, south, and combined SPF curves. The green and purple spikes are days of major earthquakes. Purple is for negative SPF events, green is for positive events, and reversals have both green and purple spikes.
13
14
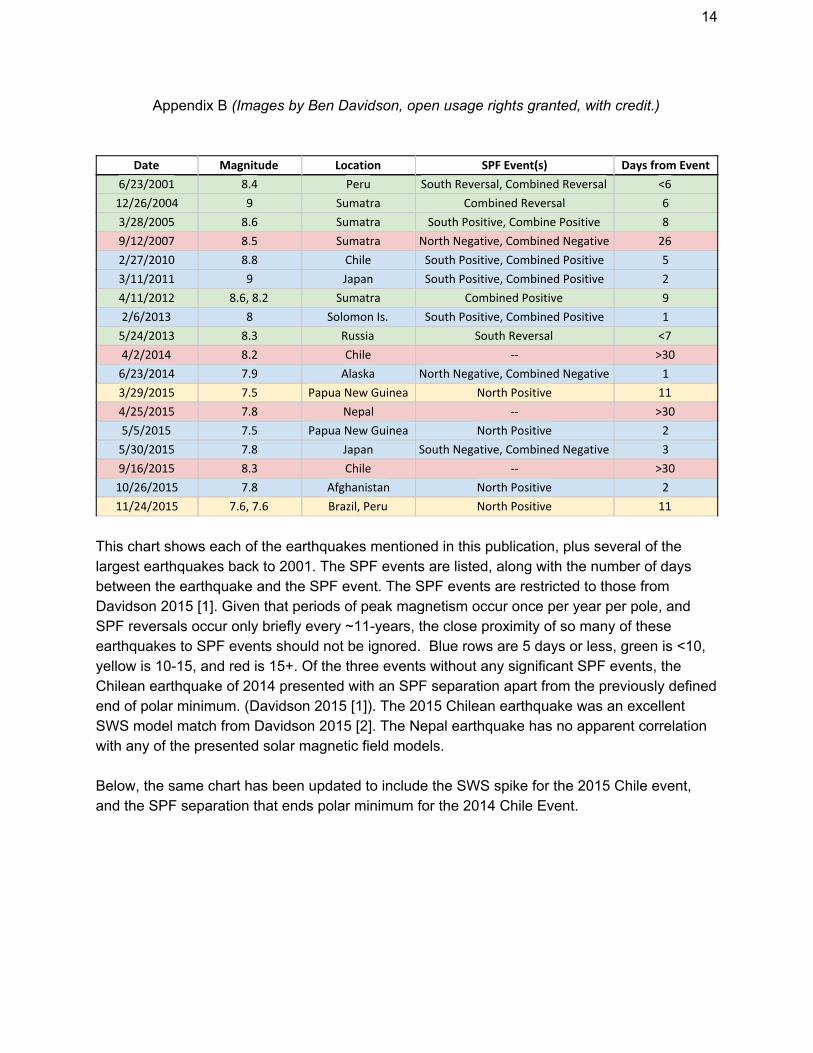
Appendix B (Images by Ben Davidson, open usage rights granted, with credit.)
Date Magnitude Location SPF Event(s) Days from Event
6/23/2001 8.4 Peru South Reversal, Combined Reversal <6
12/26/2004 9 Sumatra Combined Reversal 6
3/28/2005 8.6 Sumatra South Positive, Combine Positive 8
9/12/2007 8.5 Sumatra North Negative, Combined Negative 26
2/27/2010 8.8 Chile South Positive, Combined Positive 5
3/11/2011 9 Japan South Positive, Combined Positive 2
4/11/2012 8.6, 8.2 Sumatra Combined Positive 9
2/6/2013 8 Solomon Is. South Positive, Combined Positive 1
5/24/2013 8.3 Russia South Reversal <7
4/2/2014 8.2 Chile >30
6/23/2014 7.9 Alaska North Negative, Combined Negative 1
3/29/2015 7.5 Papua New Guinea North Positive 11
4/25/2015 7.8 Nepal >30
5/5/2015 7.5 Papua New Guinea North Positive 2
5/30/2015 7.8 Japan South Negative, Combined Negative 3
9/16/2015 8.3 Chile >30
10/26/2015 7.8 Afghanistan North Positive 2
11/24/2015 7.6, 7.6 Brazil, Peru North Positive 11
This chart shows each of the earthquakes mentioned in this publication, plus several of the largest earthquakes back to 2001. The SPF events are listed, along with the number of days between the earthquake and the SPF event. The SPF events are restricted to those from Davidson 2015 [1]. Given that periods of peak magnetism occur once per year per pole, and SPF reversals occur only briefly every ~11years, the close proximity of so many of these earthquakes to SPF events should not be ignored. Blue rows are 5 days or less, green is <10, yellow is 1015, and red is 15+. Of the three events without any significant SPF events, the Chilean earthquake of 2014 presented with an SPF separation apart from the previously defined end of polar minimum. (Davidson 2015 [1]). The 2015 Chilean earthquake was an excellent SWS model match from Davidson 2015 [2]. The Nepal earthquake has no apparent correlation with any of the presented solar magnetic field models. Below, the same chart has been updated to include the SWS spike for the 2015 Chile event, and the SPF separation that ends polar minimum for the 2014 Chile Event.
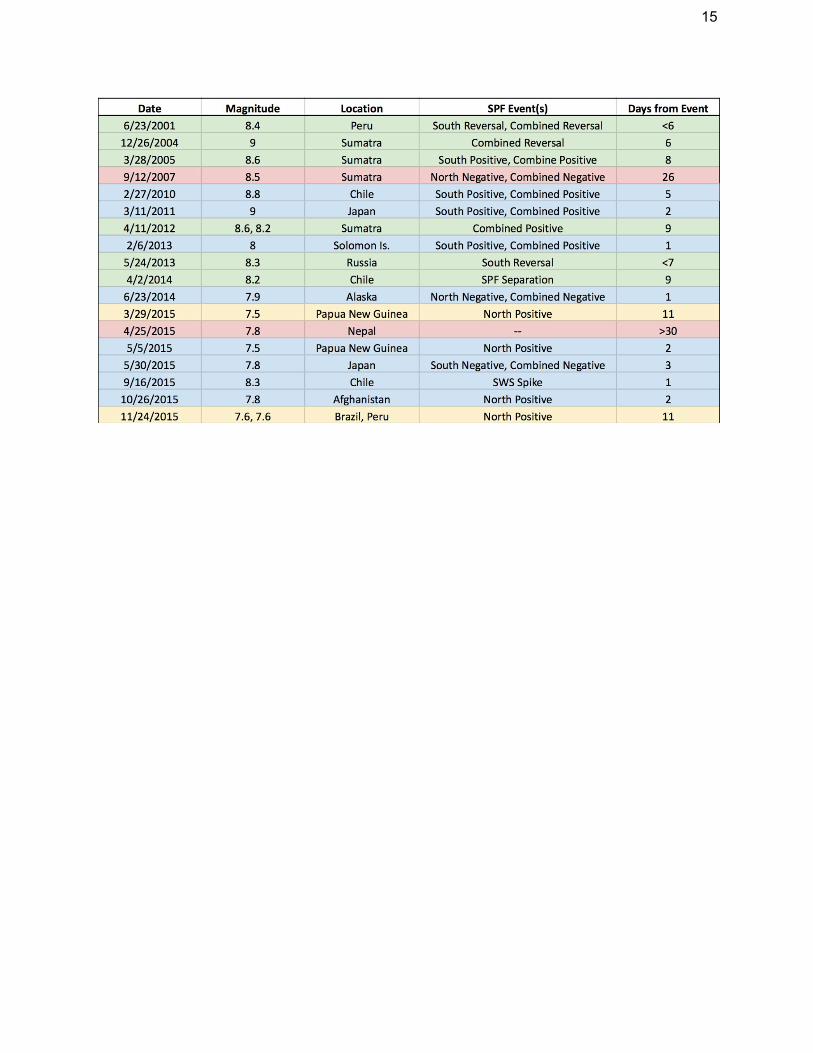
15