Embed Size (px)
Citation preview
RESTRUCTURING AND EXPANSION: NEW DIMENSIONS FOR CHINA TELECOM SECTOR GRADUATE PROJECT 5/7/2009
SUPRIYA KULKARNI
2 | P a g e
TABLE OF CONTENTS_______________________________________________________________
1. INTRODUCTION………………………………………………………………………………………………………………3
2. THE SCENARIO………………………………………………………………………………………………………………..4
3. THE ANALYSIS PROCESS………………………………………………………………………………………………….5
4. OPAQUE SCENARIO…………………………………………………………………………………………………………6
4.1 INITIAL SCENARIO…………………………………………………………………………………………………….9
4.2 SAME SCENARIO WITH 20 %GROWTH IN TRAFFIC…………………………………………………..12
5. TRANSPARENT SCENARIO……………………………………………………………………………………..………15
5.1 INITIAL SCENARIO…………………………………………………………………………………………………..16
5.2 SAME SCENARIO WITH 20 %GROWTH IN TRAFFIC…………………………………………………..19
6. COMPARISON BETWEEN ALL SCENARIOS……………………………………………………………………...23
7. EXTRA MILE …………………………………………………………………………………………………………………23
8. CONCLUSION…………………………………………………………………………………………………………………24
9. Appendix‐1
10. Appendix‐2
11. Appendix‐3
12. Appendix‐4
13. Appendix‐5
3 | P a g e
INTRODUCTION______________________________________________________________________ As the wave of Restructuring hits China Telecom industry, the leading telecom companies have
started to expand and revamp their networks. “As part of the move, China Telecom has acquired the
CDMA line of China Unicom, and China Unicom has been merged with China Netcom. Another
incumbent operator, China Mobile, has acquired China Railcom”.[1] China telecom, the largest
mobile operator in the world and also one of the biggest telecom players in Chinese Telecom
business industry has decided to expand the networks in the country. As a Network Designer
Representative for China Mobile, this project is one of the designs proposed for the network.
Further, this basic network will have growth aspect and more money and designing investment
shall be done in near future.
As we go through this journey of the network design, we will have two basic type of network considerations:
1. Opaque 2. Transparent
In the transparent mode, the transponders are present at the tributary ports of the OXC/OADM. In opaque mode, the transponders are present in WDM line system. The transparent systems can transmit through thousands of kilometers. And as we are also looking forward for a cost effective solution, this comparison would provide us option to choose.
As mentioned in the proposal/milestone, emphasize would be on:
Failure analysis
Wavelength utilizations
Utilization of the fiber pairs deployed
4 | P a g e
Cost parameter
Overall performance of the network
Optimal solution for the network design proposed
[1] Reference: http://www.cnc114.net/576/a403467.html
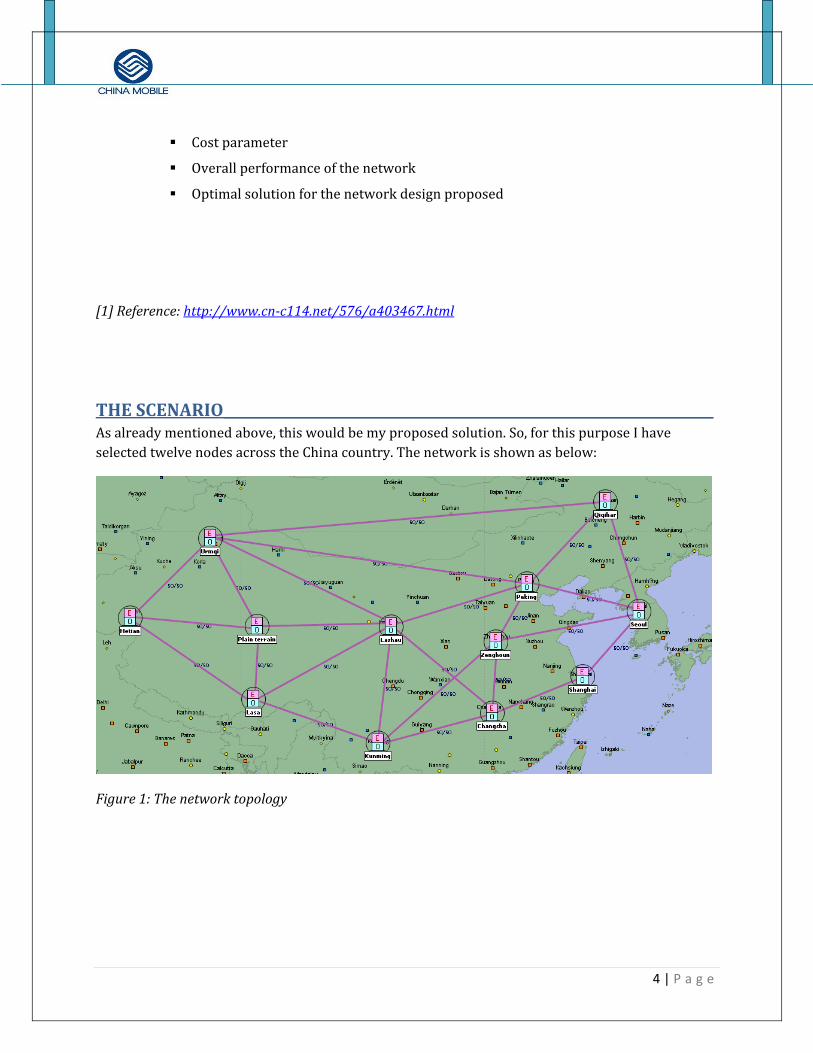
THE SCENARIO_______________________________________________________________________ As already mentioned above, this would be my proposed solution. So, for this purpose I have selected twelve nodes across the China country. The network is shown as below:
Figure 1: The network topology
5 | P a g e
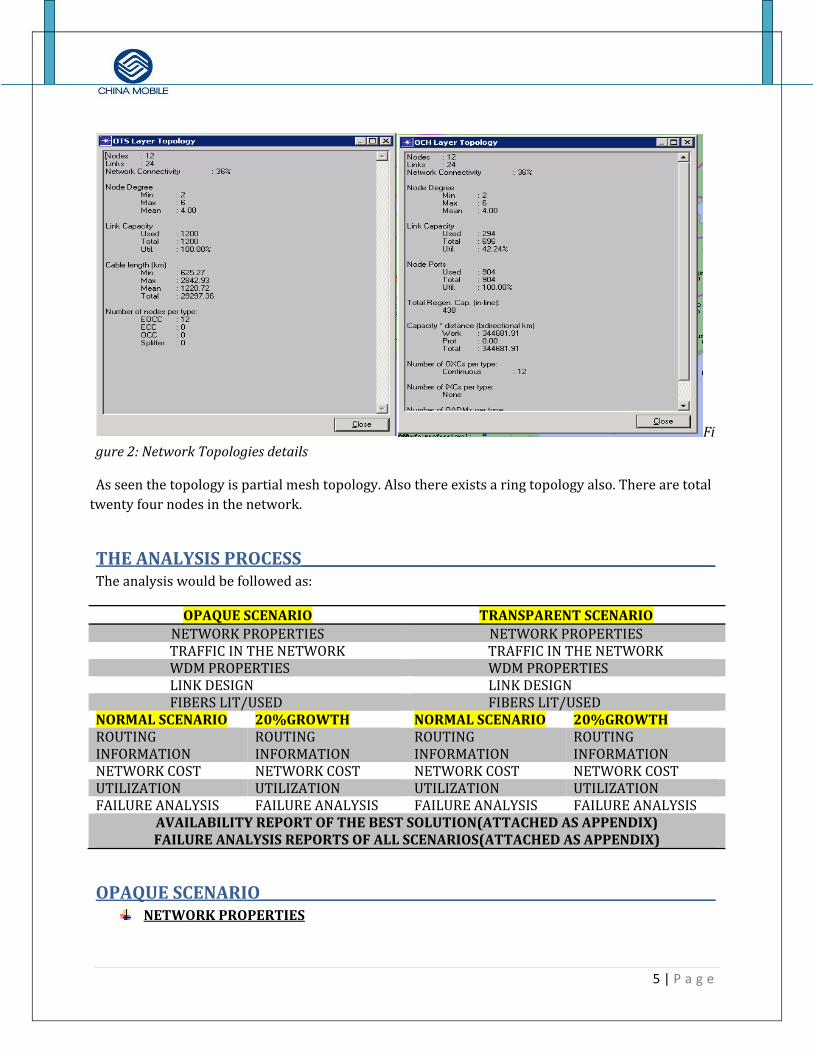
Figure 2: Network Topologies details
As seen the topology is partial mesh topology. Also there exists a ring topology also. There are total twenty four nodes in the network.
THE ANALYSIS PROCESS____________________________________________________________ The analysis would be followed as:
OPAQUE SCENARIO TRANSPARENT SCENARIO NETWORK PROPERTIES NETWORK PROPERTIES
TRAFFIC IN THE NETWORK TRAFFIC IN THE NETWORK WDM PROPERTIES WDM PROPERTIES LINK DESIGN LINK DESIGN FIBERS LIT/USED FIBERS LIT/USED NORMAL SCENARIO 20%GROWTH NORMAL SCENARIO 20%GROWTH ROUTING INFORMATION
ROUTING INFORMATION
ROUTING INFORMATION
ROUTING INFORMATION
NETWORK COST NETWORK COST NETWORK COST NETWORK COSTUTILIZATION UTILIZATION UTILIZATION UTILIZATIONFAILURE ANALYSIS FAILURE ANALYSIS FAILURE ANALYSIS FAILURE ANALYSIS
AVAILABILITY REPORT OF THE BEST SOLUTION(ATTACHED AS APPENDIX) FAILURE ANALYSIS REPORTS OF ALL SCENARIOS(ATTACHED AS APPENDIX)
OPAQUE SCENARIO__________________________________________________________________ NETWORK PROPERTIES
6 | P a g e
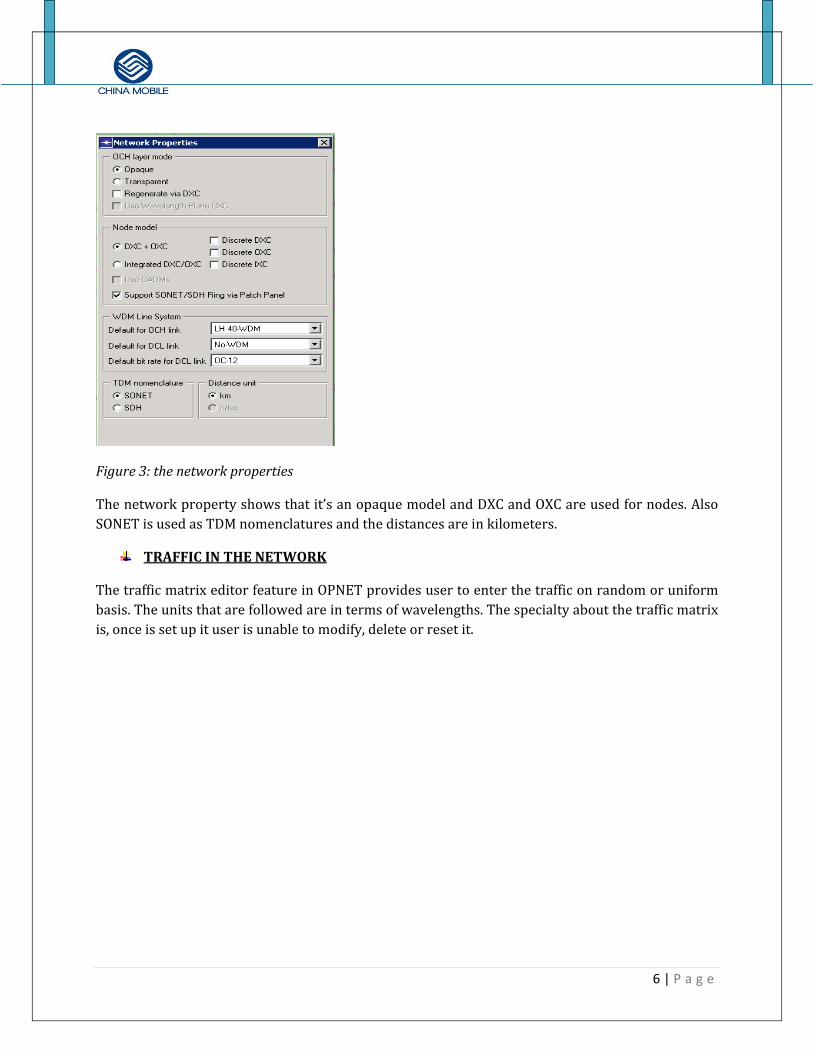
Figure 3: the network properties
The network property shows that it’s an opaque model and DXC and OXC are used for nodes. Also SONET is used as TDM nomenclatures and the distances are in kilometers.
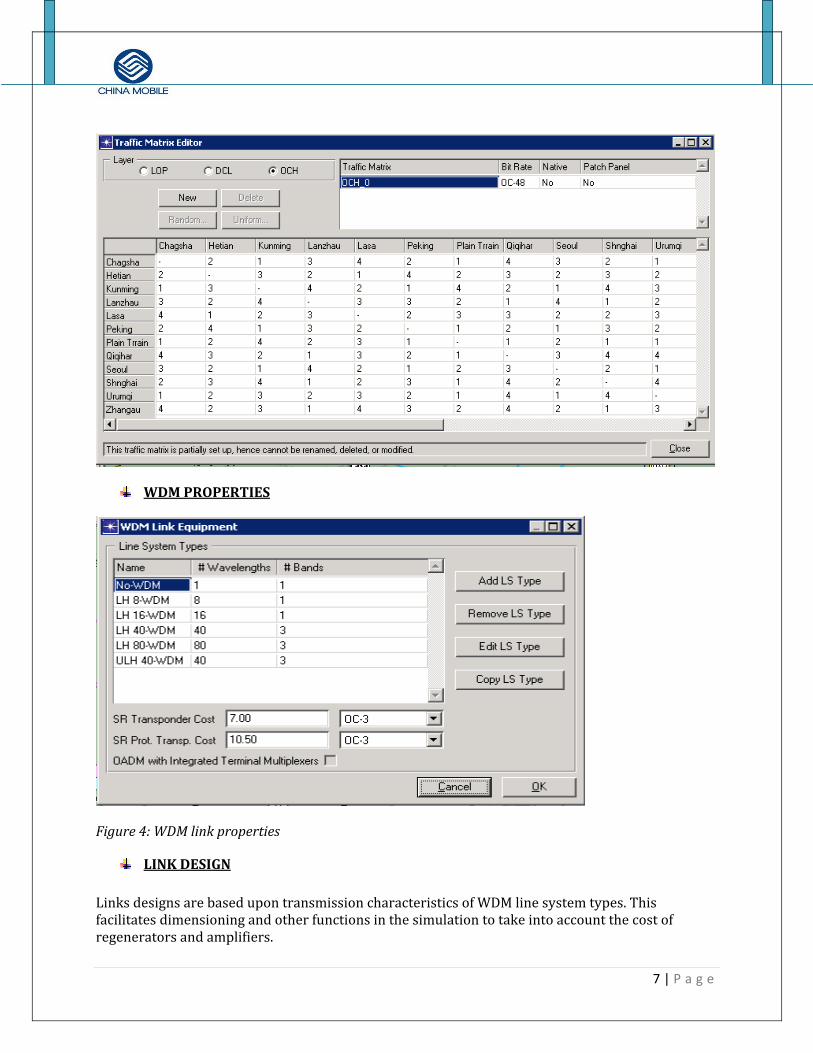
TRAFFIC IN THE NETWORK
The traffic matrix editor feature in OPNET provides user to enter the traffic on random or uniform basis. The units that are followed are in terms of wavelengths. The specialty about the traffic matrix is, once is set up it user is unable to modify, delete or reset it.
7 | P a g e
WDM PROPERTIES
Figure 4: WDM link properties
LINK DESIGN
Links designs are based upon transmission characteristics of WDM line system types. This facilitates dimensioning and other functions in the simulation to take into account the cost of regenerators and amplifiers.
8 | P a g e
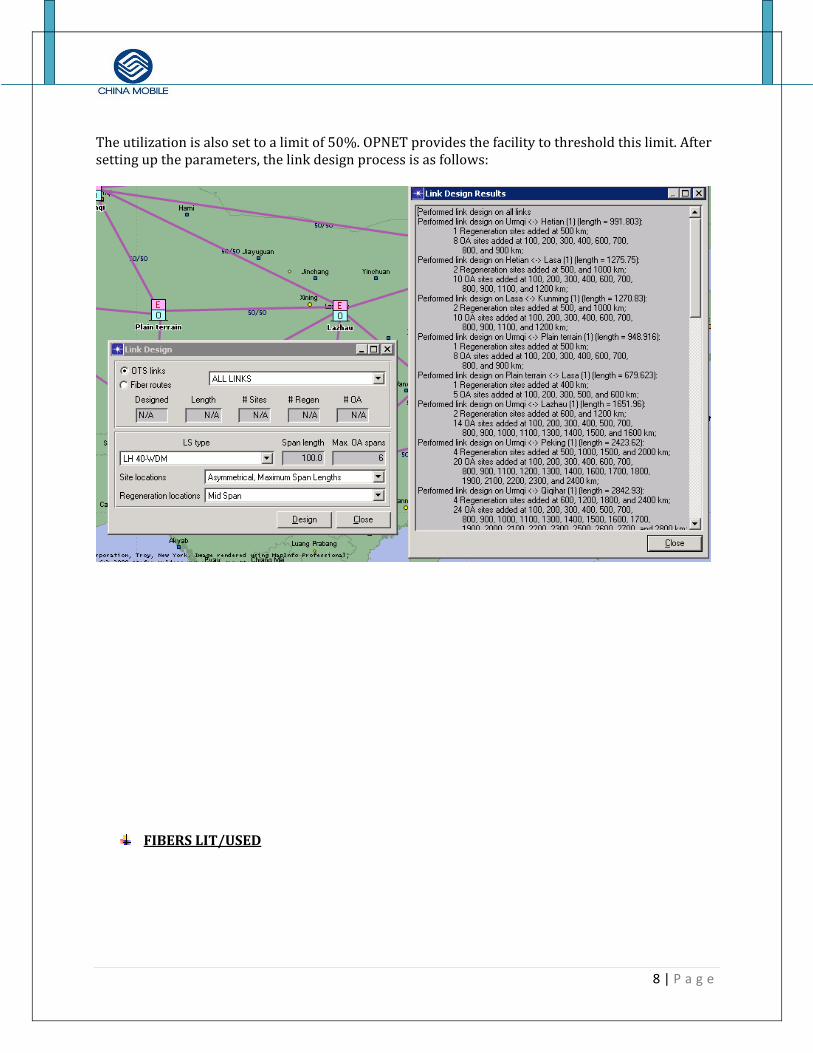
The utilization is also set to a limit of 50%. OPNET provides the facility to threshold this limit. After setting up the parameters, the link design process is as follows:
FIBERS LIT/USED
9 | P a g e
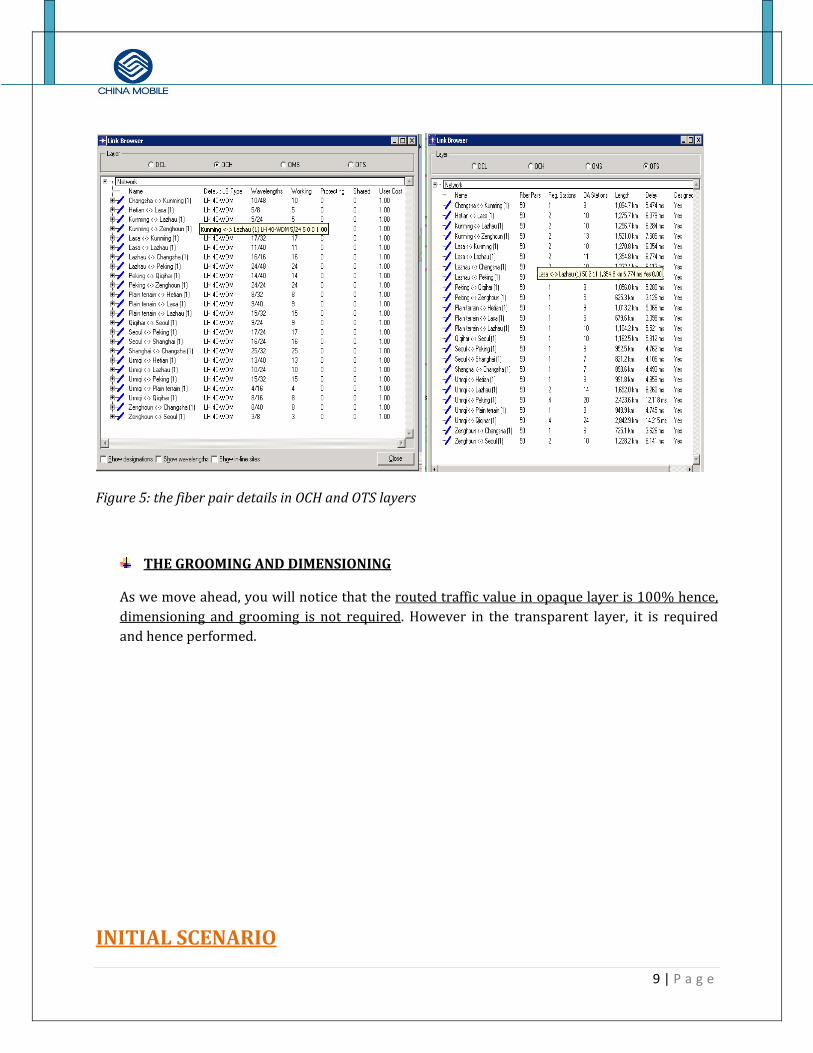
Figure 5: the fiber pair details in OCH and OTS layers
THE GROOMING AND DIMENSIONING
As we move ahead, you will notice that the routed traffic value in opaque layer is 100% hence, dimensioning and grooming is not required. However in the transparent layer, it is required and hence performed.
INITIAL SCENARIO
10 | P a g e
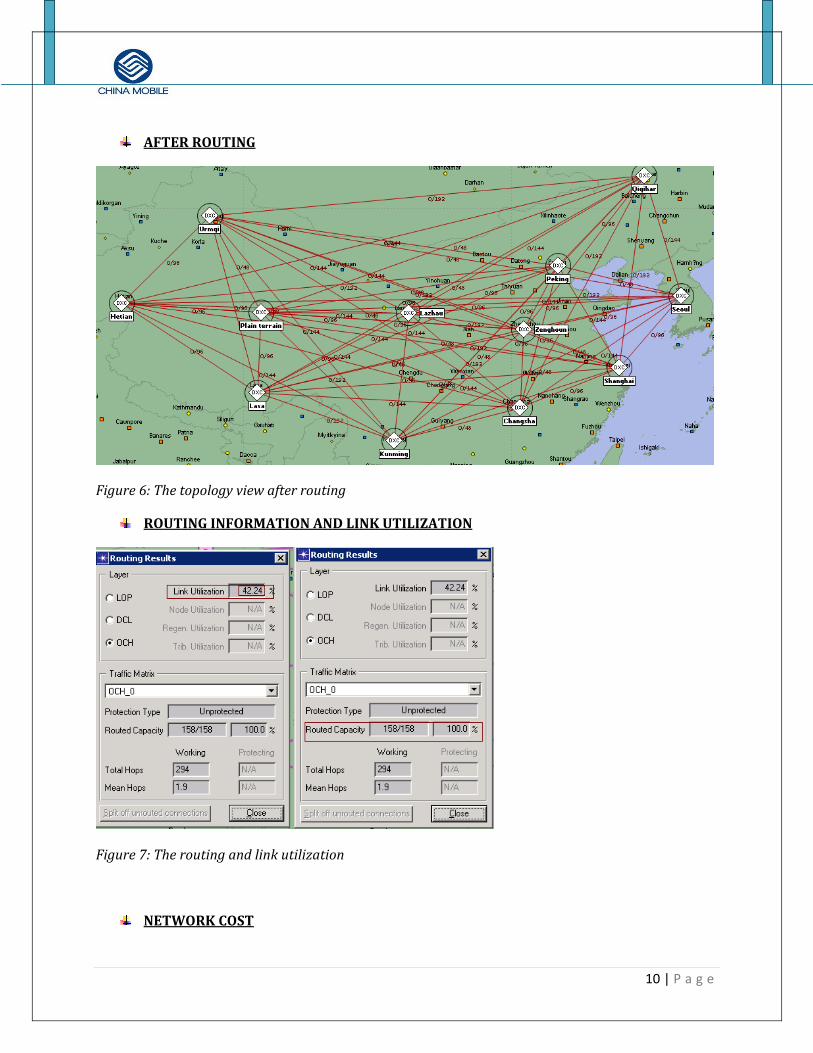
AFTER ROUTING
Figure 6: The topology view after routing
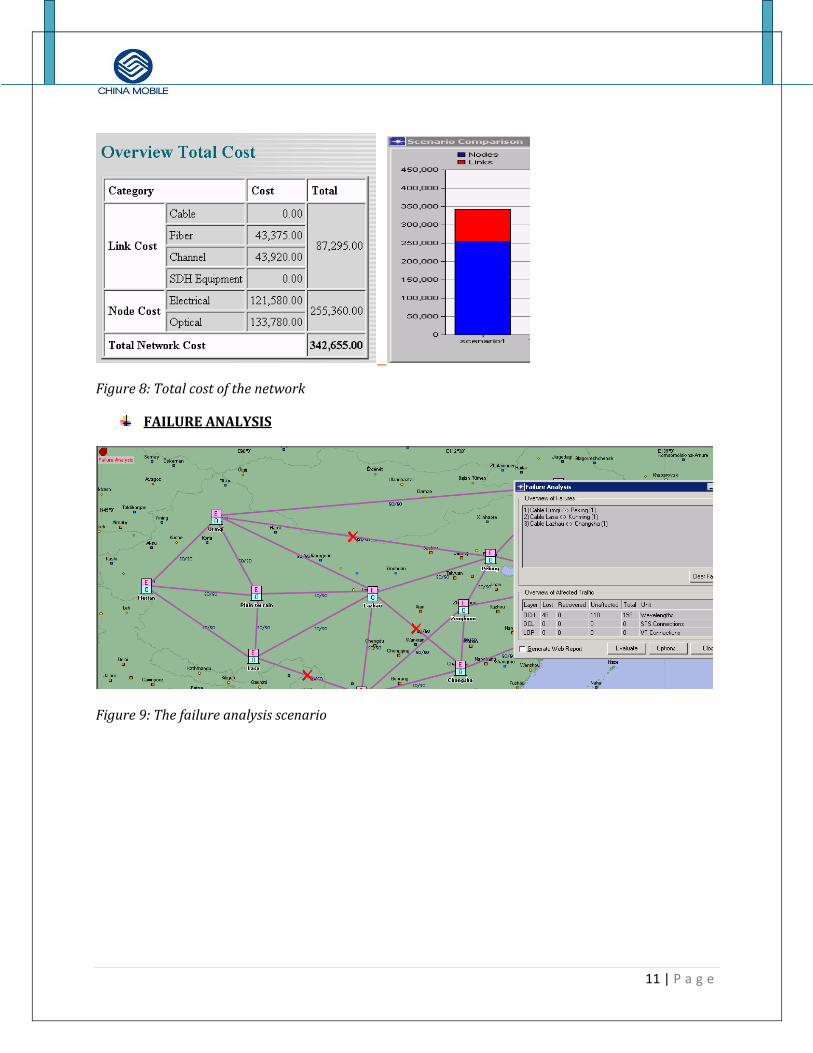
ROUTING INFORMATION AND LINK UTILIZATION
Figure 7: The routing and link utilization
NETWORK COST
11 | P a g e
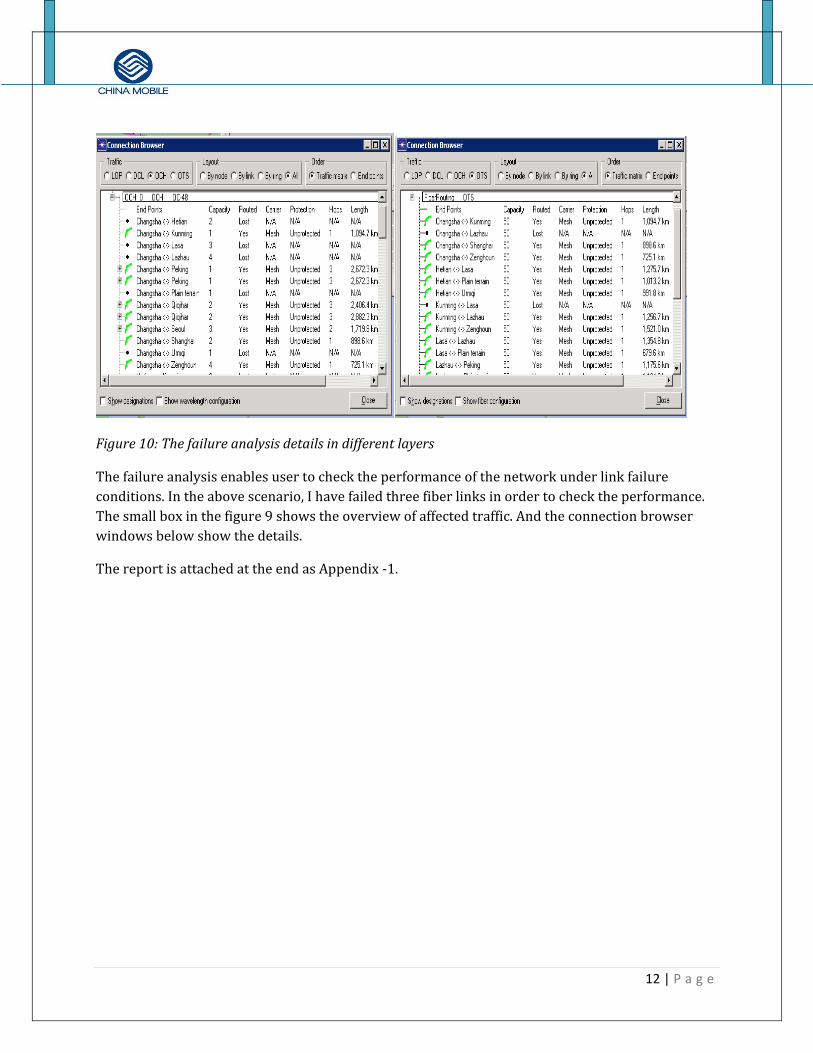
Figure 8: Total cost of the network
FAILURE ANALYSIS
Figure 9: The failure analysis scenario
12 | P a g e
Figure 10: The failure analysis details in different layers
The failure analysis enables user to check the performance of the network under link failure conditions. In the above scenario, I have failed three fiber links in order to check the performance. The small box in the figure 9 shows the overview of affected traffic. And the connection browser windows below show the details.
The report is attached at the end as Appendix ‐1.
13 | P a g e
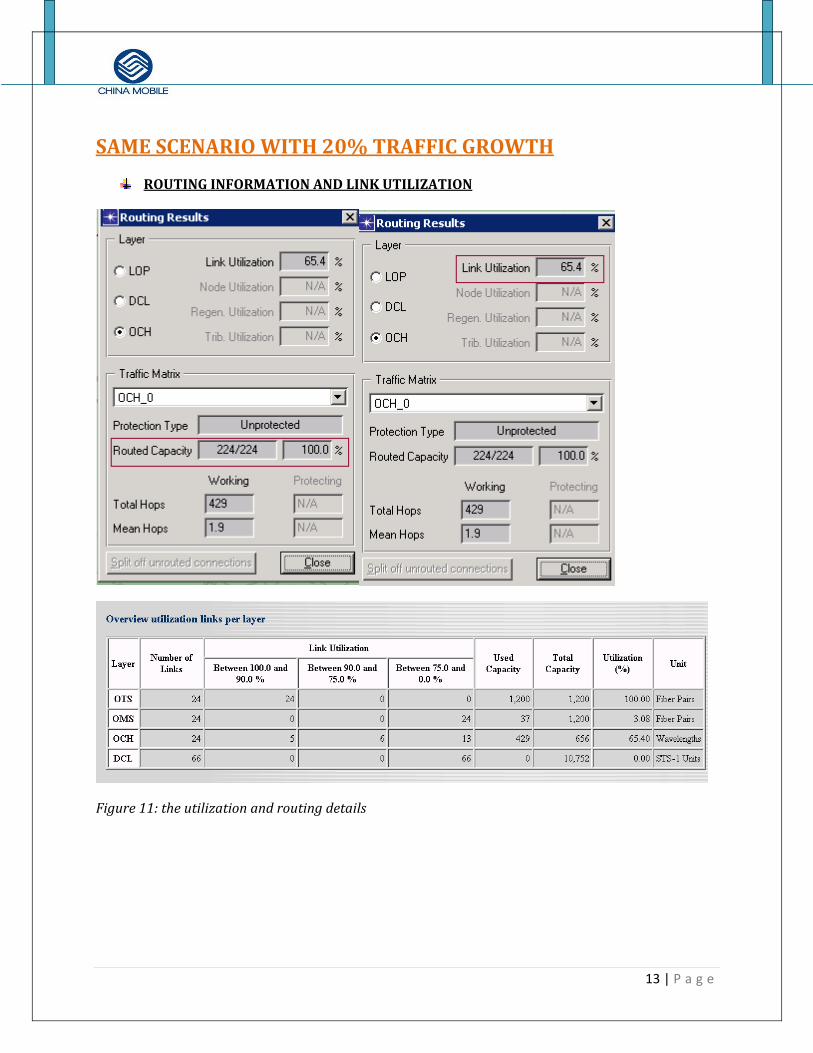
SAME SCENARIO WITH 20% TRAFFIC GROWTH
ROUTING INFORMATION AND LINK UTILIZATION
Figure 11: the utilization and routing details
14 | P a g e
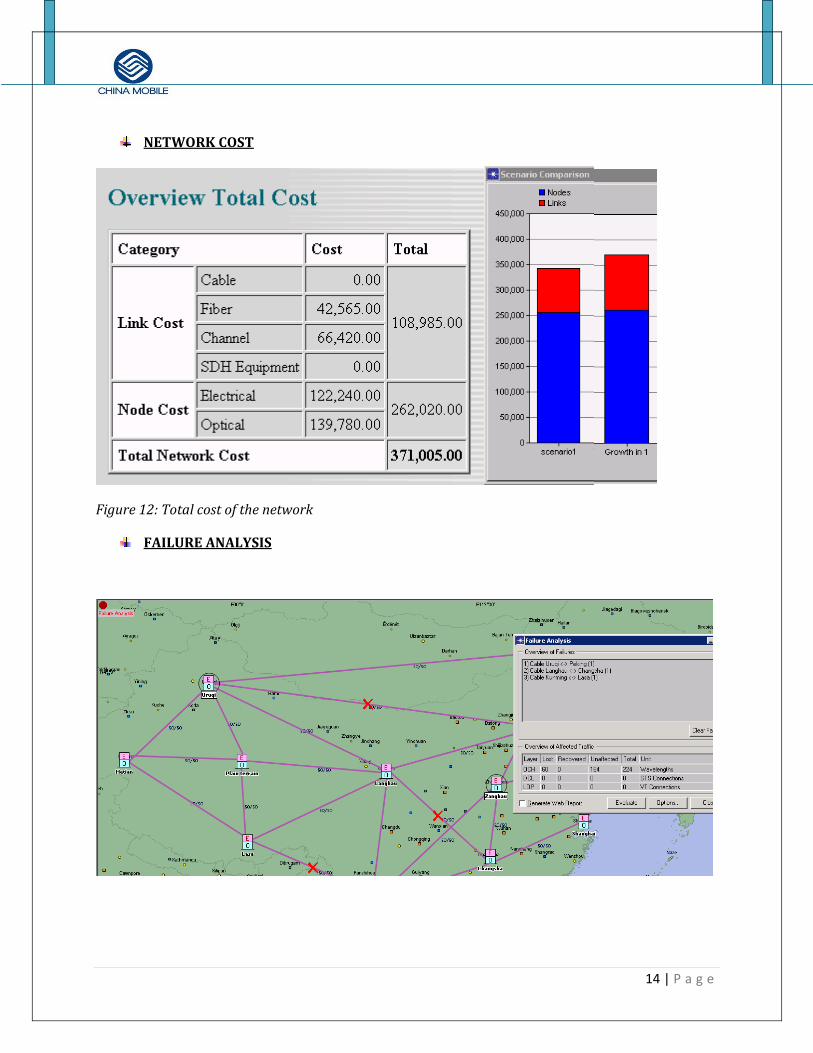
NETWORK COST
Figure 12: Total cost of the network
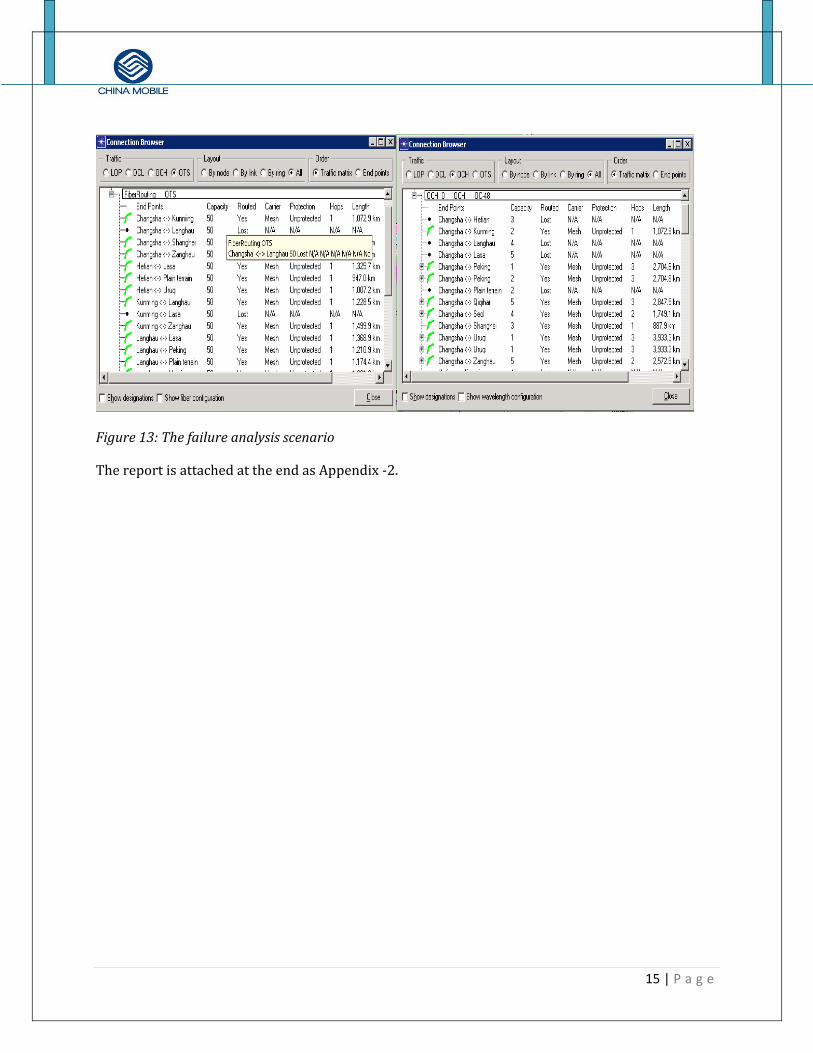
FAILURE ANALYSIS
15 | P a g e
Figure 13: The failure analysis scenario
The report is attached at the end as Appendix ‐2.
16 | P a g e
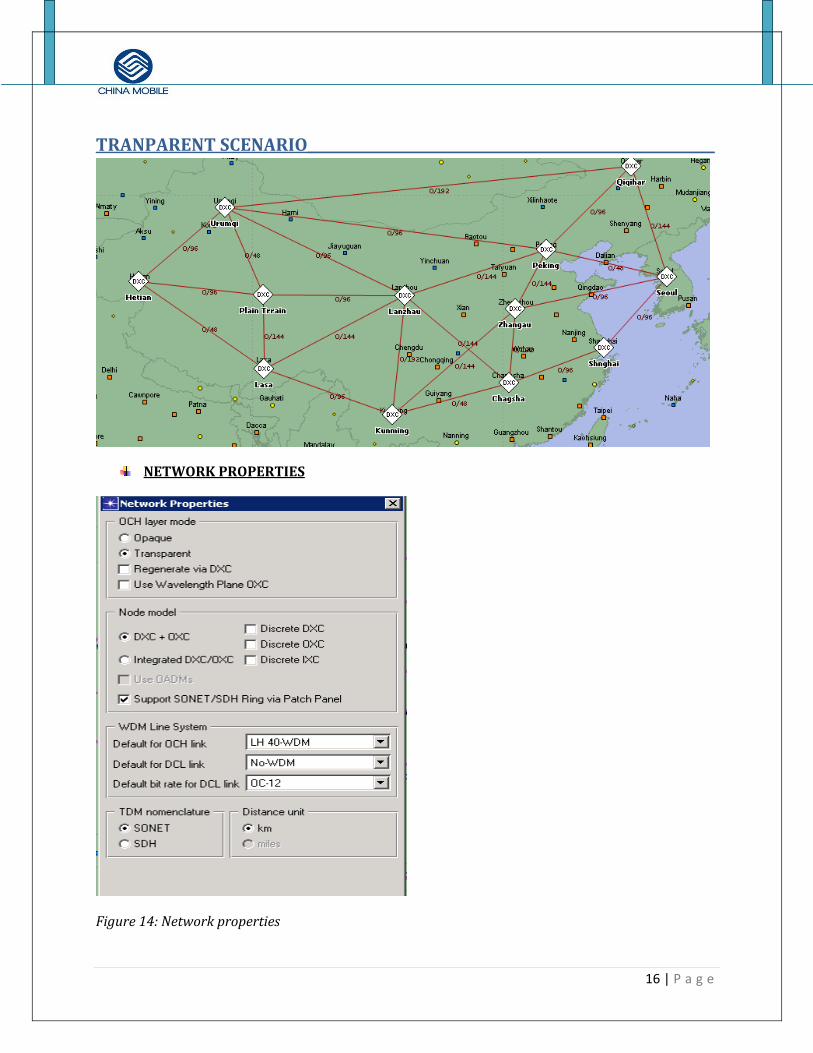
TRANPARENT SCENARIO___________________________________________________________
NETWORK PROPERTIES
Figure 14: Network properties
17 | P a g e
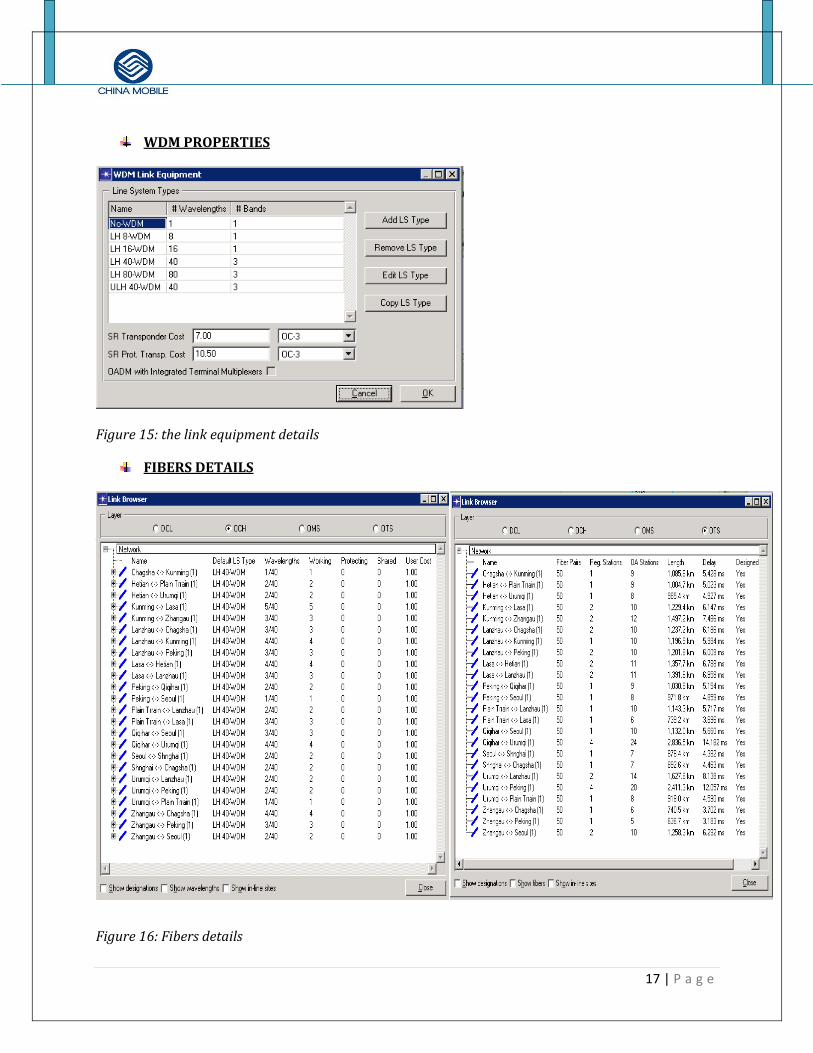
WDM PROPERTIES
Figure 15: the link equipment details
FIBERS DETAILS
INITIAL SCENARIO
Figure 16: Fibers details
18 | P a g e
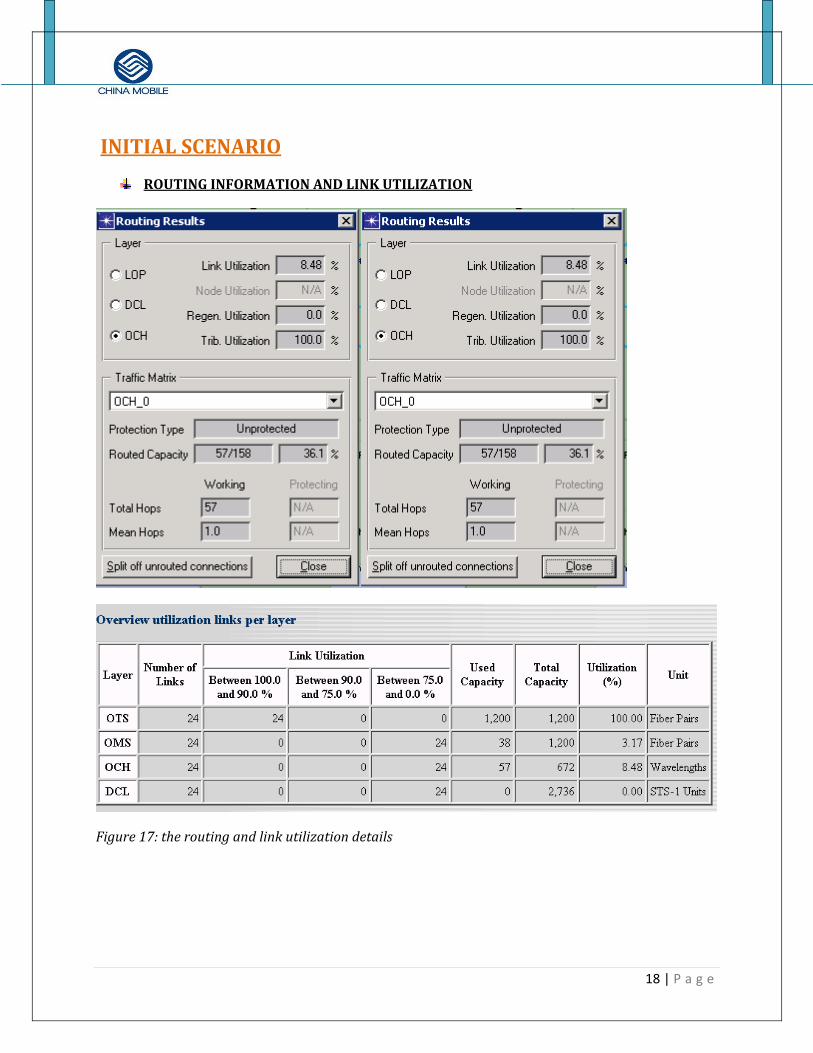
INITIAL SCENARIO ROUTING INFORMATION AND LINK UTILIZATION
Figure 17: the routing and link utilization details
19 | P a g e
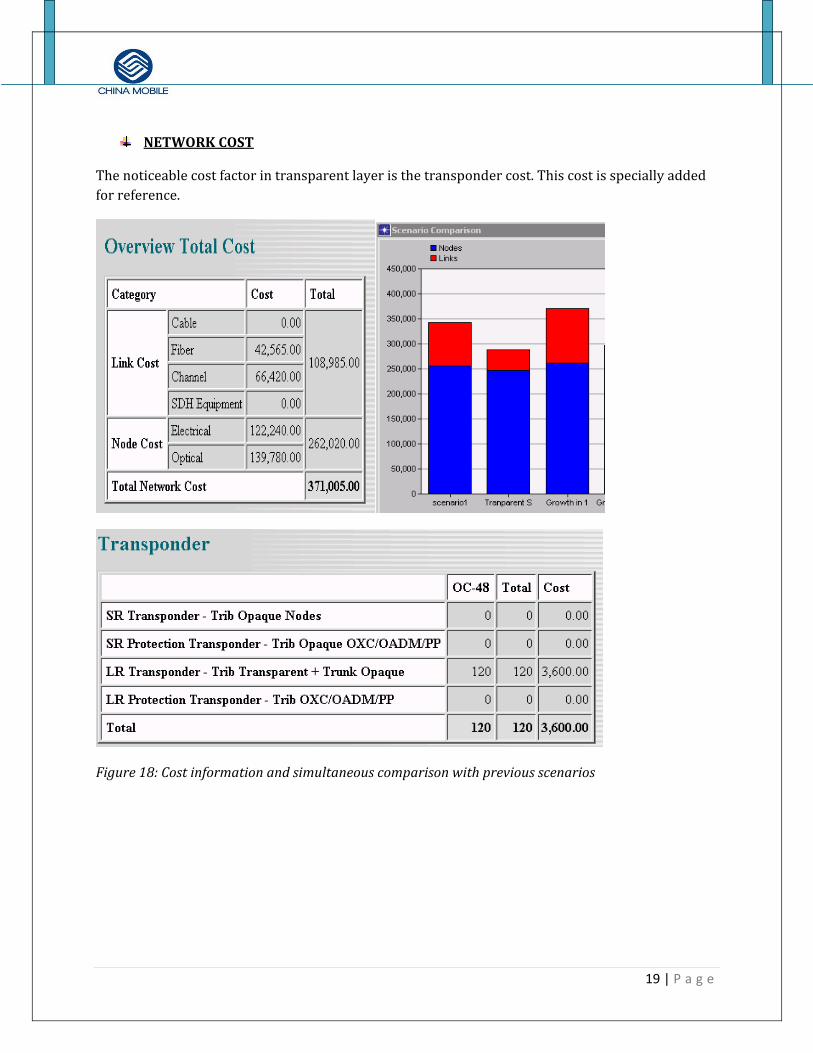
NETWORK COST
The noticeable cost factor in transparent layer is the transponder cost. This cost is specially added for reference.
Figure 18: Cost information and simultaneous comparison with previous scenarios
20 | P a g e
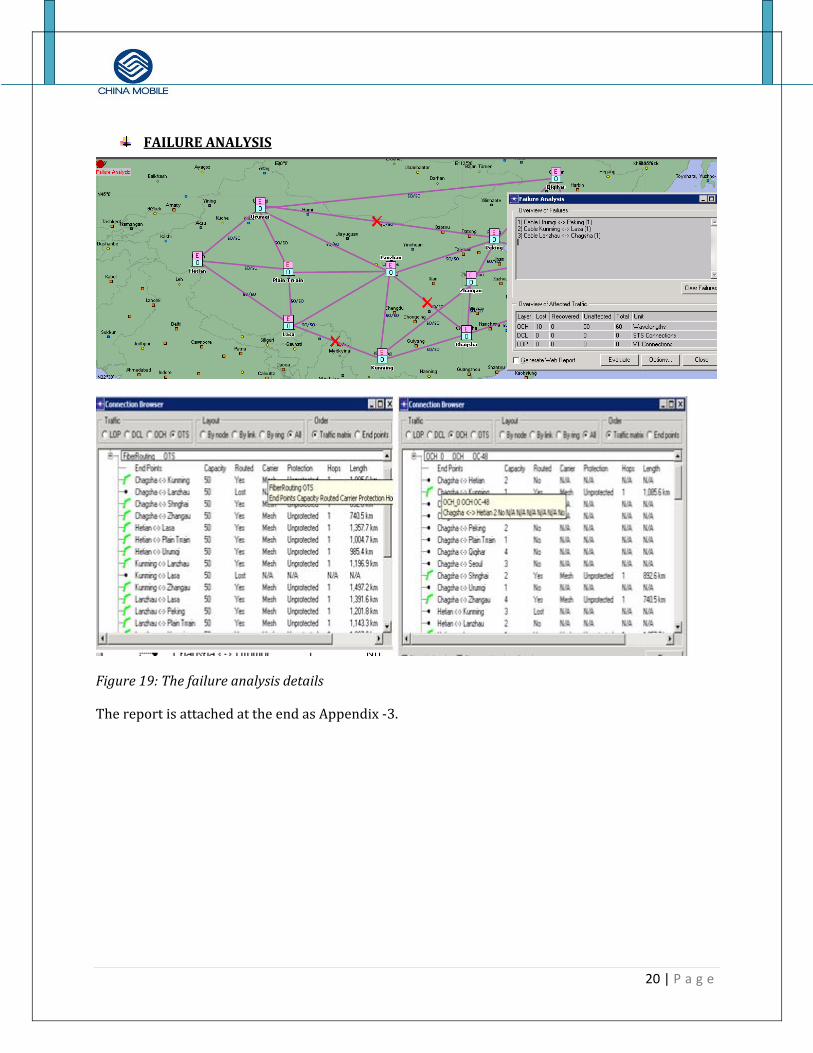
FAILURE ANALYSIS
Figure 19: The failure analysis details
The report is attached at the end as Appendix ‐3.
21 | P a g e
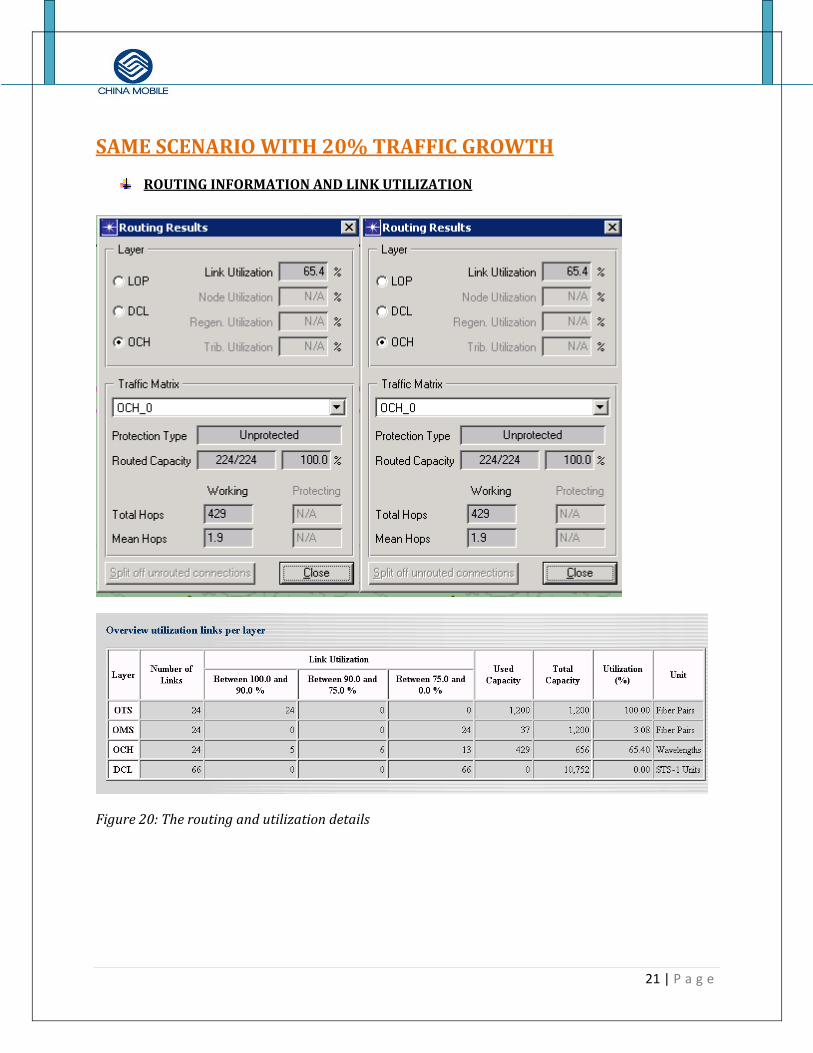
SAME SCENARIO WITH 20% TRAFFIC GROWTH
ROUTING INFORMATION AND LINK UTILIZATION
Figure 20: The routing and utilization details
22 | P a g e
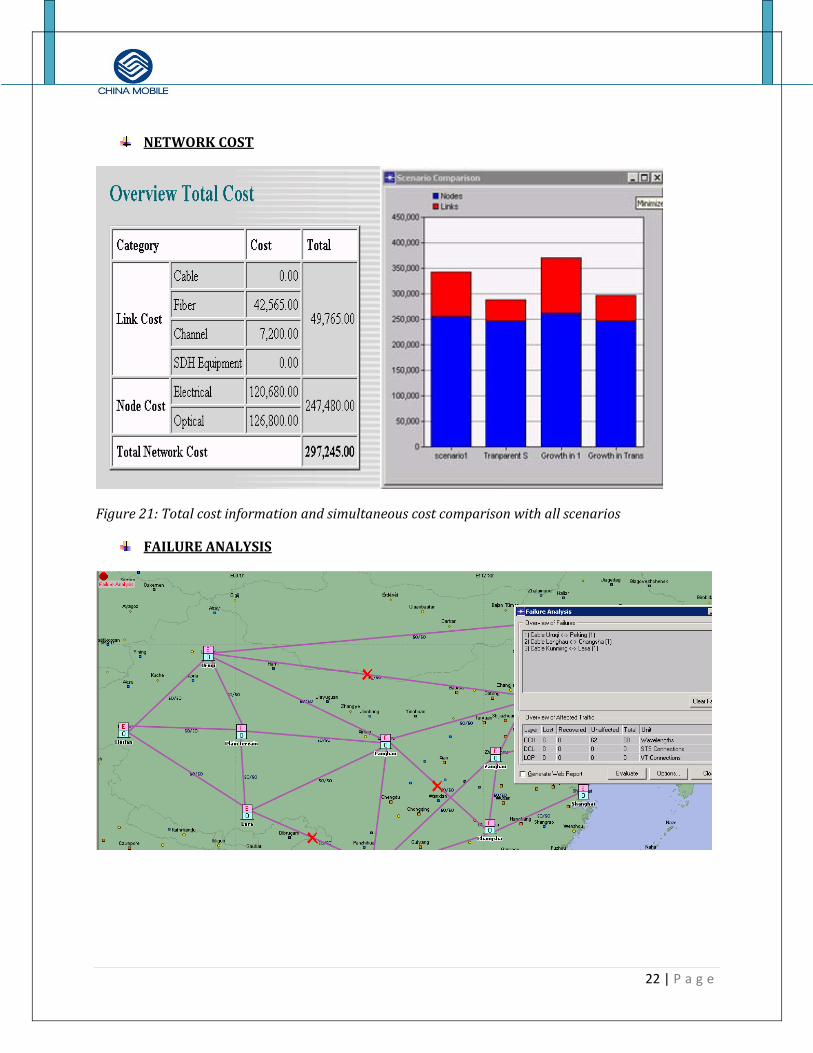
NETWORK COST
Figure 21: Total cost information and simultaneous cost comparison with all scenarios
FAILURE ANALYSIS

23 | P a g e
Figure 22: The failure analysis details
The report is attached at the end as Appendix ‐4.
24 | P a g e
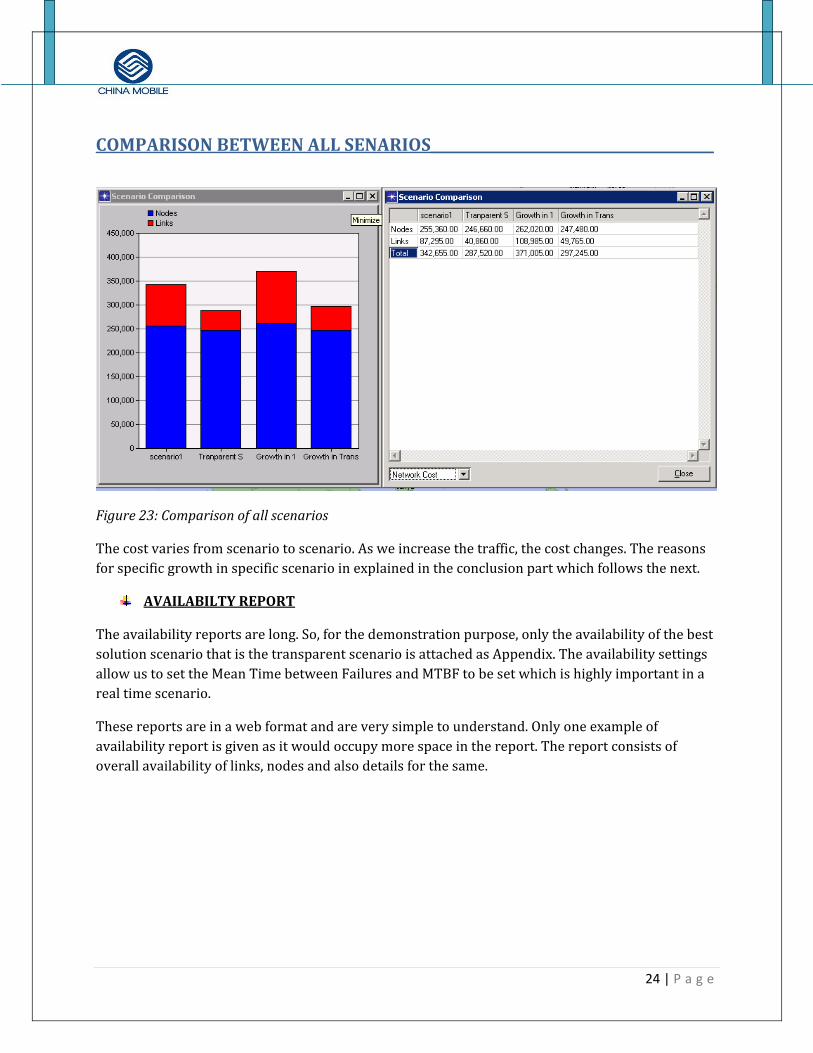
COMPARISON BETWEEN ALL SENARIOS_________________________________________
Figure 23: Comparison of all scenarios
The cost varies from scenario to scenario. As we increase the traffic, the cost changes. The reasons for specific growth in specific scenario in explained in the conclusion part which follows the next.
AVAILABILTY REPORT
The availability reports are long. So, for the demonstration purpose, only the availability of the best solution scenario that is the transparent scenario is attached as Appendix. The availability settings allow us to set the Mean Time between Failures and MTBF to be set which is highly important in a real time scenario.
These reports are in a web format and are very simple to understand. Only one example of availability report is given as it would occupy more space in the report. The report consists of overall availability of links, nodes and also details for the same.
25 | P a g e
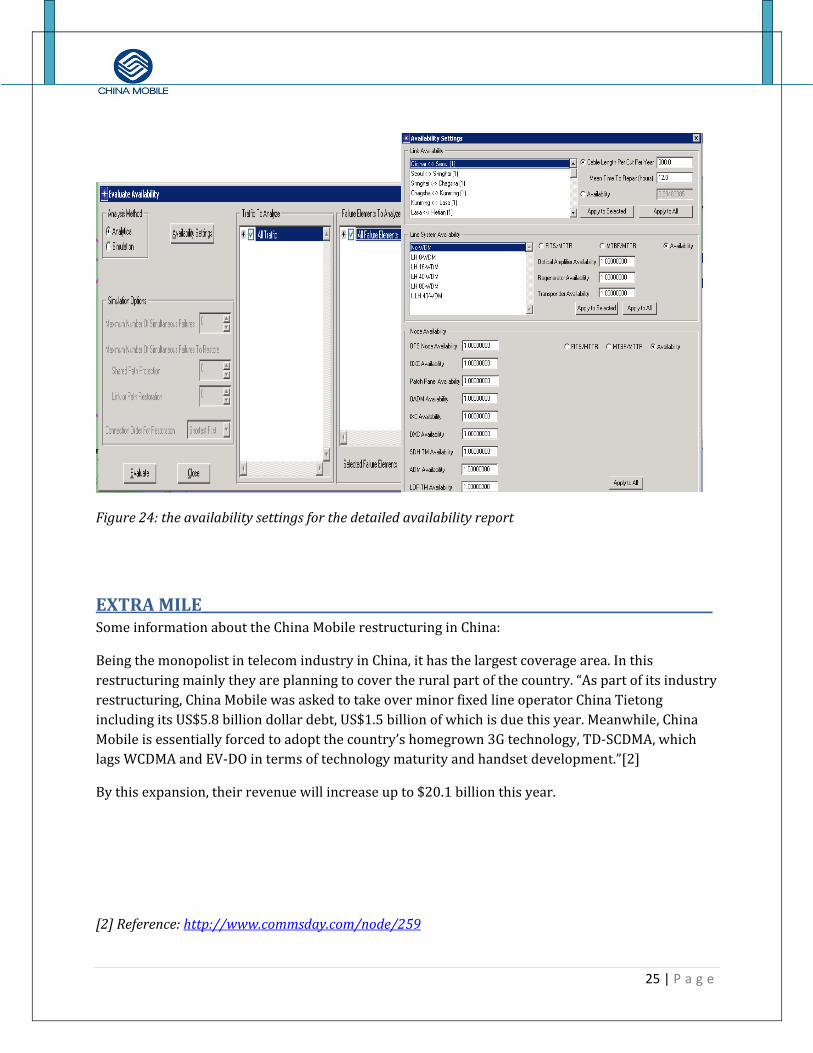
Figure 24: the availability settings for the detailed availability report
EXTRA MILE__________________________________________________________________________ Some information about the China Mobile restructuring in China:
Being the monopolist in telecom industry in China, it has the largest coverage area. In this restructuring mainly they are planning to cover the rural part of the country. “As part of its industry restructuring, China Mobile was asked to take over minor fixed line operator China Tietong including its US$5.8 billion dollar debt, US$1.5 billion of which is due this year. Meanwhile, China Mobile is essentially forced to adopt the country’s homegrown 3G technology, TD‐SCDMA, which lags WCDMA and EV‐DO in terms of technology maturity and handset development.”[2]
By this expansion, their revenue will increase up to $20.1 billion this year.
[2] Reference: http://www.commsday.com/node/259
26 | P a g e
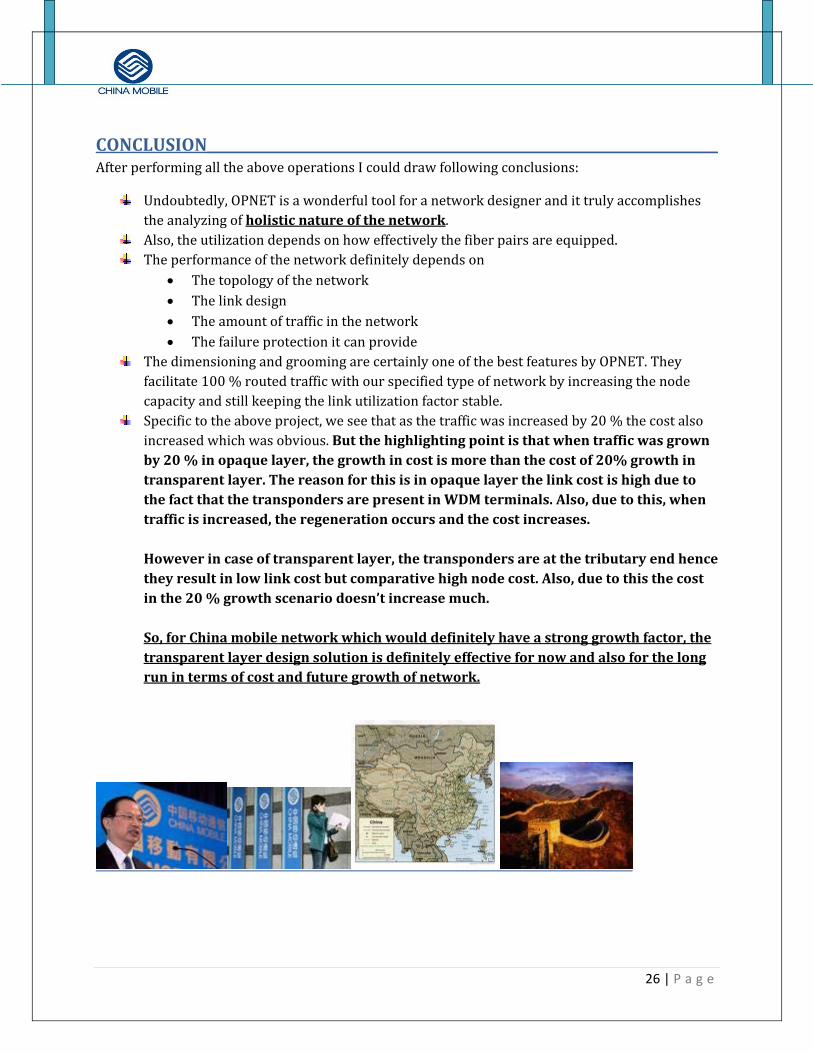
CONCLUSION__________________________________________________________________________ After performing all the above operations I could draw following conclusions:
Undoubtedly, OPNET is a wonderful tool for a network designer and it truly accomplishes the analyzing of holistic nature of the network.
Also, the utilization depends on how effectively the fiber pairs are equipped. The performance of the network definitely depends on
• The topology of the network • The link design • The amount of traffic in the network • The failure protection it can provide
The dimensioning and grooming are certainly one of the best features by OPNET. They facilitate 100 % routed traffic with our specified type of network by increasing the node capacity and still keeping the link utilization factor stable.
Specific to the above project, we see that as the traffic was increased by 20 % the cost also increased which was obvious. But the highlighting point is that when traffic was grown by 20 % in opaque layer, the growth in cost is more than the cost of 20% growth in transparent layer. The reason for this is in opaque layer the link cost is high due to the fact that the transponders are present in WDM terminals. Also, due to this, when traffic is increased, the regeneration occurs and the cost increases. However in case of transparent layer, the transponders are at the tributary end hence they result in low link cost but comparative high node cost. Also, due to this the cost in the 20 % growth scenario doesn’t increase much. So, for China mobile network which would definitely have a strong growth factor, the transparent layer design solution is definitely effective for now and also for the long run in terms of cost and future growth of network.