Embed Size (px)
Citation preview
事業概要 Overview鉄道事業 Railway Business関連事業 Affiliated Businesses財務・経営 Financial and Managerial Data沿革 History
2.96(32.2%)
4.42(48.2%)
1.79(19.6%)
0.47(8.4%)
4.49(79.4%)
0.69(12.2%)
5.09(55.5%)
3.11(33.9%)
0.97(10.6%)
名古屋NAGOYA
東京TOKYO
JR北海道Hokkaido
Railway Company(JR Hokkaido)
JR九州Kyushu
Railway Company(JR Kyushu)
JR東日本East JapanRailway Company(JR East)
東海道新幹線Tokaido Shinkansen新幹線Shinkansen
JR東海 Central Japan
Railway Company(JR Central)
JR四国ShikokuRailway Company(JR Shikoku)
JR西日本West JapanRailway Company(JR West)
京都KYOTO名古屋
NAGOYA東京TOKYO
新大阪SHIN-OSAKA
(兆円 ¥ trillion)
昭和62(1987)年4月April 1987簿価(国鉄)
Book price
平成3(1991)年10月Oct 1991再々評価
(収益調整前)Revised valuation
再々評価(収益調整後)
Transfer price
5.65
9.17
東海道Tokaido
東北・上越Tohoku, Joetsu
山陽Sanyo
JR東海JR Central
JR東日本JR East
JR西日本JR West
2.96(32.2%)
4.42(48.2%)
1.79(19.6%)
0.47(8.4%)
4.49(79.4%)
0.69(12.2%)
9.17 5.09(55.5%)
3.11(33.9%)
0.97(10.6%)
東海道Tokaido
東北・上越Tohoku, Joetsu
山陽Sanyo
注 1.本州旅客3社のバス事業は、昭和63(1988)年4月に分離され、当該旅客会社の100%出資子会社となりました。2.新幹線鉄道保有機構は、平成3(1991)年10月に鉄道整備基金に承継されました。その後、運輸施設整備事業団を経て、平成15(2003)年10月に独立行政法人鉄道建設・運輸施設整備支援機構に承継されました。3.鉄道通信株式会社は、平成元(1989)年5月に(旧)日本テレコム株式会社と合併し、商号を日本テレコム株式会社に変更し、さらに平成18(2006)年10月にソフトバンクテレコム株式会社に変更しました。ソフトバンクテレコム株式会社は、平成27(2015)年4月にソフトバンクモバイ ル株式会社に吸収合併されました。4.日本国有鉄道清算事業団は、平成10(1998)年10月に解散し、日本鉄道建設公団に承継されました。日本鉄道建設公団と運輸施設整備事業団は平成15(2003)年10月に独立行政法人鉄道建設・運輸施設整備支援機構に承継されました。
Notes: 1.The bus operations of three JR companies on Honshu (JR Central, JR East, and JR West) were split off as wholly owned subsidiaries in April 1988.
2.The Shinkansen Holding Corporation was succeeded by the Railway Development Fund in October 1991. The Railway Development Fund was succeeded by the Corporation for Advanced Transport and Technology (CATT), and the CATT was succeeded by The Japan Railway Construction, Transport and Technology Agency (JRTT) in October 2003.
3.The Railway Telecommunication Company merged with former Japan Telecom in May 1989. The new company retained the name Japan Telecom Co., Ltd., and the company changed the name to Softbank Telecom Corp. in October 2006. Softbank Telecom Corp. was taken over by Softbank Mobile Corp. in April 2015.
4.The Japanese National Railway Settlement Corporation was succeeded in October 1998 by the Japanese Railway Construction Public Corporation (JRCC). The JRTT was established in October 2003 as a result of the merger of the JRCC and the CATT.
(April1, 1987)
日本国有鉄道 Japanese National Railways(JNR)
新幹線鉄道保有機構 ※2Shinkansen Holding Corporation 2職員数(人) 64 employees
日本貨物鉄道株式会社Japan Freight Railway Company従業員数(人) 12,005 employees
鉄道通信株式会社 ※3Railway Telecommunication Company 3従業員数(人) 563 employees
鉄道情報システム株式会社Railway Information Systems Company従業員数(人) 280 employees
財団法人鉄道総合技術研究所Railway Technical Research Institute職員数(人) 545 employees
日本国有鉄道清算事業団 ※4Japanese National Railways Settlement Corporation 4
旅客会社 全国6社6 Passenger Railway Companies
東海旅客鉄道株式会社Central Japan Railway Company北海道旅客鉄道株式会社Hokkaido Railway Company
東日本旅客鉄道株式会社East Japan Railway Company
西日本旅客鉄道株式会社West Japan Railway Company
四国旅客鉄道株式会社Shikoku Railway Company
九州旅客鉄道株式会社Kyushu Railway Company
営業キロkm
バス会社Bus Companies
原則として新会社発足後分離独立 ※1Split off following establishment of new companies 1
旅客PassengerTransportation
貨物Freight
通信Telecommunication
研究Research
システムInformation Systems
従業員数(人)employees
2,00321,410
3,176
7,657
5,325
880
2,406
12,719
82,469
51,538
4,455
14,589
国鉄の分割・民営化の概要 Outline of the Breakup and Privatization of JNR新幹線資産・債務の配分 Valuation of Shinkansen Assets
旅客会社6社の営業エリア Operating Areas of Six Passenger Railway Companies
国鉄改革 Restructuring of Japanese National Railways (JNR)
23
見通し等に関する注意事項“ファクトシート 2019”に記載されている将来の計画や見込み数値等は、当社が現在入手可能な情報に基づく見通しであり、リスクや不確実性を含んでいます。潜在的なリスクや不確実性の例としては、経済動向や事業環境、消費動向、当社および子会社における他社との競合状況、法律や規制等の変更などが挙げられます。このファクトシートは、原則として令和元(2019)年5月末時点の情報に基づき、作成されています。注 1.金額は単位未満を切り捨て、その他の数値は単位未満を四捨五入して表示しています。 2.FY2018は2018年度を表します。
Forward-Looking StatementsForward-looking statements and forecasts, etc. contained in the fact sheets are future prospects based on information available at the time of preparation of this document and include risks and uncertainties. Examples of latent risks and uncertainties include; economic conditions, business environment, consumer trends, status of competition between the Company and its subsidiaries and other firms. Changes to laws and regulations, etc., may also be cited.This fact sheet is compiled based on information available as of the end of May 2019, in principle.Note: 1.Figures of financial information are truncated, while statistical data and all percentages are rounded. 2.FY2018 refers to the one-year period ending March 31, 2019.
ファクトシート
事業概要 Overview 鉄道事業 Railway Business 関連事業 Affiliated Businesses 財務・経営 Financial and Managerial Data 沿革 History
猪谷Inotani
塩尻Shiojiri
辰野Tatsuno
甲府Kofu 東京
Tokyo
品川Shinagawa
新横浜Shin-Yokohama
国府津Kozu
熱海Atami沼津
Numazu
富士Fuji
静岡Shizuoka
豊橋Toyohashi
大府Obu
名古屋Nagoya
多治見Tajimi
美濃太田Mino-Ota
岐阜Gifu
美濃赤坂Mino-Akasaka
大垣Ogaki
米原Maibara
京都Kyoto
新大阪Shin-Osaka
伊勢奥津Ise-Okitsu
亀山Kameyama
松阪Matsusaka
鳥羽Toba
新宮Shingu
多気Taki
武豊Taketoyo
参宮線Sangu Line
東海道本線Tokaido Line
東海道新幹線Tokaido Shinkansen
名松線Meisho Line
御殿場線Gotemba Line
関西本線Kansai Line
紀勢本線Kisei Line
中央本線Chuo Line
高山本線Takayama Line
身延線Minobu Line
飯田線Iida Line
太多線Taita Line
武豊線Taketoyo Line
(平成30(2018)年1月1日 As of January 1, 2018)
100
日本全体 Japan (As a whole)
当社マーケットエリア JR Central’s Market Area
23.7%
60.6%
0 50 100(%)
0 200
65.5%
その他 other
当社マーケットエリア JR Central’s Market Area
人口 Population(平成30(2018)年1月1日 As of January 1, 2018)
面積 Area(平成30(2018)年10月 As of October 2018)
県別総生産 Prefectural GDP (名目GDP Nominal GDP)(平成28(2016)年3月期 FY2015)
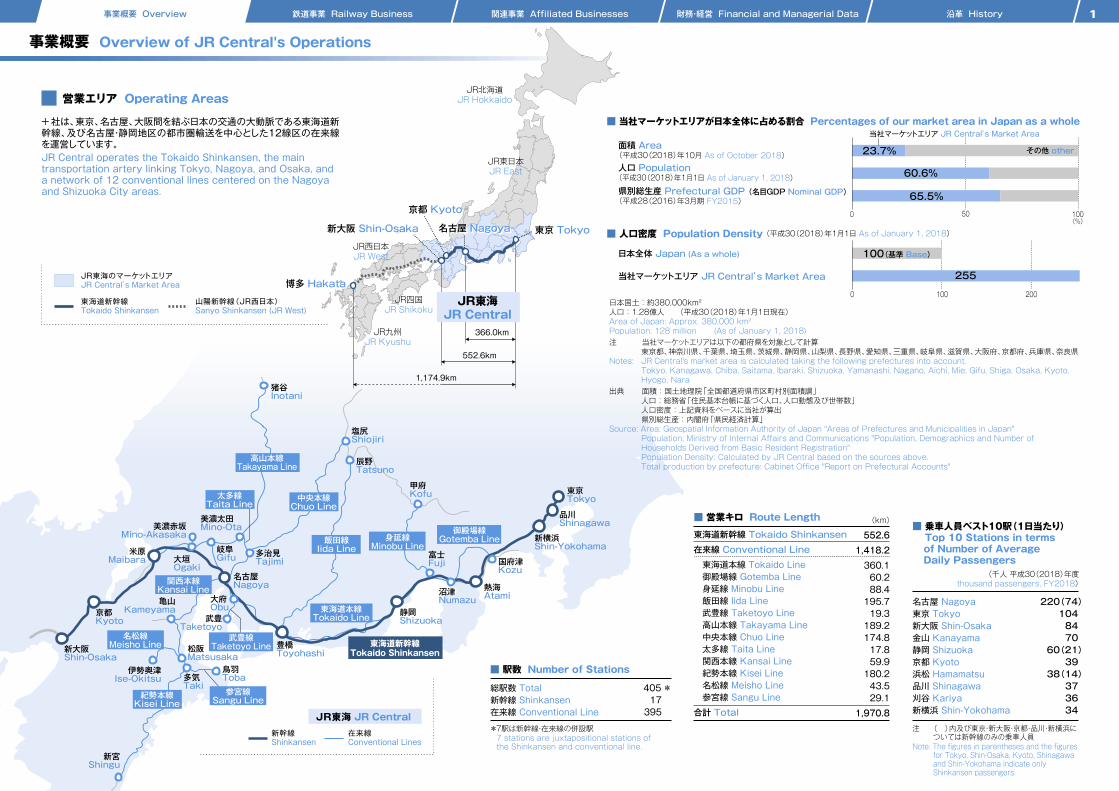
255
100(基準 Base)
京都 Kyoto
名古屋 Nagoya新大阪 Shin-Osaka
博多 Hakata
京都 Kyoto
名古屋 Nagoya 東京 Tokyo新大阪 Shin-Osaka
JR九州JR Kyushu
博多 Hakata
JR西日本JR West
JR東日本JR East
JR北海道JR Hokkaido
JR四国JR Shikoku
JR東海のマーケットエリアJR Central’s Market Area
東海道新幹線Tokaido Shinkansen
山陽新幹線(JR西日本)Sanyo Shinkansen (JR West)
366.0km
552.6km
1,174.9km
JR東海JR Central
JR東海 JR Central新幹線Shinkansen
在来線Conventional Lines
事業概要 Overview of JR Central's Operations
営業エリア Operating Areas
当社は、東京、名古屋、大阪間を結ぶ日本の交通の大動脈である東海道新幹線、及び名古屋・静岡地区の都市圏輸送を中心とした12線区の在来線を運営しています。JR Central operates the Tokaido Shinkansen, the main transportation artery linking Tokyo, Nagoya, and Osaka, and a network of 12 conventional lines centered on the Nagoya and Shizuoka City areas.
■ 人口密度 Population Density
■ 当社マーケットエリアが日本全体に占める割合 Percentages of our market area in Japan as a whole
日本国土:約380,000km²人口:1.28億人 (平成30(2018)年1月1日現在)Area of Japan: Approx. 380,000 km²Population: 128 million (As of January 1, 2018) 注 当社マーケットエリアは以下の都府県を対象として計算
東京都、神奈川県、千葉県、埼玉県、茨城県、静岡県、山梨県、長野県、愛知県、三重県、岐阜県、滋賀県、大阪府、京都府、兵庫県、奈良県Notes: JR Central's market area is calculated taking the following prefectures into account.
Tokyo, Kanagawa, Chiba, Saitama, Ibaraki, Shizuoka, Yamanashi, Nagano, Aichi, Mie, Gifu, Shiga, Osaka, Kyoto, Hyogo, Nara
出典 面積:国土地理院「全国都道府県市区町村別面積調」人口:総務省「住民基本台帳に基づく人口、人口動態及び世帯数」人口密度:上記資料をベースに当社が算出県別総生産:内閣府「県民経済計算」
Source: Area: Geospatial Information Authority of Japan "Areas of Prefectures and Municipalities in Japan"Population: Ministry of Internal Affairs and Communications "Population, Demographics and Number of Households Derived from Basic Resident Registration"Population Density: Calculated by JR Central based on the sources above.Total production by prefecture: Cabinet Office "Report on Prefectural Accounts"
*7駅は新幹線・在来線の併設駅7 stations are juxtapositional stations ofthe Shinkansen and conventional line.
東海道新幹線 Tokaido Shinkansen在来線 Conventional Line 東海道本線 Tokaido Line 御殿場線 Gotemba Line 身延線 Minobu Line 飯田線 Iida Line 武豊線 Taketoyo Line 高山本線 Takayama Line 中央本線 Chuo Line 太多線 Taita Line 関西本線 Kansai Line 紀勢本線 Kisei Line 名松線 Meisho Line 参宮線 Sangu Line
合計 Total
552.61,418.2360.160.288.4195.719.3189.2174.817.859.9180.243.529.1
1,970.8
■ 営業キロ Route Length
総駅数 Total新幹線 Shinkansen在来線 Conventional Line
405 *17 395
■ 駅数 Number of Stations
名古屋 Nagoya東京 Tokyo新大阪 Shin-Osaka金山 Kanayama静岡 Shizuoka京都 Kyoto浜松 Hamamatsu品川 Shinagawa刈谷 Kariya新横浜 Shin-Yokohama
220(74)1048470
60(21)39
38(14)373634
■ 乗車人員ベスト10駅(1日当たり) Top 10 Stations in terms of Number of Average Daily Passengers
(千人 平成30(2018)年度 thousand passengers, FY2018)
(km)
注 ( )内及び東京・新大阪・京都・品川・新横浜については新幹線のみの乗車人員
Note: The figures in parentheses and the figures for Tokyo, Shin-Osaka, Kyoto, Shinagawa and Shin-Yokohama indicate only Shinkansen passengers.
1
2
事業の内容 Summary of JR Central's Business
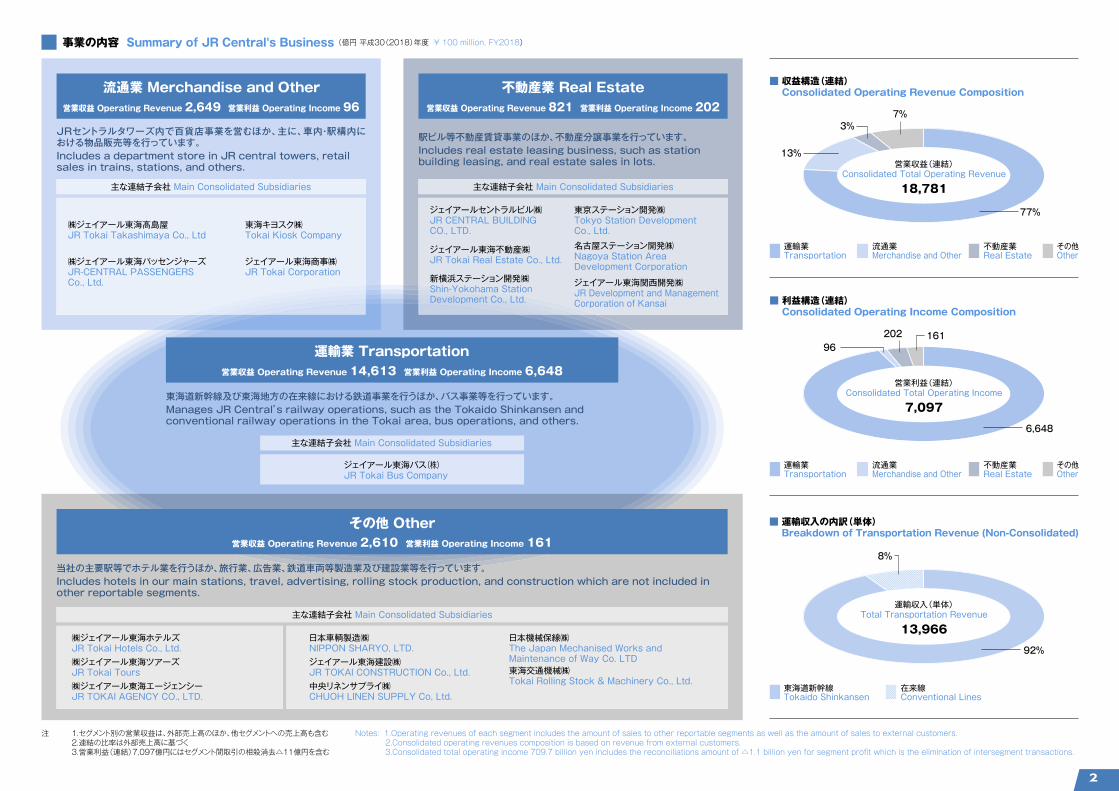
東海道新幹線及び東海地方の在来線における鉄道事業を行うほか、バス事業等を行っています。Manages JR Central’s railway operations, such as the Tokaido Shinkansen and conventional railway operations in the Tokai area, bus operations, and others.
JRセントラルタワーズ内で百貨店事業を営むほか、主に、車内・駅構内における物品販売等を行っています。Includes a department store in JR central towers, retail sales in trains, stations, and others.
駅ビル等不動産賃貸事業のほか、不動産分譲事業を行っています。Includes real estate leasing business, such as station building leasing, and real estate sales in lots.
当社の主要駅等でホテル業を行うほか、旅行業、広告業、鉄道車両等製造業及び建設業等を行っています。Includes hotels in our main stations, travel, advertising, rolling stock production, and construction which are not included in other reportable segments.
運輸業 Transportation
運輸業Transportation
東海道新幹線Tokaido Shinkansen
在来線Conventional Lines
13%
3%7%
8%
92%
77%
(億円 平成30(2018)年度 ¥ 100 million, FY2018)
流通業 Merchandise and Other
流通業Merchandise and Other
不動産業 Real Estate
不動産業Real Estate
その他 Other
その他Other
運輸業Transportation
流通業Merchandise and Other
不動産業Real Estate
その他Other
■ 収益構造(連結) Consolidated Operating Revenue Composition
■ 運輸収入の内訳(単体) Breakdown of Transportation Revenue (Non-Consolidated)
注 1.セグメント別の営業収益は、外部売上高のほか、他セグメントへの売上高も含む2.連結の比率は外部売上高に基づく3.営業利益(連結)7,097億円にはセグメント間取引の相殺消去△11億円を含む
Notes: 1.Operating revenues of each segment includes the amount of sales to other reportable segments as well as the amount of sales to external customers.2.Consolidated operating revenues composition is based on revenue from external customers.3.Consolidated total operating income 709.7 billion yen includes the reconciliations amount of △1.1 billion yen for segment profit which is the elimination of intersegment transactions.
96202 161
6,648
■ 利益構造(連結) Consolidated Operating Income Composition
主な連結子会社 Main Consolidated Subsidiaries 主な連結子会社 Main Consolidated Subsidiaries
主な連結子会社 Main Consolidated Subsidiaries
主な連結子会社 Main Consolidated Subsidiaries
ジェイアール東海バス(株)JR Tokai Bus Company
㈱ジェイアール東海パッセンジャーズJR-CENTRAL PASSENGERS Co., Ltd.
東海キヨスク㈱Tokai Kiosk Company
ジェイアール東海商事㈱JR Tokai Corporation
㈱ジェイアール東海髙島屋JR Tokai Takashimaya Co., Ltd
ジェイアール東海不動産㈱JR Tokai Real Estate Co., Ltd.
ジェイアールセントラルビル㈱JR CENTRAL BUILDING CO., LTD.
東京ステーション開発㈱Tokyo Station Development Co., Ltd.
新横浜ステーション開発㈱Shin-Yokohama Station Development Co., Ltd.
名古屋ステーション開発㈱Nagoya Station Area Development Corporation
ジェイアール東海関西開発㈱JR Development and ManagementCorporation of Kansai
ジェイアール東海建設㈱JR TOKAI CONSTRUCTION Co., Ltd.
日本車輌製造㈱NIPPON SHARYO, LTD.
中央リネンサプライ㈱CHUOH LINEN SUPPLY Co, Ltd.
日本機械保線㈱The Japan Mechanised Works and Maintenance of Way Co. LTD東海交通機械㈱Tokai Rolling Stock & Machinery Co., Ltd.㈱ジェイアール東海エージェンシー
JR TOKAI AGENCY CO., LTD.
㈱ジェイアール東海ホテルズJR Tokai Hotels Co., Ltd.㈱ジェイアール東海ツアーズJR Tokai Tours
18,781
営業収益(連結)Consolidated Total Operating Revenue
13,966
運輸収入(単体)Total Transportation Revenue
7,097
営業利益(連結)Consolidated Total Operating Income
営業収益 Operating Revenue 821 営業利益 Operating Income 202
営業収益 Operating Revenue 14,613 営業利益 Operating Income 6,648
営業収益 Operating Revenue 2,610 営業利益 Operating Income 161
営業収益 Operating Revenue 2,649 営業利益 Operating Income 96
事業概要 Overview 鉄道事業 Railway Business 関連事業 Affiliated Businesses 財務・経営 Financial and Managerial Data 沿革 History
猪谷Inotani
塩尻Shiojiri
辰野Tatsuno
甲府Kofu 東京
Tokyo
品川Shinagawa
新横浜Shin-Yokohama
国府津Kozu
熱海Atami沼津
Numazu
富士Fuji
静岡Shizuoka
豊橋Toyohashi
大府Obu
名古屋Nagoya
多治見Tajimi
美濃太田Mino-Ota
岐阜Gifu
美濃赤坂Mino-Akasaka
大垣Ogaki
米原Maibara
京都Kyoto
新大阪Shin-Osaka
伊勢奥津Ise-Okitsu
亀山Kameyama
松阪Matsusaka
鳥羽Toba
新宮Shingu
多気Taki
武豊Taketoyo
参宮線Sangu Line
東海道本線Tokaido Line
東海道新幹線Tokaido Shinkansen
名松線Meisho Line
御殿場線Gotemba Line
関西本線Kansai Line
紀勢本線Kisei Line
中央本線Chuo Line
高山本線Takayama Line
身延線Minobu Line
飯田線Iida Line
太多線Taita Line
武豊線Taketoyo Line
(平成30(2018)年1月1日 As of January 1, 2018)
100
日本全体 Japan (As a whole)
当社マーケットエリア JR Central’s Market Area
23.7%
60.6%
0 50 100(%)
0 200
65.5%
その他 other
当社マーケットエリア JR Central’s Market Area
人口 Population(平成30(2018)年1月1日 As of January 1, 2018)
面積 Area(平成30(2018)年10月 As of October 2018)
県別総生産 Prefectural GDP (名目GDP Nominal GDP)(平成28(2016)年3月期 FY2015)
255
100(基準 Base)
京都 Kyoto
名古屋 Nagoya新大阪 Shin-Osaka
博多 Hakata
京都 Kyoto
名古屋 Nagoya 東京 Tokyo新大阪 Shin-Osaka
JR九州JR Kyushu
博多 Hakata
JR西日本JR West
JR東日本JR East
JR北海道JR Hokkaido
JR四国JR Shikoku
JR東海のマーケットエリアJR Central’s Market Area
東海道新幹線Tokaido Shinkansen
山陽新幹線(JR西日本)Sanyo Shinkansen (JR West)
366.0km
552.6km
1,174.9km
JR東海JR Central
JR東海 JR Central新幹線Shinkansen
在来線Conventional Lines
事業概要 Overview of JR Central's Operations
営業エリア Operating Areas
当社は、東京、名古屋、大阪間を結ぶ日本の交通の大動脈である東海道新幹線、及び名古屋・静岡地区の都市圏輸送を中心とした12線区の在来線を運営しています。JR Central operates the Tokaido Shinkansen, the main transportation artery linking Tokyo, Nagoya, and Osaka, and a network of 12 conventional lines centered on the Nagoya and Shizuoka City areas.
■ 人口密度 Population Density
■ 当社マーケットエリアが日本全体に占める割合 Percentages of our market area in Japan as a whole
日本国土:約380,000km²人口:1.28億人 (平成30(2018)年1月1日現在)Area of Japan: Approx. 380,000 km²Population: 128 million (As of January 1, 2018) 注 当社マーケットエリアは以下の都府県を対象として計算
東京都、神奈川県、千葉県、埼玉県、茨城県、静岡県、山梨県、長野県、愛知県、三重県、岐阜県、滋賀県、大阪府、京都府、兵庫県、奈良県Notes: JR Central's market area is calculated taking the following prefectures into account.
Tokyo, Kanagawa, Chiba, Saitama, Ibaraki, Shizuoka, Yamanashi, Nagano, Aichi, Mie, Gifu, Shiga, Osaka, Kyoto, Hyogo, Nara
出典 面積:国土地理院「全国都道府県市区町村別面積調」人口:総務省「住民基本台帳に基づく人口、人口動態及び世帯数」人口密度:上記資料をベースに当社が算出県別総生産:内閣府「県民経済計算」
Source: Area: Geospatial Information Authority of Japan "Areas of Prefectures and Municipalities in Japan"Population: Ministry of Internal Affairs and Communications "Population, Demographics and Number of Households Derived from Basic Resident Registration"Population Density: Calculated by JR Central based on the sources above.Total production by prefecture: Cabinet Office "Report on Prefectural Accounts"
*7駅は新幹線・在来線の併設駅7 stations are juxtapositional stations ofthe Shinkansen and conventional line.
東海道新幹線 Tokaido Shinkansen在来線 Conventional Line 東海道本線 Tokaido Line 御殿場線 Gotemba Line 身延線 Minobu Line 飯田線 Iida Line 武豊線 Taketoyo Line 高山本線 Takayama Line 中央本線 Chuo Line 太多線 Taita Line 関西本線 Kansai Line 紀勢本線 Kisei Line 名松線 Meisho Line 参宮線 Sangu Line
合計 Total
552.61,418.2360.160.288.4195.719.3189.2174.817.859.9180.243.529.1
1,970.8
■ 営業キロ Route Length
総駅数 Total新幹線 Shinkansen在来線 Conventional Line
405 *17 395
■ 駅数 Number of Stations
名古屋 Nagoya東京 Tokyo新大阪 Shin-Osaka金山 Kanayama静岡 Shizuoka京都 Kyoto浜松 Hamamatsu品川 Shinagawa刈谷 Kariya新横浜 Shin-Yokohama
220(74)1048470
60(21)39
38(14)373634
■ 乗車人員ベスト10駅(1日当たり) Top 10 Stations in terms of Number of Average Daily Passengers
(千人 平成30(2018)年度 thousand passengers, FY2018)
(km)
注 ( )内及び東京・新大阪・京都・品川・新横浜については新幹線のみの乗車人員
Note: The figures in parentheses and the figures for Tokyo, Shin-Osaka, Kyoto, Shinagawa and Shin-Yokohama indicate only Shinkansen passengers.
1
2
事業の内容 Summary of JR Central's Business
東海道新幹線及び東海地方の在来線における鉄道事業を行うほか、バス事業等を行っています。Manages JR Central’s railway operations, such as the Tokaido Shinkansen and conventional railway operations in the Tokai area, bus operations, and others.
JRセントラルタワーズ内で百貨店事業を営むほか、主に、車内・駅構内における物品販売等を行っています。Includes a department store in JR central towers, retail sales in trains, stations, and others.
駅ビル等不動産賃貸事業のほか、不動産分譲事業を行っています。Includes real estate leasing business, such as station building leasing, and real estate sales in lots.
当社の主要駅等でホテル業を行うほか、旅行業、広告業、鉄道車両等製造業及び建設業等を行っています。Includes hotels in our main stations, travel, advertising, rolling stock production, and construction which are not included in other reportable segments.
運輸業 Transportation
運輸業Transportation
東海道新幹線Tokaido Shinkansen
在来線Conventional Lines
13%
3%7%
8%
92%
77%
(億円 平成30(2018)年度 ¥ 100 million, FY2018)
流通業 Merchandise and Other
流通業Merchandise and Other
不動産業 Real Estate
不動産業Real Estate
その他 Other
その他Other
運輸業Transportation
流通業Merchandise and Other
不動産業Real Estate
その他Other
■ 収益構造(連結) Consolidated Operating Revenue Composition
■ 運輸収入の内訳(単体) Breakdown of Transportation Revenue (Non-Consolidated)
注 1.セグメント別の営業収益は、外部売上高のほか、他セグメントへの売上高も含む2.連結の比率は外部売上高に基づく3.営業利益(連結)7,097億円にはセグメント間取引の相殺消去△11億円を含む
Notes: 1.Operating revenues of each segment includes the amount of sales to other reportable segments as well as the amount of sales to external customers.2.Consolidated operating revenues composition is based on revenue from external customers.3.Consolidated total operating income 709.7 billion yen includes the reconciliations amount of △1.1 billion yen for segment profit which is the elimination of intersegment transactions.
96202 161
6,648
■ 利益構造(連結) Consolidated Operating Income Composition
主な連結子会社 Main Consolidated Subsidiaries 主な連結子会社 Main Consolidated Subsidiaries
主な連結子会社 Main Consolidated Subsidiaries
主な連結子会社 Main Consolidated Subsidiaries
ジェイアール東海バス(株)JR Tokai Bus Company
㈱ジェイアール東海パッセンジャーズJR-CENTRAL PASSENGERS Co., Ltd.
東海キヨスク㈱Tokai Kiosk Company
ジェイアール東海商事㈱JR Tokai Corporation
㈱ジェイアール東海髙島屋JR Tokai Takashimaya Co., Ltd
ジェイアール東海不動産㈱JR Tokai Real Estate Co., Ltd.
ジェイアールセントラルビル㈱JR CENTRAL BUILDING CO., LTD.
東京ステーション開発㈱Tokyo Station Development Co., Ltd.
新横浜ステーション開発㈱Shin-Yokohama Station Development Co., Ltd.
名古屋ステーション開発㈱Nagoya Station Area Development Corporation
ジェイアール東海関西開発㈱JR Development and ManagementCorporation of Kansai
ジェイアール東海建設㈱JR TOKAI CONSTRUCTION Co., Ltd.
日本車輌製造㈱NIPPON SHARYO, LTD.
中央リネンサプライ㈱CHUOH LINEN SUPPLY Co, Ltd.
日本機械保線㈱The Japan Mechanised Works and Maintenance of Way Co. LTD東海交通機械㈱Tokai Rolling Stock & Machinery Co., Ltd.㈱ジェイアール東海エージェンシー
JR TOKAI AGENCY CO., LTD.
㈱ジェイアール東海ホテルズJR Tokai Hotels Co., Ltd.㈱ジェイアール東海ツアーズJR Tokai Tours
18,781
営業収益(連結)Consolidated Total Operating Revenue
13,966
運輸収入(単体)Total Transportation Revenue
7,097
営業利益(連結)Consolidated Total Operating Income
営業収益 Operating Revenue 821 営業利益 Operating Income 202
営業収益 Operating Revenue 14,613 営業利益 Operating Income 6,648
営業収益 Operating Revenue 2,610 営業利益 Operating Income 161
営業収益 Operating Revenue 2,649 営業利益 Operating Income 96
事業概要 Overview 鉄道事業 Railway Business 関連事業 Affiliated Businesses 財務・経営 Financial and Managerial Data 沿革 History
83838383828282828180808080807980
8080787878798081828484878889
6565656566666666666464656593
122130138139148155158158157158189187176165150143
0 5 34 34 35 37 41 45 50 51 61 70 101 145 166 170 175 187 193 188 185 188 194 201 209 217
83
65
220
83
65
226
(本/日 trains/day) (指数 index)
(億人キロ 100 million passenger-kilometers) (兆円 ¥ trillion)
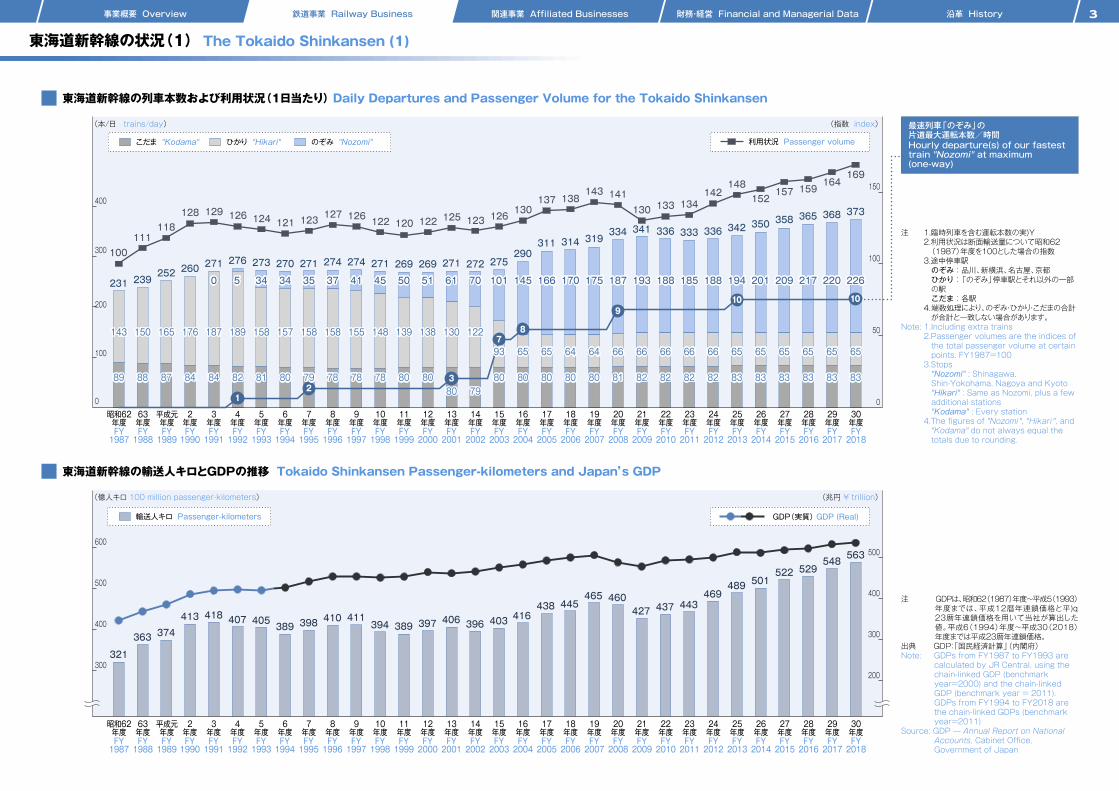
注 GDPは、昭和62(1987)年度~平成5(1993)年度までは、平成12暦年連鎖価格と平成23暦年連鎖価格を用いて当社が算出した値。平成6(1994)年度~平成30(2018)年度までは平成23暦年連鎖価格。
出典 GDP:「国民経済計算」(内閣府)Note: GDPs from FY1987 to FY1993 are
calculated by JR Central, using the chain-linked GDP (benchmark year=2000) and the chain-linked GDP (benchmark year = 2011). GDPs from FY1994 to FY2018 are the chain-linked GDPs (benchmark year=2011)
Source: GDP ̶ Annual Report on National Accounts, Cabinet Office, Government of Japan
200
300
400
500
輸送人キロ Passenger-kilometers
300
400
500
600
200
100
0
300
400
50
0
100
150
GDP(実質) GDP (Real)
321
363 374
413 418 407 405 389 398410 411
394 397389406 396 403
416438
465 460445
427 437 443469
489 501522 529
東海道新幹線の列車本数および利用状況(1日当たり) Daily Departures and Passenger Volume for the Tokaido Shinkansen
東海道新幹線の輸送人キロとGDPの推移 Tokaido Shinkansen Passenger-kilometers and Japan’s GDP
63年度
平成元年度
2年度
3年度
4年度
5年度
6年度
7年度
8年度
9年度
10年度
12年度
11年度
13年度
14年度
15年度
16年度
17年度
18年度
19年度
20年度
21年度
22年度
FY1988
昭和62年度FY1987
FY1989
FY1990
FY1991
FY1992
FY1993
FY1994
FY1995
FY1996
FY1997
FY1998
FY1999
FY2001
FY2000
FY2002
FY2003
FY2004
FY2005
FY2006
FY2007
FY2008
FY2009
FY2010
23年度FY2011
24年度FY2012
25年度FY2013
27年度FY2015
26年度FY2014
28年度FY2016
29年度FY2017
63年度
平成元年度
2年度
3年度
4年度
5年度
6年度
7年度
8年度
9年度
10年度
12年度
11年度
13年度
14年度
15年度
16年度
17年度
18年度
19年度
20年度
21年度
22年度
FY1988
昭和62年度FY1987
FY1989
FY1990
FY1991
FY1992
FY1993
FY1994
FY1995
FY1996
FY1997
FY1998
FY1999
FY2001
FY2000
FY2002
FY2003
FY2004
FY2005
FY2006
FY2007
FY2008
FY2009
FY2010
23年度FY2011
24年度FY2012
25年度FY2013
27年度FY2015
26年度FY2014
28年度FY2016
利用状況 Passenger volume
注 1.臨時列車を含む運転本数の実数2.利用状況は断面輸送量について昭和62(1987)年度を100とした場合の指数3.途中停車駅のぞみ:品川、新横浜、名古屋、京都ひかり:「のぞみ」停車駅とそれ以外の一部の駅こだま:各駅
4.端数処理により、のぞみ・ひかり・こだまの合計が合計と一致しない場合があります。
Note: 1.Including extra trains2.Passenger volumes are the indices of the total passenger volume at certain points. FY1987=100
3.Stops"Nozomi" : Shinagawa, Shin-Yokohama, Nagoya and Kyoto"Hikari" : Same as Nozomi, plus a few additional stations "Kodama" : Every station
4.The figures of "Nozomi", "Hikari", and "Kodama" do not always equal the totals due to rounding.
のぞみ "Nozomi"
最速列車「のぞみ」の片道最大運転本数/時間Hourly departure(s) of our fastest train "Nozomi" at maximum (one-way)
ひかり "Hikari"こだま "Kodama"
231 239
159157152
148142
134133130141143
138137130126123125122120122126127123121124126129128
118111
100
252 260271
0
276
1
5
273
34
270
34
271
2
35
274
37
274
41
271
45
269
50
269
51
271
3
61
272
70
275
7
101
290
8
145
311
166
314
170
319
175
334
9
187
341
193
336
188
333
185
336
188
342
10
194
350
201
358
209
365
217
6565656566666666666464656593
122130138139148155158158157158189187176165150143
83
29年度FY2017
838383828282828180808080807980
8080787878798081828484878889
東海道新幹線の状況(1) The Tokaido Shinkansen (1)
3
164
368
220
65
83
30年度FY2018
169
10
373
226
65
83
548
30年度FY2018
563
4
65
52
11
61
57
5
54
57
15
46
57
21
41
57
27
33
57
36
53
24
45
50
15
57
1
50
6
61
5
61
47
11
61
37
24
61
25
37
61
12
48
61
54
61
60
61
60
60
60
41
60
32
25
60
48
9
60
64
51
80
47
80
6
52
60
16
40
80
13
32
80
19
28
80
25
80
51
21
80
32
73
38
87
22
89
10
14
80
39
6
80
46
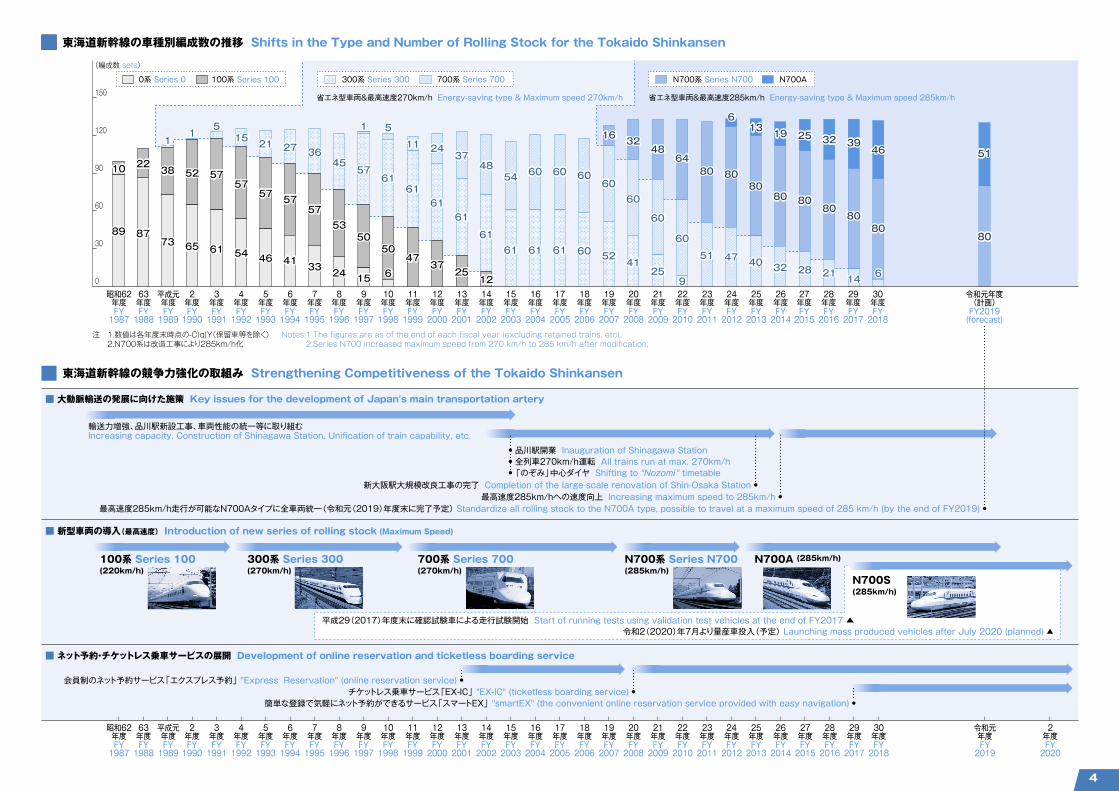
東海道新幹線の競争力強化の取組み Strengthening Competitiveness of the Tokaido Shinkansen
(220km/h) (270km/h) (270km/h) (285km/h)(285km/h)
63年度
平成元年度
2年度
3年度
4年度
5年度
6年度
7年度
8年度
9年度
10年度
12年度
11年度
13年度
14年度
15年度
16年度
17年度
18年度
19年度
20年度
21年度
22年度
FY1988
昭和62年度FY1987
FY1989
FY1990
FY1991
FY1992
FY1993
FY1994
FY1995
FY1996
FY1997
FY1998
FY1999
FY2001
FY2000
FY2002
FY2003
FY2004
FY2005
FY2006
FY2007
FY2008
FY2009
FY2010
23年度FY2011
24年度FY2012
25年度FY2013
27年度FY2015
28年度FY2016
令和元年度(計画)FY2019(forecast)
26年度FY2014
63年度
平成元年度
2年度
3年度
4年度
5年度
6年度
7年度
8年度
9年度
10年度
12年度
11年度
13年度
14年度
15年度
16年度
17年度
18年度
19年度
20年度
21年度
22年度
FY1988
昭和62年度FY1987
FY1989
FY1990
FY1991
FY1992
FY1993
FY1994
FY1995
FY1996
FY1997
FY1998
FY1999
FY2001
FY2000
FY2002
FY2003
FY2004
FY2005
FY2006
FY2007
FY2008
FY2009
FY2010
23年度FY2011
24年度FY2012
25年度FY2013
27年度FY2015
26年度FY2014
28年度FY2016
29年度FY2017
30年度FY2018
令和元年度FY2019
2年度FY2020
■ ネット予約・チケットレス乗車サービスの展開 Development of online reservation and ticketless boarding service
■ 新型車両の導入(最高速度) Introduction of new series of rolling stock (Maximum Speed)
■ 大動脈輸送の発展に向けた施策 Key issues for the development of Japan's main transportation artery
最高速度285km/h走行が可能なN700Aタイプに全車両統一(令和元(2019)年度末に完了予定) Standardize all rolling stock to the N700A type, possible to travel at a maximum speed of 285 km/h (by the end of FY2019) ●最高速度285km/hへの速度向上 Increasing maximum speed to 285km/h ●
新大阪駅大規模改良工事の完了 Completion of the large-scale renovation of Shin-Osaka Station ●
令和2(2020)年7月より量産車投入(予定) Launching mass produced vehicles after July 2020 (planned) ▲平成29(2017)年度末に確認試験車による走行試験開始 Start of running tests using validation test vehicles at the end of FY2017 ▲
簡単な登録で気軽にネット予約ができるサービス「スマートEX」 "smartEX" (the convenient online reservation service provided with easy navigation) ●
● 品川駅開業 Inauguration of Shinagawa Station● 全列車270km/h運転 All trains run at max. 270km/h● 「のぞみ」中心ダイヤ Shifting to "Nozomi" timetable
輸送力増強、品川駅新設工事、車両性能の統一等に取り組むIncreasing capacity, Construction of Shinagawa Station, Unification of train capability, etc.
会員制のネット予約サービス「エクスプレス予約」 "Express Reservation" (online reservation service) ●チケットレス乗車サービス「EX-IC」 "EX-IC" (ticketless boarding service) ●
100系 Series 100 300系 Series 300 700系 Series 700 N700系 Series N700 N700A
(285km/h)N700S
0
120
150
60
90
30 65
52
11
73
38
87
22
89
10
61
57
5
54
57
15
46
57
21
41
57
27
33
57
36
53
24
45
50
15
57
1
50
6
61
5
61
47
11
61
37
24
61
25
37
61
12
48
61
54
61
60
61
60
60
60
41
60
32
25
60
48
52
60
16
9
60
64
51
80
47
80
6
40
80
13
32
80
19
28
80
25
21
80
32
29年度FY2017
80
51
0系 Series 0 100系 Series 100
省エネ型車両&最高速度270km/h Energy-saving type & Maximum speed 270km/h 省エネ型車両&最高速度285km/h Energy-saving type & Maximum speed 285km/h
300系 Series 300 N700系 Series N700 N700A700系 Series 700
(編成数 sets)
注 1.数値は各年度末時点の編成数(保留車等を除く)2.N700系は改造工事により285km/h化
Notes:1.The figures are as of the end of each fiscal year (excluding retained trains, etc).2.Series N700 increased maximum speed from 270 km/h to 285 km/h after modification.
東海道新幹線の車種別編成数の推移 Shifts in the Type and Number of Rolling Stock for the Tokaido Shinkansen
14
80
39
30年度FY2018
6
80
46
事業概要 Overview 鉄道事業 Railway Business 関連事業 Affiliated Businesses 財務・経営 Financial and Managerial Data 沿革 History
83838383828282828180808080807980
8080787878798081828484878889
6565656566666666666464656593
122130138139148155158158157158189187176165150143
0 5 34 34 35 37 41 45 50 51 61 70 101 145 166 170 175 187 193 188 185 188 194 201 209 217
83
65
220
83
65
226
(本/日 trains/day) (指数 index)
(億人キロ 100 million passenger-kilometers) (兆円 ¥ trillion)
注 GDPは、昭和62(1987)年度~平成5(1993)年度までは、平成12暦年連鎖価格と平成23暦年連鎖価格を用いて当社が算出した値。平成6(1994)年度~平成30(2018)年度までは平成23暦年連鎖価格。
出典 GDP:「国民経済計算」(内閣府)Note: GDPs from FY1987 to FY1993 are
calculated by JR Central, using the chain-linked GDP (benchmark year=2000) and the chain-linked GDP (benchmark year = 2011). GDPs from FY1994 to FY2018 are the chain-linked GDPs (benchmark year=2011)
Source: GDP ̶ Annual Report on National Accounts, Cabinet Office, Government of Japan
200
300
400
500
輸送人キロ Passenger-kilometers
300
400
500
600
200
100
0
300
400
50
0
100
150
GDP(実質) GDP (Real)
321
363 374
413 418 407 405 389 398410 411
394 397389406 396 403
416438
465 460445
427 437443
469489 501
522 529
東海道新幹線の列車本数および利用状況(1日当たり) Daily Departures and Passenger Volume for the Tokaido Shinkansen
東海道新幹線の輸送人キロとGDPの推移 Tokaido Shinkansen Passenger-kilometers and Japan’s GDP
63年度
平成元年度
2年度
3年度
4年度
5年度
6年度
7年度
8年度
9年度
10年度
12年度
11年度
13年度
14年度
15年度
16年度
17年度
18年度
19年度
20年度
21年度
22年度
FY1988
昭和62年度FY1987
FY1989
FY1990
FY1991
FY1992
FY1993
FY1994
FY1995
FY1996
FY1997
FY1998
FY1999
FY2001
FY2000
FY2002
FY2003
FY2004
FY2005
FY2006
FY2007
FY2008
FY2009
FY2010
23年度FY2011
24年度FY2012
25年度FY2013
27年度FY2015
26年度FY2014
28年度FY2016
29年度FY2017
63年度
平成元年度
2年度
3年度
4年度
5年度
6年度
7年度
8年度
9年度
10年度
12年度
11年度
13年度
14年度
15年度
16年度
17年度
18年度
19年度
20年度
21年度
22年度
FY1988
昭和62年度FY1987
FY1989
FY1990
FY1991
FY1992
FY1993
FY1994
FY1995
FY1996
FY1997
FY1998
FY1999
FY2001
FY2000
FY2002
FY2003
FY2004
FY2005
FY2006
FY2007
FY2008
FY2009
FY2010
23年度FY2011
24年度FY2012
25年度FY2013
27年度FY2015
26年度FY2014
28年度FY2016
利用状況 Passenger volume
注 1.臨時列車を含む運転本数の実数2.利用状況は断面輸送量について昭和62(1987)年度を100とした場合の指数3.途中停車駅のぞみ:品川、新横浜、名古屋、京都ひかり:「のぞみ」停車駅とそれ以外の一部の駅こだま:各駅
4.端数処理により、のぞみ・ひかり・こだまの合計が合計と一致しない場合があります。
Note: 1.Including extra trains2.Passenger volumes are the indices of the total passenger volume at certain points. FY1987=100
3.Stops"Nozomi" : Shinagawa, Shin-Yokohama, Nagoya and Kyoto"Hikari" : Same as Nozomi, plus a few additional stations "Kodama" : Every station
4.The figures of "Nozomi", "Hikari", and "Kodama" do not always equal the totals due to rounding.
のぞみ "Nozomi"
最速列車「のぞみ」の片道最大運転本数/時間Hourly departure(s) of our fastest train "Nozomi" at maximum (one-way)
ひかり "Hikari"こだま "Kodama"
231 239
159157152
148142
134133130141143
138137130126123125122120122126127123121124126129128
118111
100
252 260271
0
276
1
5
273
34
270
34
271
2
35
274
37
274
41
271
45
269
50
269
51
271
3
61
272
70
275
7
101
290
8
145
311
166
314
170
319
175
334
9
187
341
193
336
188
333
185
336
188
342
10
194
350
201
358
209
365
217
6565656566666666666464656593
122130138139148155158158157158189187176165150143
83
29年度FY2017
838383828282828180808080807980
8080787878798081828484878889
東海道新幹線の状況(1) The Tokaido Shinkansen (1)
3
164
368
220
65
83
30年度FY2018
169
10
373
226
65
83
548
30年度FY2018
563
4
65
52
11
61
57
5
54
57
15
46
57
21
41
57
27
33
57
36
53
24
45
50
15
57
1
50
6
61
5
61
47
11
61
37
24
61
25
37
61
12
48
61
54
61
60
61
60
60
60
41
60
32
25
60
48
9
60
64
51
80
47
80
6
52
60
16
40
80
13
32
80
19
28
80
25
80
51
21
80
32
73
38
87
22
89
10
14
80
39
6
80
46
東海道新幹線の競争力強化の取組み Strengthening Competitiveness of the Tokaido Shinkansen
(220km/h) (270km/h) (270km/h) (285km/h)(285km/h)
63年度
平成元年度
2年度
3年度
4年度
5年度
6年度
7年度
8年度
9年度
10年度
12年度
11年度
13年度
14年度
15年度
16年度
17年度
18年度
19年度
20年度
21年度
22年度
FY1988
昭和62年度FY1987
FY1989
FY1990
FY1991
FY1992
FY1993
FY1994
FY1995
FY1996
FY1997
FY1998
FY1999
FY2001
FY2000
FY2002
FY2003
FY2004
FY2005
FY2006
FY2007
FY2008
FY2009
FY2010
23年度FY2011
24年度FY2012
25年度FY2013
27年度FY2015
28年度FY2016
令和元年度(計画)FY2019(forecast)
26年度FY2014
63年度
平成元年度
2年度
3年度
4年度
5年度
6年度
7年度
8年度
9年度
10年度
12年度
11年度
13年度
14年度
15年度
16年度
17年度
18年度
19年度
20年度
21年度
22年度
FY1988
昭和62年度FY1987
FY1989
FY1990
FY1991
FY1992
FY1993
FY1994
FY1995
FY1996
FY1997
FY1998
FY1999
FY2001
FY2000
FY2002
FY2003
FY2004
FY2005
FY2006
FY2007
FY2008
FY2009
FY2010
23年度FY2011
24年度FY2012
25年度FY2013
27年度FY2015
26年度FY2014
28年度FY2016
29年度FY2017
30年度FY2018
令和元年度FY2019
2年度FY2020
■ ネット予約・チケットレス乗車サービスの展開 Development of online reservation and ticketless boarding service
■ 新型車両の導入(最高速度) Introduction of new series of rolling stock (Maximum Speed)
■ 大動脈輸送の発展に向けた施策 Key issues for the development of Japan's main transportation artery
最高速度285km/h走行が可能なN700Aタイプに全車両統一(令和元(2019)年度末に完了予定) Standardize all rolling stock to the N700A type, possible to travel at a maximum speed of 285 km/h (by the end of FY2019) ●最高速度285km/hへの速度向上 Increasing maximum speed to 285km/h ●
新大阪駅大規模改良工事の完了 Completion of the large-scale renovation of Shin-Osaka Station ●
令和2(2020)年7月より量産車投入(予定) Launching mass produced vehicles after July 2020 (planned) ▲平成29(2017)年度末に確認試験車による走行試験開始 Start of running tests using validation test vehicles at the end of FY2017 ▲
簡単な登録で気軽にネット予約ができるサービス「スマートEX」 "smartEX" (the convenient online reservation service provided with easy navigation) ●
● 品川駅開業 Inauguration of Shinagawa Station● 全列車270km/h運転 All trains run at max. 270km/h● 「のぞみ」中心ダイヤ Shifting to "Nozomi" timetable
輸送力増強、品川駅新設工事、車両性能の統一等に取り組むIncreasing capacity, Construction of Shinagawa Station, Unification of train capability, etc.
会員制のネット予約サービス「エクスプレス予約」 "Express Reservation" (online reservation service) ●チケットレス乗車サービス「EX-IC」 "EX-IC" (ticketless boarding service) ●
100系 Series 100 300系 Series 300 700系 Series 700 N700系 Series N700 N700A
(285km/h)N700S
0
120
150
60
90
30 65
52
11
73
38
87
22
89
10
61
57
5
54
57
15
46
57
21
41
57
27
33
57
36
53
24
45
50
15
57
1
50
6
61
5
61
47
11
61
37
24
61
25
37
61
12
48
61
54
61
60
61
60
60
60
41
60
32
25
60
48
52
60
16
9
60
64
51
80
47
80
6
40
80
13
32
80
19
28
80
25
21
80
32
29年度FY2017
80
51
0系 Series 0 100系 Series 100
省エネ型車両&最高速度270km/h Energy-saving type & Maximum speed 270km/h 省エネ型車両&最高速度285km/h Energy-saving type & Maximum speed 285km/h
300系 Series 300 N700系 Series N700 N700A700系 Series 700
(編成数 sets)
注 1.数値は各年度末時点の編成数(保留車等を除く)2.N700系は改造工事により285km/h化
Notes:1.The figures are as of the end of each fiscal year (excluding retained trains, etc).2.Series N700 increased maximum speed from 270 km/h to 285 km/h after modification.
東海道新幹線の車種別編成数の推移 Shifts in the Type and Number of Rolling Stock for the Tokaido Shinkansen
14
80
39
30年度FY2018
6
80
46
事業概要 Overview 鉄道事業 Railway Business 関連事業 Affiliated Businesses 財務・経営 Financial and Managerial Data 沿革 History
90%
15%85%
10%
100%
70% 30%
32%68%
31528926623621719817916114211686483122139
339
72
365
226
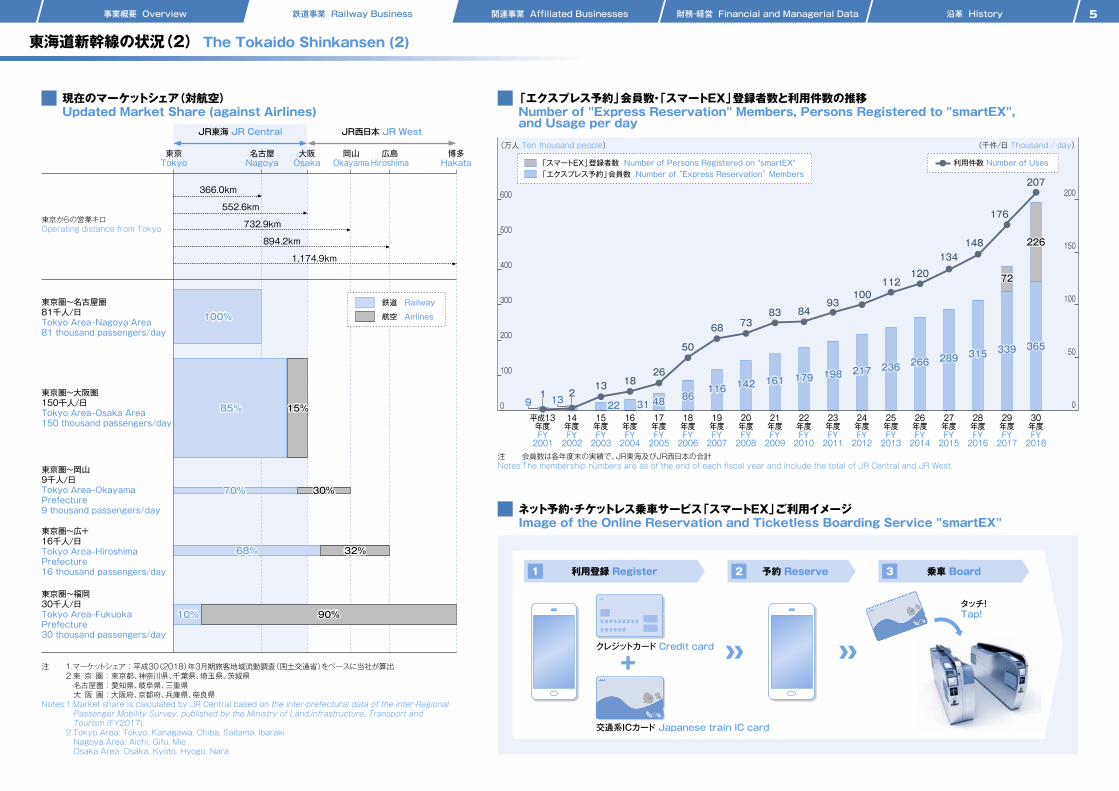
現在のマーケットシェア(対航空) Updated Market Share (against Airlines)
「エクスプレス予約」会員数・「スマートEX」登録者数と利用件数の推移Number of "Express Reservation" Members, Persons Registered to "smartEX", and Usage per day
注 1.マーケットシェア:平成30(2018)年3月期旅客地域流動調査(国土交通省)をベースに当社が算出2.東 京 圏:東京都、神奈川県、千葉県、埼玉県、茨城県 名古屋圏:愛知県、岐阜県、三重県 大 阪 圏:大阪府、京都府、兵庫県、奈良県
Notes:1.Market share is calculated by JR Central based on the inter-prefectural data of the inter-Regional Passenger Mobility Survey, published by the Ministry of Land,infrastructure, Transport and Tourism (FY2017).2.Tokyo Area: Tokyo, Kanagawa, Chiba, Saitama, Ibaraki Nagoya Area: Aichi, Gifu, Mie Osaka Area: Osaka, Kyoto, Hyogo, Nara
注 会員数は各年度末の実績で、JR東海及びJR西日本の合計Notes:The membership numbers are as of the end of each fiscal year and include the total of JR Central and JR West.
100%
85%
10% 90%
15%
鉄道 Railway
航空 Airlines
JR東海 JR Central
名古屋Nagoya
JR西日本 JR West
東京Tokyo
大阪Osaka
岡山Okayama
広島Hiroshima
博多Hakata
東京圏~名古屋圈81千人/日Tokyo Area‒Nagoya Area81 thousand passengers/day
東京からの営業キロ Operating distance from Tokyo
東京圏~大阪圈150千人/日Tokyo Area‒Osaka Area150 thousand passengers/day
東京圏~岡山9千人/日Tokyo Area‒Okayama Prefecture9 thousand passengers/day
東京圏~広島16千人/日Tokyo Area‒Hiroshima Prefecture16 thousand passengers/day
東京圏~福岡30千人/日Tokyo Area‒Fukuoka Prefecture30 thousand passengers/day
70% 30%
32%68%
366.0km
552.6km
732.9km
894.2km
1,174.9km
ネット予約・チケットレス乗車サービス「スマートEX」ご利用イメージ Image of the Online Reservation and Ticketless Boarding Service "smartEX"
0
100
200
300
400
500
600
(万人 Ten thousand people) (千件/日 Thousand / day)
0
50
100
150
200
平成13年度
14年度
15年度
16年度
17年度
18年度
19年度
20年度
21年度
FY2001
FY2002
FY2003
FY2004
FY2005
FY2006
FY2007
FY2008
FY2009
22年度FY2010
23年度FY2011
24年度FY2012
25年度FY2013
26年度FY2014
27年度FY2015
28年度FY2016
31528926623621719817916114211686483122139
「スマートEX」登録者数 Number of Persons Registered on "smartEX"「エクスプレス予約」会員数 Number of “Express Reservation” Members
利用件数 Number of Uses
148
29年度FY2017
134
120112
10093
84837368
50
261813
21
利用登録 Register
クレジットカード Credit card
交通系ICカード Japanese train IC card
タッチ!Tap!
予約 Reserve 乗車 Board1 2 3
東海道新幹線の状況(2) The Tokaido Shinkansen (2)
5
339
72
176
30年度FY2018
365
226
207
6
92
77
100(基準 Base)
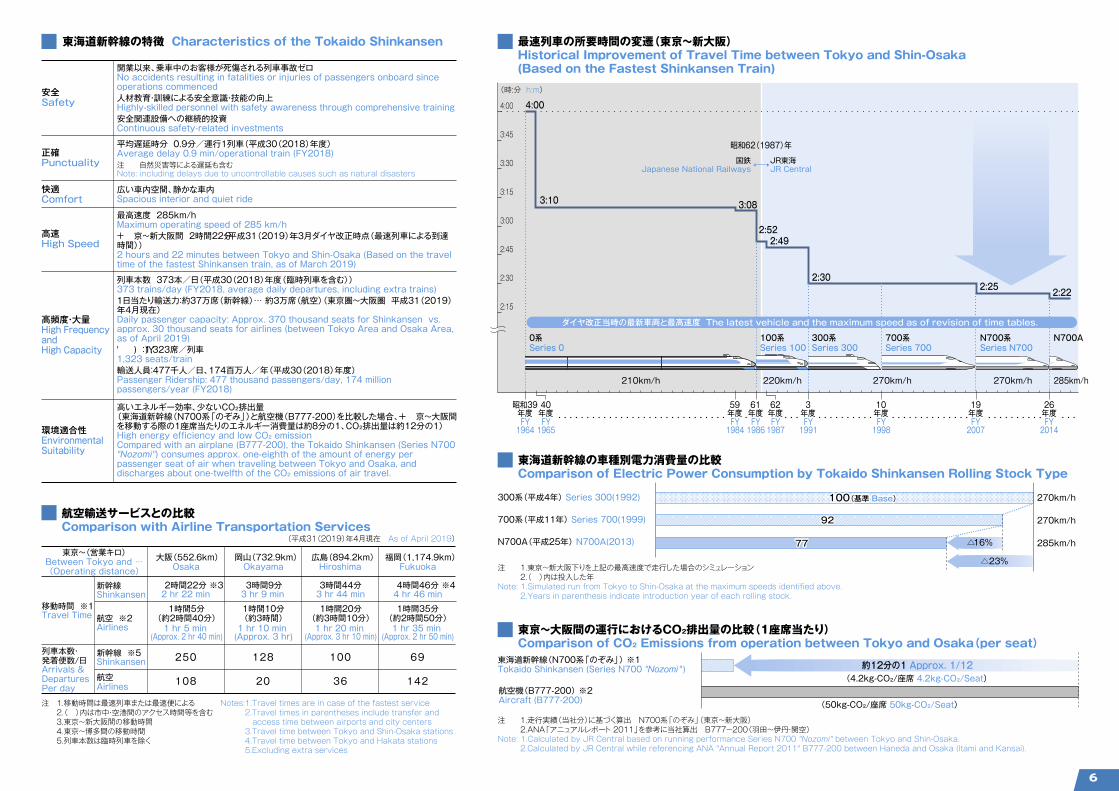
東海道新幹線の特徴 Characteristics of the Tokaido Shinkansen 最速列車の所要時間の変遷(東京~新大阪) Historical Improvement of Travel Time between Tokyo and Shin-Osaka (Based on the Fastest Shinkansen Train)
航空輸送サービスとの比較Comparison with Airline Transportation Services
安全Safety
正確Punctuality
高速High Speed
高頻度・大量High Frequency and High Capacity
250
108
128
20
100
36
69
142
(平成31(2019)年4月現在 As of April 2019)
(時:分 h:m)
東京~(営業キロ)Between Tokyo and …(Operating distance)
新幹線Shinkansen
移動時間 ※1Travel Time
列車本数・発着便数/日Arrivals & DeparturesPer day
航空 ※2Airlines
2時間22分 ※32 hr 22 min
3時間9分3 hr 9 min
3時間44分3 hr 44 min
4時間46分 ※44 hr 46 min
新幹線 ※5Shinkansen
航空 Airlines
大阪(552.6km) Osaka
岡山(732.9km) Okayama
広島(894.2km) Hiroshima
福岡(1,174.9km) Fukuoka
快適Comfort
環境適合性Environmental Suitability
開業以来、乗車中のお客様が死傷される列車事故ゼロNo accidents resulting in fatalities or injuries of passengers onboard since operations commenced人材教育・訓練による安全意識・技能の向上Highly-skilled personnel with safety awareness through comprehensive training安全関連設備への継続的投資Continuous safety-related investments
平均遅延時分 0.9分/運行1列車(平成30(2018)年度)Average delay 0.9 min/operational train (FY2018)注 自然災害等による遅延も含むNote: including delays due to uncontrollable causes such as natural disasters
最高速度 285km/hMaximum operating speed of 285 km/h東京~新大阪間 2時間22分(平成31(2019)年3月ダイヤ改正時点(最速列車による到達時間))2 hours and 22 minutes between Tokyo and Shin-Osaka (Based on the travel time of the fastest Shinkansen train, as of March 2019)
高いエネルギー効率、少ないCO₂排出量(東海道新幹線(N700系「のぞみ」)と航空機(B777-200)を比較した場合、東京~大阪間を移動する際の1座席当たりのエネルギー消費量は約8分の1、CO₂排出量は約12分の1)High energy efficiency and low CO₂ emissionCompared with an airplane (B777-200), the Tokaido Shinkansen (Series N700 "Nozomi") consumes approx. one-eighth of the amount of energy per passenger seat of air when traveling between Tokyo and Osaka, and discharges about one-twelfth of the CO₂ emissions of air travel.
列車本数 373本/日(平成30(2018)年度(臨時列車を含む))373 trains/day (FY2018, average daily departures, including extra trains)1日当たり輸送力:約37万席(新幹線)… 約3万席(航空)(東京圏~大阪圏 平成31(2019)年4月現在)Daily passenger capacity: Approx. 370 thousand seats for Shinkansen vs. approx. 30 thousand seats for airlines (between Tokyo Area and Osaka Area, as of April 2019)座席数:1,323席/列車1,323 seats/train輸送人員:477千人/日、174百万人/年(平成30(2018)年度)Passenger Ridership: 477 thousand passengers/day, 174 million passengers/year (FY2018)
広い車内空間、静かな車内Spacious interior and quiet ride
1時間5分(約2時間40分)1 hr 5 min
(Approx. 2 hr 40 min)
1時間10分(約3時間)1 hr 10 min (Approx. 3 hr)
1時間20分(約3時間10分)1 hr 20 min
(Approx. 3 hr 10 min)
1時間35分(約2時間50分)1 hr 35 min
(Approx. 2 hr 50 min)
700系(平成11年) Series 700(1999)
300系(平成4年) Series 300(1992)
N700A(平成25年) N700A(2013)
92
77 △16%
△23%
270km/h
270km/h
285km/h
東海道新幹線の車種別電力消費量の比較Comparison of Electric Power Consumption by Tokaido Shinkansen Rolling Stock Type
注 1.東京~新大阪下りを上記の最高速度で走行した場合のシミュレーション 2.( )内は投入した年Note: 1.Simulated run from Tokyo to Shin-Osaka at the maximum speeds identified above. 2.Years in parenthesis indicate introduction year of each rolling stock.
東海道新幹線(N700系「のぞみ」) ※1Tokaido Shinkansen (Series N700 "Nozomi")
航空機(B777-200) ※2Aircraft (B777-200)
(4.2kg-CO₂/座席 4.2kg-CO₂/Seat)
(50kg-CO₂/座席 50kg-CO₂/Seat)
約12分の1 Approx. 1/12
東京~大阪間の運行におけるCO₂排出量の比較(1座席当たり)Comparison of CO₂ Emissions from operation between Tokyo and Osaka(per seat)
注 1.走行実績(当社分)に基づく算出 N700系「のぞみ」(東京~新大阪) 2.ANA「アニュアルレポート 2011」を参考に当社算出 B777-200(羽田~伊丹・関空)Note: 1.Calculated by JR Central based on running performance Series N700 "Nozomi" between Tokyo and Shin-Osaka. 2.Calculated by JR Central while referencing ANA "Annual Report 2011" B777-200 between Haneda and Osaka (Itami and Kansai).
2:222:252:30
2:492:52
3:083:10
4:00
2:30
2:15
3:00
3:30
4:00
2:45
3:15
3:45
3年度
19年度
FY1991
10年度FY1998
62年度FY1987
61年度FY1986
昭和62(1987)年
59年度FY1984
昭和39年度FY1964
40年度FY1965
FY2007
26年度FY2014
Notes:1.Travel times are in case of the fastest service2.Travel times in parentheses include transfer and access time between airports and city centers3.Travel time between Tokyo and Shin-Osaka stations4.Travel time between Tokyo and Hakata stations5.Excluding extra services
注 1.移動時間は最速列車または最速便による2.( )内は市中・空港間のアクセス時間等を含む3.東京~新大阪間の移動時間4.東京~博多間の移動時間5.列車本数は臨時列車を除く
JR東海JR Central
国鉄Japanese National Railways
100(基準 Base)
0系Series 0
210km/h 220km/h 270km/h270km/h 285km/h
100系Series 100
300系Series 300
700系Series 700
N700系Series N700
N700A
ダイヤ改正当時の最新車両と最高速度 The latest vehicle and the maximum speed as of revision of time tables.
事業概要 Overview 鉄道事業 Railway Business 関連事業 Affiliated Businesses 財務・経営 Financial and Managerial Data 沿革 History
90%
15%85%
10%
100%
70% 30%
32%68%
31528926623621719817916114211686483122139
339
72
365
226
現在のマーケットシェア(対航空) Updated Market Share (against Airlines)
「エクスプレス予約」会員数・「スマートEX」登録者数と利用件数の推移Number of "Express Reservation" Members, Persons Registered to "smartEX", and Usage per day
注 1.マーケットシェア:平成30(2018)年3月期旅客地域流動調査(国土交通省)をベースに当社が算出2.東 京 圏:東京都、神奈川県、千葉県、埼玉県、茨城県 名古屋圏:愛知県、岐阜県、三重県 大 阪 圏:大阪府、京都府、兵庫県、奈良県
Notes:1.Market share is calculated by JR Central based on the inter-prefectural data of the inter-Regional Passenger Mobility Survey, published by the Ministry of Land,infrastructure, Transport and Tourism (FY2017).2.Tokyo Area: Tokyo, Kanagawa, Chiba, Saitama, Ibaraki Nagoya Area: Aichi, Gifu, Mie Osaka Area: Osaka, Kyoto, Hyogo, Nara
注 会員数は各年度末の実績で、JR東海及びJR西日本の合計Notes:The membership numbers are as of the end of each fiscal year and include the total of JR Central and JR West.
100%
85%
10% 90%
15%
鉄道 Railway
航空 Airlines
JR東海 JR Central
名古屋Nagoya
JR西日本 JR West
東京Tokyo
大阪Osaka
岡山Okayama
広島Hiroshima
博多Hakata
東京圏~名古屋圈81千人/日Tokyo Area‒Nagoya Area81 thousand passengers/day
東京からの営業キロ Operating distance from Tokyo
東京圏~大阪圈150千人/日Tokyo Area‒Osaka Area150 thousand passengers/day
東京圏~岡山9千人/日Tokyo Area‒Okayama Prefecture9 thousand passengers/day
東京圏~広島16千人/日Tokyo Area‒Hiroshima Prefecture16 thousand passengers/day
東京圏~福岡30千人/日Tokyo Area‒Fukuoka Prefecture30 thousand passengers/day
70% 30%
32%68%
366.0km
552.6km
732.9km
894.2km
1,174.9km
ネット予約・チケットレス乗車サービス「スマートEX」ご利用イメージ Image of the Online Reservation and Ticketless Boarding Service "smartEX"
0
100
200
300
400
500
600
(万人 Ten thousand people) (千件/日 Thousand / day)
0
50
100
150
200
平成13年度
14年度
15年度
16年度
17年度
18年度
19年度
20年度
21年度
FY2001
FY2002
FY2003
FY2004
FY2005
FY2006
FY2007
FY2008
FY2009
22年度FY2010
23年度FY2011
24年度FY2012
25年度FY2013
26年度FY2014
27年度FY2015
28年度FY2016
31528926623621719817916114211686483122139
「スマートEX」登録者数 Number of Persons Registered on "smartEX"「エクスプレス予約」会員数 Number of “Express Reservation” Members
利用件数 Number of Uses
148
29年度FY2017
134
120112
10093
84837368
50
261813
21
利用登録 Register
クレジットカード Credit card
交通系ICカード Japanese train IC card
タッチ!Tap!
予約 Reserve 乗車 Board1 2 3
東海道新幹線の状況(2) The Tokaido Shinkansen (2)
5
339
72
176
30年度FY2018
365
226
207
6
92
77
100(基準 Base)
東海道新幹線の特徴 Characteristics of the Tokaido Shinkansen 最速列車の所要時間の変遷(東京~新大阪) Historical Improvement of Travel Time between Tokyo and Shin-Osaka (Based on the Fastest Shinkansen Train)
航空輸送サービスとの比較Comparison with Airline Transportation Services
安全Safety
正確Punctuality
高速High Speed
高頻度・大量High Frequency and High Capacity
250
108
128
20
100
36
69
142
(平成31(2019)年4月現在 As of April 2019)
(時:分 h:m)
東京~(営業キロ)Between Tokyo and …(Operating distance)
新幹線Shinkansen
移動時間 ※1Travel Time
列車本数・発着便数/日Arrivals & DeparturesPer day
航空 ※2Airlines
2時間22分 ※32 hr 22 min
3時間9分3 hr 9 min
3時間44分3 hr 44 min
4時間46分 ※44 hr 46 min
新幹線 ※5Shinkansen
航空 Airlines
大阪(552.6km) Osaka
岡山(732.9km) Okayama
広島(894.2km) Hiroshima
福岡(1,174.9km) Fukuoka
快適Comfort
環境適合性Environmental Suitability
開業以来、乗車中のお客様が死傷される列車事故ゼロNo accidents resulting in fatalities or injuries of passengers onboard since operations commenced人材教育・訓練による安全意識・技能の向上Highly-skilled personnel with safety awareness through comprehensive training安全関連設備への継続的投資Continuous safety-related investments
平均遅延時分 0.9分/運行1列車(平成30(2018)年度)Average delay 0.9 min/operational train (FY2018)注 自然災害等による遅延も含むNote: including delays due to uncontrollable causes such as natural disasters
最高速度 285km/hMaximum operating speed of 285 km/h東京~新大阪間 2時間22分(平成31(2019)年3月ダイヤ改正時点(最速列車による到達時間))2 hours and 22 minutes between Tokyo and Shin-Osaka (Based on the travel time of the fastest Shinkansen train, as of March 2019)
高いエネルギー効率、少ないCO₂排出量(東海道新幹線(N700系「のぞみ」)と航空機(B777-200)を比較した場合、東京~大阪間を移動する際の1座席当たりのエネルギー消費量は約8分の1、CO₂排出量は約12分の1)High energy efficiency and low CO₂ emissionCompared with an airplane (B777-200), the Tokaido Shinkansen (Series N700 "Nozomi") consumes approx. one-eighth of the amount of energy per passenger seat of air when traveling between Tokyo and Osaka, and discharges about one-twelfth of the CO₂ emissions of air travel.
列車本数 373本/日(平成30(2018)年度(臨時列車を含む))373 trains/day (FY2018, average daily departures, including extra trains)1日当たり輸送力:約37万席(新幹線)… 約3万席(航空)(東京圏~大阪圏 平成31(2019)年4月現在)Daily passenger capacity: Approx. 370 thousand seats for Shinkansen vs. approx. 30 thousand seats for airlines (between Tokyo Area and Osaka Area, as of April 2019)座席数:1,323席/列車1,323 seats/train輸送人員:477千人/日、174百万人/年(平成30(2018)年度)Passenger Ridership: 477 thousand passengers/day, 174 million passengers/year (FY2018)
広い車内空間、静かな車内Spacious interior and quiet ride
1時間5分(約2時間40分)1 hr 5 min
(Approx. 2 hr 40 min)
1時間10分(約3時間)1 hr 10 min (Approx. 3 hr)
1時間20分(約3時間10分)1 hr 20 min
(Approx. 3 hr 10 min)
1時間35分(約2時間50分)1 hr 35 min
(Approx. 2 hr 50 min)
700系(平成11年) Series 700(1999)
300系(平成4年) Series 300(1992)
N700A(平成25年) N700A(2013)
92
77 △16%
△23%
270km/h
270km/h
285km/h
東海道新幹線の車種別電力消費量の比較Comparison of Electric Power Consumption by Tokaido Shinkansen Rolling Stock Type
注 1.東京~新大阪下りを上記の最高速度で走行した場合のシミュレーション 2.( )内は投入した年Note: 1.Simulated run from Tokyo to Shin-Osaka at the maximum speeds identified above. 2.Years in parenthesis indicate introduction year of each rolling stock.
東海道新幹線(N700系「のぞみ」) ※1Tokaido Shinkansen (Series N700 "Nozomi")
航空機(B777-200) ※2Aircraft (B777-200)
(4.2kg-CO₂/座席 4.2kg-CO₂/Seat)
(50kg-CO₂/座席 50kg-CO₂/Seat)
約12分の1 Approx. 1/12
東京~大阪間の運行におけるCO₂排出量の比較(1座席当たり)Comparison of CO₂ Emissions from operation between Tokyo and Osaka(per seat)
注 1.走行実績(当社分)に基づく算出 N700系「のぞみ」(東京~新大阪) 2.ANA「アニュアルレポート 2011」を参考に当社算出 B777-200(羽田~伊丹・関空)Note: 1.Calculated by JR Central based on running performance Series N700 "Nozomi" between Tokyo and Shin-Osaka. 2.Calculated by JR Central while referencing ANA "Annual Report 2011" B777-200 between Haneda and Osaka (Itami and Kansai).
2:222:252:30
2:492:52
3:083:10
4:00
2:30
2:15
3:00
3:30
4:00
2:45
3:15
3:45
3年度
19年度
FY1991
10年度FY1998
62年度FY1987
61年度FY1986
昭和62(1987)年
59年度FY1984
昭和39年度FY1964
40年度FY1965
FY2007
26年度FY2014
Notes:1.Travel times are in case of the fastest service2.Travel times in parentheses include transfer and access time between airports and city centers3.Travel time between Tokyo and Shin-Osaka stations4.Travel time between Tokyo and Hakata stations5.Excluding extra services
注 1.移動時間は最速列車または最速便による2.( )内は市中・空港間のアクセス時間等を含む3.東京~新大阪間の移動時間4.東京~博多間の移動時間5.列車本数は臨時列車を除く
JR東海JR Central
国鉄Japanese National Railways
100(基準 Base)
0系Series 0
210km/h 220km/h 270km/h270km/h 285km/h
100系Series 100
300系Series 300
700系Series 700
N700系Series N700
N700A
ダイヤ改正当時の最新車両と最高速度 The latest vehicle and the maximum speed as of revision of time tables.
事業概要 Overview 鉄道事業 Railway Business 関連事業 Affiliated Businesses 財務・経営 Financial and Managerial Data 沿革 History
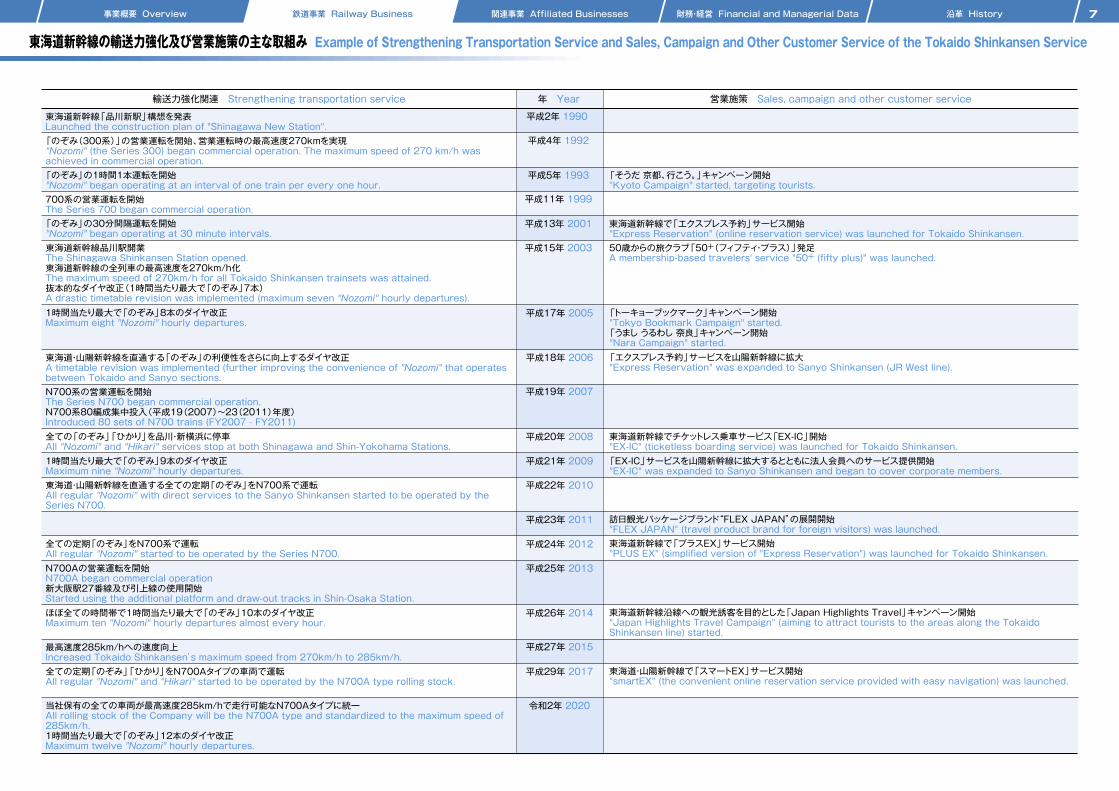
「そうだ 京都、行こう。」キャンペーン開始"Kyoto Campaign" started, targeting tourists.
東海道新幹線で「エクスプレス予約」サービス開始"Express Reservation" (online reservation service) was launched for Tokaido Shinkansen.
「のぞみ(300系)」の営業運転を開始、営業運転時の最高速度270kmを実現"Nozomi" (the Series 300) began commercial operation. The maximum speed of 270 km/h was achieved in commercial operation.
平成4年 1992
東海道新幹線「品川新駅」構想を発表Launched the construction plan of "Shinagawa New Station".
平成2年 1990
「のぞみ」の1時間1本運転を開始"Nozomi" began operating at an interval of one train per every one hour.
平成5年 1993
700系の営業運転を開始The Series 700 began commercial operation.
平成11年 1999
「のぞみ」の30分間隔運転を開始"Nozomi" began operating at 30 minute intervals.
平成13年 2001
年 Year輸送力強化関連 Strengthening transportation service 営業施策 Sales, campaign and other customer service
50歳からの旅クラブ「50+(フィフティ・プラス)」発足A membership-based travelers' service "50+ (fifty plus)" was launched.
「トーキョーブックマーク」キャンペーン開始"Tokyo Bookmark Campaign" started.「うまし うるわし 奈良」キャンペーン開始"Nara Campaign" started.
東海道新幹線品川駅開業The Shinagawa Shinkansen Station opened.東海道新幹線の全列車の最高速度を270km/h化The maximum speed of 270km/h for all Tokaido Shinkansen trainsets was attained.抜本的なダイヤ改正(1時間当たり最大で「のぞみ」7本)A drastic timetable revision was implemented (maximum seven "Nozomi" hourly departures).
平成15年 2003
「エクスプレス予約」サービスを山陽新幹線に拡大"Express Reservation" was expanded to Sanyo Shinkansen (JR West line).
1時間当たり最大で「のぞみ」8本のダイヤ改正Maximum eight "Nozomi" hourly departures.
平成17年 2005
東海道・山陽新幹線を直通する「のぞみ」の利便性をさらに向上するダイヤ改正A timetable revision was implemented (further improving the convenience of "Nozomi" that operates between Tokaido and Sanyo sections.N700系の営業運転を開始The Series N700 began commercial operation.N700系80編成集中投入(平成19(2007)~23(2011)年度)Introduced 80 sets of N700 trains (FY2007 - FY2011)
平成18年 2006
東海道新幹線でチケットレス乗車サービス「EX-IC」開始"EX-IC" (ticketless boarding service) was launched for Tokaido Shinkansen.
平成19年 2007
全ての「のぞみ」「ひかり」を品川・新横浜に停車All "Nozomi" and "Hikari" services stop at both Shinagawa and Shin-Yokohama Stations.
平成20年 2008
1時間当たり最大で「のぞみ」9本のダイヤ改正Maximum nine "Nozomi" hourly departures.
ほぼ全ての時間帯で1時間当たり最大で「のぞみ」10本のダイヤ改正Maximum ten "Nozomi" hourly departures almost every hour.
東海道新幹線沿線への観光誘客を目的とした「Japan Highlights Travel」キャンペーン開始"Japan Highlights Travel Campaign" (aiming to attract tourists to the areas along the Tokaido Shinkansen line) started.
東海道・山陽新幹線で「スマートEX」サービス開始"smartEX" (the convenient online reservation service provided with easy navigation) was launched.
「EX-IC」サービスを山陽新幹線に拡大するとともに法人会員へのサービス提供開始"EX-IC" was expanded to Sanyo Shinkansen and began to cover corporate members.
平成21年 2009
東海道・山陽新幹線を直通する全ての定期「のぞみ」をN700系で運転All regular "Nozomi" with direct services to the Sanyo Shinkansen started to be operated by the Series N700.
平成23年 2011 訪日観光パッケージブランド“FLEX JAPAN”の展開開始"FLEX JAPAN" (travel product brand for foreign visitors) was launched.東海道新幹線で「プラスEX」サービス開始"PLUS EX" (simplified version of "Express Reservation") was launched for Tokaido Shinkansen.
平成22年 2010
全ての定期「のぞみ」をN700系で運転All regular "Nozomi" started to be operated by the Series N700.N700Aの営業運転を開始N700A began commercial operation新大阪駅27番線及び引上線の使用開始Started using the additional platform and draw-out tracks in Shin-Osaka Station.
平成24年 2012
平成25年 2013
平成26年 2014
最高速度285km/hへの速度向上Increased Tokaido Shinkansen’s maximum speed from 270km/h to 285km/h.全ての定期「のぞみ」「ひかり」をN700Aタイプの車両で運転All regular "Nozomi" and "Hikari" started to be operated by the N700A type rolling stock.
平成27年 2015
平成29年 2017
当社保有の全ての車両が最高速度285km/hで走行可能なN700Aタイプに統一All rolling stock of the Company will be the N700A type and standardized to the maximum speed of 285km/h.1時間当たり最大で「のぞみ」12本のダイヤ改正Maximum twelve "Nozomi" hourly departures.
令和2年 2020
東海道新幹線の輸送力強化及び営業施策の主な取組み Example of Strengthening Transportation Service and Sales, Campaign and Other Customer Service of the Tokaido Shinkansen Service
7
事業概要 Overview 鉄道事業 Railway Business 関連事業 Affiliated Businesses 財務・経営 Financial and Managerial Data 沿革 History
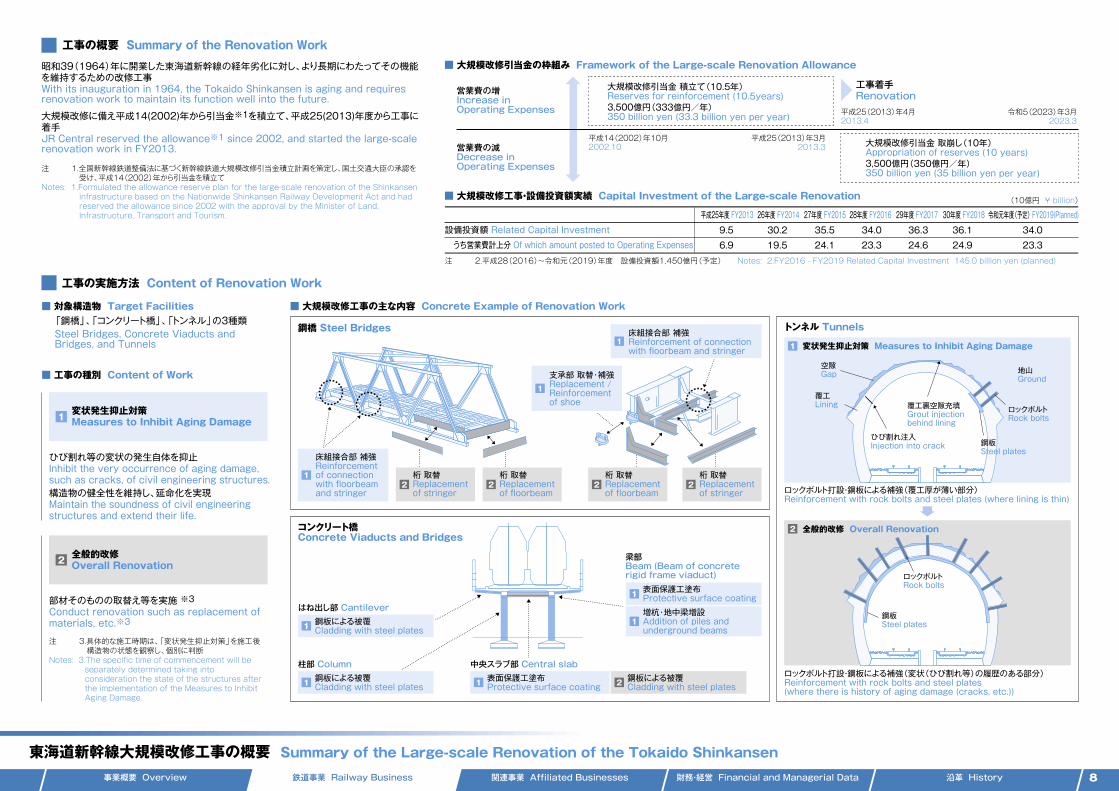
工事の概要 Summary of the Renovation Work
柱部 Column鋼板による被覆Cladding with steel plates
ロックボルト打設・鋼板による補強(覆工厚が薄い部分)Reinforcement with rock bolts and steel plates (where lining is thin)
ロックボルトRock bolts
ロックボルトRock bolts
地山Ground
空隙Gap
覆工Lining
鋼板Steel plates
鋼板Steel plates
覆工裏空隙充填Grout injection behind lining
ロックボルト打設・鋼板による補強(変状(ひび割れ等)の履歴のある部分)Reinforcement with rock bolts and steel plates(where there is history of aging damage (cracks, etc.))
ひび割れ注入Injection into crack
中央スラブ部 Central slab表面保護工塗布Protective surface coating
鋼板による被覆Cladding with steel plates
梁部 Beam (Beam of concrete rigid frame viaduct)
表面保護工塗布Protective surface coating増杭・地中梁増設Addition of piles and underground beams
変状発生抑止対策 Measures to Inhibit Aging Damage
全般的改修 Overall Renovation
工事の実施方法 Content of Renovation Work
「鋼橋」、「コンクリート橋」、「トンネル」の3種類Steel Bridges, Concrete Viaducts and Bridges, and Tunnels
昭和39(1964)年に開業した東海道新幹線の経年劣化に対し、より長期にわたってその機能を維持するための改修工事With its inauguration in 1964, the Tokaido Shinkansen is aging and requires renovation work to maintain its function well into the future.
大規模改修に備え平成14(2002)年から引当金※1を積立て、平成25(2013)年度から工事に着手JR Central reserved the allowance※1 since 2002, and started the large-scale renovation work in FY2013.
■ 対象構造物 Target Facilities
ひび割れ等の変状の発生自体を抑止Inhibit the very occurrence of aging damage, such as cracks, of civil engineering structures.構造物の健全性を維持し、延命化を実現Maintain the soundness of civil engineering structures and extend their life.
部材そのものの取替え等を実施 ※3Conduct renovation such as replacement of materials, etc.※3
■ 工事の種別 Content of Work
大規模改修引当金 取崩し(10年)Appropriation of reserves (10 years)3,500億円(350億円/年)350 billion yen (35 billion yen per year)
令和5(2023)年3月2023.3
平成25(2013)年4月2013.4
工事着手Renovation
平成25(2013)年3月2013.3
平成14(2002)年10月2002.10
大規模改修引当金 積立て(10.5年)Reserves for reinforcement (10.5years)3,500億円(333億円/年)350 billion yen (33.3 billion yen per year)
営業費の減Decrease in Operating Expenses
営業費の増Increase in Operating Expenses
トンネル Tunnels
コンクリート橋 Concrete Viaducts and Bridges
鋼橋 Steel Bridges
■ 大規模改修工事の主な内容 Concrete Example of Renovation Work
■ 大規模改修引当金の枠組み Framework of the Large-scale Renovation Allowance
変状発生抑止対策 Measures to Inhibit Aging Damage
全般的改修 Overall Renovation
1床組接合部 補強Reinforcement of connection with floorbeam and stringer
1
支承部 取替・補強Replacement / Reinforcement of shoe
1
床組接合部 補強Reinforcement of connection with floorbeam and stringer
1
1
はね出し部 Cantilever鋼板による被覆Cladding with steel plates1
1
1
1
2
2
桁 取替Replacement of floorbeam
2桁 取替Replacement of stringer
2桁 取替Replacement of floorbeam
2桁 取替Replacement of stringer
2
1
2
注 3.具体的な施工時期は、「変状発生抑止対策」を施工後構造物の状態を観察し、個別に判断
Notes: 3.The specific time of commencement will be separately determined taking into consideration the state of the structures after the implementation of the Measures to Inhibit Aging Damage.
注 2.平成28(2016)~令和元(2019)年度 設備投資額1,450億円(予定) Notes: 2.FY2016 - FY2019 Related Capital Investment 145.0 billion yen (planned)
注 1.全国新幹線鉄道整備法に基づく新幹線鉄道大規模改修引当金積立計画を策定し、国土交通大臣の承認を受け、平成14(2002)年から引当金を積立て
Notes: 1.Formulated the allowance reserve plan for the large-scale renovation of the Shinkansen infrastructure based on the Nationwide Shinkansen Railway Development Act and had reserved the allowance since 2002 with the approval by the Minister of Land, Infrastructure, Transport and Tourism.
■ 大規模改修工事・設備投資額実績 Capital Investment of the Large-scale Renovation
設備投資額 Related Capital Investment
うち営業費計上分 Of which amount posted to Operating Expenses
(10億円 ¥ billion)
9.5
6.9
平成25年度 FY2013
30.2
19.5
26年度 FY2014
35.5
24.1
27年度 FY2015
34.0
23.3
28年度 FY2016
36.3
24.6
29年度 FY2017
36.1
24.9
30年度 FY2018
34.0
23.3
令和元年度(予定) FY2019(Planned)
東海道新幹線大規模改修工事の概要 Summary of the Large-scale Renovation of the Tokaido Shinkansen8
事業概要 Overview 鉄道事業 Railway Business 関連事業 Affiliated Businesses 財務・経営 Financial and Managerial Data 沿革 History
「そうだ 京都、行こう。」キャンペーン開始"Kyoto Campaign" started, targeting tourists.
東海道新幹線で「エクスプレス予約」サービス開始"Express Reservation" (online reservation service) was launched for Tokaido Shinkansen.
「のぞみ(300系)」の営業運転を開始、営業運転時の最高速度270kmを実現"Nozomi" (the Series 300) began commercial operation. The maximum speed of 270 km/h was achieved in commercial operation.
平成4年 1992
東海道新幹線「品川新駅」構想を発表Launched the construction plan of "Shinagawa New Station".
平成2年 1990
「のぞみ」の1時間1本運転を開始"Nozomi" began operating at an interval of one train per every one hour.
平成5年 1993
700系の営業運転を開始The Series 700 began commercial operation.
平成11年 1999
「のぞみ」の30分間隔運転を開始"Nozomi" began operating at 30 minute intervals.
平成13年 2001
年 Year輸送力強化関連 Strengthening transportation service 営業施策 Sales, campaign and other customer service
50歳からの旅クラブ「50+(フィフティ・プラス)」発足A membership-based travelers' service "50+ (fifty plus)" was launched.
「トーキョーブックマーク」キャンペーン開始"Tokyo Bookmark Campaign" started.「うまし うるわし 奈良」キャンペーン開始"Nara Campaign" started.
東海道新幹線品川駅開業The Shinagawa Shinkansen Station opened.東海道新幹線の全列車の最高速度を270km/h化The maximum speed of 270km/h for all Tokaido Shinkansen trainsets was attained.抜本的なダイヤ改正(1時間当たり最大で「のぞみ」7本)A drastic timetable revision was implemented (maximum seven "Nozomi" hourly departures).
平成15年 2003
「エクスプレス予約」サービスを山陽新幹線に拡大"Express Reservation" was expanded to Sanyo Shinkansen (JR West line).
1時間当たり最大で「のぞみ」8本のダイヤ改正Maximum eight "Nozomi" hourly departures.
平成17年 2005
東海道・山陽新幹線を直通する「のぞみ」の利便性をさらに向上するダイヤ改正A timetable revision was implemented (further improving the convenience of "Nozomi" that operates between Tokaido and Sanyo sections.N700系の営業運転を開始The Series N700 began commercial operation.N700系80編成集中投入(平成19(2007)~23(2011)年度)Introduced 80 sets of N700 trains (FY2007 - FY2011)
平成18年 2006
東海道新幹線でチケットレス乗車サービス「EX-IC」開始"EX-IC" (ticketless boarding service) was launched for Tokaido Shinkansen.
平成19年 2007
全ての「のぞみ」「ひかり」を品川・新横浜に停車All "Nozomi" and "Hikari" services stop at both Shinagawa and Shin-Yokohama Stations.
平成20年 2008
1時間当たり最大で「のぞみ」9本のダイヤ改正Maximum nine "Nozomi" hourly departures.
ほぼ全ての時間帯で1時間当たり最大で「のぞみ」10本のダイヤ改正Maximum ten "Nozomi" hourly departures almost every hour.
東海道新幹線沿線への観光誘客を目的とした「Japan Highlights Travel」キャンペーン開始"Japan Highlights Travel Campaign" (aiming to attract tourists to the areas along the Tokaido Shinkansen line) started.
東海道・山陽新幹線で「スマートEX」サービス開始"smartEX" (the convenient online reservation service provided with easy navigation) was launched.
「EX-IC」サービスを山陽新幹線に拡大するとともに法人会員へのサービス提供開始"EX-IC" was expanded to Sanyo Shinkansen and began to cover corporate members.
平成21年 2009
東海道・山陽新幹線を直通する全ての定期「のぞみ」をN700系で運転All regular "Nozomi" with direct services to the Sanyo Shinkansen started to be operated by the Series N700.
平成23年 2011 訪日観光パッケージブランド“FLEX JAPAN”の展開開始"FLEX JAPAN" (travel product brand for foreign visitors) was launched.東海道新幹線で「プラスEX」サービス開始"PLUS EX" (simplified version of "Express Reservation") was launched for Tokaido Shinkansen.
平成22年 2010
全ての定期「のぞみ」をN700系で運転All regular "Nozomi" started to be operated by the Series N700.N700Aの営業運転を開始N700A began commercial operation新大阪駅27番線及び引上線の使用開始Started using the additional platform and draw-out tracks in Shin-Osaka Station.
平成24年 2012
平成25年 2013
平成26年 2014
最高速度285km/hへの速度向上Increased Tokaido Shinkansen’s maximum speed from 270km/h to 285km/h.全ての定期「のぞみ」「ひかり」をN700Aタイプの車両で運転All regular "Nozomi" and "Hikari" started to be operated by the N700A type rolling stock.
平成27年 2015
平成29年 2017
当社保有の全ての車両が最高速度285km/hで走行可能なN700Aタイプに統一All rolling stock of the Company will be the N700A type and standardized to the maximum speed of 285km/h.1時間当たり最大で「のぞみ」12本のダイヤ改正Maximum twelve "Nozomi" hourly departures.
令和2年 2020
東海道新幹線の輸送力強化及び営業施策の主な取組み Example of Strengthening Transportation Service and Sales, Campaign and Other Customer Service of the Tokaido Shinkansen Service
7
事業概要 Overview 鉄道事業 Railway Business 関連事業 Affiliated Businesses 財務・経営 Financial and Managerial Data 沿革 History
工事の概要 Summary of the Renovation Work
柱部 Column鋼板による被覆Cladding with steel plates
ロックボルト打設・鋼板による補強(覆工厚が薄い部分)Reinforcement with rock bolts and steel plates (where lining is thin)
ロックボルトRock bolts
ロックボルトRock bolts
地山Ground
空隙Gap
覆工Lining
鋼板Steel plates
鋼板Steel plates
覆工裏空隙充填Grout injection behind lining
ロックボルト打設・鋼板による補強(変状(ひび割れ等)の履歴のある部分)Reinforcement with rock bolts and steel plates(where there is history of aging damage (cracks, etc.))
ひび割れ注入Injection into crack
中央スラブ部 Central slab表面保護工塗布Protective surface coating
鋼板による被覆Cladding with steel plates
梁部 Beam (Beam of concrete rigid frame viaduct)
表面保護工塗布Protective surface coating増杭・地中梁増設Addition of piles and underground beams
変状発生抑止対策 Measures to Inhibit Aging Damage
全般的改修 Overall Renovation
工事の実施方法 Content of Renovation Work
「鋼橋」、「コンクリート橋」、「トンネル」の3種類Steel Bridges, Concrete Viaducts and Bridges, and Tunnels
昭和39(1964)年に開業した東海道新幹線の経年劣化に対し、より長期にわたってその機能を維持するための改修工事With its inauguration in 1964, the Tokaido Shinkansen is aging and requires renovation work to maintain its function well into the future.
大規模改修に備え平成14(2002)年から引当金※1を積立て、平成25(2013)年度から工事に着手JR Central reserved the allowance※1 since 2002, and started the large-scale renovation work in FY2013.
■ 対象構造物 Target Facilities
ひび割れ等の変状の発生自体を抑止Inhibit the very occurrence of aging damage, such as cracks, of civil engineering structures.構造物の健全性を維持し、延命化を実現Maintain the soundness of civil engineering structures and extend their life.
部材そのものの取替え等を実施 ※3Conduct renovation such as replacement of materials, etc.※3
■ 工事の種別 Content of Work
大規模改修引当金 取崩し(10年)Appropriation of reserves (10 years)3,500億円(350億円/年)350 billion yen (35 billion yen per year)
令和5(2023)年3月2023.3
平成25(2013)年4月2013.4
工事着手Renovation
平成25(2013)年3月2013.3
平成14(2002)年10月2002.10
大規模改修引当金 積立て(10.5年)Reserves for reinforcement (10.5years)3,500億円(333億円/年)350 billion yen (33.3 billion yen per year)
営業費の減Decrease in Operating Expenses
営業費の増Increase in Operating Expenses
トンネル Tunnels
コンクリート橋 Concrete Viaducts and Bridges
鋼橋 Steel Bridges
■ 大規模改修工事の主な内容 Concrete Example of Renovation Work
■ 大規模改修引当金の枠組み Framework of the Large-scale Renovation Allowance
変状発生抑止対策 Measures to Inhibit Aging Damage
全般的改修 Overall Renovation
1床組接合部 補強Reinforcement of connection with floorbeam and stringer
1
支承部 取替・補強Replacement / Reinforcement of shoe
1
床組接合部 補強Reinforcement of connection with floorbeam and stringer
1
1
はね出し部 Cantilever鋼板による被覆Cladding with steel plates1
1
1
1
2
2
桁 取替Replacement of floorbeam
2桁 取替Replacement of stringer
2桁 取替Replacement of floorbeam
2桁 取替Replacement of stringer
2
1
2
注 3.具体的な施工時期は、「変状発生抑止対策」を施工後構造物の状態を観察し、個別に判断
Notes: 3.The specific time of commencement will be separately determined taking into consideration the state of the structures after the implementation of the Measures to Inhibit Aging Damage.
注 2.平成28(2016)~令和元(2019)年度 設備投資額1,450億円(予定) Notes: 2.FY2016 - FY2019 Related Capital Investment 145.0 billion yen (planned)
注 1.全国新幹線鉄道整備法に基づく新幹線鉄道大規模改修引当金積立計画を策定し、国土交通大臣の承認を受け、平成14(2002)年から引当金を積立て
Notes: 1.Formulated the allowance reserve plan for the large-scale renovation of the Shinkansen infrastructure based on the Nationwide Shinkansen Railway Development Act and had reserved the allowance since 2002 with the approval by the Minister of Land, Infrastructure, Transport and Tourism.
■ 大規模改修工事・設備投資額実績 Capital Investment of the Large-scale Renovation
設備投資額 Related Capital Investment
うち営業費計上分 Of which amount posted to Operating Expenses
(10億円 ¥ billion)
9.5
6.9
平成25年度 FY2013
30.2
19.5
26年度 FY2014
35.5
24.1
27年度 FY2015
34.0
23.3
28年度 FY2016
36.3
24.6
29年度 FY2017
36.1
24.9
30年度 FY2018
34.0
23.3
令和元年度(予定) FY2019(Planned)
東海道新幹線大規模改修工事の概要 Summary of the Large-scale Renovation of the Tokaido Shinkansen8
事業概要 Overview 鉄道事業 Railway Business 関連事業 Affiliated Businesses 財務・経営 Financial and Managerial Data 沿革 History
100
69
100
71
1,242 1,2651,222 1,222 1,222 1,222988
440
936
465
919
469
918
481
877
490
850
542
748
626
733
639
698
775
517
881
480
887
432
885
426
885
426
885
425
885
408
888
272
1,091
153
1,112
127
1,112
127
1,112
107
1,166
107
1,210
50
1,242
8782
80
136 136
77 7472 69 66 6869
6456 54
50 53 55 53 56 56 57 55
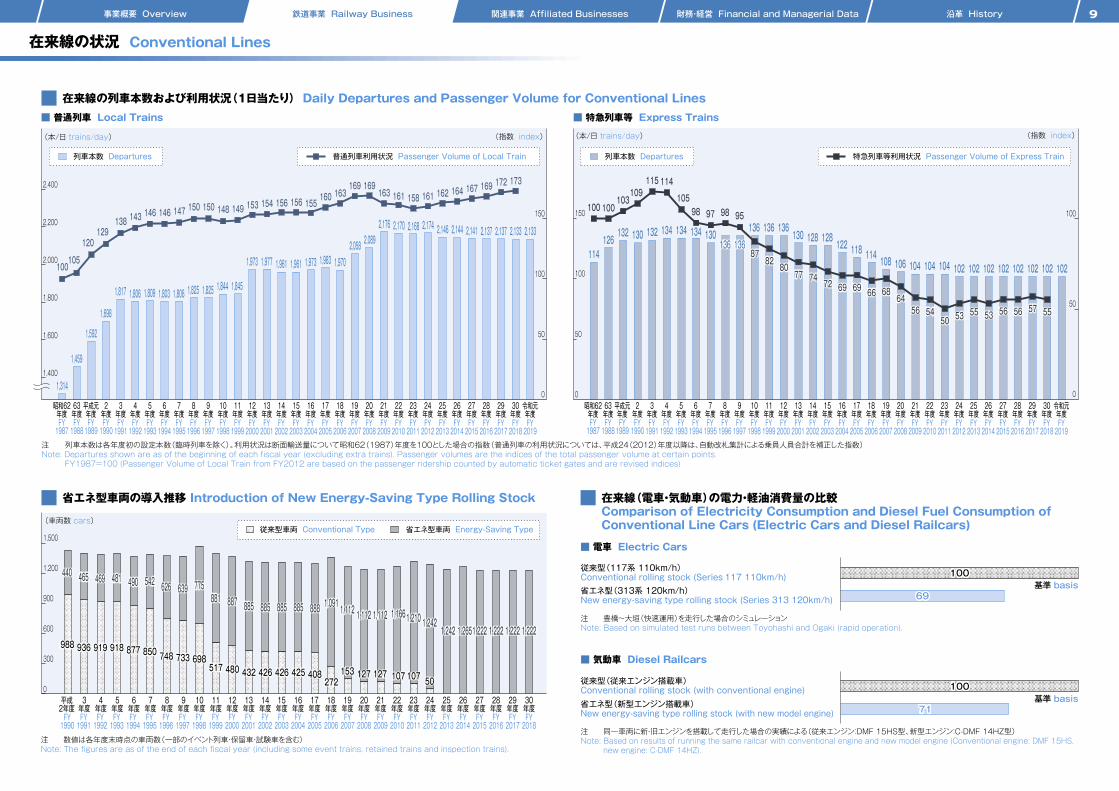
在来線の列車本数および利用状況(1日当たり) Daily Departures and Passenger Volume for Conventional Lines
省エネ型車両の導入推移 Introduction of New Energy-Saving Type Rolling Stock 在来線(電車・気動車)の電力・軽油消費量の比較Comparison of Electricity Consumption and Diesel Fuel Consumption of Conventional Line Cars (Electric Cars and Diesel Railcars)
従来型(117系 110km/h) Conventional rolling stock (Series 117 110km/h)省エネ型(313系 120km/h) New energy-saving type rolling stock (Series 313 120km/h)
100
69
従来型(従来エンジン搭載車)Conventional rolling stock (with conventional engine)省エネ型(新型エンジン搭載車)New energy-saving type rolling stock (with new model engine)
100
71
基準 basis
基準 basis
■ 電車 Electric Cars
■ 気動車 Diesel Railcars
注 豊橋~大垣(快速運用)を走行した場合のシミュレーションNote: Based on simulated test runs between Toyohashi and Ogaki (rapid operation).
注 同一車両に新・旧エンジンを搭載して走行した場合の実績による(従来エンジン:DMF 15HS型、新型エンジン:C-DMF 14HZ型)Note: Based on results of running the same railcar with conventional engine and new model engine (Conventional engine: DMF 15HS,
new engine: C-DMF 14HZ).
注 列車本数は各年度初の設定本数(臨時列車を除く)。利用状況は断面輸送量について昭和62(1987)年度を100とした場合の指数(普通列車の利用状況については、平成24(2012)年度以降は、自動改札集計による乗員人員合計を補正した指数)Note: Departures shown are as of the beginning of each fiscal year (excluding extra trains). Passenger volumes are the indices of the total passenger volume at certain points. FY1987=100 (Passenger Volume of Local Train from FY2012 are based on the passenger ridership counted by automatic ticket gates and are revised indices)
100
1,314
105
120129
138 143146 146 147 150 150 149 153148
1,459
1,592
1,698
1,817 1,806 1,809 1,803 1,806 1,825 1,825 1,844 1,845
1,973 1,977 1,961 1,961 1,973 1,983 1,9702,058
154 156 156 155160 163
169 169163 161 158 161
100
114 114 108
100103
109115 114
10598 97 98 95
8782
80
126132 130 132 134 134 134 130
136 136136 136
130 128 128 122136
■ 特急列車等 Express Trains
77 7472 69 66 6869
■ 普通列車 Local Trains
118106
6456 54
50 53
104 104
2,0892,176 2,170 2,168 2,174 2,146
104 102 102
55 53 56
102
昭和62年度
63年度
平成元年度
2年度
3年度
4年度
5年度
6年度
7年度
8年度
9年度
10年度
11年度
12年度
13年度
14年度
15年度
16年度
17年度
18年度
19年度
20年度
21年度
FY1988
FY1987
FY1989
FY1990
FY1991
FY1992
FY1993
FY1994
FY1995
FY1996
FY1997
FY1998
FY1999
FY2000
FY2001
FY2002
FY2003
FY2004
FY2005
FY2006
FY2007
FY2008
FY2009
22年度FY2010
23年度FY2011
24年度FY2012
25年度FY2013
26年度FY2014
27年度FY2015
28年度FY2016
29年度FY2017
102 102
56
102
30年度FY2018
57 55
102
令和元年度FY2019
102
162 164 167169
2,144 2,141 2,137 2,137
30年度FY2018
172 173
2,133
令和元年度FY2019
2,133
1,400
1,600
1,800
2,200
2,400
2,000
0
50
100
150
(本/日 trains/day) (指数 index) (指数 index)
0
50
100
150
50
100
0
(本/日 trains/day)
注 数値は各年度末時点の車両数(一部のイベント列車・保留車・試験車を含む)Note: The figures are as of the end of each fiscal year (including some event trains, retained trains and inspection trains).
省エネ型車両 Energy-Saving Type従来型車両 Conventional Type(車両数 cars)
平成2年度
3年度
4年度
5年度
6年度
7年度
8年度
9年度
10年度
11年度
12年度
13年度
14年度
15年度
16年度
17年度
18年度
19年度
20年度
21年度
FY1991
FY1992
FY1990
FY1993
FY1994
FY1995
FY1996
FY1997
FY1998
FY1999
FY2000
FY2001
FY2002
FY2003
FY2004
FY2005
FY2006
FY2007
FY2008
FY2009
22年度FY2010
23年度FY2011
24年度FY2012
25年度FY2013
26年度FY2014
27年度FY2015
1,242 1,2651,222
28年度FY2016
1,222
29年度FY2017
1,222
30年度FY2018
1,222
0
1,500
1,200
900
600
300
988
440
936
465
919
469
918
481
877
490
850
542
748
626
733
639
698
775
517
881
480
887
432
885
426
885
426
885
425
885
408
888
272
1,091
153
1,112
127
1,112
127
1,112
107
1,166
107
1,210
50
1,242
列車本数 Departures 普通列車利用状況 Passenger Volume of Local Train 列車本数 Departures 特急列車等利用状況 Passenger Volume of Express Train
在来線の状況 Conventional Lines
9
事業概要 Overview 鉄道事業 Railway Business 関連事業 Affiliated Businesses 財務・経営 Financial and Managerial Data 沿革 History
安全・安定輸送の確保Ensuring Safe and Reliable Transportation
輸送サービスの充実Enhancing Transportation Service
(新幹線・在来線)(Shinkansen and Conventional Lines)
超電導リニアによる中央新幹線計画Chuo Shinkansen Project (Maglev)
大規模改修工事 Large-scale renovation
東海道新幹線 The Tokaido Shinkansen
在来線 Conventional Lines
脱線・逸脱防止対策 Implementing countermeasures to derailment / deviation
令和10(2028)年度目処に全線への対策工事を完了 Scheduled to complete construction for derailment and deviation countermeasures in all lines by FY2028
平成31(2019)年3月以降新幹線駅改札口の電光掲示板を順次リニューアル(予定)(のぞみ停車駅は令和元(2019)年度中に完了予定)Sequential upgrades of electronic message boards of ticketing gates in Shinkansen stations after March, 2019 ("Nozomi" stopping stations are planned to complete in FY2019)
名古屋工場耐震化等の地震対策 Countermeasures for earthquakes, such as quake-resistant reinforcement work for the Nagoya Workshop
ハイブリッド方式による次期特急車両の新製New production of the next-generation rolling stock for Express trains using hybrid system
試験走行車の新製Production of test running vehicles
お客様にご提供する運行情報の充実 Enhancement of providing operating information to customers
駅の天井の地震対策 Earthquake-resistant measures on ceiling of stations
量産車の投入(検討中)Considering installation of production vehicles
N700A新製Introduction of N700A rolling stock
既存車両にN700A(3次車)の特長を反映させる改造工事Conducting enhancement work to reflect features of the N700A (3rd edition) on existing rolling stock
N700S確認試験車による走行試験Conducting running tests using N700S validation test vehicles
次期営業車両(量産車)の投入(予定)Launching N700S commercial vehicles (production vehicles) (planned)
中央新幹線 品川・名古屋間工事 Chuo Shinkansen construction between Shinagawa and Nagoya
平成30(2018)年度以前FY2018 and Previous Years
令和元(2019)年度FY2019
令和2(2020)年度FY2020
令和3(2021)年度FY2021
令和4(2022)年度FY2022
令和5(2023)年度FY2023
令和6(2024)年度FY2024
令和7(2025)年度FY2025
令和8(2026)年度FY2026
令和9(2027)年度FY2027
令和10(2028)年度FY2028
主な施策の展望 Future Expectation of Key Measures10
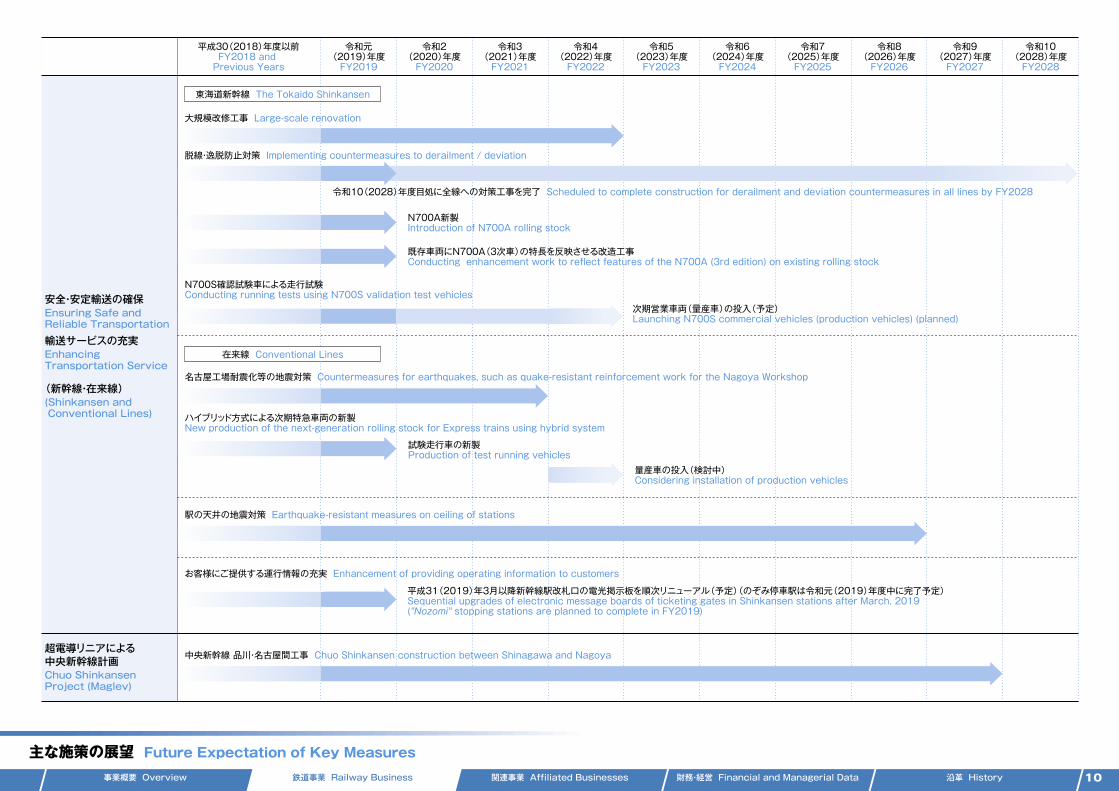
事業概要 Overview 鉄道事業 Railway Business 関連事業 Affiliated Businesses 財務・経営 Financial and Managerial Data 沿革 History
100
69
100
71
1,242 1,2651,222 1,222 1,222 1,222988
440
936
465
919
469
918
481
877
490
850
542
748
626
733
639
698
775
517
881
480
887
432
885
426
885
426
885
425
885
408
888
272
1,091
153
1,112
127
1,112
127
1,112
107
1,166
107
1,210
50
1,242
8782
80
136 136
77 7472 69 66 6869
6456 54
50 53 55 53 56 56 57 55
在来線の列車本数および利用状況(1日当たり) Daily Departures and Passenger Volume for Conventional Lines
省エネ型車両の導入推移 Introduction of New Energy-Saving Type Rolling Stock 在来線(電車・気動車)の電力・軽油消費量の比較Comparison of Electricity Consumption and Diesel Fuel Consumption of Conventional Line Cars (Electric Cars and Diesel Railcars)
従来型(117系 110km/h) Conventional rolling stock (Series 117 110km/h)省エネ型(313系 120km/h) New energy-saving type rolling stock (Series 313 120km/h)
100
69
従来型(従来エンジン搭載車)Conventional rolling stock (with conventional engine)省エネ型(新型エンジン搭載車)New energy-saving type rolling stock (with new model engine)
100
71
基準 basis
基準 basis
■ 電車 Electric Cars
■ 気動車 Diesel Railcars
注 豊橋~大垣(快速運用)を走行した場合のシミュレーションNote: Based on simulated test runs between Toyohashi and Ogaki (rapid operation).
注 同一車両に新・旧エンジンを搭載して走行した場合の実績による(従来エンジン:DMF 15HS型、新型エンジン:C-DMF 14HZ型)Note: Based on results of running the same railcar with conventional engine and new model engine (Conventional engine: DMF 15HS,
new engine: C-DMF 14HZ).
注 列車本数は各年度初の設定本数(臨時列車を除く)。利用状況は断面輸送量について昭和62(1987)年度を100とした場合の指数(普通列車の利用状況については、平成24(2012)年度以降は、自動改札集計による乗員人員合計を補正した指数)Note: Departures shown are as of the beginning of each fiscal year (excluding extra trains). Passenger volumes are the indices of the total passenger volume at certain points. FY1987=100 (Passenger Volume of Local Train from FY2012 are based on the passenger ridership counted by automatic ticket gates and are revised indices)
100
1,314
105
120129
138 143146 146 147 150 150 149 153148
1,459
1,592
1,698
1,817 1,806 1,809 1,803 1,806 1,825 1,825 1,844 1,845
1,973 1,977 1,961 1,961 1,973 1,983 1,9702,058
154 156 156 155160 163
169 169163 161 158 161
100
114 114 108
100103
109115 114
10598 97 98 95
8782
80
126132 130 132 134 134 134 130
136 136136 136
130 128 128122
136
■ 特急列車等 Express Trains
77 7472 69 66 6869
■ 普通列車 Local Trains
118106
6456 54
50 53
104 104
2,0892,176 2,170 2,168 2,174 2,146
104 102 102
55 53 56
102
昭和62年度
63年度
平成元年度
2年度
3年度
4年度
5年度
6年度
7年度
8年度
9年度
10年度
11年度
12年度
13年度
14年度
15年度
16年度
17年度
18年度
19年度
20年度
21年度
FY1988
FY1987
FY1989
FY1990
FY1991
FY1992
FY1993
FY1994
FY1995
FY1996
FY1997
FY1998
FY1999
FY2000
FY2001
FY2002
FY2003
FY2004
FY2005
FY2006
FY2007
FY2008
FY2009
22年度FY2010
23年度FY2011
24年度FY2012
25年度FY2013
26年度FY2014
27年度FY2015
28年度FY2016
29年度FY2017
昭和62年度
63年度
平成元年度
2年度
3年度
4年度
5年度
6年度
7年度
8年度
9年度
10年度
11年度
12年度
13年度
14年度
15年度
16年度
17年度
18年度
19年度
20年度
21年度
FY1988
FY1987
FY1989
FY1990
FY1991
FY1992
FY1993
FY1994
FY1995
FY1996
FY1997
FY1998
FY1999
FY2000
FY2001
FY2002
FY2003
FY2004
FY2005
FY2006
FY2007
FY2008
FY2009
22年度FY2010
23年度FY2011
24年度FY2012
25年度FY2013
26年度FY2014
27年度FY2015
28年度FY2016
29年度FY2017
102 102
56
102
30年度FY2018
57 55
102
令和元年度FY2019
102
162 164 167169
2,144 2,141 2,137 2,137
30年度FY2018
172 173
2,133
令和元年度FY2019
2,133
1,400
1,600
1,800
2,200
2,400
2,000
0
50
100
150
(本/日 trains/day) (指数 index) (指数 index)
0
50
100
150
50
100
0
(本/日 trains/day)
注 数値は各年度末時点の車両数(一部のイベント列車・保留車・試験車を含む)Note: The figures are as of the end of each fiscal year (including some event trains, retained trains and inspection trains).
省エネ型車両 Energy-Saving Type従来型車両 Conventional Type(車両数 cars)
平成2年度
3年度
4年度
5年度
6年度
7年度
8年度
9年度
10年度
11年度
12年度
13年度
14年度
15年度
16年度
17年度
18年度
19年度
20年度
21年度
FY1991
FY1992
FY1990
FY1993
FY1994
FY1995
FY1996
FY1997
FY1998
FY1999
FY2000
FY2001
FY2002
FY2003
FY2004
FY2005
FY2006
FY2007
FY2008
FY2009
22年度FY2010
23年度FY2011
24年度FY2012
25年度FY2013
26年度FY2014
27年度FY2015
1,242 1,2651,222
28年度FY2016
1,222
29年度FY2017
1,222
30年度FY2018
1,222
0
1,500
1,200
900
600
300
988
440
936
465
919
469
918
481
877
490
850
542
748
626
733
639
698
775
517
881
480
887
432
885
426
885
426
885
425
885
408
888
272
1,091
153
1,112
127
1,112
127
1,112
107
1,166
107
1,210
50
1,242
列車本数 Departures 普通列車利用状況 Passenger Volume of Local Train 列車本数 Departures 特急列車等利用状況 Passenger Volume of Express Train
在来線の状況 Conventional Lines
9
事業概要 Overview 鉄道事業 Railway Business 関連事業 Affiliated Businesses 財務・経営 Financial and Managerial Data 沿革 History
安全・安定輸送の確保Ensuring Safe and Reliable Transportation
輸送サービスの充実Enhancing Transportation Service
(新幹線・在来線)(Shinkansen and Conventional Lines)
超電導リニアによる中央新幹線計画Chuo Shinkansen Project (Maglev)
大規模改修工事 Large-scale renovation
東海道新幹線 The Tokaido Shinkansen
在来線 Conventional Lines
脱線・逸脱防止対策 Implementing countermeasures to derailment / deviation
令和10(2028)年度目処に全線への対策工事を完了 Scheduled to complete construction for derailment and deviation countermeasures in all lines by FY2028
平成31(2019)年3月以降新幹線駅改札口の電光掲示板を順次リニューアル(予定)(のぞみ停車駅は令和元(2019)年度中に完了予定)Sequential upgrades of electronic message boards of ticketing gates in Shinkansen stations after March, 2019 ("Nozomi" stopping stations are planned to complete in FY2019)
名古屋工場耐震化等の地震対策 Countermeasures for earthquakes, such as quake-resistant reinforcement work for the Nagoya Workshop
ハイブリッド方式による次期特急車両の新製New production of the next-generation rolling stock for Express trains using hybrid system
試験走行車の新製Production of test running vehicles
お客様にご提供する運行情報の充実 Enhancement of providing operating information to customers
駅の天井の地震対策 Earthquake-resistant measures on ceiling of stations
量産車の投入(検討中)Considering installation of production vehicles
N700A新製Introduction of N700A rolling stock
既存車両にN700A(3次車)の特長を反映させる改造工事Conducting enhancement work to reflect features of the N700A (3rd edition) on existing rolling stock
N700S確認試験車による走行試験Conducting running tests using N700S validation test vehicles
次期営業車両(量産車)の投入(予定)Launching N700S commercial vehicles (production vehicles) (planned)
中央新幹線 品川・名古屋間工事 Chuo Shinkansen construction between Shinagawa and Nagoya
平成30(2018)年度以前FY2018 and Previous Years
令和元(2019)年度FY2019
令和2(2020)年度FY2020
令和3(2021)年度FY2021
令和4(2022)年度FY2022
令和5(2023)年度FY2023
令和6(2024)年度FY2024
令和7(2025)年度FY2025
令和8(2026)年度FY2026
令和9(2027)年度FY2027
令和10(2028)年度FY2028
主な施策の展望 Future Expectation of Key Measures10
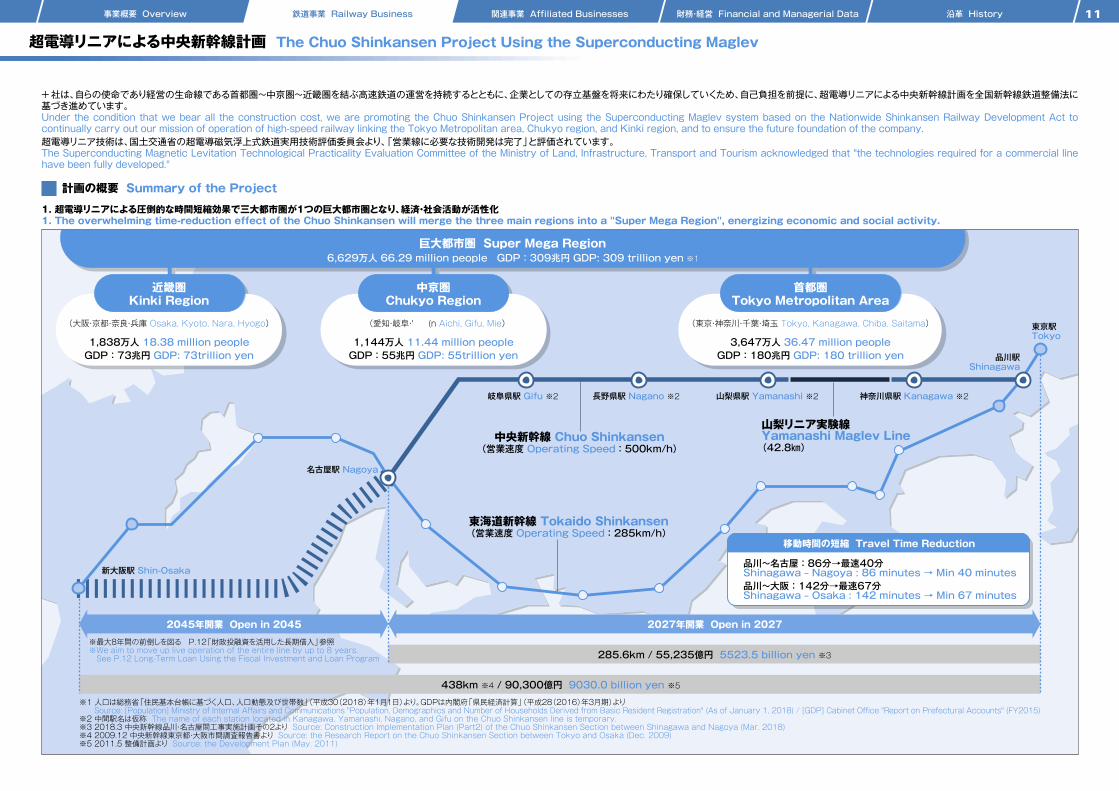
事業概要 Overview 鉄道事業 Railway Business 関連事業 Affiliated Businesses 財務・経営 Financial and Managerial Data 沿革 History
1. 超電導リニアによる圧倒的な時間短縮効果で三大都市圏が1つの巨大都市圏となり、経済・社会活動が活性化1. The overwhelming time-reduction effect of the Chuo Shinkansen will merge the three main regions into a "Super Mega Region", energizing economic and social activity.
計画の概要 Summary of the Project
超電導リニアによる中央新幹線計画 The Chuo Shinkansen Project Using the Superconducting Maglev
11
当社は、自らの使命であり経営の生命線である首都圏~中京圏~近畿圏を結ぶ高速鉄道の運営を持続するとともに、企業としての存立基盤を将来にわたり確保していくため、自己負担を前提に、超電導リニアによる中央新幹線計画を全国新幹線鉄道整備法に基づき進めています。Under the condition that we bear all the construction cost, we are promoting the Chuo Shinkansen Project using the Superconducting Maglev system based on the Nationwide Shinkansen Railway Development Act to continually carry out our mission of operation of high-speed railway linking the Tokyo Metropolitan area, Chukyo region, and Kinki region, and to ensure the future foundation of the company.超電導リニア技術は、国土交通省の超電導磁気浮上式鉄道実用技術評価委員会より、「営業線に必要な技術開発は完了」と評価されています。The Superconducting Magnetic Levitation Technological Practicality Evaluation Committee of the Ministry of Land, Infrastructure, Transport and Tourism acknowledged that "the technologies required for a commercial line have been fully developed."
新大阪駅 Shin-Osaka
名古屋駅 Nagoya
岐阜県駅 Gifu ※2 長野県駅 Nagano ※2 山梨県駅 Yamanashi ※2
山梨リニア実験線Yamanashi Maglev Line(42.8㎞)
神奈川県駅 Kanagawa ※2
品川駅Shinagawa
東京駅Tokyo
移動時間の短縮 Travel Time Reduction
品川~名古屋 : 86分→最速40分Shinagawa ‒ Nagoya : 86 minutes → Min 40 minutes品川~大阪 : 142分→最速67分Shinagawa ‒ Osaka : 142 minutes → Min 67 minutes
2027年開業 Open in 2027
中央新幹線 Chuo Shinkansen(営業速度 Operating Speed : 500km/h)
東海道新幹線 Tokaido Shinkansen(営業速度 Operating Speed : 285km/h)
2045年開業 Open in 2045
※最大8年間の前倒しを図る P.12「財政投融資を活用した長期借入」参照※We aim to move up live operation of the entire line by up to 8 years. See P.12 Long-Term Loan Using the Fiscal Investment and Loan Program 285.6km / 55,235億円 5523.5 billion yen ※3
438km ※4 / 90,300億円 9030.0 billion yen ※5
近畿圏Kinki Region
中京圏Chukyo Region
首都圏Tokyo Metropolitan Area
(大阪・京都・奈良・兵庫 Osaka, Kyoto, Nara, Hyogo) (愛知・岐阜・三重 Aichi, Gifu, Mie) (東京・神奈川・千葉・埼玉 Tokyo, Kanagawa, Chiba, Saitama)
1,838万人 18.38 million peopleGDP : 73兆円 GDP: 73trillion yen
1,144万人 11.44 million peopleGDP : 55兆円 GDP: 55trillion yen
3,647万人 36.47 million peopleGDP : 180兆円 GDP: 180 trillion yen
巨大都市圏 Super Mega Region6,629万人 66.29 million people GDP : 309兆円 GDP: 309 trillion yen ※1
※1 人口は総務省「住民基本台帳に基づく人口、人口動態及び世帯数」(平成30(2018)年1月1日)より。GDPは内閣府「県民経済計算」(平成28(2016)年3月期)より Source: [Population] Ministry of Internal Affairs and Communications "Population, Demographics and Number of Households Derived from Basic Resident Registration" (As of January 1, 2018) / [GDP] Cabinet Office "Report on Prefectural Accounts" (FY2015)※2 中間駅名は仮称 The name of each station located in Kanagawa, Yamanashi, Nagano, and Gifu on the Chuo Shinkansen line is temporary.※3 2018.3 中央新幹線品川・名古屋間工事実施計画その2より Source: Construction Implementation Plan (Part2) of the Chuo Shinkansen Section between Shinagawa and Nagoya (Mar. 2018)※4 2009.12 中央新幹線東京都・大阪市間調査報告書より Source: the Research Report on the Chuo Shinkansen Section between Tokyo and Osaka (Dec. 2009)※5 2011.5 整備計画より Source: the Development Plan (May. 2011)
12
SNS SSN
NNS
S
超電導リニアシステム※では、車両はガイドウェイに設置された浮上・案内コイルの作用(強固な磁気ばね)で支えられ、かつ常にガイドウェイ中央に安定して保持されるようになっているため脱線することはありません。 Thanks to the Superconducting Maglev system※ where railcars are always kept at the center of the guide way by magnetic power generated by levitation and guidance coils, they won’t derail.
超電導リニアの安全性 The safety of Superconducting Maglev
財政投融資を活用した長期借入 Long-Term Loan Using the Fiscal Investment and Loan Program (FILP)
■ 地震時も脱線を防止 Preventing derailment even in case of earthquakes
超電導リニアは、浮上のための電力を外部から供給する必要はありません。車両が一定以上の速度で走行していれば、浮上力が常に生じているため、停電時にも車両は急に地面に落下することなく安全に停止します。Superconducting Maglev can float without power supply from outside. While the cars run faster than a certain speed, levitation force continues to be generated. Therefore, in case of power outage, they can safely stop without falling onto the track.
中央新幹線の建設の推進のため、財政投融資を活用した長期借入の申請を独立行政法人鉄道建設・運輸施設整備支援機構に対して行い、総額3兆円の借入を2017年7月に完了しました。これによる当社のメリットは、以下3つの経営リスクの低減です。To promote the construction of the Chuo Shinkansen, we applied to Japan Railway Construction, Transport and Technology Agency for long-term loan Using the Fiscal Investment and Loan Program and borrowed 3 trillion yen in July 2017. The benefit is to mitigate following three managerial risks.
2010年に国土交通省の交通政策審議会に提出した資料では、名古屋開業後に8年間、経営体力を回復するための期間を設け、長期債務を一定程度縮減した後、名古屋・大阪間の工事に着手する見通しとしていましたが、この財投借入の活用により、この経営体力の回復期間を短縮し、最大8年前倒しを目指して建設を推進します。なお、建設費を全額自己負担し民間企業としての経営の自由、投資の自主性を確保し、将来にわたり健全経営・安定配当を堅持するという前提は変わりません。Under the original plan we submitted to the Transport Policy Council of the Ministry of Land, Infrastructure, Transport and Tourism in 2010, we indicated in our outlook that a period of 8 years after live operation between Shinagawa and Nagoya will be set to recover management strength. After reducing long-term debt by a certain amount, construction on the route between Nagoya and Osaka will be initiated. However, by utilizing this FILP Loan, we aim to reduce this period, thereby moving up live operation of the entire line by up to 8 years. This does not change the premise that we, as a private-sector corporation, cover all the construction cost, while securing autonomy in management and investment and seeing that sound management and stable dividends are strictly maintained also in the future.
1. 金利上昇リスクの回避 : 平均利率は全期間固定の0.86%1. Interest-rate increase risk : The weighted average rate is 0.86%, fixed throughout the entire period.2. 資金調達リスクの低減 : 品川・名古屋間の建設費約5.5兆円のうち新たに借入れが必要と見込まれる約3兆円を、今後の経済・金利変動の影響を受けることなく確保
2. Financing risk : Under the original plan, roughly 3 trillion yen out of 5.5 trillion yen for construction cost for the route between Shinagawa and Nagoya, was expected to require new financing. However, we secured the amount through the FILP Loan, thanks to which we avoid being impacted by future fluctuation of economic conditions or interest rate.
3. 償還リスクの低減 : 中央新幹線の工事期間の後に財投借入の償還時期を迎えるため、全線開業後に得られる営業キャッシュフローを積み上げて債務の償還に備えることが可能に
3. Redemption Risk : Since the FILP Loan matures after the construction period of the Chuo Shinkansen, we will be able to build up cash from its full operation to provide for the redemption of liabilities,
■ 停電時も安全に停止 Safely stopping even in case of power outage
浮上・案内コイルLevitation and Guidance Coils
• 開業以来50年以上経過する東海道新幹線の経年劣化に備える We prepare for aging of the Tokaido Shinkansen which has operated more than five decades.• 巨大地震等の大規模災害に対して抜本的な備えが必要 We require drastic countermeasures against large-scale natural disasters including heavy earthquakes.
南海トラフ巨大地震の想定震度の最大値の分布図Distribution map of the estimated biggest seismic intensity of the Eastern Nankai Trough Large Earthquake
3. 東京~名古屋~大阪の直行輸送が相当程度中央新幹線に移ることで、東海道新幹線の活用可能性が拡がる3. Significant portion of "Nozomi" users will shift from the Tokaido Shinaksen to the Chuo shikansen, which enables more flexible use of the Tokaido Shinkansen.
2. 超電導リニアによる中央新幹線の実現により、東京・名古屋・大阪の日本の大動脈輸送の二重系化を実現し、将来のリスク発生に備える2. We will duplicate our artery transportation system linking Tokyo, Nagoya, and Osaka with the Chuo Shinkansen, thereby preparing for future risk.
出典 中央防災会議「南海トラフ巨大地震対策について(最終報告)」(2013年5月)を元に作成Source: Prepared by JR Central based on “Countermeasure against Eastern Nankai Trough Large Earthquake (Final Report)” (May. 2013)
※ 超電導リニアの原理についてはこちらをご覧ください。 URL https://linear-chuo-shinkansen.jr-central.co.jp/about/ ※ The principles of the Superconducting Maglev system can be found at the following URL. URL https://scmaglev.jr-central-global.com/about/
震度階級Seismic intensity class
76強 6 upper6弱 6 lower5強 5 upper5弱 5 lower
4 現行Present
運行本数のイメージ Image of the Number of Operations
中央新幹線全線開業後After starting the operation of the Chuo Shinkansen's entire line
のぞみ(全列車)停車駅 Stations that Nozomi, Hikari, and Kodama stop
ひかり・こだま停車駅 Stations that Hikari and/or Kodama stop
新大阪 Shin-Os
aka
京都 Kyoto
米原 Maib
ara
岐阜羽島 Gifu-Hashim
a名古屋 Nagoya
三河安城 Mika
wa-Anjo
豊橋 Toyohashi
浜松 Ham
amatsu
掛川 Kakegaw
a静岡 Shiz
uoka
新富士 Shin
-Fuji
三島 Mish
ima
熱海 Atami
小田原 Odawa
ra
新横浜 Shin-Os
aka
品川 Shinagawa
東京 Tokyo
のぞみ Nozomi ひかり・こだま Hikari and/or Kodama
のぞみ Nozomi ひかり・こだま Hikari and/or Kodama
既計画Original plan
前倒しRevisedplan
最大8年前倒しMoving forward by up to 8 years
財投を活用した長期借入FILP borrowing
品川・名古屋間の工事Construction on the route between Shinagawa and Nagoya
品川・名古屋間の工事Construction on the route between Shinagawa and Nagoya
2027年 2027
経営体力 回復期間(8年間)Management strength recovery period(8 years)
名古屋・大阪間の工事Construction on the route between Nagoya and Osaka
名古屋・大阪間の工事Construction on the route between Nagoya and Osaka
大阪開業Operation of the entire line
大阪開業Operation of the entire line
約30年間 固定・低利で据置き Fixed and low interest rate for about 30 years
約10年間元金均等償還Equal repayment of the principal for about 10 years
中央新幹線 Chuo Shinkansen
新大阪駅Shin-Osaka新大阪駅Shin-Osaka
名古屋駅Nagoya名古屋駅Nagoya 品川駅
Shinagawa品川駅Shinagawa
中央新幹線 Chuo Shinkansen
東海道新幹線 Tokaido Shinkansen東海道新幹線 Tokaido Shinkansen
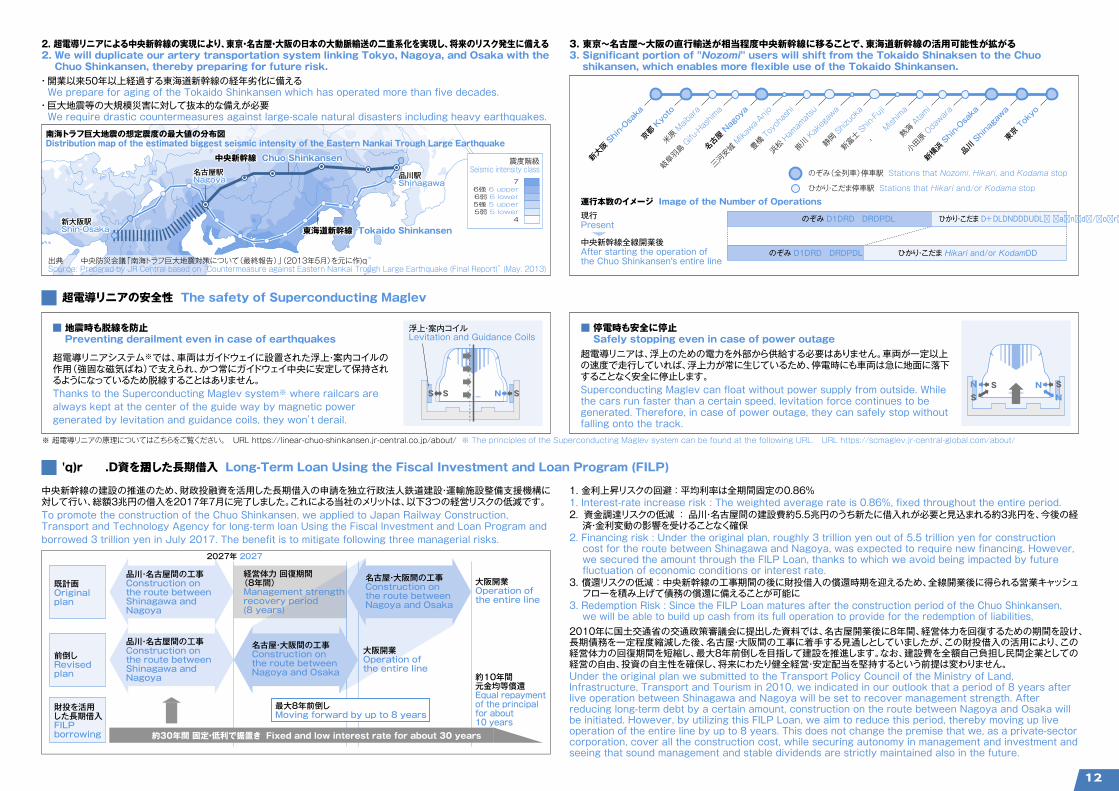
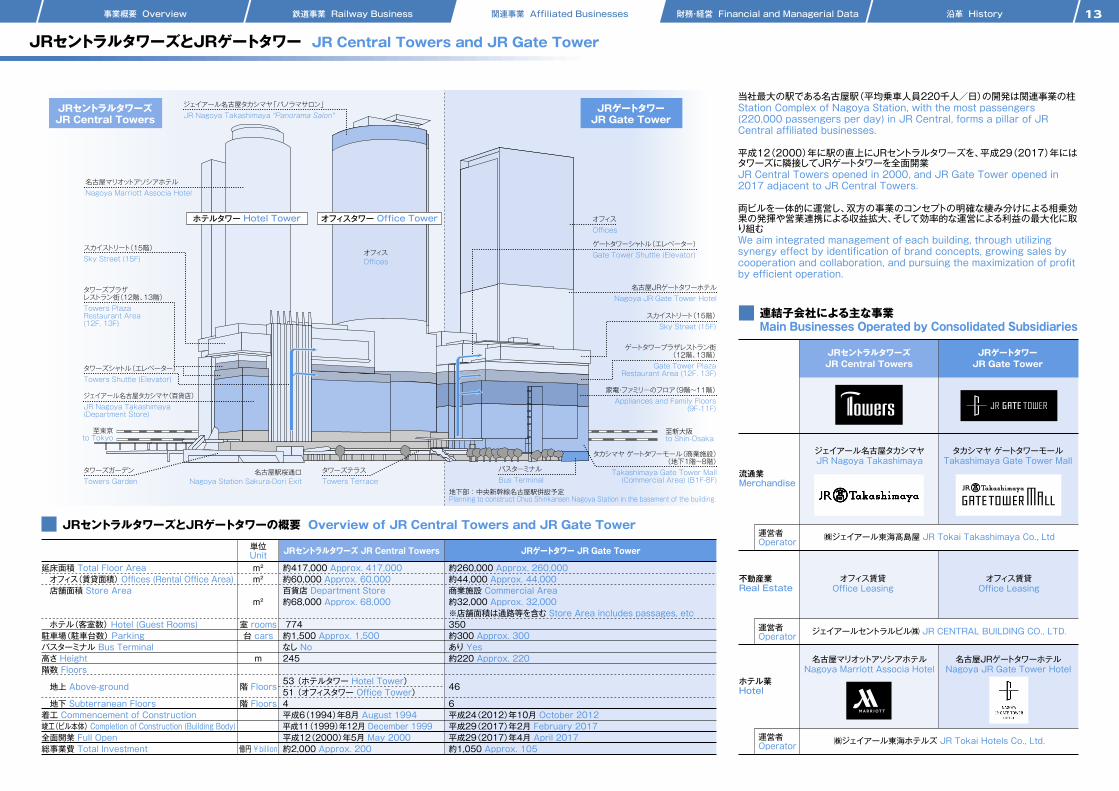
事業概要 Overview 鉄道事業 Railway Business 関連事業 Affiliated Businesses 財務・経営 Financial and Managerial Data 沿革 History
ジェイアール名古屋タカシマヤ(百貨店)JR Nagoya Takashimaya(Department Store)
タカシマヤ ゲートタワーモール(商業施設)(地下1階~8階)
Takashimaya Gate Tower Mall(Commercial Area) (B1F-8F)
タワーズテラスTowers Terrace
バスターミナルBus Terminal
地下部:中央新幹線名古屋駅併設予定Planning to construct Chuo Shinkansen Nagoya Station in the basement of the building.
オフィスOffices
タワーズガーデンTowers Garden
タワーズシャトル(エレベーター)Towers Shuttle (Elevator)
名古屋駅桜通口Nagoya Station Sakura-Dori Exit
至東京to Tokyo
至新大阪to Shin-Osaka
タワーズプラザレストラン街(12階、13階)Towers PlazaRestaurant Area(12F, 13F)
スカイストリート(15階)Sky Street (15F)
名古屋マリオットアソシアホテルNagoya Marriott Associa Hotel
オフィスタワー Office Towerホテルタワー Hotel Tower
ジェイアール名古屋タカシマヤ「パノラマサロン」JR Nagoya Takashimaya "Panorama Salon"
名古屋JRゲートタワーホテルNagoya JR Gate Tower Hotel
ゲートタワープラザレストラン街(12階、13階)
Gate Tower Plaza Restaurant Area (12F, 13F)
スカイストリート(15階)Sky Street (15F)
オフィスOffices
ゲートタワーシャトル(エレベーター)Gate Tower Shuttle (Elevator)
家電・ファミリーのフロア(9階~11階)Appliances and Family Floors
(9F-11F)
JRセントラルタワーズJR Central Towers
JRゲートタワーJR Gate Tower
延床面積 Total Floor Area オフィス(賃貸面積) Offices (Rental Office Area) 店舗面積 Store Area
ホテル(客室数) Hotel (Guest Rooms)駐車場(駐車台数) Parkingバスターミナル Bus Terminal高さ Height階数 Floors
地上 Above-ground
地下 Subterranean Floors着工 Commencement of Construction竣工(ビル本体) Completion of Construction (Building Body)全面開業 Full Open総事業費 Total Investment
JRセントラルタワーズ JR Central Towers JRゲートタワー JR Gate Tower
連結子会社による主な事業Main Businesses Operated by Consolidated Subsidiaries
JRセントラルタワーズとJRゲートタワーの概要 Overview of JR Central Towers and JR Gate Tower
当社最大の駅である名古屋駅(平均乗車人員220千人/日)の開発は関連事業の柱Station Complex of Nagoya Station, with the most passengers (220,000 passengers per day) in JR Central, forms a pillar of JR Central affiliated businesses.
平成12(2000)年に駅の直上にJRセントラルタワーズを、平成29(2017)年にはタワーズに隣接してJRゲートタワーを全面開業JR Central Towers opened in 2000, and JR Gate Tower opened in 2017 adjacent to JR Central Towers.
両ビルを一体的に運営し、双方の事業のコンセプトの明確な棲み分けによる相乗効果の発揮や営業連携による収益拡大、そして効率的な運営による利益の最大化に取り組むWe aim integrated management of each building, through utilizing synergy effect by identification of brand concepts, growing sales by cooperation and collaboration, and pursuing the maximization of profit by efficient operation.
流通業Merchandise
JRセントラルタワーズJR Central Towers
JRゲートタワーJR Gate Tower
不動産業Real Estate
ホテル業Hotel
ジェイアール名古屋タカシマヤJR Nagoya Takashimaya
運営者Operator
運営者Operator
運営者Operator
オフィス賃貸Office Leasing
名古屋マリオットアソシアホテルNagoya Marriott Associa Hotel
タカシマヤ ゲートタワーモールTakashimaya Gate Tower Mall
オフィス賃貸Office Leasing
名古屋JRゲートタワーホテルNagoya JR Gate Tower Hotel
㈱ジェイアール東海髙島屋 JR Tokai Takashimaya Co., Ltd
ジェイアールセントラルビル㈱ JR CENTRAL BUILDING CO., LTD.
㈱ジェイアール東海ホテルズ JR Tokai Hotels Co., Ltd.
m²m²
m²
室 rooms台 cars
m
階 Floors
階 Floors
億円 ¥ billion
単位Unit
JRセントラルタワーズとJRゲートタワー JR Central Towers and JR Gate Tower
13
約417,000 Approx. 417,000約60,000 Approx. 60,000百貨店 Department Store約68,000 Approx. 68,000
774約1,500 Approx. 1,500なし No245
53 (ホテルタワー Hotel Tower)51 (オフィスタワー Office Tower)4平成6(1994)年8月 August 1994平成11(1999)年12月 December 1999平成12(2000)年5月 May 2000約2,000 Approx. 200
約260,000 Approx. 260,000約44,000 Approx. 44,000商業施設 Commercial Area約32,000 Approx. 32,000※店舗面積は通路等を含む Store Area includes passages, etc350約300 Approx. 300あり Yes約220 Approx. 220
46
6平成24(2012)年10月 October 2012平成29(2017)年2月 February 2017平成29(2017)年4月 April 2017約1,050 Approx. 105
事業概要 Overview 鉄道事業 Railway Business 関連事業 Affiliated Businesses 財務・経営 Financial and Managerial Data 沿革 History
112.3
46.3
164.9
119.9
48.6
175.6
130.7
50.2
177.1
142.0
51.6
177.3
140.7
52.6
179.8
149.3
56.1
192.2
164.4
60.5
197.9
180.6
63.3
204.9
222.4
68.1
203.2
260.9 244.8
64.364.0
190.6 197.1
231.2
60.4
207.4
239.7
62.6
211.9
256.0
65.0
223.2
245.1
64.0
236.3
249.0
63.9
243.6
43.3 47.4 51.394.4 97.9 80.0
12.6
90.3
12.1
74.6
12.2
74.5
12.5
77.2
12.0
84.3
18.8108.1 108.3
108.9 105.6 100.8 99.4262.3
66.5
241.0
267.3
76.2
259.4
266.8
79.8
269.0
連結子会社営業収益の推移 Operating Revenues of Consolidated Subsidiaries
主な連結子会社一覧 JR Central's Main Consolidated Subsidiaries
385.0382.0369.3355.6335.0
210.1197.6199.9202.8217.3207.4
109.4105.7
62.057.652.6
4.543.34.7
4.747.45.4
5.051.35.6
5.0
94.4
6.1
4.9
97.9
6.4
80.0
12.6
6.5
90.3
12.1
6.5
74.6
12.2
7.0
74.5
12.5
7.1
77.2
12.0
7.4
84.3
18.8
7.5
108.1 108.3108.9 105.6 100.8 99.4
112.3
46.3
11.4
164.9
119.9
48.6
11.4
175.6
130.7
50.2
11.1
177.1
142.0
51.6
11.0
177.3
140.7
52.6
11.7
179.8
410.5
149.3
56.1
12.8
192.2
436.2
164.4
60.5
13.3
197.9
462.4
180.6
63.3
13.4
204.9
507.3
222.4
68.1
13.4
203.2
528.6 518.1
260.9 244.8
64.364.0
12.7 12.1
190.6 197.1
511.2
231.2
60.4
12.0
207.4
525.9
239.7
62.6
11.5
211.9
556.1
256.0
65.0
11.8
223.2
557.7
245.1
64.0
12.1
236.3
569.6
249.0
63.9
12.9
243.6その他Other
流通部門Merchandise and Other
不動産部門Real Estate
運輸部門Transportation
注 1.連結子会社の営業収益の単純合算 2.連結子会社数は各年度末時点
Notes: 1.Operating revenues of consolidated subsidiaries are simply aggregated. 2.The numbers of consolidated subsidiaries are as of the end of each fiscal year.
5 17 16 19 29 29 28 2930 30 313連結子会社数Number of
ConsolidatedSubsidiaries
平成元年度 2年度 3年度 4年度 5年度 6年度 7年度 8年度 9年度 10年度 12年度11年度 13年度 14年度 15年度 16年度 17年度 18年度 19年度 20年度FY1989 FY1990 FY1991 FY1992 FY1993 FY1994 FY1995 FY1996 FY1997 FY1998 FY1999 FY2001FY2000 FY2002 FY2003 FY2004 FY2005 FY2006 FY2007 FY2008 FY2009
21年度FY201022年度
FY201123年度
FY201224年度
FY201325年度
FY201426年度
FY201527年度
582.9
262.3
66.5
13.1
241.0
FY201628年度
平成29年度 FY2017
(10億円 ¥ billion)
(平成30(2018)年度末現在 As of the end of FY2018)
0
100
200
300
400
500
600
JRセントラルタワーズ開業JR Central Towers Opened
JRゲートタワー開業JR Gate Tower Opened
運輸 Transportation
流通 Merchandise and Other
不動産 Real Estate
その他 Other
社名 Company 主な事業内容 Main Business設立日 Date Established出資比率
Shareholding(%)
資本金(百万円)Capital (¥ million)
ジェイアール東海バス㈱ JR Tokai Bus Company
㈱ジェイアール東海髙島屋 JR Tokai Takashimaya Co., Ltd㈱ジェイアール東海パッセンジャーズ JR-CENTRAL PASSENGERS Co., Ltd.東海キヨスク㈱ Tokai Kiosk Companyジェイアール東海商事㈱ JR Tokai Corporation
ジェイアールセントラルビル㈱ JR CENTRAL BUILDING CO., LTD.ジェイアール東海不動産㈱ JR Tokai Real Estate Co., Ltd.新横浜ステーション開発㈱ Shin-Yokohama Station Development Co., Ltd.東京ステーション開発㈱ Tokyo Station Development Co., Ltd.名古屋ステーション開発㈱ Nagoya Station Area Development Corporationジェイアール東海関西開発㈱ JR Development and Management Corporation of Kansai
㈱ジェイアール東海ホテルズ JR Tokai Hotels Co., Ltd.㈱ジェイアール東海ツアーズ JR Tokai Tours㈱ジェイアール東海エージェンシー JR TOKAI AGENCY CO., LTD.日本車輌製造㈱ NIPPON SHARYO, LTD.ジェイアール東海建設㈱ JR TOKAI CONSTRUCTION Co., Ltd.中央リネンサプライ㈱ CHUOH LINEN SUPPLY Co, Ltd.日本機械保線㈱ The Japan Mechanised Works and Maintenance of Way Co. LTD東海交通機械㈱ Tokai Rolling Stock & Machinery Co., Ltd.
バス事業 Bus transportation
卸売・小売業(「JRセントラルタワーズ」内等での百貨店業等) Department store operations (JR Central Towers)小売業及び飲食業(車内・駅構内の物品販売及び飲食店営業) Merchandise sales and Food service in stations and on trains卸売・小売業(駅構内の物品販売) Merchandise sales in stations卸売・小売業(燃料・建築資材・各種機械器具等の販売) Sales of fuel, construction materials, and various equipment
駅ビル営業(「JRセントラルタワーズ」等の管理・運営等) Station building management (JR Central Towers)不動産事業(不動産賃貸・販売業等) Real estate leasing and Sales駅ビル営業(「新横浜中央ビル」の管理・運営等) Station building management駅ビル営業(「東京駅一番街」の管理・運営等) Station building management駅ビル営業(名古屋駅商業施設・「アピオ」「チャム」等の管理・運営等) Station building management駅ビル営業(「アスティ京都」の管理・運営等) Station building management
ホテル業(「名古屋マリオットアソシアホテル」他) Hotel operations旅行業 Travel service広告業 Advertising鉄道車両等製造業 Manufacturing of railway rolling stock建設業 Constructionリネンサプライ業(列車内等でのリネン用品の供給) On-board linen supply新幹線軌道の機械保守 Maintenance and inspection of Shinkansen track車両・機械設備の検査・修繕 Machinery maintenance and inspection of rolling stock
1,747
10,000998700100
45,00016,5009,3041,75048030
14,00049061
11,81030015010080
100.0
59.2100.0100.070.0
100.0100.0100.0100.0100.0100.0
100.070.090.051.2100.087.692.188.4
S63.3.1 March 1, 1988
H4.12.25 December 25, 1992S63.5.23 May 23, 1988S62.6.5 June 5, 1987S63.3.1 March 1, 1988
H6.6.9 June 9, 1994H13.3.27 March 27, 2001S62.6.15 June 15, 1987H17.1.5 January 5, 2005S63.3.8 March 8, 1988S63.6.8 June 8, 1988
H4.7.8 July 8, 1992H1.12.18 December 18, 1989S38.11.8 November 8, 1963M29.9.18 September 18, 1896S63.9.26 September 26, 1988S39.2.1 February 1, 1964S42.3.3 March 3, 1967S51.3.4 March 4, 1976
連結子会社の状況 Consolidated Subsidiaries14
617.1
267.3
76.2
14.0
259.4
FY201729年度
630.1
266.8
79.8
14.3
269.0
FY201830年度
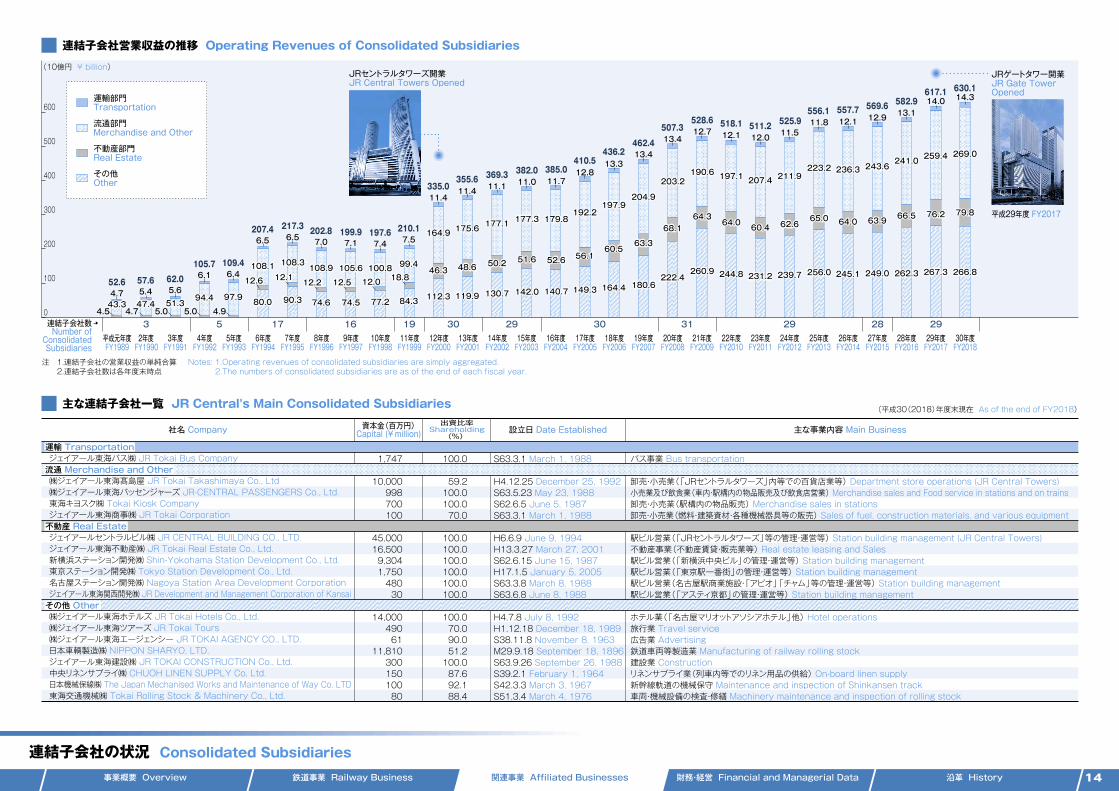
事業概要 Overview 鉄道事業 Railway Business 関連事業 Affiliated Businesses 財務・経営 Financial and Managerial Data 沿革 History
ジェイアール名古屋タカシマヤ(百貨店)JR Nagoya Takashimaya(Department Store)
タカシマヤ ゲートタワーモール(商業施設)(地下1階~8階)
Takashimaya Gate Tower Mall(Commercial Area) (B1F-8F)
タワーズテラスTowers Terrace
バスターミナルBus Terminal
地下部:中央新幹線名古屋駅併設予定Planning to construct Chuo Shinkansen Nagoya Station in the basement of the building.
オフィスOffices
タワーズガーデンTowers Garden
タワーズシャトル(エレベーター)Towers Shuttle (Elevator)
名古屋駅桜通口Nagoya Station Sakura-Dori Exit
至東京to Tokyo
至新大阪to Shin-Osaka
タワーズプラザレストラン街(12階、13階)Towers PlazaRestaurant Area(12F, 13F)
スカイストリート(15階)Sky Street (15F)
名古屋マリオットアソシアホテルNagoya Marriott Associa Hotel
オフィスタワー Office Towerホテルタワー Hotel Tower
ジェイアール名古屋タカシマヤ「パノラマサロン」JR Nagoya Takashimaya "Panorama Salon"
名古屋JRゲートタワーホテルNagoya JR Gate Tower Hotel
ゲートタワープラザレストラン街(12階、13階)
Gate Tower Plaza Restaurant Area (12F, 13F)
スカイストリート(15階)Sky Street (15F)
オフィスOffices
ゲートタワーシャトル(エレベーター)Gate Tower Shuttle (Elevator)
家電・ファミリーのフロア(9階~11階)Appliances and Family Floors
(9F-11F)
JRセントラルタワーズJR Central Towers
JRゲートタワーJR Gate Tower
延床面積 Total Floor Area オフィス(賃貸面積) Offices (Rental Office Area) 店舗面積 Store Area
ホテル(客室数) Hotel (Guest Rooms)駐車場(駐車台数) Parkingバスターミナル Bus Terminal高さ Height階数 Floors
地上 Above-ground
地下 Subterranean Floors着工 Commencement of Construction竣工(ビル本体) Completion of Construction (Building Body)全面開業 Full Open総事業費 Total Investment
JRセントラルタワーズ JR Central Towers JRゲートタワー JR Gate Tower
連結子会社による主な事業Main Businesses Operated by Consolidated Subsidiaries
JRセントラルタワーズとJRゲートタワーの概要 Overview of JR Central Towers and JR Gate Tower
当社最大の駅である名古屋駅(平均乗車人員220千人/日)の開発は関連事業の柱Station Complex of Nagoya Station, with the most passengers (220,000 passengers per day) in JR Central, forms a pillar of JR Central affiliated businesses.
平成12(2000)年に駅の直上にJRセントラルタワーズを、平成29(2017)年にはタワーズに隣接してJRゲートタワーを全面開業JR Central Towers opened in 2000, and JR Gate Tower opened in 2017 adjacent to JR Central Towers.
両ビルを一体的に運営し、双方の事業のコンセプトの明確な棲み分けによる相乗効果の発揮や営業連携による収益拡大、そして効率的な運営による利益の最大化に取り組むWe aim integrated management of each building, through utilizing synergy effect by identification of brand concepts, growing sales by cooperation and collaboration, and pursuing the maximization of profit by efficient operation.
流通業Merchandise
JRセントラルタワーズJR Central Towers
JRゲートタワーJR Gate Tower
不動産業Real Estate
ホテル業Hotel
ジェイアール名古屋タカシマヤJR Nagoya Takashimaya
運営者Operator
運営者Operator
運営者Operator
オフィス賃貸Office Leasing
名古屋マリオットアソシアホテルNagoya Marriott Associa Hotel
タカシマヤ ゲートタワーモールTakashimaya Gate Tower Mall
オフィス賃貸Office Leasing
名古屋JRゲートタワーホテルNagoya JR Gate Tower Hotel
㈱ジェイアール東海髙島屋 JR Tokai Takashimaya Co., Ltd
ジェイアールセントラルビル㈱ JR CENTRAL BUILDING CO., LTD.
㈱ジェイアール東海ホテルズ JR Tokai Hotels Co., Ltd.
m²m²
m²
室 rooms台 cars
m
階 Floors
階 Floors
億円 ¥ billion
単位Unit
JRセントラルタワーズとJRゲートタワー JR Central Towers and JR Gate Tower
13
約417,000 Approx. 417,000約60,000 Approx. 60,000百貨店 Department Store約68,000 Approx. 68,000
774約1,500 Approx. 1,500なし No245
53 (ホテルタワー Hotel Tower)51 (オフィスタワー Office Tower)4平成6(1994)年8月 August 1994平成11(1999)年12月 December 1999平成12(2000)年5月 May 2000約2,000 Approx. 200
約260,000 Approx. 260,000約44,000 Approx. 44,000商業施設 Commercial Area約32,000 Approx. 32,000※店舗面積は通路等を含む Store Area includes passages, etc350約300 Approx. 300あり Yes約220 Approx. 220
46
6平成24(2012)年10月 October 2012平成29(2017)年2月 February 2017平成29(2017)年4月 April 2017約1,050 Approx. 105
事業概要 Overview 鉄道事業 Railway Business 関連事業 Affiliated Businesses 財務・経営 Financial and Managerial Data 沿革 History
112.3
46.3
164.9
119.9
48.6
175.6
130.7
50.2
177.1
142.0
51.6
177.3
140.7
52.6
179.8
149.3
56.1
192.2
164.4
60.5
197.9
180.6
63.3
204.9
222.4
68.1
203.2
260.9 244.8
64.364.0
190.6 197.1
231.2
60.4
207.4
239.7
62.6
211.9
256.0
65.0
223.2
245.1
64.0
236.3
249.0
63.9
243.6
43.3 47.4 51.394.4 97.9 80.0
12.6
90.3
12.1
74.6
12.2
74.5
12.5
77.2
12.0
84.3
18.8108.1 108.3
108.9 105.6 100.8 99.4262.3
66.5
241.0
267.3
76.2
259.4
266.8
79.8
269.0
連結子会社営業収益の推移 Operating Revenues of Consolidated Subsidiaries
主な連結子会社一覧 JR Central's Main Consolidated Subsidiaries
385.0382.0369.3355.6335.0
210.1197.6199.9202.8217.3207.4
109.4105.7
62.057.652.6
4.543.34.7
4.747.45.4
5.051.35.6
5.0
94.4
6.1
4.9
97.9
6.4
80.0
12.6
6.5
90.3
12.1
6.5
74.6
12.2
7.0
74.5
12.5
7.1
77.2
12.0
7.4
84.3
18.8
7.5
108.1 108.3108.9 105.6 100.8 99.4
112.3
46.3
11.4
164.9
119.9
48.6
11.4
175.6
130.7
50.2
11.1
177.1
142.0
51.6
11.0
177.3
140.7
52.6
11.7
179.8
410.5
149.3
56.1
12.8
192.2
436.2
164.4
60.5
13.3
197.9
462.4
180.6
63.3
13.4
204.9
507.3
222.4
68.1
13.4
203.2
528.6 518.1
260.9 244.8
64.364.0
12.7 12.1
190.6 197.1
511.2
231.2
60.4
12.0
207.4
525.9
239.7
62.6
11.5
211.9
556.1
256.0
65.0
11.8
223.2
557.7
245.1
64.0
12.1
236.3
569.6
249.0
63.9
12.9
243.6その他Other
流通部門Merchandise and Other
不動産部門Real Estate
運輸部門Transportation
注 1.連結子会社の営業収益の単純合算 2.連結子会社数は各年度末時点
Notes: 1.Operating revenues of consolidated subsidiaries are simply aggregated. 2.The numbers of consolidated subsidiaries are as of the end of each fiscal year.
5 17 16 19 29 29 28 2930 30 313連結子会社数Number of
ConsolidatedSubsidiaries
平成元年度 2年度 3年度 4年度 5年度 6年度 7年度 8年度 9年度 10年度 12年度11年度 13年度 14年度 15年度 16年度 17年度 18年度 19年度 20年度FY1989 FY1990 FY1991 FY1992 FY1993 FY1994 FY1995 FY1996 FY1997 FY1998 FY1999 FY2001FY2000 FY2002 FY2003 FY2004 FY2005 FY2006 FY2007 FY2008 FY2009
21年度FY201022年度
FY201123年度
FY201224年度
FY201325年度
FY201426年度
FY201527年度
582.9
262.3
66.5
13.1
241.0
FY201628年度
平成29年度 FY2017
(10億円 ¥ billion)
(平成30(2018)年度末現在 As of the end of FY2018)
0
100
200
300
400
500
600
JRセントラルタワーズ開業JR Central Towers Opened
JRゲートタワー開業JR Gate Tower Opened
運輸 Transportation
流通 Merchandise and Other
不動産 Real Estate
その他 Other
社名 Company 主な事業内容 Main Business設立日 Date Established出資比率
Shareholding(%)
資本金(百万円)Capital (¥ million)
ジェイアール東海バス㈱ JR Tokai Bus Company
㈱ジェイアール東海髙島屋 JR Tokai Takashimaya Co., Ltd㈱ジェイアール東海パッセンジャーズ JR-CENTRAL PASSENGERS Co., Ltd.東海キヨスク㈱ Tokai Kiosk Companyジェイアール東海商事㈱ JR Tokai Corporation
ジェイアールセントラルビル㈱ JR CENTRAL BUILDING CO., LTD.ジェイアール東海不動産㈱ JR Tokai Real Estate Co., Ltd.新横浜ステーション開発㈱ Shin-Yokohama Station Development Co., Ltd.東京ステーション開発㈱ Tokyo Station Development Co., Ltd.名古屋ステーション開発㈱ Nagoya Station Area Development Corporationジェイアール東海関西開発㈱ JR Development and Management Corporation of Kansai
㈱ジェイアール東海ホテルズ JR Tokai Hotels Co., Ltd.㈱ジェイアール東海ツアーズ JR Tokai Tours㈱ジェイアール東海エージェンシー JR TOKAI AGENCY CO., LTD.日本車輌製造㈱ NIPPON SHARYO, LTD.ジェイアール東海建設㈱ JR TOKAI CONSTRUCTION Co., Ltd.中央リネンサプライ㈱ CHUOH LINEN SUPPLY Co, Ltd.日本機械保線㈱ The Japan Mechanised Works and Maintenance of Way Co. LTD東海交通機械㈱ Tokai Rolling Stock & Machinery Co., Ltd.
バス事業 Bus transportation
卸売・小売業(「JRセントラルタワーズ」内等での百貨店業等) Department store operations (JR Central Towers)小売業及び飲食業(車内・駅構内の物品販売及び飲食店営業) Merchandise sales and Food service in stations and on trains卸売・小売業(駅構内の物品販売) Merchandise sales in stations卸売・小売業(燃料・建築資材・各種機械器具等の販売) Sales of fuel, construction materials, and various equipment
駅ビル営業(「JRセントラルタワーズ」等の管理・運営等) Station building management (JR Central Towers)不動産事業(不動産賃貸・販売業等) Real estate leasing and Sales駅ビル営業(「新横浜中央ビル」の管理・運営等) Station building management駅ビル営業(「東京駅一番街」の管理・運営等) Station building management駅ビル営業(名古屋駅商業施設・「アピオ」「チャム」等の管理・運営等) Station building management駅ビル営業(「アスティ京都」の管理・運営等) Station building management
ホテル業(「名古屋マリオットアソシアホテル」他) Hotel operations旅行業 Travel service広告業 Advertising鉄道車両等製造業 Manufacturing of railway rolling stock建設業 Constructionリネンサプライ業(列車内等でのリネン用品の供給) On-board linen supply新幹線軌道の機械保守 Maintenance and inspection of Shinkansen track車両・機械設備の検査・修繕 Machinery maintenance and inspection of rolling stock
1,747
10,000998700100
45,00016,5009,3041,75048030
14,00049061
11,81030015010080
100.0
59.2100.0100.070.0
100.0100.0100.0100.0100.0100.0
100.070.090.051.2100.087.692.188.4
S63.3.1 March 1, 1988
H4.12.25 December 25, 1992S63.5.23 May 23, 1988S62.6.5 June 5, 1987S63.3.1 March 1, 1988
H6.6.9 June 9, 1994H13.3.27 March 27, 2001S62.6.15 June 15, 1987H17.1.5 January 5, 2005S63.3.8 March 8, 1988S63.6.8 June 8, 1988
H4.7.8 July 8, 1992H1.12.18 December 18, 1989S38.11.8 November 8, 1963M29.9.18 September 18, 1896S63.9.26 September 26, 1988S39.2.1 February 1, 1964S42.3.3 March 3, 1967S51.3.4 March 4, 1976
連結子会社の状況 Consolidated Subsidiaries14
617.1
267.3
76.2
14.0
259.4
FY201729年度
630.1
266.8
79.8
14.3
269.0
FY201830年度
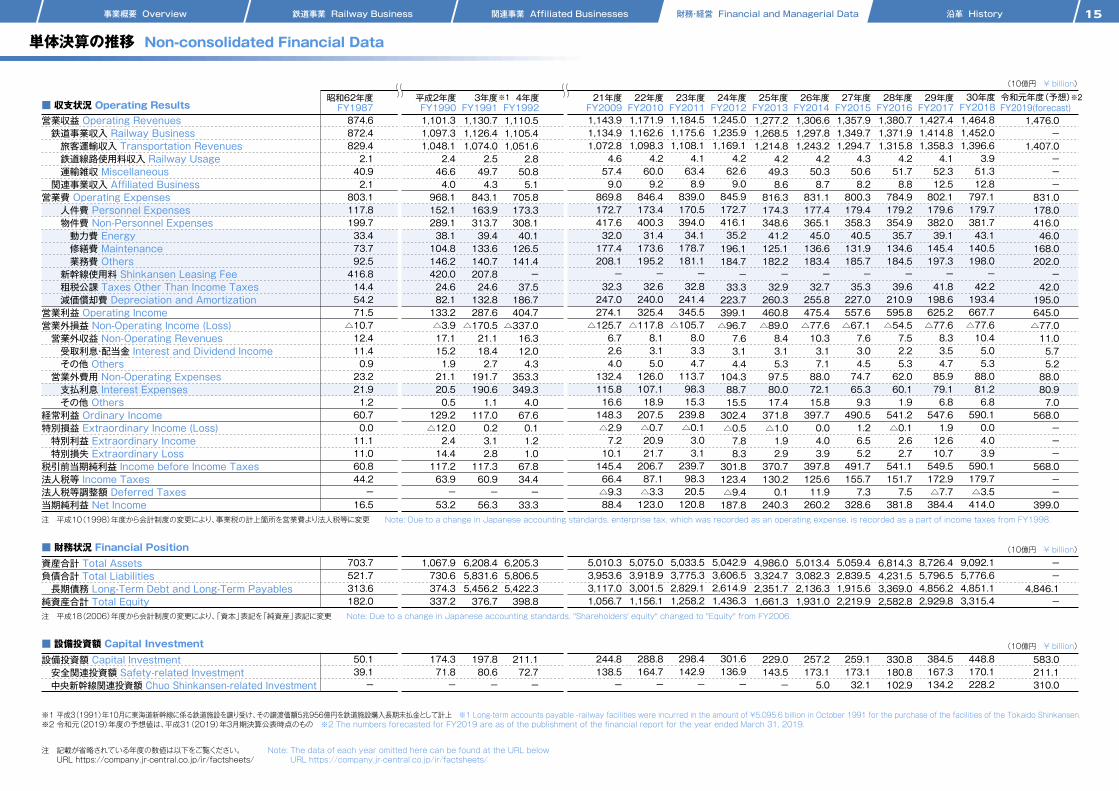
事業概要 Overview 鉄道事業 Railway Business 関連事業 Affiliated Businesses 財務・経営 Financial and Managerial Data 沿革 History
営業収益 Operating Revenues 鉄道事業収入 Railway Business 旅客運輸収入 Transportation Revenues 鉄道線路使用料収入 Railway Usage 運輸雑収 Miscellaneous 関連事業収入 Affiliated Business営業費 Operating Expenses 人件費 Personnel Expenses 物件費 Non-Personnel Expenses 動力費 Energy 修繕費 Maintenance 業務費 Others 新幹線使用料 Shinkansen Leasing Fee 租税公課 Taxes Other Than Income Taxes 減価償却費 Depreciation and Amortization営業利益 Operating Income営業外損益 Non-Operating Income (Loss) 営業外収益 Non-Operating Revenues 受取利息・配当金 Interest and Dividend Income その他 Others 営業外費用 Non-Operating Expenses 支払利息 Interest Expenses その他 Others経常利益 Ordinary Income特別損益 Extraordinary Income (Loss) 特別利益 Extraordinary Income 特別損失 Extraordinary Loss税引前当期純利益 Income before Income Taxes法人税等 Income Taxes法人税等調整額 Deferred Taxes当期純利益 Net Income
資産合計 Total Assets負債合計 Total Liabilities 長期債務 Long-Term Debt and Long-Term Payables純資産合計 Total Equity
設備投資額 Capital Investment 安全関連投資額 Safety-related Investment 中央新幹線関連投資額 Chuo Shinkansen-related Investment
4年度FY1992
3年度FY1991
平成2年度FY1990
昭和62年度FY1987 FY2009
21年度FY201022年度
FY201123年度
FY201224年度
FY201325年度
FY201426年度
FY201527年度
FY2016 FY201728年度 29年度
6,814.3
4,231.5
3,369.0
2,582.8
330.8
180.8
102.9
6,205.3
5,806.5
5,422.3
398.8
1,110.5
1,105.4
1,051.6
2.8
50.8
5.1
705.8
173.3
308.1
40.1
126.5
141.4
-
37.5
186.7
404.7
△337.0
16.3
12.0
4.3
353.3
349.3
4.0
67.6
0.1
1.2
1.0
67.8
34.4
-
33.3
211.1
72.7
-
6,208.4
5,831.6
5,456.2
376.7
1,130.7
1,126.4
1,074.0
2.5
49.7
4.3
843.1
163.9
313.7
39.4
133.6
140.7
207.8
24.6
132.8
287.6
△170.5
21.1
18.4
2.7
191.7
190.6
1.1
117.0
0.2
3.1
2.8
117.3
60.9
-
56.3
197.8
80.6
-
1,067.9
730.6
374.3
337.2
1,101.3
1,097.3
1,048.1
2.4
46.6
4.0
968.1
152.1
289.1
38.1
104.8
146.2
420.0
24.6
82.1
133.2
△3.9
17.1
15.2
1.9
21.1
20.5
0.5
129.2
△12.0
2.4
14.4
117.2
63.9
-
53.2
174.3
71.8
-
703.7
521.7
313.6
182.0
874.6
872.4
829.4
2.1
40.9
2.1
803.1
117.8
199.7
33.4
73.7
92.5
416.8
14.4
54.2
71.5
△10.7
12.4
11.4
0.9
23.2
21.9
1.2
60.7
0.0
11.1
11.0
60.8
44.2
-
16.5
50.1
39.1
-
5,010.3
3,953.6
3,117.0
1,056.7
244.8
138.5
-
1,143.9
1,134.9
1,072.8
4.6
57.4
9.0
869.8
172.7
417.6
32.0
177.4
208.1
-
32.3
247.0
274.1
△125.7
6.7
2.6
4.0
132.4
115.8
16.6
148.3
△2.9
7.2
10.1
145.4
66.4
△9.3
88.4
5,075.0
3,918.9
3,001.5
1,156.1
288.8
164.7
-
1,171.9
1,162.6
1,098.3
4.2
60.0
9.2
846.4
173.4
400.3
31.4
173.6
195.2
-
32.6
240.0
325.4
△117.8
8.1
3.1
5.0
126.0
107.1
18.9
207.5
△0.7
20.9
21.7
206.7
87.1
△3.3
123.0
5,033.5
3,775.3
2,829.1
1,258.2
298.4
142.9
-
1,184.5
1,175.6
1,108.1
4.1
63.4
8.9
839.0
170.5
394.0
34.1
178.7
181.1
-
32.8
241.4
345.5
△105.7
8.0
3.3
4.7
113.7
98.3
15.3
239.8
△0.1
3.0
3.1
239.7
98.3
20.5
120.8
5,042.9
3,606.5
2,614.9
1,436.3
301.6
136.9
-
1,245.0
1,235.9
1,169.1
4.2
62.6
9.0
845.9
172.7
416.1
35.2
196.1
184.7
-
33.3
223.7
399.1
△96.7
7.6
3.1
4.4
104.3
88.7
15.5
302.4
△0.5
7.8
8.3
301.8
123.4
△9.4
187.8
4,986.0
3,324.7
2,351.7
1,661.3
229.0
143.5
-
1,277.2
1,268.5
1,214.8
4.2
49.3
8.6
816.3
174.3
348.6
41.2
125.1
182.2
-
32.9
260.3
460.8
△89.0
8.4
3.1
5.3
97.5
80.0
17.4
371.8
△1.0
1.9
2.9
370.7
130.2
0.1
240.3
5,013.4
3,082.3
2,136.3
1,931.0
257.2
173.1
5.0
1,306.6
1,297.8
1,243.2
4.2
50.3
8.7
831.1
177.4
365.1
45.0
136.6
183.4
-
32.7
255.8
475.4
△77.6
10.3
3.1
7.1
88.0
72.1
15.8
397.7
0.0
4.0
3.9
397.8
125.6
11.9
260.2
5,059.4
2,839.5
1,915.6
2,219.9
259.1
173.1
32.1
1,357.9
1,349.7
1,294.7
4.3
50.6
8.2
800.3
179.4
358.3
40.5
131.9
185.7
-
35.3
227.0
557.6
△67.1
7.6
3.0
4.5
74.7
65.3
9.3
490.51.26.55.2
491.7155.77.3
328.6
1,380.71,371.91,315.8
4.251.78.8
784.9179.2354.935.7134.6184.5
-39.6210.9595.8△54.57.52.25.362.060.11.9
541.2△0.12.62.7
541.1151.77.5
381.8
8,726.45,796.54,856.22,929.8
384.5167.3134.2
1,427.41,414.81,358.3
4.152.312.5802.1179.6382.039.1145.4197.3
-41.8198.6625.2△77.68.33.54.785.979.16.8
547.61.912.610.7549.5172.9△7.7384.4
FY201830年度
9,092.15,776.64,851.13,315.4
448.8170.1228.2
1,464.81,452.01,396.6
3.951.312.8797.1179.7381.743.1140.5198.0
-42.2193.4667.7△77.610.45.05.388.081.26.8
590.10.04.03.9
590.1179.7△3.5414.0
令和元年度(予想)※2※1FY2019(forecast)
--
4,846.1-
583.0211.1310.0
1,476.0-
1,407.0---
831.0178.0416.046.0168.0202.0
-42.0195.0645.0△77.011.05.75.288.080.97.0
568.0---
568.0--
399.0
注 平成18(2006)年度から会計制度の変更により、「資本」表記を「純資産」表記に変更 Note: Due to a change in Japanese accounting standards, "Shareholders' equity" changed to "Equity" from FY2006.
注 記載が省略されている年度の数値は以下をご覧ください。 URL https://company.jr-central.co.jp/ir/factsheets/
Note: The data of each year omitted here can be found at the URL below URL https://company.jr-central.co.jp/ir/factsheets/
注 平成10(1998)年度から会計制度の変更により、事業税の計上箇所を営業費より法人税等に変更 Note: Due to a change in Japanese accounting standards, enterprise tax, which was recorded as an operating expense, is recorded as a part of income taxes from FY1998.
(10億円 ¥ billion)
(10億円 ¥ billion)
■ 収支状況 Operating Results
■ 設備投資額 Capital Investment
■ 財務状況 Financial Position
(10億円 ¥ billion)
※1 平成3(1991)年10月に東海道新幹線に係る鉄道施設を譲り受け、その譲渡価額5兆956億円を鉄道施設購入長期未払金として計上 ※1 Long-term accounts payable -railway facilities were incurred in the amount of ¥5,095.6 billion in October 1991 for the purchase of the facilities of the Tokaido Shinkansen.※2 令和元(2019)年度の予想値は、平成31(2019)年3月期決算公表時点のもの ※2 The numbers forecasted for FY2019 are as of the publishment of the financial report for the year ended March 31, 2019.
単体決算の推移 Non-consolidated Financial Data
15
事業概要 Overview 鉄道事業 Railway Business 関連事業 Affiliated Businesses 財務・経営 Financial and Managerial Data 沿革 History
63年度
平成元年度
2年度
3年度
4年度
5年度
6年度
7年度
8年度
9年度
10年度
12年度
11年度
13年度
14年度
15年度
16年度
17年度
18年度
19年度
20年度
21年度
22年度
FY1988
昭和62年度FY1987
FY1989
FY1990
FY1991
FY1992
FY1993
FY1994
FY1995
FY1996
FY1997
FY1998
FY1999
FY2001
FY2000
FY2002
FY2003
FY2004
FY2005
FY2006
FY2007
FY2008
FY2009
FY2010
23年度FY2011
24年度FY2012
25年度FY2013
27年度FY2015
26年度FY2014
28年度FY2016
支払利息Interest Expenses
減価償却費Depreciation and Amortization
租税公課Taxes Other Than Income Taxes
新幹線使用料Shinkansen Leasing Fee
業務費Others
修繕費Maintenance
動力費Energy
人件費Personnel Expenses
(10億円 ¥ billion)
営業費OperatingExpenses
0
600
400
200
800
1,000
1,200
845
29年度FY2017
865903896
934937953
9851,003
985979974994991988992
1,0181,0141,0301,0451,0521,0441,0521,0571,055
1,033
988
908886
825
コスト構造(単体) Structure of Costs (Non-consolidated)16
881
30年度FY2018
878
コスト構造の推移(単体) History of Cost Structure (Non-consolidated)
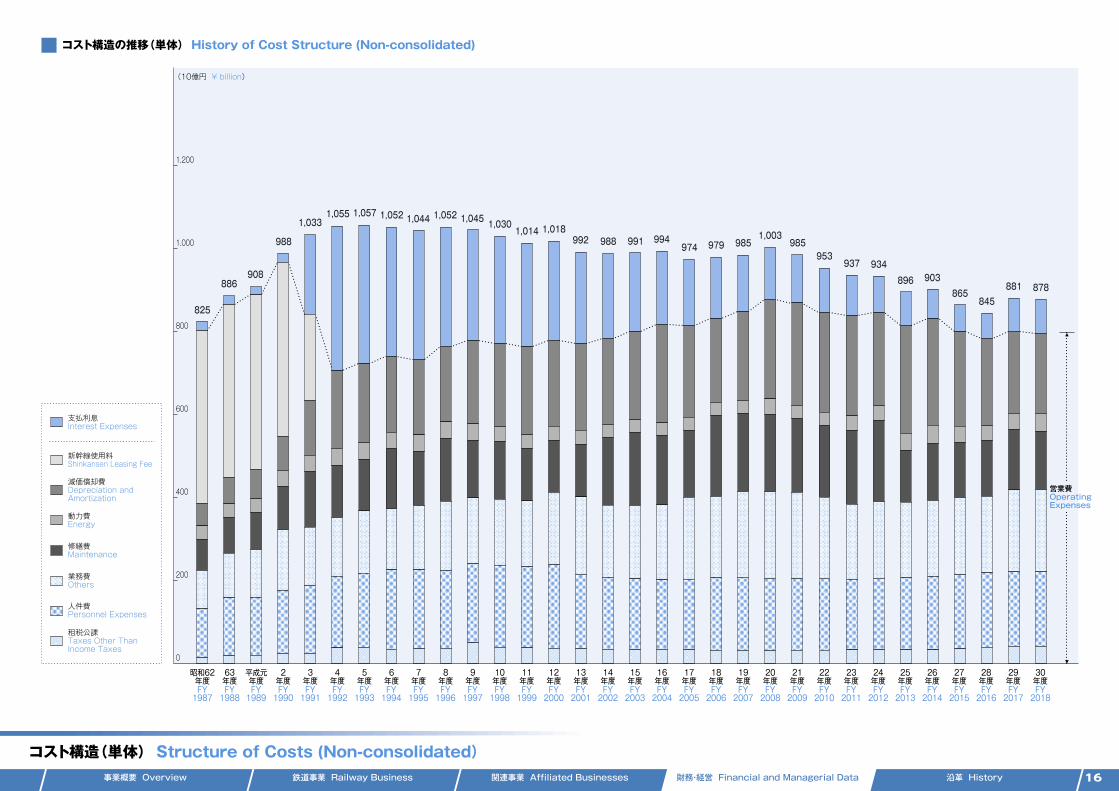
事業概要 Overview 鉄道事業 Railway Business 関連事業 Affiliated Businesses 財務・経営 Financial and Managerial Data 沿革 History
営業収益 Operating Revenues 鉄道事業収入 Railway Business 旅客運輸収入 Transportation Revenues 鉄道線路使用料収入 Railway Usage 運輸雑収 Miscellaneous 関連事業収入 Affiliated Business営業費 Operating Expenses 人件費 Personnel Expenses 物件費 Non-Personnel Expenses 動力費 Energy 修繕費 Maintenance 業務費 Others 新幹線使用料 Shinkansen Leasing Fee 租税公課 Taxes Other Than Income Taxes 減価償却費 Depreciation and Amortization営業利益 Operating Income営業外損益 Non-Operating Income (Loss) 営業外収益 Non-Operating Revenues 受取利息・配当金 Interest and Dividend Income その他 Others 営業外費用 Non-Operating Expenses 支払利息 Interest Expenses その他 Others経常利益 Ordinary Income特別損益 Extraordinary Income (Loss) 特別利益 Extraordinary Income 特別損失 Extraordinary Loss税引前当期純利益 Income before Income Taxes法人税等 Income Taxes法人税等調整額 Deferred Taxes当期純利益 Net Income
資産合計 Total Assets負債合計 Total Liabilities 長期債務 Long-Term Debt and Long-Term Payables純資産合計 Total Equity
設備投資額 Capital Investment 安全関連投資額 Safety-related Investment 中央新幹線関連投資額 Chuo Shinkansen-related Investment
4年度FY1992
3年度FY1991
平成2年度FY1990
昭和62年度FY1987 FY2009
21年度FY201022年度
FY201123年度
FY201224年度
FY201325年度
FY201426年度
FY201527年度
FY2016 FY201728年度 29年度
6,814.3
4,231.5
3,369.0
2,582.8
330.8
180.8
102.9
6,205.3
5,806.5
5,422.3
398.8
1,110.5
1,105.4
1,051.6
2.8
50.8
5.1
705.8
173.3
308.1
40.1
126.5
141.4
-
37.5
186.7
404.7
△337.0
16.3
12.0
4.3
353.3
349.3
4.0
67.6
0.1
1.2
1.0
67.8
34.4
-
33.3
211.1
72.7
-
6,208.4
5,831.6
5,456.2
376.7
1,130.7
1,126.4
1,074.0
2.5
49.7
4.3
843.1
163.9
313.7
39.4
133.6
140.7
207.8
24.6
132.8
287.6
△170.5
21.1
18.4
2.7
191.7
190.6
1.1
117.0
0.2
3.1
2.8
117.3
60.9
-
56.3
197.8
80.6
-
1,067.9
730.6
374.3
337.2
1,101.3
1,097.3
1,048.1
2.4
46.6
4.0
968.1
152.1
289.1
38.1
104.8
146.2
420.0
24.6
82.1
133.2
△3.9
17.1
15.2
1.9
21.1
20.5
0.5
129.2
△12.0
2.4
14.4
117.2
63.9
-
53.2
174.3
71.8
-
703.7
521.7
313.6
182.0
874.6
872.4
829.4
2.1
40.9
2.1
803.1
117.8
199.7
33.4
73.7
92.5
416.8
14.4
54.2
71.5
△10.7
12.4
11.4
0.9
23.2
21.9
1.2
60.7
0.0
11.1
11.0
60.8
44.2
-
16.5
50.1
39.1
-
5,010.3
3,953.6
3,117.0
1,056.7
244.8
138.5
-
1,143.9
1,134.9
1,072.8
4.6
57.4
9.0
869.8
172.7
417.6
32.0
177.4
208.1
-
32.3
247.0
274.1
△125.7
6.7
2.6
4.0
132.4
115.8
16.6
148.3
△2.9
7.2
10.1
145.4
66.4
△9.3
88.4
5,075.0
3,918.9
3,001.5
1,156.1
288.8
164.7
-
1,171.9
1,162.6
1,098.3
4.2
60.0
9.2
846.4
173.4
400.3
31.4
173.6
195.2
-
32.6
240.0
325.4
△117.8
8.1
3.1
5.0
126.0
107.1
18.9
207.5
△0.7
20.9
21.7
206.7
87.1
△3.3
123.0
5,033.5
3,775.3
2,829.1
1,258.2
298.4
142.9
-
1,184.5
1,175.6
1,108.1
4.1
63.4
8.9
839.0
170.5
394.0
34.1
178.7
181.1
-
32.8
241.4
345.5
△105.7
8.0
3.3
4.7
113.7
98.3
15.3
239.8
△0.1
3.0
3.1
239.7
98.3
20.5
120.8
5,042.9
3,606.5
2,614.9
1,436.3
301.6
136.9
-
1,245.0
1,235.9
1,169.1
4.2
62.6
9.0
845.9
172.7
416.1
35.2
196.1
184.7
-
33.3
223.7
399.1
△96.7
7.6
3.1
4.4
104.3
88.7
15.5
302.4
△0.5
7.8
8.3
301.8
123.4
△9.4
187.8
4,986.0
3,324.7
2,351.7
1,661.3
229.0
143.5
-
1,277.2
1,268.5
1,214.8
4.2
49.3
8.6
816.3
174.3
348.6
41.2
125.1
182.2
-
32.9
260.3
460.8
△89.0
8.4
3.1
5.3
97.5
80.0
17.4
371.8
△1.0
1.9
2.9
370.7
130.2
0.1
240.3
5,013.4
3,082.3
2,136.3
1,931.0
257.2
173.1
5.0
1,306.6
1,297.8
1,243.2
4.2
50.3
8.7
831.1
177.4
365.1
45.0
136.6
183.4
-
32.7
255.8
475.4
△77.6
10.3
3.1
7.1
88.0
72.1
15.8
397.7
0.0
4.0
3.9
397.8
125.6
11.9
260.2
5,059.4
2,839.5
1,915.6
2,219.9
259.1
173.1
32.1
1,357.9
1,349.7
1,294.7
4.3
50.6
8.2
800.3
179.4
358.3
40.5
131.9
185.7
-
35.3
227.0
557.6
△67.1
7.6
3.0
4.5
74.7
65.3
9.3
490.51.26.55.2
491.7155.77.3
328.6
1,380.71,371.91,315.8
4.251.78.8
784.9179.2354.935.7134.6184.5
-39.6210.9595.8△54.57.52.25.362.060.11.9
541.2△0.12.62.7
541.1151.77.5
381.8
8,726.45,796.54,856.22,929.8
384.5167.3134.2
1,427.41,414.81,358.3
4.152.312.5802.1179.6382.039.1145.4197.3
-41.8198.6625.2△77.68.33.54.785.979.16.8
547.61.912.610.7549.5172.9△7.7384.4
FY201830年度
9,092.15,776.64,851.13,315.4
448.8170.1228.2
1,464.81,452.01,396.6
3.951.312.8797.1179.7381.743.1140.5198.0
-42.2193.4667.7△77.610.45.05.388.081.26.8
590.10.04.03.9
590.1179.7△3.5414.0
令和元年度(予想)※2※1FY2019(forecast)
--
4,846.1-
583.0211.1310.0
1,476.0-
1,407.0---
831.0178.0416.046.0168.0202.0
-42.0195.0645.0△77.011.05.75.288.080.97.0
568.0---
568.0--
399.0
注 平成18(2006)年度から会計制度の変更により、「資本」表記を「純資産」表記に変更 Note: Due to a change in Japanese accounting standards, "Shareholders' equity" changed to "Equity" from FY2006.
注 記載が省略されている年度の数値は以下をご覧ください。 URL https://company.jr-central.co.jp/ir/factsheets/
Note: The data of each year omitted here can be found at the URL below URL https://company.jr-central.co.jp/ir/factsheets/
注 平成10(1998)年度から会計制度の変更により、事業税の計上箇所を営業費より法人税等に変更 Note: Due to a change in Japanese accounting standards, enterprise tax, which was recorded as an operating expense, is recorded as a part of income taxes from FY1998.
(10億円 ¥ billion)
(10億円 ¥ billion)
■ 収支状況 Operating Results
■ 設備投資額 Capital Investment
■ 財務状況 Financial Position
(10億円 ¥ billion)
※1 平成3(1991)年10月に東海道新幹線に係る鉄道施設を譲り受け、その譲渡価額5兆956億円を鉄道施設購入長期未払金として計上 ※1 Long-term accounts payable -railway facilities were incurred in the amount of ¥5,095.6 billion in October 1991 for the purchase of the facilities of the Tokaido Shinkansen.※2 令和元(2019)年度の予想値は、平成31(2019)年3月期決算公表時点のもの ※2 The numbers forecasted for FY2019 are as of the publishment of the financial report for the year ended March 31, 2019.
単体決算の推移 Non-consolidated Financial Data
15
事業概要 Overview 鉄道事業 Railway Business 関連事業 Affiliated Businesses 財務・経営 Financial and Managerial Data 沿革 History
63年度
平成元年度
2年度
3年度
4年度
5年度
6年度
7年度
8年度
9年度
10年度
12年度
11年度
13年度
14年度
15年度
16年度
17年度
18年度
19年度
20年度
21年度
22年度
FY1988
昭和62年度FY1987
FY1989
FY1990
FY1991
FY1992
FY1993
FY1994
FY1995
FY1996
FY1997
FY1998
FY1999
FY2001
FY2000
FY2002
FY2003
FY2004
FY2005
FY2006
FY2007
FY2008
FY2009
FY2010
23年度FY2011
24年度FY2012
25年度FY2013
27年度FY2015
26年度FY2014
28年度FY2016
支払利息Interest Expenses
減価償却費Depreciation and Amortization
租税公課Taxes Other Than Income Taxes
新幹線使用料Shinkansen Leasing Fee
業務費Others
修繕費Maintenance
動力費Energy
人件費Personnel Expenses
(10億円 ¥ billion)
営業費OperatingExpenses
0
600
400
200
800
1,000
1,200
845
29年度FY2017
865903896
934937953
9851,003
985979974994991988992
1,0181,0141,0301,0451,0521,0441,0521,0571,055
1,033
988
908886
825
コスト構造(単体) Structure of Costs (Non-consolidated)16
881
30年度FY2018
878
コスト構造の推移(単体) History of Cost Structure (Non-consolidated)
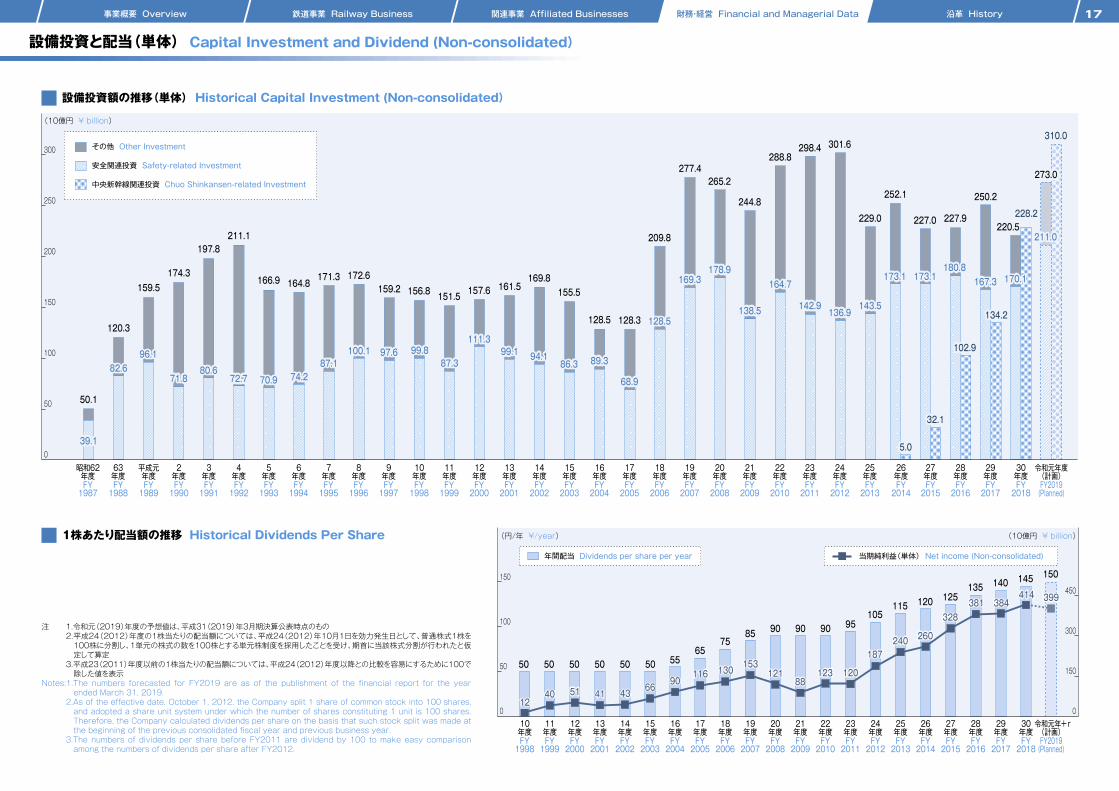
事業概要 Overview 鉄道事業 Railway Business 関連事業 Affiliated Businesses 財務・経営 Financial and Managerial Data 沿革 History
180.8167.3173.1173.1
143.5136.9
142.9
164.7
138.5
178.9169.3
128.5
68.9
89.386.394.199.1
111.3
87.399.897.6100.1
87.174.270.972.7
80.671.8
96.182.6
39.1
211.0
399381328
260240187
12012388
121153130116
90664341514012
384414
102.9
32.1
5.0
134.2
170.1
228.2
273.0
設備投資額の推移(単体) Historical Capital Investment (Non-consolidated)
(10億円 ¥ billion)
(10億円 ¥ billion)1株あたり配当額の推移 Historical Dividends Per Share
注 1.令和元(2019)年度の予想値は、平成31(2019)年3月期決算公表時点のもの2.平成24(2012)年度の1株当たりの配当額については、平成24(2012)年10月1日を効力発生日として、普通株式1株を100株に分割し、1単元の株式の数を100株とする単元株制度を採用したことを受け、期首に当該株式分割が行われたと仮定して算定3.平成23(2011)年度以前の1株当たりの配当額については、平成24(2012)年度以降との比較を容易にするために100で除した値を表示
Notes:1.The numbers forecasted for FY2019 are as of the publishment of the financial report for the year ended March 31, 2019.2.As of the effective date, October 1, 2012, the Company split 1 share of common stock into 100 shares, and adopted a share unit system under which the number of shares constituting 1 unit is 100 shares. Therefore, the Company calculated dividends per share on the basis that such stock split was made at the beginning of the previous consolidated fiscal year and previous business year.3.The numbers of dividends per share before FY2011 are dividend by 100 to make easy comparison among the numbers of dividends per share after FY2012.
0
150
100
50
200
250
300
中央新幹線関連投資 Chuo Shinkansen-related Investment
その他 Other Investment
安全関連投資 Safety-related Investment
63年度
平成元年度
2年度
3年度
4年度
5年度
6年度
7年度
8年度
9年度
10年度
12年度
11年度
13年度
14年度
15年度
16年度
17年度
18年度
19年度
20年度
21年度
22年度
FY1988
昭和62年度FY1987
FY1989
FY1990
FY1991
FY1992
FY1993
FY1994
FY1995
FY1996
FY1997
FY1998
FY1999
FY2001
FY2000
FY2002
FY2003
FY2004
FY2005
FY2006
FY2007
FY2008
FY2009
FY2010
23年度FY2011
24年度FY2012
25年度FY2013
27年度FY2015
26年度FY2014
28年度FY2016
29年度FY2017
(円/年 ¥/year)
年間配当 Dividends per share per year 当期純利益(単体) Net income (Non-consolidated)
227.9227.0
252.1
229.0
301.6298.4288.8
244.8
265.2277.4
209.8
128.3128.5
155.5169.8
161.5157.6151.5156.8159.2172.6171.3
164.8166.9
211.1197.8
174.3159.5
120.3
50.1
381328
260240187
12012388
121153130116
90664341514012
399
150135
384
140414145
125120115105
9590 90 908575
655550 50 50 50 50 50
180.8167.3173.1173.1
143.5136.9
142.9
164.7
138.5
178.9169.3
128.5
68.9
89.386.394.199.1
111.3
87.399.897.6100.1
87.174.270.972.7
80.671.8
96.182.6
39.1
102.9
32.1
5.0
0
50
100
150
0
150
300
450
設備投資と配当(単体) Capital Investment and Dividend (Non-consolidated)
17
250.2
134.2
30年度FY2018
170.1
220.5228.2
令和元年度(計画)FY2019(Planned)
10年度
12年度
11年度
13年度
14年度
15年度
16年度
17年度
18年度
19年度
20年度
21年度
22年度
FY1998
FY1999
FY2001
FY2000
FY2002
FY2003
FY2004
FY2005
FY2006
FY2007
FY2008
FY2009
FY2010
23年度FY2011
24年度FY2012
25年度FY2013
27年度FY2015
26年度FY2014
28年度FY2016
29年度FY2017
30年度FY2018
令和元年度(計画)FY2019(Planned)
273.0
211.0
310.0
事業概要 Overview 鉄道事業 Railway Business 関連事業 Affiliated Businesses 財務・経営 Financial and Managerial Data 沿革 History
5.16 5.08 5.014.91 4.75 4.62 4.51 4.30 4.08
3.91
5.215.435.845.906.196.396.53
3.71
6.81 6.35 6.01 6.08
3.54 3.36 3.24 3.14 3.13 3.10 3.122.00 1.66 1.65
長期債務総額の推移(単体) Total Long-term Debt and Payables (Non-consolidated)
新幹線債務の残高 Long-term Accounts Payable-railway Facilities(100万円 ¥ million)
平成30(2018)年度末残高
Outstanding atthe End ofMarch 2019
平成3(1991)年10月1日
October 1, 1991
支払期間Payment Schedule
支払方法Payment Method
利 率Interest Rate
1号No.1
平成3(1991)年10月1日~平成29(2017)年3月31日October 1, 1991 to March 31, 2017
ーー
2号No.2
平成3(1991)年10月1日~平成29(2017)年3月31日October 1, 1991 to March 31, 2017
元利均等半年賦支払Interest and principal paid in equal installments,semiannually
固定Fixed 6.35% ー
3号No.3
合計 Total
平成3(1991)年10月1日~令和33(2051)年9月30日October 1, 1991 to September 30, 2051
固定Fixed 6.55% 538,443
538,443
3,447,268
1,047,197
601,195
5,095,661
独立行政法人鉄道建設・運輸施設整備支援機構からの長期借入Long-Term Loan from the Japan Railway Construction, Transport and Technology Agency
第4回 Fourth第1回 First 第2回 Second 第3回 Third
借入額 Amount
(10億円 ¥ billion)
500.00.6% 0.8% 0.9% 0.9%
500.0 500.0 750.0
第5回 Fifth
1.0%750.0
利率Interest Rate 全期間固定 Fixed throughout entire period
借入実行日Borrowing Date
弁済期限Maturity Date
返済方法RepaymentMethod
担保 Security
平成28(2016)年11月29日November 29, 2016
平成29(2017)年1月16日January 16, 2017
平成29(2017)年3月10日March 10, 2017
平成29(2017)年5月17日May 17, 2017
令和37(2055)年11月29日November 29, 2055
令和38(2056)年1月16日January 16, 2056
令和38(2056)年3月10日March 10, 2056
令和37(2055)年11月17日November 17, 2055
令和28(2046)年5月まで据置Deferred up to May 2046
令和28(2046)年7月まで据置Deferred up to July 2046
以降、元金均等返済 Equal principal repayment thereafter無担保 Unsecured
令和28(2046)年9月まで据置Deferred up to September 2046
令和28(2046)年5月まで据置Deferred up to May 2046
平成29(2017)年7月12日July 12, 2017
令和38(2056)年1月12日January 12, 2056
令和28(2046)年7月まで据置Deferred up to July 2046
(10億円 ¥ billion)
0
3,000
2,000
1,000
4,000
5,000
6,000
0
6.0
4.0
2.0
8.0
10.0
鉄道施設購入長期未払金Long-term Accounts Payable-railway Facilities
長期借入金Long-term Debt
社債Corporate Bonds
新幹線貸付制度下の実質的な債務Latent Liabilities Born by the Shinkansen Leasing System
中央新幹線建設長期借入金Long-term Debt for the Chuo Shinkansen Construction
注 1. 昭和62(1987)~平成2(1990)年度の「債務増減額」の数値は「小計」の増減を示す 2. 平成3(1991)~5(1993)年度の「長期債務合計」の増減と「債務増減額」の不一致は、「鉄道施設購入長期未払金」の増加(平成3(1991)年度:51,032億円、平成4(1992)年度:39億円、平成5(1993)年度:9億円)によるNotes: 1. For FY1987 through FY1990, the "Change in Total Long-term Debt and Payables" is based on the amount in the "Subtotal" category. 2. For FY1991 through FY1993, the "Change in Total Long-term Debt and Payables" is not equivalent to the difference from the previous term's "Total Long-term Debt and Payables" owing to increases in "Long-term Accounts Payable-railway Facilities" (¥5,103.2 billion in FY1991, ¥3.9 billion in FY1992, and ¥0.9 billion in FY1993).
支払利息Interest Expenses
債務増減額Change in Total Long-term Debt and Payables
資金調達額Amount of Fund-Raising
長期債務合計Total Long-term Debt and Payables
新幹線貸付制度下の実質的な債務Latent Liabilities Born by the Shinkansen Leasing System中央新幹線建設長期借入金Long-term Debt for the Chuo Shinkansen Construction
小計Subtotal
鉄道施設購入長期未払金Long-term Accounts Payable-railway Facilities
長期借入金Long-term Debt
社債Corporate Bonds
承継債務Inherited Liabilities -
240.0
628.9
3,256.6
4,125.5
-
-
4,125.5
99.5
△163.7
204.0
-
564.9
646.6
2,204.0
3,415.6
-
-
3,415.6
321.8
△40.0
148.2
-
415.0
584.5
2,456.2
3,455.7
-
-
3,455.7
170.0
△210.0
158.6
-
285.0
635.4
3,023.0
3,943.4
-
-
3,943.4
82.0
△182.0
190.7
278.8
18.8
16.0
-
313.6
4,955.7
-
5,269.3
34.8
△5.5
21.9
32.1
115.3
307.5
4,967.2
5,422.3
-
-
5,422.3
92.7
△37.8
349.3
6.6
135.3
367.0
4,882.9
5,392.0
-
-
5,392.0
85.5
△31.3
334.6
3.4
96.9
457.4
4,788.3
5,346.3
-
-
5,346.3
98.7
△45.6
311.6
1.2
38.3
573.2
4,665.7
5,278.5
-
-
5,278.5
126.3
△67.7
310.7
-
50.0
706.7
4,407.5
5,164.3
-
-
5,164.3
178.0
△114.2
286.5
-
100.0
786.6
4,158.5
5,045.2
-
-
5,045.2
147.5
△119.0
267.5
-
130.0
774.7
4,017.5
4,922.2
-
-
4,922.2
40.0
△123.0
259.3
-
180.0
757.9
3,863.0
4,801.0
-
-
4,801.0
105.0
△121.1
250.5
-
160.0
681.8
3,718.9
4,560.8
-
-
4,560.8
-
△240.2
238.7
-
180.0
625.9
3,483.4
4,289.3
-
-
4,289.3
73.0
△271.4
220.7
222.8
38.4
64.1
-
325.3
4,897.7
-
5,223.0
67.7
11.6
20.5
146.4
57.2
147.4
-
351.0
4,881.7
-
5,232.7
102.1
25.7
19.0
112.4
77.0
184.9
-
374.3
4,821.3
-
5,195.6
58.1
23.3
20.5
79.9
95.3
239.6
5,041.2
5,456.2
-
-
5,456.2
75.8
△21.3
190.6
-
335.0
584.7
2,746.1
3,665.8
-
-
3,665.8
123.6
△277.6
176.6
-
669.8
644.3
1,945.8
3,260.1
-
-
3,260.1
209.1
△155.5
136.7
-
809.8
674.6
1,693.0
3,177.6
-
-
3,177.6
247.4
△82.5
124.3
-
969.8
665.4
1,481.6
3,117.0
-
-
3,117.0
288.3
△60.6
115.8
-
1,093.5
620.9
1,287.0
3,001.5
-
-
3,001.5
235.9
△115.4
107.1
-
1,073.0
612.3
1,143.7
2,829.1
-
-
2,829.1
174.7
△172.4
98.3
-
1,016.1
604.1
994.7
2,614.9
-
-
2,614.9
184.0
△214.1
88.7
-
882.9
612.8
855.8
2,351.7
-
-
2,351.7189.6
△263.280.0
-646.1637.9631.51,915.6
--
1,915.6195.6
△220.665.3
-724.2590.9553.81,869.0
-1,500.03,369.01,640.21,453.460.1
-767.3639.2729.62,136.3
--
2,136.3259.6
△215.472.1
承継債務Inherited Liabilities
5,269.3 5,223.0 5,232.7 5,195.65,456.2 5,422.3 5,392.0 5,346.3 5,278.5 5,164.3 5,045.2 4,922.2 4,801.0 4,560.8
4,289.3 4,125.5 3,943.43,665.8 3,455.7 3,415.6 3,260.1 3,177.6 3,117.0 3,001.5 2,829.1 2,614.9
2,351.7 2,136.3 1,915.6
3,369.0
63年度
平成元年度
2年度
3年度
4年度
5年度
6年度
7年度
8年度
9年度
10年度
12年度
11年度
13年度
14年度
15年度
16年度
17年度
18年度
19年度
20年度
21年度
22年度
FY1988
昭和62年度FY1987
FY1989
FY1990
FY1991
FY1992
FY1993
FY1994
FY1995
FY1996
FY1997
FY1998
FY1999
FY2001
FY2000
FY2002
FY2003
FY2004
FY2005
FY2006
FY2007
FY2008
FY2009
FY2010
23年度FY2011
24年度FY2012
25年度FY2013
27年度FY2015
26年度FY2014
28年度FY2016
-734.2572.8549.01,856.2
-3,000.04,856.21,595.21,487.179.1
29年度FY2017
(%)
平均金利(期末) Average Interest Rate (As of each fiscal year-end)
5.16 5.08 5.014.91 4.75 4.62 4.51 4.30 4.08
3.91
5.215.435.845.906.196.396.53
3.71
6.81 6.35 6.01 6.08
3.54 3.36 3.24 3.14 3.13 3.10 3.122.00
4,856.2
1.66
-773.2533.9543.81,851.1
-3,000.04,851.194.5△5.081.2
30年度FY2018
4,851.1
1.65
長期債務(単体) Long-term Debt and Payables (Non-consolidated)18
変動Floating
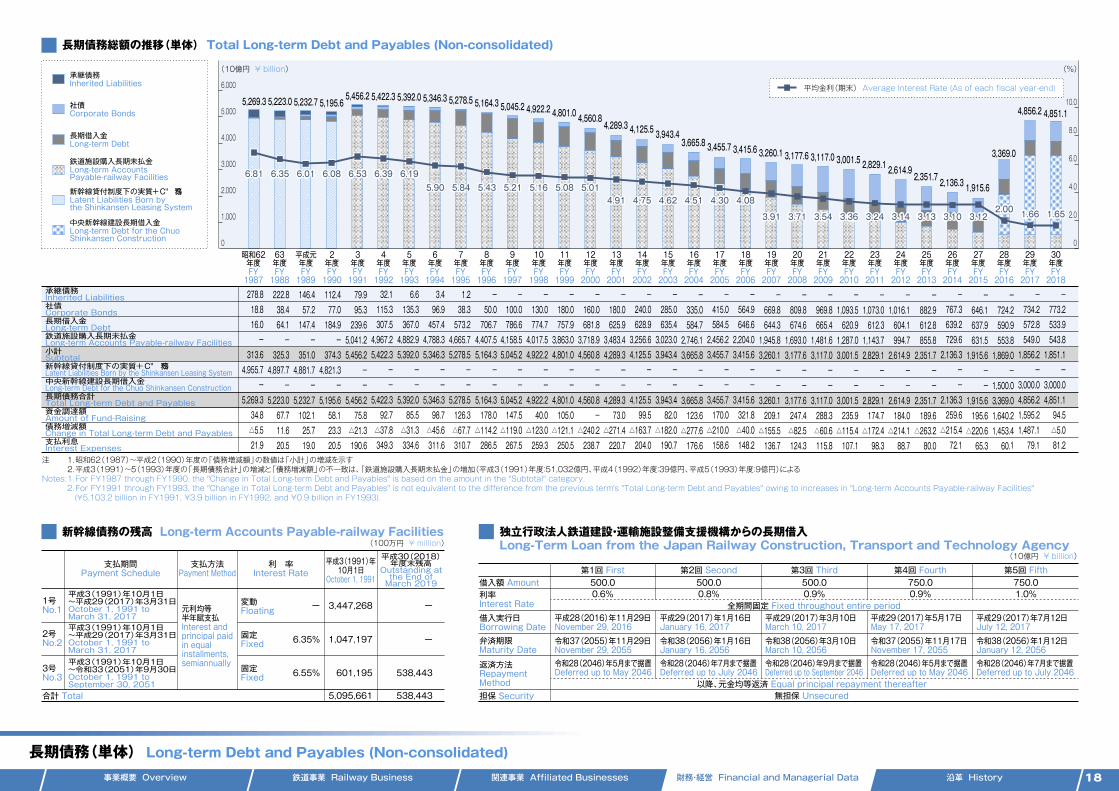
事業概要 Overview 鉄道事業 Railway Business 関連事業 Affiliated Businesses 財務・経営 Financial and Managerial Data 沿革 History
180.8167.3173.1173.1
143.5136.9
142.9
164.7
138.5
178.9169.3
128.5
68.9
89.386.394.199.1
111.3
87.399.897.6100.1
87.174.270.972.7
80.671.8
96.182.6
39.1
211.0
399381328
260240187
12012388
121153130116
90664341514012
384414
102.9
32.1
5.0
134.2
170.1
228.2
273.0
設備投資額の推移(単体) Historical Capital Investment (Non-consolidated)
(10億円 ¥ billion)
(10億円 ¥ billion)1株あたり配当額の推移 Historical Dividends Per Share
注 1.令和元(2019)年度の予想値は、平成31(2019)年3月期決算公表時点のもの2.平成24(2012)年度の1株当たりの配当額については、平成24(2012)年10月1日を効力発生日として、普通株式1株を100株に分割し、1単元の株式の数を100株とする単元株制度を採用したことを受け、期首に当該株式分割が行われたと仮定して算定3.平成23(2011)年度以前の1株当たりの配当額については、平成24(2012)年度以降との比較を容易にするために100で除した値を表示
Notes:1.The numbers forecasted for FY2019 are as of the publishment of the financial report for the year ended March 31, 2019.2.As of the effective date, October 1, 2012, the Company split 1 share of common stock into 100 shares, and adopted a share unit system under which the number of shares constituting 1 unit is 100 shares. Therefore, the Company calculated dividends per share on the basis that such stock split was made at the beginning of the previous consolidated fiscal year and previous business year.3.The numbers of dividends per share before FY2011 are dividend by 100 to make easy comparison among the numbers of dividends per share after FY2012.
0
150
100
50
200
250
300
中央新幹線関連投資 Chuo Shinkansen-related Investment
その他 Other Investment
安全関連投資 Safety-related Investment
63年度
平成元年度
2年度
3年度
4年度
5年度
6年度
7年度
8年度
9年度
10年度
12年度
11年度
13年度
14年度
15年度
16年度
17年度
18年度
19年度
20年度
21年度
22年度
FY1988
昭和62年度FY1987
FY1989
FY1990
FY1991
FY1992
FY1993
FY1994
FY1995
FY1996
FY1997
FY1998
FY1999
FY2001
FY2000
FY2002
FY2003
FY2004
FY2005
FY2006
FY2007
FY2008
FY2009
FY2010
23年度FY2011
24年度FY2012
25年度FY2013
27年度FY2015
26年度FY2014
28年度FY2016
29年度FY2017
(円/年 ¥/year)
年間配当 Dividends per share per year 当期純利益(単体) Net income (Non-consolidated)
227.9227.0
252.1
229.0
301.6298.4288.8
244.8
265.2277.4
209.8
128.3128.5
155.5169.8
161.5157.6151.5156.8159.2172.6171.3
164.8166.9
211.1197.8
174.3159.5
120.3
50.1
381328
260240187
12012388
121153130116
90664341514012
399
150135
384
140414145
125120115105
9590 90 908575
655550 50 50 50 50 50
180.8167.3173.1173.1
143.5136.9
142.9
164.7
138.5
178.9169.3
128.5
68.9
89.386.394.199.1
111.3
87.399.897.6100.1
87.174.270.972.7
80.671.8
96.182.6
39.1
102.9
32.1
5.0
0
50
100
150
0
150
300
450
設備投資と配当(単体) Capital Investment and Dividend (Non-consolidated)
17
250.2
134.2
30年度FY2018
170.1
220.5228.2
令和元年度(計画)FY2019(Planned)
10年度
12年度
11年度
13年度
14年度
15年度
16年度
17年度
18年度
19年度
20年度
21年度
22年度
FY1998
FY1999
FY2001
FY2000
FY2002
FY2003
FY2004
FY2005
FY2006
FY2007
FY2008
FY2009
FY2010
23年度FY2011
24年度FY2012
25年度FY2013
27年度FY2015
26年度FY2014
28年度FY2016
29年度FY2017
30年度FY2018
令和元年度(計画)FY2019(Planned)
273.0
211.0
310.0
事業概要 Overview 鉄道事業 Railway Business 関連事業 Affiliated Businesses 財務・経営 Financial and Managerial Data 沿革 History
5.16 5.08 5.014.91 4.75 4.62 4.51 4.30 4.08
3.91
5.215.435.845.906.196.396.53
3.71
6.81 6.35 6.01 6.08
3.54 3.36 3.24 3.14 3.13 3.10 3.122.00 1.66 1.65
長期債務総額の推移(単体) Total Long-term Debt and Payables (Non-consolidated)
新幹線債務の残高 Long-term Accounts Payable-railway Facilities(100万円 ¥ million)
平成30(2018)年度末残高
Outstanding atthe End ofMarch 2019
平成3(1991)年10月1日
October 1, 1991
支払期間Payment Schedule
支払方法Payment Method
利 率Interest Rate
1号No.1
平成3(1991)年10月1日~平成29(2017)年3月31日October 1, 1991 to March 31, 2017
ーー
2号No.2
平成3(1991)年10月1日~平成29(2017)年3月31日October 1, 1991 to March 31, 2017
元利均等半年賦支払Interest and principal paid in equal installments,semiannually
固定Fixed 6.35% ー
3号No.3
合計 Total
平成3(1991)年10月1日~令和33(2051)年9月30日October 1, 1991 to September 30, 2051
固定Fixed 6.55% 538,443
538,443
3,447,268
1,047,197
601,195
5,095,661
独立行政法人鉄道建設・運輸施設整備支援機構からの長期借入Long-Term Loan from the Japan Railway Construction, Transport and Technology Agency
第4回 Fourth第1回 First 第2回 Second 第3回 Third
借入額 Amount
(10億円 ¥ billion)
500.00.6% 0.8% 0.9% 0.9%
500.0 500.0 750.0
第5回 Fifth
1.0%750.0
利率Interest Rate 全期間固定 Fixed throughout entire period
借入実行日Borrowing Date
弁済期限Maturity Date
返済方法RepaymentMethod
担保 Security
平成28(2016)年11月29日November 29, 2016
平成29(2017)年1月16日January 16, 2017
平成29(2017)年3月10日March 10, 2017
平成29(2017)年5月17日May 17, 2017
令和37(2055)年11月29日November 29, 2055
令和38(2056)年1月16日January 16, 2056
令和38(2056)年3月10日March 10, 2056
令和37(2055)年11月17日November 17, 2055
令和28(2046)年5月まで据置Deferred up to May 2046
令和28(2046)年7月まで据置Deferred up to July 2046
以降、元金均等返済 Equal principal repayment thereafter無担保 Unsecured
令和28(2046)年9月まで据置Deferred up to September 2046
令和28(2046)年5月まで据置Deferred up to May 2046
平成29(2017)年7月12日July 12, 2017
令和38(2056)年1月12日January 12, 2056
令和28(2046)年7月まで据置Deferred up to July 2046
(10億円 ¥ billion)
0
3,000
2,000
1,000
4,000
5,000
6,000
0
6.0
4.0
2.0
8.0
10.0
鉄道施設購入長期未払金Long-term Accounts Payable-railway Facilities
長期借入金Long-term Debt
社債Corporate Bonds
新幹線貸付制度下の実質的な債務Latent Liabilities Born by the Shinkansen Leasing System
中央新幹線建設長期借入金Long-term Debt for the Chuo Shinkansen Construction
注 1. 昭和62(1987)~平成2(1990)年度の「債務増減額」の数値は「小計」の増減を示す 2. 平成3(1991)~5(1993)年度の「長期債務合計」の増減と「債務増減額」の不一致は、「鉄道施設購入長期未払金」の増加(平成3(1991)年度:51,032億円、平成4(1992)年度:39億円、平成5(1993)年度:9億円)によるNotes: 1. For FY1987 through FY1990, the "Change in Total Long-term Debt and Payables" is based on the amount in the "Subtotal" category. 2. For FY1991 through FY1993, the "Change in Total Long-term Debt and Payables" is not equivalent to the difference from the previous term's "Total Long-term Debt and Payables" owing to increases in "Long-term Accounts Payable-railway Facilities" (¥5,103.2 billion in FY1991, ¥3.9 billion in FY1992, and ¥0.9 billion in FY1993).
支払利息Interest Expenses
債務増減額Change in Total Long-term Debt and Payables
資金調達額Amount of Fund-Raising
長期債務合計Total Long-term Debt and Payables
新幹線貸付制度下の実質的な債務Latent Liabilities Born by the Shinkansen Leasing System中央新幹線建設長期借入金Long-term Debt for the Chuo Shinkansen Construction
小計Subtotal
鉄道施設購入長期未払金Long-term Accounts Payable-railway Facilities
長期借入金Long-term Debt
社債Corporate Bonds
承継債務Inherited Liabilities -
240.0
628.9
3,256.6
4,125.5
-
-
4,125.5
99.5
△163.7
204.0
-
564.9
646.6
2,204.0
3,415.6
-
-
3,415.6
321.8
△40.0
148.2
-
415.0
584.5
2,456.2
3,455.7
-
-
3,455.7
170.0
△210.0
158.6
-
285.0
635.4
3,023.0
3,943.4
-
-
3,943.4
82.0
△182.0
190.7
278.8
18.8
16.0
-
313.6
4,955.7
-
5,269.3
34.8
△5.5
21.9
32.1
115.3
307.5
4,967.2
5,422.3
-
-
5,422.3
92.7
△37.8
349.3
6.6
135.3
367.0
4,882.9
5,392.0
-
-
5,392.0
85.5
△31.3
334.6
3.4
96.9
457.4
4,788.3
5,346.3
-
-
5,346.3
98.7
△45.6
311.6
1.2
38.3
573.2
4,665.7
5,278.5
-
-
5,278.5
126.3
△67.7
310.7
-
50.0
706.7
4,407.5
5,164.3
-
-
5,164.3
178.0
△114.2
286.5
-
100.0
786.6
4,158.5
5,045.2
-
-
5,045.2
147.5
△119.0
267.5
-
130.0
774.7
4,017.5
4,922.2
-
-
4,922.2
40.0
△123.0
259.3
-
180.0
757.9
3,863.0
4,801.0
-
-
4,801.0
105.0
△121.1
250.5
-
160.0
681.8
3,718.9
4,560.8
-
-
4,560.8
-
△240.2
238.7
-
180.0
625.9
3,483.4
4,289.3
-
-
4,289.3
73.0
△271.4
220.7
222.8
38.4
64.1
-
325.3
4,897.7
-
5,223.0
67.7
11.6
20.5
146.4
57.2
147.4
-
351.0
4,881.7
-
5,232.7
102.1
25.7
19.0
112.4
77.0
184.9
-
374.3
4,821.3
-
5,195.6
58.1
23.3
20.5
79.9
95.3
239.6
5,041.2
5,456.2
-
-
5,456.2
75.8
△21.3
190.6
-
335.0
584.7
2,746.1
3,665.8
-
-
3,665.8
123.6
△277.6
176.6
-
669.8
644.3
1,945.8
3,260.1
-
-
3,260.1
209.1
△155.5
136.7
-
809.8
674.6
1,693.0
3,177.6
-
-
3,177.6
247.4
△82.5
124.3
-
969.8
665.4
1,481.6
3,117.0
-
-
3,117.0
288.3
△60.6
115.8
-
1,093.5
620.9
1,287.0
3,001.5
-
-
3,001.5
235.9
△115.4
107.1
-
1,073.0
612.3
1,143.7
2,829.1
-
-
2,829.1
174.7
△172.4
98.3
-
1,016.1
604.1
994.7
2,614.9
-
-
2,614.9
184.0
△214.1
88.7
-
882.9
612.8
855.8
2,351.7
-
-
2,351.7189.6
△263.280.0
-646.1637.9631.51,915.6
--
1,915.6195.6
△220.665.3
-724.2590.9553.81,869.0
-1,500.03,369.01,640.21,453.460.1
-767.3639.2729.62,136.3
--
2,136.3259.6
△215.472.1
承継債務Inherited Liabilities
5,269.3 5,223.0 5,232.7 5,195.65,456.2 5,422.3 5,392.0 5,346.3 5,278.5 5,164.3 5,045.2 4,922.2 4,801.0 4,560.8
4,289.3 4,125.5 3,943.43,665.8 3,455.7 3,415.6 3,260.1 3,177.6 3,117.0 3,001.5 2,829.1 2,614.9
2,351.7 2,136.3 1,915.6
3,369.0
63年度
平成元年度
2年度
3年度
4年度
5年度
6年度
7年度
8年度
9年度
10年度
12年度
11年度
13年度
14年度
15年度
16年度
17年度
18年度
19年度
20年度
21年度
22年度
FY1988
昭和62年度FY1987
FY1989
FY1990
FY1991
FY1992
FY1993
FY1994
FY1995
FY1996
FY1997
FY1998
FY1999
FY2001
FY2000
FY2002
FY2003
FY2004
FY2005
FY2006
FY2007
FY2008
FY2009
FY2010
23年度FY2011
24年度FY2012
25年度FY2013
27年度FY2015
26年度FY2014
28年度FY2016
-734.2572.8549.01,856.2
-3,000.04,856.21,595.21,487.179.1
29年度FY2017
(%)
平均金利(期末) Average Interest Rate (As of each fiscal year-end)
5.16 5.08 5.014.91 4.75 4.62 4.51 4.30 4.08
3.91
5.215.435.845.906.196.396.53
3.71
6.81 6.35 6.01 6.08
3.54 3.36 3.24 3.14 3.13 3.10 3.122.00
4,856.2
1.66
-773.2533.9543.81,851.1
-3,000.04,851.194.5△5.081.2
30年度FY2018
4,851.1
1.65
長期債務(単体) Long-term Debt and Payables (Non-consolidated)18
変動Floating
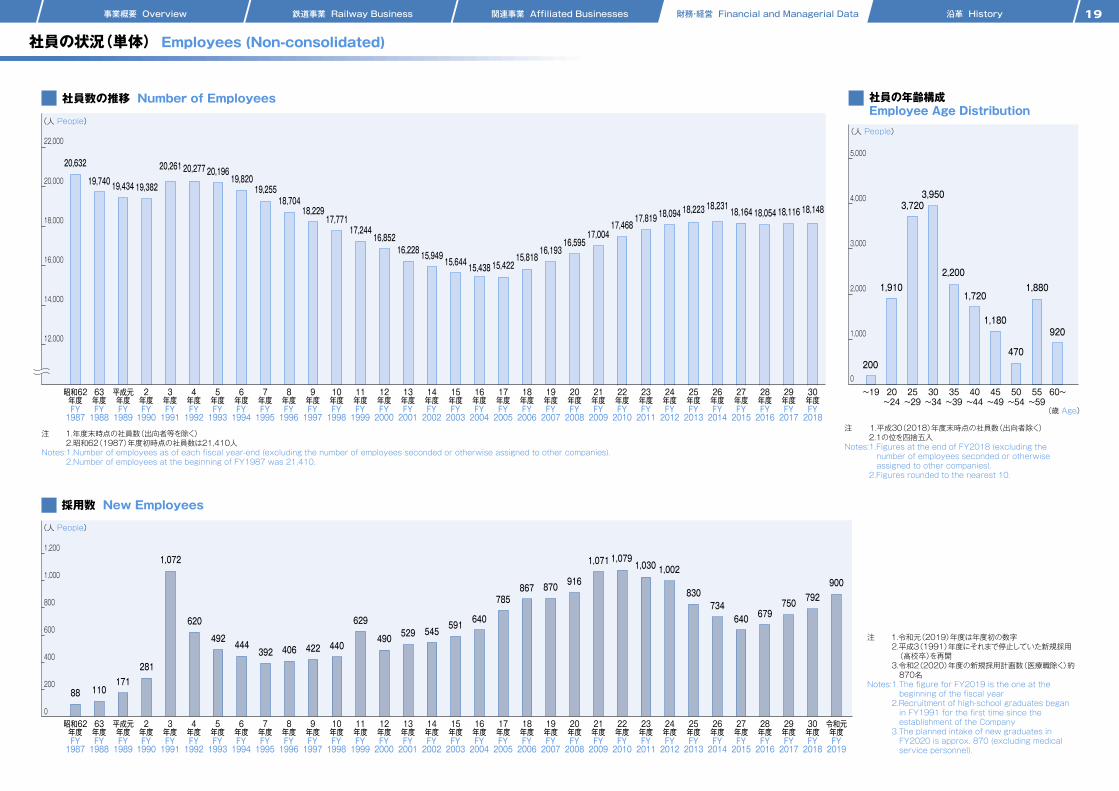
事業概要 Overview 鉄道事業 Railway Business 関連事業 Affiliated Businesses 財務・経営 Financial and Managerial Data 沿革 History
社員数の推移 Number of Employees 社員の年齢構成 Employee Age Distribution
採用数 New Employees
20,632
19,740 19,434 19,382
20,261 20,277 20,19619,820
19,25518,704
18,22917,771
16,85216,228 15,949 15,644 15,438 15,422
15,81816,193
17,244
14,000
12,000
18,000
16,000
20,000
22,000
(人 People)
~19 20~24
25~29
30~34
35~39
40~44
45~49
50~54
55~59
60~0
2,000
1,000
3,000
4,000
5,000
(人 People)
(歳 Age)
11088171
281
1,072
620
492 444392 406 422 440
629529 545
591 640
785867 870 916
490
0
1,200
1,000
800
600
400
200
(人 People)
16,59517,004
63年度
平成元年度
2年度
3年度
4年度
5年度
6年度
7年度
8年度
9年度
10年度
12年度
11年度
13年度
14年度
15年度
16年度
17年度
18年度
19年度
20年度
1,071
21年度
1,079
22年度
17,46817,819 18,094
18,231
FY1988
昭和62年度FY1987
FY1989
FY1990
FY1991
FY1992
FY1993
FY1994
FY1995
FY1996
FY1997
FY1998
FY1999
FY2001
FY2000
FY2002
FY2003
FY2004
FY2005
FY2006
FY2007
FY2008
FY2009
FY2010
1,030
23年度FY2011
1,002
24年度FY2012
830734
25年度FY2013
27年度FY2015
注 1.平成30(2018)年度末時点の社員数(出向者除く)2.1の位を四捨五入
Notes:1.Figures at the end of FY2018 (excluding the number of employees seconded or otherwise assigned to other companies).
2.Figures rounded to the nearest 10.
注 1.年度末時点の社員数(出向者等を除く)2.昭和62(1987)年度初時点の社員数は21,410人
Notes:1.Number of employees as of each fiscal year-end (excluding the number of employees seconded or otherwise assigned to other companies).2.Number of employees at the beginning of FY1987 was 21,410.
注 1.令和元(2019)年度は年度初の数字2.平成3(1991)年度にそれまで停止していた新規採用(高校卒)を再開3.令和2(2020)年度の新規採用計画数(医療職除く)約870名
Notes:1.The figure for FY2019 is the one at the beginning of the fiscal year
2.Recruitment of high-school graduates began in FY1991 for the first time since the establishment of the Company
3.The planned intake of new graduates in FY2020 is approx. 870 (excluding medical service personnel).
18,223
26年度FY2014
640 679
28年度FY2016
63年度
平成元年度
2年度
3年度
4年度
5年度
6年度
7年度
8年度
9年度
10年度
12年度
11年度
13年度
14年度
15年度
16年度
17年度
18年度
19年度
20年度
21年度
22年度
FY1988
昭和62年度FY1987
FY1989
FY1990
FY1991
FY1992
FY1993
FY1994
FY1995
FY1996
FY1997
FY1998
FY1999
FY2001
FY2000
FY2002
FY2003
FY2004
FY2005
FY2006
FY2007
FY2008
FY2009
FY2010
23年度FY2011
24年度FY2012
25年度FY2013
27年度FY2015
26年度FY2014
28年度FY2016
29年度FY2017
18,164 18,054
29年度FY2017
30年度FY2018
社員の状況(単体) Employees (Non-consolidated)
19
920
1,880
470
1,180
1,720
2,200
3,9503,720
1,910
200
18,116
750 792
30年度FY2018
令和元年度FY2019
18,148
900
事業概要 Overview 鉄道事業 Railway Business 関連事業 Affiliated Businesses 財務・経営 Financial and Managerial Data 沿革 History
東海道新幹線 Tokaido Shinkansen在来線 Conventional Lines
■ 旅客運輸収入 Transportation Revenues
■ 輸送人キロ Passenger-Kilometers
(10億円 ¥ billion)
■ 輸送人員 Passenger Ridership
注 輸送人員の合計は新幹線、在来線の重複人員を除いて計上 Note: A passenger using both Shinkansen and conventional lines in a single journey is counted as one ride in the Total rows.
注 端数処理により、内訳の積算と合計が一致しない場合があります。 Note: The figures do not always equal the totals due to rounding.
注 輸送効率の算出方法は次の通り 新幹線座席利用率= 旅客輸送人キロ/座席キロ(編成別列車キロ×座席数)×100 在来線乗車効率=旅客輸送人キロ/(客車走行キロ×平均定員)×100
Note: Figures are calculated as below; For Shinkansen: Passenger Kilometers / Available Seat Kilometers *100 For Conventional Lines: Passenger Kilometers / (Rolling Stock Kilometers * Average Passenger Capacity) *100
(100万人 million passengers)
■ 輸送効率 Transport Efficiency (%)
(100万人キロ million passenger-kilometers)
定期 Commuter Passes定期外 Others計 Total定期 Commuter Passes定期外 Others計 Total定期 Commuter Passes定期外 Others計 Total
定期 Commuter Passes定期外 Others計 Total定期 Commuter Passes定期外 Others計 Total定期 Commuter Passes定期外 Others計 Total
定期 Commuter Passes定期外 Others計 Total定期 Commuter Passes定期外 Others計 Total定期 Commuter Passes定期外 Others計 Total
旅客運賃・料金Transportation Revenues
小荷物運賃・料金 Parcel Fare合計 Total
東海道新幹線 Tokaido Shinkansen
在来線 Conventional Lines
合計 Total
東海道新幹線 Tokaido Shinkansen
在来線 Conventional Lines
小計 Subtotal
東海道新幹線 Tokaido Shinkansen
在来線 Conventional Lines
合計 Total
FY200921年度
FY201022年度
FY201123年度
FY201224年度
FY201325年度
FY201426年度
FY201527年度
FY201628年度
16.2957.3973.633.965.299.250.2
1,022.51,072.8
0.01,072.8
1,35541,33042,6855,4253,5648,9896,77944,89551,674
1,38942,91544,3035,4903,4628,9526,87946,37753,255
14129143254130384266249516
59.132.3
16.6994.41,011.034.062.997.050.6
1,057.41,108.1
0.01,108.1
1,39145,54046,9305,4633,5759,0386,85449,11455,968
14124138252132384264247511
55.632.8
14135149253133387266259524
62.232.7
16.61,053.01,069.634.065.399.450.6
1,118.41,169.0
0.01,169.1
1,44447,42948,8735,5883,6419,2297,03251,07058,102
15140155260135395273265538
63.532.9
17.11,096.71,113.834.366.6100.951.4
1,163.31,214.8
0.01,214.8
1,37542,36643,7415,4763,5259,0016,85145,89152,742
14127141254132386266249515
58.032.7
16.5983.0999.534.164.598.750.6
1,047.61,098.2
0.01,098.3
1,39048,74450,1345,4813,5879,0696,87152,33259,203
14143157257134391269267536
63.632.4
16.91,126.51,143.434.065.799.750.9
1,192.21,243.2
0.01,243.2
1,43150,73452,1665,5683,7349,3026,99954,46861,467
15148163262138401275276551
64.332.8
16.81,175.21,192.033.968.7102.650.7
1,243.91,294.7
0.01,294.7
1,45051,45952,9095,6143,7459,3597,06455,20562,269
15150165265140405278279557
63.932.4
17.31,194.51,211.934.869.1103.952.2
1,263.61,315.8
0.01,315.8
FY201729年度
1,47953,27754,7565,6563,8009,4567,13557,07664,212
15155170269142410281286567
65.532.7
17.61,235.51,253.235.169.9105.152.8
1,305.51,358.3
0.01,358.3
FY201830年度
1,51954,75856,2775,6763,7839,4597,19658,54165,736
15159174271143414284291574
66.432.5
18.11,273.61,291.835.269.5104.853.4
1,343.21,396.6
0.01,396.6
輸送データ Transportation Data20
注 記載が省略されている年度の数値は以下をご覧ください。 URL https://company.jr-central.co.jp/ir/factsheets/
Note: The data of each year omitted here can be found at the URL below URL https://company.jr-central.co.jp/ir/factsheets/
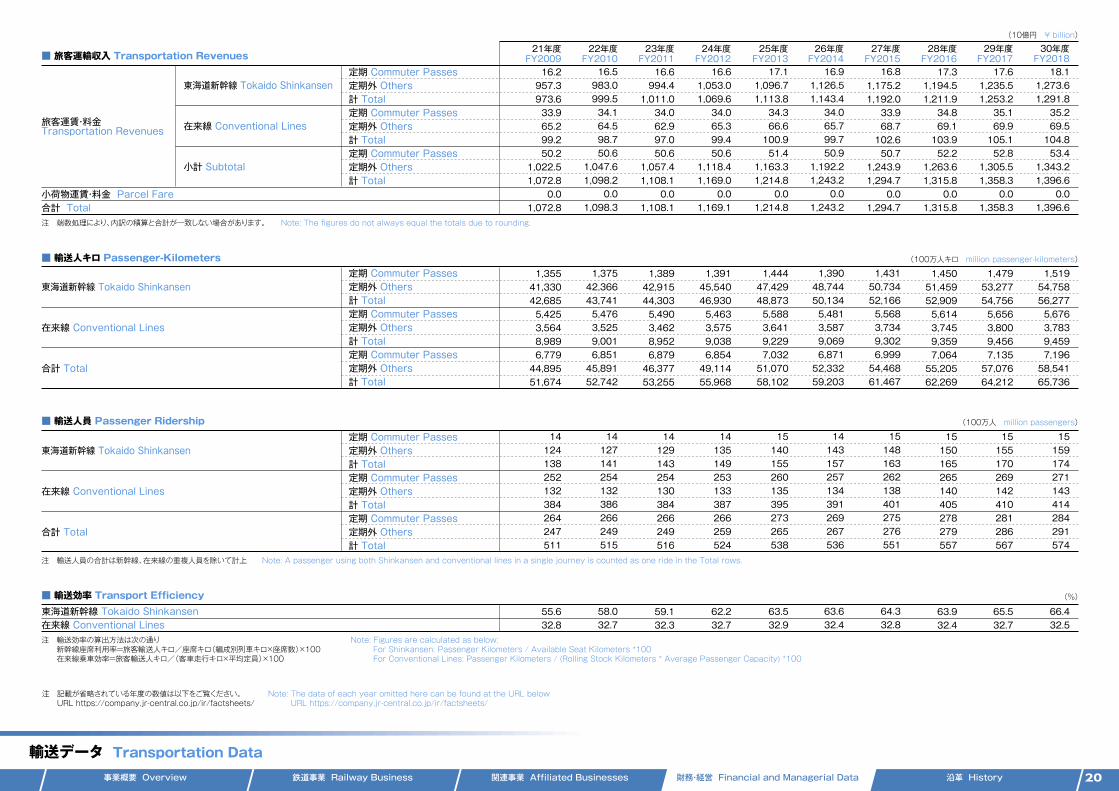
事業概要 Overview 鉄道事業 Railway Business 関連事業 Affiliated Businesses 財務・経営 Financial and Managerial Data 沿革 History
社員数の推移 Number of Employees 社員の年齢構成 Employee Age Distribution
採用数 New Employees
20,632
19,740 19,434 19,382
20,261 20,277 20,19619,820
19,25518,704
18,22917,771
16,85216,228 15,949 15,644 15,438 15,422
15,81816,193
17,244
14,000
12,000
18,000
16,000
20,000
22,000
(人 People)
~19 20~24
25~29
30~34
35~39
40~44
45~49
50~54
55~59
60~0
2,000
1,000
3,000
4,000
5,000
(人 People)
(歳 Age)
11088171
281
1,072
620
492 444392 406 422 440
629529 545
591 640
785867 870 916
490
0
1,200
1,000
800
600
400
200
(人 People)
16,59517,004
63年度
平成元年度
2年度
3年度
4年度
5年度
6年度
7年度
8年度
9年度
10年度
12年度
11年度
13年度
14年度
15年度
16年度
17年度
18年度
19年度
20年度
1,071
21年度
1,079
22年度
17,46817,819 18,094
18,231
FY1988
昭和62年度FY1987
FY1989
FY1990
FY1991
FY1992
FY1993
FY1994
FY1995
FY1996
FY1997
FY1998
FY1999
FY2001
FY2000
FY2002
FY2003
FY2004
FY2005
FY2006
FY2007
FY2008
FY2009
FY2010
1,030
23年度FY2011
1,002
24年度FY2012
830734
25年度FY2013
27年度FY2015
注 1.平成30(2018)年度末時点の社員数(出向者除く)2.1の位を四捨五入
Notes:1.Figures at the end of FY2018 (excluding the number of employees seconded or otherwise assigned to other companies).
2.Figures rounded to the nearest 10.
注 1.年度末時点の社員数(出向者等を除く)2.昭和62(1987)年度初時点の社員数は21,410人
Notes:1.Number of employees as of each fiscal year-end (excluding the number of employees seconded or otherwise assigned to other companies).2.Number of employees at the beginning of FY1987 was 21,410.
注 1.令和元(2019)年度は年度初の数字2.平成3(1991)年度にそれまで停止していた新規採用(高校卒)を再開3.令和2(2020)年度の新規採用計画数(医療職除く)約870名
Notes:1.The figure for FY2019 is the one at the beginning of the fiscal year
2.Recruitment of high-school graduates began in FY1991 for the first time since the establishment of the Company
3.The planned intake of new graduates in FY2020 is approx. 870 (excluding medical service personnel).
18,223
26年度FY2014
640 679
28年度FY2016
63年度
平成元年度
2年度
3年度
4年度
5年度
6年度
7年度
8年度
9年度
10年度
12年度
11年度
13年度
14年度
15年度
16年度
17年度
18年度
19年度
20年度
21年度
22年度
FY1988
昭和62年度FY1987
FY1989
FY1990
FY1991
FY1992
FY1993
FY1994
FY1995
FY1996
FY1997
FY1998
FY1999
FY2001
FY2000
FY2002
FY2003
FY2004
FY2005
FY2006
FY2007
FY2008
FY2009
FY2010
23年度FY2011
24年度FY2012
25年度FY2013
27年度FY2015
26年度FY2014
28年度FY2016
29年度FY2017
18,164 18,054
29年度FY2017
30年度FY2018
社員の状況(単体) Employees (Non-consolidated)
19
920
1,880
470
1,180
1,720
2,200
3,9503,720
1,910
200
18,116
750 792
30年度FY2018
令和元年度FY2019
18,148
900
事業概要 Overview 鉄道事業 Railway Business 関連事業 Affiliated Businesses 財務・経営 Financial and Managerial Data 沿革 History
東海道新幹線 Tokaido Shinkansen在来線 Conventional Lines
■ 旅客運輸収入 Transportation Revenues
■ 輸送人キロ Passenger-Kilometers
(10億円 ¥ billion)
■ 輸送人員 Passenger Ridership
注 輸送人員の合計は新幹線、在来線の重複人員を除いて計上 Note: A passenger using both Shinkansen and conventional lines in a single journey is counted as one ride in the Total rows.
注 端数処理により、内訳の積算と合計が一致しない場合があります。 Note: The figures do not always equal the totals due to rounding.
注 輸送効率の算出方法は次の通り 新幹線座席利用率= 旅客輸送人キロ/座席キロ(編成別列車キロ×座席数)×100 在来線乗車効率=旅客輸送人キロ/(客車走行キロ×平均定員)×100
Note: Figures are calculated as below; For Shinkansen: Passenger Kilometers / Available Seat Kilometers *100 For Conventional Lines: Passenger Kilometers / (Rolling Stock Kilometers * Average Passenger Capacity) *100
(100万人 million passengers)
■ 輸送効率 Transport Efficiency (%)
(100万人キロ million passenger-kilometers)
定期 Commuter Passes定期外 Others計 Total定期 Commuter Passes定期外 Others計 Total定期 Commuter Passes定期外 Others計 Total
定期 Commuter Passes定期外 Others計 Total定期 Commuter Passes定期外 Others計 Total定期 Commuter Passes定期外 Others計 Total
定期 Commuter Passes定期外 Others計 Total定期 Commuter Passes定期外 Others計 Total定期 Commuter Passes定期外 Others計 Total
旅客運賃・料金Transportation Revenues
小荷物運賃・料金 Parcel Fare合計 Total
東海道新幹線 Tokaido Shinkansen
在来線 Conventional Lines
合計 Total
東海道新幹線 Tokaido Shinkansen
在来線 Conventional Lines
小計 Subtotal
東海道新幹線 Tokaido Shinkansen
在来線 Conventional Lines
合計 Total
FY200921年度
FY201022年度
FY201123年度
FY201224年度
FY201325年度
FY201426年度
FY201527年度
FY201628年度
16.2957.3973.633.965.299.250.2
1,022.51,072.8
0.01,072.8
1,35541,33042,6855,4253,5648,9896,77944,89551,674
1,38942,91544,3035,4903,4628,9526,87946,37753,255
14129143254130384266249516
59.132.3
16.6994.41,011.034.062.997.050.6
1,057.41,108.1
0.01,108.1
1,39145,54046,9305,4633,5759,0386,85449,11455,968
14124138252132384264247511
55.632.8
14135149253133387266259524
62.232.7
16.61,053.01,069.634.065.399.450.6
1,118.41,169.0
0.01,169.1
1,44447,42948,8735,5883,6419,2297,03251,07058,102
15140155260135395273265538
63.532.9
17.11,096.71,113.834.366.6100.951.4
1,163.31,214.8
0.01,214.8
1,37542,36643,7415,4763,5259,0016,85145,89152,742
14127141254132386266249515
58.032.7
16.5983.0999.534.164.598.750.6
1,047.61,098.2
0.01,098.3
1,39048,74450,1345,4813,5879,0696,87152,33259,203
14143157257134391269267536
63.632.4
16.91,126.51,143.434.065.799.750.9
1,192.21,243.2
0.01,243.2
1,43150,73452,1665,5683,7349,3026,99954,46861,467
15148163262138401275276551
64.332.8
16.81,175.21,192.033.968.7102.650.7
1,243.91,294.7
0.01,294.7
1,45051,45952,9095,6143,7459,3597,06455,20562,269
15150165265140405278279557
63.932.4
17.31,194.51,211.934.869.1103.952.2
1,263.61,315.8
0.01,315.8
FY201729年度
1,47953,27754,7565,6563,8009,4567,13557,07664,212
15155170269142410281286567
65.532.7
17.61,235.51,253.235.169.9105.152.8
1,305.51,358.3
0.01,358.3
FY201830年度
1,51954,75856,2775,6763,7839,4597,19658,54165,736
15159174271143414284291574
66.432.5
18.11,273.61,291.835.269.5104.853.4
1,343.21,396.6
0.01,396.6
輸送データ Transportation Data20
注 記載が省略されている年度の数値は以下をご覧ください。 URL https://company.jr-central.co.jp/ir/factsheets/
Note: The data of each year omitted here can be found at the URL below URL https://company.jr-central.co.jp/ir/factsheets/
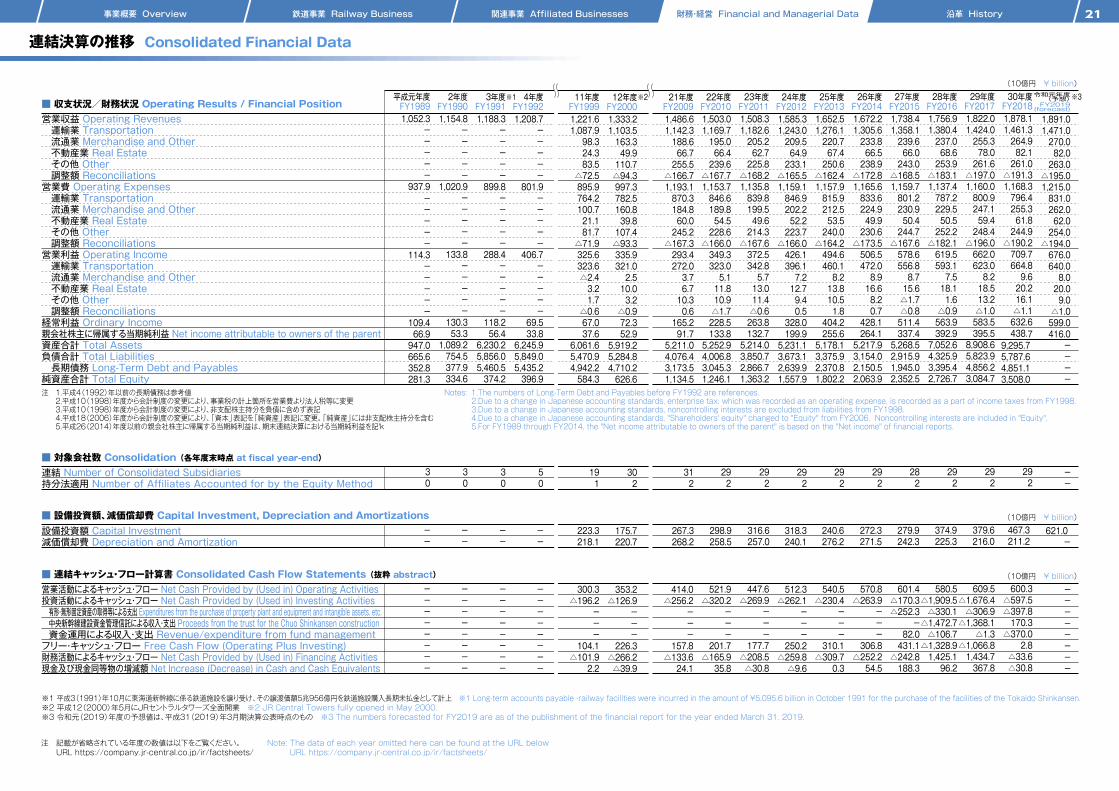
事業概要 Overview 鉄道事業 Railway Business 関連事業 Affiliated Businesses 財務・経営 Financial and Managerial Data 沿革 History
営業収益 Operating Revenues 運輸業 Transportation 流通業 Merchandise and Other 不動産業 Real Estate その他 Other 調整額 Reconciliations営業費 Operating Expenses 運輸業 Transportation 流通業 Merchandise and Other 不動産業 Real Estate その他 Other 調整額 Reconciliations営業利益 Operating Income 運輸業 Transportation 流通業 Merchandise and Other 不動産業 Real Estate その他 Other 調整額 Reconciliations経常利益 Ordinary Income親会社株主に帰属する当期純利益 Net income attributable to owners of the parent資産合計 Total Assets負債合計 Total Liabilities 長期債務 Long-Term Debt and Payables純資産合計 Total Equity
連結 Number of Consolidated Subsidiaries持分法適用 Number of Affiliates Accounted for by the Equity Method
設備投資額 Capital Investment減価償却費 Depreciation and Amortization
■ 収支状況/財務状況 Operating Results / Financial Position
営業活動によるキャッシュ・フロー Net Cash Provided by (Used in) Operating Activities投資活動によるキャッシュ・フロー Net Cash Provided by (Used in) Investing Activities 有形・無形固定資産の取得等による支出 Expenditures from the purchase of property plant and equipment and intangible assets, etc. 中央新幹線建設資金管理信託による収入・支出 Proceeds from the trust for the Chuo Shinkansen construction 資金運用による収入・支出 Revenue/expenditure from fund managementフリー・キャッシュ・フロー Free Cash Flow (Operating Plus Investing)財務活動によるキャッシュ・フロー Net Cash Provided by (Used in) Financing Activities現金及び現金同等物の増減額 Net Increase (Decrease) in Cash and Cash Equivalents
■ 対象会社数 Consolidation (各年度末時点 at fiscal year-end)
■ 設備投資額、減価償却費 Capital Investment, Depreciation and Amortizations
■ 連結キャッシュ・フロー計算書 Consolidated Cash Flow Statements (抜粋 abstract)
(10億円 ¥ billion)
(10億円 ¥ billion)
(10億円 ¥ billion)
※312年度FY2000
175.7220.7
302
353.2△126.9
---
226.3△266.2△39.9
1,333.21,103.5163.349.9110.7△94.3997.3782.5160.839.8107.4△93.3335.9321.02.510.03.2△0.972.352.9
5,919.25,284.84,710.2626.6
11年度FY1999
223.3218.1
191
300.3△196.2
---
104.1△101.9
2.2
1,221.61,087.998.324.383.5△72.5895.9764.2100.721.181.7△71.9325.6323.6△2.43.21.7△0.667.037.6
6,061.65,470.94,942.2584.3
4年度FY1992
--
50
--------
1,208.7-----
801.9-----
406.7-----
69.533.8
6,245.95,849.05,435.2396.9
3年度FY1991
--
30
--------
1,188.3-----
899.8-----
288.4-----
118.256.4
6,230.25,856.05,460.5374.2
2年度FY1990
--
30
--------
1,154.8-----
1,020.9-----
133.8-----
130.353.3
1,089.2754.5377.9334.6
平成元年度FY1989
--
30
--------
1,052.3-----
937.9-----
114.3-----
109.466.9947.0665.6352.8281.3
FY200921年度
414.0△256.2
---
157.8△133.624.1
267.3268.2
312
1,486.61,142.3188.666.7255.5△166.71,193.1870.3184.860.0245.2△167.3293.4272.03.76.710.30.6
165.291.7
5,211.04,076.43,173.51,134.5
FY201022年度
521.9△320.2
---
201.7△165.935.8
298.9258.5
1,503.01,169.7195.066.4239.6△167.71,153.7846.6189.854.5228.6△166.0349.3323.05.111.810.9△1.7228.5133.85,252.94,006.83,045.31,246.1
292
FY201123年度
292
316.6257.0
447.6△269.9
---
177.7△208.5△30.8
1,508.31,182.6205.262.7225.8△168.21,135.8839.8199.549.6214.3△167.6372.5342.85.713.011.4△0.6263.8132.75,214.03,850.72,866.71,363.2
FY201527年度
279.9242.3
601.4△170.3△252.3
-82.0431.1△242.8188.3
282
1,738.41,358.1239.666.0243.0△168.51,159.7801.2230.950.4244.7△167.6578.6556.88.715.6△1.7△0.8511.4337.45,268.52,915.91,945.02,352.5
FY201628年度
374.9225.3
580.5△1,909.5△330.1△1,472.7△106.7△1,328.91,425.196.2
292
1,756.91,380.4237.068.6253.9△183.11,137.4787.2229.550.5252.2△182.1619.5593.17.518.11.6△0.9563.9392.97,052.64,325.93,395.42,726.7
FY201729年度 30年度
379.6216.0
609.5△1,676.4△306.9△1,368.1
△1.3△1,066.81,434.7367.8
292
1,822.01,424.0255.378.0261.6△197.01,160.0800.9247.159.4248.4△196.0662.0623.08.218.513.2△1.0583.5395.58,908.65,823.94,856.23,084.7
FY2018
467.3 211.2
600.3△597.5△397.8170.3△370.0
2.8△33.6△30.8
292
1,878.11,461.3264.982.1261.0△191.31,168.3796.4255.361.8244.9△190.2709.7664.89.620.216.1△1.1632.6438.7
9,295.7 5,787.6 4,851.1 3,508.0
令和元年度(予想)FY2019(forecast)
621.0 -
--------
--
1,891.01,471.0270.082.0263.0△195.01,215.0831.0262.062.0254.0△194.0676.0640.08.020.09.0△1.0599.0416.0
----
FY201224年度
318.3240.1
512.3△262.1
---
250.2△259.8△9.6
292
1,585.31,243.0209.564.9233.1△165.51,159.1846.9202.252.2223.7△166.0426.1396.17.212.79.40.5
328.0199.95,231.13,673.12,639.91,557.9
FY201325年度
240.6276.2
540.5△230.4
---
310.1△309.7
0.3
292
1,652.51,276.1220.767.4250.6△162.41,157.9815.9212.553.5240.0△164.2494.6460.18.213.810.51.8
404.2255.65,178.13,375.92,370.81,802.2
FY201426年度
272.3271.5
570.8△263.9
---
306.8△252.254.5
292
1,672.21,305.6233.866.5238.9△172.81,165.6833.6224.949.9230.6△173.5506.5472.08.916.68.20.7
428.1264.15,217.93,154.02,150.52,063.9
注 1.平成4(1992)年以前の長期債務は参考値 2.平成10(1998)年度から会計制度の変更により、事業税の計上箇所を営業費より法人税等に変更 3.平成10(1998)年度から会計制度の変更により、非支配株主持分を負債に含めず表記 4.平成18(2006)年度から会計制度の変更により、「資本」表記を「純資産」表記に変更。「純資産」には非支配株主持分を含む 5.平成26(2014)年度以前の親会社株主に帰属する当期純利益は、期末連結決算における当期純利益を記載
Notes: 1.The numbers of Long-Term Debt and Payables before FY1992 are references.2.Due to a change in Japanese accounting standards, enterprise tax, which was recorded as an operating expense, is recorded as a part of income taxes from FY1998.3.Due to a change in Japanese accounting standards, noncontrolling interests are excluded from liabilities from FY1998.4.Due to a change in Japanese accounting standards, "Shareholders' equity" changed to "Equity" from FY2006. Noncontrolling interests are included in "Equity".5.For FY1989 through FY2014, the "Net income attributable to owners of the parent" is based on the "Net income" of financial reports.
連結決算の推移 Consolidated Financial Data
21
※1 平成3(1991)年10月に東海道新幹線に係る鉄道施設を譲り受け、その譲渡価額5兆956億円を鉄道施設購入長期未払金として計上 ※1 Long-term accounts payable -railway facilities were incurred in the amount of ¥5,095.6 billion in October 1991 for the purchase of the facilities of the Tokaido Shinkansen.※2 平成12(2000)年5月にJRセントラルタワーズ全面開業 ※2 JR Central Towers fully opened in May 2000.※3 令和元(2019)年度の予想値は、平成31(2019)年3月期決算公表時点のもの ※3 The numbers forecasted for FY2019 are as of the publishment of the financial report for the year ended March 31, 2019.
※1 ※2
注 記載が省略されている年度の数値は以下をご覧ください。 URL https://company.jr-central.co.jp/ir/factsheets/
Note: The data of each year omitted here can be found at the URL below URL https://company.jr-central.co.jp/ir/factsheets/
事業概要 Overview 鉄道事業 Railway Business 関連事業 Affiliated Businesses 財務・経営 Financial and Managerial Data 沿革 History
22.4
19.4
15.815.5
12.6
8.88.9
6.28.0
10.29.2
8.36.8
5.23.63.1
4.03.1
0.9
21.7 23.4
売上高営業利益率Operating Income/Operating Revenues売上高経常利益率Ordinary Income/Operating Revenues売上高当期純利益率Net Income/Operating Revenues
%
%
%
自己資本当期純利益率(ROE)Return on Equity売上高当期純利益率Net Income/Operating Revenues総資産回転率Asset Turnover財務レバレッジFinancial Leverage総資産営業利益率Operating Income/Total Assets自己資本比率Equity Ratio負債比率Debt to Equity RatioインタレストカバレッジレシオInterest Coverage RatioEBITDAEarnings Before Interest,Taxes,Depreciation and Amortization1株当たり当期純利益Earnings per Share1株当たり純資産Shareholders' Equity per Share1株当たり配当額Dividend per Share配当性向Dividend Payout Ratio純資産配当率Dividend on Equity Ratio
%
%
回Times倍Times
%
%
%
倍Times10億円¥Billion円¥円¥円¥
%
%
■ 単体 Non-consolidated
■ 連結 Consolidated
■ EBITDAと売上高当期純利益の推移 EBITDA and Net Income/Operating Revenues
注 1.EBITDAは 営業利益+減価償却費 により算出2.インタレストカバレッジレシオは(営業利益+受取利息・配当金)/支払利息 で計算3.平成24(2012)年度の1株当たりの数値については、平成24(2012)年10月1日を効力発生日として、普通株式1株を100株に分割し、1単元の株式の数を100株とする単元株制度を採用したことを受け、期首に当該株式分割が行われたと仮定して算定
Notes: 1.EBITDA represents operating income plus depreciation and amortization.2.Interest coverage ratio is calculated as "the sum of operating income and interest and dividend income" devided by "interest expense".3.As of the effective date, October 1, 2012, the Company split 1 share of common stock into 100 shares, and adopted a share unit system under which the number of shares constituting 1 unit is 100 shares. Therefore, the Company calculated Shareholders' Equity per Share, EPS and Dividend per Share on the basis that such stock split was made at the beginning of the previous consolidated fiscal year and previous business year.
16年度FY2004
15年度FY2003
14年度FY2002
13年度FY2001
12年度FY2000
11年度FY1999
平成10年度FY1998
17年度FY2005
18年度FY2006
19年度FY2007
20年度FY2008 FY2009
21年度FY201022年度
FY201123年度
FY201224年度
FY201325年度
FY201426年度
FY201527年度
FY201628年度
(10億円 ¥ billion) (%)
400
600
800
0
15
10
5
20
25
EBITDA Earnings Before Interest,Taxes,Depreciation and Amortization 売上高当期純利益率 Net Income/Operating Revenues
22.4
19.4
15.815.5
12.6
8.88.9
6.28.0
10.29.2
8.36.8
5.23.63.1
4.03.1
0.9
844.9
FY201729年度
821.0778.1770.8
666.3629.5
607.9561.6
640.6662.9
617.7638.6
598.6569.8562.4
592.4556.7543.8541.3
11.96.80.36.26.516.0522.71.9
598.642,806379,8715,50012.81.5
28.811.17.9
13.48.30.35.57.618.3443.82.5
638.654,560434,9176,50011.91.6
32.016.39.7
15.69.20.36.57.715.3552.12.7
617.769,407400,8967,50010.81.8
31.417.910.7
18.710.20.35.68.417.8461.03.2
662.981,106464,4678,50010.52.0
32.720.312.2
13.18.00.35.27.419.4412.83.0
640.664,023513,2339,00014.11.8
29.216.19.8
8.76.20.34.85.621.0371.72.5
561.646,574555,9999,00019.31.7
24.013.07.7
10.58.80.33.97.125.3291.43.8
629.56746,7159,50014.11.5
29.220.210.2
14.112.60.33.58.228.9242.74.8
666.31,0167,68910510.31.5
32.124.315.1
15.715.50.33.09.533.9192.56.2
770.81,2998,9111158.91.4
36.129.118.8
11.68.90.34.46.723.0332.13.2
607.967,990613,1349,00013.21.5
27.817.710.5
14.015.80.32.69.738.7156.17.0
778.11,34210,2651208.91.3
36.430.419.9
15.619.40.32.311.044.0125.98.9
821.01,71411,7701257.31.1
41.136.124.2
15.722.40.32.610.138.2160.710.3844.91,99613,6811356.81.1
43.239.227.7
13.821.70.22.98.334.3190.68.5
878.02,01515,6021406.91.0
43.838.426.9
13.423.40.22.77.837.3166.78.9
921.02,23817,7031456.50.9
45.640.328.3
29.45.94.6
8.74.00.29.45.610.6843.41.4
556.723,643279,7335,00021.11.8
30.06.43.8
7.13.10.210.45.49.6
936.21.3
543.816,820260,8725,00029.72.1
30.36.51.1
2.30.90.212.75.67.9
1,164.91.3
541.34,860
211,3395,000102.92.4
31.67.53.7
6.53.10.28.66.411.6760.61.7
592.418,790295,1445,00026.61.7
29.38.23.9
7.23.60.28.06.112.4702.11.6
562.421,801310,0305,00022.91.7
29.010.45.9
9.95.20.37.16.214.0613.01.8
569.832,172342,1265,00015.51.5
経営指標の推移 Financial Statement Ratios22
21.7
878.0
FY201830年度
23.4
921.0
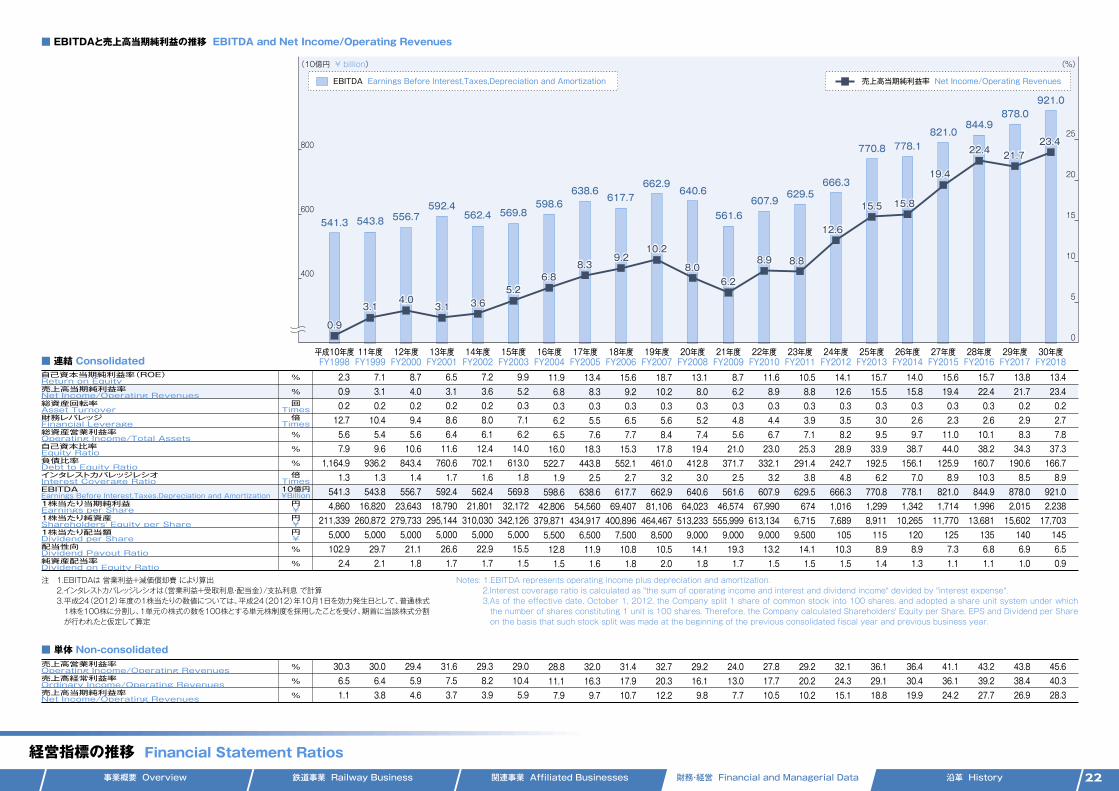
事業概要 Overview 鉄道事業 Railway Business 関連事業 Affiliated Businesses 財務・経営 Financial and Managerial Data 沿革 History
営業収益 Operating Revenues 運輸業 Transportation 流通業 Merchandise and Other 不動産業 Real Estate その他 Other 調整額 Reconciliations営業費 Operating Expenses 運輸業 Transportation 流通業 Merchandise and Other 不動産業 Real Estate その他 Other 調整額 Reconciliations営業利益 Operating Income 運輸業 Transportation 流通業 Merchandise and Other 不動産業 Real Estate その他 Other 調整額 Reconciliations経常利益 Ordinary Income親会社株主に帰属する当期純利益 Net income attributable to owners of the parent資産合計 Total Assets負債合計 Total Liabilities 長期債務 Long-Term Debt and Payables純資産合計 Total Equity
連結 Number of Consolidated Subsidiaries持分法適用 Number of Affiliates Accounted for by the Equity Method
設備投資額 Capital Investment減価償却費 Depreciation and Amortization
■ 収支状況/財務状況 Operating Results / Financial Position
営業活動によるキャッシュ・フロー Net Cash Provided by (Used in) Operating Activities投資活動によるキャッシュ・フロー Net Cash Provided by (Used in) Investing Activities 有形・無形固定資産の取得等による支出 Expenditures from the purchase of property plant and equipment and intangible assets, etc. 中央新幹線建設資金管理信託による収入・支出 Proceeds from the trust for the Chuo Shinkansen construction 資金運用による収入・支出 Revenue/expenditure from fund managementフリー・キャッシュ・フロー Free Cash Flow (Operating Plus Investing)財務活動によるキャッシュ・フロー Net Cash Provided by (Used in) Financing Activities現金及び現金同等物の増減額 Net Increase (Decrease) in Cash and Cash Equivalents
■ 対象会社数 Consolidation (各年度末時点 at fiscal year-end)
■ 設備投資額、減価償却費 Capital Investment, Depreciation and Amortizations
■ 連結キャッシュ・フロー計算書 Consolidated Cash Flow Statements (抜粋 abstract)
(10億円 ¥ billion)
(10億円 ¥ billion)
(10億円 ¥ billion)
※312年度FY2000
175.7220.7
302
353.2△126.9
---
226.3△266.2△39.9
1,333.21,103.5163.349.9110.7△94.3997.3782.5160.839.8107.4△93.3335.9321.02.510.03.2△0.972.352.9
5,919.25,284.84,710.2626.6
11年度FY1999
223.3218.1
191
300.3△196.2
---
104.1△101.9
2.2
1,221.61,087.998.324.383.5△72.5895.9764.2100.721.181.7△71.9325.6323.6△2.43.21.7△0.667.037.6
6,061.65,470.94,942.2584.3
4年度FY1992
--
50
--------
1,208.7-----
801.9-----
406.7-----
69.533.8
6,245.95,849.05,435.2396.9
3年度FY1991
--
30
--------
1,188.3-----
899.8-----
288.4-----
118.256.4
6,230.25,856.05,460.5374.2
2年度FY1990
--
30
--------
1,154.8-----
1,020.9-----
133.8-----
130.353.3
1,089.2754.5377.9334.6
平成元年度FY1989
--
30
--------
1,052.3-----
937.9-----
114.3-----
109.466.9947.0665.6352.8281.3
FY200921年度
414.0△256.2
---
157.8△133.624.1
267.3268.2
312
1,486.61,142.3188.666.7255.5△166.71,193.1870.3184.860.0245.2△167.3293.4272.03.76.710.30.6
165.291.7
5,211.04,076.43,173.51,134.5
FY201022年度
521.9△320.2
---
201.7△165.935.8
298.9258.5
1,503.01,169.7195.066.4239.6△167.71,153.7846.6189.854.5228.6△166.0349.3323.05.111.810.9△1.7228.5133.85,252.94,006.83,045.31,246.1
292
FY201123年度
292
316.6257.0
447.6△269.9
---
177.7△208.5△30.8
1,508.31,182.6205.262.7225.8△168.21,135.8839.8199.549.6214.3△167.6372.5342.85.713.011.4△0.6263.8132.75,214.03,850.72,866.71,363.2
FY201527年度
279.9242.3
601.4△170.3△252.3
-82.0431.1△242.8188.3
282
1,738.41,358.1239.666.0243.0△168.51,159.7801.2230.950.4244.7△167.6578.6556.88.715.6△1.7△0.8511.4337.45,268.52,915.91,945.02,352.5
FY201628年度
374.9225.3
580.5△1,909.5△330.1△1,472.7△106.7△1,328.91,425.196.2
292
1,756.91,380.4237.068.6253.9△183.11,137.4787.2229.550.5252.2△182.1619.5593.17.518.11.6△0.9563.9392.97,052.64,325.93,395.42,726.7
FY201729年度 30年度
379.6216.0
609.5△1,676.4△306.9△1,368.1
△1.3△1,066.81,434.7367.8
292
1,822.01,424.0255.378.0261.6△197.01,160.0800.9247.159.4248.4△196.0662.0623.08.218.513.2△1.0583.5395.58,908.65,823.94,856.23,084.7
FY2018
467.3 211.2
600.3△597.5△397.8170.3△370.0
2.8△33.6△30.8
292
1,878.11,461.3264.982.1261.0△191.31,168.3796.4255.361.8244.9△190.2709.7664.89.620.216.1△1.1632.6438.7
9,295.7 5,787.6 4,851.1 3,508.0
令和元年度(予想)FY2019(forecast)
621.0 -
--------
--
1,891.01,471.0270.082.0263.0△195.01,215.0831.0262.062.0254.0△194.0676.0640.08.020.09.0△1.0599.0416.0
----
FY201224年度
318.3240.1
512.3△262.1
---
250.2△259.8△9.6
292
1,585.31,243.0209.564.9233.1△165.51,159.1846.9202.252.2223.7△166.0426.1396.17.212.79.40.5
328.0199.95,231.13,673.12,639.91,557.9
FY201325年度
240.6276.2
540.5△230.4
---
310.1△309.7
0.3
292
1,652.51,276.1220.767.4250.6△162.41,157.9815.9212.553.5240.0△164.2494.6460.18.213.810.51.8
404.2255.65,178.13,375.92,370.81,802.2
FY201426年度
272.3271.5
570.8△263.9
---
306.8△252.254.5
292
1,672.21,305.6233.866.5238.9△172.81,165.6833.6224.949.9230.6△173.5506.5472.08.916.68.20.7
428.1264.15,217.93,154.02,150.52,063.9
注 1.平成4(1992)年以前の長期債務は参考値 2.平成10(1998)年度から会計制度の変更により、事業税の計上箇所を営業費より法人税等に変更 3.平成10(1998)年度から会計制度の変更により、非支配株主持分を負債に含めず表記 4.平成18(2006)年度から会計制度の変更により、「資本」表記を「純資産」表記に変更。「純資産」には非支配株主持分を含む 5.平成26(2014)年度以前の親会社株主に帰属する当期純利益は、期末連結決算における当期純利益を記載
Notes: 1.The numbers of Long-Term Debt and Payables before FY1992 are references.2.Due to a change in Japanese accounting standards, enterprise tax, which was recorded as an operating expense, is recorded as a part of income taxes from FY1998.3.Due to a change in Japanese accounting standards, noncontrolling interests are excluded from liabilities from FY1998.4.Due to a change in Japanese accounting standards, "Shareholders' equity" changed to "Equity" from FY2006. Noncontrolling interests are included in "Equity".5.For FY1989 through FY2014, the "Net income attributable to owners of the parent" is based on the "Net income" of financial reports.
連結決算の推移 Consolidated Financial Data
21
※1 平成3(1991)年10月に東海道新幹線に係る鉄道施設を譲り受け、その譲渡価額5兆956億円を鉄道施設購入長期未払金として計上 ※1 Long-term accounts payable -railway facilities were incurred in the amount of ¥5,095.6 billion in October 1991 for the purchase of the facilities of the Tokaido Shinkansen.※2 平成12(2000)年5月にJRセントラルタワーズ全面開業 ※2 JR Central Towers fully opened in May 2000.※3 令和元(2019)年度の予想値は、平成31(2019)年3月期決算公表時点のもの ※3 The numbers forecasted for FY2019 are as of the publishment of the financial report for the year ended March 31, 2019.
※1 ※2
注 記載が省略されている年度の数値は以下をご覧ください。 URL https://company.jr-central.co.jp/ir/factsheets/
Note: The data of each year omitted here can be found at the URL below URL https://company.jr-central.co.jp/ir/factsheets/
事業概要 Overview 鉄道事業 Railway Business 関連事業 Affiliated Businesses 財務・経営 Financial and Managerial Data 沿革 History
22.4
19.4
15.815.5
12.6
8.88.9
6.28.0
10.29.2
8.36.8
5.23.63.1
4.03.1
0.9
21.7 23.4
売上高営業利益率Operating Income/Operating Revenues売上高経常利益率Ordinary Income/Operating Revenues売上高当期純利益率Net Income/Operating Revenues
%
%
%
自己資本当期純利益率(ROE)Return on Equity売上高当期純利益率Net Income/Operating Revenues総資産回転率Asset Turnover財務レバレッジFinancial Leverage総資産営業利益率Operating Income/Total Assets自己資本比率Equity Ratio負債比率Debt to Equity RatioインタレストカバレッジレシオInterest Coverage RatioEBITDAEarnings Before Interest,Taxes,Depreciation and Amortization1株当たり当期純利益Earnings per Share1株当たり純資産Shareholders' Equity per Share1株当たり配当額Dividend per Share配当性向Dividend Payout Ratio純資産配当率Dividend on Equity Ratio
%
%
回Times倍Times
%
%
%
倍Times10億円¥Billion円¥円¥円¥
%
%
■ 単体 Non-consolidated
■ 連結 Consolidated
■ EBITDAと売上高当期純利益の推移 EBITDA and Net Income/Operating Revenues
注 1.EBITDAは 営業利益+減価償却費 により算出2.インタレストカバレッジレシオは(営業利益+受取利息・配当金)/支払利息 で計算3.平成24(2012)年度の1株当たりの数値については、平成24(2012)年10月1日を効力発生日として、普通株式1株を100株に分割し、1単元の株式の数を100株とする単元株制度を採用したことを受け、期首に当該株式分割が行われたと仮定して算定
Notes: 1.EBITDA represents operating income plus depreciation and amortization.2.Interest coverage ratio is calculated as "the sum of operating income and interest and dividend income" devided by "interest expense".3.As of the effective date, October 1, 2012, the Company split 1 share of common stock into 100 shares, and adopted a share unit system under which the number of shares constituting 1 unit is 100 shares. Therefore, the Company calculated Shareholders' Equity per Share, EPS and Dividend per Share on the basis that such stock split was made at the beginning of the previous consolidated fiscal year and previous business year.
16年度FY2004
15年度FY2003
14年度FY2002
13年度FY2001
12年度FY2000
11年度FY1999
平成10年度FY1998
17年度FY2005
18年度FY2006
19年度FY2007
20年度FY2008 FY2009
21年度FY201022年度
FY201123年度
FY201224年度
FY201325年度
FY201426年度
FY201527年度
FY201628年度
(10億円 ¥ billion) (%)
400
600
800
0
15
10
5
20
25
EBITDA Earnings Before Interest,Taxes,Depreciation and Amortization 売上高当期純利益率 Net Income/Operating Revenues
22.4
19.4
15.815.5
12.6
8.88.9
6.28.0
10.29.2
8.36.8
5.23.63.1
4.03.1
0.9
844.9
FY201729年度
821.0778.1770.8
666.3629.5
607.9561.6
640.6662.9
617.7638.6
598.6569.8562.4
592.4556.7543.8541.3
11.96.80.36.26.516.0522.71.9
598.642,806379,8715,50012.81.5
28.811.17.9
13.48.30.35.57.618.3443.82.5
638.654,560434,9176,50011.91.6
32.016.39.7
15.69.20.36.57.715.3552.12.7
617.769,407400,8967,50010.81.8
31.417.910.7
18.710.20.35.68.417.8461.03.2
662.981,106464,4678,50010.52.0
32.720.312.2
13.18.00.35.27.419.4412.83.0
640.664,023513,2339,00014.11.8
29.216.19.8
8.76.20.34.85.621.0371.72.5
561.646,574555,9999,00019.31.7
24.013.07.7
10.58.80.33.97.125.3291.43.8
629.56746,7159,50014.11.5
29.220.210.2
14.112.60.33.58.228.9242.74.8
666.31,0167,68910510.31.5
32.124.315.1
15.715.50.33.09.533.9192.56.2
770.81,2998,9111158.91.4
36.129.118.8
11.68.90.34.46.723.0332.13.2
607.967,990613,1349,00013.21.5
27.817.710.5
14.015.80.32.69.738.7156.17.0
778.11,34210,2651208.91.3
36.430.419.9
15.619.40.32.311.044.0125.98.9
821.01,71411,7701257.31.1
41.136.124.2
15.722.40.32.610.138.2160.710.3844.91,99613,6811356.81.1
43.239.227.7
13.821.70.22.98.334.3190.68.5
878.02,01515,6021406.91.0
43.838.426.9
13.423.40.22.77.837.3166.78.9
921.02,23817,7031456.50.9
45.640.328.3
29.45.94.6
8.74.00.29.45.610.6843.41.4
556.723,643279,7335,00021.11.8
30.06.43.8
7.13.10.210.45.49.6
936.21.3
543.816,820260,8725,00029.72.1
30.36.51.1
2.30.90.212.75.67.9
1,164.91.3
541.34,860
211,3395,000102.92.4
31.67.53.7
6.53.10.28.66.411.6760.61.7
592.418,790295,1445,00026.61.7
29.38.23.9
7.23.60.28.06.112.4702.11.6
562.421,801310,0305,00022.91.7
29.010.45.9
9.95.20.37.16.214.0613.01.8
569.832,172342,1265,00015.51.5
経営指標の推移 Financial Statement Ratios22
21.7
878.0
FY201830年度
23.4
921.0
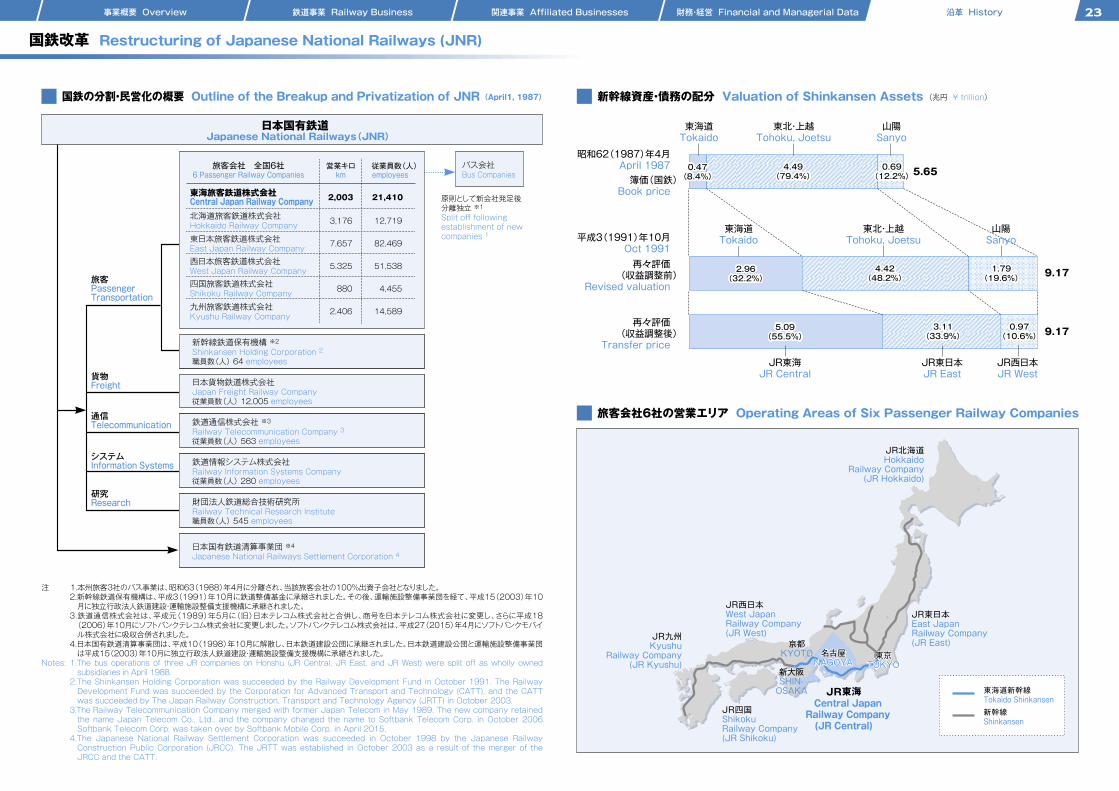
事業概要 Overview 鉄道事業 Railway Business 関連事業 Affiliated Businesses 財務・経営 Financial and Managerial Data 沿革 History
2.96(32.2%)
4.42(48.2%)
1.79(19.6%)
0.47(8.4%)
4.49(79.4%)
0.69(12.2%)
5.09(55.5%)
3.11(33.9%)
0.97(10.6%)
名古屋NAGOYA
東京TOKYO
JR北海道Hokkaido
Railway Company(JR Hokkaido)
JR九州Kyushu
Railway Company(JR Kyushu)
JR東日本East JapanRailway Company(JR East)
東海道新幹線Tokaido Shinkansen新幹線Shinkansen
JR東海 Central Japan
Railway Company(JR Central)
JR四国ShikokuRailway Company(JR Shikoku)
JR西日本West JapanRailway Company(JR West)
京都KYOTO 名古屋
NAGOYA東京TOKYO
新大阪SHIN-OSAKA
(兆円 ¥ trillion)
昭和62(1987)年4月April 1987簿価(国鉄)
Book price
平成3(1991)年10月Oct 1991再々評価
(収益調整前)Revised valuation
再々評価(収益調整後)
Transfer price
5.65
9.17
東海道Tokaido
東北・上越Tohoku, Joetsu
山陽Sanyo
JR東海JR Central
JR東日本JR East
JR西日本JR West
2.96(32.2%)
4.42(48.2%)
1.79(19.6%)
0.47(8.4%)
4.49(79.4%)
0.69(12.2%)
9.175.09(55.5%)
3.11(33.9%)
0.97(10.6%)
東海道Tokaido
東北・上越Tohoku, Joetsu
山陽Sanyo
注 1.本州旅客3社のバス事業は、昭和63(1988)年4月に分離され、当該旅客会社の100%出資子会社となりました。2.新幹線鉄道保有機構は、平成3(1991)年10月に鉄道整備基金に承継されました。その後、運輸施設整備事業団を経て、平成15(2003)年10月に独立行政法人鉄道建設・運輸施設整備支援機構に承継されました。3.鉄道通信株式会社は、平成元(1989)年5月に(旧)日本テレコム株式会社と合併し、商号を日本テレコム株式会社に変更し、さらに平成18(2006)年10月にソフトバンクテレコム株式会社に変更しました。ソフトバンクテレコム株式会社は、平成27(2015)年4月にソフトバンクモバイ ル株式会社に吸収合併されました。4.日本国有鉄道清算事業団は、平成10(1998)年10月に解散し、日本鉄道建設公団に承継されました。日本鉄道建設公団と運輸施設整備事業団は平成15(2003)年10月に独立行政法人鉄道建設・運輸施設整備支援機構に承継されました。
Notes: 1.The bus operations of three JR companies on Honshu (JR Central, JR East, and JR West) were split off as wholly owned subsidiaries in April 1988.
2.The Shinkansen Holding Corporation was succeeded by the Railway Development Fund in October 1991. The Railway Development Fund was succeeded by the Corporation for Advanced Transport and Technology (CATT), and the CATT was succeeded by The Japan Railway Construction, Transport and Technology Agency (JRTT) in October 2003.
3.The Railway Telecommunication Company merged with former Japan Telecom in May 1989. The new company retained the name Japan Telecom Co., Ltd., and the company changed the name to Softbank Telecom Corp. in October 2006. Softbank Telecom Corp. was taken over by Softbank Mobile Corp. in April 2015.
4.The Japanese National Railway Settlement Corporation was succeeded in October 1998 by the Japanese Railway Construction Public Corporation (JRCC). The JRTT was established in October 2003 as a result of the merger of the JRCC and the CATT.
(April1, 1987)
日本国有鉄道 Japanese National Railways(JNR)
新幹線鉄道保有機構 ※2Shinkansen Holding Corporation 2職員数(人) 64 employees
日本貨物鉄道株式会社Japan Freight Railway Company従業員数(人) 12,005 employees
鉄道通信株式会社 ※3Railway Telecommunication Company 3従業員数(人) 563 employees
鉄道情報システム株式会社Railway Information Systems Company従業員数(人) 280 employees
財団法人鉄道総合技術研究所Railway Technical Research Institute職員数(人) 545 employees
日本国有鉄道清算事業団 ※4Japanese National Railways Settlement Corporation 4
旅客会社 全国6社6 Passenger Railway Companies
東海旅客鉄道株式会社Central Japan Railway Company北海道旅客鉄道株式会社Hokkaido Railway Company
東日本旅客鉄道株式会社East Japan Railway Company
西日本旅客鉄道株式会社West Japan Railway Company
四国旅客鉄道株式会社Shikoku Railway Company
九州旅客鉄道株式会社Kyushu Railway Company
営業キロkm
バス会社Bus Companies
原則として新会社発足後分離独立 ※1Split off following establishment of new companies 1
旅客PassengerTransportation
貨物Freight
通信Telecommunication
研究Research
システムInformation Systems
従業員数(人)employees
2,003 21,410
3,176
7,657
5,325
880
2,406
12,719
82,469
51,538
4,455
14,589
国鉄の分割・民営化の概要 Outline of the Breakup and Privatization of JNR 新幹線資産・債務の配分 Valuation of Shinkansen Assets
旅客会社6社の営業エリア Operating Areas of Six Passenger Railway Companies
国鉄改革 Restructuring of Japanese National Railways (JNR)
23
見通し等に関する注意事項“ファクトシート 2019”に記載されている将来の計画や見込み数値等は、当社が現在入手可能な情報に基づく見通しであり、リスクや不確実性を含んでいます。潜在的なリスクや不確実性の例としては、経済動向や事業環境、消費動向、当社および子会社における他社との競合状況、法律や規制等の変更などが挙げられます。このファクトシートは、原則として令和元(2019)年5月末時点の情報に基づき、作成されています。注 1.金額は単位未満を切り捨て、その他の数値は単位未満を四捨五入して表示しています。 2.FY2018は2018年度を表します。
Forward-Looking StatementsForward-looking statements and forecasts, etc. contained in the fact sheets are future prospects based on information available at the time of preparation of this document and include risks and uncertainties. Examples of latent risks and uncertainties include; economic conditions, business environment, consumer trends, status of competition between the Company and its subsidiaries and other firms. Changes to laws and regulations, etc., may also be cited.This fact sheet is compiled based on information available as of the end of May 2019, in principle.Note: 1.Figures of financial information are truncated, while statistical data and all percentages are rounded. 2.FY2018 refers to the one-year period ending March 31, 2019.
ファクトシート