Embed Size (px)
Citation preview

Results – MQ’11 & FY 2011
May 9, 2011
Investor Presentation
MQ‘11 Results - May 9, 2011
Safe Harbour Statement
This Release / Communication, except for the historical information, may contain
statements, including the words or phrases such as ‘expects, anticipates, intends, will,
would, undertakes, aims, estimates, contemplates, seeks to, objective, goal, projects,
should’ and similar expressions or variations of these expressions or negatives of these
terms indicating future performance or results, financial or otherwise, which are forward
looking statements. These forward looking statements are based on certain
expectations, assumptions, anticipated developments and other factors which are not
limited to, risk and uncertainties regarding fluctuations in earnings, market growth,
intense competition and the pricing environment in the market, consumption level,
ability to maintain and manage key customer relationship and supply chain sources and
those factors which may affect our ability to implement business strategies successfully,
namely changes in regulatory environments, political instability, change in international
oil prices and input costs and new or changed priorities of the trade. The Company,
therefore, cannot guarantee that the forward looking statements made herein shall be
realized. The Company, based on changes as stated above, may alter, amend, modify or
make necessary corrective changes in any manner to any such forward looking
statement contained herein or make written or oral forward looking statements as may
be required from time to time on the basis of subsequent developments and events.
The Company does not undertake any obligation to update forward looking statements
that may be made from time to time by or on behalf of the Company to reflect the
events or circumstances after the date hereof.
MQ‘11 Results - May 9, 2011
Agenda
• Market Context
• MQ’11 Highlights
• Category Overview
• MQ’11 Financial Results
• FY 2010–11 Performance Review
• Looking ahead
MQ‘11 Results - May 9, 2011
• FMCG market growth at low double digit
• Slower volume growth in Soaps & Detergents
• Continued competitive intensity
• Some moderation in industry media spends
• High input cost inflation despite recent correction
Market Context – MQ’11
MQ‘11 Results - May 9, 2011
• Domestic Consumer business grows 14%
• Driven by strong volume growth
• Ahead of market
• Broad based growth across HPC categories
• Double digit growth in Soaps & Detergents
• Continued strong growth in Personal Products
• Robust growth in Beverages – Tea and Coffee
• Packaged Foods portfolio expanded with new offerings
MQ’11 Highlights
MQ‘11 Results - May 9, 2011
• Cost of goods sold higher by 290 bps
• High input cost especially in Soaps & Detergents
• Continued focus on buying efficiencies and CEPs*
• A&P spends maintained at competitive levels;12.7% of sales
• Operating profit grows by 8.4%; PBIT margin lower by 60 bps
• PAT (bei) at Rs.515 crore, grows by 22%; Net Profit Rs.569
crore, down by 2%
MQ’11 Highlights
*CEPs: Cost effectiveness programmes ^Share of voice/ Share of market
MQ‘11 Results - May 9, 2011
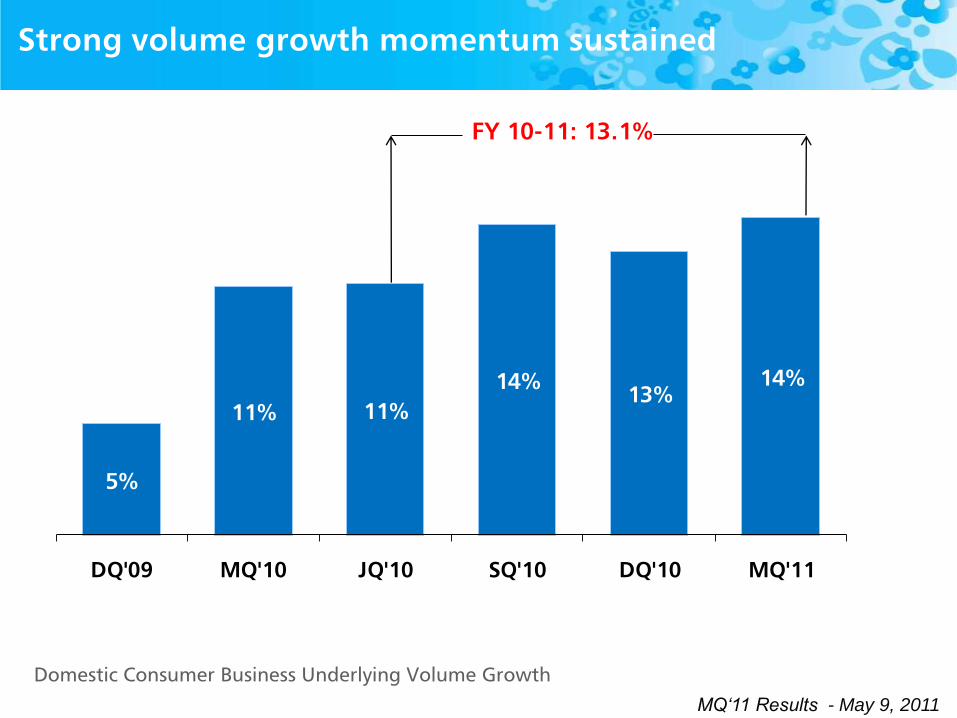
5%
11% 11%
14%13%
14%
DQ'09 MQ'10 JQ'10 SQ'10 DQ'10 MQ'11
Strong volume growth momentum sustained
Domestic Consumer Business Underlying Volume Growth
FY 10-11: 13.1%

MQ‘11 Results - May 9, 2011
Soaps & Detergents
Personal Products
Ice Cream
Packaged Foods
Beverages
11.4
16.2
11.2
21.0
26.6
Domestic FMCG 14.0
All segments grow in double digit
Growth% MQ‘11
^
^ Excludes Other Operational Income * Including water
Domestic Consumer 14% *
MQ‘11 Results - May 9, 2011
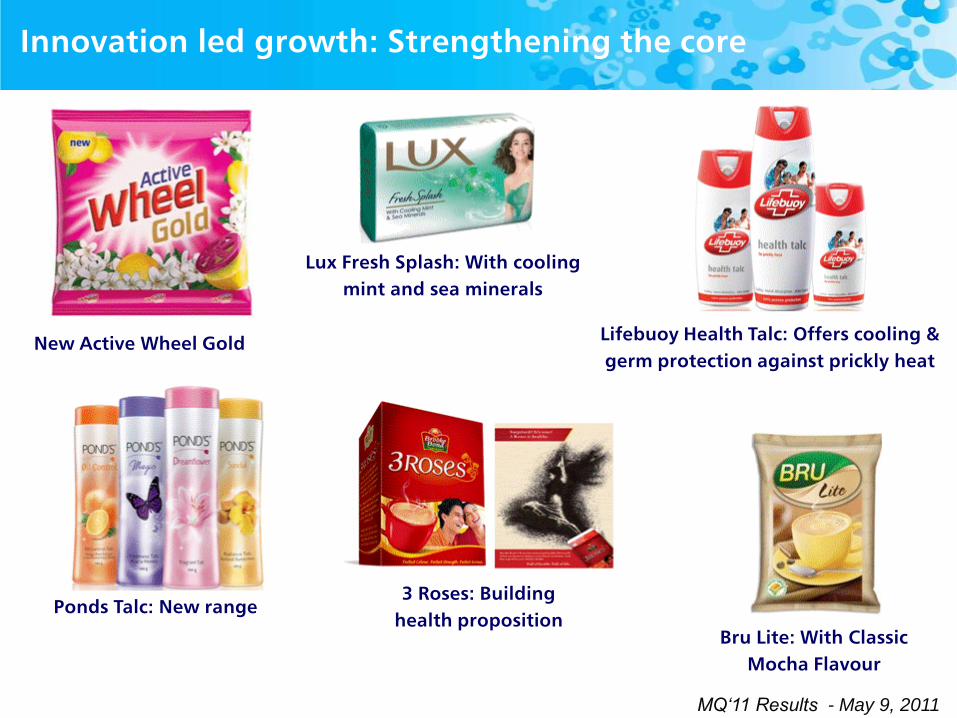
Innovation led growth: Strengthening the core
New Active Wheel Gold
Ponds Talc: New range
Lux Fresh Splash: With cooling
mint and sea minerals
3 Roses: Building
health propositionBru Lite: With Classic
Mocha Flavour
Lifebuoy Health Talc: Offers cooling &
germ protection against prickly heat
MQ‘11 Results - May 9, 2011
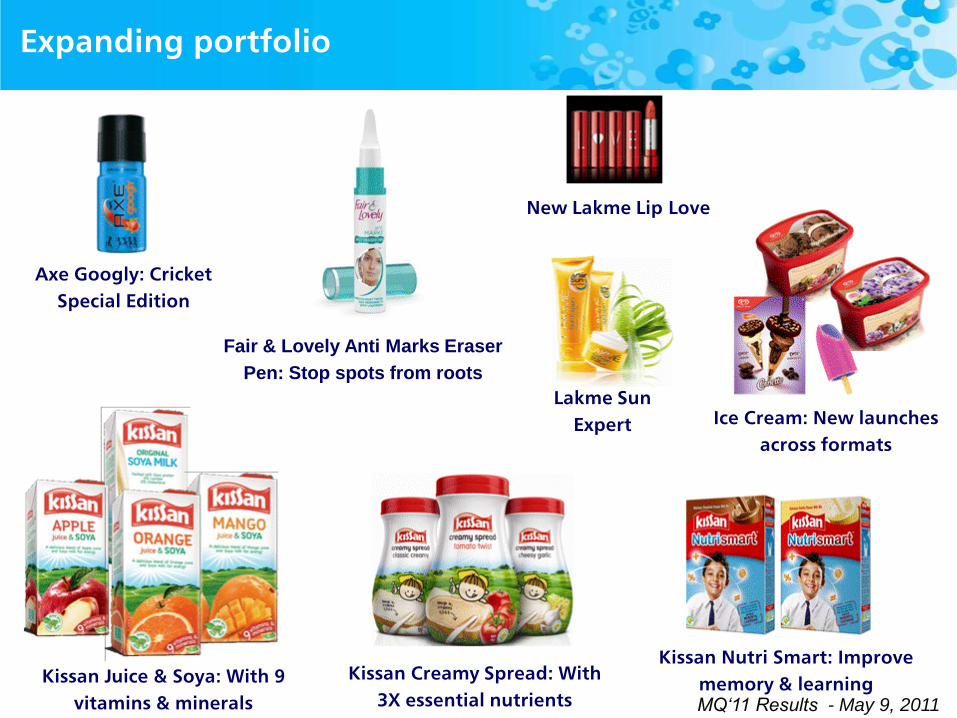
Expanding portfolio
Axe Googly: Cricket
Special Edition
New Lakme Lip Love
Kissan Juice & Soya: With 9
vitamins & minerals
Kissan Creamy Spread: With
3X essential nutrients
Ice Cream: New launches
across formats
Lakme Sun
Expert
Kissan Nutri Smart: Improve
memory & learning
Fair & Lovely Anti Marks Eraser
Pen: Stop spots from roots
MQ‘11 Results - May 9, 2011
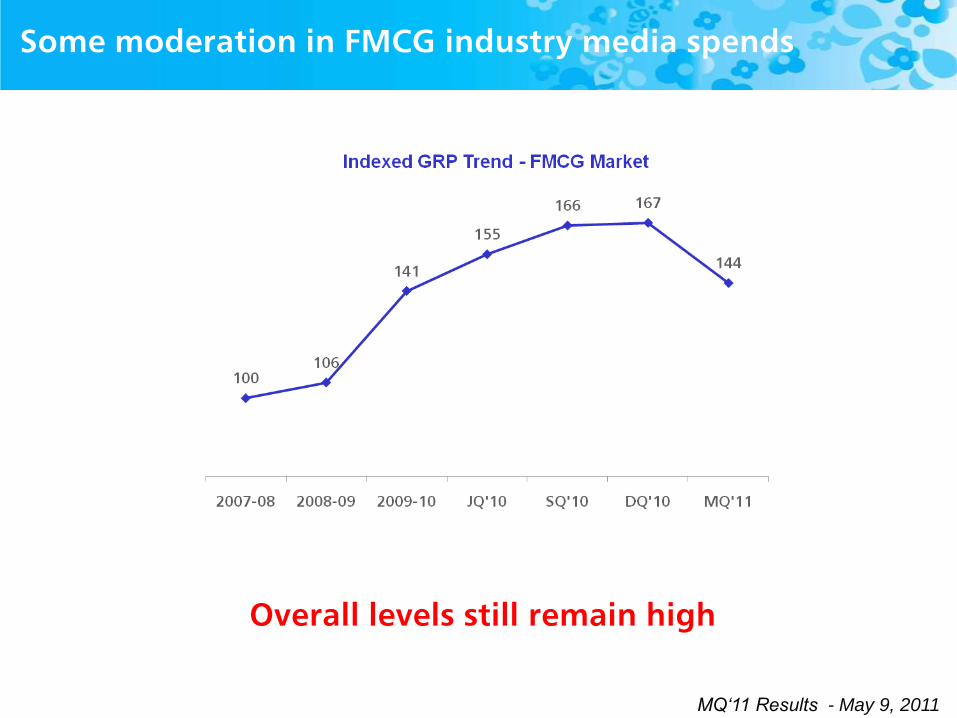
Some moderation in FMCG industry media spends
Overall levels still remain high
MQ‘11 Results - May 9, 2011
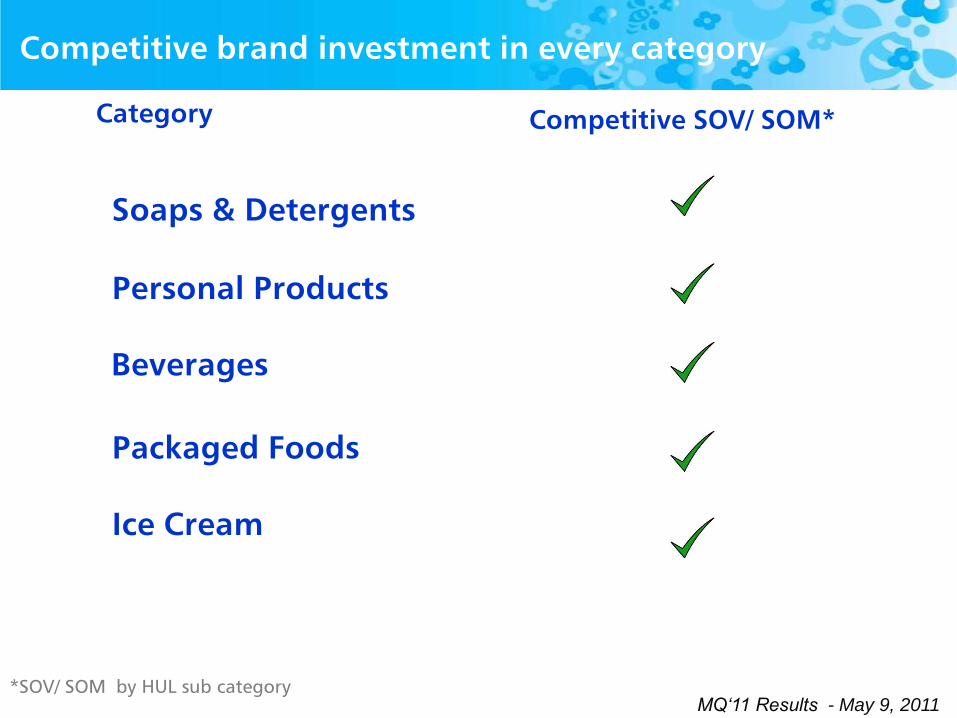
Competitive brand investment in every category
Category Competitive SOV/ SOM*
Soaps & Detergents
Personal Products
Ice Cream
Packaged Foods
Beverages
*SOV/ SOM by HUL sub category
MQ‘11 Results - May 9, 2011
60
70
80
90
100
110
Jan'0
8
Mar'08
May'0
8
Jul'0
8
Sep'0
8
Nov'0
8
Jan'0
9
Mar'09
May'0
9
Jul'0
9
Sep'0
9
Nov'0
9
Jan'1
0
Mar'10
May'1
0
Jul'1
0
Sep'1
0
Nov'1
0
Jan'1
1
Mar'11
80
130
180
230
280
330
380
Jan-0
5
Apr-
05
Jul-05
Oct
-05
Jan-0
6
Apr-
06
Jul-06
Oct
-06
Jan-0
7
Apr-
07
Jul-07
Oct
-07
Jan-0
8
Apr-
08
Jul-08
Oct
-08
Jan-0
9
Apr-
09
Jul-09
Oct
-09
Jan-1
0
Apr-
10
Jul-10
Oct
-10
Jan-1
1
Apr-
11
CPO Index
PFAD Index
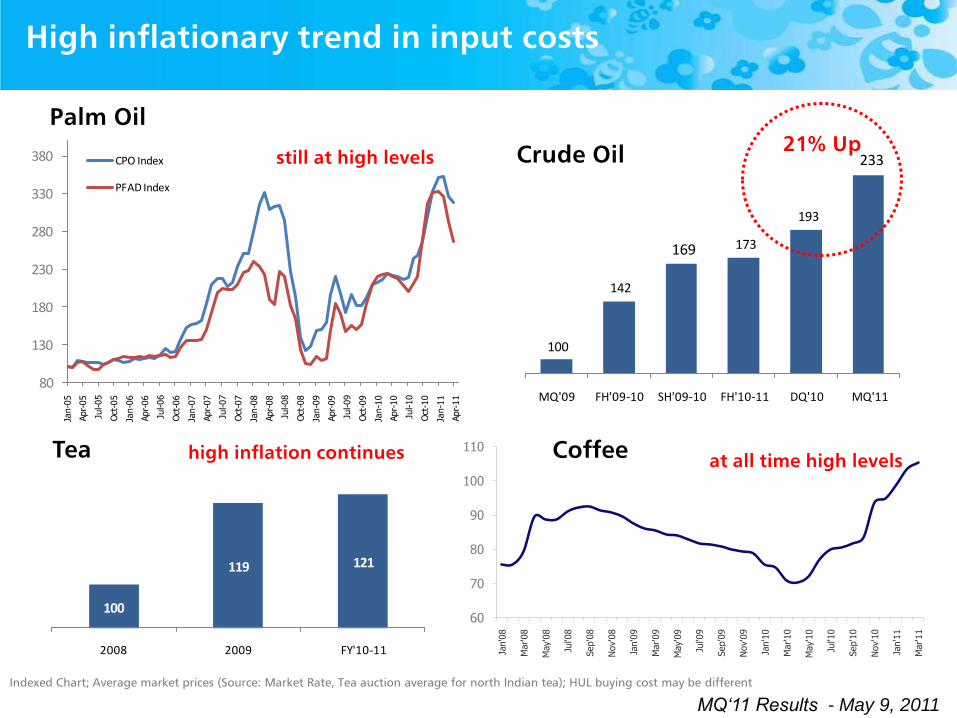
100
142
169 173
193
233
MQ'09 FH'09-10 SH'09-10 FH'10-11 DQ'10 MQ'11
High inflationary trend in input costs
Palm Oil
Crude Oilstill at high levels21% Up
Coffee at all time high levels
Indexed Chart; Average market prices (Source: Market Rate, Tea auction average for north Indian tea); HUL buying cost may be different
100
119 121
2008 2009 FY'10-11
Tea high inflation continues
MQ‘11 Results - May 9, 2011
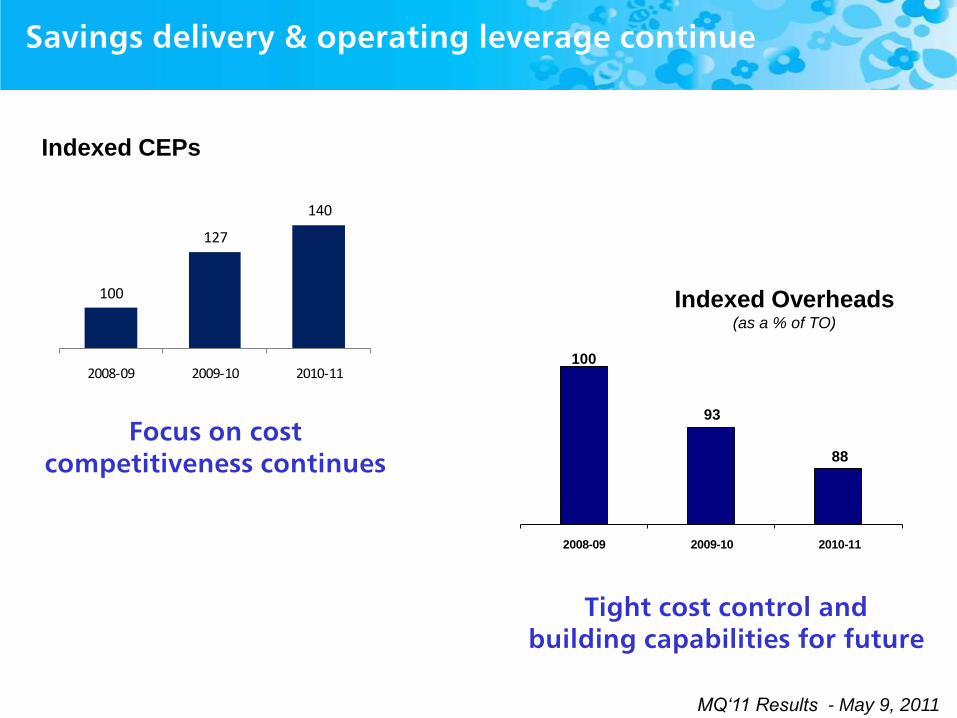
100
127
140
2008-09 2009-10 2010-11100
93
88
2008-09 2009-10 2010-11
Indexed Overheads(as a % of TO)
Indexed CEPs
Tight cost control and building capabilities for future
Savings delivery & operating leverage continue
Focus on cost competitiveness continues
MQ‘11 Results - May 9, 2011
Category Highlights

MQ‘11 Results - May 9, 2011
• Double digit growth; ahead of market
• Broad based growth across powders and bars
• All the three brands grow with double digit volume growth
• Rin crosses Rs.1000 cr mark in FY 2010-11
• New Active Wheel Gold launched during MQ’11
• Comfort continues to develop fabric conditioner market
Laundry: Successful defence of leadership position
Market Growth Source: AC Nielsen
Consumer Experience building penetration
MQ‘11 Results - May 9, 2011
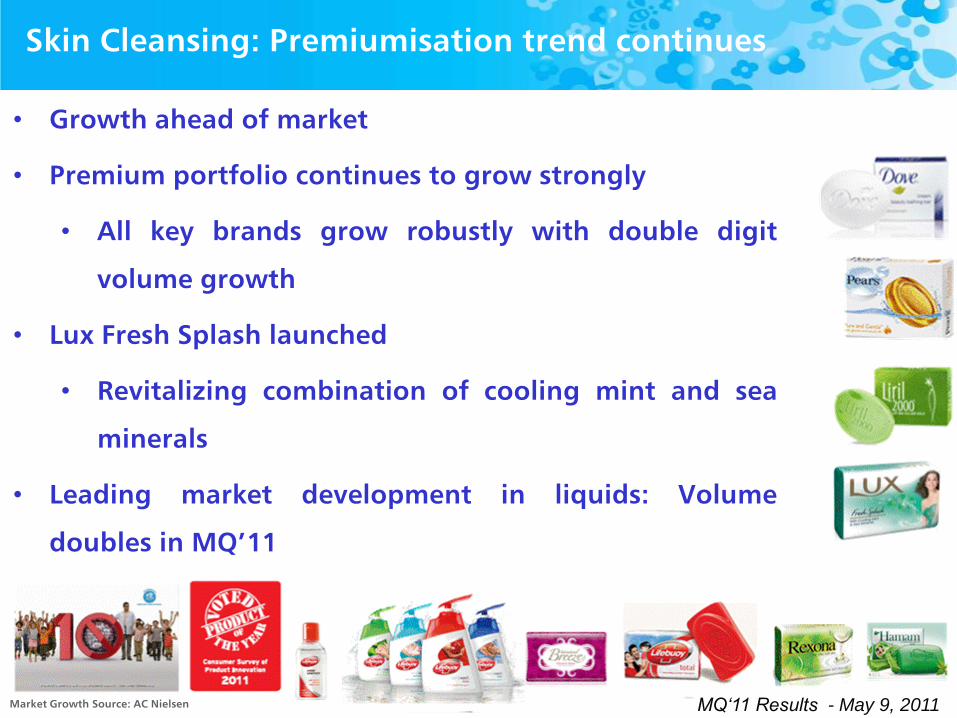
• Growth ahead of market
• Premium portfolio continues to grow strongly
• All key brands grow robustly with double digit
volume growth
• Lux Fresh Splash launched
• Revitalizing combination of cooling mint and sea
minerals
• Leading market development in liquids: Volume
doubles in MQ’11
Skin Cleansing: Premiumisation trend continues
Market Growth Source: AC Nielsen
MQ‘11 Results - May 9, 2011
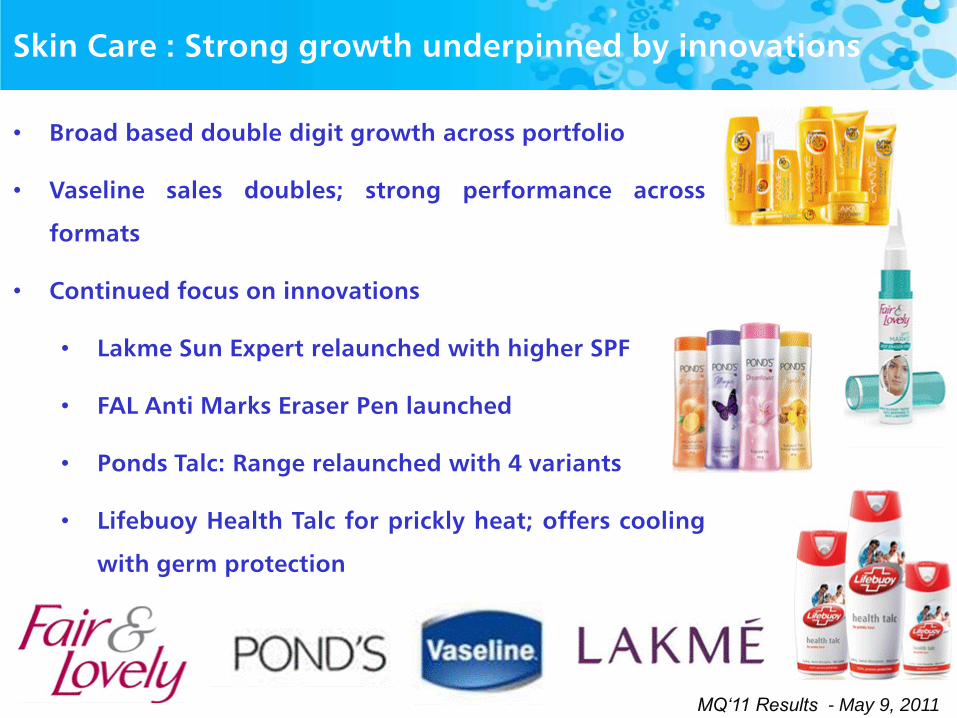
Skin Care : Strong growth underpinned by innovations
• Broad based double digit growth across portfolio
• Vaseline sales doubles; strong performance across
formats
• Continued focus on innovations
• Lakme Sun Expert relaunched with higher SPF
• FAL Anti Marks Eraser Pen launched
• Ponds Talc: Range relaunched with 4 variants
• Lifebuoy Health Talc for prickly heat; offers cooling
with germ protection
MQ‘11 Results - May 9, 2011
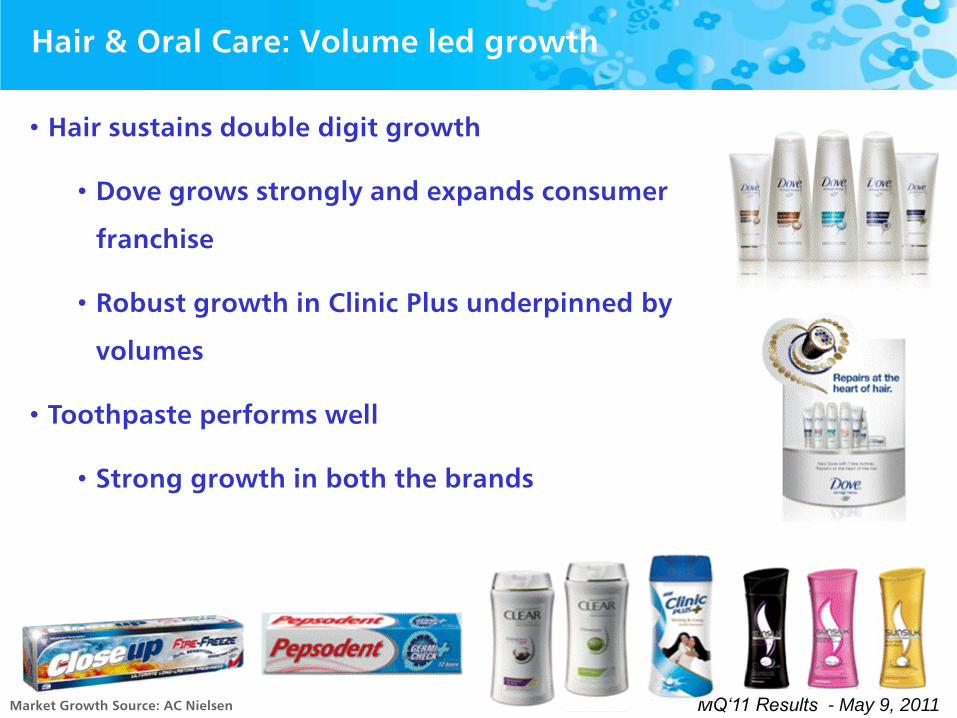
• Hair sustains double digit growth
• Dove grows strongly and expands consumer
franchise
• Robust growth in Clinic Plus underpinned by
volumes
• Toothpaste performs well
• Strong growth in both the brands
Hair & Oral Care: Volume led growth
Market Growth Source: AC Nielsen
MQ‘11 Results - May 9, 2011
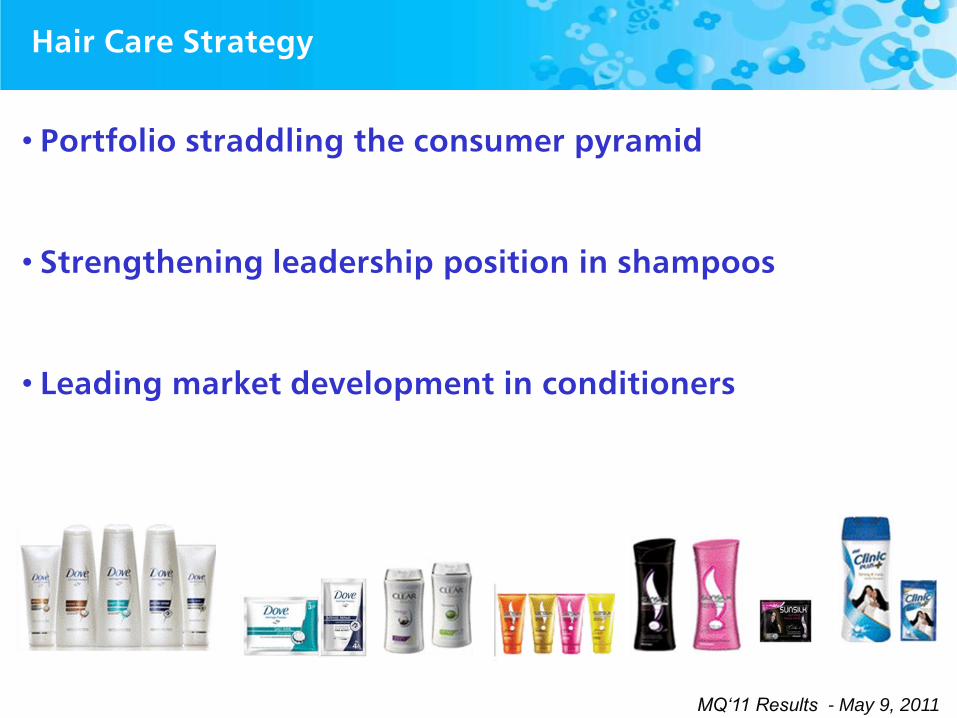
Hair Care Strategy
• Portfolio straddling the consumer pyramid
• Strengthening leadership position in shampoos
• Leading market development in conditioners
MQ‘11 Results - May 9, 2011
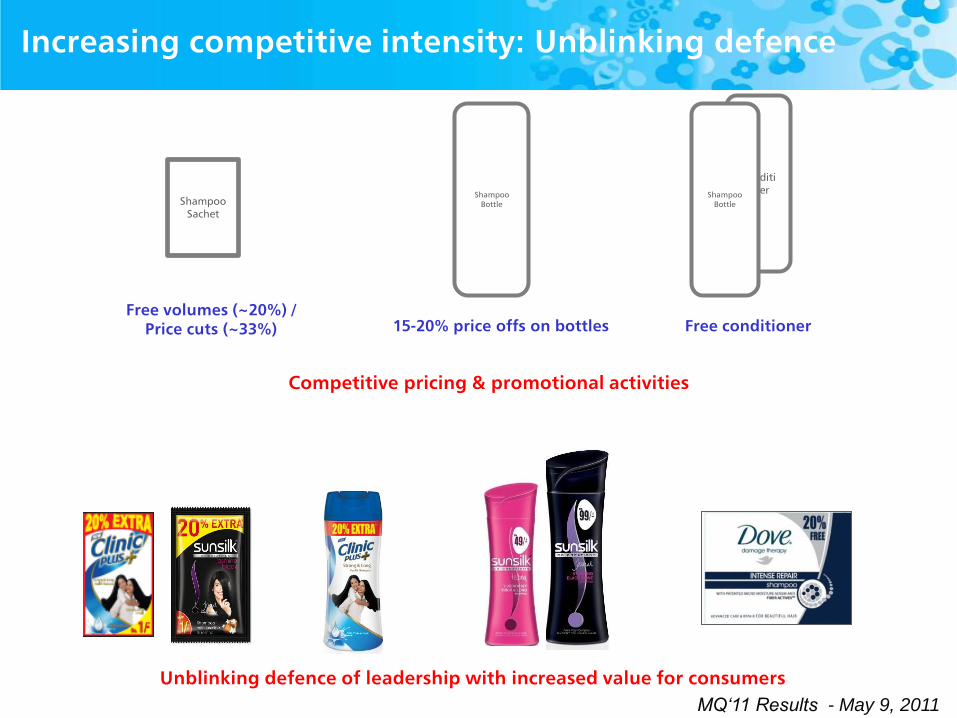
Conditioner
Increasing competitive intensity: Unblinking defence
Competitive pricing & promotional activities
Shampoo Sachet
Free volumes (~20%) / Price cuts (~33%)
ShampooBottle
15-20% price offs on bottles
ShampooBottle
Free conditioner
Unblinking defence of leadership with increased value for consumers
MQ‘11 Results - May 9, 2011
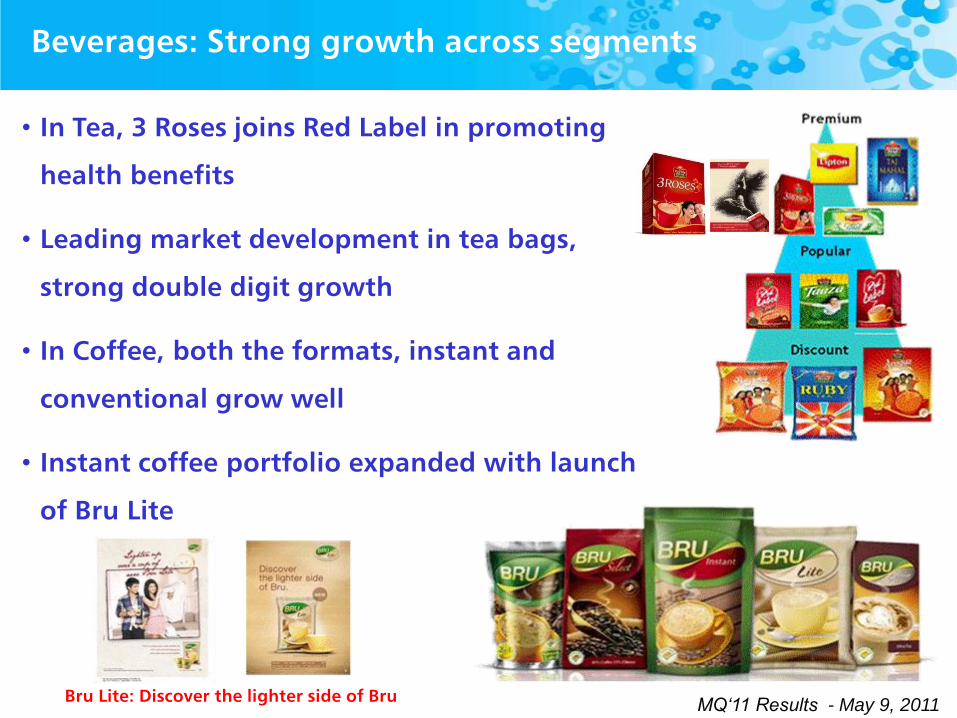
Beverages: Strong growth across segments
• In Tea, 3 Roses joins Red Label in promoting
health benefits
• Leading market development in tea bags,
strong double digit growth
• In Coffee, both the formats, instant and
conventional grow well
• Instant coffee portfolio expanded with launch
of Bru Lite
Bru Lite: Discover the lighter side of Bru
MQ‘11 Results - May 9, 2011
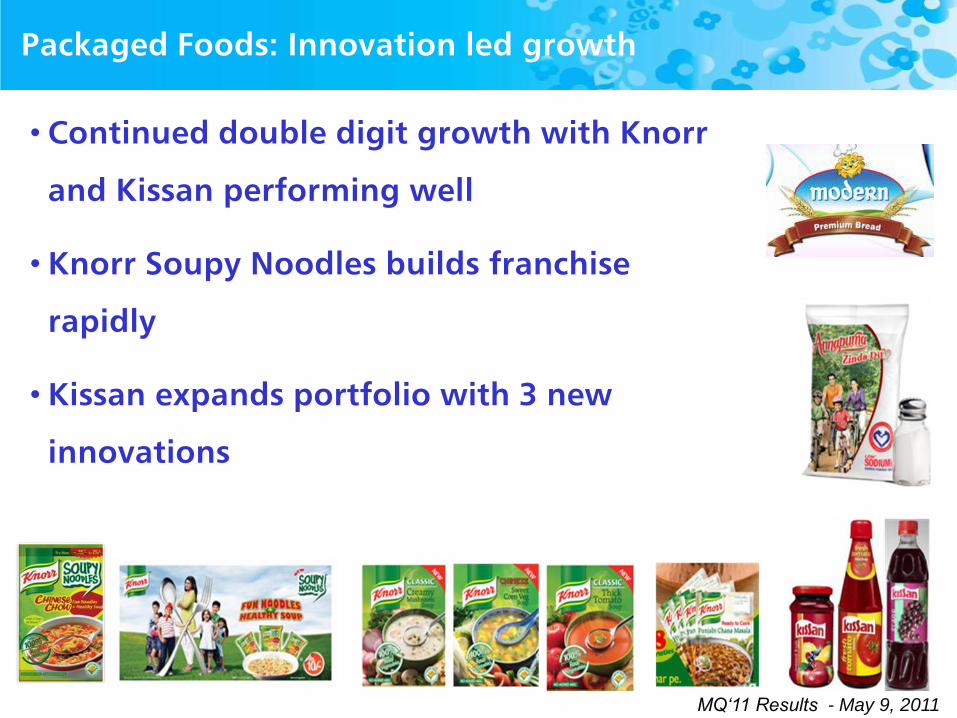
Packaged Foods: Innovation led growth
• Continued double digit growth with Knorr
and Kissan performing well
• Knorr Soupy Noodles builds franchise
rapidly
• Kissan expands portfolio with 3 new
innovations
MQ‘11 Results - May 9, 2011
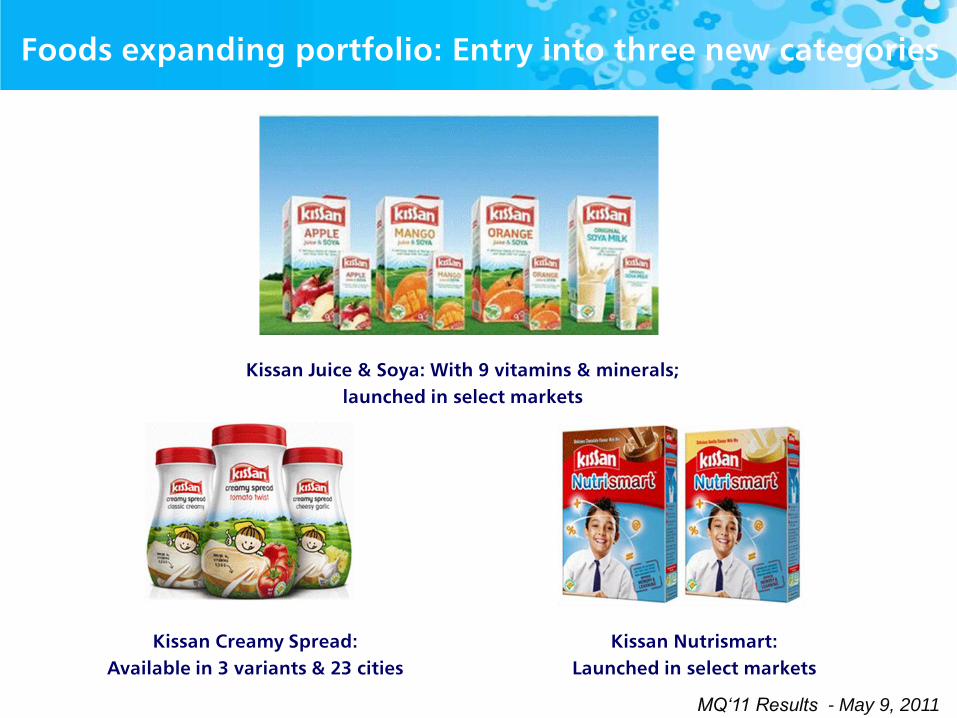
Foods expanding portfolio: Entry into three new categories
Kissan Juice & Soya: With 9 vitamins & minerals;
launched in select markets
Kissan Creamy Spread:
Available in 3 variants & 23 cities
Kissan Nutrismart:
Launched in select markets
MQ‘11 Results - May 9, 2011
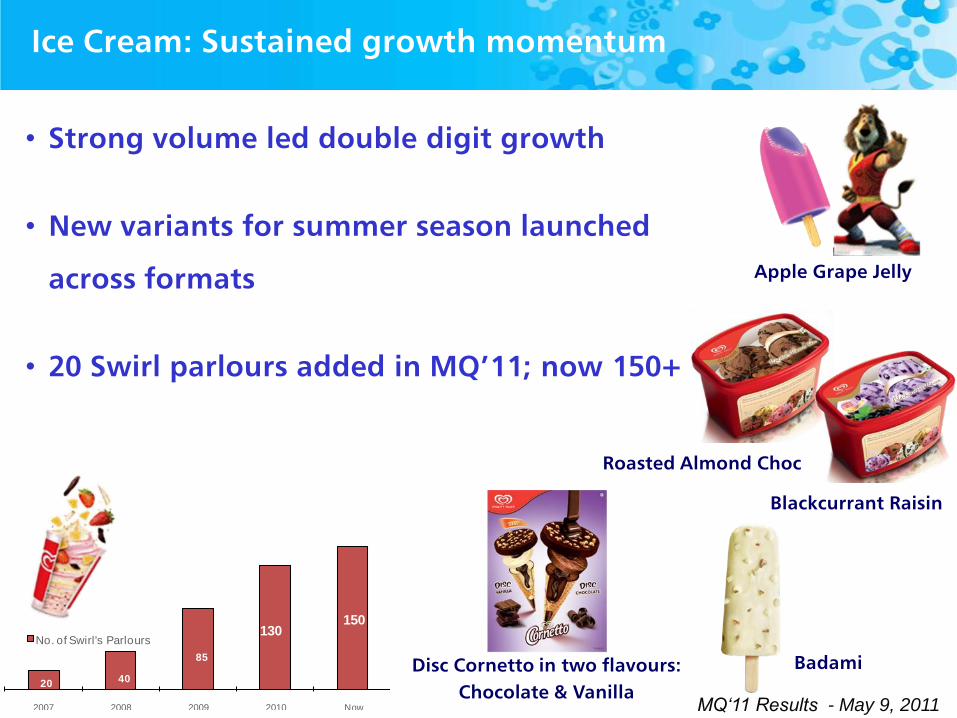
20 40
85
130150
2007 2008 2009 2010 Now
No. of Swirl's Parlours
• Strong volume led double digit growth
• New variants for summer season launched
across formats
• 20 Swirl parlours added in MQ’11; now 150+
Ice Cream: Sustained growth momentum
Apple Grape Jelly
Blackcurrant Raisin
Roasted Almond Choc
Disc Cornetto in two flavours:
Chocolate & Vanilla
Badami
MQ‘11 Results - May 9, 2011
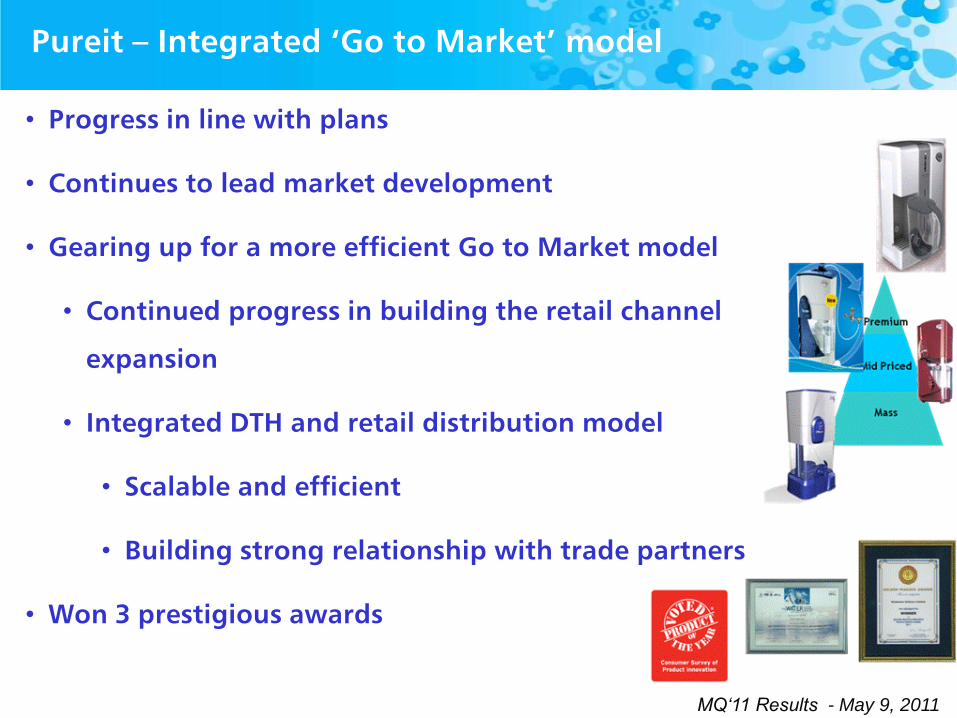
Pureit – Integrated ‘Go to Market’ model
• Progress in line with plans
• Continues to lead market development
• Gearing up for a more efficient Go to Market model
• Continued progress in building the retail channel
expansion
• Integrated DTH and retail distribution model
• Scalable and efficient
• Building strong relationship with trade partners
• Won 3 prestigious awards
MQ‘11 Results - May 9, 2011
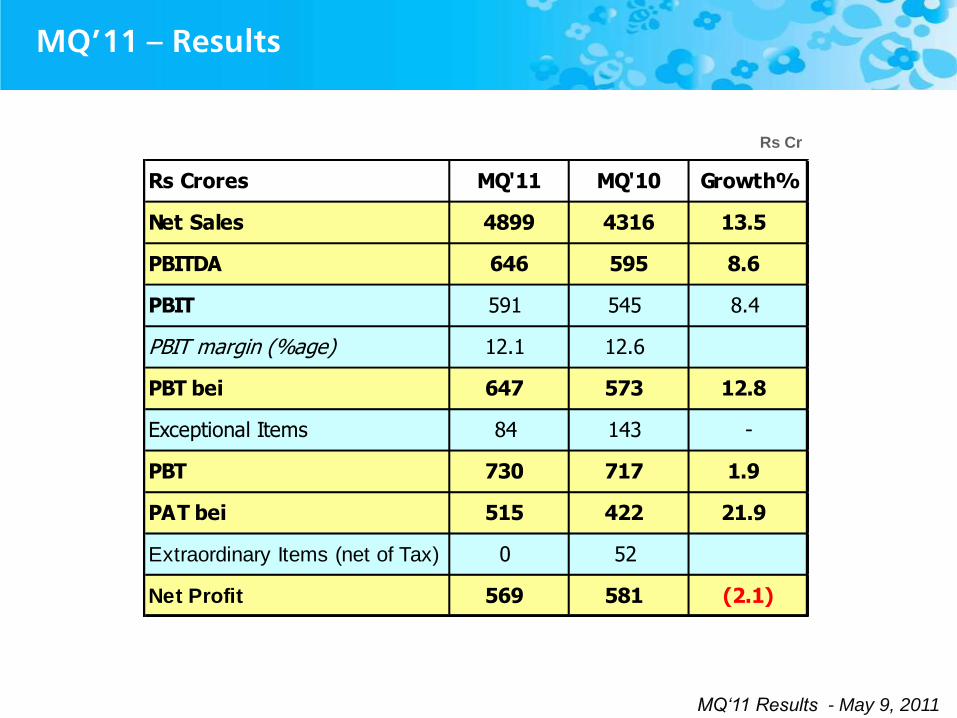
MQ’11 – Results
Rs Crores MQ'11 MQ'10 Growth%
Net Sales 4899 4316 13.5
PBITDA 646 595 8.6
PBIT 591 545 8.4
PBIT margin (%age) 12.1 12.6
PBT bei 647 573 12.8
Exceptional Items 84 143 -
PBT 730 717 1.9
PAT bei 515 422 21.9
Extraordinary Items (net of Tax) 0 52
Net Profit 569 581 (2.1)
Rs Cr
MQ‘11 Results - May 9, 2011
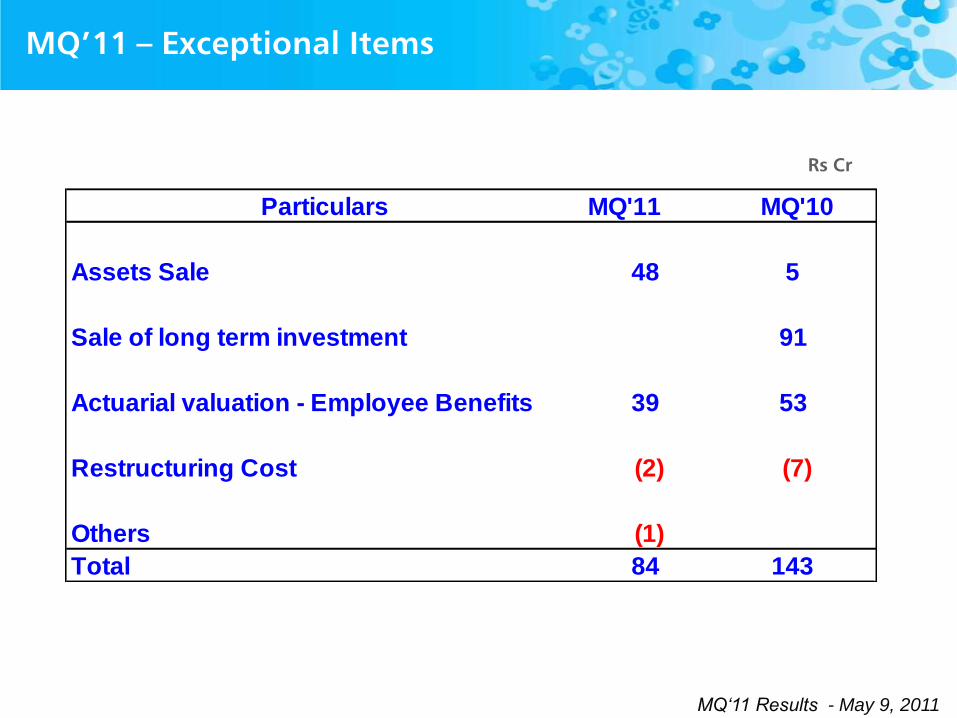
MQ’11 – Exceptional Items
Rs Cr
Particulars MQ'11 MQ'10
Assets Sale 48 5
Sale of long term investment 91
Actuarial valuation - Employee Benefits 39 53
Restructuring Cost (2) (7)
Others (1)
Total 84 143
MQ‘10 Results - 25th May 2010
Summary
• Strong volume driven growth at 14% in domestic
consumer business; ahead of market
• Broad based momentum across portfolio
• High input cost inflation - Cost of goods sold higher by
290 bps; continued focus on CEPs
• Brand support maintained at competitive levels
• PAT (bei) Rs. 515 crore; up 22%
MQ‘10 Results - 25th May 2010
Financial year 2010-11
Performance Review
MQ‘10 Results - 25th May 2010
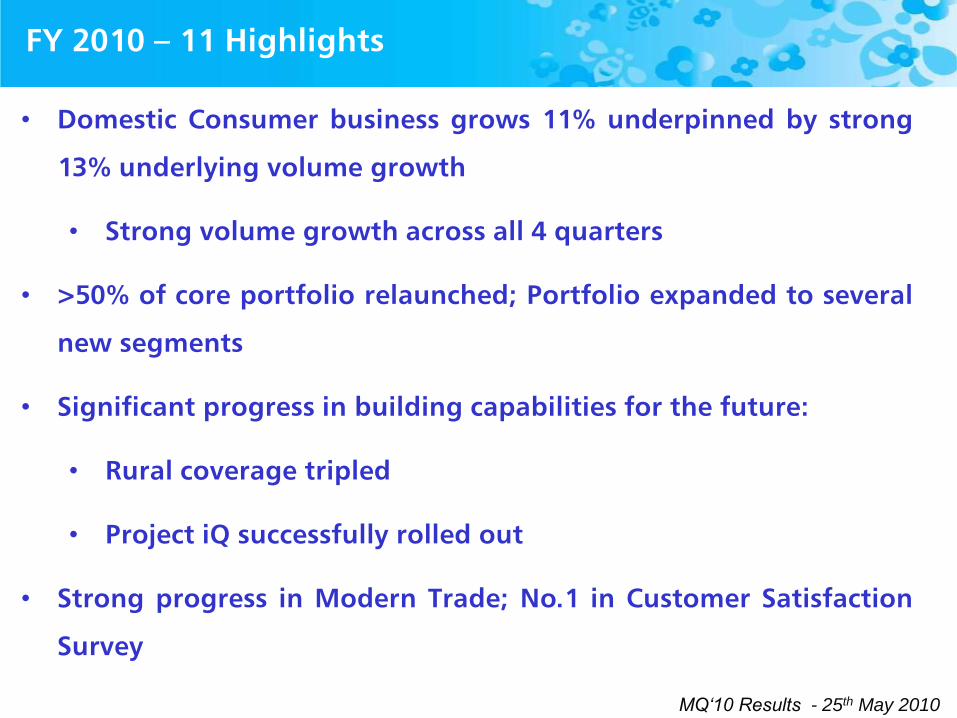
• Domestic Consumer business grows 11% underpinned by strong
13% underlying volume growth
• Strong volume growth across all 4 quarters
• >50% of core portfolio relaunched; Portfolio expanded to several
new segments
• Significant progress in building capabilities for the future:
• Rural coverage tripled
• Project iQ successfully rolled out
• Strong progress in Modern Trade; No.1 in Customer Satisfaction
Survey
FY 2010 – 11 Highlights
MQ‘10 Results - 25th May 2010
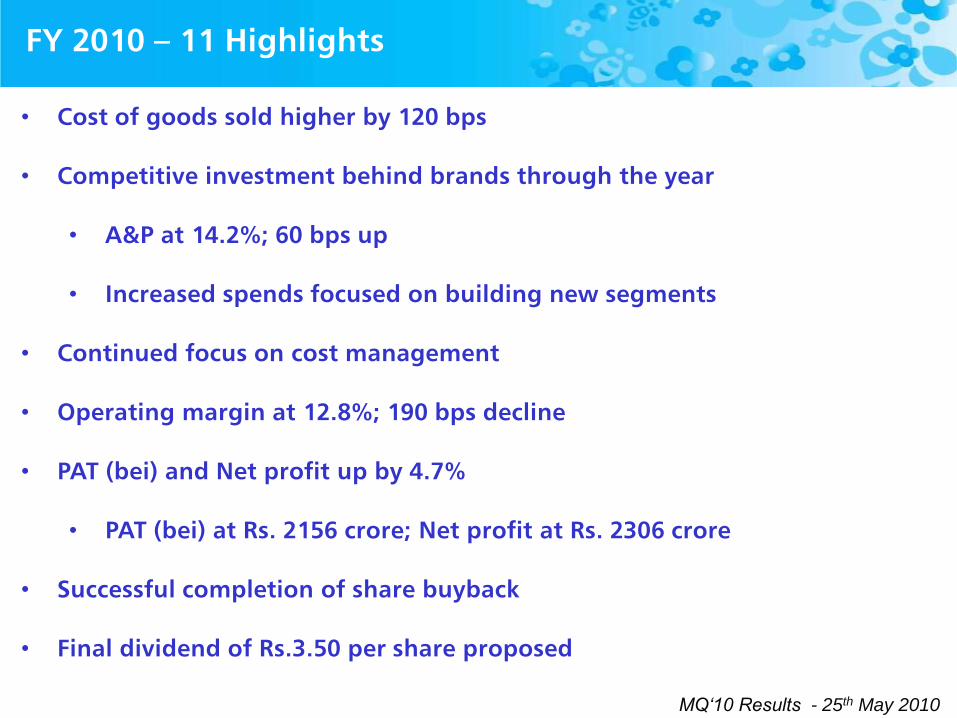
• Cost of goods sold higher by 120 bps
• Competitive investment behind brands through the year
• A&P at 14.2%; 60 bps up
• Increased spends focused on building new segments
• Continued focus on cost management
• Operating margin at 12.8%; 190 bps decline
• PAT (bei) and Net profit up by 4.7%
• PAT (bei) at Rs. 2156 crore; Net profit at Rs. 2306 crore
• Successful completion of share buyback
• Final dividend of Rs.3.50 per share proposed
FY 2010 – 11 Highlights
MQ‘10 Results - 25th May 2010
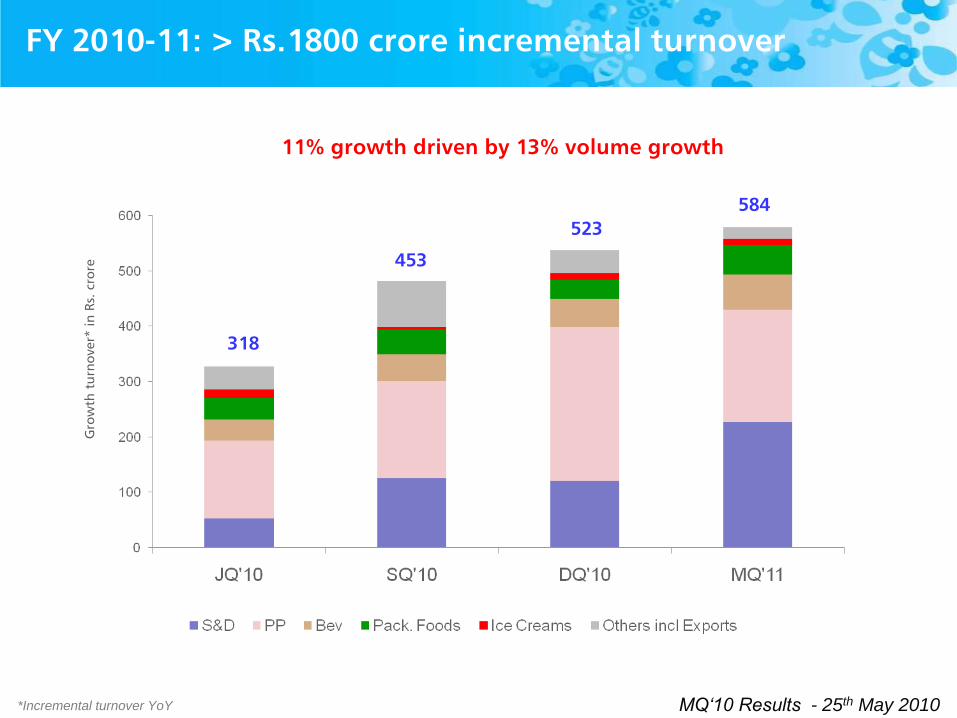
FY 2010-11: > Rs.1800 crore incremental turnover
11% growth driven by 13% volume growth
Gro
wth
tu
rno
ver*
in
Rs.
cro
re
318
453
523
584
*Incremental turnover YoY
MQ‘11 Results - May 9, 2011
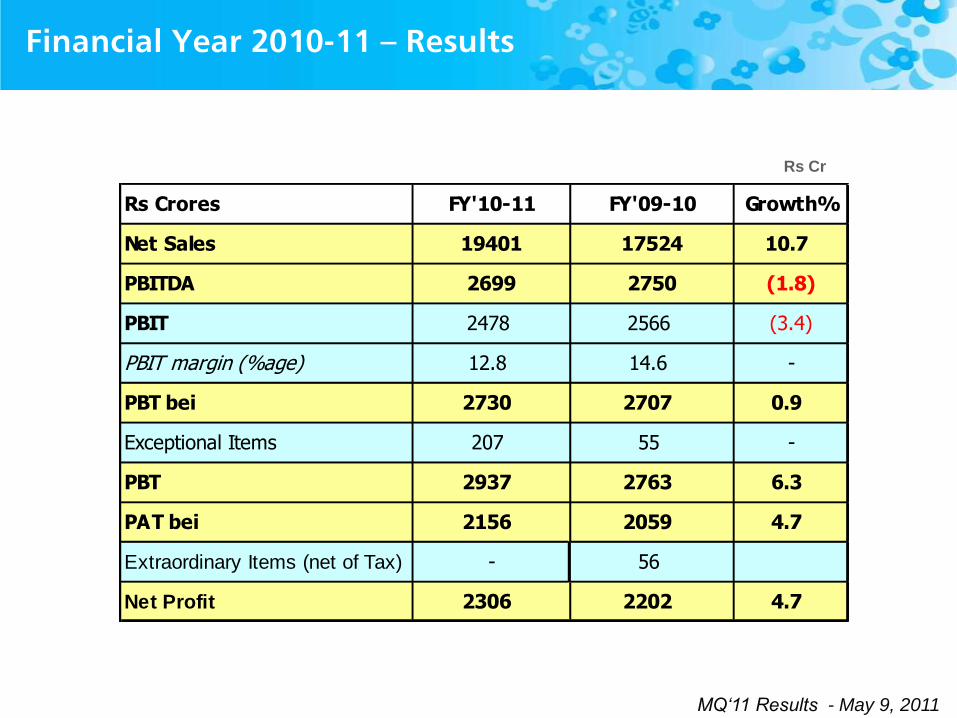
Financial Year 2010-11 – Results
Rs Crores FY'10-11 FY'09-10 Growth%
Net Sales 19401 17524 10.7
PBITDA 2699 2750 (1.8)
PBIT 2478 2566 (3.4)
PBIT margin (%age) 12.8 14.6 -
PBT bei 2730 2707 0.9
Exceptional Items 207 55 -
PBT 2937 2763 6.3
PAT bei 2156 2059 4.7
Extraordinary Items (net of Tax) - 56
Net Profit 2306 2202 4.7
Rs Cr
MQ‘11 Results - May 9, 2011
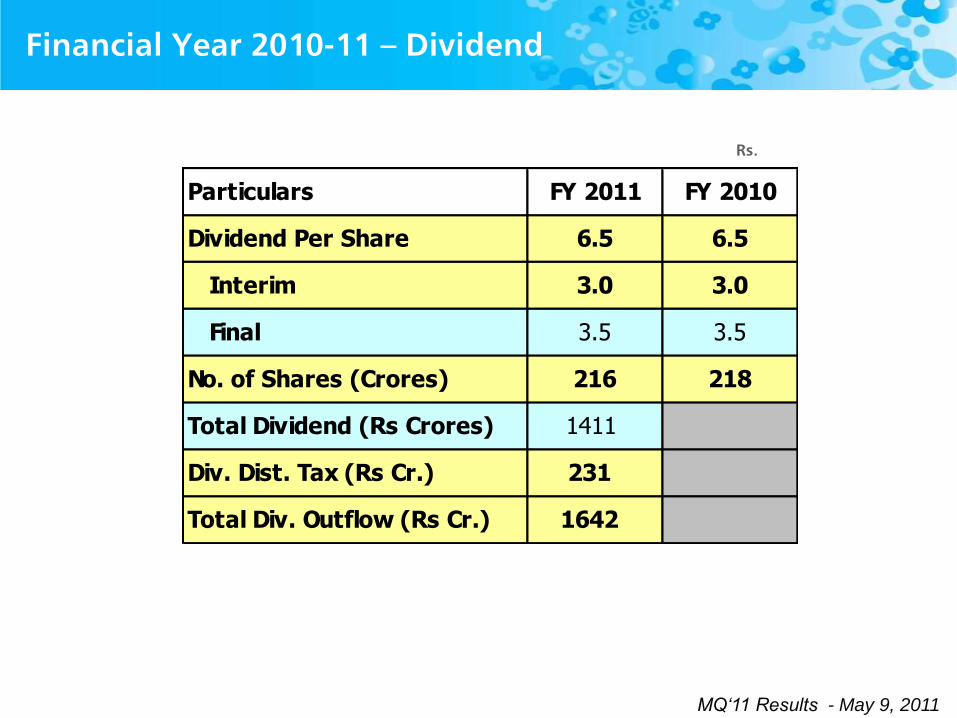
Financial Year 2010-11 – Dividend
Particulars FY 2011 FY 2010
Dividend Per Share 6.5 6.5
Interim 3.0 3.0
Final 3.5 3.5
No. of Shares (Crores) 216 218
Total Dividend (Rs Crores) 1411
Div. Dist. Tax (Rs Cr.) 231
Total Div. Outflow (Rs Cr.) 1642
Rs.
MQ‘11 Results - May 9, 2011
Looking ahead
• FMCG market will continue to grow
• Changing mix of volume and price growth
• High cost inflation combined with volatility
• Competitive environment will continue to remain intense
• Our strategy and focus remains consistent
• Strengthen leadership positions and leading market
development of future categories and channel
• Ensure market & cost competitiveness; manage the business
even more dynamically
Winning Today Winning Tomorrow

MQ‘11 Results - May 9, 2011
Thank you
For more information, please visit http://www.hul.co.in