Embed Size (px)
Citation preview

Retail Choice in Electricity: What Have
We Learned in 20 Years?
Mathew Morey & Laurence KirschChristensen Associates Energy Consulting
www.caenergy.com
March 7, 2016
Presentation Outline
Summary Status of Retail Choice Drivers of Retail Choice Retail Choice History Challenges Outcomes
2
SUMMARY
3
Innovative Service Offerings
RC extends penetration of dynamic pricing programs that reflect power system conditions.
RC promotes renewable resources but may raise resource adequacy issues because of non‐dispatchability.
RC has a mixed record in promoting demand response.
RC has not generally promoted smart metering.
4
Impacts on Consumer Prices
RC prices vary with fuel prices and are less stable than non‐RC prices.
RC prices vary by location and mimic locational variations in wholesale prices.
Statistical studies have reached contradictory conclusions about price impacts of RC. EU experience gives no clear signal about how RC affects retail prices.
5
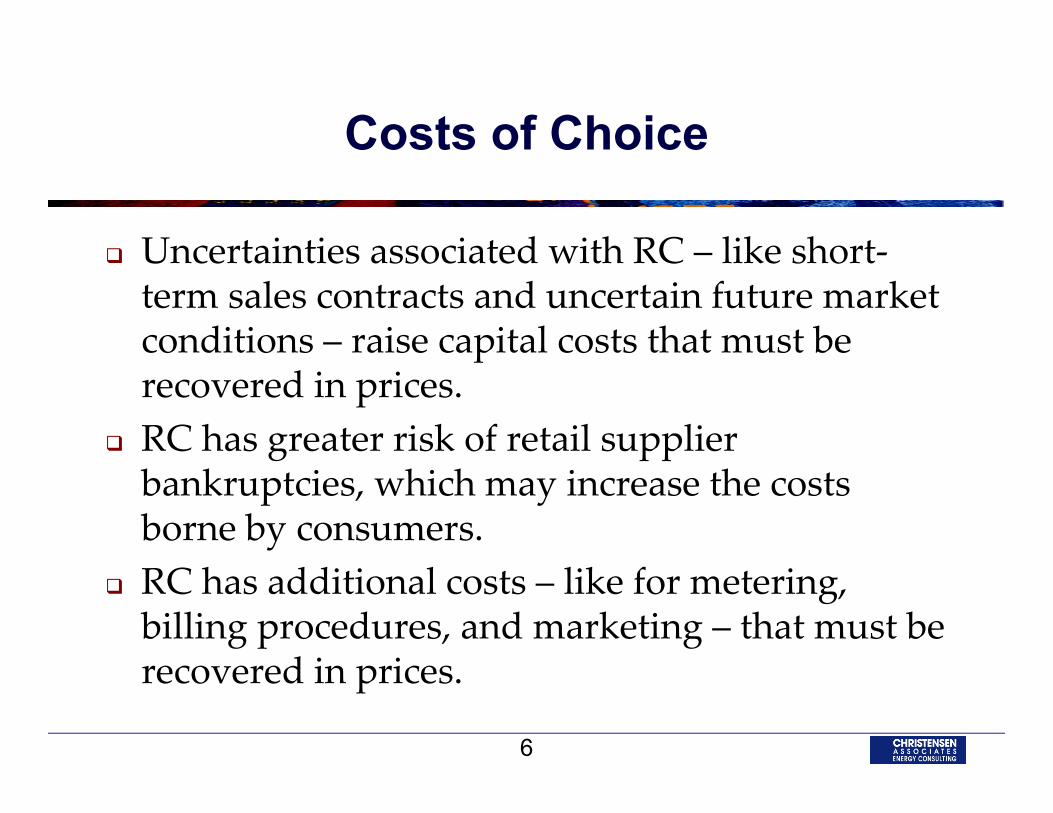
Costs of Choice
Uncertainties associated with RC – like short‐term sales contracts and uncertain future market conditions – raise capital costs that must be recovered in prices.
RC has greater risk of retail supplier bankruptcies, which may increase the costs borne by consumers.
RC has additional costs – like for metering, billing procedures, and marketing – that must be recovered in prices.
6
STATUS OF RETAIL CHOICE
7
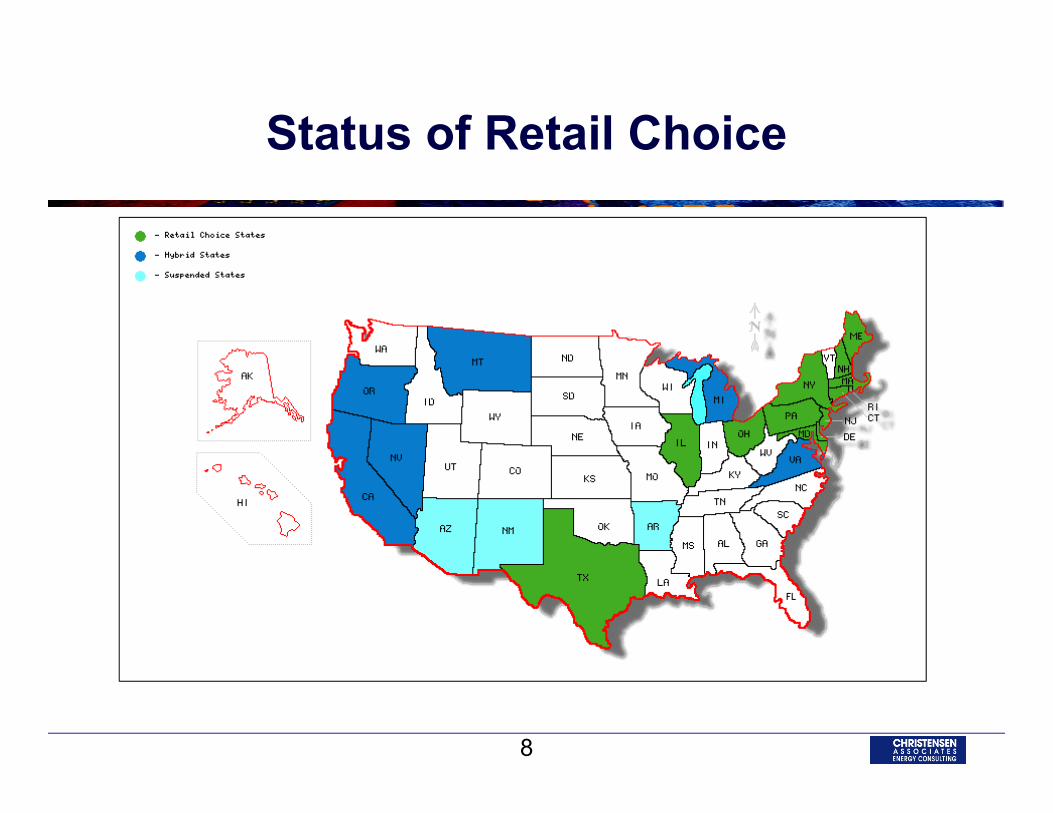
Status of Retail Choice
8
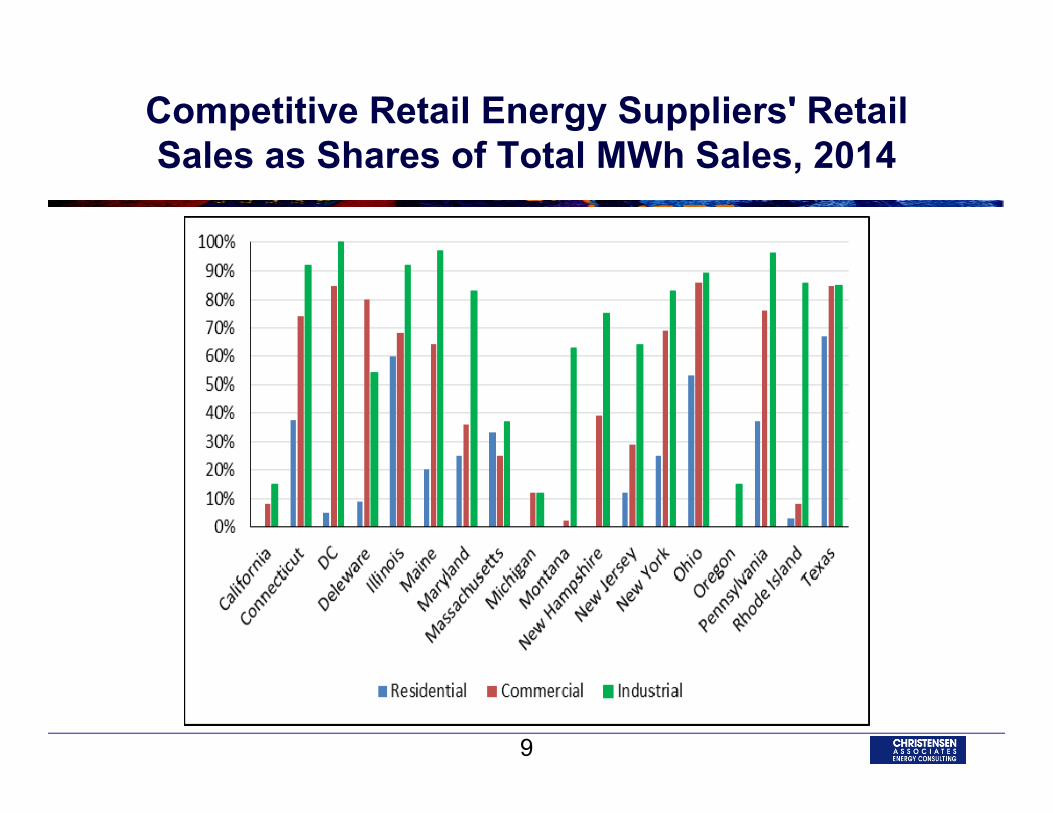
Competitive Retail Energy Suppliers' Retail Sales as Shares of Total MWh Sales, 2014
9

Residential Customers Taking Competitive Electric Service as Shares of Eligible Customers,
2014
10
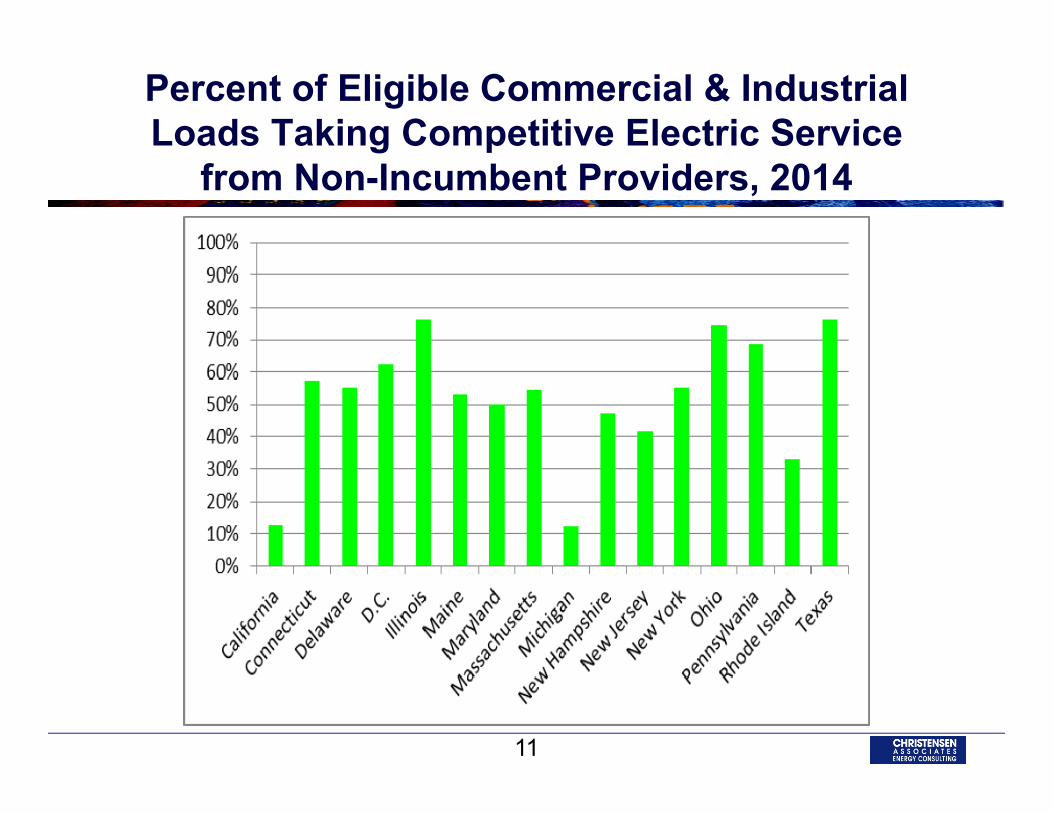
Percent of Eligible Commercial & Industrial Loads Taking Competitive Electric Service
from Non-Incumbent Providers, 2014
11
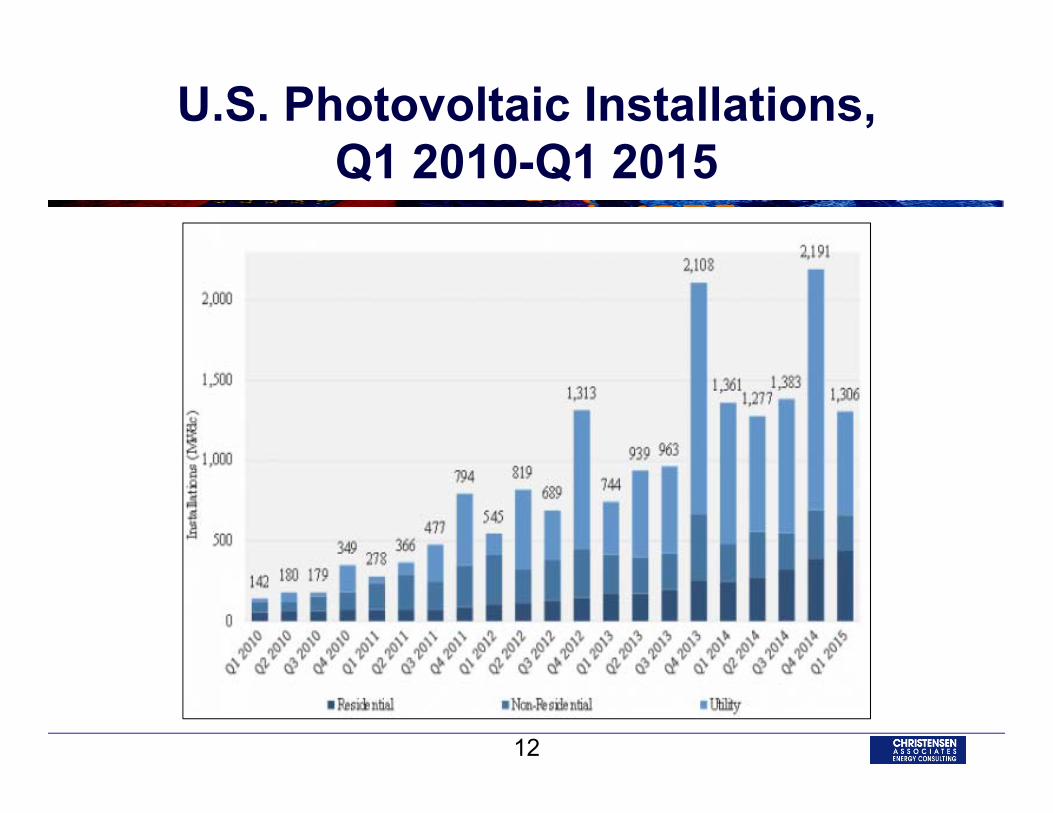
U.S. Photovoltaic Installations, Q1 2010-Q1 2015
12
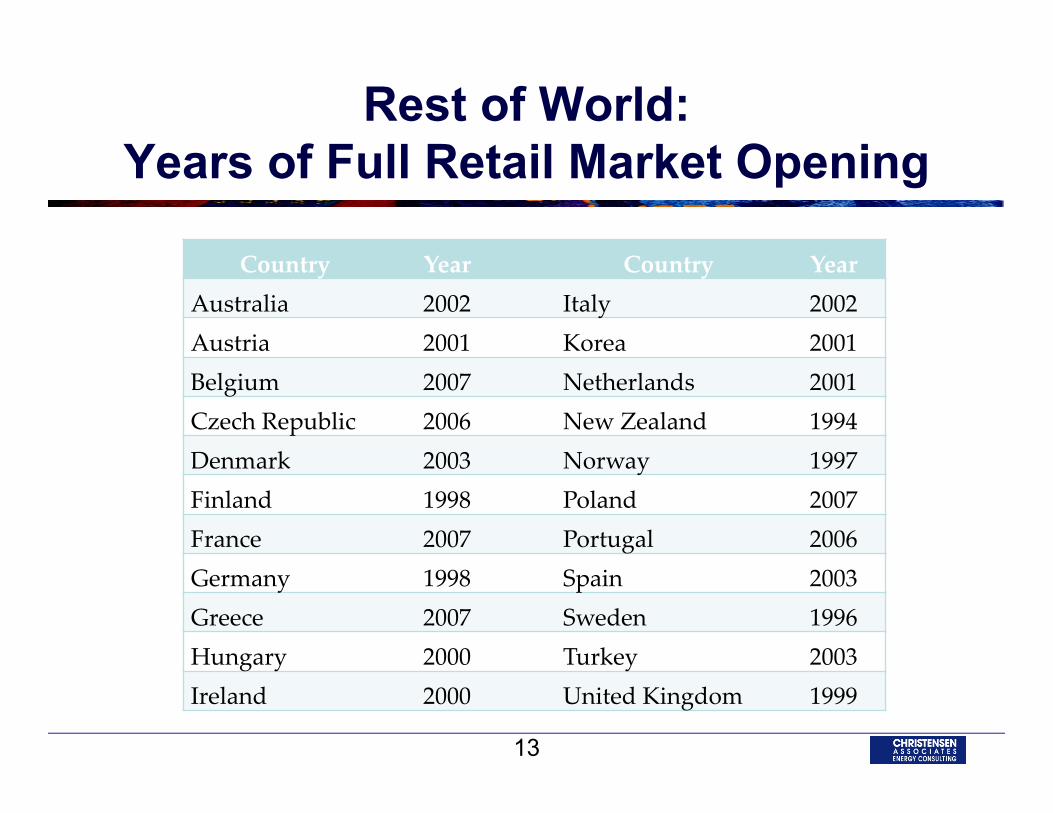
Rest of World:Years of Full Retail Market Opening
Country Year Country YearAustralia 2002 Italy 2002Austria 2001 Korea 2001Belgium 2007 Netherlands 2001Czech Republic 2006 New Zealand 1994Denmark 2003 Norway 1997Finland 1998 Poland 2007France 2007 Portugal 2006Germany 1998 Spain 2003Greece 2007 Sweden 1996Hungary 2000 Turkey 2003Ireland 2000 United Kingdom 1999
13
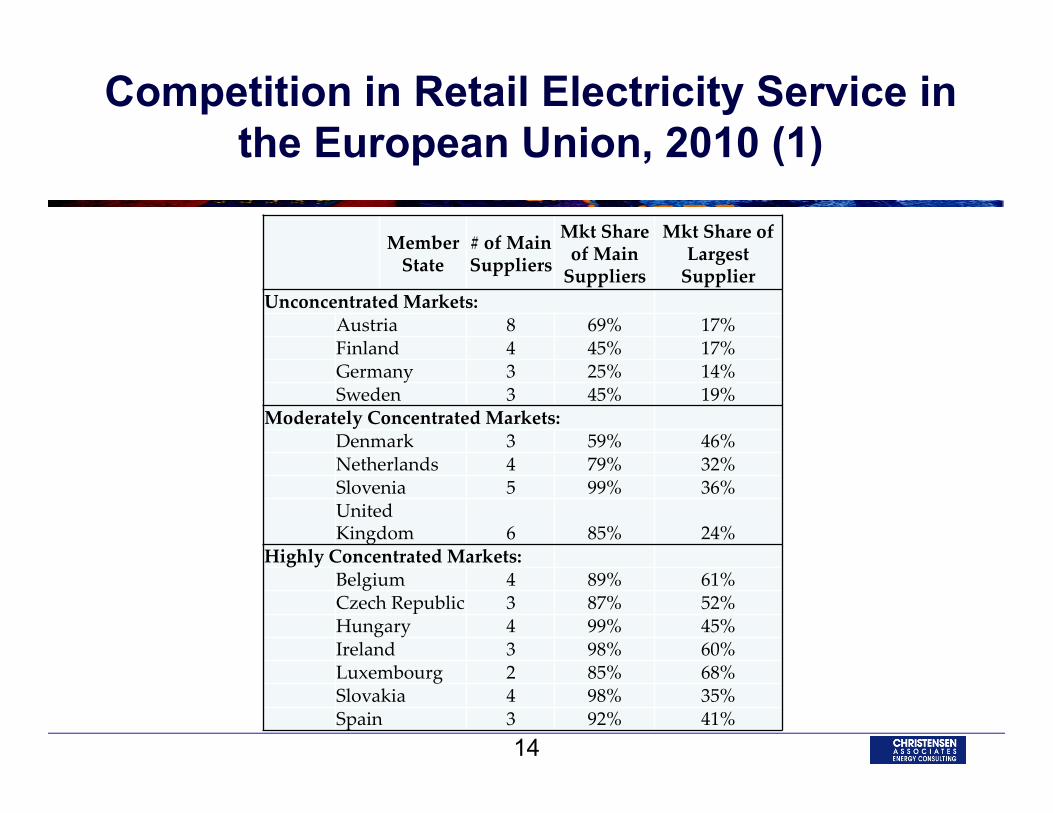
Competition in Retail Electricity Service in the European Union, 2010 (1)
Member State
# of Main Suppliers
Mkt Share of Main Suppliers
Mkt Share of Largest Supplier
Unconcentrated Markets:Austria 8 69% 17%Finland 4 45% 17%Germany 3 25% 14%Sweden 3 45% 19%
Moderately Concentrated Markets:Denmark 3 59% 46%Netherlands 4 79% 32%Slovenia 5 99% 36%United Kingdom 6 85% 24%
Highly Concentrated Markets:Belgium 4 89% 61%Czech Republic 3 87% 52%Hungary 4 99% 45%Ireland 3 98% 60%Luxembourg 2 85% 68%Slovakia 4 98% 35%Spain 3 92% 41%
14
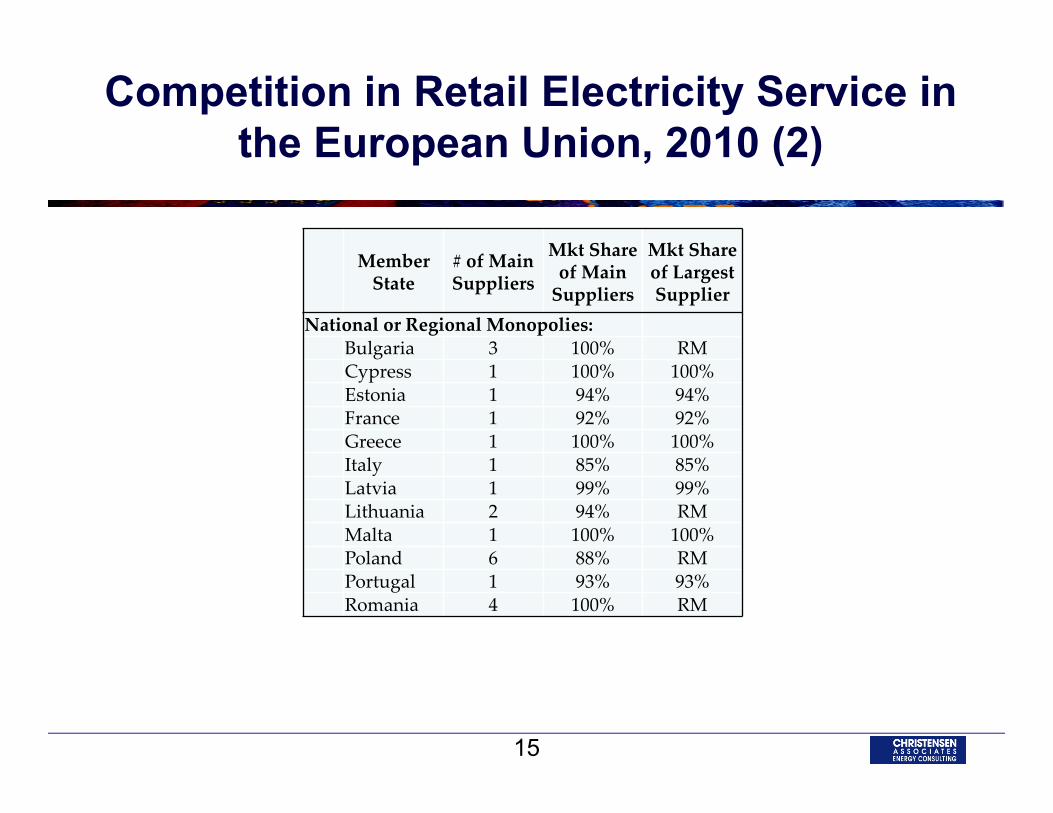
Competition in Retail Electricity Service in the European Union, 2010 (2)
Member State
# of Main Suppliers
Mkt Share of Main Suppliers
Mkt Share of Largest Supplier
National or Regional Monopolies:Bulgaria 3 100% RMCypress 1 100% 100%Estonia 1 94% 94%France 1 92% 92%Greece 1 100% 100%Italy 1 85% 85%Latvia 1 99% 99%Lithuania 2 94% RMMalta 1 100% 100%Poland 6 88% RMPortugal 1 93% 93%Romania 4 100% RM
15
HISTORY OF RETAIL CHOICE
16
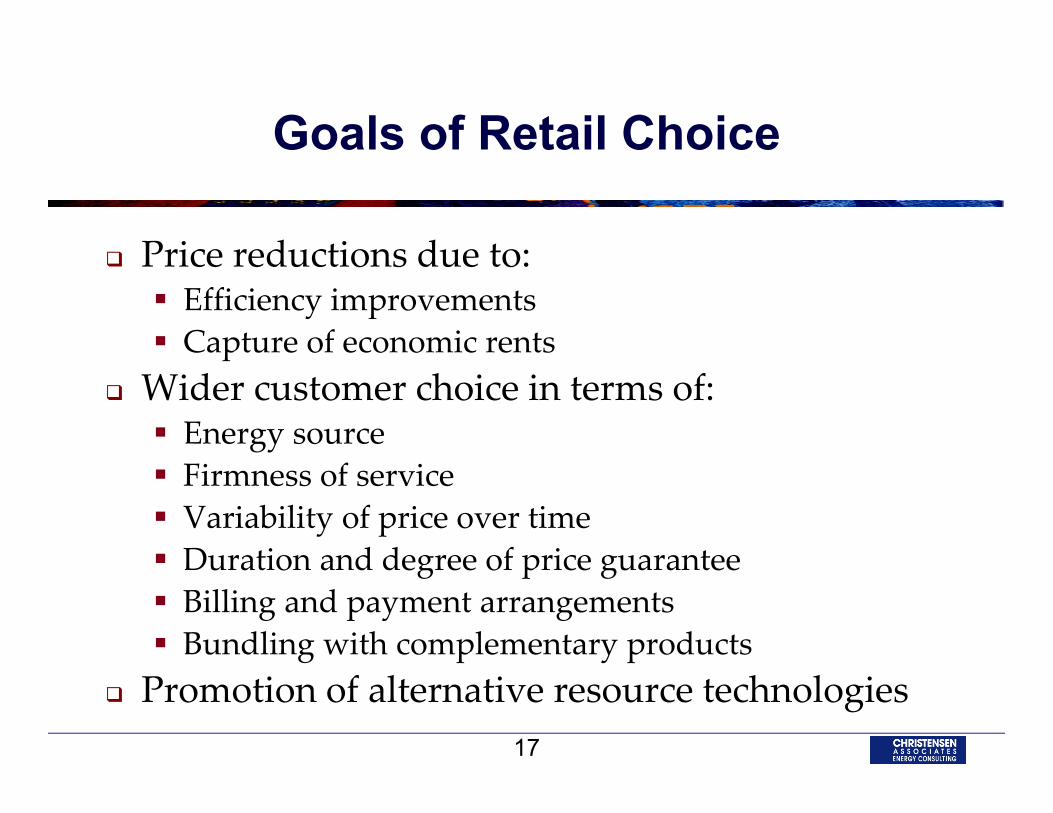
Goals of Retail Choice
Price reductions due to: Efficiency improvements Capture of economic rents
Wider customer choice in terms of: Energy source Firmness of service Variability of price over time Duration and degree of price guarantee Billing and payment arrangements Bundling with complementary products
Promotion of alternative resource technologies17
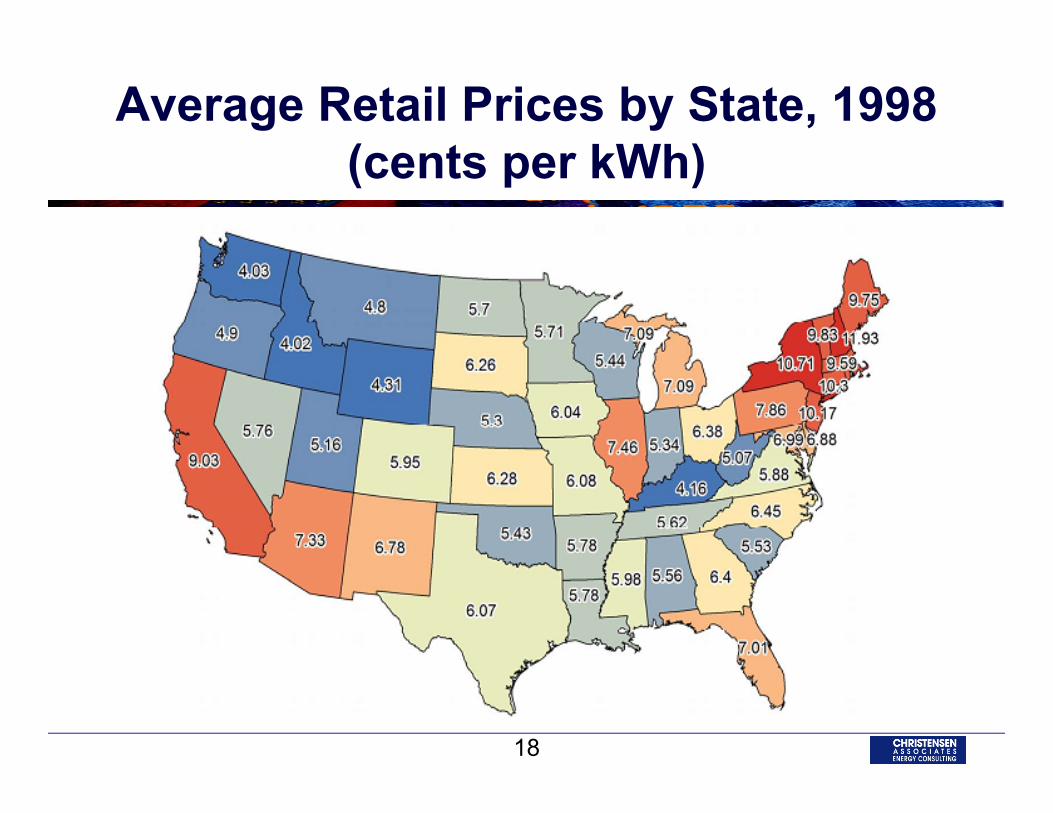
Average Retail Prices by State, 1998 (cents per kWh)
18
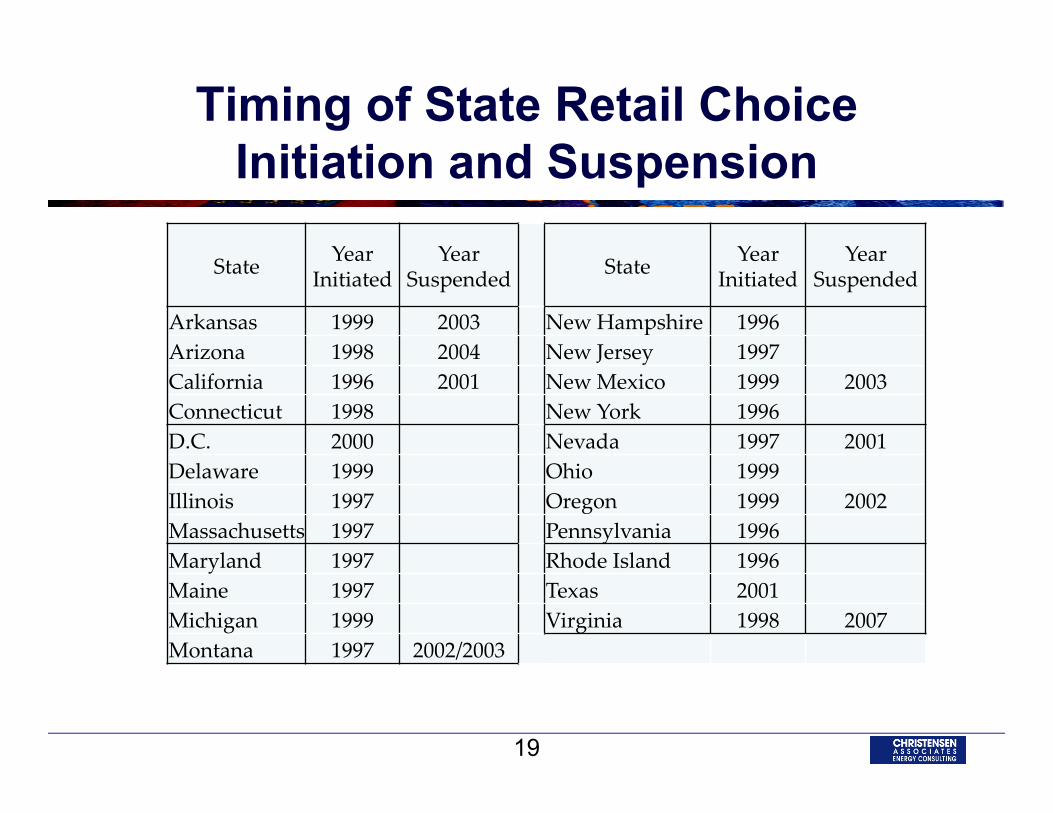
Timing of State Retail Choice Initiation and Suspension
State Year Initiated
Year Suspended State Year
InitiatedYear
Suspended
Arkansas 1999 2003 New Hampshire 1996Arizona 1998 2004 New Jersey 1997California 1996 2001 New Mexico 1999 2003Connecticut 1998 New York 1996D.C. 2000 Nevada 1997 2001Delaware 1999 Ohio 1999Illinois 1997 Oregon 1999 2002Massachusetts 1997 Pennsylvania 1996Maryland 1997 Rhode Island 1996Maine 1997 Texas 2001Michigan 1999 Virginia 1998 2007Montana 1997 2002/2003
19
IMPLEMENTATION CHALLENGES
20
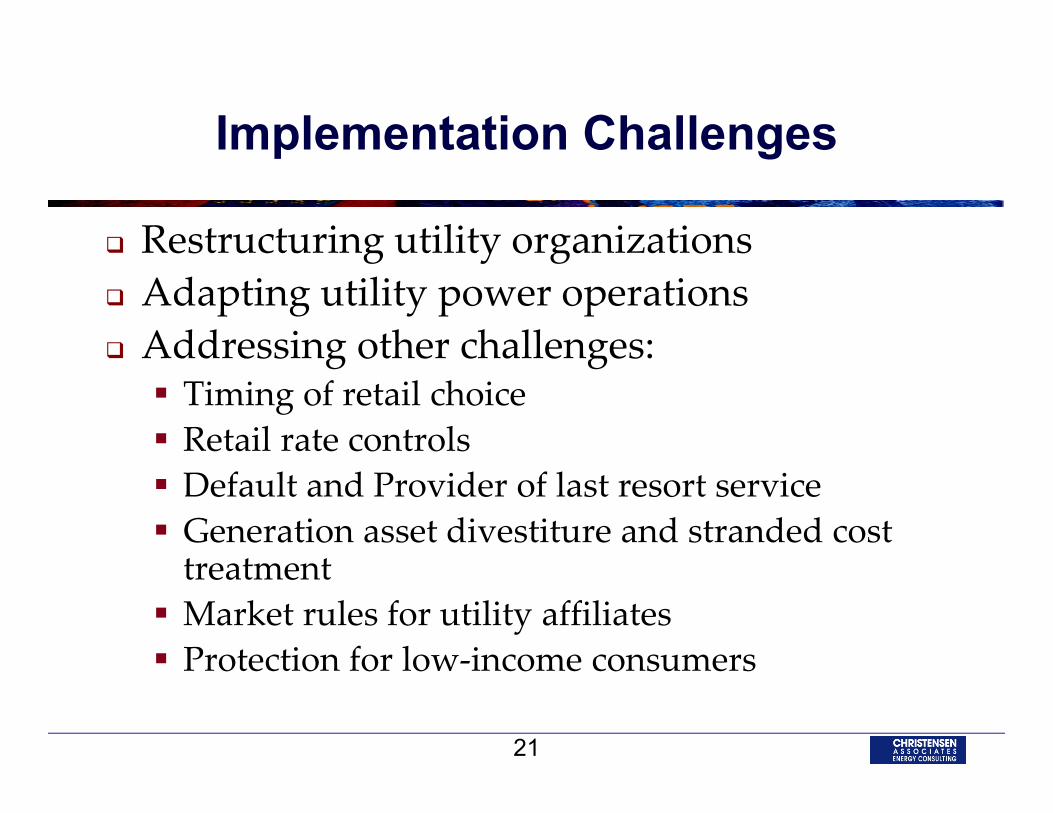
Implementation Challenges
Restructuring utility organizations Adapting utility power operations Addressing other challenges: Timing of retail choice Retail rate controls Default and Provider of last resort service Generation asset divestiture and stranded cost treatment Market rules for utility affiliates Protection for low‐income consumers
21
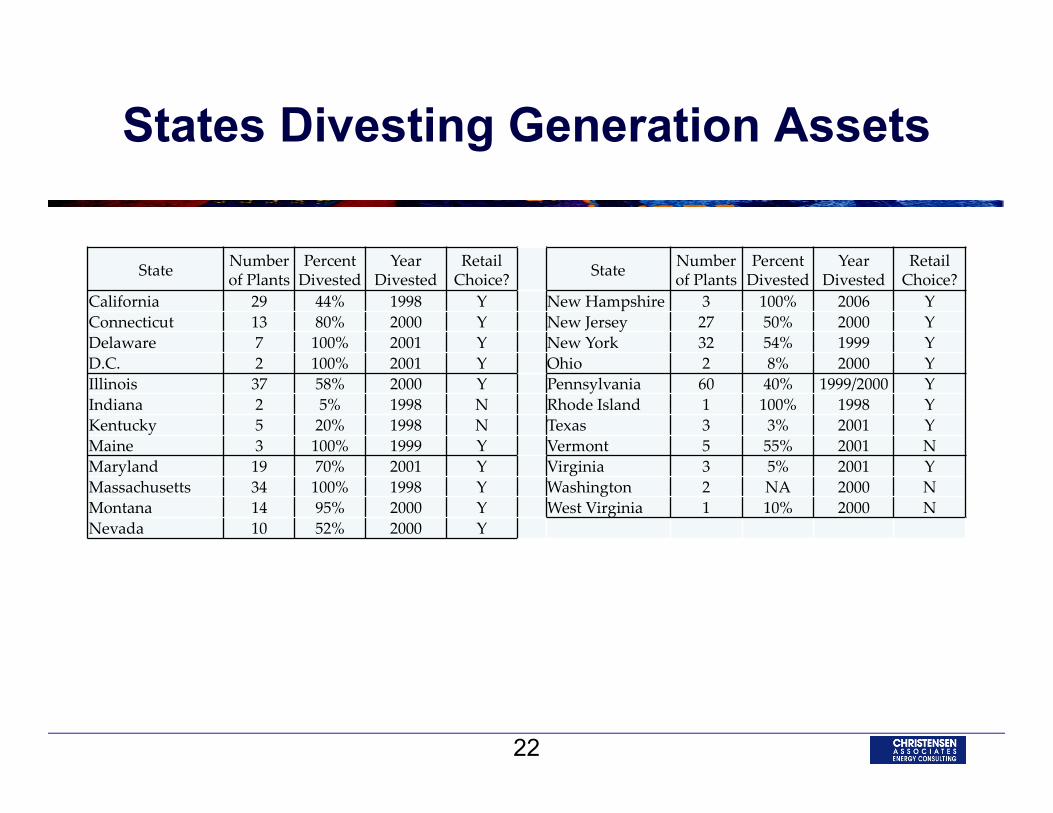
States Divesting Generation Assets
State Number of Plants
Percent Divested
Year Divested
Retail Choice? State Number
of PlantsPercent Divested
Year Divested
Retail Choice?
California 29 44% 1998 Y New Hampshire 3 100% 2006 YConnecticut 13 80% 2000 Y New Jersey 27 50% 2000 YDelaware 7 100% 2001 Y New York 32 54% 1999 YD.C. 2 100% 2001 Y Ohio 2 8% 2000 YIllinois 37 58% 2000 Y Pennsylvania 60 40% 1999/2000 YIndiana 2 5% 1998 N Rhode Island 1 100% 1998 YKentucky 5 20% 1998 N Texas 3 3% 2001 YMaine 3 100% 1999 Y Vermont 5 55% 2001 NMaryland 19 70% 2001 Y Virginia 3 5% 2001 YMassachusetts 34 100% 1998 Y Washington 2 NA 2000 NMontana 14 95% 2000 Y West Virginia 1 10% 2000 NNevada 10 52% 2000 Y
22
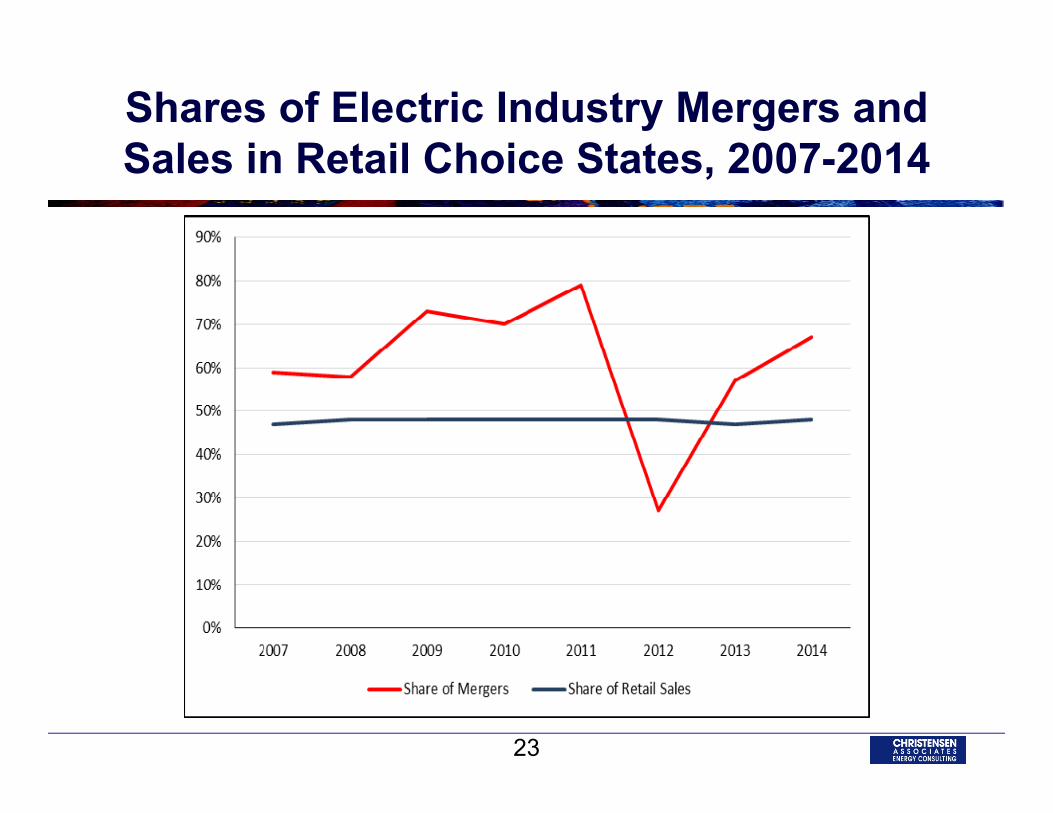
Shares of Electric Industry Mergers and Sales in Retail Choice States, 2007-2014
23
IMPACTS ON CUSTOMER SERVICE
24
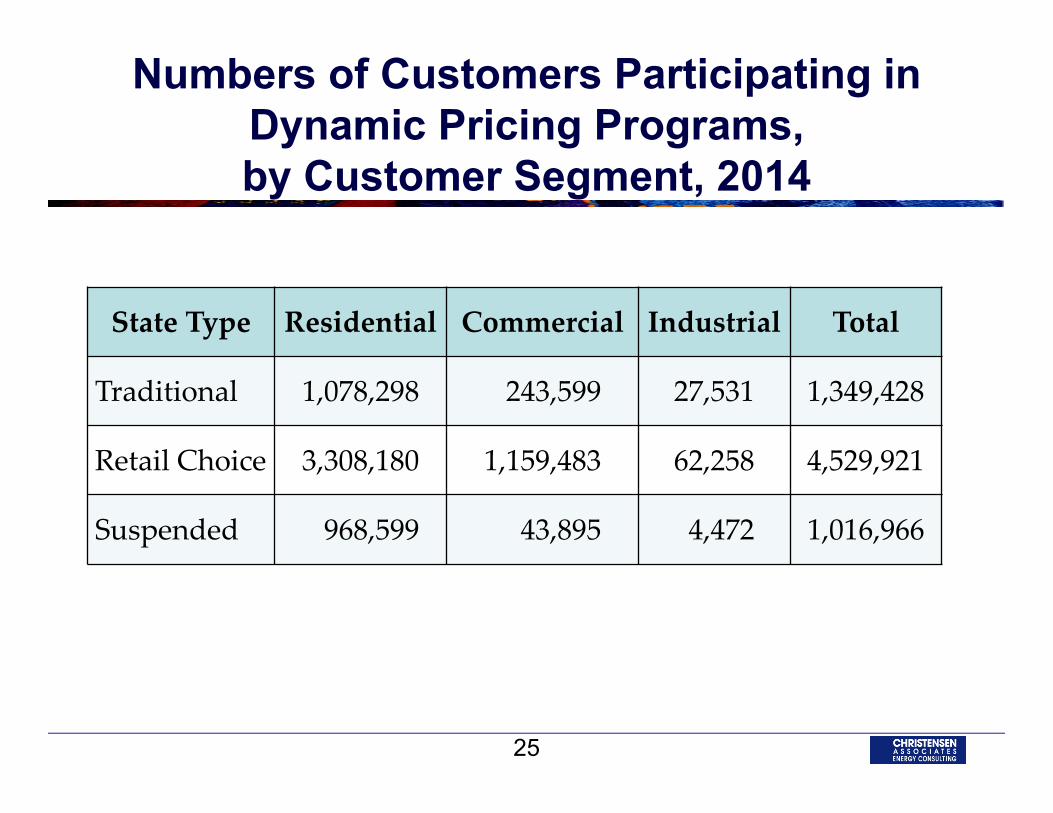
Numbers of Customers Participating in Dynamic Pricing Programs, by Customer Segment, 2014
State Type Residential Commercial Industrial Total
Traditional 1,078,298 243,599 27,531 1,349,428
Retail Choice 3,308,180 1,159,483 62,258 4,529,921
Suspended 968,599 43,895 4,472 1,016,966
25
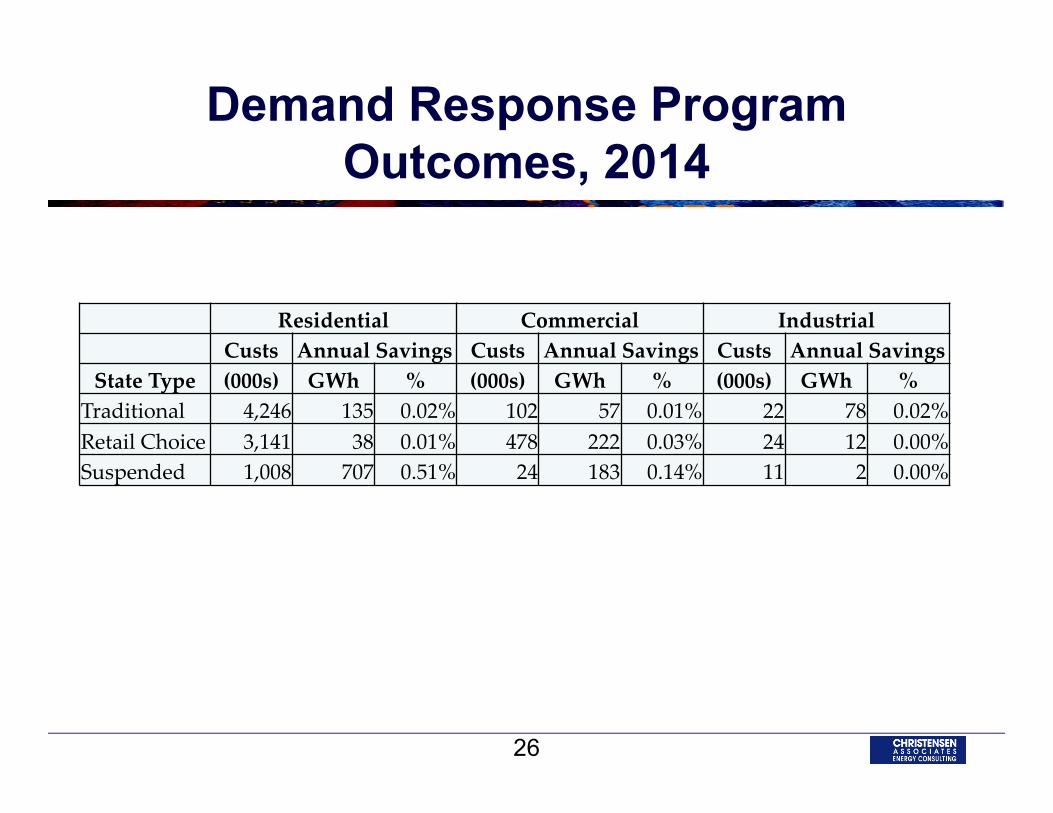
Demand Response Program Outcomes, 2014
Residential Commercial IndustrialCusts Annual Savings Custs Annual Savings Custs Annual Savings
State Type (000s) GWh % (000s) GWh % (000s) GWh %Traditional 4,246 135 0.02% 102 57 0.01% 22 78 0.02%Retail Choice 3,141 38 0.01% 478 222 0.03% 24 12 0.00%Suspended 1,008 707 0.51% 24 183 0.14% 11 2 0.00%
26
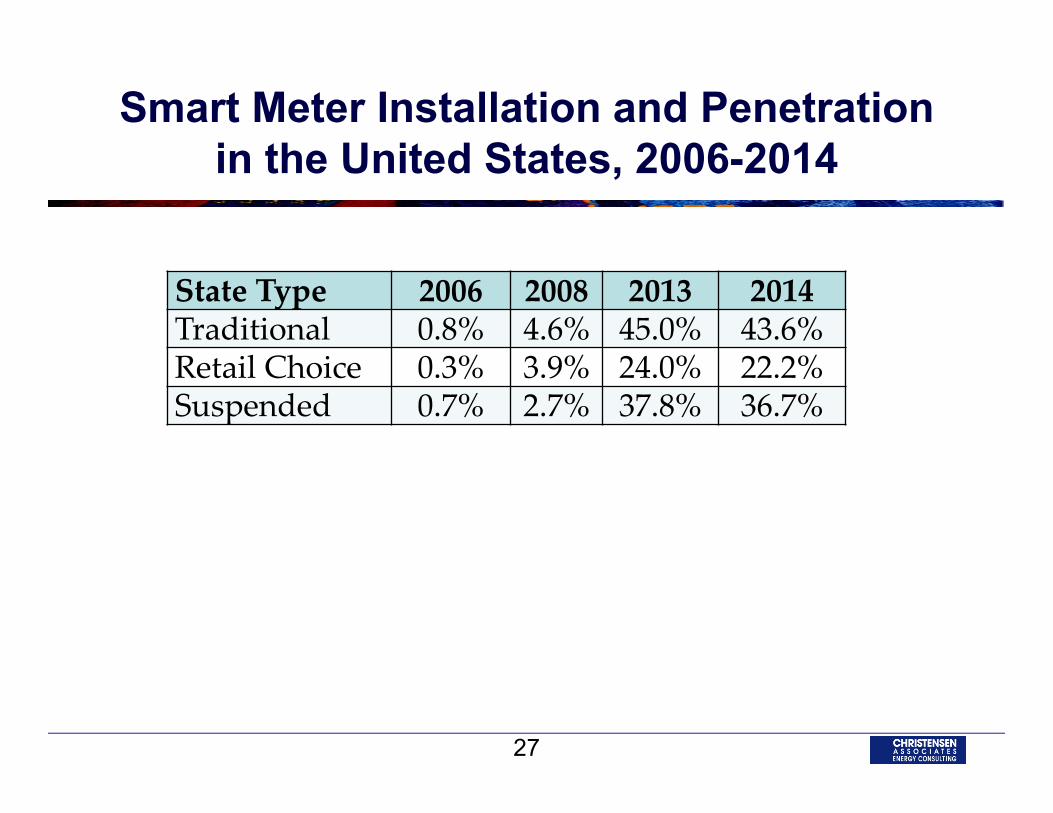
Smart Meter Installation and Penetration in the United States, 2006-2014
State Type 2006 2008 2013 2014Traditional 0.8% 4.6% 45.0% 43.6%Retail Choice 0.3% 3.9% 24.0% 22.2%Suspended 0.7% 2.7% 37.8% 36.7%
27
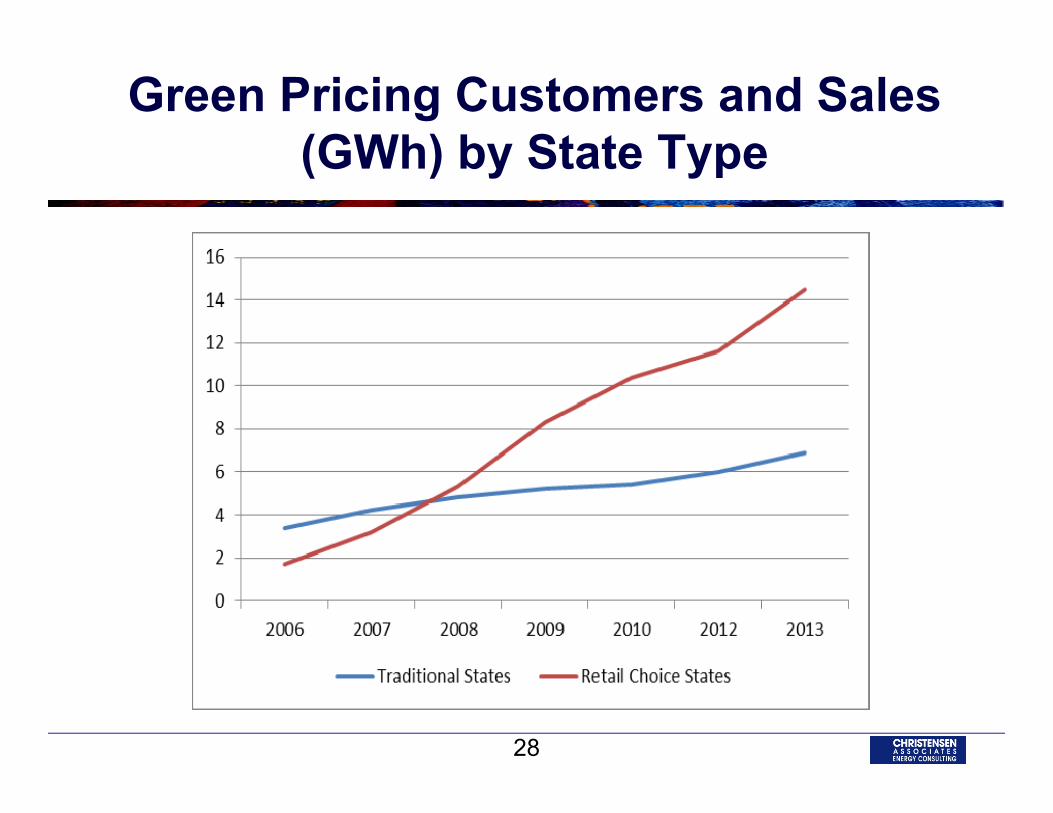
Green Pricing Customers and Sales (GWh) by State Type
28
Customer Satisfaction: JD Power Survey (1)
RC customers are more satisfied with price than customers of local electric utilities Customer satisfaction is tied to price perception, which is shaped by the level of price volatility Price satisfaction is higher under fixed‐price contracts than under variable‐price contracts. Satisfaction is lower in aggregation programs than when the customer chooses their provider.
29
Customer Satisfaction:JD Power Survey (2)
Residential customers do not switch to alternative retail providers because: Savings are not large enough: one fourth would switch for $20 cut in monthly bill. Satisfied with incumbent utility. Lack of knowledge about how to switch. Fear service quality would decline.
Residential electric customers’ satisfaction with the overall price of service increases substantially as customers become more familiar with available energy efficiency programs.
30
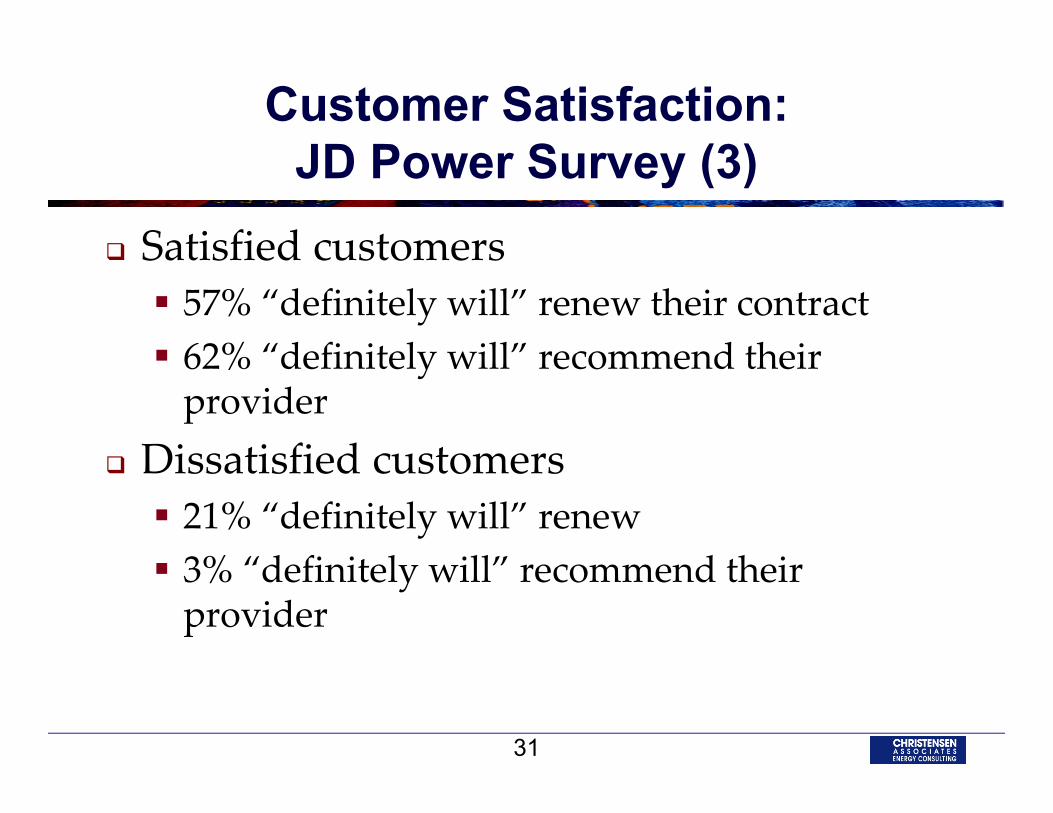
Customer Satisfaction:JD Power Survey (3)
Satisfied customers 57% “definitely will” renew their contract 62% “definitely will” recommend their provider
Dissatisfied customers 21% “definitely will” renew 3% “definitely will” recommend their provider
31
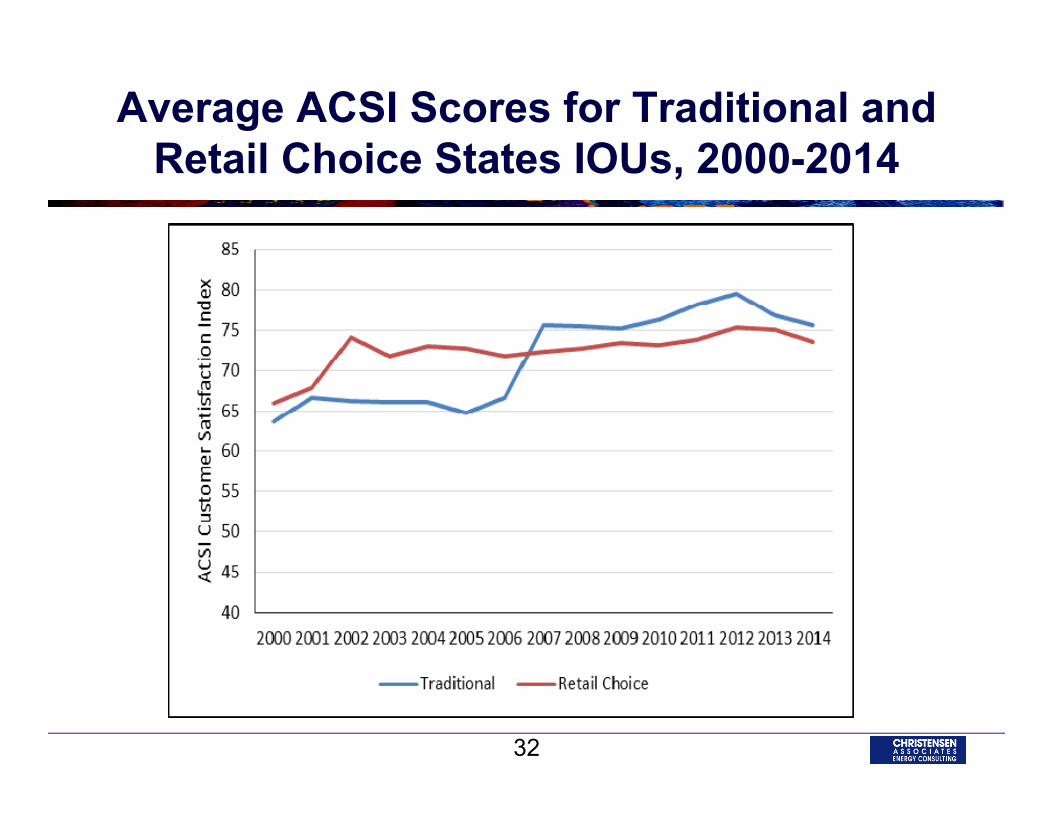
Average ACSI Scores for Traditional and Retail Choice States IOUs, 2000-2014
32
IMPACTS ON PRICES
33
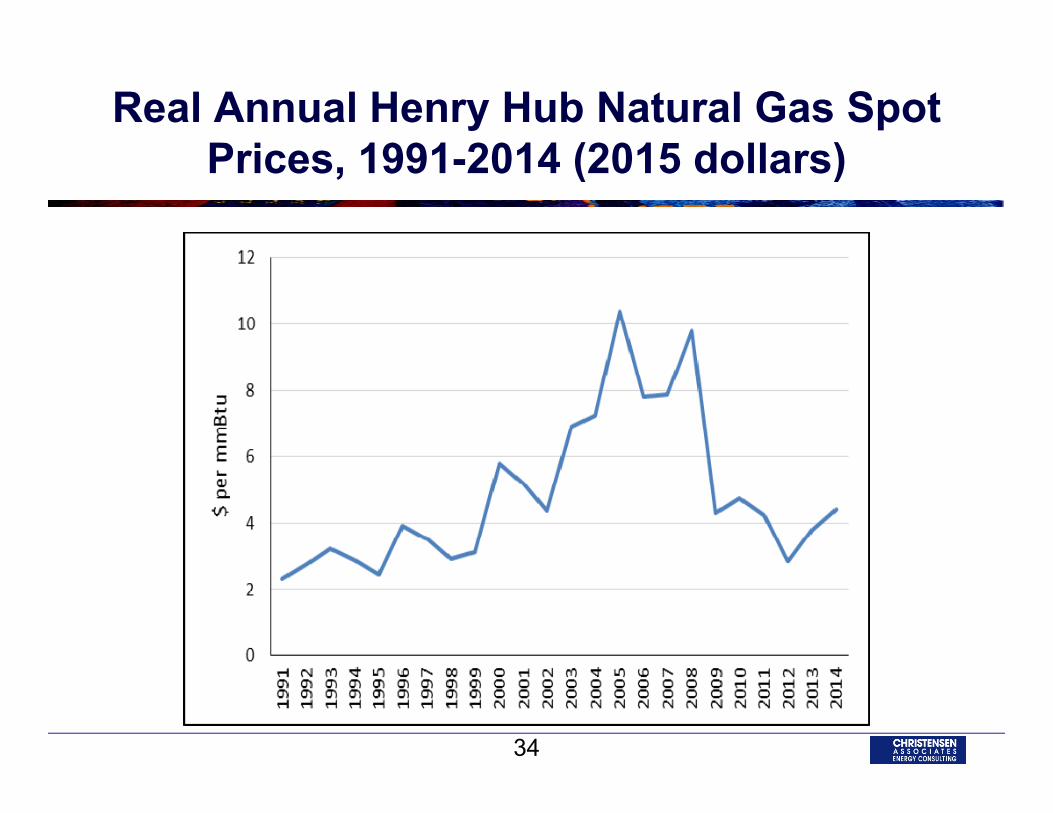
Real Annual Henry Hub Natural Gas Spot Prices, 1991-2014 (2015 dollars)
34
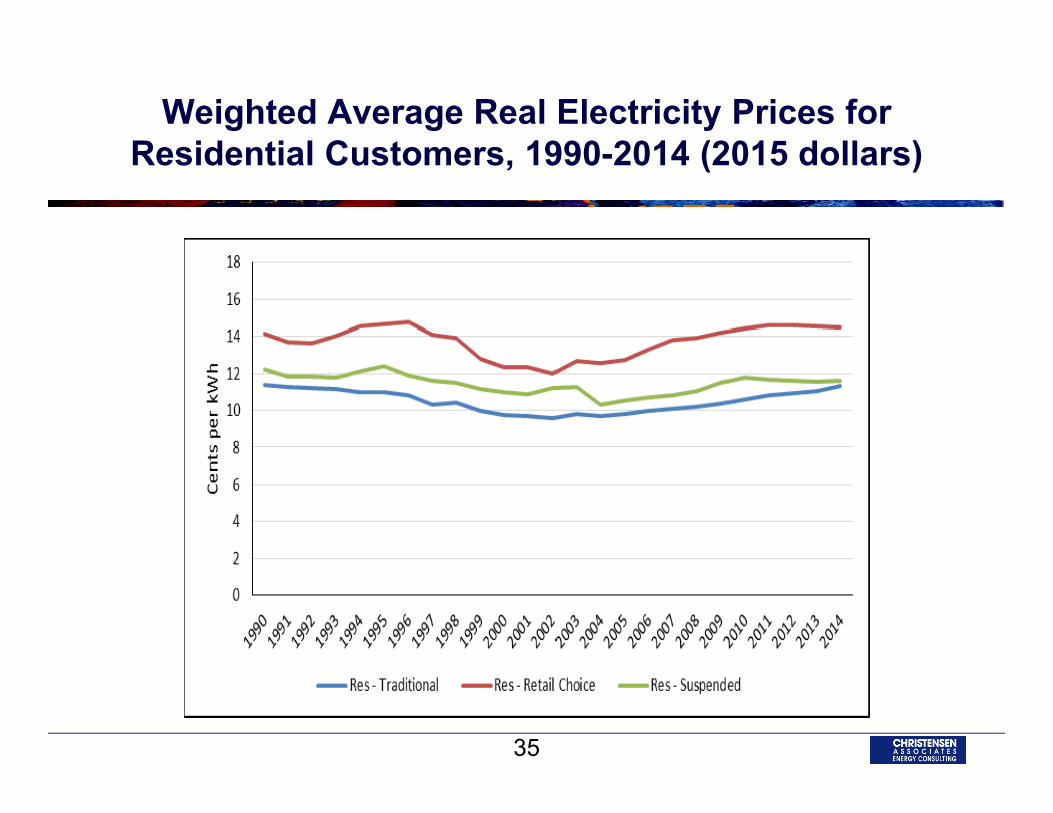
Weighted Average Real Electricity Prices for Residential Customers, 1990-2014 (2015 dollars)
35
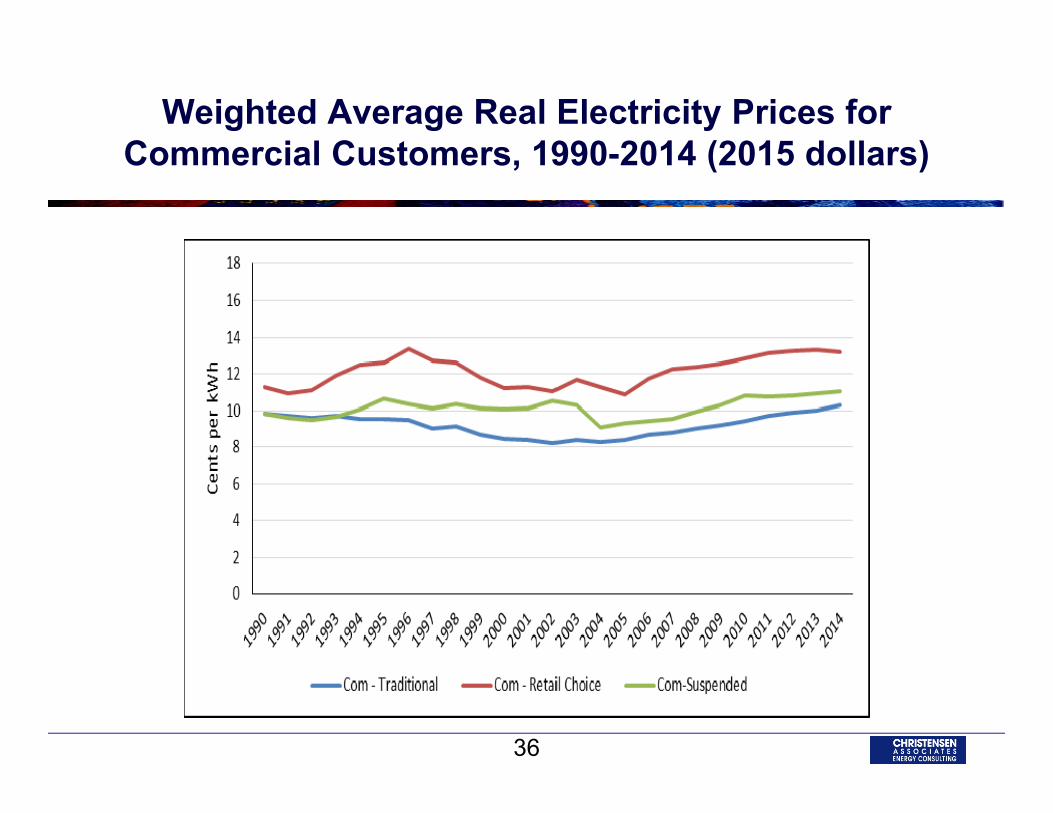
Weighted Average Real Electricity Prices for Commercial Customers, 1990-2014 (2015 dollars)
36
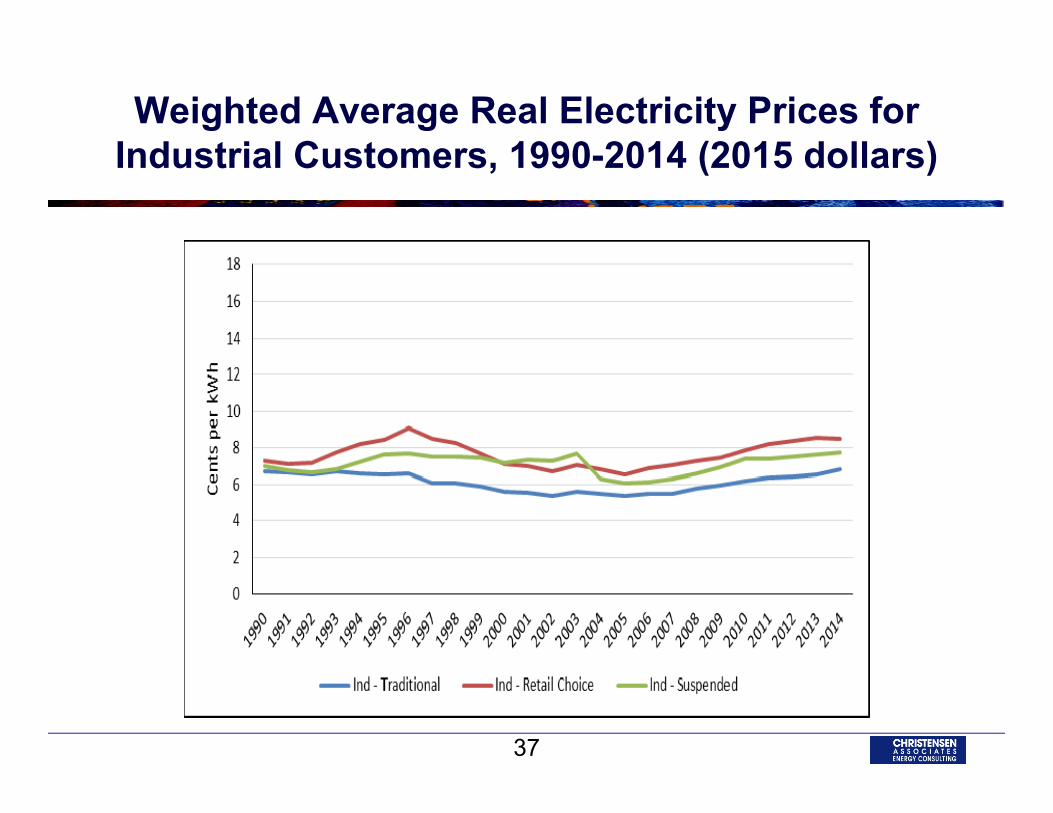
Weighted Average Real Electricity Prices for Industrial Customers, 1990-2014 (2015 dollars)
37
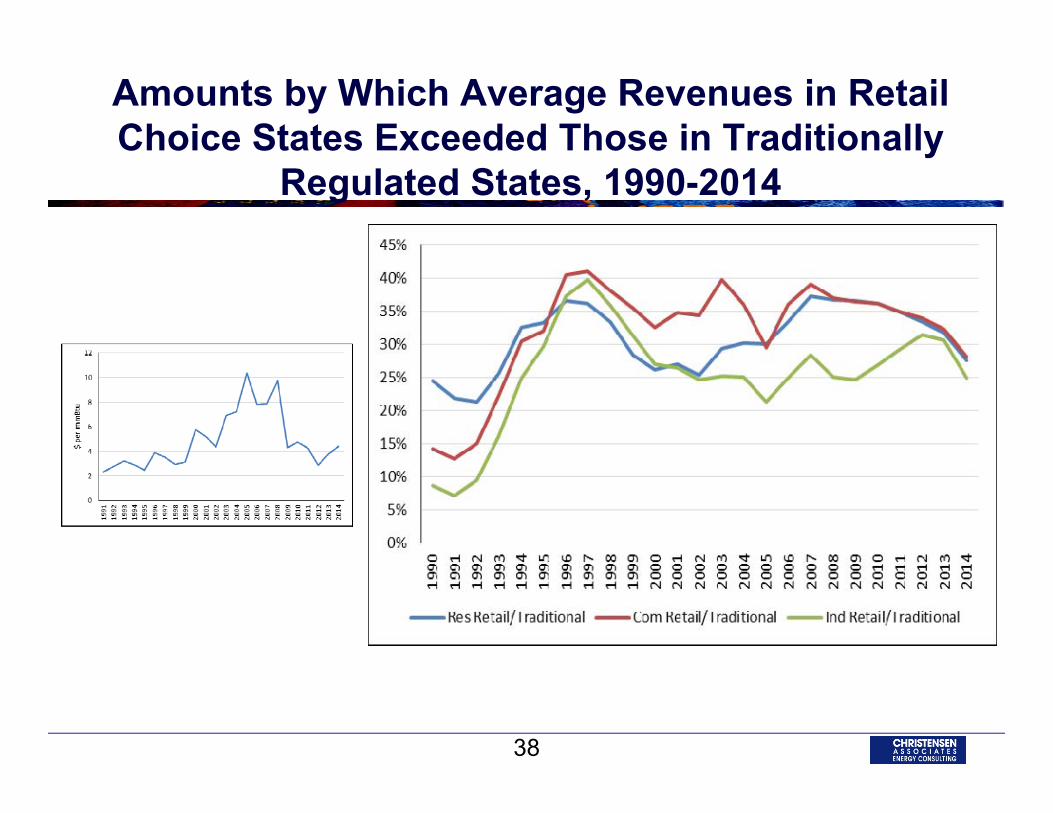
Amounts by Which Average Revenues in Retail Choice States Exceeded Those in Traditionally
Regulated States, 1990-2014
38
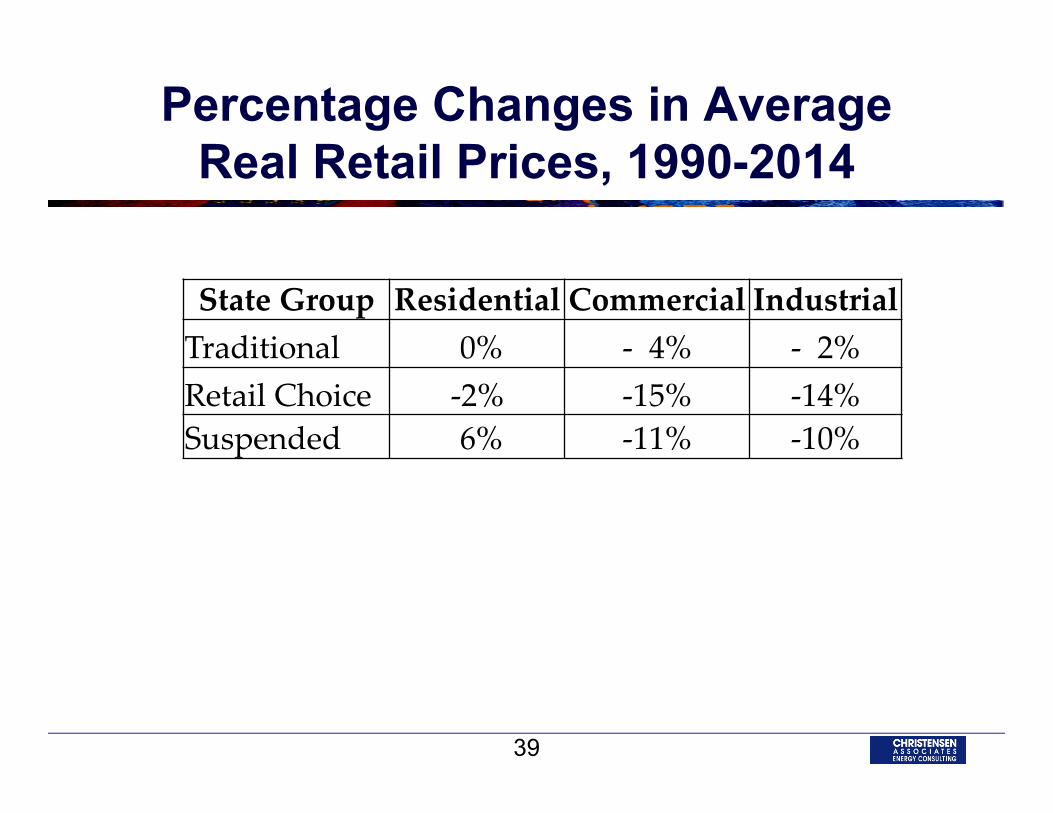
Percentage Changes in Average Real Retail Prices, 1990-2014
State Group Residential Commercial IndustrialTraditional 0% ‐ 4% ‐ 2%Retail Choice ‐2% ‐15% ‐14%Suspended 6% ‐11% ‐10%
39
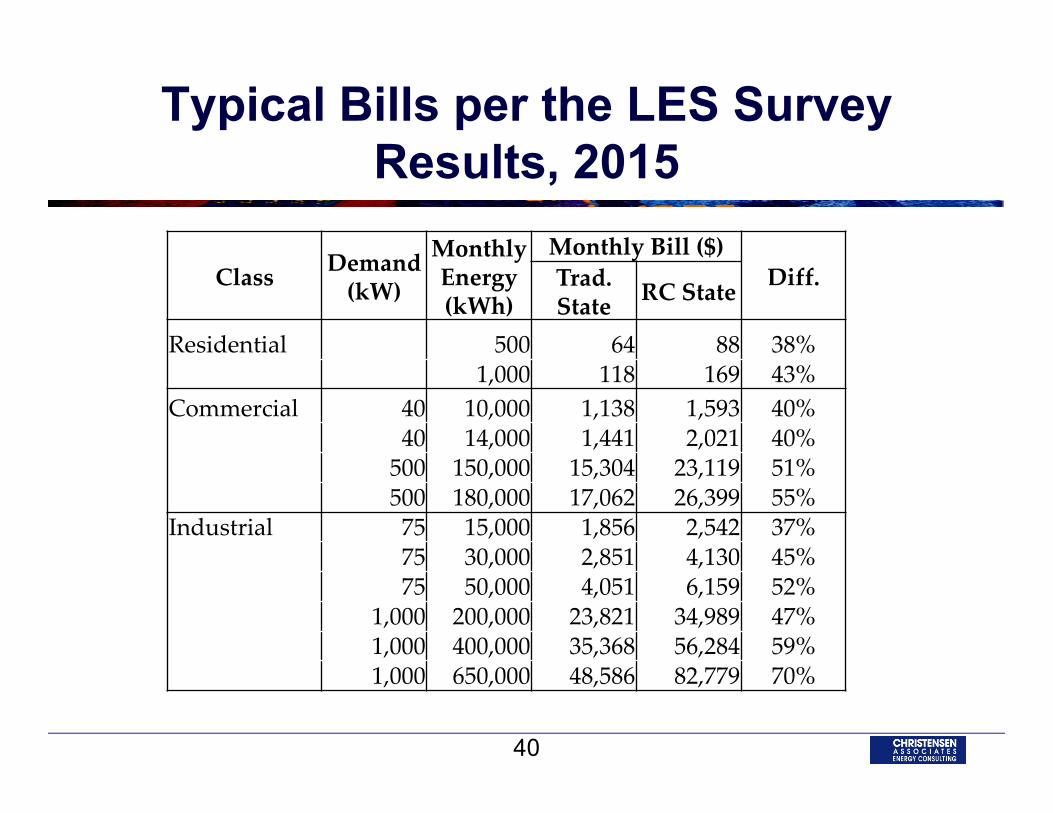
Typical Bills per the LES Survey Results, 2015
Class Demand (kW)
Monthly Energy (kWh)
Monthly Bill ($)Diff.Trad.
State RC State
Residential 500 64 88 38%1,000 118 169 43%
Commercial 40 10,000 1,138 1,593 40%40 14,000 1,441 2,021 40%500 150,000 15,304 23,119 51%500 180,000 17,062 26,399 55%
Industrial 75 15,000 1,856 2,542 37%75 30,000 2,851 4,130 45%75 50,000 4,051 6,159 52%
1,000 200,000 23,821 34,989 47%1,000 400,000 35,368 56,284 59%1,000 650,000 48,586 82,779 70%
40
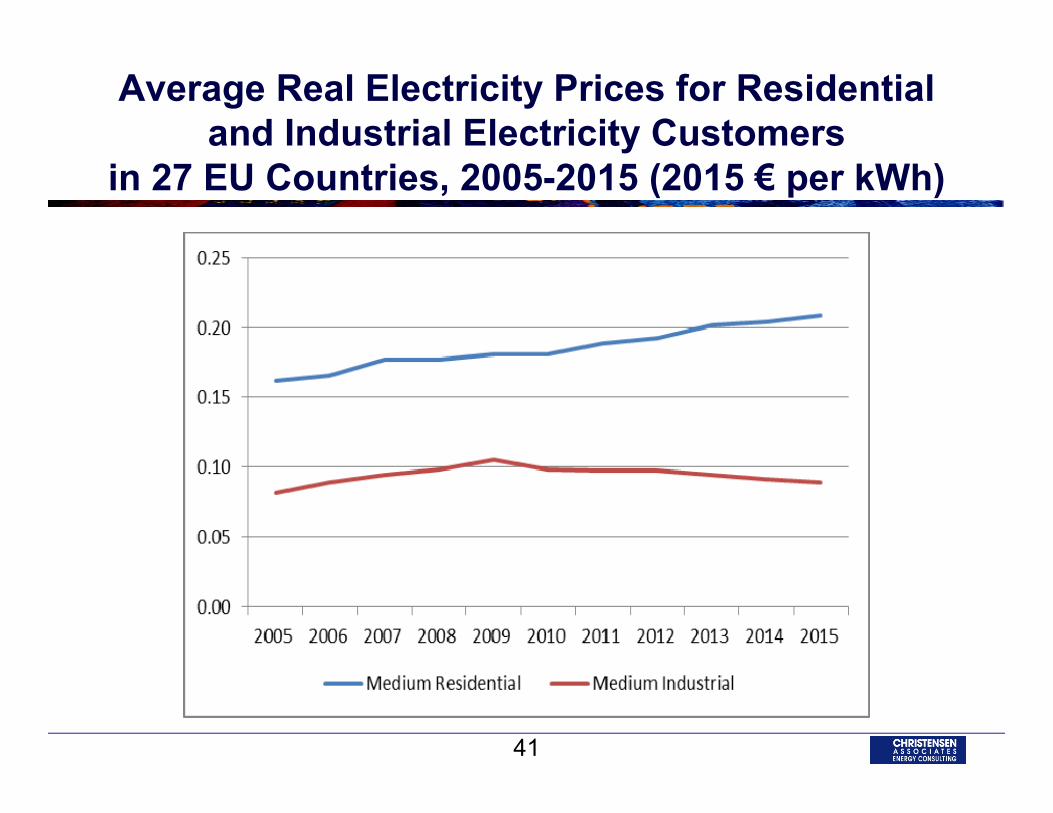
Average Real Electricity Prices for Residential and Industrial Electricity Customers
in 27 EU Countries, 2005-2015 (2015 € per kWh)
41
Statistical Studies Focused on Retail Choice
RC has reduced retail prices. RC has increased retail prices. RC has reduced retail prices in states with high participation rates and raised retail prices in states with low participation rates.
Restructuring and RC have improved generating plant efficiencies.
42
Statistical Studies Focused on Restructuring in General
Restructuring : has provided substantial consumer benefits and/or significantly lower consumer prices; has not significantly affected customers’ prices; has increased wholesale prices.
Consumers in PJM have enjoyed savings due to restructuring.
43
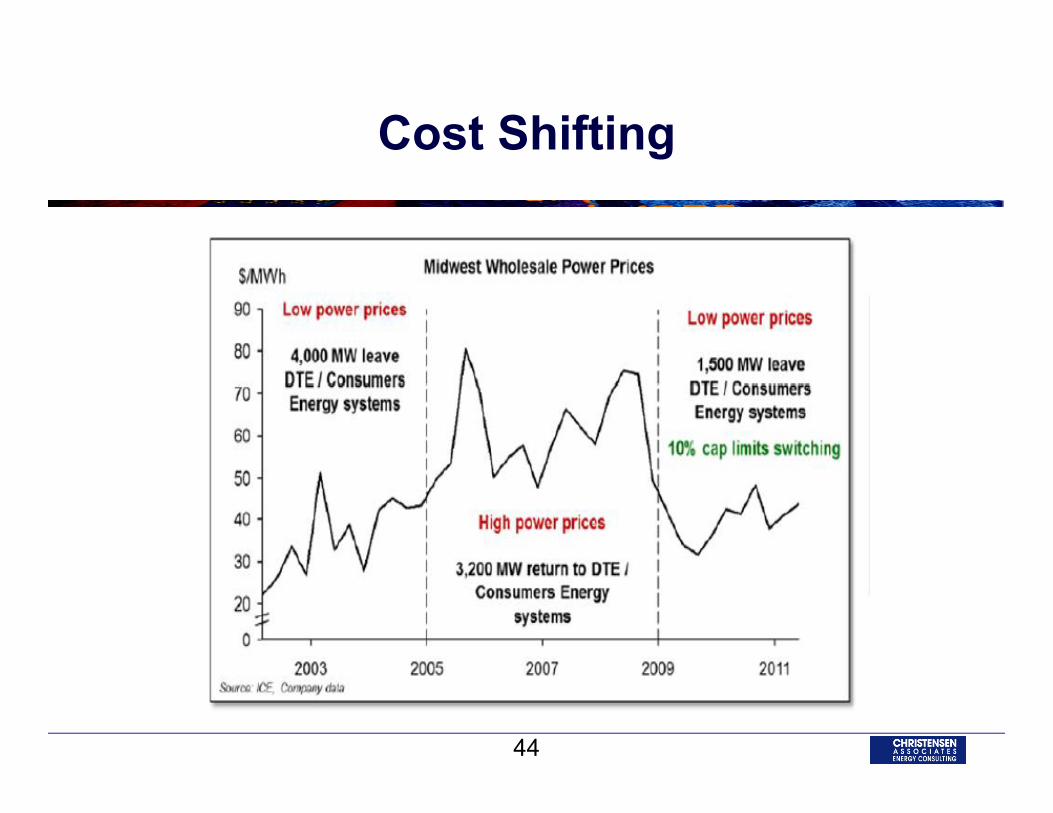
Cost Shifting
44
Investment Risk Impacts
RC adds to the financial uncertainties faced by investors in generating resources. Under RC, sales contracts have durations that are only small fractions of generators’ lives. The consequent revenue uncertainty makes:
– investment in new generation less attractive– long‐term fuel contracting less attractive.
The foregoing uncertainties: raise the required returns on investment, and may impinge upon resource adequacy.
45
Impacts on Demographic Groups
RC causes greater locational variation in retail prices.
RC may disproportionately benefit well educated, high‐income, white, urban customers.
Concerns over low residential switching rates are misplaced.
46
CONCLUSIONS
47
RC’s Benefits are Ambiguous
There is little evidence that RC has yielded significant benefits beyond those from wholesale competition. Price impacts are ambiguous. Service options may be greater. Participation in dynamic pricing programs is greater. Consumer risks are greater.
48
Directions for Future Policy
RC’s benefits should be measured by the value it adds, not by switching rates. Customers should not be forced to switch. Competitors should not be subsidized.
In all states, generation services should be unbundled from other services.
In RC states, utilities should offer real‐time pricing to all customers willing to pay metering and billing costs.
49


![Electricity Revision Question 1 DGC 2008 Q4 … Revision Question 1 ‐ DGC 2008 Q4 Supply of Electricity [20 Marks] With the problems faced by Eskom in maintaining sufficient electricity](https://img.pdfslide.tips/doc/110x75/5b88715c7f8b9a5b688b8583/electricity-revision-question-1-dgc-2008-q4-revision-question-1-dgc-2008-q4.jpg)