Embed Size (px)
Citation preview
170
Rev. Fac. Ing. Univ. Antioquia N.° 62 pp. 170-176. Marzo, 2012
Rainfall – CN (Curve Number) relationships in a tropical rainforest microbasin within the Panamá Canal watershed
Relaciones Precipitación – CN (Número de Curva) en una microcuenca de un bosque húmedo tropical dentro de la cuenca del Canal de Panamá
José R. Fábrega D*., Reinhardt Pinzón, Erick Vallester, David Vega
Centro de Investigaciones Hidráulicas e Hidrotécnicas. Universidad Tecnológica de Panamá Sede Tocumen. Avenida Domingo Díaz. A.A. 0819-07289. Panamá, Rep. De Panamá.
(Recibido el 19 de enero de 2011. Aceptado el 28 de febrero de 2012)
Abstract
Precipitation (P) Curve-Number (CN) relationships for different base flow ranges, obtained within the upper Chagres River watershed were applied to a 6.5 Ha microbasin located within the Panamá Canal watershed. These relationships estimate CN values from P data employing an equation established by Calvo et al (10). This equation uses k and CN∞ as fitting parameters.
Rainfall/Runoff data from the microbasin, collected over a six-month period, were analyzed. These analyses showed that CN values at the microbasin are closer to CN results predicted by the equation corresponding to the lower base-flow range (14-42 m3/s) at the upper Chagres watershed. These results were explained by considering not the absolute values of the base flow (Qbase), but the value of this parameter relative to the basin area under study.
----- Keywords: Precipitation, Panamá Canal watershed, curve number, tropical hydrology
Resumen
Relaciones de Precipitación (P) y Número de Curva (CN) para diferentes rangos de flujo base obtenidas dentro de la cuenca alta del Río Chagres fueron
* Autor de correspondencia: teléfono: 50 + 7 + 290 84 12, fax: 50 + 7 + 290 84 46, correo electrónico: [email protected] (J. Fábrega)

171
Rainfall – CN (Curve Number) relationships in a tropical rainforest microbasin within the ...
aplicadas a una microcuenca de 6.5 Ha localizada dentro de la cuenca del Canal de Panamá. Estas relaciones estiman valores de CN a partir de los datos de P empleando una ecuación establecida por Calvo et al (10). Esta ecuación usa k y CN∞ como parámetros de ajuste. Datos de precipitación/escorrentía de la microcuenca, colectados en un período de 6 meses fueron analizados. Estos análisis mostraron que los valores de CN en la microcuenca son más cercanos a los valores de CN predichos por la ecuación correspondiente al rango más bajo de los flujos base (14-42 m3/s) de la cuenca alta del Río Chagres. Estos resultados se explican si consideramos no los valores absolutos del flujo base Qbase, sino los valores relativos de este parámetro con respecto al área de la cuenca bajo estudio.
----- Palabras clave: Precipitación, Cuenca del Canal de Panamá, números de curva, hidrología tropical
IntroductionThe necessity for a deeper study of the Hydrological Cycle in tropical regions obeys, contrary to popular belief, to the lack of water sources in these regions capable of attending a growing demand. Factors such as population growth and high living standards [1] play an important role in this situation. In addition, existing deforestation rates, changing rainfall patterns, and the negative effects of climate change [2] interact to create a dynamic and complex problem. Although detailed studies in tropical hydrology are scarce, it is important to mention the work of Bruijnzeel [3] in the hydrological functions of tropical rainforests, Elsenbeer [4] in the flow movement in slopes in tropical rainforests, and Bonell [5] in overland flow processes.
The Panamá Canal Watershed not only serves the Panamá Canal operation, but also supplies water for industrial and domestic uses to the City of Panamá. Events such as droughts and land-use changes can seriously damage the existing volume distribution of water in the watershed, with disastrous consequences not only for Panamá but for the world commerce. Even though, two thirds of the rainforests within the Panamá Canal Watershed are protected under the figure of national park or nature monument, it is necessary to further change the way rainforest are protected and pollution controlled in this area. [6]
For the case of the Panamá Canal Watershed a book entitled “The Río Chagres: A multidisciplinary profile of a tropical watershed” [7] was published in 2005. This book was the product of a multidisciplinary study made over a period of 3 years at the upper Río Chagres basin. This work provided a detailed review of topics such as hydrology of hillslope soils [8], runoff production [9] and the determination of CN values for the “Curve Number” Method [10]. This paper focused on this latest topic, since it evaluated the applicability of CN values obtained at the upper Río Chagres basin for the microbasin under study. The goal of this study was to establish possible similarities among these two cases, in order to better understand rainfall runoff processes in tropical rainforest watersheds.
Research methods
Study site
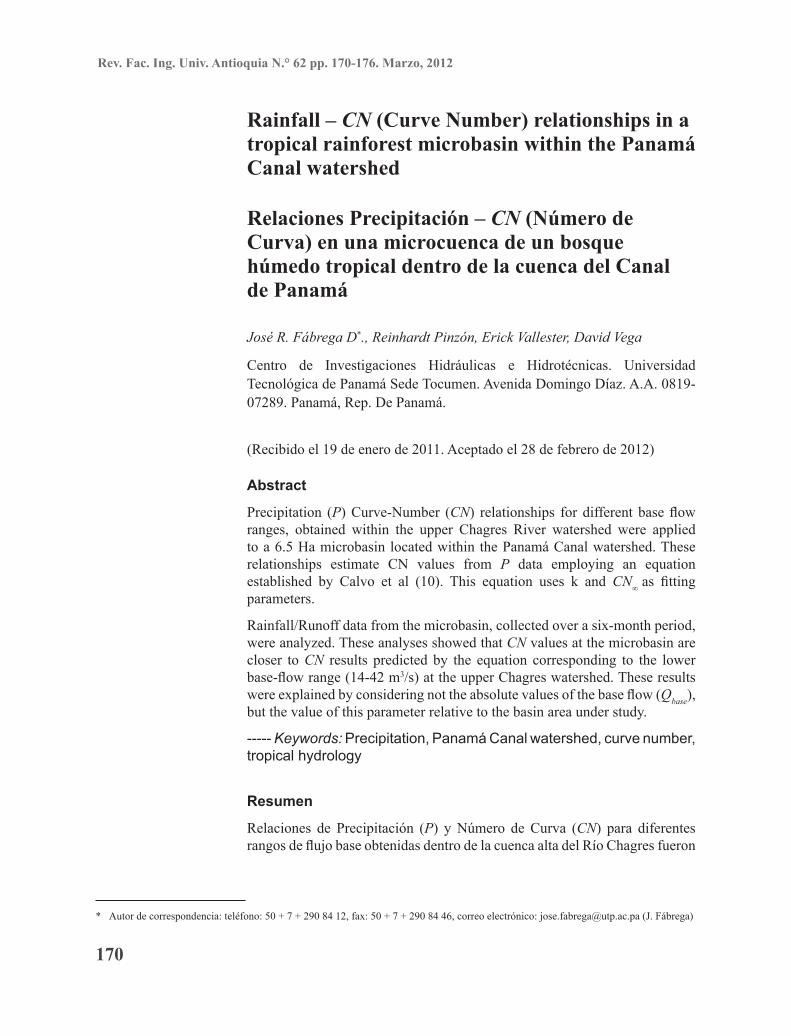
The data for this project was collected at the Tropical Hydrology Observatory at Cerro Pelado (THOCP). The THOCP is located in a microbasin covering an area of approximately 6.5 Ha within the Río Chagres basin (figure 1). The THOCP was started as a joint effort among researchers from the New Mexico Institute of Mining and Technology (NMT), the University of Wyoming (UW), and the Hydraulics and Hydrotechnical Research Center at the Universidad Tecnológica
172
Rev. Fac. Ing. Univ. Antioquia N.° 62. Marzo 2012
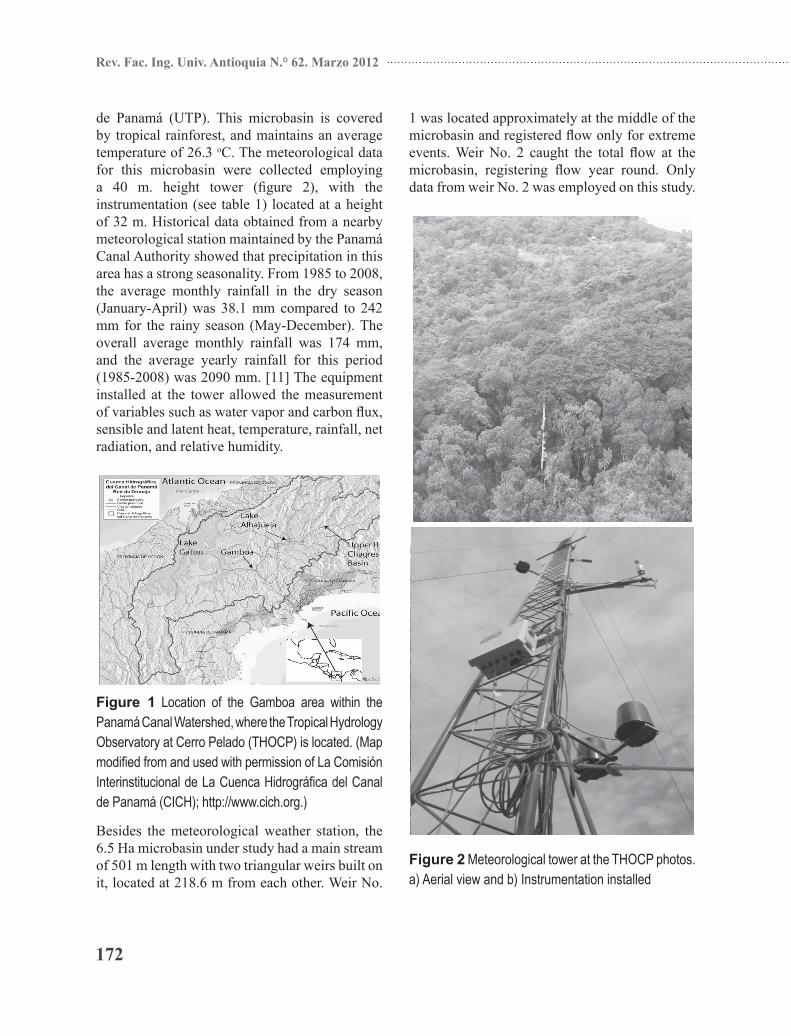
de Panamá (UTP). This microbasin is covered by tropical rainforest, and maintains an average temperature of 26.3 oC. The meteorological data for this microbasin were collected employing a 40 m. height tower (figure 2), with the instrumentation (see table 1) located at a height of 32 m. Historical data obtained from a nearby meteorological station maintained by the Panamá Canal Authority showed that precipitation in this area has a strong seasonality. From 1985 to 2008, the average monthly rainfall in the dry season (January-April) was 38.1 mm compared to 242 mm for the rainy season (May-December). The overall average monthly rainfall was 174 mm, and the average yearly rainfall for this period (1985-2008) was 2090 mm. [11] The equipment installed at the tower allowed the measurement of variables such as water vapor and carbon flux, sensible and latent heat, temperature, rainfall, net radiation, and relative humidity.
Figure 1 Location of the Gamboa area within the Panamá Canal Watershed, where the Tropical Hydrology Observatory at Cerro Pelado (THOCP) is located. (Map modified from and used with permission of La Comisión Interinstitucional de La Cuenca Hidrográfica del Canal de Panamá (CICH); http://www.cich.org.)
Besides the meteorological weather station, the 6.5 Ha microbasin under study had a main stream of 501 m length with two triangular weirs built on it, located at 218.6 m from each other. Weir No.
1 was located approximately at the middle of the microbasin and registered flow only for extreme events. Weir No. 2 caught the total flow at the microbasin, registering flow year round. Only data from weir No. 2 was employed on this study.
Figure 2 Meteorological tower at the THOCP photos. a) Aerial view and b) Instrumentation installed
173
Rainfall – CN (Curve Number) relationships in a tropical rainforest microbasin within the ...
Table 1 Equipment installed at the THOCP Meteorological Tower at 32 m height
Equipment Vendor DescriptionFW05 Type E Campbell Scientific Fine wire termocouple (diameter 0.00127 cm)
CSAT33-D Campbell Scientific Sonic anemometer (tridimensional)Li-7500 LI-COR Open gas chamber analyzer (CO2 y H2O) CNR1 Kipp & Zonen Net radiometer
CR5000 Campbell Scientific Datalogger
“Curve Number” methodologyCurve Number methodology was developed by the United States Soil Conservation Service (SCS) [12]. This methodology is widely employed to calculate rainfall runoff relationships as it allows the construction of Synthetic Unitary Hydrograms. Its employment is critical due to the lack of hydrological measurements in many sites of interest. [13] Therefore, it is important to establish the viability of applying this methodology to evaluate basic rainfall/runoff processes in small basins.
CN is the most influential factor within this method to determine excessive runoff. CN is also crucial for the synthesis of composed hydrograms [10]. This value measures the potential hydrological response of a watershed. In its original version, the National Engineering Handbook [12] suggested CN values based on the soil type and use. Sometime later, a work group within the USDA reviewed the procedure for CN computation, developing an asymptotic method for its calculation. This method incorporates the CN variability by considering CN as a random variable with values ranging as a function of the antecedent moisture content (AMC) classes I and III. [10] In general terms, this method estimates runoff based on the application of the following equation:
SP
SPQ
8.0
2)2.0(
+−= (1)
Where Q is the effective precipitation, P is the precipitation, and S is a storage index for the watershed. All these values were given in inches.
It is important to notice that the term 0.2 S represents the initial infiltration loss. This value was challenged by Hawkins and Hibbert [14], who found values lower than 0.2 for agricultural sites in the United States. CN as a function of S is given by the following equation:
(2)
Rearranging Equation 1 to define S as a function of P and Q resulted in:
(3)
Equation 3 was useful to obtain S and CN values from known values of Q and P. This equation worked better when P and Q values were ordered, allowing to estimate runoff and precipitation frequencies [10]. For these cases, the relationship between CN and P was given by:
(4)
CN∞ and k are fitting parameters. Once CN values were calculated, the Curve-Number method can be employed to estimate Q maximum (Qmax). It is important to point out that even though calculations were made using inches, the results were given in SI units.
Results and discussionRainfall and runoff data obtained at the THOCP for a six-month period starting on February 17, 2009 and ending on August 21, 2009 were employed. These dates were chosen because the
174
Rev. Fac. Ing. Univ. Antioquia N.° 62. Marzo 2012
information collected suffers no interruption. Figures 3 and 4 show daily total precipitation and average daily flow rates at the end of the microbasin for the period under study. Rainfall data was collected from the meteorological station located at the THOCP, while the flow rate was measured at weir No. 2. For the time period evaluated, 272 rainfall events were registered with durations ranging from 10 to 305 minutes.
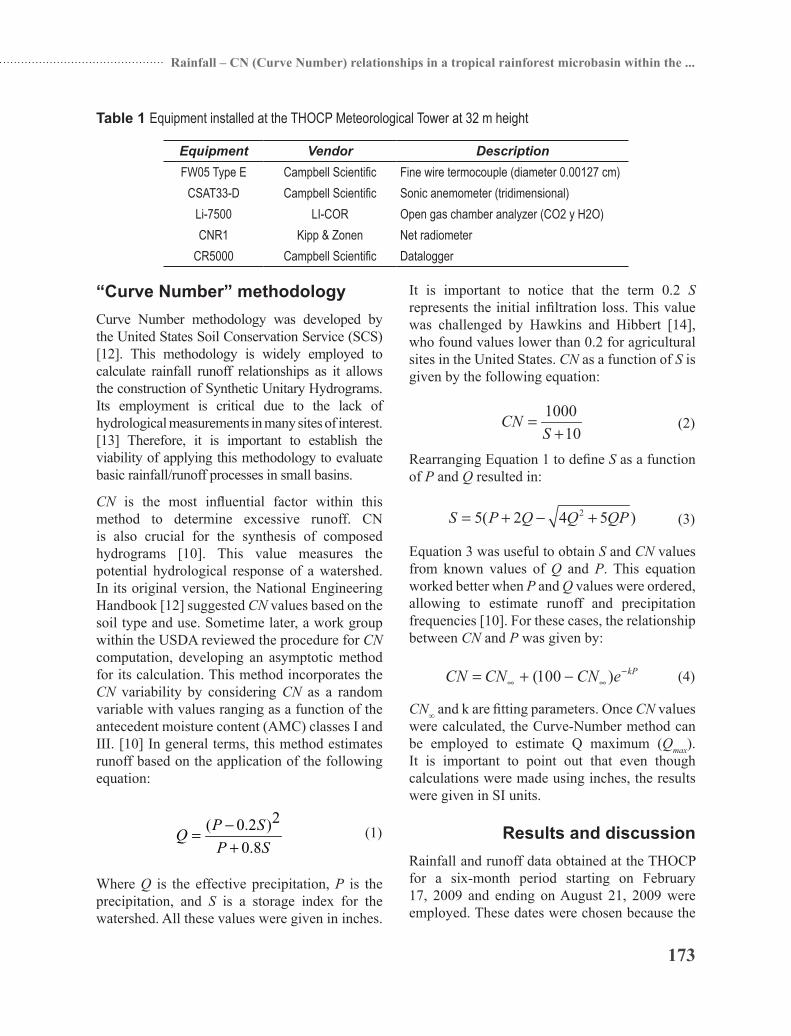
Figure 3 shows the average daily flow rates measured at the weir installed at the end of the microbasin (weir No. 2) for the period under study. Most of these flow rates had values under 7.50 l/s with an average overall flow rate of 3.09 l/s.
Figure 3 Frequency distribution of average daily discharges measured at weir No. 2 from February 17 to August 21, 2009
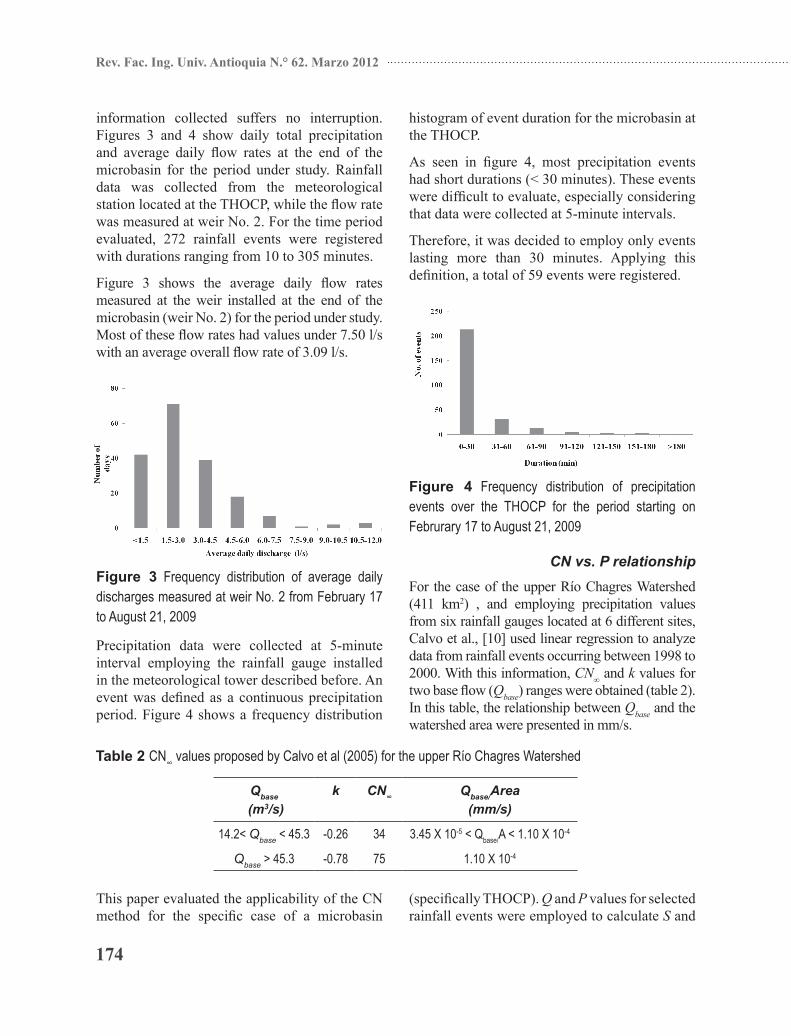
Precipitation data were collected at 5-minute interval employing the rainfall gauge installed in the meteorological tower described before. An event was defined as a continuous precipitation period. Figure 4 shows a frequency distribution
histogram of event duration for the microbasin at the THOCP.
As seen in figure 4, most precipitation events had short durations (< 30 minutes). These events were difficult to evaluate, especially considering that data were collected at 5-minute intervals.
Therefore, it was decided to employ only events lasting more than 30 minutes. Applying this definition, a total of 59 events were registered.
Figure 4 Frequency distribution of precipitation events over the THOCP for the period starting on Februrary 17 to August 21, 2009
CN vs. P relationshipFor the case of the upper Río Chagres Watershed (411 km2) , and employing precipitation values from six rainfall gauges located at 6 different sites, Calvo et al., [10] used linear regression to analyze data from rainfall events occurring between 1998 to 2000. With this information, CN∞ and k values for two base flow (Qbase) ranges were obtained (table 2). In this table, the relationship between Qbase and the watershed area were presented in mm/s.
Table 2 CN∞ values proposed by Calvo et al (2005) for the upper Río Chagres Watershed
Qbase
(m3/s)k CN∞ Qbase/Area
(mm/s)
14.2< Qbase < 45.3 -0.26 34 3.45 X 10⁻⁵ < Qbase/A < 1.10 X 10⁻⁴
Qbase > 45.3 -0.78 75 1.10 X 10⁻⁴
This paper evaluated the applicability of the CN method for the specific case of a microbasin
(specifically THOCP). Q and P values for selected rainfall events were employed to calculate S and
175
Rainfall – CN (Curve Number) relationships in a tropical rainforest microbasin within the ...
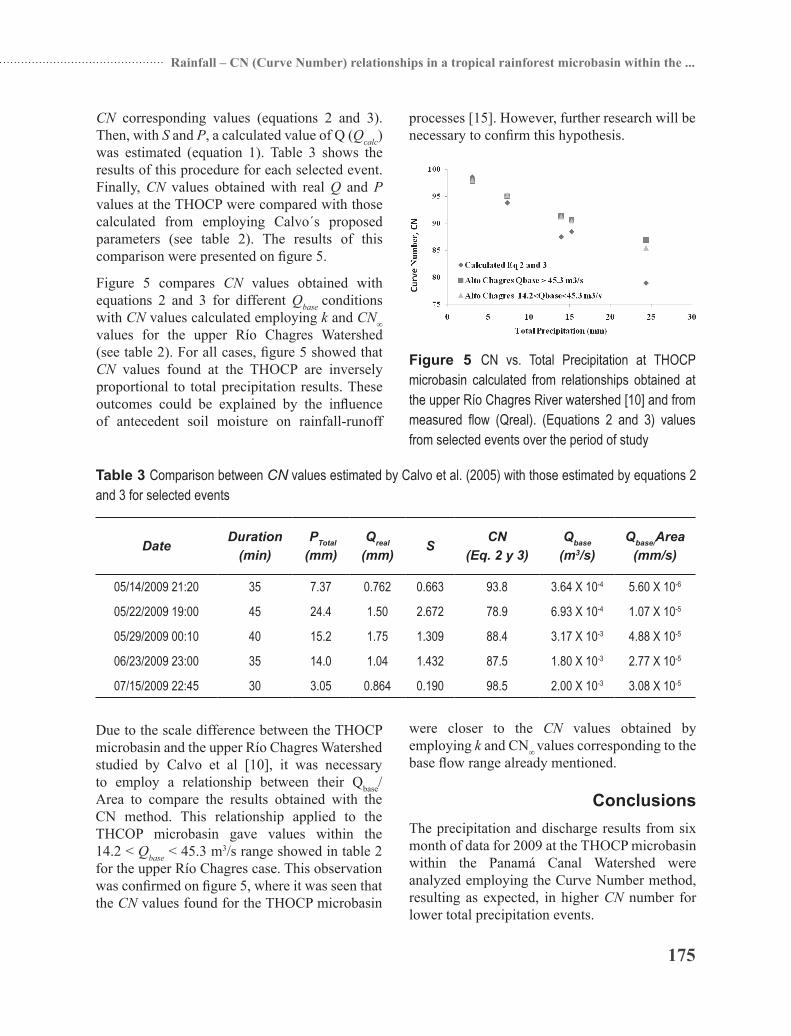
CN corresponding values (equations 2 and 3). Then, with S and P, a calculated value of Q (Qcalc) was estimated (equation 1). Table 3 shows the results of this procedure for each selected event. Finally, CN values obtained with real Q and P values at the THOCP were compared with those calculated from employing Calvo´s proposed parameters (see table 2). The results of this comparison were presented on figure 5.
Figure 5 compares CN values obtained with equations 2 and 3 for different Qbase conditions with CN values calculated employing k and CN∞ values for the upper Río Chagres Watershed (see table 2). For all cases, figure 5 showed that CN values found at the THOCP are inversely proportional to total precipitation results. These outcomes could be explained by the influence of antecedent soil moisture on rainfall-runoff
processes [15]. However, further research will be necessary to confirm this hypothesis.
Figure 5 CN vs. Total Precipitation at THOCP microbasin calculated from relationships obtained at the upper Río Chagres River watershed [10] and from measured flow (Qreal). (Equations 2 and 3) values from selected events over the period of study
Table 3 Comparison between CN values estimated by Calvo et al. (2005) with those estimated by equations 2 and 3 for selected events
DateDuration
(min) PTotal
(mm)Qreal
(mm)S
CN(Eq. 2 y 3)
Qbase
(m3/s)Qbase/Area
(mm/s)
05/14/2009 21:20 35 7.37 0.762 0.663 93.8 3.64 X 10⁻⁴ 5.60 X 10⁻⁶
05/22/2009 19:00 45 24.4 1.50 2.672 78.9 6.93 X 10⁻⁴ 1.07 X 10⁻⁵
05/29/2009 00:10 40 15.2 1.75 1.309 88.4 3.17 X 10⁻³ 4.88 X 10⁻⁵
06/23/2009 23:00 35 14.0 1.04 1.432 87.5 1.80 X 10⁻³ 2.77 X 10⁻⁵
07/15/2009 22:45 30 3.05 0.864 0.190 98.5 2.00 X 10⁻³ 3.08 X 10⁻⁵
Due to the scale difference between the THOCP microbasin and the upper Río Chagres Watershed studied by Calvo et al [10], it was necessary to employ a relationship between their Qbase/Area to compare the results obtained with the CN method. This relationship applied to the THCOP microbasin gave values within the 14.2 < Qbase < 45.3 m3/s range showed in table 2 for the upper Río Chagres case. This observation was confirmed on figure 5, where it was seen that the CN values found for the THOCP microbasin
were closer to the CN values obtained by employing k and CN∞ values corresponding to the base flow range already mentioned.
ConclusionsThe precipitation and discharge results from six month of data for 2009 at the THOCP microbasin within the Panamá Canal Watershed were analyzed employing the Curve Number method, resulting as expected, in higher CN number for lower total precipitation events.
176
Rev. Fac. Ing. Univ. Antioquia N.° 62. Marzo 2012
These results were compared with those obtained employing CN-P relationships (equation 4) using k and CN∞ as fitting parameters for different Qbase ranges at the larger upper Río Chagres Watershed, also within the Panamá Canal Watershed. This comparison showed a better correlation for the lower Qbase range. This outcome was explained by considering not Qbase absolute values, but the relative value of this parameter to the basin area under study.
Even though further studies are necessary, these results suggest the possibility of extrapolating results from large-area basins to smaller ones, within the same watershed, if the Qbase values are corrected employing the basin area as scaling factor.
Finally, it is important to emphasize the need to evaluate the applicability of these results in watersheds under different weather conditions, as well as the influence of the antecedent soil moisture on the CN-P relationship.
AcknowledgementsOur greatest thanks to the National Secretary for Science and Technology of Panamá (SENACYT), for financing this research. (Project No. COL06-013). Also thanks to professor Fred Ogden for the installation of the meteorological tower and weirs at the THOCP area. This instrumentation made possible the data collection for this paper. Finally, the authors would like to give special thanks to the Hydraulics and Hydrotechnical Research Center personnel, especially to technician José Rodríguez for his work downloading the data from the meteorological tower.
References1. M. Bonell, J, Balek. Recent Scientific Developments
and Research Needs in Hydrological Processes of the Humid Tropics: in Hydrology and Water Management in the Humid Tropics. UNESCO, Div. Water Sci. Paris (France). 1993. pp. 167-260
2. H. Wasser, J. Harger. Several Environmental Factors Affecting the Rainfall in Indonesia. ROSTSEA/UNESCO. Jakarta (Indonesia). 1992. pp. 22.
3. L. Bruijnzeel. “Hydrological functions of tropical forests: not seeing the soil for the trees?” Agriculture Ecosystems & Environment. Vol. 104. 2004. pp. 185-228.
4. H. Elsenbeer. “Hydrologic flowpaths in tropical rainforest soilscapes”. A review, Hydrological Processes. Vol. 15. 2001. pp. 1751-1759.
5. M. Bonell. “Progress in understanding of runoff generation dynamics in forests.” Jour. Hydrol. Vol. 150. 1993. pp. 217-275.
6. R. Ibáñez, R. Condit, G. Angehr, S. Aguilar, T. García, R. Martínez, A. Sanjur, R. Stallard, S. Wright, A. Rand, S. Heckadon. “An ecosystem report on the Panamá Canal: monitoring the status of the forest communities and the watershed”. Env. Monitor. Assess. Vol. 80. 2002. pp. 65-95
7. H. Russell. A Multidisciplinary Profile of a Tropical Watershed. Ed. Springer Publisher. The Río Chagres (Panamá). 2005. pp. 345
8. J. Hendrickx, D. Vega, J. Harrison, L. Calvo, P. Rojas, T. Miller. “Soil Hydrology Along Steep Hillslopes in the Río Chagres Watershed”. The Río Chagres: A Multidisciplinary Profile of a Tropical Watershed. R. Harmon (editor). Ed. Kluwer Acad. Pub. New York (USA). 2005. pp. 113-138.
9. J. Niedzialek, F. Ogden. “Runoff Production in the Upper Río Chagres Watershed, Panamá”. The Río Chagres: A Multidisciplinary Profile of a Tropical Watershed. R. Harmon (editor). Ed. Kluwer Acad. Pub. New York (USA). 2005. pp. 149-168.
10. L. Calvo, F. Ogden, J. Hendrickx. “Infiltration in the Upper Río Chagres Basin, Panamá: The Soil Conservation Service Curve Numbers”. The Río Chagres: A Multidisciplinary Profile of a Tropical Watershed. R. Harmon (editor). Ed. Kluwer Acad. Pub. New York (USA). 2005. pp. 139-147.
11. M. Cedeño, A. Fernández. Calibración del Modelo Hidrológico Hydrus 3D, aplicado a la Microcuenca Experimental de Bosque Tropical Húmedo de Cerro Pelado – Gamboa. Panamá. 2009. pp. 259.
12. Soil Conservation Service. National Engineering Handbook, Section 4, Hydrology. Thesis. U.S. Department of Agriculture. Washington, D.C. (USA). 1972. pp. 762
13. K. Brooks, P. Folliott, H. Gregersen, L. DeBano. Hydrology and the Management of Watersheds. 3rd ed. Ed. Blackwell Publishing. Ames (USA). 2003. pp. 435-469.
14. R. Hawkins, A. Hibbert. “Initial abstraction and loss in the curve number method”. Water Resour. In Arizona and the Southwest. Vol. 30. 2000. pp. 29-35.
15. Y. Zhang, H. Wei, M. Nearing. “Effects of antecedent soil moisture on runoff modeling in small semiarid watersheds of south eastern Arizona”. Hydrology and Earth System Sciences Discussions. Vol. 8. 2011. pp. 6227-6256.