Embed Size (px)
Citation preview
1
Contents
Page
INTRODUCTION …………………………………………………………… 1
REVIEW OF LITERATURE ……………………………………………… 4
MATERIALS AND METHODS …………………………………………… 26
RESULTS AND DISCUSSION …………………………………………… 31
1- Growth attributes ……………………………………………………… 31
1.1- Root fresh weight (g/plant) ………………………………………… 31
1.2- Root dry weight (g/plant) …………………………………………… 34
1.3- Foliage fresh weight (g/plant) ……………………………………… 39
1.4- Foliage dry weight (g/plant) ………………………………………… 45
1.5- Leaf area index (LAI) ……………………………………………… 46
1.6- Crop growth rate (CGR) …………………………………………… 49
1.7- Relative growth rate (RGR) ………………………………………… 53
1.8- Net assimilation rate (NAR) ………………………………………… 55
2- Yield components……………………………………………………… 58
2.1- Root fresh weight (g/plant) ………………………………………… 58
2.2- Foliage fresh weight (g/plant) ……………………………………… 61
2.3- Root/top ratio ……………………………………………………… 67
2.4- Root length (cm) …………………………………………………… 69
2.5- Root diameter (cm) ………………………………………………… 72
3- Yield quality …………………………………………………………… 74
3.1- Total soluble solids (TSS %) ………………………………………… 74
3.2- Sucrose % …………………………………………………………… 79
3.3- Apparent purity % ………………………………………………… 85
4- Yield ……………………………………………………………………… 86
4.1- Root yield (t/fad) …………………………………………………… 86
4.2- top yield (t/fad) ……………………………………………………… 91
4.3- Sugar yield (t/fad) …………………………………………………… 100
4.4- Harvest index (HI) ………………………………………………… 105
SUMMARY …………………………………………………………………… 107
REFERENCES ……………………………………………………………… 112
2
List of Tables
No. Title Page
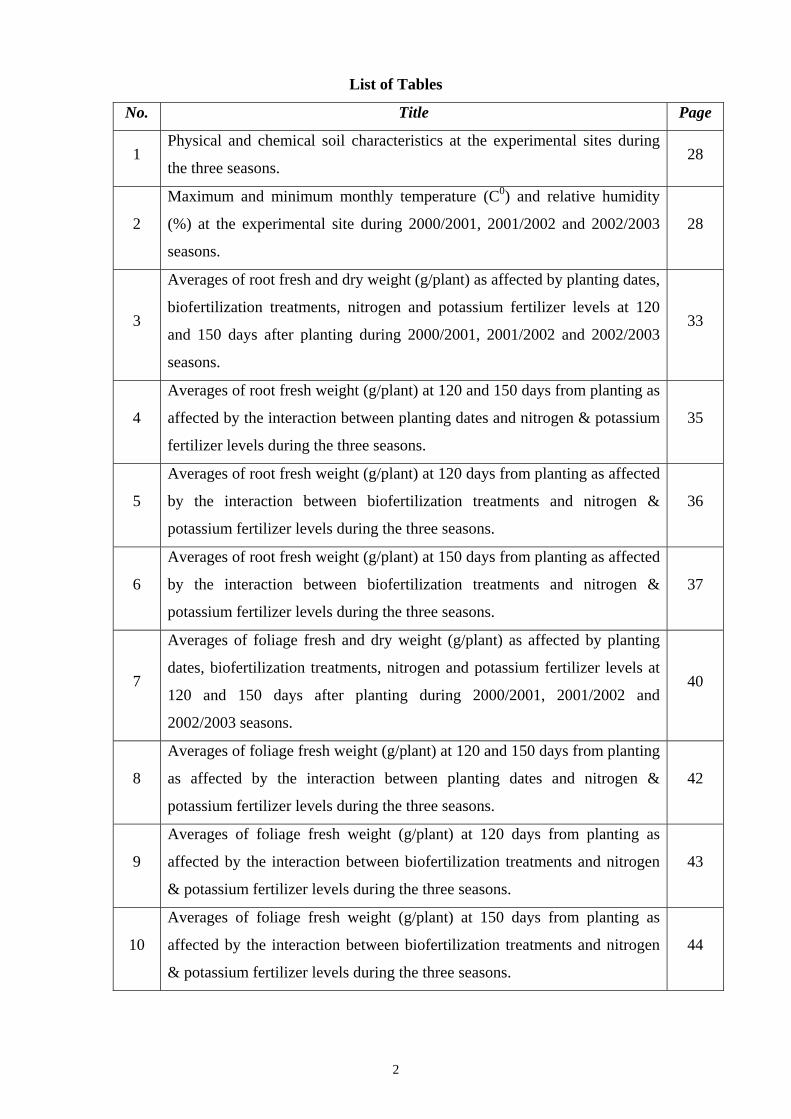
1 Physical and chemical soil characteristics at the experimental sites during
the three seasons. 28
2
Maximum and minimum monthly temperature (C0) and relative humidity
(%) at the experimental site during 2000/2001, 2001/2002 and 2002/2003
seasons.
28
3
Averages of root fresh and dry weight (g/plant) as affected by planting dates,
biofertilization treatments, nitrogen and potassium fertilizer levels at 120
and 150 days after planting during 2000/2001, 2001/2002 and 2002/2003
seasons.
33
4
Averages of root fresh weight (g/plant) at 120 and 150 days from planting as
affected by the interaction between planting dates and nitrogen & potassium
fertilizer levels during the three seasons.
35
5
Averages of root fresh weight (g/plant) at 120 days from planting as affected
by the interaction between biofertilization treatments and nitrogen &
potassium fertilizer levels during the three seasons.
36
6
Averages of root fresh weight (g/plant) at 150 days from planting as affected
by the interaction between biofertilization treatments and nitrogen &
potassium fertilizer levels during the three seasons.
37
7
Averages of foliage fresh and dry weight (g/plant) as affected by planting
dates, biofertilization treatments, nitrogen and potassium fertilizer levels at
120 and 150 days after planting during 2000/2001, 2001/2002 and
2002/2003 seasons.
40
8
Averages of foliage fresh weight (g/plant) at 120 and 150 days from planting
as affected by the interaction between planting dates and nitrogen &
potassium fertilizer levels during the three seasons.
42
9
Averages of foliage fresh weight (g/plant) at 120 days from planting as
affected by the interaction between biofertilization treatments and nitrogen
& potassium fertilizer levels during the three seasons.
43
10
Averages of foliage fresh weight (g/plant) at 150 days from planting as
affected by the interaction between biofertilization treatments and nitrogen
& potassium fertilizer levels during the three seasons.
44
3
No. Title Page
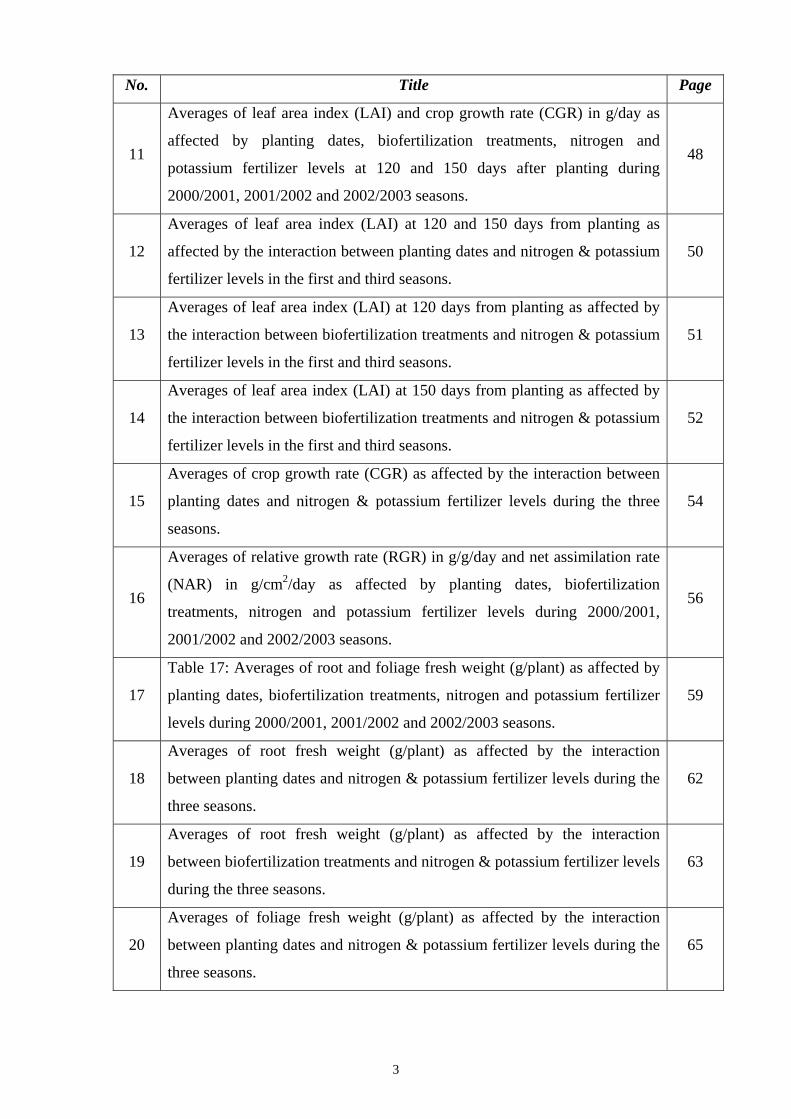
11
Averages of leaf area index (LAI) and crop growth rate (CGR) in g/day as
affected by planting dates, biofertilization treatments, nitrogen and
potassium fertilizer levels at 120 and 150 days after planting during
2000/2001, 2001/2002 and 2002/2003 seasons.
48
12
Averages of leaf area index (LAI) at 120 and 150 days from planting as
affected by the interaction between planting dates and nitrogen & potassium
fertilizer levels in the first and third seasons.
50
13
Averages of leaf area index (LAI) at 120 days from planting as affected by
the interaction between biofertilization treatments and nitrogen & potassium
fertilizer levels in the first and third seasons.
51
14
Averages of leaf area index (LAI) at 150 days from planting as affected by
the interaction between biofertilization treatments and nitrogen & potassium
fertilizer levels in the first and third seasons.
52
15
Averages of crop growth rate (CGR) as affected by the interaction between
planting dates and nitrogen & potassium fertilizer levels during the three
seasons.
54
16
Averages of relative growth rate (RGR) in g/g/day and net assimilation rate
(NAR) in g/cm2/day as affected by planting dates, biofertilization
treatments, nitrogen and potassium fertilizer levels during 2000/2001,
2001/2002 and 2002/2003 seasons.
56
17
Table 17: Averages of root and foliage fresh weight (g/plant) as affected by
planting dates, biofertilization treatments, nitrogen and potassium fertilizer
levels during 2000/2001, 2001/2002 and 2002/2003 seasons.
59
18
Averages of root fresh weight (g/plant) as affected by the interaction
between planting dates and nitrogen & potassium fertilizer levels during the
three seasons.
62
19
Averages of root fresh weight (g/plant) as affected by the interaction
between biofertilization treatments and nitrogen & potassium fertilizer levels
during the three seasons.
63
20
Averages of foliage fresh weight (g/plant) as affected by the interaction
between planting dates and nitrogen & potassium fertilizer levels during the
three seasons.
65
4
No. Title Page
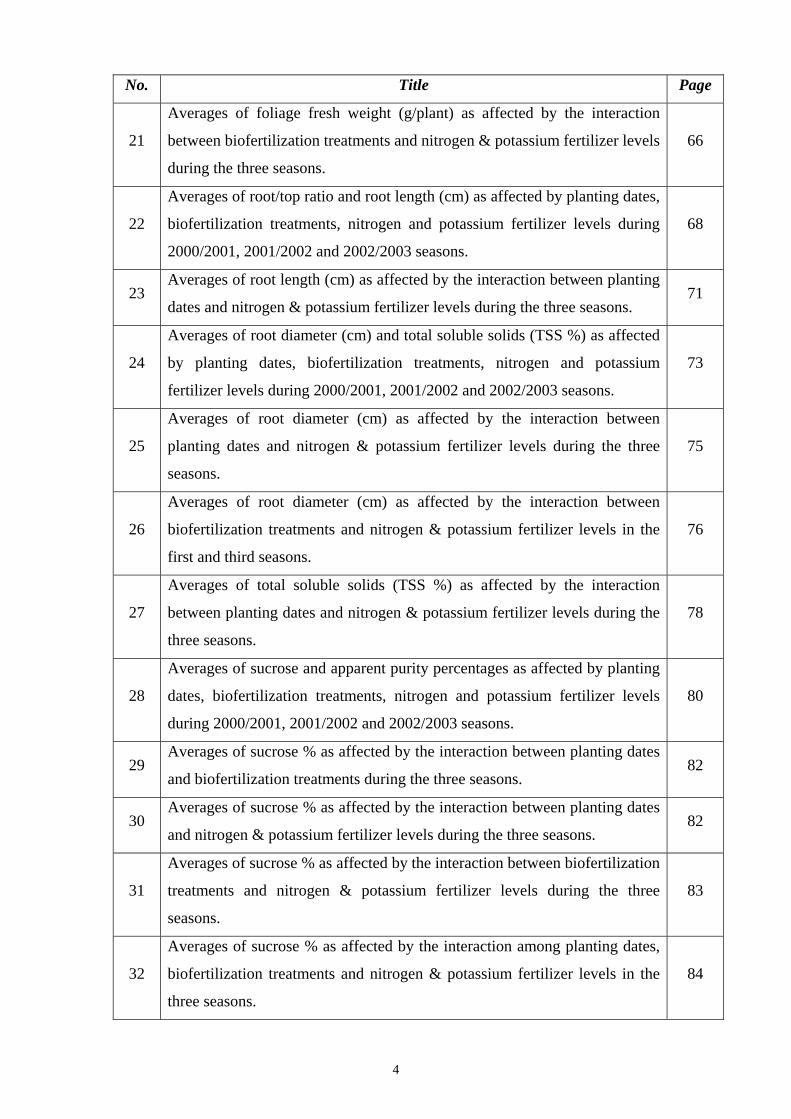
21
Averages of foliage fresh weight (g/plant) as affected by the interaction
between biofertilization treatments and nitrogen & potassium fertilizer levels
during the three seasons.
66
22
Averages of root/top ratio and root length (cm) as affected by planting dates,
biofertilization treatments, nitrogen and potassium fertilizer levels during
2000/2001, 2001/2002 and 2002/2003 seasons.
68
23 Averages of root length (cm) as affected by the interaction between planting
dates and nitrogen & potassium fertilizer levels during the three seasons. 71
24
Averages of root diameter (cm) and total soluble solids (TSS %) as affected
by planting dates, biofertilization treatments, nitrogen and potassium
fertilizer levels during 2000/2001, 2001/2002 and 2002/2003 seasons.
73
25
Averages of root diameter (cm) as affected by the interaction between
planting dates and nitrogen & potassium fertilizer levels during the three
seasons.
75
26
Averages of root diameter (cm) as affected by the interaction between
biofertilization treatments and nitrogen & potassium fertilizer levels in the
first and third seasons.
76
27
Averages of total soluble solids (TSS %) as affected by the interaction
between planting dates and nitrogen & potassium fertilizer levels during the
three seasons.
78
28
Averages of sucrose and apparent purity percentages as affected by planting
dates, biofertilization treatments, nitrogen and potassium fertilizer levels
during 2000/2001, 2001/2002 and 2002/2003 seasons.
80
29 Averages of sucrose % as affected by the interaction between planting dates
and biofertilization treatments during the three seasons. 82
30 Averages of sucrose % as affected by the interaction between planting dates
and nitrogen & potassium fertilizer levels during the three seasons. 82
31
Averages of sucrose % as affected by the interaction between biofertilization
treatments and nitrogen & potassium fertilizer levels during the three
seasons.
83
32
Averages of sucrose % as affected by the interaction among planting dates,
biofertilization treatments and nitrogen & potassium fertilizer levels in the
three seasons.
84
5
No. Title Page
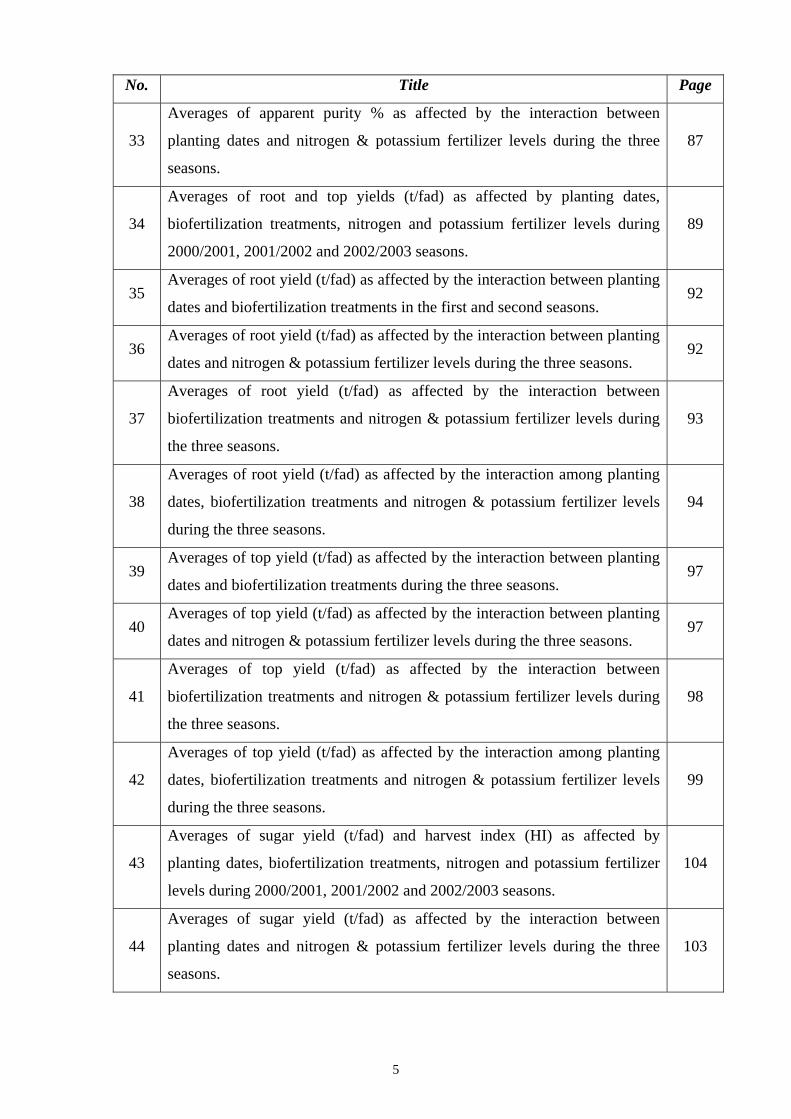
33
Averages of apparent purity % as affected by the interaction between
planting dates and nitrogen & potassium fertilizer levels during the three
seasons.
87
34
Averages of root and top yields (t/fad) as affected by planting dates,
biofertilization treatments, nitrogen and potassium fertilizer levels during
2000/2001, 2001/2002 and 2002/2003 seasons.
89
35 Averages of root yield (t/fad) as affected by the interaction between planting
dates and biofertilization treatments in the first and second seasons. 92
36 Averages of root yield (t/fad) as affected by the interaction between planting
dates and nitrogen & potassium fertilizer levels during the three seasons. 92
37
Averages of root yield (t/fad) as affected by the interaction between
biofertilization treatments and nitrogen & potassium fertilizer levels during
the three seasons.
93
38
Averages of root yield (t/fad) as affected by the interaction among planting
dates, biofertilization treatments and nitrogen & potassium fertilizer levels
during the three seasons.
94
39 Averages of top yield (t/fad) as affected by the interaction between planting
dates and biofertilization treatments during the three seasons. 97
40 Averages of top yield (t/fad) as affected by the interaction between planting
dates and nitrogen & potassium fertilizer levels during the three seasons. 97
41
Averages of top yield (t/fad) as affected by the interaction between
biofertilization treatments and nitrogen & potassium fertilizer levels during
the three seasons.
98
42
Averages of top yield (t/fad) as affected by the interaction among planting
dates, biofertilization treatments and nitrogen & potassium fertilizer levels
during the three seasons.
99
43
Averages of sugar yield (t/fad) and harvest index (HI) as affected by
planting dates, biofertilization treatments, nitrogen and potassium fertilizer
levels during 2000/2001, 2001/2002 and 2002/2003 seasons.
104
44
Averages of sugar yield (t/fad) as affected by the interaction between
planting dates and nitrogen & potassium fertilizer levels during the three
seasons.
103

6
No. Title Page
45
Averages of sugar yield (t/fad) as affected by the interaction between
biofertilization treatments and nitrogen & potassium fertilizer levels during
the three seasons.
104

7
ACKNOWLEDGMENT
Firstly, I direct my deepest thanks to my God, who does my life in a perfect way.
I would like to express my grandiose thanks and sincere gratitude to Prof. Dr. Ahmed A.
Kandil, Professor of Agronomy, Faculty of Agriculture, Mansoura University, chairman of my
advisory committee, for his valuable guidance, continuous advice and all assistance throughout the
progress of his investigation and all states.
I would to exert my greatest thanks to Prof. Dr. Mahmoud S. Sultan, Professor of
Agronomy and vice Dean of High Graduate, Faculty of Agriculture, Mansoura University, for his
supervision, his inspiring help and continuos counseling.
I also extend my greatest thanks to Prof. Dr. Ahmed N. Attia, Professor and Head of
Agronomy department, Faculty of Agriculture, Mansoura University, for his fruitful supervision,
available suggestions and help me to right direction.
I wish to convey my grateful to Prof. Dr. Mohsen A. Badawi, Professor of Agronomy,
Faculty of Agriculture, Mansoura University, for his supervision, suggestion research plain,
continuous encouragement and facilities through the preparation of this manuscript.
I shall remain very grateful to my colleges and all staff members of Agronomy Department,
who provided me more assistance during this work.
Lastly, I would like to express my deep appreciation to my wife, my dear boys Ahmed,
Mohamed, Mahmoud and Jasmine as well as my brothers for their continuous encouragement and
giving me sufficient time to execute this work.
Dr. Saleh E. Seadh
8
INTRODUCTION
Sugar beet is a specially type of Beta vulgaris, L. grown for sugar production and is
considered the second important sugar crop in Egypt and in many countries all over the world after
sugar cane (Sacchurum officinarum, L.). Nowadays, the present world production of sugar beet
roots is about 238.28 * million tons, which comes from planting about 5.83 million ha with an
average of 40.84 t/ha.
In Egypt, sugar beet has becomes an important crop for sugar production, hence the total
cultivated area reached about 131200 ** fad and the total production exceeded 2.43 million ton roots
with and average of 19.32 t/fad. Egyptian Government imports large amount of sugar every year to
face the rapid increase of population and sugar consumption. By referring the total annual
consumption of sugar amount, it raised to about 2.18** million ton in 2002 year. Approximately, 66
% of this amount are produced locally from sugar beet (346913 ton sugar), sugar cane (938381 ton
sugar) and natural sweets (158405 ton sugar), and the rest 33 % (0.73 million ton sugar) is imported
from foreign countries. So that, increasing sugar production from unit area is considered one of the
important national targets to minimize gab between sugar consumption and production.
Recently, sugar beet crop has an important position in Egyptian crop rotation as winter crop
not only in the fertile soils, but also in poor, saline alkaline and calcareous soils. Whereas, it could
be economically grown in the newly reclaimed soils such as at the Northern parts of Egypt as one of
the most tolerant crops to salinity and wide range of climates. Sugar beet being, often, the most
important cash crop in the rotation, it leaves the soil in good conditions for the benefit of the
following cereal crops. By-products of sugar production, such as pulp, molasses and lime, flow bath
into agriculture to increase livestock production and improve soil fertility as well as provide various
middle products as alcohol, forage and other many products.
The great importance of sugar beet crop is not only from its ability to grow in the newly
reclaimed areas as economic crop, but also for producing higher yield of sugar under these
conditions as compared with sugar cane. Moreover, sugar beet is specialized as a short duration
crop, where its growth period is about half that of sugar cane. Furthermore, sugar beet requires less
water, which a kilogram of sugar requires about 1.4 m3 and 4.0 m3 water to be produced by sugar
beet and sugar cane, respectively (Sohier, Ouda, 2001).
It is well know that high productivity of any crop is the final goal of many factors and
operations. In addition, the pronounced role of the agronomical processes such as planting dates,
biofertilization treatments, nitrogen and potassium fertilizer levels play very important effect on
sugar beet growth, yield and quality.
* FAO.org, Statistical database, Faostat agriculture, Primary crops, supplied at 3 Feb. 2004.
** Egyptian society of sugar technology.
9
Planting dates of sugar beet is considered among most important factors that influenced its
growth and productivity. Also, planting date is the great important factor in organizing and securing
work schedule of beet factories. Thus, planting sugar beet on suitable date according to
environmental conditions of region is best method to maximize sugar beet yield and quality.
Biofertilizers technologies are based on enhancing and improving the naturally existing
nutrient transformation activities in the soil profiles, when the inoculant should be able to be
adapted to the environmental conditions prevailing in the site of application. Whereas, inoculation
seeds of various C3 and C4 plants with associative nitrogen-fixing bacteria led to improve plant
growth and yield (Eid, 1982). So, biological nitrogen fixation of sugar beet with non-symbiotic
nitrogen fixers play an important role in increasing growth and yield as well as decreasing chemical
nitrogen fertilizer requirements and consequently minimizing environmental pollution by mineral
fertilizers and to save its costs.
Nitrogen is the most important element of those supplied to sugar beet in fertilization.
Nitrogen fertilizer has a pronounced effect on the growth and physiological and chemical
characteristics of the crop. So that, nitrogen caused desirable effect on sugar beet growth and yield
characters.
Decidedly, potassium is major plant nutrient needed for sugar beet, which plays an
important role in plant nutrition association with the quality of the production.
Therefore, this investigation was established to determine the effect of planting dates,
biofertilization treatments, nitrogen and potassium fertilizer levels as well as their interactions on
growth, yield and yield components as well as quality of sugar beet under the environmental
conditions of Mansoura district.

10
REVIEW OF LITERATURE
The compatible literature dealing with concern of the effect of planting dates,
biofertilization treatments, nitrogen and potassium fertilization levels as well as their interactions on
growth, yield and its components and quality will be reviewed herein for each factor under study as
follows:
I: Effect of planting dates.
II: Effect of biofertilization treatments.
III: Effect of the interaction between planting dates and biofertilization treatments.
IV: Effect of nitrogen fertilizer levels.
V: Effect of potassium fertilizer levels.
VI: Effect of nitrogen and potassium fertilizer levels.
VII: Effect of the interaction between planting dates and nitrogen & potassium fertilizer
levels.
VIII: Effect of the interaction between biofertilization treatments and nitrogen & potassium
fertilizer levels.
IX: Effect of the interaction among planting dates, biofertilization treatments and nitrogen &
potassium fertilizer levels.
I: Effect of planting dates:
Planting dates means the effect of edaphic factors and all environmental conditions
in large scale on growth and yield of all field crops, which differ widely from region to another.
Moreover, planting dates is considered the most important affecting factor for all field crops
generally and sugar beet specially. It has a vital role for germination, growth, yield and root quality
of sugar beet plants. Since the edaphic factors varied under Egyptian conditions and also from
country to another, the literature on this work dealing with planting dates will depended mainly
under Egyptian conditions:
Badawi (1985) recorded that planting sugar beet on 10th Oct. produced maximum total dry
weight of plant, root/top ratio, root and foliage fresh weights, root length and diameter, TSS %,
sucrose % and root, top as well as sugar yields/fad. Whilst, planting on 10th Nov. produced lower
values of the above mentioned traits.
Hanna et al. (1988) concluded that planting sugar beet plants on 10th Oct. was suitable
planting date for raising its productivity under environmental condition of EL-Mansoura district.
Badawi (1989) found that early planting i.e. 1st Sept. was associated with higher root fresh
weight, foliage fresh weight, root length and diameter, leaf area index (LAI), TSS %, sucrose %,
purity % and root, top as well as sugar yields/fad. He also recorded that planting on 1st Sept. or 1st
Oct. has not significant differences in all studied characteristics under this investigation.
11
EL-Kassaby and Leilah (1992 b) detected that sowing dates (15th Sept., 1st Oct., 15th Oct.,
1st Nov. and 15th Nov.) had significant effects on root diameter, root weight, and root as well as
sugar yields/fad. Sowing sugar beet during Oct. recorded the highest yield components and root, top
as well as sugar yields/fad than sowing during Nov.
Leilah and Nasr (1992) stated that sowing dates markedly affected sucrose and juice purity
percentages as well as root and sugar yields/fad. They also confirmed that early sowing on 15th
Sept. recorded the highest root yield/fad. On the other hand, the highest mean of sugar yield was
obtained from sowing sugar beet on 15th Oct.
Badawi et al. (1995) observed that planting dates markedly affected leaf area index (LAI),
total weight of root + foliage, root length and diameter as well as root, top and sugar yields/fad.
Generally, they recommended that early planting, 1st Oct., tended to increase root, top and sugar
yields/fad under the environmental conditions of Dakhlia Governorate.
Azzazy (1998) showed that non of the studied characters (root length and diameter, TSS %,
sucrose %, purity % and root as well as sugar yields/fad) was significantly affected by sowing dates
on 1st or 15th Nov., except top yield/fad only.
Ghonema (1998) reported that planting dates had obvious effect on all studied traits (leaf
area index (LAI), root length and diameter, root fresh weight, sucrose and purity percentages as
well as root and sugar yields/fad) with exception foliage fresh weight and root/top ratio in the
second season only. He concluded that planting sugar beet during Oct. produced the maximum leaf
area index (LAI), root length and diameter, root and foliage fresh weights, sucrose and purity
percentages as well as root and sugar yields/fad as compared with planting during Sept. or Nov.
Ramadan and Hassanin (1999) revealed that sown sugar beet on 10th Sept. produced
greater root length and diameter and root as well as recoverable sugar yields/fad. They also
recorded that delaying sowing date to 10th Nov. intensified reducing in sucrose, purity and
recoverable sugar percentages.
Abd EL-Gawad et al. (2000) studied the effect of some planting dates of sugar beet at 1st
Oct. to 1st Dec. in the first season and 1st Sept. to 1st Dec. in the second season on yield and yield
components. They found that early planting dates produced thicker, heaviest sugar beet root/plant
and top yield per plant and faddan as well as sugar yield/fad. However, planting sugar beet at 1st
Nov. was more favorable for emergence %, plant stand at harvest and root length.
Abdou (2000) found that planting sugar beet on 1st Oct. gave obvious increment in root and
foliage fresh weights/plant, root/top ratio, root length and diameter, harvest index and root, top as
well as sugar yields/fad. On the other hand, the greatest values of TSS, sucrose and purity
percentages were resulted from planting sugar beet on 1st Sept.
12
Abo-Salama and EL-Sayiad (2000) investigated the effect of planting dates at 1st and 15th
Oct. and 1st Nov. on sugar beet yield components, yield and quality. They indicated that early
planting increased, in a highly significant manner, most of yield components and good quality
parameters. The highest root yield, quality index and sugar yield (31.61 t/fad, 77.81 and 4.13 t/fad,
respectively) were produced from early planting (1st Oct.).
Kandil, et al. (2002 b) found that root fresh and dry weights, foliage fresh and dry weights,
LAI (at 120 and 150 days from planting), CGR, RGR and NAR had significant effect due to
planting dates. The best planting dates, which produced the greatest values of all growth characters
was on 15th of October.
Kandil, et al. (2002 c) reported that planting dates showed favorite effect on root and
foliage fresh weights, root length and diameter, root/top ratio (in the second season), quality
parameters (TSS, sucrose and juice purity percentages in the first season) and root, top as well as
sugar yields/fad of sugar beet. Finally, planting date on 15th Oct. gave the highest means of the most
yield components and yield as well as quality characters.
II: Effect of biofertilization:
In recent years, the trend is to explore the possibility of supplementing chemical fertilizers
with more particularly biofertilizers of microbial origin. This method aims to minimize the
environmental pollution which resulted from mineral fertilizers and also to reduce its coasts
(Cakmakci et al., 1999 and Abu EL-Fotoh et al., 2000), in the same time maintenance of high
yielding. Biofertilizers can be generally defined as preparations containing live or latent cells of
efficient strains of nitrogen fixation, phosphate solubility and silicate decomposers used for
application to soil with the objective of acceleration certain microbial processes to augment the
extent of the availability of nutrients in a form which can be easily assimilated by plants.
Biofertilizers may affect plant growth by one or more mechanisms such as nitrogen fixation,
enhancing nutrient uptake, production of organic acids, protection against plant pathogens and
excretion growth regulators like IAA and GA3, which stimulated growth and resulted in high yield.
Many researches with this respect were done in foreign countries are arranged together with those
done under Egyptian conditions as follows:
Suslow et al. (1979) in USA, tested biochemical and physiological responses of sugar beet
to Plant Growth Promoting Rhizobacteria (PGPR), Pseudomonas putida and Pseudomonas
fluorescens. They showed that seedlings vigor, root and foliage growth were increased by
inoculation with PGPR.
Sprenat (1990) in UK, recorded that inoculation soil by Azotobacter spp caused
solubilization of mineral nutrients and synthesis of vitamins, amino acids, auxins as well as
gibberellins, which stimulate plant growth and induce high yields.
13
Babu et al. (1991) in India, observed that the application of biofertilizers is suggested as a
sustainable way for increasing crop yields, which would reduce the use of chemical fertilizers and
improve soil fertility.
Prasad and Rokima (1991) in India, showed that an integrated effect of organic, inorganic
and biofertilizers on the available N, P and K contents of the soil and increased the N and K
contents, but not its K content.
EL-Badry and EL-Bassel (1993) in Egypt, found that inoculation sugar beet with
Azospirillum caused a significant saving in nitrogen fertilizer (about 25-40 %). They also reported
that a significant increase in root yield (from 2.8 to 6.0 t/fad) and sugar yield as a result of
inoculation by Azospirillum.
Favilli et al. (1993) in India, observed that inoculation seeds of sugar beet with Azospirillum
lipoferum significantly enhanced root weight per plant and per hectare.
Butorac (1995) in Germany, studied the effect of fertilization treatments i.e. ; (a) no
fertilizer ; (b) agrarvital containing limestone, micronutrients and nitrogen fixing bacteria ; (c) NPK
fertilizers ; (d) waste containing N, P, K, Ca, Na, micronutrients and organic matter ; (e) NPK +
waste water ; (f) NPK + agrarvital + waste water and (g) agrarvital + waste water on sugar beet
yield and quality. He found that root yield, sugar content and sugar yield were lowest with NPK +
agrarvital + waste water treatment, while root and sugar yields were highest with waste containing
N, P, K, Ca, Na, micronutrients and organic matter treatment. Finally, he reported that sugar content
was highest with no fertilizer treatment.
Milic et al. (1995) in Yugoslavia, showed that increasing number of free aerobic
nitrofixators as a result of increasing nitrogen soil content led to improve seed emergence and
growth.
Singh and Bisoyi (1995) in India, concluded that biofertilizers such as Azolla, Azotobacter,
Azospirillum, Rhizobium and phospho microorganisms were important for plantation crops. They
also concluded that nitrogen fixation and biomes accumulation by biofertilizers were reviewed and
their role in mineralization and reclamation of soil problems and balancing of soil nitrogen.
Ali (1996) in Egypt, found that inoculation sugar beet with free-living bacteria, which could
be able to fixing nitrogen (Azospirillum spp) significantly improved seed germination, reducing
sugars and non-reducing sugars under all recommended nitrogen levels. On the other hand,
inoculation sugar beet with Azospirillum and addition of nitrogen fertilizer resulted in low
significant effect on nitrogen uptake by sugar beet in leaves and roots.
Shabaev et al. (1996) in Russia, comes to conclusion that inoculation sugar beet seeds with
nitrogen fixation bacteria (Pseudomonas putida 23) increasing nitrogen available in the rhizosphere,
which led to increments in root length, shoot length, nitrogen uptake and positive nitrogen balance.
14
Nitrogen fixation and inoculation of bacterially fixed atmospheric nitrogen in the plants took place
in the second half of the vegetative period and accelerated plant development.
Mrkovack et al. (1997) in Hungry, stated that inoculation sugar beet seeds with certain
strains of Azotobacter caused favorable effect in dry weight of plant and nitrogen content, which
proportionally to the nitrogen content in the medium.
Stajner et al. (1997) in Yugoslavia, studied the effect of inoculation with Azotobacter
chroococcum strains and treatments, which increased supply of nitrogen in solution culture on sugar
beet cv. kwmaja where grown in sand culture in the greenhouse. They found that the activating of
the antioxidant enzymes superoxide dismutase, peroxidase and cutalase, the content of chlorophyll
and carotenoids, soluble proteins and dry matter in leaves were increased by previously mentioned
treatment.
Mezei et al. (1998) in Hungry, found that inoculation sugar beet seeds with Azotobacter
chroococcum strains resulted in the highest callus mass and dry matter of plant, whereas improved
growth of roots and leaves.
Cakmakci et al. (1999) in Turkey, studied seed inoculation of sugar beet (cv. sonja) with
nitrogen fixing (Bacillus polymyxa) and phosphate dissolving (Bacillus megaterium var.
phosphaticum) bacteria in comparison to control and mineral fertilizer application. They reported
that sugar beet root yield was increased by 12.0 %, 7.5 % and 16.5 % due to seed inoculation
treatments (B. polymyxa, B. megaterium var. phosphaticum and dual applications over control
treatment), respectively. Other yield and yield components were also enhanced especially by dual
application. While, increases in yield and yield components were lower than or comparable to
mineral fertilizer application. Finally, they concluded that microbial inoculation of seeds with
Bacillus polymyxa and Bacillus megaterium var. phosphaticum, alone or in dual combinations, may
substitute costly NP fertilizers in sugar beet production.
Sultan et al. (1999) in Egypt, studied the response of sugar beet yield and its attributes to
biological (inoculated and non-inoculated seeds with Azotobacterin) and mineral fertilization under
weed control. They recorded that inoculation of sugar beet seeds with Azotobacterin significantly
increased leaf area index (LAI), root length and diameter, TSS %, sucrose %, purity % and root as
well as sugar yields/fad.
Abo EL-Goud (2000) in Egypt, stated that biofertilization treatments of fodder beet showed
marked increases in root fresh and dry weights, foliage fresh and dry weights, leaf area index (LAI),
root and top yields/fad.
Abu EL-Fotoh et al. (2000) in Egypt, studied the effect of NPK fertilization as
recommended doses and 50 % from its and some biofertilizers (microbin and phosphorin separately
or together) on yield and quality of sugar beet. They showed that the addition of biofertilizers
15
combined with NPK chemical fertilizers at the rate of 50 % of recommended dose produced higher
root yield and quality characters compared with the other treatments. However, this investigation
illustrated that biofertilizers alone can not be met the NPK requirements for sugar beet crop.
Bassal et al. (2001) in Egypt, found that bio-mineral nitrogen fertilization (inoculation with
Syrialin at the rate of 400 g/fad) treatment had significant effects on root and foliage fresh weights,
root length and diameter, root/top ratio, TSS %, sucrose %, purity % and root, top as well as sugar
yields/fad.
Cakmakci et al. (2001) in Turkey, studied the effectiveness of seven N2-fixing bacterial,
(five strains of Bacillus; BA-140, BA-142, M-3, M-13 and M-58, a strain of Burkholderia {BA-7}
and Pseudomonas {BA-8}) isolated from various sources, on sugar beet production. They showed
that seed inoculation with bacteria strains significantly affected yield, yield components and quality
parameters of sugar beet. In conclusion, bacterial seed inoculations especially with BA-140 and
BA-142 may satisfy nitrogen requirements of sugar beet under field conditions in upland areas.
Maareg and Sohir, Badr (2001) in Egypt, investigated the effect of some biofertilizers
(Rhizobacterin, Syrialin and Phosphorine) on sugar beet growth and yield. They reported that
Syrialin caused an increase in length, diameter and weight of roots, fresh weight of foliage, TSS %,
sucrose %, purity % and sugar yield/fad.
Kandil et al. (2002 b) in Egypt, stated that root fresh and dry weights, foliage fresh and dry
weights, LAI, CGR, RGR and NAR in both samples (after 120and 150 days from planting) had a
significant response due to biofertilization treatments. They also showed that the highest
measurements were achieved from treating seeds with Rhizobacterin.
Kandil et al. (2002 c) in Egypt, confirmed that biofertilization treatments brought out
significant effects on root and foliage fresh weights, root length and diameter, root/top ratio, root,
top and sugar yields/fad. The highest means of previously mentioned characteristics were resulted
from inoculation seeds of sugar beet with Rhizobacterin, except root/top ratio were obtained from
uninoculated treatment.
Ramadan et al. (2003) in Egypt, studied the effect of mixture of nitrogen fixers namely,
Azospirillum sp., Azotobacter sp. and phosphate dissolving bacteria (Bacillus sp.) on root quality,
yield and its components. They showed that biofertilization treatments had significant effect on root
length and diameter, root, top and sugar yields/fad. On the other hand, biofertilization treatments
exhibited insignificant effect in sucrose and purity percentages.
III: Effect of interaction between planting dates and biofertilization treatments.
Kandil et al. (2002 b) showed that the interaction between planting dates and
biofertilization treatments caused a significant effect on fresh and dry weights of root and foliage as
well as LAI after 120 and 150 days from planting in both seasons of this dissertation.
16
Kandil et al. (2002 c) confirmed that the interaction between planting dates and
biofertilization treatments exhibited significant increase of root diameter and purity % (in the first
season), foliage fresh weight (in the second season), root, top and sugar yields/fad in both seasons.
IV: Effect of nitrogen fertilizer levels:
Sugar beet require a well-balanced supply of minerals throughout their life cycle for
maximum growth, available minerals especially nitrogen affected plant growth and sugar beet
productivity. This effect resulted in improving the color and vigor of the leaf canopy, net
assimilation rate and dry matter accumulation. The Egyptian soils in general suffered from low
content of nitrogen, therefore yields were drastically reduced, and may even be halved on most its.
Thereby, it must be determining optimum nitrogen dose, which produce maximum root yield and
best root quality parameters, at the same time reduce environmental pollution. Recently, there are
many investigations concerned with optimizing application of nitrogen in order to maximizing
yields and quality parameters as well as reducing environmental pollution under varying conditions
of soil and climate (Draycott, 1993 and Badawi, 1996). In this concern, Abdel- Aal and Ibrahim
(1990) in Egypt, observed that application of nitrogen fertilizer to sugar beet plants significantly
increased root length and diameter, leaf area/plant, root, top and total weights/plant and root and
sugar yields as well as juice purity % compared to untreated plants (without nitrogen fertilizer).
Generally, the highest values for most traits were obtained by nitrogen fertilization at the rate of 75
kg N/fad. In contrast, TSS % and Sugar % gradually decreased with increasing nitrogen fertilization
up to 75 kg N/fad.
Emara (1990) in Egypt, stated that increasing nitrogen fertilizer levels from 40 to 60 kg
N/fad gave the highest means of root and foliage fresh weights, root and foliage dry weights, root
length and diameter, LAI, NAR, CGR as well as root, top and sugar yields/fad. On the other side,
increasing nitrogen fertilizer from 40 to 60 kg N/fad resulted in great reduce of sucrose and purity
percentages, as well as root/top ratio.
Khan et al. (1990) in India, pointed out that each increase in nitrogen fertilizer levels
associated with significant increase in root and sugar yields, but it decreased root sucrose content.
They also concluded that application of 120 kg N/ha was produced highest yields and good quality
of sugar beet in saline-sodic soils.
Mahmoud et al. (1990 a) in Egypt, recorded that increasing nitrogen fertilizer level up to 80
kg N/fad enhanced dry matter accumulation and leaf area index (LAI). On the other wise, relative
growth rate (RGR), net assimilation rate (NAR) and root/top ratio were significantly reduced due to
increasing nitrogen fertilizer levels.
17
Mahmoud et al. (1990 b) in Egypt, decided that the highest means of sucrose %, purity %,
root, top and sugar yields were resulted from increasing nitrogen fertilization rate up to 80 kg N/fad,
while sugar content was decreased with increasing nitrogen rate.
Marlander (1990) in Germany, found that root, total sugars and white sugar yields/ha
reached maximum values at 159, 136 and 129 kg applied N/ha, respectively. He also recorded that
sugars concentration, especially white sugar decreased with increasing nitrogen rate and were
highest at 82 kg N/ha.
Singhania and Sharma (1990) in India, reported that fertilizing sugar beet plants with 0,
60, 120 and 180 kg N/ha produced 9.18, 15.53, 24.15 and 27.9 t/ha of root yield. Root sugar
contents and purity percentage increased with increasing nitrogen rate up to 120 kg Nha.
Meirvenne et al. (1991) in Belgium, pointed out that sugar beet plants receiving no nitrogen
fertilizer yielded 56.71 t root/ha and 9.12 t sugar/ha. At the optimum nitrogen application rate (160
kg N/ha), yields were 64.31 t roots and 10.18 t sugar/ha.
Vlassak et al. (1991) in Belgium, found that root yields resulting from nitrogen fertilizer
were 88.06, 84.24, 87.43 and 91.22 t/ha at the rates of 65, 110, 160 and 210 kg N/ha, respectively.
Root sugar concentrations ranged from 16.4 % (210 kg N/ha) to 17.5 % (untreated plants).
Assey et al. (1992 a) in Egypt, illustrated that the response to nitrogen fertilization was up to
80 kg N/fad for foliage dry weight/plant and plant dry weight (at 100 days from planting), and up to
120 kg N/fad for both leaf area/plant and LAI (at 115 days from planting). However, root diameter,
root dry weight and crop growth rate (CGR) at different stages of growth insignificantly affected
due to nitrogen fertilizer levels.
Assey et al. (1992 b) in Egypt, pointed out that increasing nitrogen fertilizer level than 40 kg
N/fad resulted in a remarkable increase in all yield components of sugar beet, with exception
root/top ratio. They also showed that maximum root and sugar yields/fad were produced from
adding 80 kg N/fad. On the other side, applying 30 kg N/fad resulted in higher sucrose %.
Bell et al. (1992) in UK, suggested that the highest nitrogen fertilizer rate (180 kg N/ha)
decreased the final sugar concentration in storage roots. The alpha-amino nitrogen concentration in
the roots was positively related to nitrate supply throughout growth.
EL-Kassaby and Leilah (1992 a) in Egypt, stated that increasing nitrogen rate up to 60 kg
N/fad caused obvious effect on root fresh weight, root diameter and root as well as sugar yields/fad.
Ali (1993) in Egypt, found that supplying sugar beet plants with nitrogen fertilizer at the rate
of 80 kg N/fad increased root and foliage fresh weights, leaf area/plant, root and sugar yields/fad.
While, sucrose concentration in roots was reduced as nitrogen fertilization incremented.
EL-Kased et al. (1993) in Egypt, reported that root yield and impurity parameters of sugar
juice were increased as a result of increasing nitrogen fertilization, vice versa with respect of
18
sucrose percentage. Total sugar production and the extractable sugar were significantly increased
due to use the higher level of nitrogen fertilizer (100 kg N/fad).
Strnad and Javurek (1993) in Belgium, illustrated that addition of nitrogen not allows
necessary for higher contents of sugar, where there was a negative correlation between sugar
content and nitrogen fertilization.
Wojcik (1993) in Poland, reported that weight of leaves increased with increasing nitrogen
rates from 0 to 260 kg N/ha. While, root length decreased and root weight was greatest at 80 kg
N/ha. Root yield was increased from 53.0 t/ha without nitrogen fertilizer to 63.1 t/ha with 140 kg
N/ha as urea. Finally, sugar contents were decreased and alpha-amino nitrogen contents were
increased with increasing nitrogen rates to 140 kg N/ha.
Barbanti et al. (1994) in Italy, studied the effect of nitrogen fertilizer at the rates of 0, 60,
120 or 180 kg N/ha on sugar beet yields and quality. They suggested that intermediate applications
of 60 or 120 kg N/ha proved to be the most effective nitrogen fertilizer application rates in terms of
yield. Beet quality parameters were adversely affected by increasing nitrogen rate to 120 kg N/ha.
Kemp et al. (1994) in New Zealand, fertilized sugar beet with various rates of nitrogen (0 to
360 kg N/ha), which illustrated the effect of it on yield and quality of sugar beet. They found that
highest root fresh weight was obtained when fertilized plants with 360 kg N/ha, while highest sugar
yield was resulted by adding 180 kg N/ha. Juice purity ranged from 91 % (without nitrogen
fertilizer) to 80 % (adding 360 kg N/ha), as well as maximum extractable sucrose yield was
obtained with 180 kg N/ha.
Lopez et al. (1994) in Spain, fertilized sugar beet plants with 0, 120, 160, 200 or 260 kg
N/ha as urea. They determined that response of sugar yield to nitrogen fertilizer rates, depended on
the nitrogen available in the soil. They also found that optimum yield was obtained with fertilizing
with 160 kg N/ha.
Sharief and Eghbal (1994) in Egypt, cleared that increasing nitrogen rate up to 150 kg/ha
increased root length and diameter, leaf area index and root, top as well as sugar yields/ha, but TSS,
sucrose and purity percentages were decreased.
Abdrabou (1995) in Egypt, showed that when applying higher nitrogen fertilizer rate (120
kg N/fad), dry weights/fad for root, top and whole plant as well as root/top ratio were significantly
increased in the two studied seasons, except root dry weight in the second season only.
Badawi et al. (1995) under Egyptian conditions, concluded that applying nitrogen fertilizer
at the rate of 75 kg N/fad showed noticeable increase in root length and diameter, root and top as
well as sugar yields/fad, whilst, sucrose percentage was decreased.
19
Besheit et al. (1995) in Egypt, demonstrated that increasing nitrogen fertilization rate up to
69 kg N/fad significantly raised fresh and dry weights of root, top and sugar per faddan, but its
reduced sucrose and purity percentages.
EL-Attar et al. (1995) in Egypt, showed that increasing nitrogen application to 80 kg N/fad
recorded obvious increase in root weight/plant, root, top and gross sugar yields/fad.
Smit et al. (1995) in New Zealand, indicated that root and sugar yields were optimal when
applied 240 and 200 kg N/ha, respectively. They also concluded that top fresh weight increased
with increasing nitrogen availability, while sugar content was reduced.
Abou-Amou et al. (1996) in Egypt, reported that root, top and gross sugar yields/fad and
quality parameters i.e. TSS, sucrose and purity percentages were significantly differed due to
nitrogen fertilizer levels (0, 40 and 80 kg N/fad). The highest values of yield characters were
obtained from applied 80 kg N/fad. On contrary, the highest means of quality parameters were
recorded as a result of control treatment (without nitrogen fertilization).
Allison et al. (1996) in UK, investigated the effects of different rates of nitrogen fertilizer (0
to 180 kg N/ha) on the growth, yield and processing quality of sugar beet. They showed that
increasing nitrogen fertilizer rate up to 180 kg N/ha had a little effect on yield.
Badawi (1996) in Egypt, reported that increasing nitrogen fertilizer rates from 0 to 60 kg
N/fad gave the favorable effect on sugar beet yields and their attributes. While, raising nitrogen
rates from 60 to 80 kg N/fad did not show marked effects for most studied characters. On the other
hand, raising nitrogen rates up to 80 kg N/fad caused a decrease in TSS, sucrose and juice purity
percentages. Finally, he recommended that, the rate of 60 kg N/fad was optimal for increasing root
and sugar yields/fad in same manner decreasing fertilization coasts.
Salama and Badawi (1996) in Egypt, found that increasing nitrogen levels from 50 to 70
kg N/fad exhibited significant increase in root diameter and sugar yield/fad. However, raising
nitrogen levels from 70 to 90 kg N/fad did not induce obvious effects for most studied traits and
markedly reduced TSS and sucrose percentages.
Neamet Alla (1997) in Egypt, reported that increasing nitrogen fertilization rates from 60 to
105 kg N/fad significantly increased most studied characters. He also recorded that no significant
difference was found between applied 90 and 105 kg N/fad in most characters under study. Root
diameter, crop growth rate (CGR), net assimilation rate (NAR) and top yield were significantly
increased by increasing nitrogen rate up to 105 kg N/fad. Meanwhile, root/top ratio, relative growth
rate (RGR), total soluble solids (TSS) and Juice purity percentages were significantly decreased by
incrementing nitrogen rate up to 75 kg N/fad.
Ramadan (1997) in Egypt, stated that increasing nitrogen rate up to 90 kg N/fad markedly
increased root weight, root, top and sugar yields/fad, whereas further increase in nitrogen rate
20
decreased sugar yields. Number of harvested roots and root/top ratio were not show any significant
response to nitrogen rates (30, 60 90 and 120 kg N/fad). Sucrose, juice purity and recoverable sugar
percentages were decreased with all increase in nitrogen rate to 90 kg N/fad.
Sharief et al. (1997) in Egypt, reported that increasing nitrogen fertilizer rate up to 80 kg
N/fad significantly increased root length and diameter, LAI, fresh and dry weights of root and
foliage/plant, root and sugar yields/fad by 25.4 %, 37.1 %, 89.3 %, 117.7 %, 90.4 %, 105.9 %, 62.3
%, 81.1 % and 60.3 %, respectively, compared with applying 40 kg N/fad. However, percentages of
TSS, sucrose and juice purity were decreased by 9.0 %, 12.3 % and 3.1 %, respectively due to
increasing nitrogen dose up to 80 kg N/fad.
AL-Labbody (1998) in Egypt, cleared that increasing nitrogen fertilizer levels from 0 to 45
and 90 kg N/fad gradually increased root and foliage fresh weights per plant, root length and
diameter, purity %, root and sugar yields/fad. With respect of quality parameters, increasing
nitrogen fertilizer level up to 45 kg N/fad negatively affected TSS % and sucrose %.
Azzazy (1998) in Egypt, illustrated the effect of three nitrogen fertilizer levels (40, 60 and
80 kg N/fad) on yield and quality of sugar beet. He showed that root length and diameter and top
yield/fad significantly influenced by increasing nitrogen fertilizer levels. On the other side, sugar
yield/fad, sucrose and purity percentages were reduced.
EL-Hennawy et al. (1998) in Egypt, studied the response of sugar beet yield to different
nitrogen rates viz., 60, 90 and 120 kg N/fad. They indicated that increasing nitrogen rate up to 120
kg N/fad resulted in highest values of root and top yields/fad, while root/top ratio tended to decrease
as nitrogen rate increased. They also reported that excessive nitrogen application lowered beet
quality in terms of root sucrose content and juice purity %.
EL-Moursy et al. (1998) in Egypt, found that increasing nitrogen fertilizer level up to 100
kg N/fad significantly increased root length and diameter, root fresh weight, root, top and sugar
yields/fad as well as TSS %. Whilst, increasing nitrogen fertilizer levels from 40 through 100 kg
N/fad caused great decrease in sucrose and purity percentages.
Geypens et al. (1998) concluded that root yields/ha increased, but sugar content decreased
with increasing nitrogen rate above the recommended dose (80 kg N/ha).
Ibrahim (1998) in Egypt, investigated the effect of nitrogen fertilizer rates viz., 0, 25, 50,
75 and 100 kg N/fad on sugar beet yield components, yield and quality. He recorded that increasing
nitrogen fertilizer rate up to 100 kg N/fad caused a remarkable increase in root and foliage fresh
weights per plant, root length and diameter, root and sugar yields/fad, vice versa with respect of
quality parameters in terms of TSS, sucrose and purity percentages.
Kucke and Kleeberg (1998) in Germany, investigated the effect of reduced nitrogen
fertilization on yield, nitrogen balances and nitrogen leaching of sugar beet. They showed that

21
reducing the usual mineral nitrogen fertilization by 45-55 kg N/ha had a negligible effect on the
yields (2-4 % reduction).
Attia et al. (1999) in Egypt, reviewed that fertilizing beet plants with 60 kg N/fad gave the
desirable findings and the highest values of root and foliage fresh weights, root length and diameter,
root/top ratio, root, top and sugar yields/fad, HI, TSS, sucrose and purity percentages. Hence the
highest it values were resulted from adding 40 kg N/fad. Moreover, the highest values of sucrose
and purity percentages were obtained from control treatment (without N).
Basha (1999) in Egypt, found that addition of 90 kg N/fad significantly raised root diameter
and root/top ratio, but any further increase in nitrogen not exerted significant effect. Root and
foliage weights/plant, root, top and sugar yields/fad were significantly improved by increasing
nitrogen level up to 120 kg N/fad. Relation to quality parameters, the highest values of TSS, sucrose
and apparent purity percentages were obtained from fertilizing with 60 kg N/fad.
EL-Hawary (1999) in Egypt, cleared that root fresh weight/plant, root length, root, top and
sugar yields/fad were significantly increased with increasing nitrogen rates from 0 to 60 and 90 kg
N/fad, while its gave opposite effect on sucrose %. Application nitrogen at the rate of 90 kg N/fad
produced the highest means of root and sugar yields/fad, whilst the lowest ones resulted from
control treatment (without nitrogen fertilization).
EL-Kassaby et al. (1999) in Egypt, pointed out that root fresh and dry weights, foliage fresh
and dry weights, LAI, CGR, and NAR were proved to be significant increase as a result of nitrogen
fertilizer levels (at 120 and 140 days from sowing). Increasing nitrogen fertilizer level up to 60 kg
N/fad produced the highest values of these measurements.
Mahasen, Fahmi (1999) in Egypt, stated that nitrogen fertilizer levels exhibited significant
effect on all growth traits (root fresh and dry weights, foliage fresh and dry weights and LAI), yield
components (root and foliage fresh weights and root length and diameter) and yield characters (root,
top and sugar yields/fad as well as HI). Increasing nitrogen levels from 50 to 70 and 90 kg N/fad
enhanced all above-mentioned characters, while it resulted in great reduction on yield quality (TSS,
sucrose and purity percentages).
Mahmoud et al. (1999) in Egypt, reported that increasing nitrogen level up to 100 kg N/fad
substantially improved length, diameter and weights of roots, depressed sucrose content in the roots,
decreased purity percentage and increased impurities in terms of alpha amino-nitrogen content in
sugar beet juice. Application of 80 kg N/fad significantly increased root and gross sugar yields/fad,
thereafter excess application of nitrogen had no marked effect on gross sugar yield. Nitrogen
increment over 60 kg N/fad was accompanied by a marked increase in top yield.
Soheir, Ouda et al. (1999) in Egypt, studied the effect of nitrogen fertilizer levels i.e. 60,
80, 100 and 120 kg N/fad on sugar beet productivity. They found that root length and diameter, root
22
and sugar yields/fad significantly responded to nitrogen fertilizer levels. The highest values of root,
top and sugar yields/fad were obtained from applying 120 kg N/fad.
Abd EL-Moneim (2000) in Egypt, indicated that nitrogen fertilizer levels significantly
increased root length and diameter, root and top fresh weights, root, top and sugar yields/fad, but it
decreased TSS, sucrose and purity percentages.
Abdou (2000) found that fertilizing sugar beet plants with 100 kg N/fad produced highest
values of root and foliage fresh weights, root length and diameter, root, top and sugar yields/fad.
Meanwhile, the highest means of TSS, sucrose and purity percentages as well as harvest index were
obtained from addition of the lowest nitrogen fertilizer level (60 kg N/fad).
Azab et al. (2000) in Egypt, detected that values of root length, root fresh weight, root and
top yields/fad were significantly raised with incrementing nitrogen fertilizer rate. Applying nitrogen
fertilizer at the rate of 90 kg N/fad gave the highest values of previously mentioned traits. In
contrast, sucrose and purity percentages significantly decreased with increasing nitrogen fertilizer
up to 90 kg N/fad.
EL-Shafai (2000) in Egypt, showed that increasing nitrogen fertilizer level up to 92 kg
N/fad exhibited obvious effect on root fresh weight/plant, root and sugar yields/fad, while sucrose
percentage was decreased as nitrogen levels increased.
EL-Zayat (2000) in Egypt, found that increasing nitrogen from 70 to 90 kg N/fad
substantially improved root length, dry matter accumulation, LAI, CGR, root, top and sugar
yields/fad. There was no evidence for significant differences in root diameter, root/top ratio, RGR,
NAR and quality parameters of sugar beet due to nitrogen rates (70 and 90 kg N/fad).
Hassanin and Sohair, Elayan (2000) in Egypt, reported that increasing nitrogen rate up to
90 kg N/fad improved size and weight of the individual root and increased root yield by 3.4 t/fad,
sugar yield by 0.46 t/fad and top yield by 1.41 t/fad as compared with fertilizing with 60 kg N/fad.
On the other hand, higher nitrogen rate depressed sugar beet quality.
Laila, Saif (2000) in Egypt, cleared that the quantitative criteria in terms of top and root
yields significantly and positively responded to nitrogen fertilizer application up to 120 kg N/fad
under conditions of Kafr EL-Sheikh Governorate.
Zeinab, Moustafa et al. (2000) in Egypt, studied the effect of various nitrogen rates i.e. 60,
80, 100, 120, 140 and 160 % of the recommended dose (75 kg N/fad) on root quality and yield.
They stated that increasing nitrogen dressing up to 90 kg N/fad (20 % over recommended dose)
exhibited the highest root quality, root and sugar yields t/fad. On the other side, further nitrogen
dressing markedly decreased the most studies traits.
EL-Geddawy et al. (2001) in Egypt, found that levels of nitrogen (60, 80 and 100 kg N/fad)
had no statistical differences with relation to TSS %, sucrose %, root and sugar yields/fad.
23
EL-Harriri and Mirvat, Gobarh (2001) in Egypt, noticed that adding 110 kg N/fad
resulted in greatest values of root weight/plant, root length and diameter, TSS %, root and top
yields/fad. On contrary, increasing nitrogen level up to 110 kg N/fad depressed significantly sucrose
and purity percentages as compared with lower level (70 kg N/fad).
EL-Shahawy, et al. (2001) in Egypt, pointed out that the desirable effect of nitrogen
fertilizer was recorded when applied 60 kg N/fad, which gave the highest values of root, top and
sugar yields/fad. While, the highest means of sucrose % and purity % were obtained under control
treatment (without nitrogen).
Nemeat Alla (2001) in Egypt, found that nitrogen fertilizer levels (90, 115 and 140 kg
N/fad) significantly increased root and top yields/fad, but significantly decreased sucrose, purity
percentages and sugar yield/fad. Also, no significant effect on root length and diameter and TSS %
due to nitrogen fertilizer rates was detected.
Nemeat Alla and EL-Geddawy (2001) in Egypt, studied the effect of different levels of
nitrogen fertilizer (80, 100, 120 and 140 kg N/fad) on yield and quality of sugar beet. They deduced
that increasing nitrogen level up to 100 kg N/fad incremented root length and diameter, root and
sugar yields/fad, while decreased TSS and sucrose percentages.
Ostrowska et al. (2001) in Poland, concluded that application nitrogen at the rate of 90 kg
N/ha produced the highest root and gross sugar yields/ha.
Shafika, Mostafa and Darwish (2001) in Egypt, recommended that for increasing root and
gross sugar yields/fad, it must be increasing nitrogen fertilizer level upon 105 kg N/fad.
Sohier, Ouda (2001) in Egypt, confirmed that root length, foliage fresh weight/plant and
root sucrose content were responded to nitrogen fertilizer level up to 75 kg N/fad. While root
diameter, root fresh weight/plant, TSS %, root, top and sugar yields/fad were responded up to 90 kg
N/fad. On the other side, purity % did not clear any significant effect due to nitrogen fertilizer
levels.
Abo EL-Wafa (2002) in Egypt, concluded that fertilizing sugar beet plants with 80 kg
N/fad was responsible for producing economical yields. While, the highest values of sucrose
percentage were recorded when adding 60 kg N/fad.
EL-Shahawy et al. (2002) in Egypt, recorded significant increase in root and sugar
yields/fad with increasing applied nitrogen up to 80 kg N/fad.
Kandil et al. (2002 b) in Egypt, found that raising nitrogen fertilizer levels from 0 to 20, 40,
60 and 80 kg N/fad significantly improved root fresh and dry weights, foliage fresh and dry
weights, LAI, CGR, RGR and NAR. The highest means of these characters were attained to
increase nitrogen fertilizer level up to 80 kg N/fad.
24
Kandil et al. (2002 c) in Egypt, noticed that there was a significant increase in root and
foliage weights, root length and diameter, root/top ratio, root, top and sugar yields/fad due to raising
nitrogen fertilizer levels from 0 to 20, 40, 60 and 80 kg N/fad. They also recorded that the greatest
values of TSS, sucrose and purity percentages were achieved from control treatment (without
nitrogen).
Nemeat Alla et al. (2002) in Egypt, reported that increasing nitrogen fertilizer as soil
application up to 90 kg N/fad significantly increased root length and diameter, root, top and sugar
yields/fad. The reverse was true with respect to TSS %, sucrose % and purity %.
Sohier, Ouda (2002) in Egypt, indicated that root length and diameter and purity % were
improved by incrementing nitrogen fertilizer levels from 70 to 100 kg N/fad. While, increasing
nitrogen fertilizer level up to 130 kg N/fad increased root, top and sugar yields/fad. But nitrogen
fertilizer did not significantly affected sucrose and TSS percentages.
Ramadan et al. (2003) in Egypt, reported that application of mineral fertilizers at the
recommended rates significantly decreased TSS % (in the second season, sucrose % (in the first
season) and purity % (in both seasons). Fertilizing beet plants with the highest level of 100 %
mineral fertilizers (75 kg N + 15 kg P2O5/fad) gave the highest significant increase in root length
and diameter, root, top and sugar yields/fad.
Shalaby et al. (2003) in Egypt, reported that applying nitrogen fertilizer at the rate of 80 and
100 kg N/fad produced the highest values of the chemical constituents of fresh sugar beet roots.
They also showed that increasing nitrogen up to 120 kg N/fad could be significantly increased root,
top and sugar yields/fad. On the other hand, sucrose %, juice purity % and TSS % decreased with
increasing nitrogen fertilizer rate up to 120 kg N/fad.
V: Effect of potassium fertilizer levels:
Potassium is very mobile in plant tissues and moves readily from older tissues to the
growing points of the root and foliage. Moreover, potassium is a major plant nutrient needed in
sugar beet for best plant growth and production. It is important to photosynthesis, activating starch
synthetase enzymes and the sugar yield, which is produced, relies on potassium for movement to
the storage root (Nitoses and Evans, 1969). Potassium also improves performance by increasing leaf
area, this allows the crop to intercept more radiation giving proportional increases in sugar yield.
Potassium has important financial implications because, for a given weight of sugar produced,
growers are often paid commensurately more for high sugar percentage roots. In addition, costs are
decreased because, for a given weight of sugar, less weight of roots has to be harvested and
transported (Draycott, 1993). Generally, potassium is usually taken up earlier than nitrogen and
phosphorus and uptake increases faster than dry matter production. This means that potassium
accumulates early in the growing period and then is translocated to other plant parts. There are
25
many investigations with respect to the effect of potassium fertilization on sugar beet productivity.
In this connections,
Ahmed (1988) in Egypt, recorded a slight response for potassium at rate of 10 kg K2O/fad
with respect to root and sugar yields/fad.
Beringer et al. (1988) in Germany, found that increasing potassium supply led to higher
root weights/plant. They also recorded that there was a negative correlation between potassium
fertilization and sugar concentration in the root.
Genaidy (1988) in Egypt, showed that application of 86 kg K/fad increased root and top
yields/fad, sugar content, purity and gross sugar yield by 17, 12, 10, 17 and 27 %, respectively over
the control treatment (without potassium fertilization).
Abdel-Aal (1990) in Egypt, decided that increasing K2O up to 72 kg/fad improved root
length and diameter, foliage and root fresh weights/plant and root yield/fad.
Kandil (1993) in Egypt, showed that potassium fertilization exerted significant increase in
all studied characteristics (root weight, length and width, number of leaves/plant, weight of
leaves/plant and blade leaf area) compared to the control treatment (without potassium fertilizer).
With exception for purity percentage, which cleared opposite trend.
Basha (1994) in Egypt, cleared that applying potassium fertilizer at the rate of 72 kg
K2O/fad significantly enhanced root length and diameter, root and foliage fresh weights/plant, root,
top and gross sugar yields/fad. In addition root quality parameters in terms of TSS, sucrose and
purity percentages were taken similar trend with respect of potassium fertilization.
Kasap and Killi (1994) in Turkey, stated that average of root weight/plant and root yield/ha
were increased by potassium fertilizer treatments. The highest root fresh weight/plant, root and
sugar yields/ha were associated with applying potassium fertilizer at the rate of 60 kg K2O/ha.
Nigrila et al. (1994) in Romania, decided that application potassium fertilizer at the rate of
70 kg K2O/ha increased root yield from 80 to 83 t/ha and sugar yield from 9.2 to 10.0 t/ha.
Badawi et al. (1995) in Egypt, comes to conclusion that potassium fertilizer at the rate of 48
kg K2O/fad without nitrogen or phosphorus fertilization gave the highest sucrose percentage.
Denesova and Andres (1995) in Romania, reported that there were good effects on yields
of root, sugar and the economic returns due to utilization potassium fertilizer at the rate of 200
kg/ha.
Hegazy and Genaidy (1995) in Egypt, found that applying potassium fertilizer at the
economic optimum rate (48 kg K2O/fad) improved growth and yield of sugar beet when sowing it
alone or intercropped with faba bean.
Khalifa et al. (1995) in Egypt, showed that root and sugar yields/fad were positively
affected by potassium fertilizer rate up to 48 kg K2O/fad. Root quality i.e. sucrose %, white possible
26
extractable sugar % and sugar purity % were decreased by increasing potassium rates from 0 to 48
and 72 kg K2O/fad.
Abd EL-Wahab et al. (1996) in Egypt, studied the effect of different rates of potassium
fertilizer viz., 0, 12, 24, 36 and 48 kg K2O/fad on yield and quality of sugar beet. They
demonstrated that root length and diameter, root and sugar yields were significantly affected by
potassium rates. In contrast, sucrose and juice purity percentages did not clear any significant
differences between potassium fertilizer rates.
Abou-Amou et al. (1996) in Egypt, showed that potassium fertilizer levels (0, 24 and 48 kg
K2O/fad) caused significant differences with respect to root and top yields/fad. While, root quality
parameters in terms of TSS, sucrose and purity percentages were not responded due to potassium
fertilization.
EL-Kammah and Ali (1996) in Egypt, pointed out that all agronomic characters of sugar
beet i.e. root/top ratio, leaf area, root, top and sugar yields/fad were affected by increasing
potassium rates from 0 to 12, 21 and 42 kg K2O/fad. Generally, the highest means of most studied
traits were obtained from potassium application at the rate of 42 kg K2O/fad. All the quality
parameters were insignificantly affected by increasing potassium rates from 0 to 42 kg K2O/fad.
Morrsi (1997) in Egypt, found that application of 48 kg K2O/fad significantly affected root
length and diameter, sucrose and juice purity percentages.
Ramadan (1997) in Egypt, showed that increasing potassium rate up to 72 kg K2O/fad
developed beet growth in terms of root weight, improved quality in terms of sucrose and purity
percentages and increased yields of root, top and sugar per faddan.
Sharief et al. (1997) in Egypt, observed that root length and diameter, LAI, root fresh and
dry weights, foliage fresh and dry weights, root and sugar yields/fad were tended to increase due to
potassium fertilizer at the rate of 36 kg K2O/fad as compared with control (without potassium
fertilization). On the other hand, TSS, sucrose and purity percentages had inverse effect.
Basha (1998) in Egypt, noticed that applying of 48 kg K2O/fad to fodder beet significantly
increased root weight/plant, total weight of plants, root length and diameter, root and top yields/fad,
whilst root/top ratio was reduced.
EL-Moursy et al. (1998) in Egypt, indicated that applying potassium fertilizer level up to
48 kg K2O/fad markedly enhanced root fresh weight/plant, root diameter, root, top and sugar
yields/fad, vice versa with respect of juice purity percentage.
Sayed et al. (1998) in Egypt, confirmed that increasing potassium fertilizer rates from 0 to
48 kg K2O/fad significantly increased root diameter, root fresh weight/plant, root and sugar
yields/fad.
27
EL-Hawary (1999) in Egypt, indicated that all studied traits significantly increased as
potassium rates increased from 0 to 24 and 48 kg K2O/fad. The highest potassium fertilizer rate (48
kg K2O/fad) caused 24.27, 28.57 %, 12.97 and 15.08 % increase in root and sugar yields/fad in the
first and second seasons, respectively.
EL-Yamani (1999) in Egypt, noticed that the highest values of root yield were obtained
from fertilizing sugar beet plants with 24 kg K2O/fad. In addition, the highest values of sucrose %
and gross sugar yield were recorded by application of 72 kg K2O/fad.
Selim and EL-Ghinbihi (1999) in Egypt, observed that increasing potassium fertilizer rate
up to 48 kg K2O/fad improved root, top and sugar yields/fad. Moreover, sucrose content had a
positive effect, but juice purity percentage was decreased as potassium fertilizer rates increased.
EL-Shafai (2000) in Egypt, pointed out that increasing potassium fertilizer levels from 0 to
48 kg K2O/fad positively increased root fresh weight/plant, sugar yield/fad and sucrose %. Whilst,
root yield insignificantly increased as potassium level increased up to 48 kg K2O/fad.
EL-Zayat (2000) in Egypt, stated that increasing potassium fertilizer rates from 0 to 24 kg
K2O/fad brought out significant increases in root length and diameter, dry matter accumulation,
LAI, CGR, root, top and sugar yields/fad. On the other side, potassium fertilization failed to exhibit
significant differences in RGR, NAR and quality parameters.
EL-Harriri and Mirvat, Gobarh (2001) in Egypt, indicated that high level of potassium
fertilizer (48 kg K2O/fad) exhibited a significant increase on LAI, root/top ratio, root length and
diameter, root and top yields/fad, TSS, sucrose and purity percentages as compared with control
treatment.
Hannan, Yossef (2001) in Egypt, concluded that increasing potassium levels from 24 to 48
kg K2O/fad significantly increased root yield by 6.4 % as compared with control treatment.
Sohier, Ouda (2001) in Egypt, revealed that increasing potassium fertilizer levels from 0 to
24 and 48 kg K2O/fad caused a significant increase in root length and diameter, root and foliage
weights/plant, root, top and sugar yields/fad, TSS and sucrose percentages. In contrast, purity %
was not influenced by the application of potassium fertilizer.
Kandil et al. (2002 a) in Egypt, reported that potassium fertilizer significantly affected root
and foliage fresh weights/plant, LAI and CGR. Vice versa with connection RGR and NAR. The
highest values of root, top and sugar yields/fad were obtained from application of 36 kg K2O/fad.
Whereas, increasing K2O level up to 48 kg K2O/fad did not exhibit any significant increase. With
respect to quality parameters (TSS %, sucrose % and purity %), it is worthy to note that potassium
fertilizer levels did not significantly affect these traits.
28
VI: Effect of nitrogen and potassium fertilizer levels.
EL-Kassaby et al. (1991) in Egypt, concluded that fertilizing sugar beet with 70 kg N + 24
kg K2O/fad raise the root yield/fad.
EL-Shafei (1991) in Egypt, recommended that adding nitrogen and potassium fertilizers at
the rate of 75 kg N + 96 kg K2O/fad produced highest root and top of sugar beet yields/fad.
Sobh et al. (1992) in Egypt, cleared that application of 60 kg N + 24 kg K2O/fad produced
highest root and top yields/fad as well as sugar constituents, while the highest values of sugar yield
resulted from application of 60 kg N + 48 kg K2O/fad.
Sorour et al. (1992) in Egypt, showed that root and top yields/fad were highest with
applying 75 kg N + 96 kg K2O/fad. On the other hand, the highest yield of sugar resulted from
applying 60 kg N + 96 kg K2O/fad.
Ghonema and Sarhan (1994) in Egypt, comes to conclusion that increasing NK fertilizer
levels up to 75 kg N + 48 kg K2O/fad significantly increased most yield components, yield and
quality of sugar beet, with exception sucrose and juice purity percentages. Generally, they
recommended that the highest root and sugar yields/fad can be obtained by adding 75 kg N + 48 kg
K2O/fad.
Badawi et al. (1995) in Egypt, revealed that the combined fertilizer treatment of NK at the
rate of 75 kg N + 48 kg K2O/fad was the most favorable for raising root, top and sugar yields/fad.
Abou-Amou et al. (1996) in Egypt, found that the application of 80 kg N + 48 kg K2O/fad
resulted the highest values of root yield of sugar beet (27.07 t/fad), purity % (78.75 %) and gross
sugar yield (4.61 t/fad). They concluded that potassium fertilization increased the efficiency of
nitrogen uptake from the soil and its utilization by sugar beet plants, especially when the nitrogen
fertilization was applied at its high level (80 kg N/fad).
Geweifel and Aly (1996) in Egypt, observed that total fresh weight of plant was the highest
with application of 80 kg N + 50 or 100 kg K2O/fad.
Gasiorowska (1997) in Russia, recorded that increasing nitrogen and potassium rates (100
kg N + 120 kg K2O, 160 kg N + 190 kg K2O or 220 kg N + 260 kg K2O/ha) reduced root and
foliage dry matter and also sugar content.
Ramadan (1997) in Egypt, concluded that the interaction between nitrogen and potassium
fertilization was significant with respect to root/top ratio and root yield/fad.
Samia, EL-Maghraby et al. (1998) in Egypt, reported that there was a significant effect on
the interaction between nitrogen and potassium fertilization on root and sugar yields/fad, whereas
the combination of 90 kg N + 48 kg K2O/fad had superior effect on these characters.

29
Sarhan (1998) in Egypt, decided that addition of 100 kg N + 48 kg K2O/fad produced the
highest values of leaf area/plant, root length and diameter, root and foliage fresh weights/plant, root,
top and sugar yields/fad.
Sayed et al. (1998) in Egypt, illustrated that application of 60 kg N + 48 kg K2O/fad
obtained the highest values of root and top yields/fad, root size and gross sugar yield/fad.
EL-Hawary (1999) in Egypt, reported that the interaction between nitrogen and potassium
fertilization had significant effects on root length, root fresh weight/plant, sucrose %, root, top and
sugar yields/fad. The highest values of these characters were recorded by fertilizing with 90 kg N +
48 kg K2O/fad.
Sultan et al. (1999) in Egypt, recorded that the combined application of 60 kg N + 48 kg
K2O/fad markedly developed yield and root quality and should be recommended to get maximum
yields compared to the application of nitrogen or potassium fertilizer alone.
EL-Shafai (2000) in Egypt, observed that root yield/fad and sucrose % had significant
response as a result of the interaction between nitrogen and potassium fertilizer levels, vice versa
with connection root fresh weight/plant, sugar yield and purity %.
EL-Zayat (2000) in Egypt, concluded that fertilization sugar beet plants with 90 kg N + 24
kg K2O/fad could be recommended for optimum root and extractable white sugar yields per unit
area.
EL-Harriri and Mirvat, Gobarh (2001) in Egypt, pointed out that application of 110 kg N
+ 48 kg K2O/fad markedly increased number of leaves/plant, LAI, root/top ratio, root characters,
TSS %, root and top yields/fad.
VII: Effect of the interaction between planting dates and nitrogen & potassium fertilizer
levels.
Badawi et al. (1995) concluded that early planting of sugar beet (1st Oct.) and fertilizing it
with 75 kg N + 24 kg K2O/fad achieved the maximum root and sugar yields/fad.
Azzazy (1998) reported that root yield/fad (in the second season) significantly affected by
the interaction between planting dates and nitrogen levels. On the contrary, TSS %, sucrose %,
purity %, top and sugar yields/fad insignificantly affected by the interaction between planting dates
and nitrogen levels.
Kandil et al. (2002 b) indicated that the interaction between planting dates and nitrogen
levels had significant increases on root fresh and dry weights, foliage fresh and dry weights and
LAI in both seasons. The highest values of these traits were obtained by planting beets during
October and fertilizing with 80 kg N/fad.
Kandil et al. (2002 c) found that root length and diameter, root and foliage fresh
weight/plant, root, top and sugar yields/fad significantly affected due to the interaction between
30
planting dates and nitrogen levels. In addition, the best results were achieved when planting during
October and application of 80 kg N/fad
VIII: Effect of the interaction between biofertilization treatments and nitrogen & potassium
fertilizer levels.
Favilli et al. (1993) in India, showed that inoculation seeds of sugar beet with Azospirillum
lipoferum + 60 kg N/ha produced the highest root weight per plant and per hectare compared with
fertilizing plants with 100 kg N/ha alone.
Milic et al. (1995) in Yugoslavia, studied the effect of quantity of free aerobic nitrofixators,
Na, K and P oxides and mineral nitrogen levels (0, 60, 90, 120 and 150 kg N/ha) on seed emergence
and growth of sugar beet. They found that mineral nitrogen fertilizer levels at 60, 90 and 120 kg
N/ha had a positive effect upon number of nitrofixators, which led to improve seed emergence and
growth, while application of 150 kg N/ha caused a decrease.
Sultan et al. (1999) in Egypt, concluded that the maximum yields of sugar beet were
achieved by inoculating seeds with Azotobacterin and application of NPK fertilization at the rate of
60 kg N + 30 kg P2O5 + 48 kg K2O/fad.
Abu EL-Fotoh et al. (2000) in Egypt, indicated that using biofertilizers (Microbbin or
Phosphorin) and NPK chemical fertilizers at the rate of 30 kg N + 15 kg P2O5 + 12 kg K2O/fad
induced obvious effect on the quality of sugar beet juice (alpha-amino nitrogen, and sucrose
percentage). Finally, they concluded that biofertilizers alone can not be met the NPK requirements
for sugar beet crop.
Bassal et al. (2001) in Egypt, observed that increasing bio-mineral nitrogen fertilization
level up to 60 kg N/fad + Syrialin inoculation significantly increased root, top and sugar yields/fad
as well as sucrose percentage.
Kandil et al. (2002 c) in Egypt, reviewed that the interaction between biofertilization
treatments and nitrogen fertilizer levels exerted significant effect on root and foliage fresh
weights/plant, root length and diameter, root and top yields/fad. While, root/top ratio, TSS %, purity
% and sugar yield (in the first season) did not differed due to the interaction between biofertilization
treatments and nitrogen fertilizer levels.
Soha, Khalil (2002) in Egypt, reported that fertilization with a mixture of Azotobacterin
(Azotobacter chroococcum) and Phosphobacterin (Bacillus megaterium) combination with 50 kg
N/fad affected significantly root fresh weight, top fresh weight, root length and diameter, TSS %,
sucrose % and purity % as well as root, top and sugar yields/fad. Generally, the productivity of
sugar beet was increased in spite of reducing the quantity of mineral nitrogen fertilizer until 50 kg
N/fad, which worry save 25 kg N/fad and reduce the environmental pollution.

31
Ramadan et al. (2003) in Egypt, recorded that the interaction between biofertilization
treatments and mineral fertilizer levels had significant decreases in TSS % (in the second season),
sucrose and purity percentages (in both seasons). The application of 100 % of mineral fertilizers (75
kg N + 15 kg P2O5/fad) in the presence of biofertilization produced the highest increase in root
length and diameter, root, top and sugar yields/fad.
IX: Effect of the interaction among planting dates, biofertilization treatments and nitrogen &
potassium fertilizer levels.
Abdou (2001) found that the interaction among planting dates, biofertilization treatments
and nitrogen fertilizer levels showed significant effect on root and foliage fresh weights, root
diameter, root and top yields/fad. He concluded that planting sugar beet during October and treated
seeds before planting with Rhizobacterin in addition adding 80 kg N/fad associated with best
productivity of sugar beet.
32
MATERIALS AND METHODS
Three field experiments were conducted at the Experimental Station, Faculty of Agriculture,
Mansoura University, during the three successive winter seasons of 2000/2001, 2001/2002 and
2002/2003. The main objectives of this study were to determine the effect of planting dates,
biofertilization treatments, nitrogen & potassium fertilizer levels and their interactions on growth,
yield and its components as well as quality of sugar beet (Beta vulgaris var. altissima, L.) cv. Beta
Poly 4.
The Beta Poly 4 cultivar is one of multigerm sugar beet cultivars, and annually imported
from Hungary by Dakahlia Sugar Company at Belkass. It is one of short duration cultivars (180-200
days) and recommended to be grown under Dakahlia Governorate conditions.
Treatments and experimental design:
Three field experiments were laid-out in a split-split plot design with three replications. In
the first season (2000/2001), the experiment included sixty-four treatments comprising, two
planting dates, four biofertilization treatments and eight combinations of nitrogen and potassium
fertilizer levels. While in the second and third seasons (2001/2002 and 2002/2003), each experiment
included ninety-six treatments comprising, three planting dates, four biofertilization treatments and
eight combinations of nitrogen and potassium fertilizer levels.
The main plots were assigned to planting dates as follows: two planting dates only in the
first season (1st Oct. and 1st Nov.) and three planting dates in the second and third seasons (1st Sept.,
1st Oct. and 1st Nov.).
The sub-plots were allocated with the following four biofertilization treatments:
B0 - Without biofertilization (control).
B1 - Treated soil with Rhizobacterin (450 g/fad).
B2 - Treated soil with Cerialine (450 g/fad).
B3- Treated soil with Rhizobacterin + Cerialine (225+225 g/fad, respectively).
Rhizobacterin and Cerialine as commercial products were produced by Biofertilizer Unit,
Agriculture Research Center (ARC), Giza, Egypt, which included free-living bacteria able to fix
atmospheric nitrogen in the rhizosphere of soil.
The biofertilizer treatments were done before first irrigation directly by mixing the
recommended dose of each biofertilizer with fine clay as side-dress near from hills.
The sub sub-plots were occupied with the following eight combinations of nitrogen and
potassium fertilizer levels:
1- 20 kg N + 24 kg K2O/fad.
2- 20 kg N + 48 kg K2O/fad.
3- 40 kg N + 24 kg K2O/fad.

33
4- 40 kg N + 48 kg K2O/fad.
5- 60 kg N + 24 kg K2O/fad.
6- 60 kg N + 48 kg K2O/fad.
7- 80 kg N + 24 kg K2O/fad.
8- 80 kg N + 48 kg K2O/fad.
Nitrogen and potassium fertilizers in the forms of urea (46 %N) and potassium sulphate (48
% K2O), respectively were applied as a side-dressing in two equal doses, one half after thinning (35
days after sowing) and the other before the third watering (70 days after sowing).
Each experimental basic unit (sub sub-plot) included four ridges, each 60 cm apart and 4.0
m length, resulted an area of 9.6 m2 (1/437.5 fad) in the first and third seasons only. Whilst, in the
second season the specialty area of experiment was very limit, thus each experimental unit
consisted of four ridges, each 60 cm apart and 4.0 m length, but the external ridges of each plot as a
border. The preceding summer crop was maize (Zea mays, L.) in all seasons.
Mechanical and chemical analysis of soil:
Soil samples were taken at random from the experimental field area at a depth of 15 and 30
cm from soil surface before soil preparation to measure the chemical and physical soil properties as
shown in Table 1.
Temperature and humidity:
Meteorological data (monthly temperature C0 and relative humidity %) of EL-Mansoura
district during the three growing seasons of 2000/2001, 2001/2002 and 2002/2003 were shown in
Table 2.
Agricultural practices:
The experimental field well prepared through two ploughing, leveling, compaction, ridging,
division and then divided into the experimental units. Calcium super phosphate (15.5 % P2O5) was
applied during soil preparation at the rate of 100 kg/fad.
Sugar beet balls were hand sown 3-5 balls/hill using dry sowing method on one side of the
ridge in hills 20 cm apart during the aforementioned dates in the first, second and third seasons,
respectively. The plots were irrigated immediately after sowing directly. Plants were thinned at the
age of 35 days from planting to obtain one plant/hill (35000 plants/fad).
Plants were kept free from weeds, which were manually controlled by hand hoeing at two
times. The common agricultural practices for growing sugar beet according to the recommendations
of Ministry of Agriculture were followed, except the factors under study.
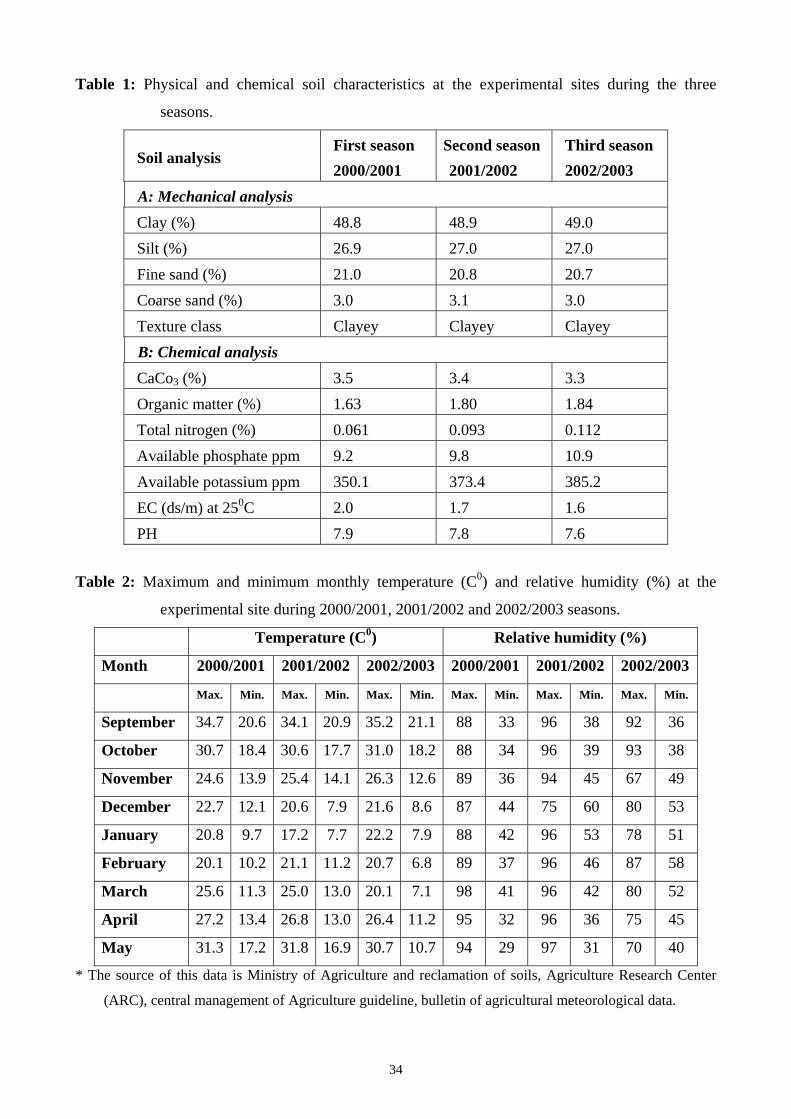
34
Table 1: Physical and chemical soil characteristics at the experimental sites during the three
seasons.
Soil analysis First season 2000/2001
Second season 2001/2002
Third season 2002/2003
A: Mechanical analysis Clay (%) 48.8 48.9 49.0 Silt (%) 26.9 27.0 27.0 Fine sand (%) 21.0 20.8 20.7 Coarse sand (%) 3.0 3.1 3.0 Texture class Clayey Clayey Clayey B: Chemical analysis CaCo3 (%) 3.5 3.4 3.3 Organic matter (%) 1.63 1.80 1.84 Total nitrogen (%) 0.061 0.093 0.112 Available phosphate ppm 9.2 9.8 10.9 Available potassium ppm 350.1 373.4 385.2 EC (ds/m) at 250C 2.0 1.7 1.6 PH 7.9 7.8 7.6
Table 2: Maximum and minimum monthly temperature (C0) and relative humidity (%) at the
experimental site during 2000/2001, 2001/2002 and 2002/2003 seasons.
Temperature (C0) Relative humidity (%)
Month 2000/2001 2001/2002 2002/2003 2000/2001 2001/2002 2002/2003
Max. Min. Max. Min. Max. Min. Max. Min. Max. Min. Max. Min.
September 34.7 20.6 34.1 20.9 35.2 21.1 88 33 96 38 92 36
October 30.7 18.4 30.6 17.7 31.0 18.2 88 34 96 39 93 38
November 24.6 13.9 25.4 14.1 26.3 12.6 89 36 94 45 67 49
December 22.7 12.1 20.6 7.9 21.6 8.6 87 44 75 60 80 53
January 20.8 9.7 17.2 7.7 22.2 7.9 88 42 96 53 78 51
February 20.1 10.2 21.1 11.2 20.7 6.8 89 37 96 46 87 58
March 25.6 11.3 25.0 13.0 20.1 7.1 98 41 96 42 80 52
April 27.2 13.4 26.8 13.0 26.4 11.2 95 32 96 36 75 45
May 31.3 17.2 31.8 16.9 30.7 10.7 94 29 97 31 70 40
* The source of this data is Ministry of Agriculture and reclamation of soils, Agriculture Research Center
(ARC), central management of Agriculture guideline, bulletin of agricultural meteorological data.

35
Sampling time:
Two samples were taken during the growth period (120 and 150 days from planting), i.e.
five guarded plants were chosen at random from outer ridges of each sub sub-plot. Each sample was
separated into foliages and roots, then the roots and foliages were cut to small pieces. The following
growth attributes was determined:
1. Root fresh weight (g).
2. Root dry weight (g).
3. Foliage fresh weight (g).
4. Foliage dry weight (g).
To determine root and foliage dry weight, all plant fractions were air-dried, then oven dried
at 700C till constant weight obtained.
5. Leaf area index (LAI): Leaf area measurement determined by the disk method using 10 disks of 1.0
cm diameter according to Watson (1958) and then following equation was used.
Unit leaf area per plant (cm2)
LAI =
Plant ground area (cm2)
6. Crop growth rate (CGR) in g/day: Determined according to Radford`s (1967), where: W1 and W2
refer to dry weight of plant at sampling time T1 (120 DAP) and T2 (150 DAP), respectively.
W2-W1
CGR =
T2-T1
7. Relative growth rate (RGR) in g/g/day: Determined according to Watson`s (1958).
loge W2 - loge W1
RGR =
T2 - T1
8. Net assimilation rate (NAR) in g/cm2/day: Determined according to Radford`s (1967), where:
W1, A1 and W2, A2, respectively refer to dry weight and leaf area of plant at sampling time T1
and T2, respectively.
(W2 - W1) (loge A2 - loge A1)
NAR =
(T2 - T1) (A2 - A1)
Yield components and quality characters:
At maturity (after approximately 195 days from planting) five plants were chosen at random
from the outer ridges of each sub sub-plot to determine yield components and quality characters as
follows:
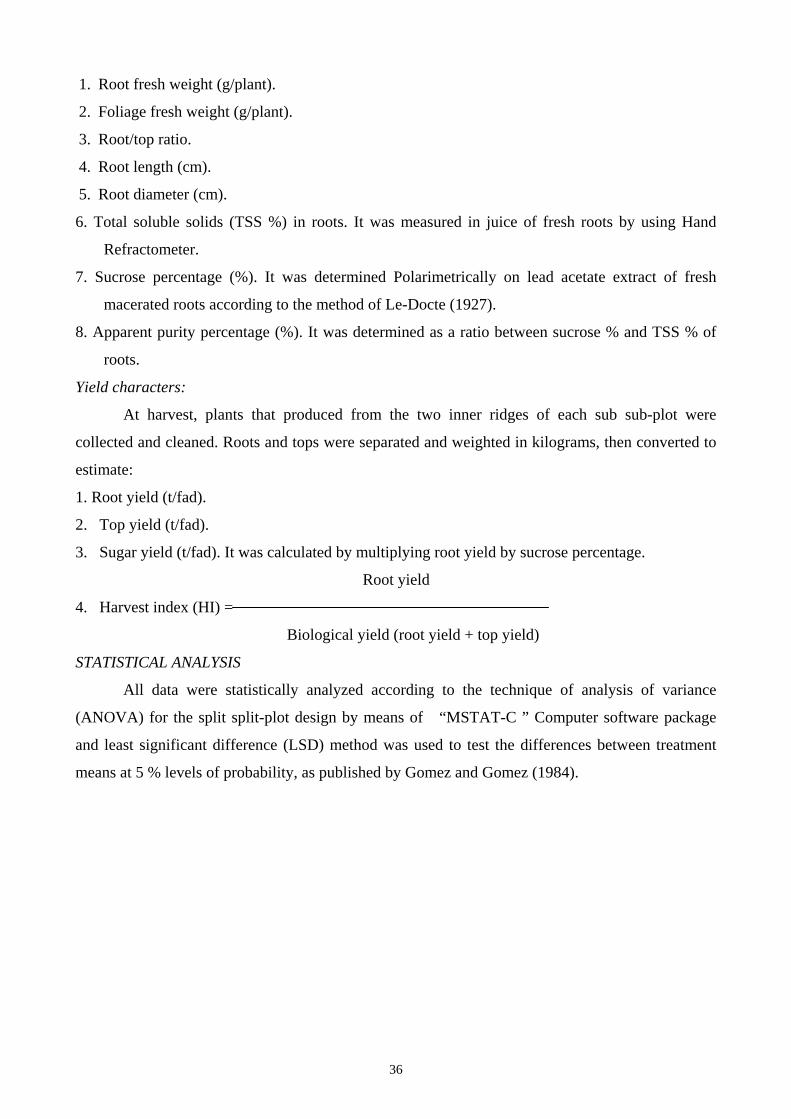
36
1. Root fresh weight (g/plant).
2. Foliage fresh weight (g/plant).
3. Root/top ratio.
4. Root length (cm).
5. Root diameter (cm).
6. Total soluble solids (TSS %) in roots. It was measured in juice of fresh roots by using Hand
Refractometer.
7. Sucrose percentage (%). It was determined Polarimetrically on lead acetate extract of fresh
macerated roots according to the method of Le-Docte (1927).
8. Apparent purity percentage (%). It was determined as a ratio between sucrose % and TSS % of
roots.
Yield characters:
At harvest, plants that produced from the two inner ridges of each sub sub-plot were
collected and cleaned. Roots and tops were separated and weighted in kilograms, then converted to
estimate:
1. Root yield (t/fad).
2. Top yield (t/fad).
3. Sugar yield (t/fad). It was calculated by multiplying root yield by sucrose percentage.
Root yield
4. Harvest index (HI) =
Biological yield (root yield + top yield)
STATISTICAL ANALYSIS
All data were statistically analyzed according to the technique of analysis of variance
(ANOVA) for the split split-plot design by means of “MSTAT-C ” Computer software package
and least significant difference (LSD) method was used to test the differences between treatment
means at 5 % levels of probability, as published by Gomez and Gomez (1984).

37
RESULTS AND DISCUSSION
The main objective of this chapter in the study is to attend to the obtained results and a try
for explaining its. Effect of planting dates, biofertilization treatments, nitrogen and potassium
fertilizer levels on growth, yield and quality of sugar beet will be presented and discussed in
separate topics under the following four headings:
1. Growth attributes.
2. Yield components.
3. Yield quality.
4. Yield.
1. GROWTH ATTRIBUTES:
1.1- Root fresh weight (g/plant):
Root fresh weight of sugar beet plants (g/plant) as affected by planting dates, biofertilization
treatments, nitrogen and potassium fertilizer levels at 120 and 150 days from planting during
2000/2001, 2001/2002 and 2002/2003 seasons are presented in Table 3.
Effect of planting dates:
As shown from data in Table 3, planting dates had a significant effect on root fresh weight at
120 and 150 days from planting in the second and third seasons only. Planting in 1st October was
accompanied with highest means of root fresh weight (276.5, 368.0 and 370.5 g/plant) and (314.9,
566.9 and 572.6 g/plant) at 120 and 150 days from planting in the first, second and third seasons,
respectively. On the other hand, the lowest ones i.e. 243.2, 264.8 and 273.4 as well as 309.6, 513.8
and 499.4 g/plant at 120 and 150 days from planting in the first, second and third seasons,
respectively were resulted from planting beet on 1st November in the first and third seasons and
from 1st of September in the second season. The superiority of planting sugar beet on 1st October
with respect to root fresh weight may be due to the suitable weather conditions during growth stages
of plant that held not only maximum growth of roots but also rapid growth and formation a good
canopy able to make efficient photosynthesis. These results are in harmony with those obtained by
Badawi (1985), Badawi et al. (1995) and Kandil et al. (2002 b).
Effect of biofertilization treatments:
Significant differences were noticed in root fresh weight at 120 and 150 days from planting
in response to biofertilization treatments in the three seasons as it is shown in Table 3. The heaviest
fresh roots were produced from Rhizobacterin treatment, where results were 289.1, 344.6 and 334.2
g/plant as well as 343.9, 564.8 and 550.8 g/plant at 120 and 150 days from planting in the first,
second and third seasons, respectively. Treated soil with Rhizobacterin + Cerialine came in the
second rank after Rhizobacterin, while Cerialine treatment came in the third rank with concern root
fresh weight at the two samples in all seasons of study. The lowest means of root fresh weight
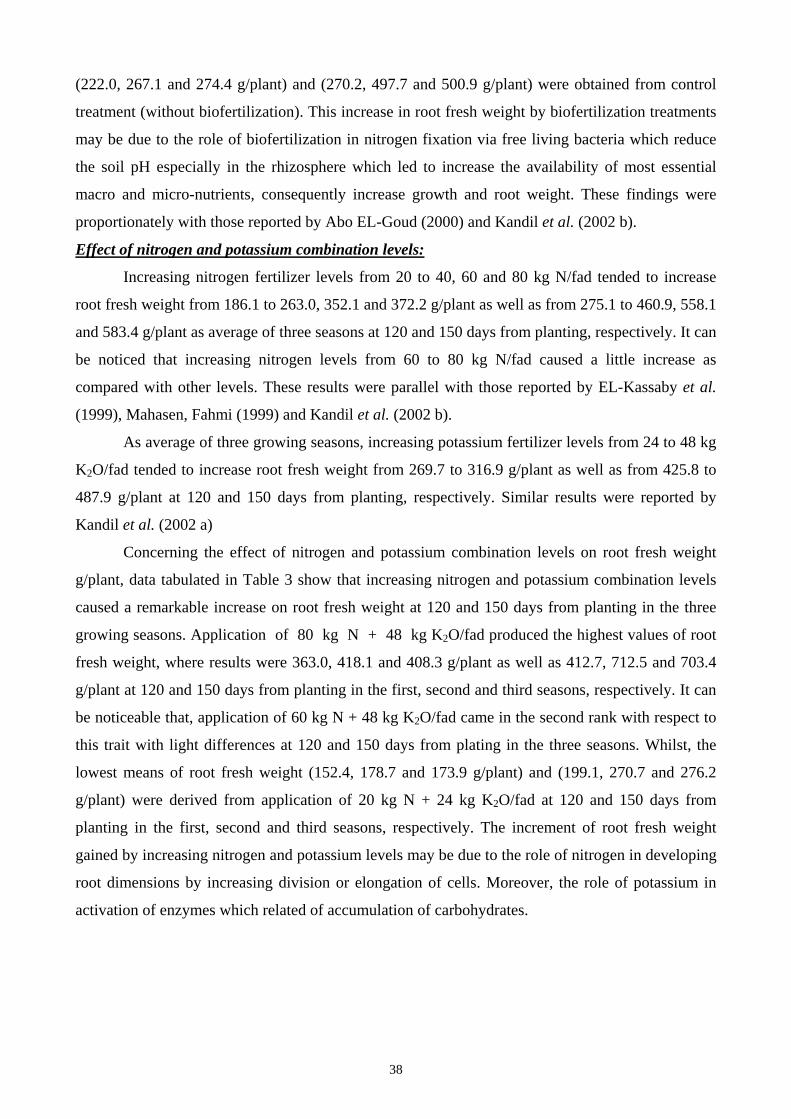
38
(222.0, 267.1 and 274.4 g/plant) and (270.2, 497.7 and 500.9 g/plant) were obtained from control
treatment (without biofertilization). This increase in root fresh weight by biofertilization treatments
may be due to the role of biofertilization in nitrogen fixation via free living bacteria which reduce
the soil pH especially in the rhizosphere which led to increase the availability of most essential
macro and micro-nutrients, consequently increase growth and root weight. These findings were
proportionately with those reported by Abo EL-Goud (2000) and Kandil et al. (2002 b).
Effect of nitrogen and potassium combination levels:
Increasing nitrogen fertilizer levels from 20 to 40, 60 and 80 kg N/fad tended to increase
root fresh weight from 186.1 to 263.0, 352.1 and 372.2 g/plant as well as from 275.1 to 460.9, 558.1
and 583.4 g/plant as average of three seasons at 120 and 150 days from planting, respectively. It can
be noticed that increasing nitrogen levels from 60 to 80 kg N/fad caused a little increase as
compared with other levels. These results were parallel with those reported by EL-Kassaby et al.
(1999), Mahasen, Fahmi (1999) and Kandil et al. (2002 b).
As average of three growing seasons, increasing potassium fertilizer levels from 24 to 48 kg
K2O/fad tended to increase root fresh weight from 269.7 to 316.9 g/plant as well as from 425.8 to
487.9 g/plant at 120 and 150 days from planting, respectively. Similar results were reported by
Kandil et al. (2002 a)
Concerning the effect of nitrogen and potassium combination levels on root fresh weight
g/plant, data tabulated in Table 3 show that increasing nitrogen and potassium combination levels
caused a remarkable increase on root fresh weight at 120 and 150 days from planting in the three
growing seasons. Application of 80 kg N + 48 kg K2O/fad produced the highest values of root
fresh weight, where results were 363.0, 418.1 and 408.3 g/plant as well as 412.7, 712.5 and 703.4
g/plant at 120 and 150 days from planting in the first, second and third seasons, respectively. It can
be noticeable that, application of 60 kg N + 48 kg K2O/fad came in the second rank with respect to
this trait with light differences at 120 and 150 days from plating in the three seasons. Whilst, the
lowest means of root fresh weight (152.4, 178.7 and 173.9 g/plant) and (199.1, 270.7 and 276.2
g/plant) were derived from application of 20 kg N + 24 kg K2O/fad at 120 and 150 days from
planting in the first, second and third seasons, respectively. The increment of root fresh weight
gained by increasing nitrogen and potassium levels may be due to the role of nitrogen in developing
root dimensions by increasing division or elongation of cells. Moreover, the role of potassium in
activation of enzymes which related of accumulation of carbohydrates.
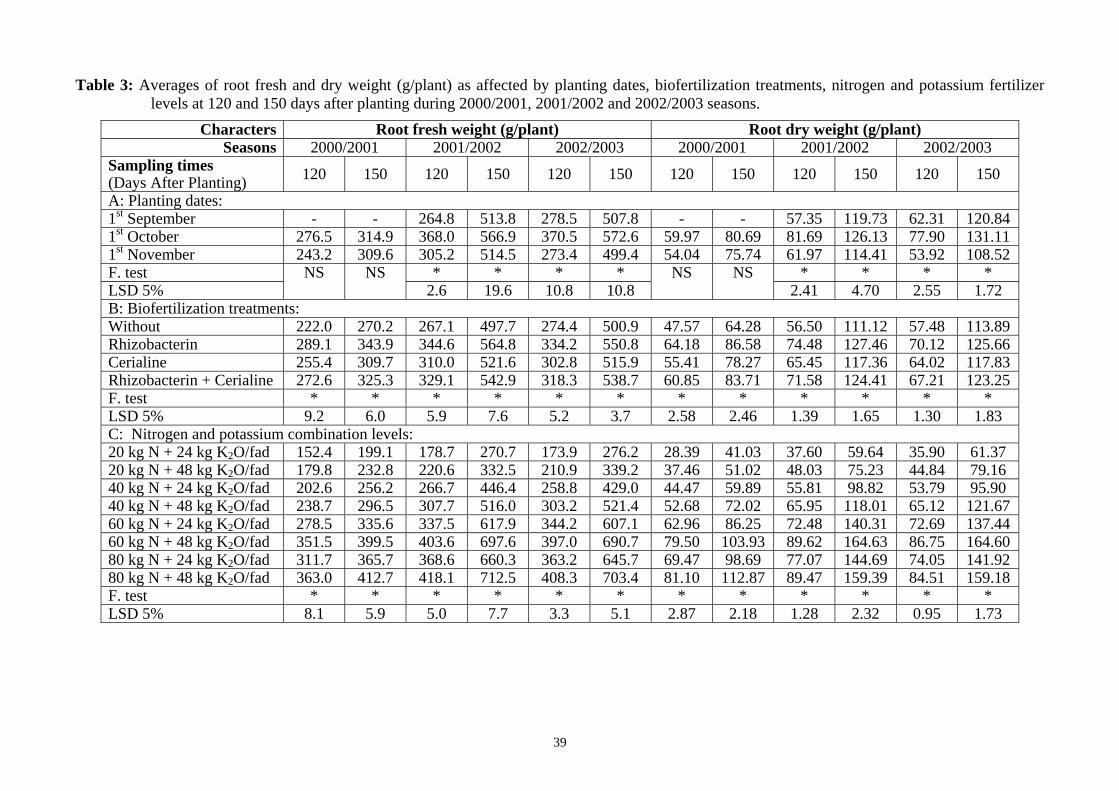
39
Table 3: Averages of root fresh and dry weight (g/plant) as affected by planting dates, biofertilization treatments, nitrogen and potassium fertilizer levels at 120 and 150 days after planting during 2000/2001, 2001/2002 and 2002/2003 seasons.
Characters Root fresh weight (g/plant) Root dry weight (g/plant) Seasons 2000/2001 2001/2002 2002/2003 2000/2001 2001/2002 2002/2003
Sampling times (Days After Planting) 120 150 120 150 120 150 120 150 120 150 120 150
A: Planting dates: 1st September - - 264.8 513.8 278.5 507.8 - - 57.35 119.73 62.31 120.84 1st October 276.5 314.9 368.0 566.9 370.5 572.6 59.97 80.69 81.69 126.13 77.90 131.11 1st November 243.2 309.6 305.2 514.5 273.4 499.4 54.04 75.74 61.97 114.41 53.92 108.52 F. test * * * * * * * * LSD 5%
NS
NS 2.6 19.6 10.8 10.8
NS NS 2.41 4.70 2.55 1.72
B: Biofertilization treatments: Without 222.0 270.2 267.1 497.7 274.4 500.9 47.57 64.28 56.50 111.12 57.48 113.89 Rhizobacterin 289.1 343.9 344.6 564.8 334.2 550.8 64.18 86.58 74.48 127.46 70.12 125.66 Cerialine 255.4 309.7 310.0 521.6 302.8 515.9 55.41 78.27 65.45 117.36 64.02 117.83 Rhizobacterin + Cerialine 272.6 325.3 329.1 542.9 318.3 538.7 60.85 83.71 71.58 124.41 67.21 123.25 F. test * * * * * * * * * * * * LSD 5% 9.2 6.0 5.9 7.6 5.2 3.7 2.58 2.46 1.39 1.65 1.30 1.83 C: Nitrogen and potassium combination levels: 20 kg N + 24 kg K2O/fad 152.4 199.1 178.7 270.7 173.9 276.2 28.39 41.03 37.60 59.64 35.90 61.37 20 kg N + 48 kg K2O/fad 179.8 232.8 220.6 332.5 210.9 339.2 37.46 51.02 48.03 75.23 44.84 79.16 40 kg N + 24 kg K2O/fad 202.6 256.2 266.7 446.4 258.8 429.0 44.47 59.89 55.81 98.82 53.79 95.90 40 kg N + 48 kg K2O/fad 238.7 296.5 307.7 516.0 303.2 521.4 52.68 72.02 65.95 118.01 65.12 121.67 60 kg N + 24 kg K2O/fad 278.5 335.6 337.5 617.9 344.2 607.1 62.96 86.25 72.48 140.31 72.69 137.44 60 kg N + 48 kg K2O/fad 351.5 399.5 403.6 697.6 397.0 690.7 79.50 103.93 89.62 164.63 86.75 164.60 80 kg N + 24 kg K2O/fad 311.7 365.7 368.6 660.3 363.2 645.7 69.47 98.69 77.07 144.69 74.05 141.92 80 kg N + 48 kg K2O/fad 363.0 412.7 418.1 712.5 408.3 703.4 81.10 112.87 89.47 159.39 84.51 159.18 F. test * * * * * * * * * * * * LSD 5% 8.1 5.9 5.0 7.7 3.3 5.1 2.87 2.18 1.28 2.32 0.95 1.73

40
Effect of interactions:
The interaction between planting dates X nitrogen and potassium combination levels
showed significant effect on root fresh weight at 120 and 150 days from planting (Table 4). The
highest averages of this trait 368.2, 472.1 and 487.4 as well as 415.2, 764.1 and 762.1 g/plant were
obtained from planting on 1st October and application of 80 kg N + 48 kg K2O/fad at 120 and 150
days from planting in the first, second and third seasons, respectively. Similar findings were
supported by Kandil et al. (2002 b).
The interaction between biofertilization treatments X nitrogen and potassium combination
levels was significant in the three seasons (Table 5 and 6). The highest values of root fresh weight
(394.0, 458.4 and 443.0 g/plant as well as 432.0, 748.5 and 734.4 g/plant) were resulted from
application of Rhizobacterin combination with 80 kg N + 48 kg K2O/fad at 120 and 150 days from
planting in the first, second and third seasons, respectively. Meanwhile, inoculation soil by
Rhizobacterin and fertilizing with 60 kg N + 48 kg K2O/fad produced the best results after
aforementioned interaction at both samples in all seasons.
1.2- Root dry weight (g/plant):
The effect of planting dates, biofertilization treatments, nitrogen and potassium fertilizer
levels on root dry weight (g/plant) at 120 and 150 days from planting during 2000/2001, 2001/2002
and 2002/2003 seasons are listed in Table 3.
Effect of planting dates:
Planting dates exhibited significant effect on root dry weight at 120 and 150 days from
planting in the second and third seasons, vice versa in the first season (Table 3). The maximum
averages of root dry weight (59.97, 81.69 and 77.90 g/plant) and (80.69, 126.13 and 131.11 g/plant)
were achieved when planting on 1st October at 120 and 150 days from planting in the first, second
and third seasons, respectively. On the other side, the lowest ones were obtained from planting on
1st November at 120 and 150 days from planting in all growing seasons, except second season at
120 days from sowing only that produced from planting on 1st September . The increase in root
dry weight caused by planting beets on the first October may be ascribed to the more favorable
climatic conditions, particularly temperature, day length and light intensity with suitable growth
period of plant, consequently enhance establishment and growth as well as development roots.
These results stand in harmony with those obtained by Badawi (1985) and Kandil et al. (2002 b).
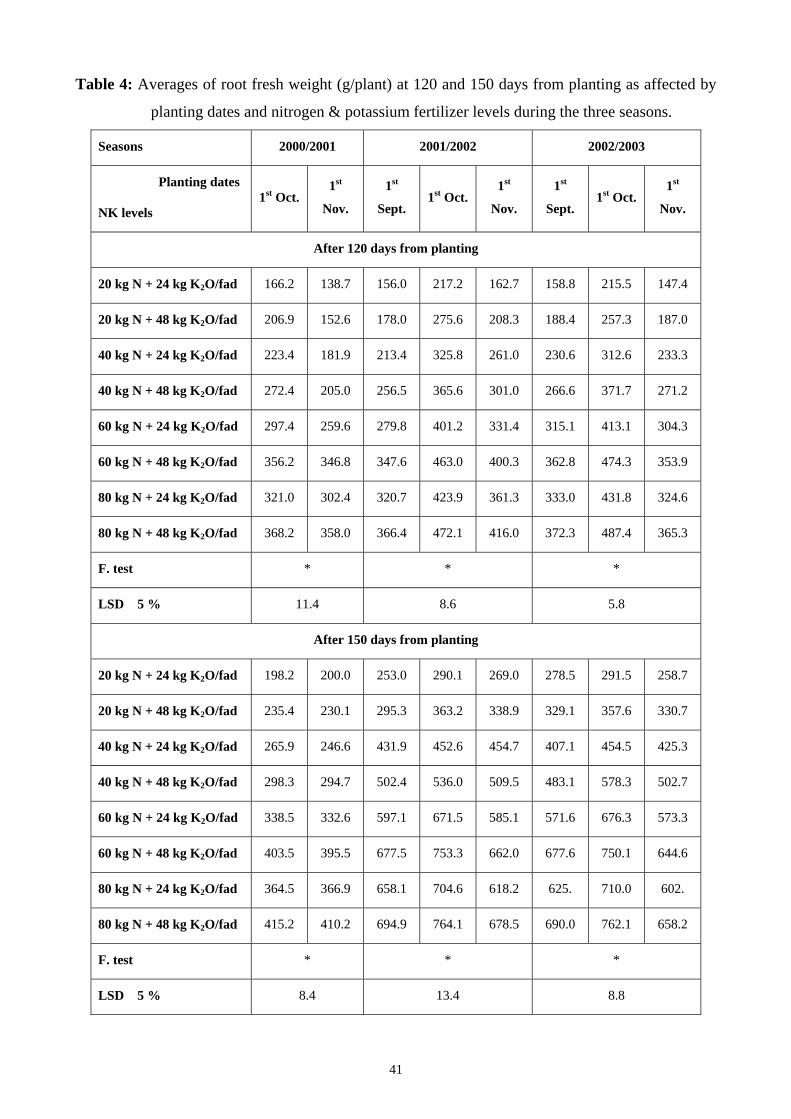
41
Table 4: Averages of root fresh weight (g/plant) at 120 and 150 days from planting as affected by
planting dates and nitrogen & potassium fertilizer levels during the three seasons.
Seasons 2000/2001 2001/2002 2002/2003
Planting dates
NK levels 1st Oct.
1st
Nov.
1st
Sept. 1st Oct.
1st
Nov.
1st
Sept. 1st Oct.
1st
Nov.
After 120 days from planting
20 kg N + 24 kg K2O/fad 166.2 138.7 156.0 217.2 162.7 158.8 215.5 147.4
20 kg N + 48 kg K2O/fad 206.9 152.6 178.0 275.6 208.3 188.4 257.3 187.0
40 kg N + 24 kg K2O/fad 223.4 181.9 213.4 325.8 261.0 230.6 312.6 233.3
40 kg N + 48 kg K2O/fad 272.4 205.0 256.5 365.6 301.0 266.6 371.7 271.2
60 kg N + 24 kg K2O/fad 297.4 259.6 279.8 401.2 331.4 315.1 413.1 304.3
60 kg N + 48 kg K2O/fad 356.2 346.8 347.6 463.0 400.3 362.8 474.3 353.9
80 kg N + 24 kg K2O/fad 321.0 302.4 320.7 423.9 361.3 333.0 431.8 324.6
80 kg N + 48 kg K2O/fad 368.2 358.0 366.4 472.1 416.0 372.3 487.4 365.3
F. test * * *
LSD 5 % 11.4 8.6 5.8
After 150 days from planting
20 kg N + 24 kg K2O/fad 198.2 200.0 253.0 290.1 269.0 278.5 291.5 258.7
20 kg N + 48 kg K2O/fad 235.4 230.1 295.3 363.2 338.9 329.1 357.6 330.7
40 kg N + 24 kg K2O/fad 265.9 246.6 431.9 452.6 454.7 407.1 454.5 425.3
40 kg N + 48 kg K2O/fad 298.3 294.7 502.4 536.0 509.5 483.1 578.3 502.7
60 kg N + 24 kg K2O/fad 338.5 332.6 597.1 671.5 585.1 571.6 676.3 573.3
60 kg N + 48 kg K2O/fad 403.5 395.5 677.5 753.3 662.0 677.6 750.1 644.6
80 kg N + 24 kg K2O/fad 364.5 366.9 658.1 704.6 618.2 625. 710.0 602.
80 kg N + 48 kg K2O/fad 415.2 410.2 694.9 764.1 678.5 690.0 762.1 658.2
F. test * * *
LSD 5 % 8.4 13.4 8.8
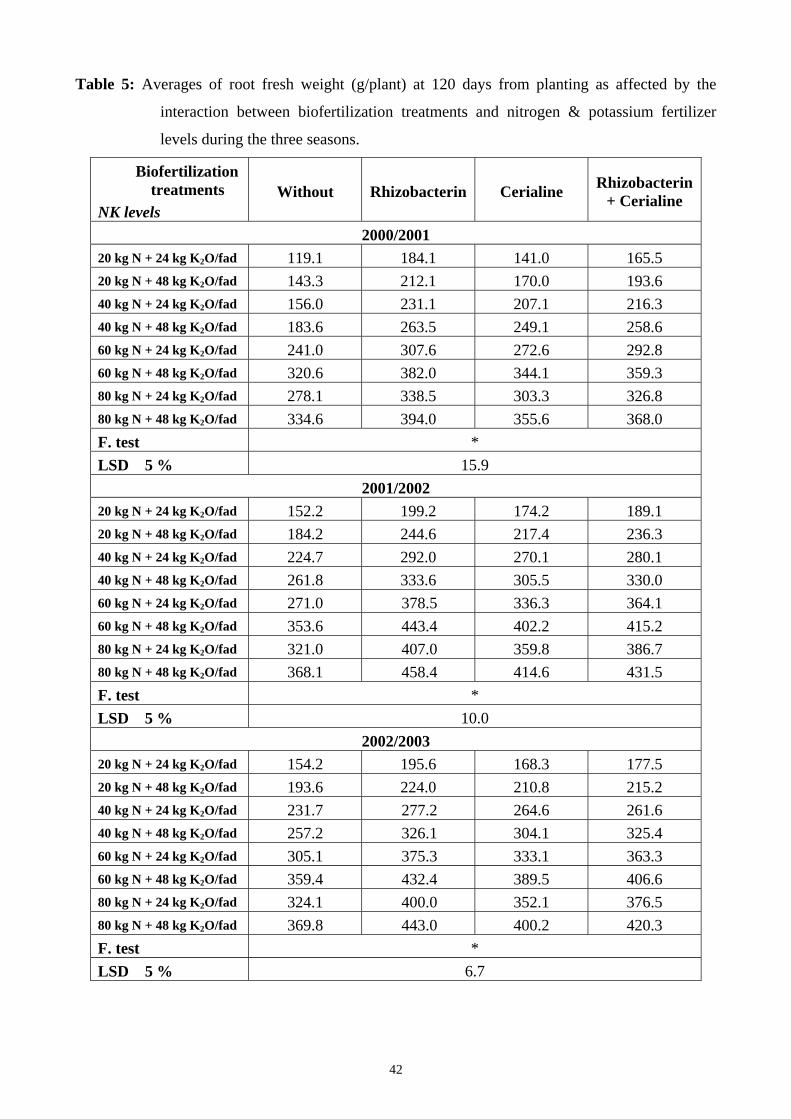
42
Table 5: Averages of root fresh weight (g/plant) at 120 days from planting as affected by the
interaction between biofertilization treatments and nitrogen & potassium fertilizer
levels during the three seasons.
Biofertilization treatments
NK levels Without Rhizobacterin Cerialine Rhizobacterin
+ Cerialine
2000/2001 20 kg N + 24 kg K2O/fad 119.1 184.1 141.0 165.5 20 kg N + 48 kg K2O/fad 143.3 212.1 170.0 193.6 40 kg N + 24 kg K2O/fad 156.0 231.1 207.1 216.3 40 kg N + 48 kg K2O/fad 183.6 263.5 249.1 258.6 60 kg N + 24 kg K2O/fad 241.0 307.6 272.6 292.8 60 kg N + 48 kg K2O/fad 320.6 382.0 344.1 359.3 80 kg N + 24 kg K2O/fad 278.1 338.5 303.3 326.8 80 kg N + 48 kg K2O/fad 334.6 394.0 355.6 368.0 F. test * LSD 5 % 15.9
2001/2002 20 kg N + 24 kg K2O/fad 152.2 199.2 174.2 189.1 20 kg N + 48 kg K2O/fad 184.2 244.6 217.4 236.3 40 kg N + 24 kg K2O/fad 224.7 292.0 270.1 280.1 40 kg N + 48 kg K2O/fad 261.8 333.6 305.5 330.0 60 kg N + 24 kg K2O/fad 271.0 378.5 336.3 364.1 60 kg N + 48 kg K2O/fad 353.6 443.4 402.2 415.2 80 kg N + 24 kg K2O/fad 321.0 407.0 359.8 386.7 80 kg N + 48 kg K2O/fad 368.1 458.4 414.6 431.5 F. test * LSD 5 % 10.0
2002/2003 20 kg N + 24 kg K2O/fad 154.2 195.6 168.3 177.5 20 kg N + 48 kg K2O/fad 193.6 224.0 210.8 215.2 40 kg N + 24 kg K2O/fad 231.7 277.2 264.6 261.6 40 kg N + 48 kg K2O/fad 257.2 326.1 304.1 325.4 60 kg N + 24 kg K2O/fad 305.1 375.3 333.1 363.3 60 kg N + 48 kg K2O/fad 359.4 432.4 389.5 406.6 80 kg N + 24 kg K2O/fad 324.1 400.0 352.1 376.5 80 kg N + 48 kg K2O/fad 369.8 443.0 400.2 420.3 F. test * LSD 5 % 6.7

43
Table 6: Averages of root fresh weight (g/plant) at 150 days from planting as affected by biofertilization treatments and nitrogen & potassium fertilizer levels during the three seasons.
Biofertilization treatments NK levels
Without Rhizobacterin Cerialine Rhizobacterin + Cerialine
2000/2001 20 kg N + 24 kg K2O/fad 166.5 231.6 190.0 208.5 20 kg N + 48 kg K2O/fad 179.3 281.0 218.6 252.1 40 kg N + 24 kg K2O/fad 192.0 309.3 256.1 267.6 40 kg N + 48 kg K2O/fad 230.5 333.0 298.8 323.8 60 kg N + 24 kg K2O/fad 295.8 355.0 341.0 350.5 60 kg N + 48 kg K2O/fad 377.3 421.1 393.1 406.5 80 kg N + 24 kg K2O/fad 328.6 388.3 372.6 373.1 80 kg N + 48 kg K2O/fad 391.6 432.0 407.3 420.0 F. test * LSD 5 % 11.9
2001/2002 20 kg N + 24 kg K2O/fad 246.2 294.4 267.4 274.8 20 kg N + 48 kg K2O/fad 308.7 347.3 343.1 339.7 40 kg N + 24 kg K2O/fad 418.2 477.4 421.2 468.8 40 kg N + 48 kg K2O/fad 493.4 556.5 489.5 524.4 60 kg N + 24 kg K2O/fad 573.5 659.2 610.4 628.5 60 kg N + 48 kg K2O/fad 648.0 733.5 693.6 715.3 80 kg N + 24 kg K2O/fad 623.8 701.4 649.2 666.8 80 kg N + 48 kg K2O/fad 669.8 748.5 707.2 724.5 F. test * LSD 5 % 15.5
2002/2003 20 kg N + 24 kg K2O/fad 252.2 298.3 269.3 285.2 20 kg N + 48 kg K2O/fad 314.7 361.6 331.0 349.3 40 kg N + 24 kg K2O/fad 400.8 449.6 420.8 444.6 40 kg N + 48 kg K2O/fad 502.0 530.8 507.2 545.5 60 kg N + 24 kg K2O/fad 587.1 636.5 593.7 611.0 60 kg N + 48 kg K2O/fad 659.1 722.5 677.7 703.6 80 kg N + 24 kg K2O/fad 618.4 672.6 636.5 655.1 80 kg N + 48 kg K2O/fad 672.8 734.4 690.7 715.7 F. test * LSD 5 % 10.1
44
Effect of biofertilization treatments:
Regarding the effect of biofertilization treatments on root dry weight, it was significant at
the two samples in the three seasons of study (Table 3). Root dry weight was markedly increased
and achieved maximum values in treatment of inoculation soil with Rhizobacterin as compared with
other biofertilization treatments. The corresponding values in order to previous treatment were
64.18, 74.48 and 70.12 g/plant as well as 86.58, 127.46 and 125.66 g/plant at 120 and 150 days
from planting in the first, second and third seasons, respectively. The arrangement of biofertilization
treatments after Rhizobacterin treatment was Rhizobacterin + Syrialin, Cerialine then control
treatment with respect their desirable effect on this trait at both samples during the three seasons.
The increase in root dry weight as a result of biofertilization treatments may be has the same reason
for increasing root fresh weight, which mentioned before. These results are extremely similar to
those suggested by Mrkovack et al. (1997), Mezei et al. (1998), Abo EL-Goud (2000) and Kandil et
al. (2002 b).
Effect of nitrogen and potassium combination levels:
Root dry weight tended to increase due to increasing nitrogen fertilizer levels from 20 to 40,
60 and 80, which values were 38.71, 56.32, 77.33 and 79.30 g/plant as well as 61.22, 94.41, 132.92
and 136.12 g/plant as average of three seasons at 120 and 150 days from planting, respectively.
These results are in line with recorded by EL-Kassaby et al. (1999), Mahasen, Fahmi (1999), EL-
Zayat (2000) and Kandil et al. (2002 b).
Increasing potassium fertilizer levels from 24 to 48 kg K2O/fad tended to increase root dry
weight from 57.14 to 68.80 g/plant and from 97.21 to 115.14 g/plant at 120 and 150 days from
planting as average of the three seasons. EL-Zayat (2000) confirmed this conclusion.
With reference to the effect of nitrogen and potassium combination levels on root dry
weight, results listed in Table 3 reveal that there was a significant effect at 120 and 150 days from
planting in the three seasons of study. Raising nitrogen and potassium combination levels from 20
kg N + 24 kg K2O/fad to 80 kg N + 48 kg K2O/fad caused significant increase in root dry weight at
both samples in all seasons. The highest values of root dry weight (81.10 and 112.87 g/plant) were
recorded due to application of 80 kg N + 48 kg K2O/fad at 120 and 150 days from planting in the
first season, respectively. While, in second and third seasons the highest once (89.62 and 86.75
g/plant as well as 164.63 and 164.60 g/plant) were produced from application of 60 kg N + 48 kg
K2O/fad at 120 and 150 days from planting, respectively. On opposition to, the lowest ones (28.39,
37.60 and 35.90 g/plant) and (41.03, 59.64 and 61.37 g/plant) were proceeded from fertilizing with
20 kg N + 24 kg K2O/fad at 120 and 150 days from planting in the first, second and third seasons,
respectively. This increase in root dry weight by increasing nitrogen and potassium combination
45
levels might have been resulted from increasing photosynthetic area per plant, which led to more
photosynthates production and therefore increasing dry matter accumulation.
1.3- Foliage fresh weight (g/plant):
Averages of foliage fresh weight (g/plant) as affected by planting dates, biofertilization
treatments, nitrogen and potassium fertilizer levels at 120 and 150 days from planting during
2000/2001, 2001/2002 and 2002/2003 seasons are registered in Table 7.
Effect of planting dates:
Data recorded in Table 7, clear that foliage fresh weight was significantly affected by
planting dates at 120 and 150 days from planting in the three growing seasons, except at 120 days
from planting in the second season only. The greatest values of foliage fresh weight (657.8, 411.6
and 441.6 g/plant) and (699.2, 518.3 and 554.1 g/plant) were derived from planting beets on 1st
October at 120 and 150 days from planting in the first, second and third seasons, respectively. In
contrast with, the lowest ones (484.9, 393.6 and 371.9 g/plant) and (572.4, 490.7 and 466.9 g/plant)
were gained from cultivation beet plants on 1st November at 120 and 150 days from planting in the
first, second and third seasons, respectively, with the exclusion of the second season at 120 and 150
days from sowing which resulted from planting on 1st September. This increase in foliage fresh
weight when planting on 1st October may be originated from more suitable weather conditions
during this period, which led to encouragement germination, establishment and vegetative growth
of sugar beet. These findings are in good agreement with those confirmed by Badawi (1985),
Badawi et al. (1995) and Kandil et al. (2002 b).
Effect of biofertilization treatments:
As shown in Table 7, foliage fresh weight exposed significant differences among
biofertilization treatments at 120 and 150 days from sowing in the three seasons. Treated soil with
Rhizobacterin fertilizer caused significant increase in foliage fresh weight over other biofertilization
treatments and gave the highest values, which results were 660.0, 437.4 and 427.4 as well as 722.5,
545.1 and 539.3 g/plant at 120 and 150 days from planting in the first, second and third seasons,
respectively. The lowest values in this terms (471.1, 357.0 and 358.9 g/plant) and (524.5, 452.4 and
447.8 g/plant) were achieved when left soil without biofertilization (chick treatment) at 120 and 150
days from planting in the first, second and third seasons, respectively. This increase in foliage fresh
weight by biofertilization treatments may be attributed to its effect upon nitrogen fixation,
enhancing nutrient uptake and excretion some growth substances such as IAA and GA3 which
improve growth and leaf canopy of sugar beet. Similar results were also corresponding by Abo EL-
Goud (2000) and Kandil et al. (2002 b).

46
Table 7: Averages of foliage fresh and dry weight (g/plant) as affected by planting dates, biofertilization treatments, nitrogen and potassium fertilizer levels at 120 and 150 days after planting during 2000/2001, 2001/2002 and 2002/2003 seasons.
Characters Foliage fresh weight (g/plant) Foliage dry weight (g/plant) Seasons 2000/2001 2001/2002 2002/2003 2000/2001 2001/2002 2002/2003 Sampling times (Days After Planting) 120 150 120 150 120 150 120 150 120 150 120 150
A: Planting dates: 1st September - - 393.6 490.7 373.4 485.0 - - 39.13 55.94 37.23 52.69 1st October 657.8 699.2 411.6 518.3 441.6 554.1 58.82 84.36 42.99 53.40 43.69 59.92 1st November 484.9 572.4 395.2 504.6 371.9 466.9 47.65 68.78 38.34 56.09 35.63 50.32 F. test NS * * * * * * * LSD 5%
* * - 14.1 34.3 27.2
* * 0.41 1.76 3.18 2.51
B: Biofertilization treatments: Without 471.1 524.5 357.0 452.4 358.9 447.8 44.73 61.20 35.03 48.76 34.85 47.82 Rhizobacterin 660.0 722.5 437.4 545.1 427.4 539.3 61.25 88.82 44.53 59.96 42.28 58.85 Cerialine 548.5 630.8 390.3 496.2 387.4 498.6 51.48 75.89 39.28 54.23 38.02 53.51 Rhizobacterin + Cerialine 605.8 665.4 415.9 524.4 408.9 522.4 55.49 80.36 41.78 57.64 40.26 57.06
F. test * * * * * * * * * * * * LSD 5% 38.3 35.8 8.9 10.1 6.0 6.9 3.69 3.35 1.33 0.91 0.69 1.00 C: Nitrogen and potassium combination levels: 20 kg N + 24 kg K2O/fad 352.7 394.2 228.0 294.3 221.5 299.4 29.16 40.65 22.52 31.24 21.36 31.74 20 kg N + 48 kg K2O/fad 401.0 448.6 291.6 372.6 291.5 363.4 34.94 48.35 29.91 40.96 29.11 39.79 40 kg N + 24 kg K2O/fad 480.6 536.7 350.7 444.4 349.4 440.3 42.97 60.29 34.65 48.20 33.88 47.24 40 kg N + 48 kg K2O/fad 552.4 602.3 403.4 509.6 399.5 501.9 50.59 70.82 41.54 56.88 40.03 55.33 60 kg N + 24 kg K2O/fad 631.3 703.7 445.3 561.9 435.7 561.4 58.32 83.80 44.61 61.95 42.55 60.39 60 kg N + 48 kg K2O/fad 732.1 817.1 501.7 623.8 498.4 624.8 68.82 100.70 52.31 70.28 50.69 69.67 80 kg N + 24 kg K2O/fad 676.2 753.8 463.7 591.7 457.9 585.9 65.65 97.56 44.46 62.50 43.47 61.78 80 kg N + 48 kg K2O/fad 744.6 830.1 516.6 638.0 510.8 639.0 75.44 110.37 51.23 69.17 49.72 68.55 F. test * * * * * * * * * * * * LSD 5% 16.9 16.7 6.3 6.7 5.6 4.9 2.70 2.60 0.87 1.03 0.66 0.72
47
Effect of nitrogen and potassium combination levels:
Increasing nitrogen fertilizer levels from 20 to 40, 60 and 80 kg N/fad tended to increase
foliage fresh weight from 297.7 to 422.7, 540.8 and 561.6 g/plant as well as from 362.1 to 505.9,
648.8 and 673.6 g/plant at 120 and 150 days from planting as average over seasons, respectively.
This tendency was recorded by EL-Kassaby et al. (1999), Mahasen, Fahmi (1999) and Kandil et al.
(2000 b).
Increasing potassium fertilizer levels from 24 to 48 kg K2O/fad tended to increase this trait
from 424.4 to 487.0 g/plant and from 514.0 to 580.9 g/plant at 120 and 150 days from planting as
average during the three seasons. These results were in agreement with those reported by Kandil et
al. (2000 a).
With connection the effect of nitrogen and potassium combination levels on foliage fresh
weight, it was apparent that adding nitrogen and potassium fertilizers markedly increased foliage
fresh weight at 120 and 150 days after sowing in the three seasons as shown in Table 7. Application
of 80 kg N + 48 kg K2O/fad recorded maximum foliage fresh weight, where its increased this
character by 111.11, 126.57 and 130.60 % as well as 110.57, 116.78 and 113.42 % over application
of 20 kg N + 24 kg K2O/fad at 120 and 150 days from planting in the first, second and third
seasons, respectively. It was followed by application of 60 kg N + 48 kg K2O/fad at the very least
differences in foliage fresh weight at both samples in all growing seasons. Such increase in foliage
fresh weight may be due to the role of nitrogen and potassium in leaf initiation, increment
chlorophyll concentration in leaves and photosynthesis process, which led to improve growth and
leaf canopy.
Effect of interactions:
In the three growing seasons, the interaction between planting dates X nitrogen and
potassium combination levels showed significant effect on foliage fresh weight at 120 and 150 days
from planting (Table 8). The highest averages of this trait (860.8, 520.6 and 568.6 g/plant as well as
900.8, 654.6 and 695.1 g/plant) were obtained when planting on 1st October and application of 80
kg N + 48 kg K2O/fad at 120 and 150 days from planting in the first, second and third seasons,
respectively. Similar conclusion supported by Kandil et al. (2002 b).
The interaction between biofertilization treatment X nitrogen and potassium combination
levels was significant in the three seasons of study (Table 9 and 10). The highest values of foliage
fresh weight (848.3, 557.4 and 556.0 g/plant and 926.8, 691.0 and 686.4 g/plant) were resulted from
application of Rhizobacterin accompanied with 80 kg N + 48 kg K2O/fad at 120 and 150 days from
planting in the first, second and third seasons, respectively. Meanwhile, inoculation soil by
Rhizobacterin and fertilizing with 60 kg N + 48 kg K2O/fad produced the best results after formerly
treatmentin all seasons.
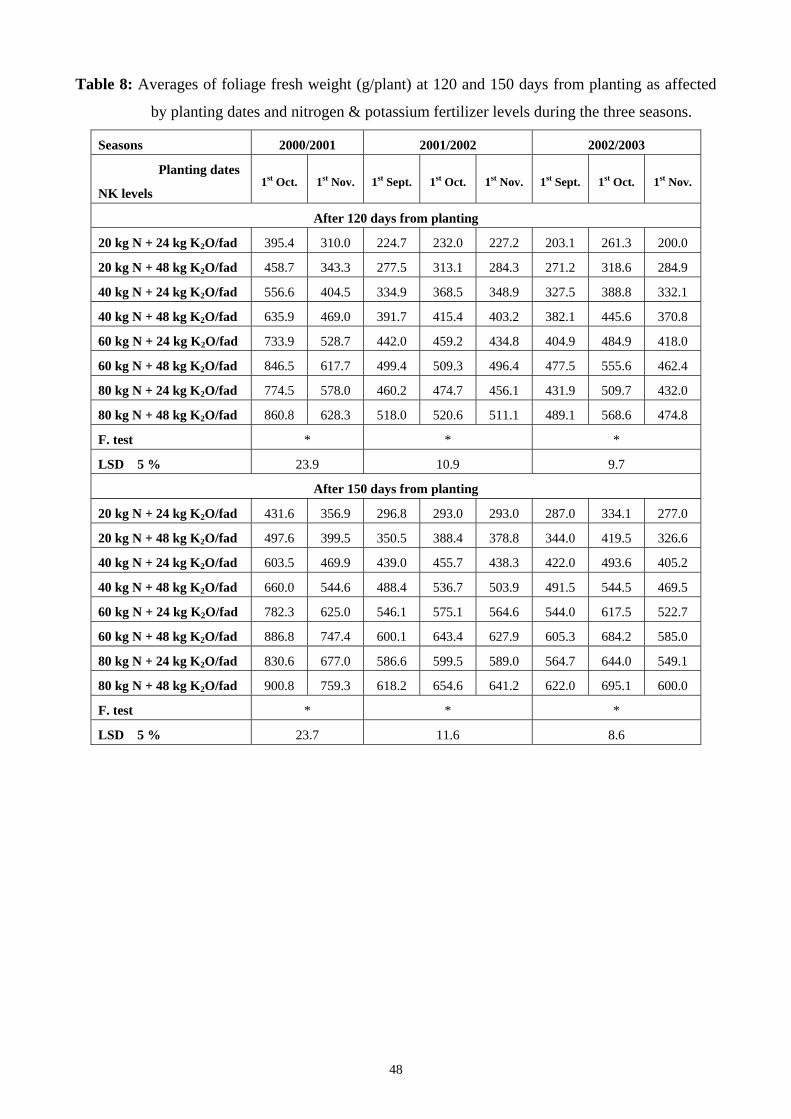
48
Table 8: Averages of foliage fresh weight (g/plant) at 120 and 150 days from planting as affected
by planting dates and nitrogen & potassium fertilizer levels during the three seasons.
Seasons 2000/2001 2001/2002 2002/2003
Planting dates
NK levels 1st Oct. 1st Nov. 1st Sept. 1st Oct. 1st Nov. 1st Sept. 1st Oct. 1st Nov.
After 120 days from planting
20 kg N + 24 kg K2O/fad 395.4 310.0 224.7 232.0 227.2 203.1 261.3 200.0
20 kg N + 48 kg K2O/fad 458.7 343.3 277.5 313.1 284.3 271.2 318.6 284.9
40 kg N + 24 kg K2O/fad 556.6 404.5 334.9 368.5 348.9 327.5 388.8 332.1
40 kg N + 48 kg K2O/fad 635.9 469.0 391.7 415.4 403.2 382.1 445.6 370.8
60 kg N + 24 kg K2O/fad 733.9 528.7 442.0 459.2 434.8 404.9 484.9 418.0
60 kg N + 48 kg K2O/fad 846.5 617.7 499.4 509.3 496.4 477.5 555.6 462.4
80 kg N + 24 kg K2O/fad 774.5 578.0 460.2 474.7 456.1 431.9 509.7 432.0
80 kg N + 48 kg K2O/fad 860.8 628.3 518.0 520.6 511.1 489.1 568.6 474.8
F. test * * *
LSD 5 % 23.9 10.9 9.7
After 150 days from planting
20 kg N + 24 kg K2O/fad 431.6 356.9 296.8 293.0 293.0 287.0 334.1 277.0
20 kg N + 48 kg K2O/fad 497.6 399.5 350.5 388.4 378.8 344.0 419.5 326.6
40 kg N + 24 kg K2O/fad 603.5 469.9 439.0 455.7 438.3 422.0 493.6 405.2
40 kg N + 48 kg K2O/fad 660.0 544.6 488.4 536.7 503.9 491.5 544.5 469.5
60 kg N + 24 kg K2O/fad 782.3 625.0 546.1 575.1 564.6 544.0 617.5 522.7
60 kg N + 48 kg K2O/fad 886.8 747.4 600.1 643.4 627.9 605.3 684.2 585.0
80 kg N + 24 kg K2O/fad 830.6 677.0 586.6 599.5 589.0 564.7 644.0 549.1
80 kg N + 48 kg K2O/fad 900.8 759.3 618.2 654.6 641.2 622.0 695.1 600.0
F. test * * *
LSD 5 % 23.7 11.6 8.6

49
Table 9: Averages of foliage fresh weight (g/plant) at 120 days from planting as affected by biofertilization treatments and nitrogen & potassium fertilizer levels during the three seasons.
Biofertilization treatments NK levels
Without Rhizobacterin Cerialine Rhizobacterin + Cerialine
2000/2001 20 kg N + 24 kg K2O/fad 286.6 418.3 328.3 377.5 20 kg N + 48 kg K2O/fad 340.0 452.5 375.0 436.6 40 kg N + 24 kg K2O/fad 413.3 559.1 434.1 515.8 40 kg N + 48 kg K2O/fad 452.6 654.6 511.6 590.8 60 kg N + 24 kg K2O/fad 518.6 730.0 610.8 665.8 60 kg N + 48 kg K2O/fad 599.3 837.6 724.1 767.3 80 kg N + 24 kg K2O/fad 550.0 779.6 664.0 711.3 80 kg N + 48 kg K2O/fad 608.3 848.3 740.0 781.6 F. test * LSD 5 % 33.9
2001/2002 20 kg N + 24 kg K2O/fad 192.5 257.6 221.0 240.7 20 kg N + 48 kg K2O/fad 252.6 322.5 286.5 305.0 40 kg N + 24 kg K2O/fad 312.0 385.4 346.3 359.3 40 kg N + 48 kg K2O/fad 360.4 438.8 390.5 424.0 60 kg N + 24 kg K2O/fad 396.6 484.6 435.4 464.7 60 kg N + 48 kg K2O/fad 454.4 550.4 487.0 515.0 80 kg N + 24 kg K2O/fad 419.7 502.5 449.8 482.6 80 kg N + 48 kg K2O/fad 467.5 557.4 505.8 535.6 F. test * LSD 5 % 12.6
2002/2003 20 kg N + 24 kg K2O/fad 200.7 242.4 213.1 229.6 20 kg N + 48 kg K2O/fad 269.8 305.7 287.3 303.3 40 kg N + 24 kg K2O/fad 321.1 372.7 345.0 359.0 40 kg N + 48 kg K2O/fad 361.7 419.0 395.2 422.2 60 kg N + 24 kg K2O/fad 389.6 475.2 431.0 448.0 60 kg N + 48 kg K2O/fad 449.4 544.2 485.2 515.0 80 kg N + 24 kg K2O/fad 416.1 504.0 444.6 466.8 80 kg N + 48 kg K2O/fad 462.6 556.0 497.6 527.2 F. test * LSD 5 % 11.2
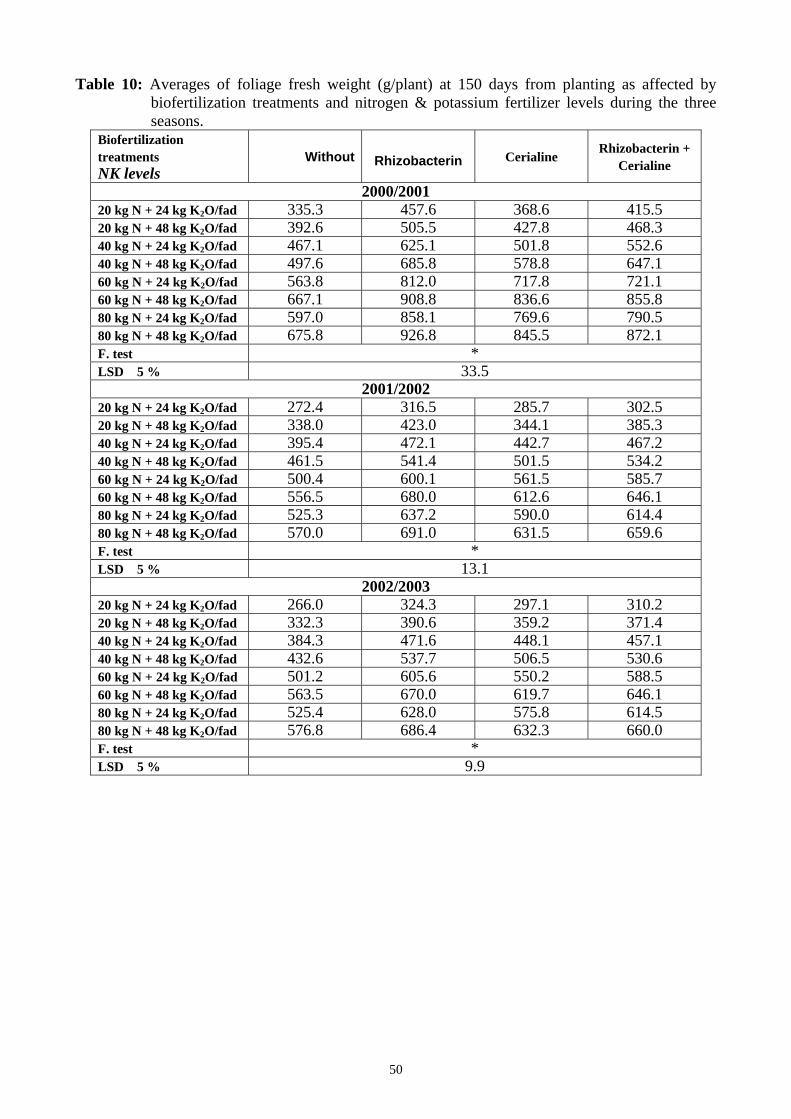
50
Table 10: Averages of foliage fresh weight (g/plant) at 150 days from planting as affected by biofertilization treatments and nitrogen & potassium fertilizer levels during the three seasons.
Biofertilization treatments NK levels
Without Rhizobacterin Cerialine Rhizobacterin + Cerialine
2000/2001 20 kg N + 24 kg K2O/fad 335.3 457.6 368.6 415.5 20 kg N + 48 kg K2O/fad 392.6 505.5 427.8 468.3 40 kg N + 24 kg K2O/fad 467.1 625.1 501.8 552.6 40 kg N + 48 kg K2O/fad 497.6 685.8 578.8 647.1 60 kg N + 24 kg K2O/fad 563.8 812.0 717.8 721.1 60 kg N + 48 kg K2O/fad 667.1 908.8 836.6 855.8 80 kg N + 24 kg K2O/fad 597.0 858.1 769.6 790.5 80 kg N + 48 kg K2O/fad 675.8 926.8 845.5 872.1 F. test * LSD 5 % 33.5
2001/2002 20 kg N + 24 kg K2O/fad 272.4 316.5 285.7 302.5 20 kg N + 48 kg K2O/fad 338.0 423.0 344.1 385.3 40 kg N + 24 kg K2O/fad 395.4 472.1 442.7 467.2 40 kg N + 48 kg K2O/fad 461.5 541.4 501.5 534.2 60 kg N + 24 kg K2O/fad 500.4 600.1 561.5 585.7 60 kg N + 48 kg K2O/fad 556.5 680.0 612.6 646.1 80 kg N + 24 kg K2O/fad 525.3 637.2 590.0 614.4 80 kg N + 48 kg K2O/fad 570.0 691.0 631.5 659.6 F. test * LSD 5 % 13.1
2002/2003 20 kg N + 24 kg K2O/fad 266.0 324.3 297.1 310.2 20 kg N + 48 kg K2O/fad 332.3 390.6 359.2 371.4 40 kg N + 24 kg K2O/fad 384.3 471.6 448.1 457.1 40 kg N + 48 kg K2O/fad 432.6 537.7 506.5 530.6 60 kg N + 24 kg K2O/fad 501.2 605.6 550.2 588.5 60 kg N + 48 kg K2O/fad 563.5 670.0 619.7 646.1 80 kg N + 24 kg K2O/fad 525.4 628.0 575.8 614.5 80 kg N + 48 kg K2O/fad 576.8 686.4 632.3 660.0 F. test * LSD 5 % 9.9
51
1.4- Foliage dry weight (g/plant):
Means of foliage dry weight (g/plant) in response to planting dates, biofertilization
treatments, nitrogen and potassium fertilizer levels at 120 and 150 days from planting in the three
growing seasons are presented in Table 7.
Effect of planting dates:
Planting dates had a significant effect on foliage dry weight at 120 and 150 days from
planting in all growing seasons (Table 7). The highest values of this character (58.82, 42.99 and
43.69 g/plant) and (84.36, 56.09 and 59.92 g/plant) were resulted from planting beets on 1st
October at 120 and 150 days from planting in the first, second and third seasons, respectively, with
exception in the second season at 150 days from sowing which resulted from planting on 1st
November. In spite of, planting on 1st November associated with the lowest values of foliage dry
weight (47.65, 38.34 and 35.63 g/plant) and (68.78, 53.40 and 50.32 g/plant) at 120 and 150 days
from planting in the first, second and third seasons, respectively, excluding in the second season at
150 days after planting. The stimulatory effect on foliage dry weight observed in this trait due to
planting dates may be attributed to the suitable weather condition during vegetative growth, which
contributed to good foliage growth and formation ample canopy able to make best photosynthesis,
hence increase dry matter accumulation. Many investigation i.e. Badawi (1985) and Kandil et al.
(2002 b) stated similar observations.
Effect of biofertilization treatments:
Foliage dry weight was significantly affected by biofertilization treatments at 120 and 150
days from sowing in the three seasons (Table 7). Inoculation soil after seedlings by Rhizobacterin
was accompanied with maximum average means of foliage dry weight. The corresponding values
with related to antecedent treatment were 61.25, 44.53 and 42.28 g/plant as well as 88.82, 59.96 and
58.85 g/plant at 120 and 150 days from planting in the first, second and third seasons, respectively.
Noteworthy, application of Rhizobacterin + Cerialine treatment came in the second rank after
Rhizobacterin treatment with light differences. The lowest values of this trait (44.73, 35.03 and
34.85 g/plant) and (61.20, 48.76 and 47.82 g/plant) were recorded for the control treatment (without
biofertilization) at 120 and 150 days from planting in the first, second and third seasons,
respectively. This increase in foliage dry weight in this case may be due to same reason for
increasing root and foliage fresh weight as formerly mentioned. These results are sustainable with
the previously obtained by Mrkovack et al. (1997), Mezei et al. (1998), Abo EL-Goud (2000) and
Kandil et al. (2002 b).
Effect of nitrogen and potassium combination levels:
From data shown in Table 7, increasing nitrogen fertilizer levels from 20 to 40, 60 and 80 kg
N/fad tended to increase foliage dry weight, where its values were 27.81, 40.62, 52.95 and 55.01
52
g/plant as well as 38.84, 56.62, 74.53 and 78.33 g/plant as average in the three growing seasons at
120 and 150 days from planting, respectively. Increasing nitrogen levels from 60 to 80 kg N/fad
caused light increase as compared with other increases in nitrogen levels. EL-Kassaby et al. (1999),
Mahasen, Fahmi (1999), EL-Zayat (2000) and Kandil et al. (2000 b) supported these results.
Increasing potassium fertilizer levels from 24 to 48 kg K2O/fad tended to increase foliage
dry weight from 40.32 to 47.95 g/plant and from 57.82 to 66.74 g/plant at 120 and 150 days from
planting as average over seasons, respectively. EL-Zayat (2000) supported this trend.
Nitrogen and potassium combination levels significantly affected foliage dry weight at 120
and 150 days after sowing in the three seasons of study (Table 7). Maximum means of this character
(75.44 and 110.37 g/plant) obtained from application of 80 kg N + 48 kg K2O/fad at 120 and 150
days from planting in the first season, respectively. Whilst, in the second and third seasons the
highest values (52.31 and 50.69 g/plant and 70.28 and 69.67) associated with application of 60 kg N
+ 48 kg K2O/fad at 120 and 150 days after sowing, respectively. At all samples in all growing
seasons, the differences between application of 60 kg N + 48 kg K2O/fad or 80 kg N + 48 kg
K2O/fad were negligible as compared other differences among applications. The lowest values in
this term (29.16, 22.52 and 21.36 g/plant) and (40.65, 31.24 and 31.74 g/plant) were produced from
application of 20 kg N + 24 kg K2O/fad at 120 and 150 days from planting in the first, second and
third seasons, respectively. The increase in foliage dry weight with the increase in nitrogen and
potassium combination levels may be attributed to the role of it in stimulatory foliage growth,
increase in chlorophyll content and causing canopy regeneration to continue late into the season and
directs photosynthates into top production rather than root storage.
1.5- Leaf area index (LAI):
Means of leaf area index (LAI) in response to planting dates, biofertilization treatments,
nitrogen and potassium fertilizer levels at 120 and 150 days from planting during 2000/2001,
2001/2002 and 2002/2003 seasons are marked down in Table 11.
Effect of planting dates:
The effect of planting dates on LAI was significant at 150 days from planting in the first
season and also at 120 and 150 days from planting in the third season only (Table 11). As seen from
obtained results, planting beets on 1st October achieved maximum increase in LAI (3.64, 2.25 and
2.17) and (5.23, 2.86 and 2.91) at 120 and 150 days from planting in the first, second and third
seasons, respectively, excepting in the second season at 150 days after sowing that resulted from
planting on 1st September. On contrary of that, the lowest means of LAI (3.42, 2.15 and 1.83) and
(4.58, 2.77 and 2.31) were produced due to planting beets on 1st November at 120 and 150 days
from planting in the first, second and third seasons, respectively. The increase in LAI due to
planting during 1st October might be ascribed to more suitable weather condition i.e. temperature,
53
day length, and light intensity which allow to better establishment and vegetative growth, hence
formation good canopy capable to increase photosynthesis process. These findings are coincidence
with those of Badawi et al. (1995), Ghonema (1998) and Kandil et al. (2002 b).
Effect of biofertilization treatments:
Regarding the effect of biofertilization treatments on LAI, it was significant at 120
and 150 days from sowing in the three seasons of study (Table 11). It is quite clear that
Rhizobacterin treatment induced the greatest means of LAI. The corresponding values of
aforementioned treatment were 3.96, 2.47 and 2.13 as well as 5.61, 3.00 and 2.74 at 120 and 150
days from planting in the first, second and third seasons, respectively. It was followed by
inoculation soil with Rhizobacterin + Cerialine treatment (with minimum differences between
them), Cerialine treatment. At last, control treatment (without biofertilization) gave minimum
values of LAI at two samples over all growing seasons. The increase in LAI as a result of
biofertilization treatments may be referred to their effect on nitrogen fixation and the uptake of
nutrients, hence increased sugar beet growth and development. These findings are in fully
accordance with results of Sultan et al. (1999), Abo EL-Goud (2000) and Kandil et al. (2000 b).
Effect of nitrogen and potassium combination levels:
Regarding the effect of nitrogen fertilizer levels only, increasing nitrogen fertilizer levels
from 20 to 40, 60 and 80 kg N/fad tended to increase LAI from 1.76 to 2.42, 3.01 and 3.08 as well
as from 2.32 to 3.18, 4.02 and 4.25 as average over three seasons at 120 and 150 days from sowing,
respectively. This trend is in good compatible with those stated by EL-Kassaby et al. (1999),
Mahasen, Fahmi (1999), EL-Zayat (2000) and Kandil et al. (2000 b).
Increasing potassium fertilizer levels from 24 to 48 kg K2O/fad tended to increase LAI from
2.43 to 2.70 and from 3.20 to 3.60 at 120 and 150 days from planting as average in the three
seasons. EL-Zayat (2000), EL-Harriri and Mirvat, Gobarh (2001) and Kandil et al. (2000 a)
confirmed this tendency.
With referred to the effect of nitrogen and potassium combination levels on LAI, it was
significant at two samples in all seasons of this work (Table 11). It can be consider that the highest
values of LAI (4.37 and 6.25) were recorded when application of 60 kg N + 48 kg K2O/fad in the
first season at 120 and 150 days from planting, respectively. In the second and third seasons, the
highest LAI values (2.70 and 2.59 as well as 3.60 and 3.42) were resulted from application of 80
kg N + 48 kg K2O /fad at 120 and 150 days from planting, respectively. It was worthy to
mentioned that the differences between applying of 60 kg N + 48 kg K2O/fad or 80 kg N + 48 kg
K2O/fad were lesser than others among nitrogen and potassium applications at both samples in all
seasons of this research. Such increase in this trait may be returned to the role of nitrogen and
potassium in increasing number of leaves and blade width per plant. In other words nitrogen and
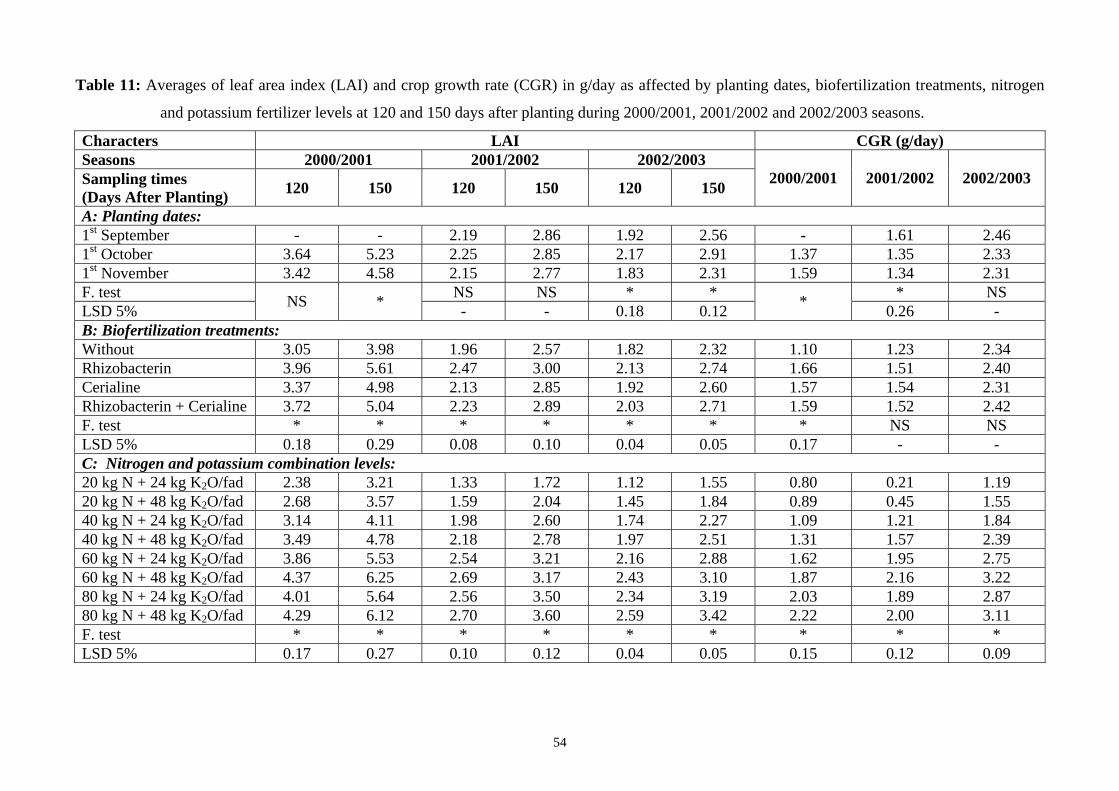
54
Table 11: Averages of leaf area index (LAI) and crop growth rate (CGR) in g/day as affected by planting dates, biofertilization treatments, nitrogen
and potassium fertilizer levels at 120 and 150 days after planting during 2000/2001, 2001/2002 and 2002/2003 seasons.
Characters LAI CGR (g/day) Seasons 2000/2001 2001/2002 2002/2003 Sampling times (Days After Planting) 120 150 120 150 120 150 2000/2001 2001/2002 2002/2003
A: Planting dates: 1st September - - 2.19 2.86 1.92 2.56 - 1.61 2.46 1st October 3.64 5.23 2.25 2.85 2.17 2.91 1.37 1.35 2.33 1st November 3.42 4.58 2.15 2.77 1.83 2.31 1.59 1.34 2.31 F. test NS NS * * * NS LSD 5% NS * - - 0.18 0.12 * 0.26 - B: Biofertilization treatments: Without 3.05 3.98 1.96 2.57 1.82 2.32 1.10 1.23 2.34 Rhizobacterin 3.96 5.61 2.47 3.00 2.13 2.74 1.66 1.51 2.40 Cerialine 3.37 4.98 2.13 2.85 1.92 2.60 1.57 1.54 2.31 Rhizobacterin + Cerialine 3.72 5.04 2.23 2.89 2.03 2.71 1.59 1.52 2.42 F. test * * * * * * * NS NS LSD 5% 0.18 0.29 0.08 0.10 0.04 0.05 0.17 - - C: Nitrogen and potassium combination levels: 20 kg N + 24 kg K2O/fad 2.38 3.21 1.33 1.72 1.12 1.55 0.80 0.21 1.19 20 kg N + 48 kg K2O/fad 2.68 3.57 1.59 2.04 1.45 1.84 0.89 0.45 1.55 40 kg N + 24 kg K2O/fad 3.14 4.11 1.98 2.60 1.74 2.27 1.09 1.21 1.84 40 kg N + 48 kg K2O/fad 3.49 4.78 2.18 2.78 1.97 2.51 1.31 1.57 2.39 60 kg N + 24 kg K2O/fad 3.86 5.53 2.54 3.21 2.16 2.88 1.62 1.95 2.75 60 kg N + 48 kg K2O/fad 4.37 6.25 2.69 3.17 2.43 3.10 1.87 2.16 3.22 80 kg N + 24 kg K2O/fad 4.01 5.64 2.56 3.50 2.34 3.19 2.03 1.89 2.87 80 kg N + 48 kg K2O/fad 4.29 6.12 2.70 3.60 2.59 3.42 2.22 2.00 3.11 F. test * * * * * * * * * LSD 5% 0.17 0.27 0.10 0.12 0.04 0.05 0.15 0.12 0.09
55
potassium fertilizers certainly stimulating growth and increasing leaf area per plant. The
aforementioned results generally are in good agreement with those stated by Sarhan (1998) and EL-
Harriri and Mirvat, Gobarh (2001).
Effect of interactions:
In the first and third seasons only, the interaction between planting dates X nitrogen and
potassium combination levels showed significant effect on LAI at both samples (Table 12). The
highest averages of LAI (4.46 and 2.91 as well as 6.56 and 3.90 in the first and third seasons at 120
and 150 days from planting, respectively) were obtained when planting on 1st October and
application of 60 kg N + 48 kg K2O/fad in the first season or application of 80 kg N + 48 kg
K2O/fad in the third season. Similar results supported by Kandil et al. (2002 b).
The interaction between biofertilization X nitrogen and potassium combination levels was
significant in the first and third seasons (Table 13 and 14). The highest values of LAI (5.04 and 2.87
as well as 7.12 and 3.65) were produced from application of Rhizobacterin + 60 kg N + 48 kg
K2O/fad in the first season at 120 and 150 days from sowing or application 80 kg N + 48 kg
K2O/fad in third season at 120 and 150 days after planting, respectively.
1.6- Crop growth rate (CGR) in g/day:
Means of crop growth rate (CGR) as affected by planting dates, biofertilization treatments,
nitrogen and potassium fertilizer levels at the period of 120 to 150 days from planting during the
three growing seasons are showed in Table 11.
Effect of planting dates:
Crop growth rate (CGR) was significantly affected by planting dates in the first and second
seasons only (Table 11). Planting beets on 1st September resulted in the highest means of CGR
(1.61 and 2.46 g/day) in the second and third seasons, respectively, while in the first season it was
(1.59 g/day) resulted from planting on 1st November. It must be noticed that the differences between
planting of 1st October or 1st November did not reached the level of significance in the three seasons
. Similar results were illustrated by Kandil et al. (2002 b).
Effect of biofertilization treatments:
Data in Table 11 excreted that biofertilization treatments had a significant effect on crop
growth rate (CGR) in the first season only, conversely in the second and third seasons. As seems to
appear from data in Table 11, there were not indubitable trend with respect to response of CGR to
biofertilization treatments, considering the maximum values (1.66, 1.54 and 2.42 g/day) were
obtained from Rhizobacterin treatment in the first season, but from Cerialine treatment in the
second season and from Rhizobacterin + Cerialine treatment in the third season, respectively.
Generally, biofertilization treatments exhibited slight improvement in CGR in all planting dates in
the three seasons over than control treatment. This effect of biofertilization treatment on enhancing
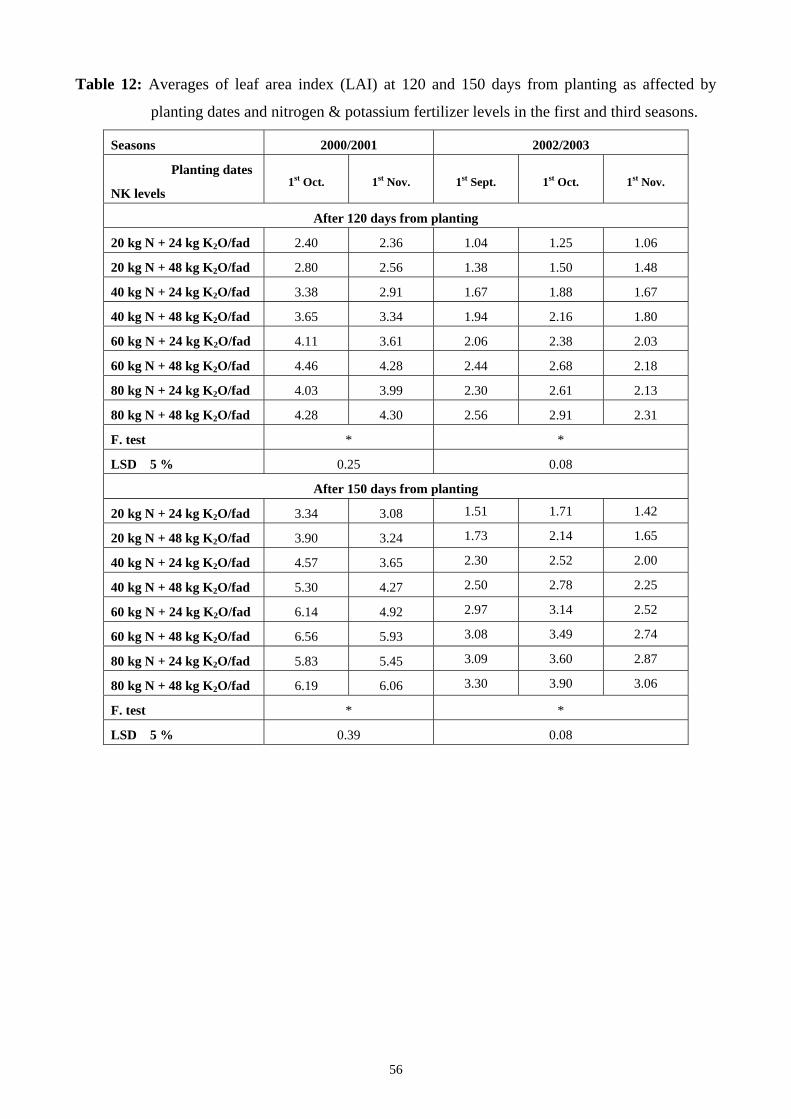
56
Table 12: Averages of leaf area index (LAI) at 120 and 150 days from planting as affected by
planting dates and nitrogen & potassium fertilizer levels in the first and third seasons.
Seasons 2000/2001 2002/2003
Planting dates
NK levels 1st Oct. 1st Nov. 1st Sept. 1st Oct. 1st Nov.
After 120 days from planting
20 kg N + 24 kg K2O/fad 2.40 2.36 1.04 1.25 1.06
20 kg N + 48 kg K2O/fad 2.80 2.56 1.38 1.50 1.48
40 kg N + 24 kg K2O/fad 3.38 2.91 1.67 1.88 1.67
40 kg N + 48 kg K2O/fad 3.65 3.34 1.94 2.16 1.80
60 kg N + 24 kg K2O/fad 4.11 3.61 2.06 2.38 2.03
60 kg N + 48 kg K2O/fad 4.46 4.28 2.44 2.68 2.18
80 kg N + 24 kg K2O/fad 4.03 3.99 2.30 2.61 2.13
80 kg N + 48 kg K2O/fad 4.28 4.30 2.56 2.91 2.31
F. test * *
LSD 5 % 0.25 0.08
After 150 days from planting
20 kg N + 24 kg K2O/fad 3.34 3.08 1.51 1.71 1.42
20 kg N + 48 kg K2O/fad 3.90 3.24 1.73 2.14 1.65
40 kg N + 24 kg K2O/fad 4.57 3.65 2.30 2.52 2.00
40 kg N + 48 kg K2O/fad 5.30 4.27 2.50 2.78 2.25
60 kg N + 24 kg K2O/fad 6.14 4.92 2.97 3.14 2.52
60 kg N + 48 kg K2O/fad 6.56 5.93 3.08 3.49 2.74
80 kg N + 24 kg K2O/fad 5.83 5.45 3.09 3.60 2.87
80 kg N + 48 kg K2O/fad 6.19 6.06 3.30 3.90 3.06
F. test * *
LSD 5 % 0.39 0.08

57
Table 13: Averages of leaf area index (LAI) at 120 days from planting as affected by
biofertilization treatments and nitrogen & potassium fertilizer levels in the first and third
seasons.
Biofertilization treatments
NK levels Without Rhizobacterin Cerialine
Rhizobacterin +
Cerialine 2000/2001
20 kg N + 24 kg K2O/fad 2.15 2.60 2.20 2.56 20 kg N + 48 kg K2O/fad 2.53 2.87 2.42 2.89 40 kg N + 24 kg K2O/fad 3.01 3.50 2.75 3.31 40 kg N + 48 kg K2O/fad 3.04 4.07 3.23 3.63 60 kg N + 24 kg K2O/fad 2.94 4.54 3.87 4.08 60 kg N + 48 kg K2O/fad 3.79 5.04 4.21 4.45 80 kg N + 24 kg K2O/fad 3.40 4.51 3.95 4.19 80 kg N + 48 kg K2O/fad 3.57 4.57 4.34 4.68 F. test * LSD 5 % 0.33
2002/2003 20 kg N + 24 kg K2O/fad 1.01 1.24 1.06 1.16 20 kg N + 48 kg K2O/fad 1.38 1.52 1.42 1.48 40 kg N + 24 kg K2O/fad 1.57 1.78 1.78 1.83 40 kg N + 48 kg K2O/fad 1.80 1.99 1.95 2.13 60 kg N + 24 kg K2O/fad 2.02 2.36 2.12 2.12 60 kg N + 48 kg K2O/fad 2.33 2.64 2.32 2.43 80 kg N + 24 kg K2O/fad 2.11 2.65 2.22 2.39 80 kg N + 48 kg K2O/fad 2.33 2.87 2.49 2.67 F. test * LSD 5 % 0.09

58
Table 14: Averages of leaf area index (LAI) at 150 days from planting as affected by
biofertilization treatments and nitrogen & potassium fertilizer levels in the first and third
seasons.
Biofertilization treatments
NK levels Without Rhizobacterin Cerialine
Rhizobacterin +
Cerialine 2000/2001
20 kg N + 24 kg K2O/fad 2.59 3.58 3.11 3.57 20 kg N + 48 kg K2O/fad 3.03 4.03 3.29 3.94 40 kg N + 24 kg K2O/fad 3.38 5.20 3.68 4.19 40 kg N + 48 kg K2O/fad 4.01 5.55 4.59 4.98 60 kg N + 24 kg K2O/fad 4.20 6.37 6.11 5.44 60 kg N + 48 kg K2O/fad 4.97 7.12 6.57 6.32 80 kg N + 24 kg K2O/fad 4.70 6.20 5.86 5.80 80 kg N + 48 kg K2O/fad 4.91 6.86 6.66 6.06 F. test * LSD 5 % 0.53
2002/2003 20 kg N + 24 kg K2O/fad 1.41 1.63 1.51 1.63 20 kg N + 48 kg K2O/fad 1.74 1.92 1.80 1.89 40 kg N + 24 kg K2O/fad 2.03 2.40 2.28 2.38 40 kg N + 48 kg K2O/fad 2.21 2.63 2.53 2.66 60 kg N + 24 kg K2O/fad 2.54 3.09 2.86 3.01 60 kg N + 48 kg K2O/fad 2.73 3.33 3.12 3.24 80 kg N + 24 kg K2O/fad 2.82 3.32 3.23 3.38 80 kg N + 48 kg K2O/fad 2.07 3.65 3.47 3.49 F. test * LSD 5 % 0.10

59
growth of sugar beet plants was expected. These results are in harmony with those supported by
Kandil et al. (2002 b).
Effect of nitrogen and potassium combination levels:
Increasing nitrogen fertilizer levels from 20 to 40, 60 and 80 kg N/fad tended to increase
CGR from 0.85 to 1.57, 2.26 and 2.35 g/day as average during the three seasons, respectively.
Similar results were confirmed by EL-Kassaby et al. (1999), EL-Zayat (2000) and Kandil et al.
(2000 b).
Increasing potassium fertilizer levels from 24 to 48 kg K2O/fad tended to increase CGR
from 1.62 to 1.90 g/day as average in the three seasons, respectively. EL-Zayat (2000) and Kandil et
al. (2000 a) came to similar trend.
Regarding the effect of nitrogen and potassium combination levels on crop growth rate
(CGR), it was significant in the three growing seasons as shown in Table 11. CGR was gradually
increased with each increase in nitrogen and potassium combination levels over planting dates in
the three seasons of this work. Raising nitrogen and potassium combination levels up to 60 kg N +
48 kg K2O/fad produced the maximum values of CGR (2.16 and 3.22 g/day) in the second and third
seasons, respectively. While, in the first season the highest one (2.22 g/day) was resulted from
application of 80 kg N + 48 kg K2O/fad. Moreover, there were insignificant differences between
application of 60 kg N + 48 kg K2O/fad or 80 kg N + 48 kg K2O/fad in the second and third
seasons. The lowest values of CGR (0.80, 0.21 and 1.19 g/day) were derived from application of 20
kg N + 24 kg K2O/fad in the first, second and third seasons, respectively. The increase in CGR due
to raising nitrogen and potassium fertilizer levels may be attributed to its role in increasing dry
matter accumulation in root and foliage as well as LAI as record before.
Effect of interactions:
In the three seasons, the interaction between planting dates X nitrogen and potassium
combination levels exhibited significant effect on CGR (Table 15). The highest averages of this trait
(2.31, 2.34 and 3.48 g/day) were obtained when planting beets on 1st of November and application
80 kg N + 48 kg K2O/fad in the first season and planting on 1st September and application 60 kg N
+ 48 kg K2O/fad in the second and third seasons, respectively.
1.7- Relative growth rate (RGR) in g/g/day:
Data collected in Table 16 display the effect of planting dates, biofertilization treatments,
nitrogen and potassium fertilizer levels on relative growth rate (RGR) during 2000/2001, 2001/2002
and 2002/2003 seasons.
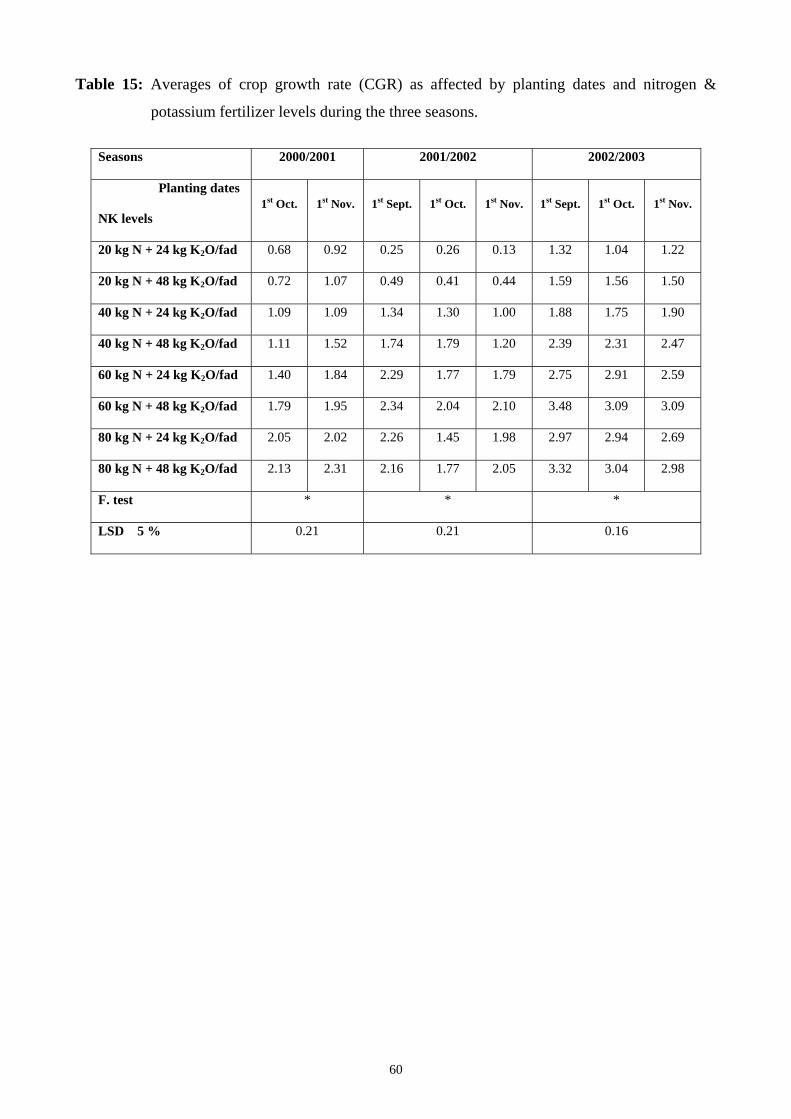
60
Table 15: Averages of crop growth rate (CGR) as affected by planting dates and nitrogen &
potassium fertilizer levels during the three seasons.
Seasons 2000/2001 2001/2002 2002/2003
Planting dates
NK levels 1st Oct. 1st Nov. 1st Sept. 1st Oct. 1st Nov. 1st Sept. 1st Oct. 1st Nov.
20 kg N + 24 kg K2O/fad 0.68 0.92 0.25 0.26 0.13 1.32 1.04 1.22
20 kg N + 48 kg K2O/fad 0.72 1.07 0.49 0.41 0.44 1.59 1.56 1.50
40 kg N + 24 kg K2O/fad 1.09 1.09 1.34 1.30 1.00 1.88 1.75 1.90
40 kg N + 48 kg K2O/fad 1.11 1.52 1.74 1.79 1.20 2.39 2.31 2.47
60 kg N + 24 kg K2O/fad 1.40 1.84 2.29 1.77 1.79 2.75 2.91 2.59
60 kg N + 48 kg K2O/fad 1.79 1.95 2.34 2.04 2.10 3.48 3.09 3.09
80 kg N + 24 kg K2O/fad 2.05 2.02 2.26 1.45 1.98 2.97 2.94 2.69
80 kg N + 48 kg K2O/fad 2.13 2.31 2.16 1.77 2.05 3.32 3.04 2.98
F. test * * *
LSD 5 % 0.21 0.21 0.16
61
Effect of planting dates:
With reference to the effect of planting dates on relative growth rate (RGR), it was
significant in the second and third seasons only (Table 16). The highest values of RGR were
recorded when planting beets on 1st November (0.126 g/g/day) in the first season or planting on 1st
September (0.142 and 0.143 g/g/day) in the second and third seasons, respectively. On contrary of
that, the lowest ones (0.119, 0.129 and 0.139 g/g/day) were registered by planting on 1st October in
the first, second and third seasons, respectively. Similar results were reported by Kandil et al. (2002
b).
Effect of biofertilization treatments:
It is clearly seen that relative growth rate (RGR) was insignificantly affected by
biofertilization treatments through second and third seasons, vise versa in the first season only
(Table 16). A slight increase in this case was found due to biofertilization treatments as compared
with the control treatment (without biofertilization) in all seasons of study. On the whole, there
were insignificant differences among biofertilization treatments over planting dates in the three
seasons. Similar results were supported by Kandil et al. (2002 b).
Effect of nitrogen and potassium combination levels:
When increasing nitrogen fertilizer levels from 20 to 40, 60 and 80 kg N/fad tended to
increase RGR from 0.115 to 0.133, 0.143 and 0.145 g/g/day as average of the three seasons. The
previous tendency is parallel with those stated by Kandil et al. (2000 b).
By increasing potassium fertilizer levels from 24 to 48 kg K2O/fad tended to increase RGR
from 0.132 to 0.136 g/g/day as average over seasons.
It was evident from the data of Table 16 that the application of nitrogen and potassium
combination levels tended to significantly increase relative growth rate (CGR) over the chick
treatment (20 kg N + 24 kg K2O/fad) in the three seasons. The highest averages of CGR (0.139,
0.148 and 0.152 g/g/day) were achieved by application of 80 kg N + 48 kg K2O/fad in the first
season and by application of 60 kg N + 48 kg K2O/fad in the second and third seasons,
respectively. The differences between application of 60 kg N + 48 kg K2O/fad or 80 kg N + 48 kg
K2O/fad failed to reach the level of significance in the second and third seasons. The increase in
RGR due to increase in nitrogen and potassium combination levels may be ascribed to its role in
increasing dry matter accumulation as mentioned formerly.
1.8- Net assimilation rate (NAR) in g/cm2/day:
Data listed in Table 16 clear the effect of planting dates, biofertilization treatments, nitrogen
and potassium fertilizer levels on net assimilation rate (NAR) during the three growing seasons.

62
Table 16: Averages of relative growth rate (RGR) in g/g/day and net assimilation rate (NAR) in
g/cm2/day as affected by planting dates, biofertilization treatments, nitrogen and
potassium fertilizer levels during 2000/2001, 2001/2002 and 2002/2003 seasons.
RGR (g/g/day) NAR (g/cm2/day) Characters
Seasons 2000/2001 2001/2002 2002/2003 2000/2001 2001/2002 2002/2003
A: Planting dates:
1st September - 0.142 0.143 - 3.26 2.98
1st October 0.119 0.129 0.139 3.73 2.73 3.10
1st November 0.126 0.139 0.140 3.38 2.93 2.69
F. test * * * *
LSD 5%
NS
0.004 0.001
NS
0.39 0.30
B: Biofertilization treatments:
Without 0.112 0.137 0.140 2.79 2.86 2.71
Rhizobacterin 0.127 0.137 0.141 4.00 2.80 2.91
Cerialine 0.125 0.137 0.141 3.97 3.13 3.01
Rhizobacterin+Cerialine 0.125 0.137 0.141 3.46 3.10 3.06
F. test * NS NS * * *
LSD 5% 0.005 - - 0.47 0.26 0.15
C: Nitrogen and potassium combination levels: 20 kg N + 24 kg K2O/fad 0.104 0.112 0.121 2.44 2.24 2.28 20 kg N + 48 kg K2O/fad 0.106 0.119 0.130 2.53 2.36 2.36 40 kg N + 24 kg K2O/fad 0.113 0.139 0.142 2.86 2.71 2.56 40 kg N + 48 kg K2O/fad 0.120 0.139 0.142 3.15 2.85 2.78 60 kg N + 24 kg K2O/fad 0.128 0.147 0.147 3.82 3.13 3.18 60 kg N + 48 kg K2O/fad 0.133 0.148 0.152 4.49 3.05 3.27 80 kg N + 24 kg K2O/fad 0.136 0.148 0.148 4.29 3.75 3.42 80 kg N + 48 kg K2O/fad 0.139 0.148 0.151 4.87 3.69 3.55
F. test * * * * * *
LSD 5% 0.004 0.002 0.003 0.51 0.30 0.12
63
Effect of planting dates:
Planting dates of sugar beet adopted to appear a favorable effect on NAR in the second and
third seasons (Table 16). The highest values of NAR (3.73, 3.26 and 3.10 g/cm2/day in the first,
second and third seasons, respectively) were resulted from planting on 1st October in the first and
third season, whilst in the second season it was produced from planting on 1st September. In
reverse, The lowest values of NAR (3.38, 2.73 and 2.69 g/cm2/day in the first, second and third
seasons, respectively) were achieved by planting beets on 1st November in the first and third
seasons and from planting on 1st October in the second season. Similar results were partially agreed
with those reported by Kandil et al.(2002b).
Effect of biofertilization treatments:
Concerning the effect of biofertilization treatments on NAR, it showed a significant role in
the three seasons (Table 16). The biofertilization treatments had a variable trend with respect to
NAR, where the highest values of its (4.00, 3.13 and 3.06 g/cm2/day in the first, second and third
seasons, respectively) were produced due to inoculate soil with Rhizobacterin fertilizer in the first
season, Cerialine fertilizer in the second season and Rhizobacterin + Cerialine treatment in the third
season. In general, biofertilization treatment caused noticeable increase in NAR over control
treatment (without biofertilization). This favorable increase in NAR owing to biofertilization
treatments may be returned to the role of Rhizobacterin and Cerialine in fixing more nitrogen and
producing some growth substances that encourage plant growth and dry matter accumulation. These
results are in stand with those confirmed by Kandil et al. (2002b).
Effect of nitrogen and potassium combination levels:
Obtained results showed that increasing nitrogen fertilizer levels from 20 to 40, 60 and 80
kg N/fad tended to increase NAR from 2.37 to 2.82, 3.49 and 3.93 g/cm2/day as average of the three
seasons, respectively. Similar results were supported by EL-Kassaby et al. (1999) and Kandil et al.
(2000 b).
Increasing potassium fertilizer levels from 24 to 48 kg K2O/fad tended to increase NAR
from 3.06 to 3.25 g/cm2/day as average of the three seasons, respectively.
With respect to the effect of nitrogen and potassium combination levels on NAR, it can be
clearly stated that NAR was significantly affected by this factor in the three seasons (Table 16).
Application of 80 kg N + 48 kg K2O/fad resulted in the highest values of NAR (4.87 and 3.55
g/cm2/day) in the first and third seasons, respectively. While, in the second season the highest mean
(3.75 g/cm2/day) was obtained from application of 80 kg N + 24 kg K2O/fad. On the other side, the
lowest ones (2.44, 2.24 and 2.28 g/cm2/day) were obtained from application of 20 kg N + 24 kg
K2O/fad in the first, second and third seasons, respectively. Such increase in NAR may be reflected
64
to the role of nitrogen and potassium in increasing cell volume, leaf area/plant and consequently
increasing NAR.
2. YIELD COMPONENTS:
2.1- Root fresh weight (g/plant):
Means of root fresh weight (g/plant) at harvesting time as affected by planting dates,
biofertilization treatments, nitrogen and potassium fertilizer levels during 2000/2001, 2001/2002
and 2002/2003 seasons are registered in Table 17.
Effect of planting dates:
As shown from tabulated data in Table 17, root fresh weight was markedly affected as a
result of planting dates during the second and third seasons, but conversely with respect first season.
Planting sugar beet at 1st October exerted significant increase in root fresh weight and gave the
highest values (558.1, 795.9 and 814.8 g/plant) in the first, second and third seasons, respectively.
On contrary, the lowest ones (543.7, 742.3 and 649.2 g/plant in the first, second and third seasons,
respectively) were accompanied with planting on 1st November in the first and third seasons and
on 1st September in the second
season. The favorable effect of planting on 1st October on root fresh weight might be
ascribed to the suitable environmental conditions during this period such as temperature, relative
humidity (Table 2), day length and light intensity which allow to rapid growth and formation good
canopy able to make greatest photosynthesis, consequently increasing dry matter accumulation as
well as root weight/plant. This trend of results is in good agreement with those confirmed by
Badawi (1985), EL-Kassaby and Leilah (1992 b), Badawi et al. (1995), Ghonema (1998), Abd EL-
Gawad et al. (2000), Abdou (2000), and Kandil et al. (2002 c).
Effect of biofertilization treatments:
With connection the effect of biofertilization treatments on root fresh weight, it is seems to
clear that a significant response was found during the three growing seasons (Table 17). It was
worthy to remark that biofertilization treatments caused a significant increase in root fresh weight
over control treatment (without biofertilization) in all seasons of study. Inoculation soil with
Rhizobacterin fertilizer induced the highest means of root fresh weight, which scores were 633.7,
814.1 and 824.2 g/plant over planting dates in the first, second and third seasons, respectively. It
was followed by Rhizobacterin + Cerialine treatment, then Cerialine fertilizer in the three seasons.
This increase in root fresh weight in consequence of applying biofertilizers may be due to nitrogen
fixation, increase the uptake of nutrients and released some growth regulators which stimulating
establishment and vegetative growth, hence increasing root and foliage fresh weight. There many
investigators confirming this conclusion i.e. Favilli et al. (1993), Bassal et al. (2001), Maareg and
Sohir, Badr (2001) and Kandil et al. (2002 c).

65
Table 17: Averages of root and foliage fresh weight (g/plant) as affected by planting dates,
biofertilization treatments, nitrogen and potassium fertilizer levels during 2000/2001,
2001/2002 and 2002/2003 seasons.
Characters Root fresh weight (g/plant) Foliage fresh weight (g/plant)
Seasons 2000/2001 2001/2002 2002/2003 2000/2001 2001/2002 2002/2003
A: Planting dates:1st September - 742.3 779.9 - 251.3 325.0 1st October 558.1 795.9 814.8 491.0 284.4 387.1 1st November 543.7 758.2 649.2 374.2 258.1 348.6 F. test * * * * LSD 5%
NS 14.5 38.5
* 16.7 15.7
B: Biofertilization treatments: Without 462.6 687.9 670.5 372.6 242.1 315.3
Rhizobacterin 633.7 814.1 824.2 492.7 280.5 387.5 Cerialine 530.7 762.4 730.4 411.3 262.0 342.2 Rhizobacterin+Cerialine 576.5 797.4 766.6 453.8 273.9 369.3 F. test * * * * * * LSD 5% 19.7 8.9 9.2 18.4 5.8 5.7 C: Nitrogen and potassium combination levels: 20 kg N + 24 kg K2O/fad 281.3 408.7 408.9 255.7 161.8 235.8 20 kg N + 48 kg K2O/fad 354.4 535.4 529.1 310.6 198.3 271.0 40 kg N + 24 kg K2O/fad 430.2 633.5 647.5 367.9 227.0 314.5 40 kg N + 48 kg K2O/fad 532.7 764.4 745.4 404.5 254.9 349.0 60 kg N + 24 kg K2O/fad 629.9 865.6 843.9 462.2 278.0 378.8 60 kg N + 48 kg K2O/fad 738.8 974.9 954.5 565.1 339.3 433.7 80 kg N + 24 kg K2O/fad 686.7 926.5 882.5 517.3 306.7 398.8 80 kg N + 48 kg K2O/fad 752.9 994.8 971.8 577.5 350.8 447.0 F. test * * * * * * LSD 5% 13.6 7.2 10.1 11.0 3.7 4.9
66
Effect of nitrogen and potassium combination levels:
Increasing nitrogen fertilizer levels from 20 to 40, 60 and 80 kg N/fad tended to increase
root fresh weight from 419.6 to 625.6, 834.2 and 869.2 g/plant as average of the three seasons and
this increase amounted 49.0, 33.4 and 4.2 % between nitrogen levels, respectively. Noteworthy,
increasing nitrogen levels from 60 to 80 kg N/fad caused little increase (4.2 %) in the comparison
with other levels. These results are in line with those obtained by AL-Labbody (1998), Attia et al.
(1999), EL-Hawary (1999), Abd EL-Moneim (2000), Azab et al. (2000), Sohier, Ouda (2001) and
Kandil et al. (2002 c).
Increasing potassium fertilizer levels from 24 to 48 kg K2O/fad tended to increase root fresh
weight from 637.1 to 737.4 as average over seasons. Similar trend was recorded by EL-Moursy et
al. (1998), Sayed et al. (1998), EL-Shafai (2000), Sohier, Ouda (2001) and Kandil et al. (2002 a).
Nitrogen and potassium combination levels exhibited significant effect on root fresh weight
in the three growing seasons (Table 17). A gradual increase was observed in root fresh weight as
reason of increasing nitrogen and potassium combination levels from 20 kg N + 24 kg K2O/fad to
80 kg N + 48 kg K2O/fad in all seasons of this research. The highest values of root fresh weight
(752.9, 994.8 and 971.8 g/plant) were associated with application of 80 kg N + 48 kg K2O/fad in the
first, second and third seasons, respectively. Adversely, the lowest ones were resulted from the
chick treatment (20 kg N + 24 kg K2O/fad), which data were 281.3, 408.7 and 408.9 g/plant in the
first, second and third seasons, respectively. Application of 60 kg N + 48 kg K2O/fad occupied
second rank after application of the highest levels of nitrogen and potassium combination, where
the differences between them were fewer than others among rest combinations. Such effect of
nitrogen and potassium on this characteristic may be returned to its role in building up metabolites
and activation of enzymes that associate with accumulation of carbohydrates, which translated from
leaves to developing roots. The present results are in line with those obtained by Geweifel and Aly
(1996), Sarhan (1998) and EL-Hawary (1999).
Effect of interactions:
In the three seasons, the interaction between planting dates X nitrogen and potassium
combination levels showed significant effect (Table 18). The highest averages of this trait (787.6,
1018.8 and 1053.7 g/plant) were obtained when planting beets on 1st Oct. and application of 80 kg
N + 48 kg K2O/fad in the first, second and third seasons, respectively. While, the lowest ones
(275.7, 384.6 and 361.2 g/plant in the first, second and third seasons, respectively) were resulted
from planting on 1st Oct. in the first, 1st September in the second season or 1st Nov. in the third
season by and application of 20 kg N + 24 kg K2O/fad. Similar conclusion was supported by Kandil
et al. (2002 c).
67
The interaction between biofertilization treatment X nitrogen and potassium combination
levels over planting dates was significant in the three seasons (Table 19). The highest values of
root fresh weight (870.5, 1073.1 and 1059.4 g/plant) were resulted from application of
Rhizobacterin combination with 80 kg N + 48 kg K2O/fad in the first, second and third seasons,
respectively. Meanwhile, inoculation soil by Rhizobacterin and fertilizing with 60 kg N + 48 kg
K2O/fad produced the best results after formerly interaction in all seasons without any significant
differences in the first and third seasons. Kandil et al. (2002 c) and Soha, Khalil (2002) confirming
these results.
2.2- Foliage fresh weight (g/plant):
Data listed in Table 17 reveal the effect of planting dates, biofertilization treatments,
nitrogen and potassium fertilizer levels on foliage fresh weight g/plant during the three growing
seasons.
Effect of planting dates:
With reference to the effect of planting dates on foliage fresh weight, it is apparent that
planting dates markedly affected foliage fresh weight in the three seasons as shown in Table 17.
The highest means of foliage fresh weight (491.0, 284.4 and 387.1 g/plant) were obtained on
account of planting beets on 1st October in the first, second and third seasons, respectively.
However, the lowest ones of this trait (374.2, 251.3 and 325.0 g/plant in the first, second and third
seasons, respectively) were obtained from planting beets on 1st November in the first season and
from 1st September in the second and third seasons. This improving in foliage fresh weight owing to
planting beets on 1st October may be attributed to corresponding environmental conditions in order
to maximum sugar beet growth and development. These results are stated by many workers i.e. by
Badawi (1985), Badawi et al. (1995), Ghonema (1998), Abd EL -Gawad et al. (2000), Abdou
(2000) and Kandil et al. (2002 c).
Effect of biofertilization treatments:
It seems from returns of statistical analysis, there were a significant and positive relationship
between foliage fresh weight and biofertilization treatments in the three seasons (Table 17). It can
be clear seen that foliage fresh weight significantly increased biofertilization treatments
(Rhizobacterin, Cerialine and Rhizobacterin + Syrialin) and the differences among its were high
significant as compared with chick treatment (without biofertilization) in all growing seasons. The
highest averages of foliage fresh weight (492.7, 280.5 and 387.5 g/plant) were achieved by
inoculation soil with Rhizobacterin in the first, second and third seasons, respectively. However, the
lowest ones (372.6, 242.1 and 315.3 g/plant) were reflected from control treatment. The best
biofertilization treatment after Rhizobacterin treatment was application of Rhizobacterin + Cerialine
thereafter Cerialine treatment in the three seasons of study. Obtained results provide evidence that

68
Table 18: Averages of root fresh weight (g/plant) as affected by planting dates and nitrogen &
potassium fertilizer levels during the three seasons.
Seasons 2000/2001 2001/2002 2002/2003
Planting dates
NK levels 1st Oct. 1st Nov. 1st Sept. 1st Oct. 1st Nov. 1st Sept. 1st Oct. 1st Nov.
20 kg N + 24 kg K2O/fad 275.7 287.0 384.6 442.2 399.4 403.0 462.5 361.2
20 kg N + 48 kg K2O/fad 344.2 364.6 520.1 568.5 517.5 524.0 588.3 475.0
40 kg N + 24 kg K2O/fad 412.1 448.3 617.5 688.6 654.6 644.0 724.1 574.6
40 kg N + 48 kg K2O/fad 525.1 540.3 733.5 806.5 753.2 776.0 802.5 657.9
60 kg N + 24 kg K2O/fad 638.8 621.0 831.3 900.6 864.7 913.5 898.3 720.0
60 kg N + 48 kg K2O/fad 772.9 704.6 953.0 1002.0 969.8 1008.1 1036.2 819.1
80 kg N + 24 kg K2O/fad 708.0 665.3 923.5 940.4 915.7 945.6 952.5 749.6
80 kg N + 48 kg K2O/fad 787.6 718.2 975.0 1018.8 990.8 1025.0 1053.7 836.6
F. test * * *
LSD 5 % 19.3 12.6 17.5
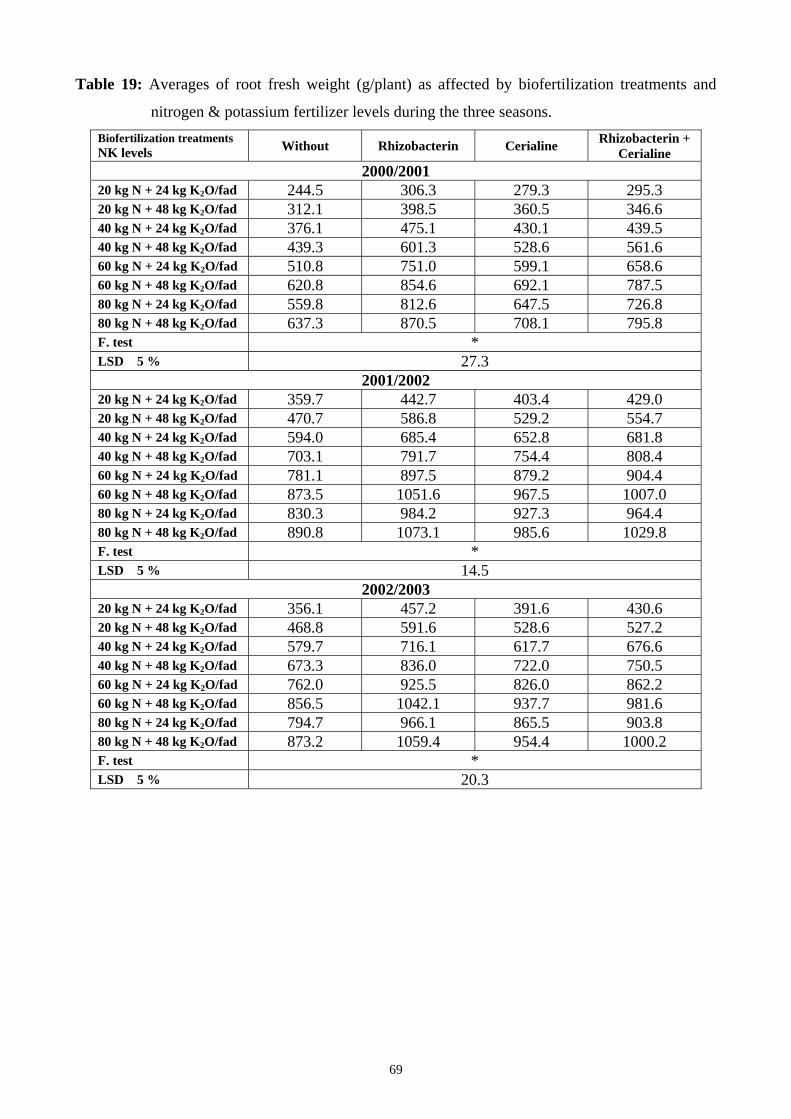
69
Table 19: Averages of root fresh weight (g/plant) as affected by biofertilization treatments and
nitrogen & potassium fertilizer levels during the three seasons. Biofertilization treatments NK levels Without Rhizobacterin Cerialine Rhizobacterin +
Cerialine 2000/2001
20 kg N + 24 kg K2O/fad 244.5 306.3 279.3 295.3 20 kg N + 48 kg K2O/fad 312.1 398.5 360.5 346.6 40 kg N + 24 kg K2O/fad 376.1 475.1 430.1 439.5 40 kg N + 48 kg K2O/fad 439.3 601.3 528.6 561.6 60 kg N + 24 kg K2O/fad 510.8 751.0 599.1 658.6 60 kg N + 48 kg K2O/fad 620.8 854.6 692.1 787.5 80 kg N + 24 kg K2O/fad 559.8 812.6 647.5 726.8 80 kg N + 48 kg K2O/fad 637.3 870.5 708.1 795.8 F. test * LSD 5 % 27.3
2001/2002 20 kg N + 24 kg K2O/fad 359.7 442.7 403.4 429.0 20 kg N + 48 kg K2O/fad 470.7 586.8 529.2 554.7 40 kg N + 24 kg K2O/fad 594.0 685.4 652.8 681.8 40 kg N + 48 kg K2O/fad 703.1 791.7 754.4 808.4 60 kg N + 24 kg K2O/fad 781.1 897.5 879.2 904.4 60 kg N + 48 kg K2O/fad 873.5 1051.6 967.5 1007.0 80 kg N + 24 kg K2O/fad 830.3 984.2 927.3 964.4 80 kg N + 48 kg K2O/fad 890.8 1073.1 985.6 1029.8 F. test * LSD 5 % 14.5
2002/2003 20 kg N + 24 kg K2O/fad 356.1 457.2 391.6 430.6 20 kg N + 48 kg K2O/fad 468.8 591.6 528.6 527.2 40 kg N + 24 kg K2O/fad 579.7 716.1 617.7 676.6 40 kg N + 48 kg K2O/fad 673.3 836.0 722.0 750.5 60 kg N + 24 kg K2O/fad 762.0 925.5 826.0 862.2 60 kg N + 48 kg K2O/fad 856.5 1042.1 937.7 981.6 80 kg N + 24 kg K2O/fad 794.7 966.1 865.5 903.8 80 kg N + 48 kg K2O/fad 873.2 1059.4 954.4 1000.2 F. test * LSD 5 % 20.3
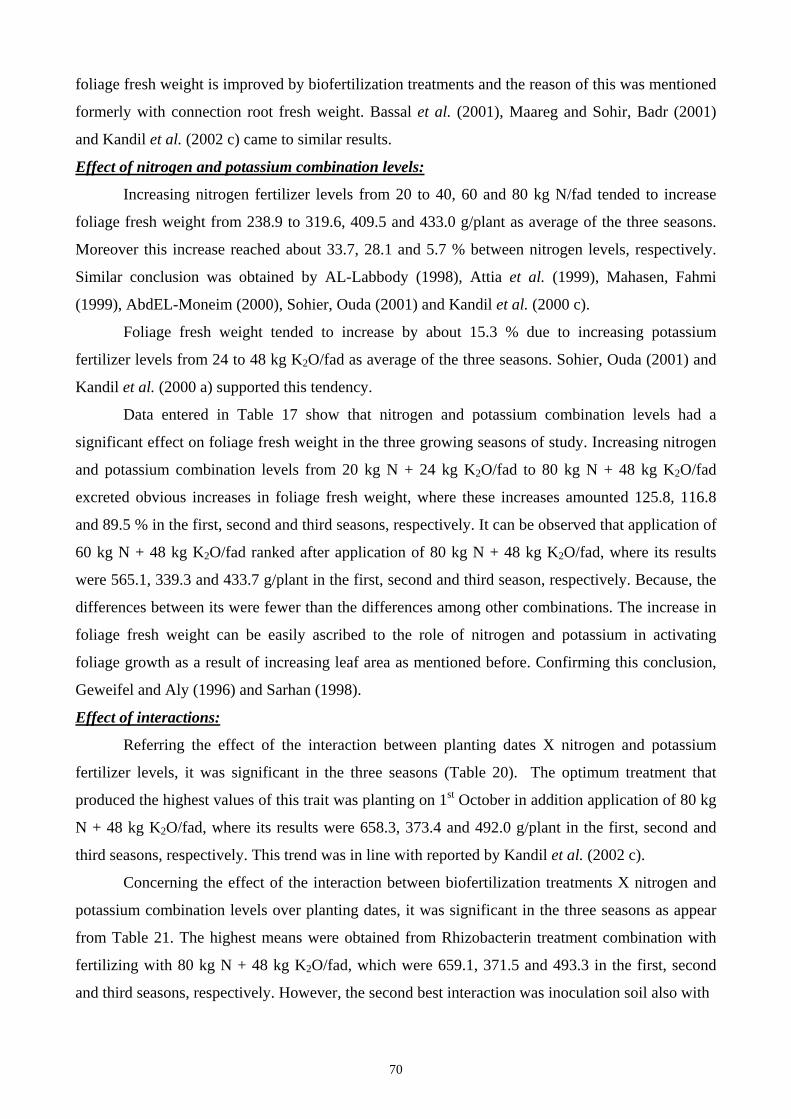
70
foliage fresh weight is improved by biofertilization treatments and the reason of this was mentioned
formerly with connection root fresh weight. Bassal et al. (2001), Maareg and Sohir, Badr (2001)
and Kandil et al. (2002 c) came to similar results.
Effect of nitrogen and potassium combination levels:
Increasing nitrogen fertilizer levels from 20 to 40, 60 and 80 kg N/fad tended to increase
foliage fresh weight from 238.9 to 319.6, 409.5 and 433.0 g/plant as average of the three seasons.
Moreover this increase reached about 33.7, 28.1 and 5.7 % between nitrogen levels, respectively.
Similar conclusion was obtained by AL-Labbody (1998), Attia et al. (1999), Mahasen, Fahmi
(1999), AbdEL-Moneim (2000), Sohier, Ouda (2001) and Kandil et al. (2000 c).
Foliage fresh weight tended to increase by about 15.3 % due to increasing potassium
fertilizer levels from 24 to 48 kg K2O/fad as average of the three seasons. Sohier, Ouda (2001) and
Kandil et al. (2000 a) supported this tendency.
Data entered in Table 17 show that nitrogen and potassium combination levels had a
significant effect on foliage fresh weight in the three growing seasons of study. Increasing nitrogen
and potassium combination levels from 20 kg N + 24 kg K2O/fad to 80 kg N + 48 kg K2O/fad
excreted obvious increases in foliage fresh weight, where these increases amounted 125.8, 116.8
and 89.5 % in the first, second and third seasons, respectively. It can be observed that application of
60 kg N + 48 kg K2O/fad ranked after application of 80 kg N + 48 kg K2O/fad, where its results
were 565.1, 339.3 and 433.7 g/plant in the first, second and third season, respectively. Because, the
differences between its were fewer than the differences among other combinations. The increase in
foliage fresh weight can be easily ascribed to the role of nitrogen and potassium in activating
foliage growth as a result of increasing leaf area as mentioned before. Confirming this conclusion,
Geweifel and Aly (1996) and Sarhan (1998).
Effect of interactions:
Referring the effect of the interaction between planting dates X nitrogen and potassium
fertilizer levels, it was significant in the three seasons (Table 20). The optimum treatment that
produced the highest values of this trait was planting on 1st October in addition application of 80 kg
N + 48 kg K2O/fad, where its results were 658.3, 373.4 and 492.0 g/plant in the first, second and
third seasons, respectively. This trend was in line with reported by Kandil et al. (2002 c).
Concerning the effect of the interaction between biofertilization treatments X nitrogen and
potassium combination levels over planting dates, it was significant in the three seasons as appear
from Table 21. The highest means were obtained from Rhizobacterin treatment combination with
fertilizing with 80 kg N + 48 kg K2O/fad, which were 659.1, 371.5 and 493.3 in the first, second
and third seasons, respectively. However, the second best interaction was inoculation soil also with
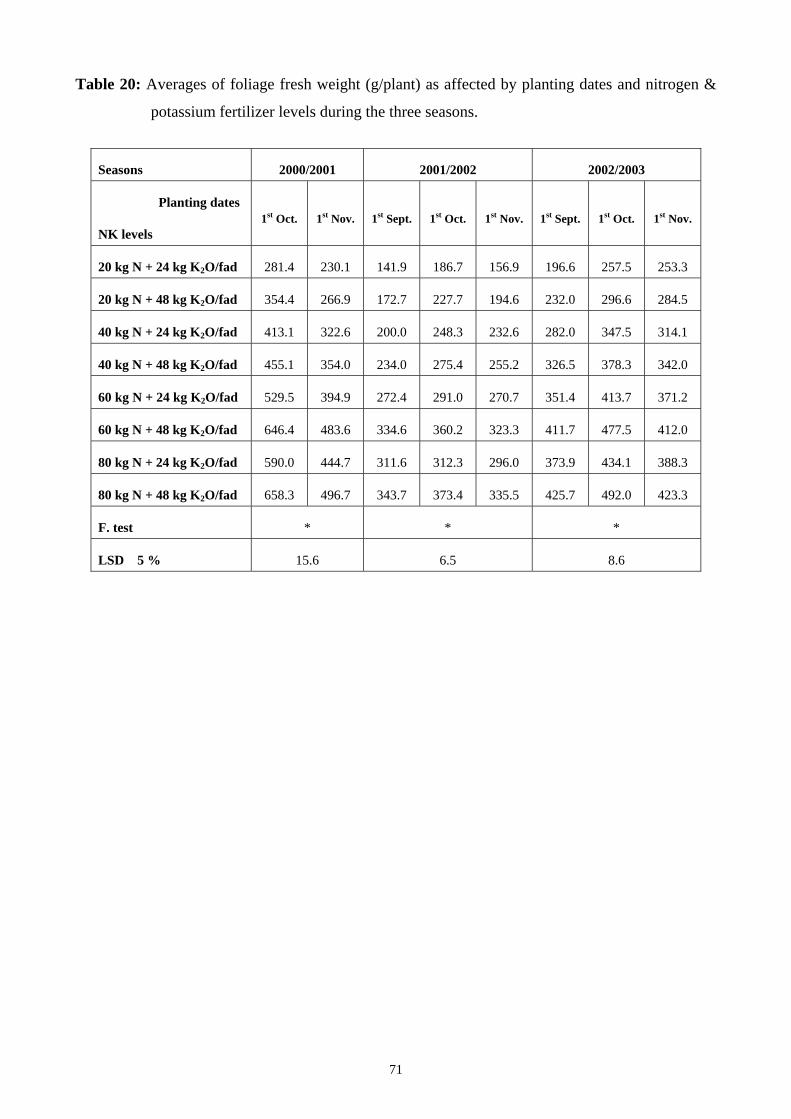
71
Table 20: Averages of foliage fresh weight (g/plant) as affected by planting dates and nitrogen &
potassium fertilizer levels during the three seasons.
Seasons 2000/2001 2001/2002 2002/2003
Planting dates
NK levels 1st Oct. 1st Nov. 1st Sept. 1st Oct. 1st Nov. 1st Sept. 1st Oct. 1st Nov.
20 kg N + 24 kg K2O/fad 281.4 230.1 141.9 186.7 156.9 196.6 257.5 253.3
20 kg N + 48 kg K2O/fad 354.4 266.9 172.7 227.7 194.6 232.0 296.6 284.5
40 kg N + 24 kg K2O/fad 413.1 322.6 200.0 248.3 232.6 282.0 347.5 314.1
40 kg N + 48 kg K2O/fad 455.1 354.0 234.0 275.4 255.2 326.5 378.3 342.0
60 kg N + 24 kg K2O/fad 529.5 394.9 272.4 291.0 270.7 351.4 413.7 371.2
60 kg N + 48 kg K2O/fad 646.4 483.6 334.6 360.2 323.3 411.7 477.5 412.0
80 kg N + 24 kg K2O/fad 590.0 444.7 311.6 312.3 296.0 373.9 434.1 388.3
80 kg N + 48 kg K2O/fad 658.3 496.7 343.7 373.4 335.5 425.7 492.0 423.3
F. test * * *
LSD 5 % 15.6 6.5 8.6

72
Table 21: Averages of foliage fresh weight (g/plant) as affected by biofertilization treatments and nitrogen & potassium fertilizer levels during the three seasons.
Biofertilization treatments NK levels Without Rhizobacterin Cerialine Rhizobacterin +
Cerialine 2000/2001
20 kg N + 24 kg K2O/fad 218.3 294.6 243.5 266.6 20 kg N + 48 kg K2O/fad 288.3 338.1 298.1 318.0 40 kg N + 24 kg K2O/fad 335.6 416.5 343.8 375.6 40 kg N + 48 kg K2O/fad 356.5 459.0 382.5 420.3 60 kg N + 24 kg K2O/fad 400.0 527.0 430.0 491.8 60 kg N + 48 kg K2O/fad 470.1 652.0 544.5 593.3 80 kg N + 24 kg K2O/fad 426.6 595.3 491.0 556.5 80 kg N + 48 kg K2O/fad 485.6 659.1 557.3 608.0 F. test * LSD 5 % 22.1
2001/2002 20 kg N + 24 kg K2O/fad 142.5 177.6 158.8 168.3 20 kg N + 48 kg K2O/fad 177.7 210.5 201.4 203.6 40 kg N + 24 kg K2O/fad 202.4 236.8 229.1 239.5 40 kg N + 48 kg K2O/fad 226.5 267.4 253.1 272.5 60 kg N + 24 kg K2O/fad 246.8 297.4 278.0 289.8 60 kg N + 48 kg K2O/fad 321.4 356.5 332.1 347.4 80 kg N + 24 kg K2O/fad 291.4 326.1 299.2 310.0 80 kg N + 48 kg K2O/fad 327.8 371.5 344.3 359.7 F. test * LSD 5 % 7.5
2002/2003 20 kg N + 24 kg K2O/fad 215.5 252.4 228.5 246.6 20 kg N + 48 kg K2O/fad 247.2 293.7 263.3 280.0 40 kg N + 24 kg K2O/fad 287.2 333.5 312.2 325.2 40 kg N + 48 kg K2O/fad 315.0 381.6 335.5 363.7 60 kg N + 24 kg K2O/fad 334.1 422.6 362.6 395.7 60 kg N + 48 kg K2O/fad 380.0 479.3 418.3 457.4 80 kg N + 24 kg K2O/fad 350.5 443.3 385.1 416.2 80 kg N + 48 kg K2O/fad 392.7 493.3 432.2 469.8 F. test * LSD 5 % 9.9

73
Rhizobacterin, but fertilizing with 60 kg N + 48 kg K2O/fad, which differences between their were
very few in all seasons. Kandil et al. (2002 c) and Soha, Khalil (2002) obtained similar findings.
2.3- Root/top ratio:
Data in Table 22 are in concern with the effect of planting dates, biofertilization treatments,
nitrogen and potassium fertilizer levels on root/top ratio during 2000/2001, 2001/2002 and
2002/2003 seasons.
Effect of planting dates:
It is quite evident from the data listed in Table 22 that planting dates of sugar beet had
significant effect on root/top ratio in the first and third seasons only. Planting sugar beet on first
September registered the highest values of root/top ratio, since results were 2.97 and 2.38 in the
second and third seasons, respectively. Meanwhile, in the first season the highest one (1.44) was
recorded due to planting on 1st November. On contrary, the lowest values of root/top ratio (1.11,
2.78 and 1.83) were resulted from planting beets on 1st October in the first and second seasons and
from planting on 1st November in the third season. Badawi (1985), Abdou (2000) and Kandil et al.
(2002 c) came to similar results.
Effect of biofertilization treatments:
From data in Table 22, it is clear seen that there were insignificant effects for biofertilization
treatments on root/top ratio during 2000/2001, 2001/2002 and 2002/2003 seasons. Nonetheless,
there were gradual increases in root/top ratio as affected by biofertilization treatments in the three
seasons of this investigation. These results were alleged with the previous results obtained by
Bassal et al. (2001).
Effect of nitrogen and potassium combination levels:
Increasing nitrogen fertilizer levels from 20 to 40 and 60 kg N/fad tended to increase
root/top ratio from 1.88 to 2.11 and 2.19 as average of the three seasons, respectively. Whilst,
increasing nitrogen levels from 60 to 80 kg N/fad associated with reduction in this character from
2.19 to 2.15. These results are consistent with those reported by Attia et al. (1999) and Kandil et al.
(2002 c).
Increasing potassium fertilizer levels from 24 to 48 kg K2O/fad tended to show light
increase in root/top ratio from 2.08 to 2.09 as average of all seasons. In the three seasons of study,
nitrogen and potassium combination levels significantly affected root/top ratio (Table 22).
Increasing nitrogen and potassium combination levels from 20 kg N + 24 kg K2O/fad to 60 kg N +
24 kg
K2O/fad caused gradual increases in root/top ratio, which the highest averages (1.38, 3.13
and 2.24) were registered by application of 60 kg N + 24 kg K2O/fad in the first, second and third
season, respectively. Moreover, each increase nitrogen and potassium combination levels upon
74
Table 22: Averages of root/top ratio and root length (cm) as affected by planting dates,
biofertilization treatments, nitrogen and potassium fertilizer levels during 2000/2001,
2001/2002 and 2002/2003 seasons.
Characters Root/top ratio Root length (cm)
Seasons 2000/2001 2001/2002 2002/2003 2000/2001 2001/2002 2002/2003
A: Planting dates:1st September - 2.97 2.38 - 36.47 36.55 1st October 1.11 2.78 2.08 31.55 37.93 40.05 1st November 1.44 2.90 1.83 34.22 37.37 38.15 F. test NS * NS * LSD 5%
* - 0.07
* - 1.10
B: Biofertilization treatments: Without 1.25 2.85 2.11 30.93 35.43 36.76 Rhizobacterin 1.28 2.89 2.11 34.77 38.63 39.56 Cerialine 1.30 2.89 2.11 32.27 37.11 37.77 Rhizobacterin+Cerialine 1.26 2.89 2.05 33.58 37.87 38.90 F. test NS NS NS * * * LSD 5% - - - 0.69 0.53 0.35 C: Nitrogen and potassium combination levels: 20 kg N + 24 kg K2O/fad 1.11 2.55 1.75 27.58 31.72 32.91 20 kg N + 48 kg K2O/fad 1.17 2.72 1.97 29.08 33.86 34.72 40 kg N + 24 kg K2O/fad 1.19 2.90 2.07 30.41 35.47 36.58 40 kg N + 48 kg K2O/fad 1.34 3.02 2.14 31.95 36.80 37.97 60 kg N + 24 kg K2O/fad 1.38 3.13 2.24 34.50 38.38 39.38 60 kg N + 48 kg K2O/fad 1.32 2.87 2.20 36.62 41.05 41.75 80 kg N + 24 kg K2O/fad 1.34 3.02 2.22 35.62 39.33 40.41 80 kg N + 48 kg K2O/fad 1.32 2.83 2.18 37.33 41.47 42.27 F. test * * * * * * LSD 5% 0.05 0.06 0.05 0.48 0.36 0.28
75
previous level (60 kg N + 24 kg K2O/fad) associated with visible decrease in root/top ratio during
all seasons. The decrease in root/top ratio with increasing in nitrogen level over 60 kg N/fad may be
due to the increase in top weight more than the increase in root weight. Ramadan (1997) and EL-
Harriri and Mirvat, Gobarh (2001) came to similar conculsion.
2.4- Root length (cm):
Data in Table 22 show the means of root length (cm) at harvesting as affected by planting
dates, biofertilization treatments, nitrogen and potassium fertilizer levels during the seasons of
2000/2001, 2001/2002 and 2002/2003.
Effect of planting dates:
Data illustrated in Table 22 show that planting dates of sugar beet had a significant effect on
root length at harvesting in the first and third seasons only. It can be easily comment that planting
sugar beet on 1st October was accompanied with the tallest roots (37.93 and 40.05 cm) in the second
and third seasons, respectively. While, in the first season the tallest ones were resulted from
planting on the first of November. On the other hand, planting beets on 1st September recorded the
shortest roots (36.47 and 36.55 cm) in the second and third seasons, respectively). Whilst, in the
first season the lowest value of root length (31.55 cm) was obtained when planting beets was on 1st
October. The desirable effect of planting dates on root length might be imputed to the suitable
environmental conditions which play a vital role in activating establishment, growth and ripening of
plants, hence increasing root dimension. These results are in partial compatible with those stated by
Badawi (1985), Badawi et al. (1995), Ghonema (1998), Abdou (2000) and Kandil et al. (2002 c).
Effect of biofertilization treatments:
As shown in Table 22, root length of sugar beet significantly improved by biofertilization
treatments (Rhizobacterin, Cerialine and mixture of Rhizobacterin + Cerialine) during 2000/2001,
2001/2002 and 2002/2003 seasons. Inoculation soil with Rhizobacterin biofertilizer created
significant increases in root length more than other treatments and produced the maximum ones
(34.77, 38.63 and 39.56 cm) in the first, second and third seasons, respectively. With respect
Rhizobacterin + Cerialine treatment, it was ranked second after Rhizobacterin treatment, which
values were 33.58, 37.87 and 38.90 cm with minimum differences between its in the first, second
and third seasons, respectively. In opposition, the lowest values (30.93, 35.43 and 36.76 cm) were
achieved as a results of control treatment (without biofertilization) in the first, second and third
seasons, respectively. Such effect of biofertilization treatment on root size may be attributed to the
active role of bacteria which released from biofertilizers in producing certain growth regulators and
stimulation compounds such as GA3 and IAA which play an important role in formation a large and
active root system and therefore increasing nutrient uptake. Similar results were suggested by
76
several investigators i.e. Shabaev et al. (1996), Sultan et al. (1999), Bassal et al. (2001), Maareg
and Sohir, Badr (2001), Kandil et al. (2002 c) and Ramadan et al. (2003).
Effect of nitrogen and potassium combination levels:
Increasing nitrogen fertilizer levels from 20 to 40, 60 and 80 kg N/fad tended to increase
root length from 31.35 to 34.86, 38.61 and 39.41 cm as average in the three seasons, respectively.
This increase amounted 10.14, 10.75 and 2.07 % between nitrogen levels. These results are in
accordance with those reported by Azzazy (1998), Attia et al. (1999), EL-Hawary (1999), Abd EL-
Moneim (2000), Sohair, Ouda (2001), Nemeat Alla et al. (2002) and Ramadan et al. (2003).
Increasing potassium fertilizer levels from 24 to 48 kg K2O/fad tended to increase root
length from 35.19 to 37.07 cm as average in the three seasons. EL-Zayat (2000) and Sohair, Ouda
(2001).
With regard to the effect of nitrogen and potassium combination levels on root length, it is
obvious from data tabulated in Table 22 that increasing nitrogen and potassium combination levels
from 20 kg N + 24 kg K2O/fad to 80 kg N + 48 kg K2O/fad was accompanied with significant
increase in root length in the three seasons. Thereby, the highest averages of root length (37.33,
41.47 and 42.27 cm) were produced from fertilizing beets with 80 kg N + 48 kg K2O/fad. In
reverse, the lowest ones were resulted from plants received 20 kg N + 24 kg K2O/fad, where
findings were 27.58, 31.72 and 32.91 cm in the first, second and third seasons, respectively. It must
be observation that application of 60 kg N + 48 kg K2O/fad) ranked after the highest level of
nitrogen and potassium combination, which records were 36.62, 41.05 and 41.75 cm in the first,
second and third seasons, respectively. Such effect of nitrogen and potassium may be ascribed to its
role in increasing division and elongation of cells, consequently increasing root size. These results
are in agreement with Sarhan (1998), Sayed et al. (1998), EL-Hawary (1999) and EL-Harriri and
Mirvat, Gobarh (2001).
Effect of interactions:
A significant effect of the interaction between planting dates X nitrogen and potassium
combination levels on root length was found in the three seasons (Table 23). The longest roots
(39.00, 42.83 and 43.75 cm) were resulted from planting beets on 1st November (in the first season)
or on 1st October (in the second and third seasons) plus fertilizing its with 80 kg N + 48 kg K2O/fad.
While, replace the highest level of nitrogen (80 kg N/fad) with 60 kg N/fad from previous
interaction produced the best results with insignificant differences in the same time save about 20
kg N/fad. Similar findings were observed by Kandil et al. (2002 c).
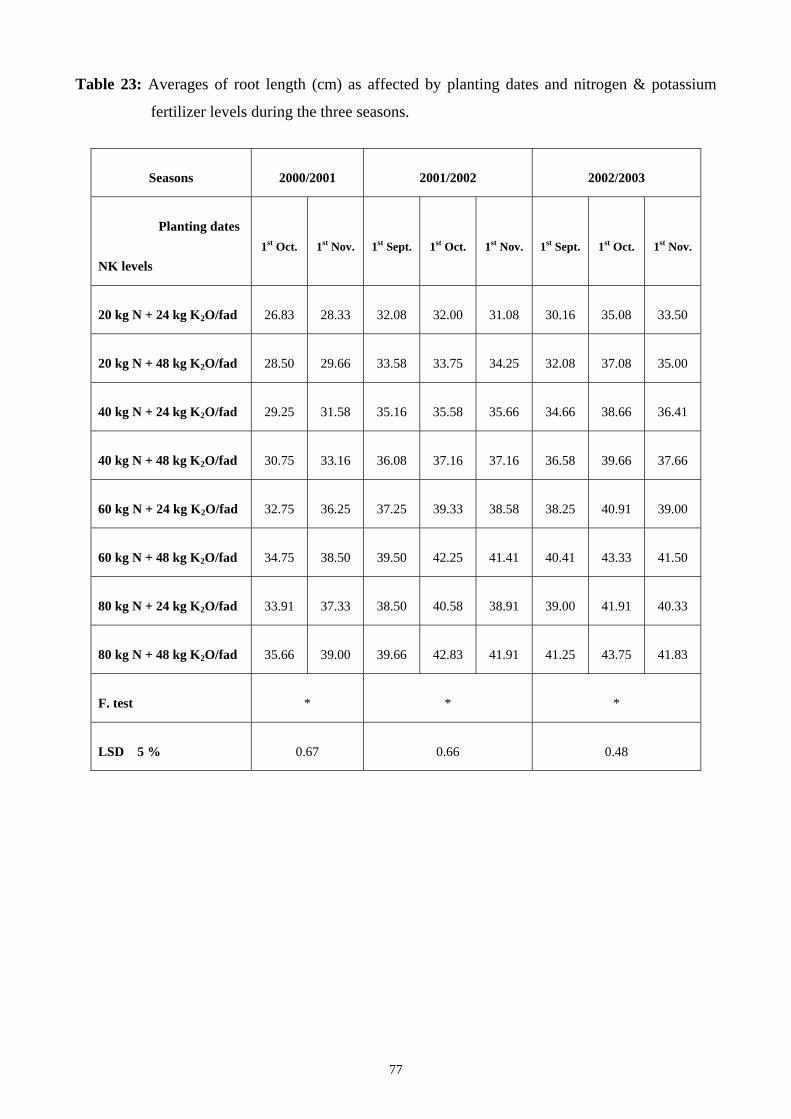
77
Table 23: Averages of root length (cm) as affected by planting dates and nitrogen & potassium
fertilizer levels during the three seasons.
Seasons 2000/2001 2001/2002 2002/2003
Planting dates
NK levels 1st Oct. 1st Nov. 1st Sept. 1st Oct. 1st Nov. 1st Sept. 1st Oct. 1st Nov.
20 kg N + 24 kg K2O/fad 26.83 28.33 32.08 32.00 31.08 30.16 35.08 33.50
20 kg N + 48 kg K2O/fad 28.50 29.66 33.58 33.75 34.25 32.08 37.08 35.00
40 kg N + 24 kg K2O/fad 29.25 31.58 35.16 35.58 35.66 34.66 38.66 36.41
40 kg N + 48 kg K2O/fad 30.75 33.16 36.08 37.16 37.16 36.58 39.66 37.66
60 kg N + 24 kg K2O/fad 32.75 36.25 37.25 39.33 38.58 38.25 40.91 39.00
60 kg N + 48 kg K2O/fad 34.75 38.50 39.50 42.25 41.41 40.41 43.33 41.50
80 kg N + 24 kg K2O/fad 33.91 37.33 38.50 40.58 38.91 39.00 41.91 40.33
80 kg N + 48 kg K2O/fad 35.66 39.00 39.66 42.83 41.91 41.25 43.75 41.83
F. test * * *
LSD 5 % 0.67 0.66 0.48
78
2.5- Root diameter (cm):
The effect of planting dates, biofertilization treatments, nitrogen and potassium fertilizer
levels on root diameter (cm) during 2000/2001, 2001/2002 and 2002/2003 seasons are presented in
Table 24.
Effect of planting dates:
Root diameter exhibited significant differences among planting dates in the third seasons
only (Table 24). The thickest roots were produced from plating on 1st October, results were 8.40,
10.21 and 10.53 cm in the first, second and third seasons, respectively. Whereas, the thinnest roots
(8.23, 10.05 and 9.65 cm) were came out from planting beets on 1st November in the first, second
and third seasons, respectively. The trend of these results is similar to those of root length and
similar discussion could be cited. Confirming these findings, Badawi (1985), EL-Kassaby and
Leilah (1992 b), Badawi et al. (1995), Ghonema (1998), Abdou (2000) and Kandil et al. (2002c).
Effect of biofertilization treatments:
Data collected in Table 24 reveal that biofertilization treatments had a significant effect on
root diameter in the three growing seasons of this research. Roots in the treatment of Rhizobacterin
as biofertilizer (8.63, 10.58 and 10.55 cm) were significantly thicker than other treatments in the
first, second and third seasons, respectively. Also, in can be supervision that Rhizobacterin +
Cerialine treatment came in the second rank after aforementioned treatment with respect root
diameter in all seasons. With concern Cerialine biofertilizer, it was occupied as eventual
biofertilization treatments during the three seasons of this study. It can be cited that the increase in
root diameter due to the same reason that led to the increase in root length as previously mentioned.
These results are in full accordance with those reported by Sultan et al. (1999), Bassal et al. (2001),
Maareg and Sohir, Badr (2001) and Ramadan et al. (2003).
Effect of nitrogen and potassium combination levels:
Increasing nitrogen fertilizer levels from 20 to 40, 60 and 80 kg N/fad tended to increase
root diameter from 7.69 to 9.13, 10.49 and 10.79 cm as average in the three seasons. Increasing
nitrogen levels from 60 to 80 kg N/fad led to slight increase (2.86 %) as compared to other
increases due to increasing nitrogen levels. These findings are accomplished with those observed by
AL-Labbody (1998) Attia et al. (1999), Abd EL-Moneim (2000), Kandil et al. (2002 c) and
Ramadan et al. (2003).
Increasing potassium fertilizer levels from 24 to 48 kg K2O/fad tended to increase root
diameter from 9.14 to 9.91 cm as average over seasons. Sayed et al. (1998), Sohier, Ouda (2001)
and Kandil et al. (2002 a).
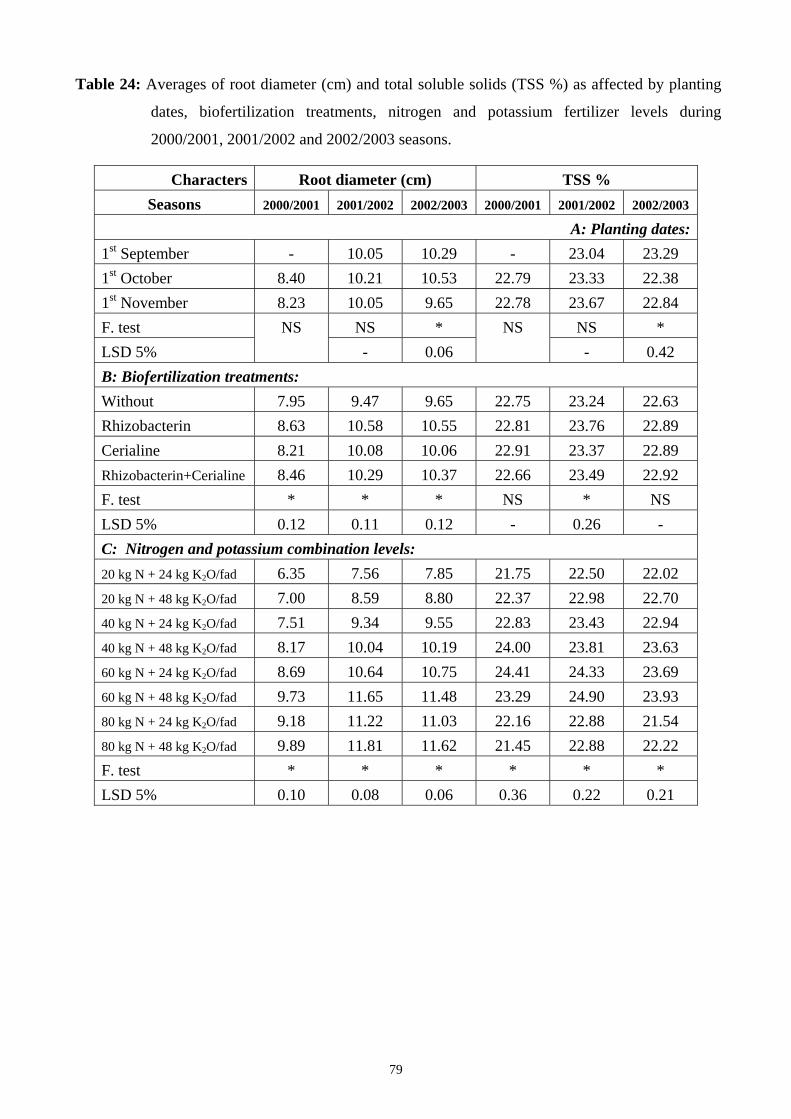
79
Table 24: Averages of root diameter (cm) and total soluble solids (TSS %) as affected by planting
dates, biofertilization treatments, nitrogen and potassium fertilizer levels during
2000/2001, 2001/2002 and 2002/2003 seasons.
Characters Root diameter (cm) TSS % Seasons 2000/2001 2001/2002 2002/2003 2000/2001 2001/2002 2002/2003
A: Planting dates:1st September - 10.05 10.29 - 23.04 23.29 1st October 8.40 10.21 10.53 22.79 23.33 22.38 1st November 8.23 10.05 9.65 22.78 23.67 22.84 F. test NS * NS * LSD 5%
NS - 0.06
NS - 0.42
B: Biofertilization treatments: Without 7.95 9.47 9.65 22.75 23.24 22.63 Rhizobacterin 8.63 10.58 10.55 22.81 23.76 22.89 Cerialine 8.21 10.08 10.06 22.91 23.37 22.89 Rhizobacterin+Cerialine 8.46 10.29 10.37 22.66 23.49 22.92 F. test * * * NS * NS LSD 5% 0.12 0.11 0.12 - 0.26 - C: Nitrogen and potassium combination levels: 20 kg N + 24 kg K2O/fad 6.35 7.56 7.85 21.75 22.50 22.02 20 kg N + 48 kg K2O/fad 7.00 8.59 8.80 22.37 22.98 22.70 40 kg N + 24 kg K2O/fad 7.51 9.34 9.55 22.83 23.43 22.94 40 kg N + 48 kg K2O/fad 8.17 10.04 10.19 24.00 23.81 23.63 60 kg N + 24 kg K2O/fad 8.69 10.64 10.75 24.41 24.33 23.69 60 kg N + 48 kg K2O/fad 9.73 11.65 11.48 23.29 24.90 23.93 80 kg N + 24 kg K2O/fad 9.18 11.22 11.03 22.16 22.88 21.54 80 kg N + 48 kg K2O/fad 9.89 11.81 11.62 21.45 22.88 22.22 F. test * * * * * * LSD 5% 0.10 0.08 0.06 0.36 0.22 0.21
80
Respecting the effect of nitrogen and potassium combination levels on root diameter, it can
be clearly seen that this character was significantly affected by increasing nitrogen and potassium
combination levels during the three seasons (Table 24). It can be easily statement that, each increase
in nitrogen and potassium combination levels from 20 kg N + 24 kg K2O/fad to 80 kg N + 48 kg
K2O/fad associated with a progressive increase in root diameter during the three seasons.
Application the highest level of nitrogen and potassium (80 kg N + 48 kg K2O/fad) resulted in the
highest values of root diameter (9.89, 11.81 and 11.62 cm) in the first, second and third seasons,
respectively. However, application of 60 kg N + 48 kg K2O/fad arranged as second best application
after the highest combination. The enhancing effect of nitrogen and potassium fertilization on root
diameter may be attributed to the increase in cell size and numbers as a result of increasing division
of cells as well as activating accumulation of metabolites in storage roots. These findings are
accomplished with those recorded by Sarhan (1998) and Sayed et al. (1998).
Effect of interactions:
The interaction between planting dates X nitrogen and potassium fertilizer levels had a
significant effect on root diameter in the three seasons (Table 25). The highest means of this criteria
(10.03, 11.95 and 12.30 cm) were produced when planting on 1st of October and application of 80
kg N + 48 kg K2O/fad in the first, second and third seasons, respectively. These results are in good
accordance with those obtained by Kandil et al. (2002 c).
The interaction between biofertilization treatments X nitrogen and potassium combination
levels indicated significant effect on root diameter in the first and third seasons only (Table 26). The
highest values of root diameter (10.40 and 11.98 cm) can be obtained from using Rhizobacterin
biofertilizer + 80 kg N + 48 kg K2O/fad in the first and third seasons, respectively. Whilst, the
lowest ones (6.16 and 7.07 cm) were achieved with application of 20 kg N + 24 kg K2O/fad without
biofertilization in the first and third seasons, respectively. Kandil et al. (2002 c) and Soha, Khalil
(2002) came to similar trend.
3. YIELD QUALITY:
3.1- Total soluble solids percentage (TSS %):
Data presented in Table 24 bring out the means of total soluble solids percentage (TSS %) as
affected by planting dates, biofertilization treatments, nitrogen and potassium fertilizer levels during
2000/2001, 2001/2002 and 2002/2003 seasons.
Effect of planting dates:
Data inscribed in Table 24 indicate that planting dates had significant effect on TSS % in the
third season only. It was detected that the highest values of TSS % (22.79, 23.67 and 23.29 % in the
first, second and third seasons, respectively) were derived from planting beets on 1st October in the
first season, while in the second and third seasons its resulted from planting on 1st November and 1st

81
Table 25: Averages of root diameter (cm) as affected by planting dates and nitrogen & potassium
fertilizer levels during the three seasons.
Seasons 2000/2001 2001/2002 2002/2003
Planting dates
NK levels 1st Oct. 1st Nov. 1st Sept. 1st Oct. 1st Nov. 1st Sept. 1st Oct. 1st Nov.
20 kg N + 24 kg K2O/fad 6.41 6.28 7.46 7.61 7.60 8.20 7.85 7.50
20 kg N + 48 kg K2O/fad 7.24 6.77 8.52 8.63 8.63 9.08 8.97 8.34
40 kg N + 24 kg K2O/fad 7.60 7.41 9.31 9.36 9.34 9.85 9.81 8.97
40 kg N + 48 kg K2O/fad 8.20 8.15 9.90 10.21 10.00 10.43 10.55 9.59
60 kg N + 24 kg K2O/fad 8.70 8.67 10.56 10.82 10.53 10.90 11.20 10.15
60 kg N + 48 kg K2O/fad 9.87 9.59 11.59 11.76 11.59 11.37 12.09 10.98
80 kg N + 24 kg K2O/fad 9.15 9.21 11.23 11.32 11.01 11.07 11.50 10.52
80 kg N + 48 kg K2O/fad 10.03 9.75 11.75 11.95 11.74 11.40 12.30 11.16
F. test * * *
LSD 5 % 0.15 0.14 0.11
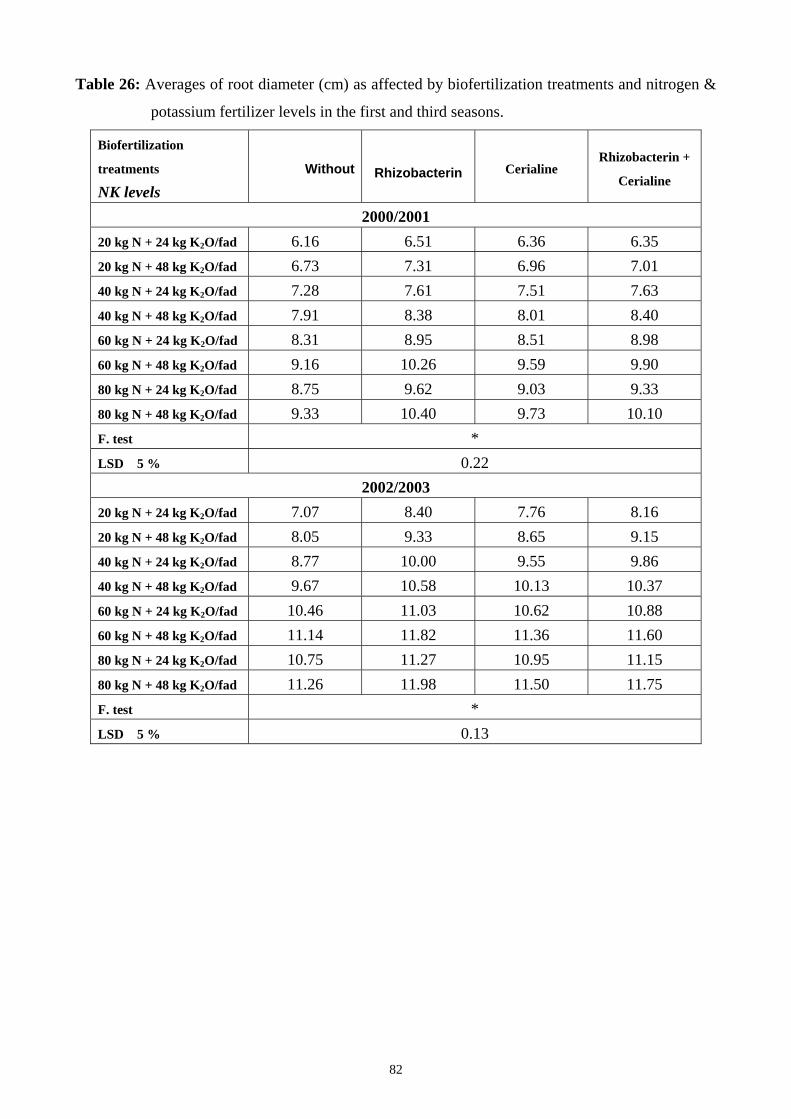
82
Table 26: Averages of root diameter (cm) as affected by biofertilization treatments and nitrogen &
potassium fertilizer levels in the first and third seasons.
Biofertilization
treatments
NK levels Without Rhizobacterin Cerialine
Rhizobacterin +
Cerialine
2000/2001 20 kg N + 24 kg K2O/fad 6.16 6.51 6.36 6.35 20 kg N + 48 kg K2O/fad 6.73 7.31 6.96 7.01 40 kg N + 24 kg K2O/fad 7.28 7.61 7.51 7.63 40 kg N + 48 kg K2O/fad 7.91 8.38 8.01 8.40 60 kg N + 24 kg K2O/fad 8.31 8.95 8.51 8.98 60 kg N + 48 kg K2O/fad 9.16 10.26 9.59 9.90 80 kg N + 24 kg K2O/fad 8.75 9.62 9.03 9.33 80 kg N + 48 kg K2O/fad 9.33 10.40 9.73 10.10 F. test * LSD 5 % 0.22
2002/2003 20 kg N + 24 kg K2O/fad 7.07 8.40 7.76 8.16 20 kg N + 48 kg K2O/fad 8.05 9.33 8.65 9.15 40 kg N + 24 kg K2O/fad 8.77 10.00 9.55 9.86 40 kg N + 48 kg K2O/fad 9.67 10.58 10.13 10.37 60 kg N + 24 kg K2O/fad 10.46 11.03 10.62 10.88 60 kg N + 48 kg K2O/fad 11.14 11.82 11.36 11.60 80 kg N + 24 kg K2O/fad 10.75 11.27 10.95 11.15 80 kg N + 48 kg K2O/fad 11.26 11.98 11.50 11.75 F. test * LSD 5 % 0.13
83
September, respectively. In other words, TSS % had unstable trend due to planting dates over
growing seasons of this research. Badawi (1985) and Kandil et al. (2002 c) came to results partially
corresponding with obtained results in this study.
Effect of biofertilization treatments:
Statistical analysis of obtained results detected that TSS % was insignificantly responded to
biofertilization treatments in the first and third seasons, but in the second season there was a
significant effect (Table 24). It was worthy noticed that biofertilization treatments caused noticeable
increases in TSS % over control (without biofertilization) in the three seasons. This increase in TSS
% due to biofertilization treatments may be backed to its role in increasing growth and dry matter
accumulation. Similar results were reported by many workers i.e. Sultan et al. (1999), Bassal et al.
(2001) and Maareg and Sohir, Badr (2001).
Effect of nitrogen and potassium combination levels:
TSS % tended to increase as a result of increasing nitrogen fertilizer levels from 20 to 40
and 60 kg N/fad, where these increase reached 4.68 and 2.77 % as average in the three seasons. On
the other hand, increasing nitrogen levels from 60 to 80 kg N/fad led to decrease TSS % by 7.88 %.
Confirming this tendency Attia et al. (1999), Mahasen, Fahmi (1999), Abd EL-Moneim (2000),
Nemeat Alla et al. (2002) and Ramadan et al. (2003).
Increasing potassium fertilizer levels from 24 to 48 kg K2O/fad tended to increase TSS %
from 22.87 to 23.18 % as average in the three seasons. Sohier, Ouda (2001) confirmed this trend.
Referencing the effect of nitrogen and potassium combination levels on TSS %, it can be
clearly seen that this quality parameter had a significant effect in the three growing seasons (Table
24). It can be easily considered that application of 60 kg N + 48 kg K2O/fad gave the highest values
of TSS %, where data were 24.90 and 23.93 % in the second and third seasons, respectively,
whereas in the first season the highest one (24.41 %) was resulted from application of 60 kg N + 24
kg K2O/fad. Any increase in nitrogen and potassium combination levels upon 60 kg N + 48 kg
K2O/fad caused remarkable decrease in TSS % in the three seasons of this study. The decrease in
TSS % due to excessive nitrogen or potassium application can be ascribed to its role in increasing
root weight and diameter, tissue water content as well as partitioning of more photosynthates to the
tops than to the roots of sugar beet plants and consequently TSS % may be lowered. Confirming
this conclusion Sobh et al. (1992) and Sultan et al. (1999).
Effect of interactions:
The interaction between planting dates X nitrogen and potassium combination levels
showed significant effect on TSS % in the three seasons (Table 27). The highest value of TSS % in
the first season (24.50 %) resulted from planting on 1st October by addition 60 kg N + 24 kg
K2O/fad, but in the second season the highest one (25.04 %) was produced from planting on 1st
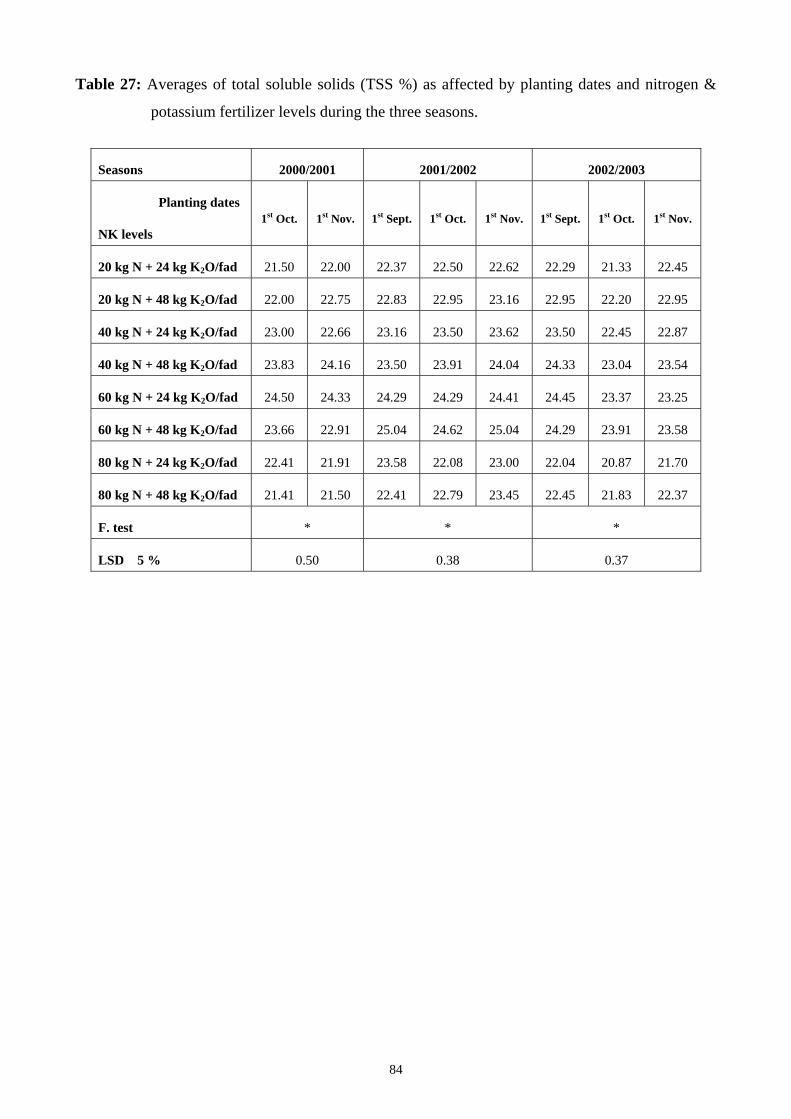
84
Table 27: Averages of total soluble solids (TSS %) as affected by planting dates and nitrogen &
potassium fertilizer levels during the three seasons.
Seasons 2000/2001 2001/2002 2002/2003
Planting dates
NK levels 1st Oct. 1st Nov. 1st Sept. 1st Oct. 1st Nov. 1st Sept. 1st Oct. 1st Nov.
20 kg N + 24 kg K2O/fad 21.50 22.00 22.37 22.50 22.62 22.29 21.33 22.45
20 kg N + 48 kg K2O/fad 22.00 22.75 22.83 22.95 23.16 22.95 22.20 22.95
40 kg N + 24 kg K2O/fad 23.00 22.66 23.16 23.50 23.62 23.50 22.45 22.87
40 kg N + 48 kg K2O/fad 23.83 24.16 23.50 23.91 24.04 24.33 23.04 23.54
60 kg N + 24 kg K2O/fad 24.50 24.33 24.29 24.29 24.41 24.45 23.37 23.25
60 kg N + 48 kg K2O/fad 23.66 22.91 25.04 24.62 25.04 24.29 23.91 23.58
80 kg N + 24 kg K2O/fad 22.41 21.91 23.58 22.08 23.00 22.04 20.87 21.70
80 kg N + 48 kg K2O/fad 21.41 21.50 22.41 22.79 23.45 22.45 21.83 22.37
F. test * * *
LSD 5 % 0.50 0.38 0.37
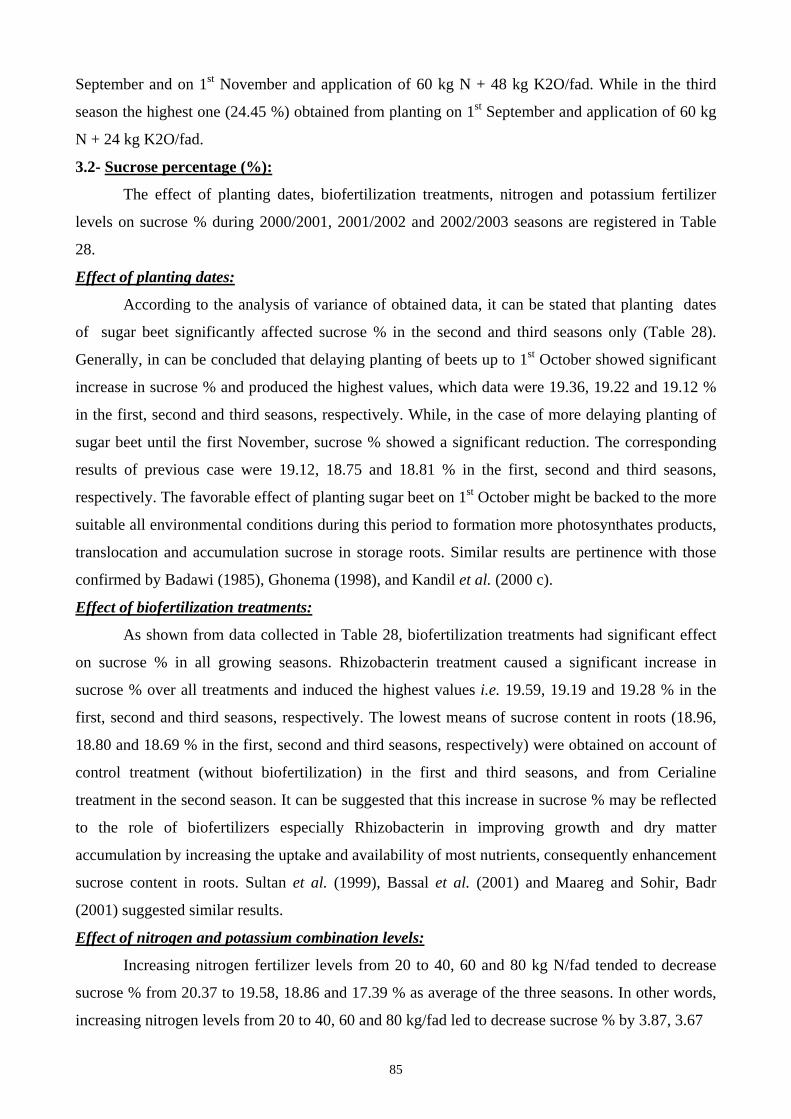
85
September and on 1st November and application of 60 kg N + 48 kg K2O/fad. While in the third
season the highest one (24.45 %) obtained from planting on 1st September and application of 60 kg
N + 24 kg K2O/fad.
3.2- Sucrose percentage (%):
The effect of planting dates, biofertilization treatments, nitrogen and potassium fertilizer
levels on sucrose % during 2000/2001, 2001/2002 and 2002/2003 seasons are registered in Table
28.
Effect of planting dates:
According to the analysis of variance of obtained data, it can be stated that planting dates
of sugar beet significantly affected sucrose % in the second and third seasons only (Table 28).
Generally, in can be concluded that delaying planting of beets up to 1st October showed significant
increase in sucrose % and produced the highest values, which data were 19.36, 19.22 and 19.12 %
in the first, second and third seasons, respectively. While, in the case of more delaying planting of
sugar beet until the first November, sucrose % showed a significant reduction. The corresponding
results of previous case were 19.12, 18.75 and 18.81 % in the first, second and third seasons,
respectively. The favorable effect of planting sugar beet on 1st October might be backed to the more
suitable all environmental conditions during this period to formation more photosynthates products,
translocation and accumulation sucrose in storage roots. Similar results are pertinence with those
confirmed by Badawi (1985), Ghonema (1998), and Kandil et al. (2000 c).
Effect of biofertilization treatments:
As shown from data collected in Table 28, biofertilization treatments had significant effect
on sucrose % in all growing seasons. Rhizobacterin treatment caused a significant increase in
sucrose % over all treatments and induced the highest values i.e. 19.59, 19.19 and 19.28 % in the
first, second and third seasons, respectively. The lowest means of sucrose content in roots (18.96,
18.80 and 18.69 % in the first, second and third seasons, respectively) were obtained on account of
control treatment (without biofertilization) in the first and third seasons, and from Cerialine
treatment in the second season. It can be suggested that this increase in sucrose % may be reflected
to the role of biofertilizers especially Rhizobacterin in improving growth and dry matter
accumulation by increasing the uptake and availability of most nutrients, consequently enhancement
sucrose content in roots. Sultan et al. (1999), Bassal et al. (2001) and Maareg and Sohir, Badr
(2001) suggested similar results.
Effect of nitrogen and potassium combination levels:
Increasing nitrogen fertilizer levels from 20 to 40, 60 and 80 kg N/fad tended to decrease
sucrose % from 20.37 to 19.58, 18.86 and 17.39 % as average of the three seasons. In other words,
increasing nitrogen levels from 20 to 40, 60 and 80 kg/fad led to decrease sucrose % by 3.87, 3.67
86
Table 28: Averages of sucrose and apparent purity percentages as affected by planting dates, biofertilization treatments, nitrogen and potassium fertilizer levels during 2000/2001, 2001/2002 and 2002/2003 seasons.
Characters Sucrose % Apparent purity % Seasons 2000/2001 2001/2002 2002/2003 2000/2001 2001/2002 2002/2003
A: Planting dates:1st September - 18.85 18.87 - 80.74 81.15 1st October 19.36 19.22 19.12 84.95 82.47 85.64 1st November 19.12 18.75 18.81 84.44 79.36 82.39 F. test * * NS * LSD 5%
NS 0.19 0.23
NS - 2.59
B: Biofertilization treatments: Without 18.96 18.81 18.69 83.46 81.14 82.78
Rhizobacterin 19.59 19.19 19.28 85.83 80.85 84.36 Cerialine 19.30 18.80 18.89 84.36 80.60 82.63 Rhizobacterin+Cerialine 19.27 18.96 18.87 85.14 80.84 82.46 F. test * * * NS NS * LSD 5% 0.10 0.07 0.13 - - 1.12 C: Nitrogen and potassium combination levels: 20 kg N + 24 kg K2O/fad 20.52 19.92 19.73 93.86 88.62 89.76 20 kg N + 48 kg K2O/fad 21.05 20.57 20.45 93.67 89.55 90.16 40 kg N + 24 kg K2O/fad 19.54 19.20 19.11 85.71 81.98 83.42 40 kg N + 48 kg K2O/fad 20.16 19.77 19.71 84.10 83.04 83.49 60 kg N + 24 kg K2O/fad 18.68 18.56 18.52 76.57 76.31 78.24 60 kg N + 48 kg K2O/fad 19.30 19.13 18.99 82.98 76.88 79.40 80 kg N + 24 kg K2O/fad 17.22 16.90 17.21 77.75 74.00 80.06 80 kg N + 48 kg K2O/fad 17.78 17.48 17.75 82.93 76.48 79.96
F. test * * * * * * LSD 5% 0.14 0.08 0.12 1.45 0.86 1.03
87
and 7.80 %, respectively. Similar trend was obtained by Azzazy (1998), Attia et al. (1999), Abd
EL-Moneim (2000), Kandil et al. (2002 c) and Ramadan et al. (2003).
Increasing potassium fertilizer levels from 24 to 48 kg K2O/fad tended to increase sucrose %
from 18.76 to 19.35 % as average of the three seasons. Selim and EL-Ghinbihi (1999), EL-Shafai
(2000) and Sohier, Ouda (2001).
With regard to the effect of nitrogen and potassium combination levels on sucrose %, it is
clearly seen that there was significant effect on sucrose % due to this factor in the three seasons
(Table 28). It can be easily observed that each increase in nitrogen and potassium combination
levels from 20 kg N + 24 kg K2O/fad to 80 kg N + 48 kg K2O/fad associated with gradual decrease
in sucrose % in the three seasons. The maximum values of sucrose in beet roots were produced
from fertilizing plants with 20 kg N + 48 kg K2O/fad, where results were 21.05, 20.57 and 20.45 %
in the first, second and third seasons, respectively. On the contrary, the lowest ones (17.22, 16.90
and 17.21 %) were resulted from application of 80 kg N + 24 kg K2O/fad in the first, second and
third seasons, respectively. The decrease in sucrose % owing to increasing nitrogen fertilizer levels
can be attributed to its role in increasing non-sucrose substances such as proteins and alpha amino
acid, and hence decreasing sucrose content in roots. Similar results were indicated by EL-Hawary
(1999), Sultan et al. (1999) and EL-Harriri and Mirvat, Gobarh (2001).
Effect of interactions:
With regard to the effect of the interaction between planting dates X biofertilization
treatments on sucrose %, it was significant in the three growing seasons (Table 29). The highest
values of sucrose % (19.70, 19.60 and 19.47 % in the first, second and third seasons, respectively)
resulted from planting on 1st October (in the first and second seasons) or on 1st September (in the
third season) and utilizing Rhizobacterin treatment.
Respecting the interaction between planting dates X nitrogen and potassium combination
levels, it was significant during the three seasons with concern sucrose % (Table 30). The highest
means of sucrose % (21.40, 20.63 and 20.56 % in the first, second and third seasons, respectively)
produced from planting on 1st November (in the first season) or on 1st October (in the second and
third seasons) besides 20 kg N + 48 kg K2O/fad.
The interaction between biofertilization treatments X nitrogen and potassium combination
levels on sucrose % was significant in the three growing seasons (Table 31). The highest values of
sucrose % (21.21, 20.84 and 20.85 %) resulted from utilizing Rhizobacterin besides 20 kg N + 48
kg K2O/fad in the first, second and third seasons, respectively. On the other hand, the lowest
ones were obtained by application of 80 kg N + 24 kg K2O/fad without biofertilization in all
seasons. Abu EL-Fotoh et al. (2000), Bassal et al. (2001) and Soha, Khalil (2002) confirming these
results.
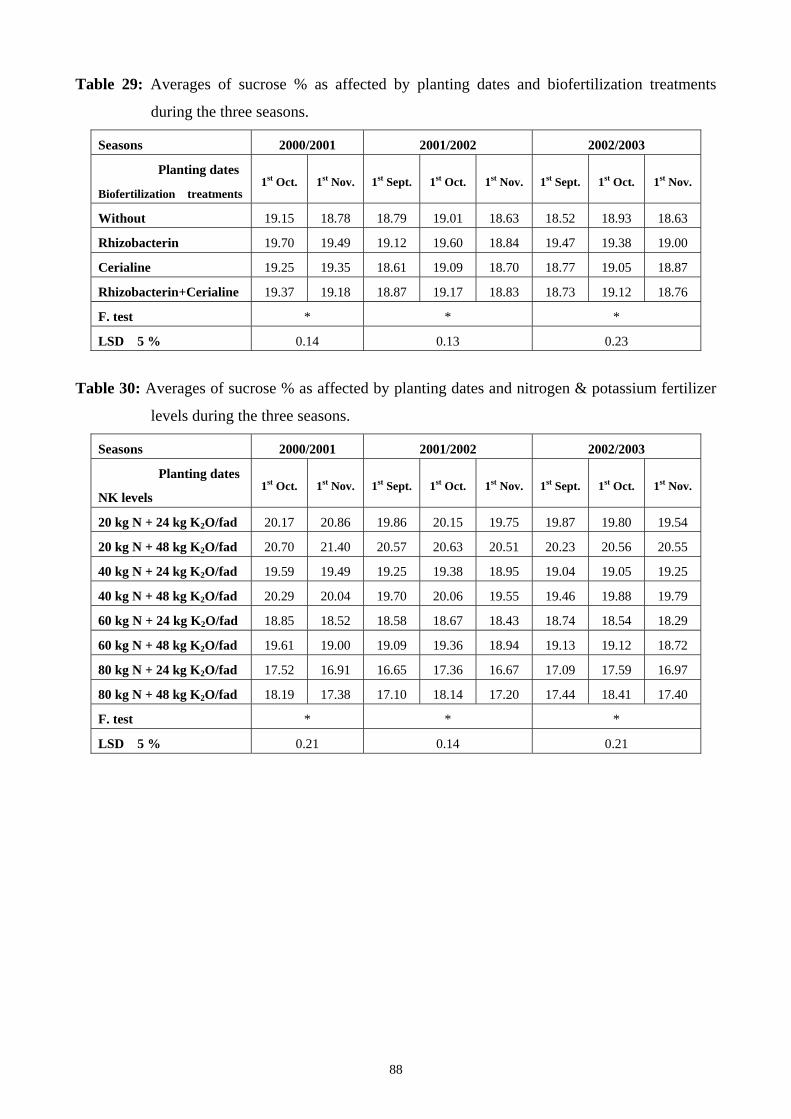
88
Table 29: Averages of sucrose % as affected by planting dates and biofertilization treatments
during the three seasons.
Seasons 2000/2001 2001/2002 2002/2003
Planting dates
Biofertilization treatments 1st Oct. 1st Nov. 1st Sept. 1st Oct. 1st Nov. 1st Sept. 1st Oct. 1st Nov.
Without 19.15 18.78 18.79 19.01 18.63 18.52 18.93 18.63
Rhizobacterin 19.70 19.49 19.12 19.60 18.84 19.47 19.38 19.00
Cerialine 19.25 19.35 18.61 19.09 18.70 18.77 19.05 18.87
Rhizobacterin+Cerialine 19.37 19.18 18.87 19.17 18.83 18.73 19.12 18.76
F. test * * *
LSD 5 % 0.14 0.13 0.23
Table 30: Averages of sucrose % as affected by planting dates and nitrogen & potassium fertilizer
levels during the three seasons.
Seasons 2000/2001 2001/2002 2002/2003
Planting dates
NK levels 1st Oct. 1st Nov. 1st Sept. 1st Oct. 1st Nov. 1st Sept. 1st Oct. 1st Nov.
20 kg N + 24 kg K2O/fad 20.17 20.86 19.86 20.15 19.75 19.87 19.80 19.54
20 kg N + 48 kg K2O/fad 20.70 21.40 20.57 20.63 20.51 20.23 20.56 20.55
40 kg N + 24 kg K2O/fad 19.59 19.49 19.25 19.38 18.95 19.04 19.05 19.25
40 kg N + 48 kg K2O/fad 20.29 20.04 19.70 20.06 19.55 19.46 19.88 19.79
60 kg N + 24 kg K2O/fad 18.85 18.52 18.58 18.67 18.43 18.74 18.54 18.29
60 kg N + 48 kg K2O/fad 19.61 19.00 19.09 19.36 18.94 19.13 19.12 18.72
80 kg N + 24 kg K2O/fad 17.52 16.91 16.65 17.36 16.67 17.09 17.59 16.97
80 kg N + 48 kg K2O/fad 18.19 17.38 17.10 18.14 17.20 17.44 18.41 17.40
F. test * * *
LSD 5 % 0.21 0.14 0.21
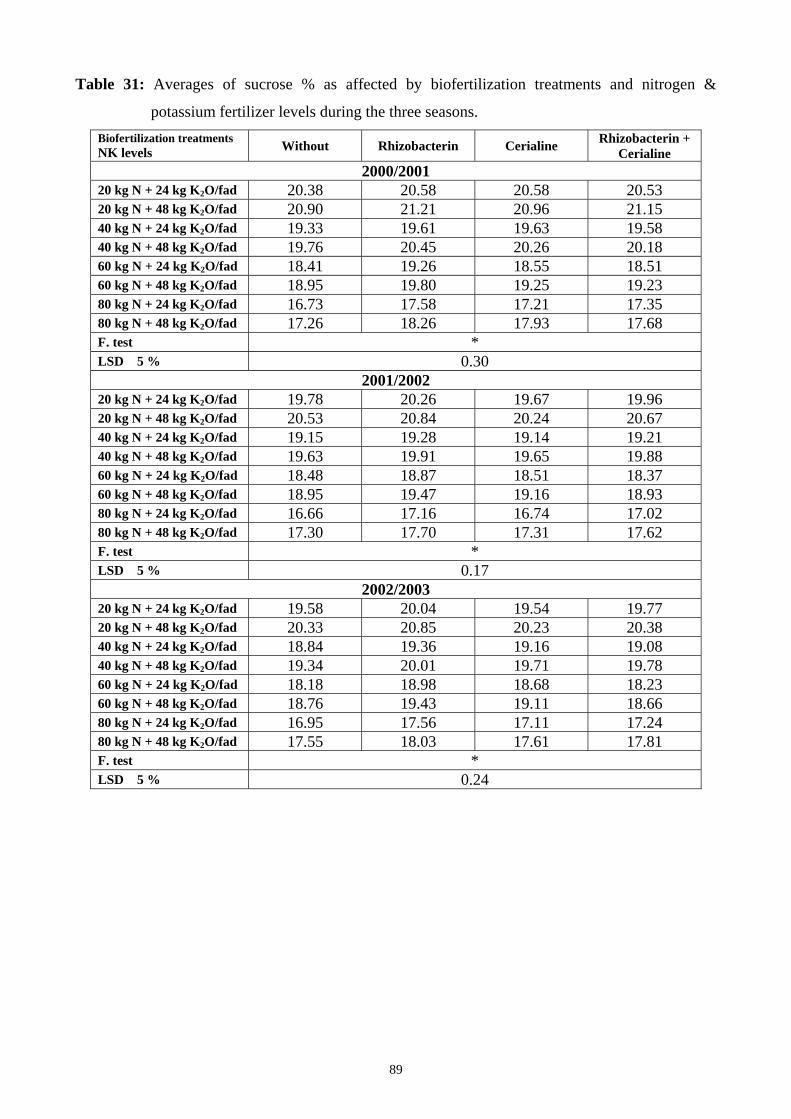
89
Table 31: Averages of sucrose % as affected by biofertilization treatments and nitrogen &
potassium fertilizer levels during the three seasons. Biofertilization treatments NK levels Without Rhizobacterin Cerialine Rhizobacterin +
Cerialine 2000/2001
20 kg N + 24 kg K2O/fad 20.38 20.58 20.58 20.53 20 kg N + 48 kg K2O/fad 20.90 21.21 20.96 21.15 40 kg N + 24 kg K2O/fad 19.33 19.61 19.63 19.58 40 kg N + 48 kg K2O/fad 19.76 20.45 20.26 20.18 60 kg N + 24 kg K2O/fad 18.41 19.26 18.55 18.51 60 kg N + 48 kg K2O/fad 18.95 19.80 19.25 19.23 80 kg N + 24 kg K2O/fad 16.73 17.58 17.21 17.35 80 kg N + 48 kg K2O/fad 17.26 18.26 17.93 17.68 F. test * LSD 5 % 0.30
2001/2002 20 kg N + 24 kg K2O/fad 19.78 20.26 19.67 19.96 20 kg N + 48 kg K2O/fad 20.53 20.84 20.24 20.67 40 kg N + 24 kg K2O/fad 19.15 19.28 19.14 19.21 40 kg N + 48 kg K2O/fad 19.63 19.91 19.65 19.88 60 kg N + 24 kg K2O/fad 18.48 18.87 18.51 18.37 60 kg N + 48 kg K2O/fad 18.95 19.47 19.16 18.93 80 kg N + 24 kg K2O/fad 16.66 17.16 16.74 17.02 80 kg N + 48 kg K2O/fad 17.30 17.70 17.31 17.62 F. test * LSD 5 % 0.17
2002/2003 20 kg N + 24 kg K2O/fad 19.58 20.04 19.54 19.77 20 kg N + 48 kg K2O/fad 20.33 20.85 20.23 20.38 40 kg N + 24 kg K2O/fad 18.84 19.36 19.16 19.08 40 kg N + 48 kg K2O/fad 19.34 20.01 19.71 19.78 60 kg N + 24 kg K2O/fad 18.18 18.98 18.68 18.23 60 kg N + 48 kg K2O/fad 18.76 19.43 19.11 18.66 80 kg N + 24 kg K2O/fad 16.95 17.56 17.11 17.24 80 kg N + 48 kg K2O/fad 17.55 18.03 17.61 17.81 F. test * LSD 5 % 0.24
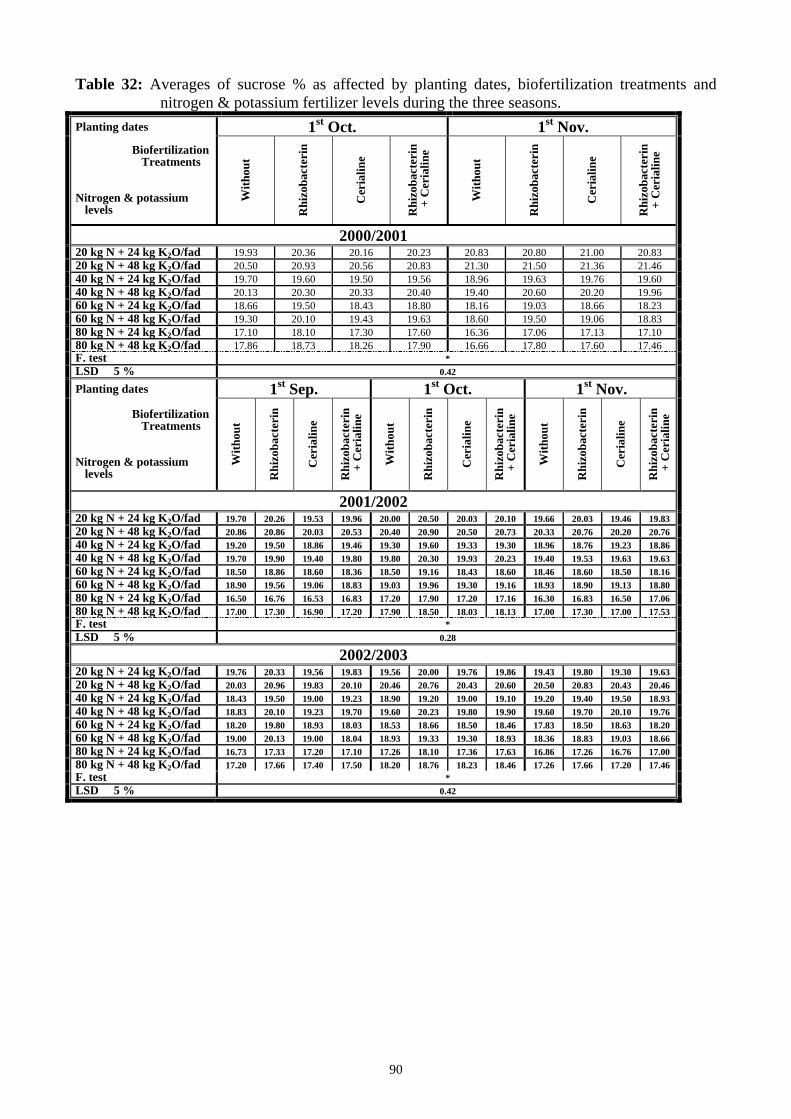
90
Table 32: Averages of sucrose % as affected by planting dates, biofertilization treatments and nitrogen & potassium fertilizer levels during the three seasons.
Planting dates 1st Oct. 1st Nov. Biofertilization
Treatments Nitrogen & potassium
levels
With
out
Rhi
zoba
cter
in
Cer
ialin
e
Rhi
zoba
cter
in
+ C
eria
line
With
out
Rhi
zoba
cter
in
Cer
ialin
e
Rhi
zoba
cter
in
+ C
eria
line
2000/2001 20 kg N + 24 kg K2O/fad 19.93 20.36 20.16 20.23 20.83 20.80 21.00 20.83 20 kg N + 48 kg K2O/fad 20.50 20.93 20.56 20.83 21.30 21.50 21.36 21.46 40 kg N + 24 kg K2O/fad 19.70 19.60 19.50 19.56 18.96 19.63 19.76 19.60 40 kg N + 48 kg K2O/fad 20.13 20.30 20.33 20.40 19.40 20.60 20.20 19.96 60 kg N + 24 kg K2O/fad 18.66 19.50 18.43 18.80 18.16 19.03 18.66 18.23 60 kg N + 48 kg K2O/fad 19.30 20.10 19.43 19.63 18.60 19.50 19.06 18.83 80 kg N + 24 kg K2O/fad 17.10 18.10 17.30 17.60 16.36 17.06 17.13 17.10 80 kg N + 48 kg K2O/fad 17.86 18.73 18.26 17.90 16.66 17.80 17.60 17.46 F. test * LSD 5 % 0.42
Planting dates 1st Sep. 1st Oct. 1st Nov. Biofertilization
Treatments Nitrogen & potassium
levels
With
out
Rhi
zoba
cter
in
Cer
ialin
e
Rhi
zoba
cter
in
+ C
eria
line
With
out
Rhi
zoba
cter
in
Cer
ialin
e
Rhi
zoba
cter
in
+ C
eria
line
With
out
Rhi
zoba
cter
in
Cer
ialin
e
Rhi
zoba
cter
in
+ C
eria
line
2001/2002 20 kg N + 24 kg K2O/fad 19.70 20.26 19.53 19.96 20.00 20.50 20.03 20.10 19.66 20.03 19.46 19.83 20 kg N + 48 kg K2O/fad 20.86 20.86 20.03 20.53 20.40 20.90 20.50 20.73 20.33 20.76 20.20 20.76 40 kg N + 24 kg K2O/fad 19.20 19.50 18.86 19.46 19.30 19.60 19.33 19.30 18.96 18.76 19.23 18.86 40 kg N + 48 kg K2O/fad 19.70 19.90 19.40 19.80 19.80 20.30 19.93 20.23 19.40 19.53 19.63 19.63 60 kg N + 24 kg K2O/fad 18.50 18.86 18.60 18.36 18.50 19.16 18.43 18.60 18.46 18.60 18.50 18.16 60 kg N + 48 kg K2O/fad 18.90 19.56 19.06 18.83 19.03 19.96 19.30 19.16 18.93 18.90 19.13 18.80 80 kg N + 24 kg K2O/fad 16.50 16.76 16.53 16.83 17.20 17.90 17.20 17.16 16.30 16.83 16.50 17.06 80 kg N + 48 kg K2O/fad 17.00 17.30 16.90 17.20 17.90 18.50 18.03 18.13 17.00 17.30 17.00 17.53 F. test * LSD 5 % 0.28
2002/2003 20 kg N + 24 kg K2O/fad 19.76 20.33 19.56 19.83 19.56 20.00 19.76 19.86 19.43 19.80 19.30 19.63 20 kg N + 48 kg K2O/fad 20.03 20.96 19.83 20.10 20.46 20.76 20.43 20.60 20.50 20.83 20.43 20.46 40 kg N + 24 kg K2O/fad 18.43 19.50 19.00 19.23 18.90 19.20 19.00 19.10 19.20 19.40 19.50 18.93 40 kg N + 48 kg K2O/fad 18.83 20.10 19.23 19.70 19.60 20.23 19.80 19.90 19.60 19.70 20.10 19.76 60 kg N + 24 kg K2O/fad 18.20 19.80 18.93 18.03 18.53 18.66 18.50 18.46 17.83 18.50 18.63 18.20 60 kg N + 48 kg K2O/fad 19.00 20.13 19.00 18.04 18.93 19.33 19.30 18.93 18.36 18.83 19.03 18.66 80 kg N + 24 kg K2O/fad 16.73 17.33 17.20 17.10 17.26 18.10 17.36 17.63 16.86 17.26 16.76 17.00 80 kg N + 48 kg K2O/fad 17.20 17.66 17.40 17.50 18.20 18.76 18.23 18.46 17.26 17.66 17.20 17.46 F. test * LSD 5 % 0.42
91
Referring to the effect of interaction among the three factors under investigation, it is clearly
seen that this interaction was significant in the three seasons (Table 32). The highest percentages of
sucrose (21.50, 20.90 and 20.96 %) were produced from planting beets on 1st November or October
or September in addition application of Rhizobacterin treatment + 20 kg N + 48 kg K2O/fad in the
first, second and third seasons, respectively.
3.3- Apparent purity percentage (%):
Data presented in Table 28 indicate the response of apparent purity % to planting dates,
biofertilization treatments, nitrogen and potassium fertilizer levels in 2000/2001, 2001/2002 and
2002/2003 seasons.
Effect of planting dates:
Respecting the effect of planting dates on purity %, it was reach to the level of significance
at 5 % of probability in the third season only, but in the first and second seasons, this effect failed to
reach the level of significance at 5 % of probability (Table 28). Planting sugar beet on 1st October
gave the maximum values of juice purity %, which records were 84.95, 82.47 and 85.64 % in the
first, second and third seasons, respectively. Whereas, the minimum ones (84.44, 79.36 and 81.15 %
in the first, second and third seasons, respectively) were obtained in view of plating beets on 1st
November in the first and second seasons, but in the third season its produced from planting on 1st
September. The favorable effect of planting sugar beet on 1st October on purity % might be backed
to the more suitable all environmental conditions during this period to formation more
photosynthates products, translocation and accumulation sucrose in storage roots. Similar findings
are acceptable with those supported by Leilah and Nasr (1992), Ghonema (1998) and Abo-Salama
and EL-Sayiad (2000).
Effect of biofertilization treatments:
As shown from data presented in Table 28, apparent purity % did not responded due to
biofertilization treatments in the first and second seasons, while in the third season there was a
significant response. It can be detected that inoculation soil of beets fields with Rhizobacterin
biofertilizer produced the highest values of juice purity %, where findings were 85.83 and 84.36 in
the first and third seasons, respectively. In contrast with that chick treatment (without
biofertilization) gave the highest average of this character (81.14 %) in the second season only.
Such light increases in apparent purity % due to biofertilization treatment certainly reflected to the
role of biofertilizers especially Rhizobacterin in improving growth and dry matter accumulation,
consequently enhancement sucrose content and reduction of impurity parameters in roots. Sultan et
al. (1999), Bassal et al. (2001) and Maareg and Sohir, Badr (2001) confirming these results.
92
Effect of nitrogen and potassium combination levels:
Increasing nitrogen fertilizer levels from 20 to 40, 60 and 80 kg N/fad tended to decrease
juice purity % from 90.94 to 83.62, 78.54 and 78.40 % as average of the three seasons. Similar
results are in agreement with those obtained by Azzazy (1998), Attia et al. (1999), Mahasen, Fahmi
(1999), Abd EL-Moneim (2000), Kandil et al. (2002 c) and Ramadan et al. (2003).
Increasing potassium fertilizer levels from 24 to 48 kg K2O/fad tended to increase purity %
from 82.19 to 83.55 % as average during the three seasons. Kandil et al. (2002 a) came to similar
trend.
The tabulated data in Table 28 reveal that nitrogen and potassium combination levels had a
significant effect on apparent purity % in the three seasons of study. Raising nitrogen and potassium
combination levels from 20 kg N + 24 kg K2O/fad to 80 kg N + 48 kg K2O/fad cleared a remarkable
reduction in juice purity % in all seasons. The highest values of purity % were recorded by
fertilizing beet plants with 20 kg N + 24 kg K2O/fad in the first season and by 20 kg N + 48 kg
K2O/fad in the second and third seasons. The corresponding data of its were 93.86, 89.55 and 90.16
% in the first, second and third season, respectively. The reduction in purity % owing to increase
nitrogen fertilizer levels can be attributed to its role in increasing impurity substances such as
proteins and alpha amino acid, and hence decreasing juice purity %. Similar results are in line with
recorded by Abou-Amou et al. (1996).
Effect of interactions:
With regard to the interaction between planting dates X nitrogen and potassium combination
levels on juice purity %, it was significant in the three growing seasons (Table 33). In the first
season, the highest value of purity % (94.90 %) resulted from planting on 1st November and
application of 20 kg N + 24 kg K2O/fad. While, in the second season the highest one (90.12 %) was
obtained from planting on 1st September and application of 20 kg N + 48 kg K2O/fad. On the other
hand, in the third season the highest one (92.98 %) was produced from planting on 1st October and
addition of 20 kg N + 24 kg K2O/fad.
4. YIELD CHARACTERS:
4.1- Root yield (t/fad):
Means of root yield (t/fad) as affected by planting dates, biofertilization treatments, nitrogen
and potassium fertilizer levels in the three seasons of this experimentation are listed in Table 34.
Effect of planting dates:
Planting dates of sugar beet exhibited significant effect on root yield in the three seasons of
study (Table 34). Generally, the optimum planting date was on 1st October so that produced the
highest values of root yield, which results were 15.500, 21.596 and 21.278 t/fad in the first, second
and third seasons, respectively. On the contrast, the lowest means of root yield (14.573, 20.709 and

93
Table 33: Averages of apparent purity % as affected by planting dates and nitrogen & potassium
fertilizer levels during the three seasons.
Seasons 2000/2001 2001/2002 2002/2003
Planting dates
NK levels 1st Oct. 1st Nov. 1st Sept. 1st Oct. 1st Nov. 1st Sept. 1st Oct. 1st Nov.
20 kg N + 24 kg K2O/fad 92.82 94.90 88.82 89.66 87.38 89.24 92.98 87.05
20 kg N + 48 kg K2O/fad 93.10 94.23 90.12 89.91 88.61 88.17 92.70 89.60
40 kg N + 24 kg K2O/fad 85.32 86.11 83.14 82.50 80.30 81.08 84.89 84.29
40 kg N + 48 kg K2O/fad 85.22 82.98 83.85 83.90 81.37 80.03 86.33 84.10
60 kg N + 24 kg K2O/fad 76.98 76.16 76.52 76.89 75.53 76.65 79.37 78.71
60 kg N + 48 kg K2O/fad 82.98 82.99 76.32 78.65 75.68 78.79 80.01 79.40
80 kg N + 24 kg K2O/fad 78.22 77.27 70.74 78.66 72.59 77.56 84.390 78.21
80 kg N + 48 kg K2O/fad 84.98 80.88 76.40 79.61 73.43 77.68 74.41 77.78
F. test * * *
LSD 5 % 2.07 1.51 1.83

94
19.404 t/fad in the first, second and third seasons, respectively) were achieved when delaying
planting up to 1st November in the first and third seasons and on 1st September in the second season.
The desirable effect of planting sugar beet on 1st October on root yield might be ascribed to the
seasonable environmental conditions during this period such as temperature, relative humidity
(Table 2), day length and light intensity which allow to rapid germination, establishment, vegetative
growth, development and ripening consequently increasing dry matter accumulation, yield
components as well as root yield per unit area. These results are in agreement with those reported
by Badawi (1985), EL-Kassaby and Leilah (1992 b), Badawi et al. (1995), Ghonema (1998), Abdou
(2000), Abo-Salama and EL-Sayiad (2000) and Kandil et al. (2002 c).
Effect of biofertilization treatments:
The collected data in Table 34 show that there were remarkable significant differences
among biofertilization treatments on root yield per faddan during the three growing seasons.
Noteworthy, Rhizobacterin biofertilizer was the best treatment among other biofertilization
treatments, which resulted in the maximum root yield (16.127, 22.485 and 21.887 t/fad) in the first,
second and third seasons, respectively. Furthermore, it exceeded control treatment (without
biofertilization) by 14.61, 20.40 and 17.83 % in the first, second and third seasons, respectively. It
was followed by the mixture of Rhizobacterin + Cerialine as biofertilizers, while Cerialine
biofertilizer came in the third rank with related to its effect on root yield in all seasons of this study.
This effect of biofertilization treatments expressly Rhizobacterin biofertilizer may be ascribed to its
role in improving plant growth, vigor of plant and yields through fixing atmospheric nitrogen and
mineralization and/or mineralizing organic compounds as well as release of certain growth
regulators, stimulatory compounds and nutrients in soil by the introduced organisms. Similar results
were in coincidence with those fixed by EL-Badry and EL-Bassel (1993), Favilli et al. (1993),
Cakmakci et al. (1999), Cakmakci et al. (2001), Kandil et al. (2002 c) and Ramadan et al. (2003).
Effect of nitrogen and potassium combination levels:
With expecting the effect of nitrogen fertilizer levels on root yield, increasing its levels from
20 to 40, 60 and 80 kg N/fad tended to increase root yield from 11.711 to 17.109, 22.807 and
23.682 t/fad as average of the three growing seasons. Noteworthy, increasing nitrogen levels from
60 to 80 kg caused an increase in root yield amounted by 3.836 %. On the other hand, increasing
nitrogen levels from 20 to 40 kg or from 40 to 60 kg N/fad caused increasing in root yield amounted
by 46.093 and 33.304 %, respectively. Similar findings were established by other workers including
Attia et al. (1999), EL-Hawary (1999), Abd EL-Moneim (2000), EL-Shahawy et al. (2002) and
Kandil et al. (2002 c) and Ramadan et al. (2003).
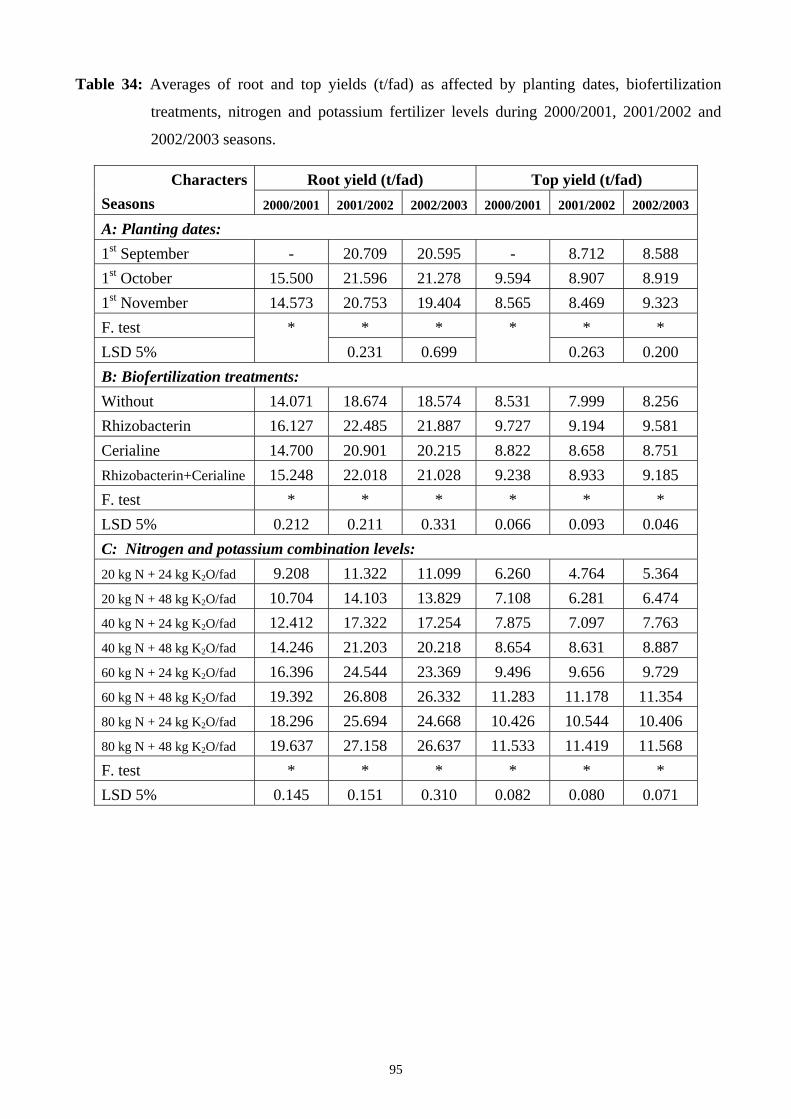
95
Table 34: Averages of root and top yields (t/fad) as affected by planting dates, biofertilization
treatments, nitrogen and potassium fertilizer levels during 2000/2001, 2001/2002 and
2002/2003 seasons.
Root yield (t/fad) Top yield (t/fad) Characters Seasons 2000/2001 2001/2002 2002/2003 2000/2001 2001/2002 2002/2003
A: Planting dates: 1st September - 20.709 20.595 - 8.712 8.588 1st October 15.500 21.596 21.278 9.594 8.907 8.919 1st November 14.573 20.753 19.404 8.565 8.469 9.323 F. test * * * * LSD 5%
* 0.231 0.699
* 0.263 0.200
B: Biofertilization treatments: Without 14.071 18.674 18.574 8.531 7.999 8.256 Rhizobacterin 16.127 22.485 21.887 9.727 9.194 9.581 Cerialine 14.700 20.901 20.215 8.822 8.658 8.751 Rhizobacterin+Cerialine 15.248 22.018 21.028 9.238 8.933 9.185 F. test * * * * * * LSD 5% 0.212 0.211 0.331 0.066 0.093 0.046 C: Nitrogen and potassium combination levels: 20 kg N + 24 kg K2O/fad 9.208 11.322 11.099 6.260 4.764 5.364 20 kg N + 48 kg K2O/fad 10.704 14.103 13.829 7.108 6.281 6.474 40 kg N + 24 kg K2O/fad 12.412 17.322 17.254 7.875 7.097 7.763 40 kg N + 48 kg K2O/fad 14.246 21.203 20.218 8.654 8.631 8.887 60 kg N + 24 kg K2O/fad 16.396 24.544 23.369 9.496 9.656 9.729 60 kg N + 48 kg K2O/fad 19.392 26.808 26.332 11.283 11.178 11.354 80 kg N + 24 kg K2O/fad 18.296 25.694 24.668 10.426 10.544 10.406 80 kg N + 48 kg K2O/fad 19.637 27.158 26.637 11.533 11.419 11.568 F. test * * * * * * LSD 5% 0.145 0.151 0.310 0.082 0.080 0.071
96
Increasing potassium fertilizer levels from 24 to 48 kg K2O/fad tended to increase root yield
from 17.632 to 20.022 t/fad as average of the three seasons. Similar findings were established by
other workers including EL-Moursy et al. (1998), Selim and EL-Ghinbihi (1999), EL-Zayat (2000),
Sohier, Ouda (2001) and Kandil et al. (2002 a).
Concerning the effect of nitrogen and potassium combination levels on root yield (t/fad), it
is clearly seen that increasing these levels from 20 kg N + 24 kg K2O/fad to 80 kg N + 48 kg
K2O/fad significantly increased root yield in all seasons of this research (Table 34). It can be easily
statement that gradual and conspicuous increases in root yield were observed as a result of
increasing nitrogen and potassium combination levels in all seasons. The highest yield of roots per
faddan was produced from fertilizing beet plants with 80 kg N + 48 kg K2O/fad, which recorded
data were 19.637, 27.158 and 26.637 t/fad in the first, second and third seasons, respectively. It was
followed by application of 60 kg N + 48 kg K2O/fad at the very least differences in comparison
with other applications. In contrast, application the lowest level of nitrogen and potassium
combinations (20 kg N + 24 kg K2O/fad) gave the lowest values of root yield (9.208, 11.322 and
11.099 t/fad) in the first, second and third seasons, respectively. The increase in root yield due to
application of nitrogen and potassium fertilization can be explained through the fact that nitrogen
and potassium has a vital role in building up metabolites, activating enzymes and carbohydrates
accumulation which transferred from leaves to developing roots which in turn enhanced root length,
diameter as well as root fresh weight and finally root yield per unit area. Badawi et al. (1995),
Samia, EL-Maghraby et al. (1998), EL-Shafai (2000), EL-Harriri and Mirvat, Gobarh (2001)
recorded similar tendency.
Effect of interactions:
The effect of interaction between planting dates X biofertilization treatments on root yield
was significant in the first and second seasons only. The optimum treatment that produced the
highest values of root yield (16.900 and 23.054 t/fad) was planting on 1st October and utilization
Rhizobacterin treatment in the first and second seasons, respectively (Table 35). On the other side,
the lowest values (13.833 and 18.512 t/fad) were followed from planting on 1st November and left
soil without biofertilization (control treatment) in the first and second seasons, respectively. Similar
results were established by Kandil et al. (2002 c).
The interaction between planting dates X nitrogen and potassium combination levels was
significant on root yield in the three seasons (Table 36). The highest values of root yield (20.217,
27.583 and 27.277 t/fad) were produced from planting beets on 1st October in combination with 80
kg N + 48 kg K2O/fad in the first, second and third seasons, respectively. On the contrary of that,
the lowest ones (8.875, 10.850 and 10.246 t/fad) accompanied with planting on 1st November and
97
application of 20 kg N + 24 kg K2O/fad in the first, second and third seasons, respectively. Similar
results were established by Badawi et al. (1995), Azzazy (1998) and Kandil et al. (2002 c).
The effect of interaction between biofertilization treatments X nitrogen and potassium
combination levels on root yield was significant in the three seasons. The optimum treatment that
produced the highest values of root yield was utilization Rhizobacterin combination with 80 kg N +
48 kg K2O/fad, where its results were 21.050, 28.978 and 28.280 t/fad in the first, second and third
seasons, respectively (Table 37). It was followed by the treatment of using Rhizobacterin plus 60 kg
N + 48 kg K2O/fad with lower differences compared with other treatments in all growing seasons.
These results were reported by Favilli et al. (1993), Sultan et al. (1999), Bassal et al. (2001),
Kandil et al. (2002 c), Soha, Khalil (2002) and Ramadan et al. (2003).
With connection the effect of the triple interaction on root yield (t/fad), it was significant in
the three seasons of study (Table 38). The highest means of root yield (21.967, 29.367 and 29.013
t/fad) were resulted from planting sugar beet during the first of October and utilization of
Rhizobacterin in addition to 80 kg N + 48 kg K2O/fad in the first, second and third seasons,
respectively. The best interaction ranked after formerly treatment was planting on 1st October +
Rhizobacterin + 60 kg N + 48 kg K2O/fad in all growing seasons. Abdou (2001) obtained results
partially like this direction.
4.2- Top yield (t/fad):
Data related to the effect of planting dates, biofertilization treatments, nitrogen and
potassium fertilizer levels on top yield (t/fad) during of 2000/2001, 2001/2002 and 2002/2003
seasons are shown in Table 34.
Effect of planting dates:
Planting dates had a significant effect on top yield (t/fad) during the three seasons of study
(Table 34). By Dwelling obtained data, the highest values of top yield (9.594, 8.907 and 9.323 t/fad
in the first, second and third seasons, respectively) could be obtained from planting beets on 1st
October in the first and second seasons, but from 1st November in the third season. On contrary of
that, the lowest means in this terms (8.565, 8.469 and 8.588 t/fad in the first, second and third
seasons, respectively) were obtained from planting on 1st November in the first and second seasons
and on 1st September in the third one. This enhancing in top yield/fad owing to planting beets on 1st
October may be attributed to corresponding environmental conditions in order to maximum sugar
beet growth and development. These results are in accordance with those referred by Badawi
(1985), EL-Kassaby and Leilah (1992 b), Badawi et al. (1995), Abd EL-Gawad et al. (2000),
Abdou (2000) and Kandil et al. (2002 c).
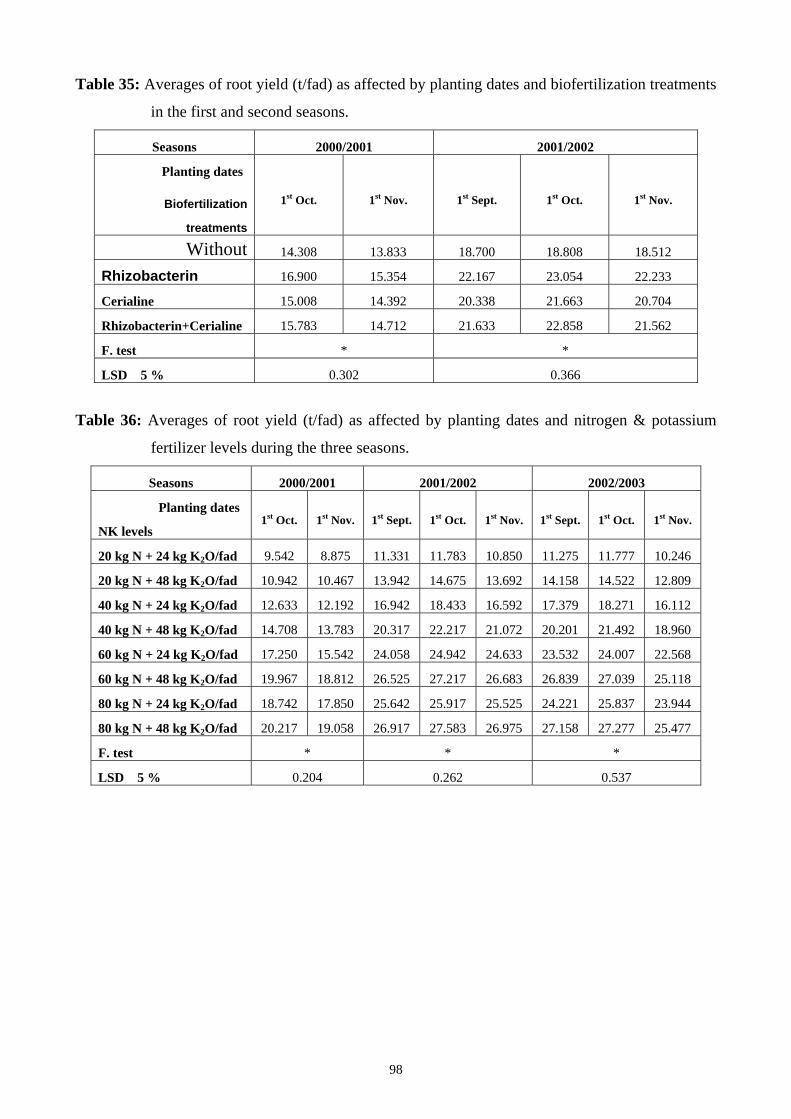
98
Table 35: Averages of root yield (t/fad) as affected by planting dates and biofertilization treatments
in the first and second seasons.
Seasons 2000/2001 2001/2002
Planting dates
Biofertilization
treatments
1st Oct. 1st Nov. 1st Sept. 1st Oct. 1st Nov.
Without 14.308 13.833 18.700 18.808 18.512
Rhizobacterin 16.900 15.354 22.167 23.054 22.233
Cerialine 15.008 14.392 20.338 21.663 20.704
Rhizobacterin+Cerialine 15.783 14.712 21.633 22.858 21.562
F. test * *
LSD 5 % 0.302 0.366
Table 36: Averages of root yield (t/fad) as affected by planting dates and nitrogen & potassium
fertilizer levels during the three seasons.
Seasons 2000/2001 2001/2002 2002/2003
Planting dates
NK levels 1st Oct. 1st Nov. 1st Sept. 1st Oct. 1st Nov. 1st Sept. 1st Oct. 1st Nov.
20 kg N + 24 kg K2O/fad 9.542 8.875 11.331 11.783 10.850 11.275 11.777 10.246
20 kg N + 48 kg K2O/fad 10.942 10.467 13.942 14.675 13.692 14.158 14.522 12.809
40 kg N + 24 kg K2O/fad 12.633 12.192 16.942 18.433 16.592 17.379 18.271 16.112
40 kg N + 48 kg K2O/fad 14.708 13.783 20.317 22.217 21.072 20.201 21.492 18.960
60 kg N + 24 kg K2O/fad 17.250 15.542 24.058 24.942 24.633 23.532 24.007 22.568
60 kg N + 48 kg K2O/fad 19.967 18.812 26.525 27.217 26.683 26.839 27.039 25.118
80 kg N + 24 kg K2O/fad 18.742 17.850 25.642 25.917 25.525 24.221 25.837 23.944
80 kg N + 48 kg K2O/fad 20.217 19.058 26.917 27.583 26.975 27.158 27.277 25.477
F. test * * *
LSD 5 % 0.204 0.262 0.537
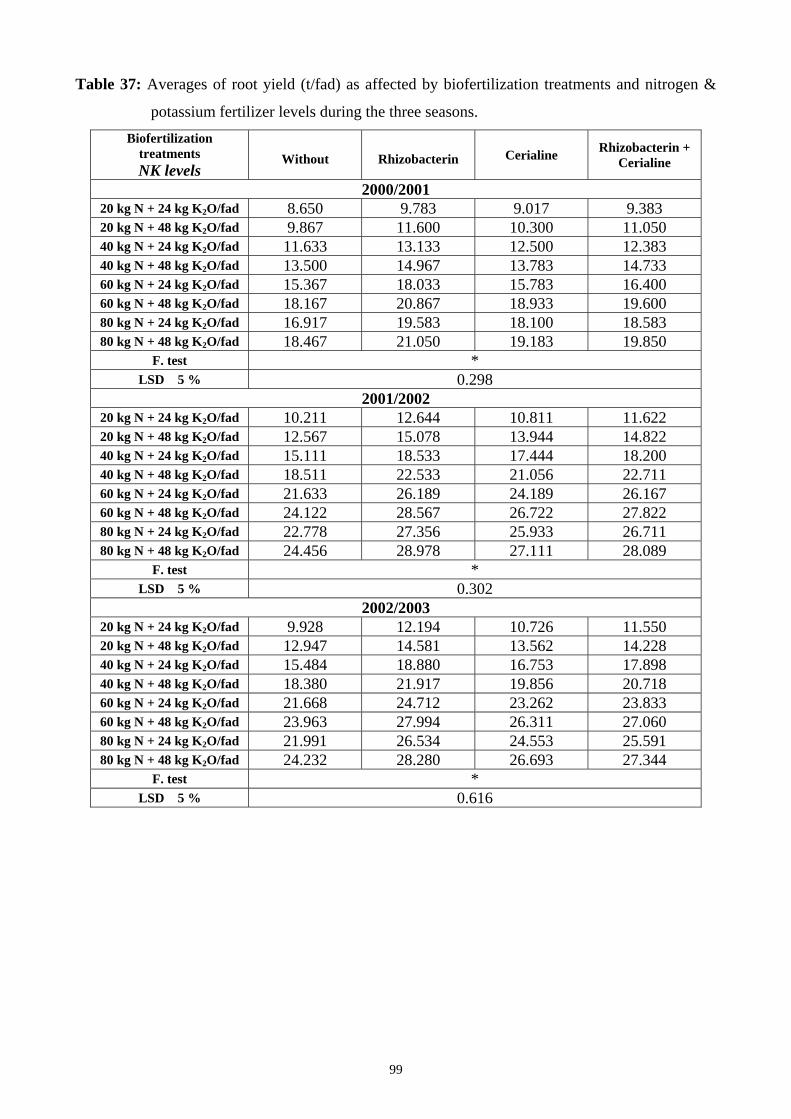
99
Table 37: Averages of root yield (t/fad) as affected by biofertilization treatments and nitrogen &
potassium fertilizer levels during the three seasons. Biofertilization
treatments NK levels
Without Rhizobacterin Cerialine Rhizobacterin + Cerialine
2000/2001 20 kg N + 24 kg K2O/fad 8.650 9.783 9.017 9.383 20 kg N + 48 kg K2O/fad 9.867 11.600 10.300 11.050 40 kg N + 24 kg K2O/fad 11.633 13.133 12.500 12.383 40 kg N + 48 kg K2O/fad 13.500 14.967 13.783 14.733 60 kg N + 24 kg K2O/fad 15.367 18.033 15.783 16.400 60 kg N + 48 kg K2O/fad 18.167 20.867 18.933 19.600 80 kg N + 24 kg K2O/fad 16.917 19.583 18.100 18.583 80 kg N + 48 kg K2O/fad 18.467 21.050 19.183 19.850
F. test * LSD 5 % 0.298
2001/2002 20 kg N + 24 kg K2O/fad 10.211 12.644 10.811 11.622 20 kg N + 48 kg K2O/fad 12.567 15.078 13.944 14.822 40 kg N + 24 kg K2O/fad 15.111 18.533 17.444 18.200 40 kg N + 48 kg K2O/fad 18.511 22.533 21.056 22.711 60 kg N + 24 kg K2O/fad 21.633 26.189 24.189 26.167 60 kg N + 48 kg K2O/fad 24.122 28.567 26.722 27.822 80 kg N + 24 kg K2O/fad 22.778 27.356 25.933 26.711 80 kg N + 48 kg K2O/fad 24.456 28.978 27.111 28.089
F. test * LSD 5 % 0.302
2002/2003 20 kg N + 24 kg K2O/fad 9.928 12.194 10.726 11.550 20 kg N + 48 kg K2O/fad 12.947 14.581 13.562 14.228 40 kg N + 24 kg K2O/fad 15.484 18.880 16.753 17.898 40 kg N + 48 kg K2O/fad 18.380 21.917 19.856 20.718 60 kg N + 24 kg K2O/fad 21.668 24.712 23.262 23.833 60 kg N + 48 kg K2O/fad 23.963 27.994 26.311 27.060 80 kg N + 24 kg K2O/fad 21.991 26.534 24.553 25.591 80 kg N + 48 kg K2O/fad 24.232 28.280 26.693 27.344
F. test * LSD 5 % 0.616
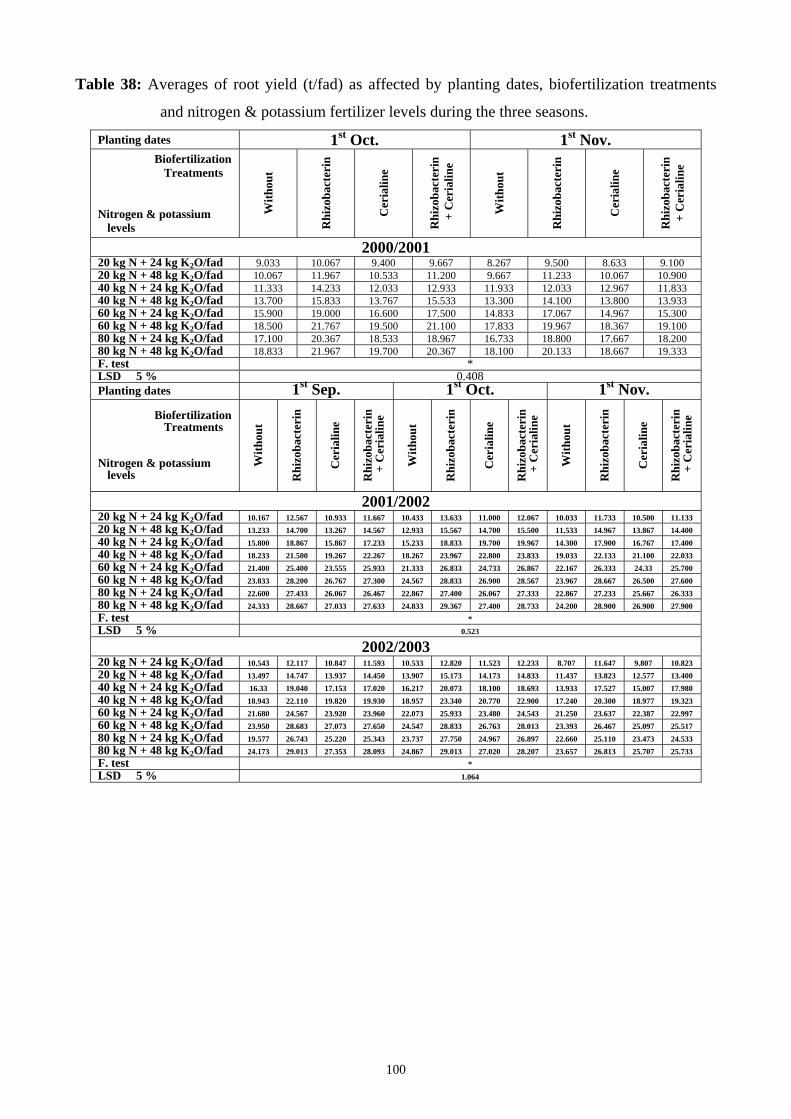
100
Table 38: Averages of root yield (t/fad) as affected by planting dates, biofertilization treatments
and nitrogen & potassium fertilizer levels during the three seasons.
Planting dates 1st Oct. 1st Nov. Biofertilization
Treatments Nitrogen & potassium
levels
With
out
Rhi
zoba
cter
in
Cer
ialin
e
Rhi
zoba
cter
in
+ C
eria
line
With
out
Rhi
zoba
cter
in
Cer
ialin
e
Rhi
zoba
cter
in
+ C
eria
line
2000/2001 20 kg N + 24 kg K2O/fad 9.033 10.067 9.400 9.667 8.267 9.500 8.633 9.100 20 kg N + 48 kg K2O/fad 10.067 11.967 10.533 11.200 9.667 11.233 10.067 10.900 40 kg N + 24 kg K2O/fad 11.333 14.233 12.033 12.933 11.933 12.033 12.967 11.833 40 kg N + 48 kg K2O/fad 13.700 15.833 13.767 15.533 13.300 14.100 13.800 13.933 60 kg N + 24 kg K2O/fad 15.900 19.000 16.600 17.500 14.833 17.067 14.967 15.300 60 kg N + 48 kg K2O/fad 18.500 21.767 19.500 21.100 17.833 19.967 18.367 19.100 80 kg N + 24 kg K2O/fad 17.100 20.367 18.533 18.967 16.733 18.800 17.667 18.200 80 kg N + 48 kg K2O/fad 18.833 21.967 19.700 20.367 18.100 20.133 18.667 19.333 F. test * LSD 5 % 0.408 Planting dates 1st Sep. 1st Oct. 1st Nov.
Biofertilization Treatments
Nitrogen & potassium
levels
With
out
Rhi
zoba
cter
in
Cer
ialin
e
Rhi
zoba
cter
in
+ C
eria
line
With
out
Rhi
zoba
cter
in
Cer
ialin
e
Rhi
zoba
cter
in
+ C
eria
line
With
out
Rhi
zoba
cter
in
Cer
ialin
e
Rhi
zoba
cter
in
+ C
eria
line
2001/2002 20 kg N + 24 kg K2O/fad 10.167 12.567 10.933 11.667 10.433 13.633 11.000 12.067 10.033 11.733 10.500 11.133 20 kg N + 48 kg K2O/fad 13.233 14.700 13.267 14.567 12.933 15.567 14.700 15.500 11.533 14.967 13.867 14.400 40 kg N + 24 kg K2O/fad 15.800 18.867 15.867 17.233 15.233 18.833 19.700 19.967 14.300 17.900 16.767 17.400 40 kg N + 48 kg K2O/fad 18.233 21.500 19.267 22.267 18.267 23.967 22.800 23.833 19.033 22.133 21.100 22.033 60 kg N + 24 kg K2O/fad 21.400 25.400 23.555 25.933 21.333 26.833 24.733 26.867 22.167 26.333 24.33 25.700 60 kg N + 48 kg K2O/fad 23.833 28.200 26.767 27.300 24.567 28.833 26.900 28.567 23.967 28.667 26.500 27.600 80 kg N + 24 kg K2O/fad 22.600 27.433 26.067 26.467 22.867 27.400 26.067 27.333 22.867 27.233 25.667 26.333 80 kg N + 48 kg K2O/fad 24.333 28.667 27.033 27.633 24.833 29.367 27.400 28.733 24.200 28.900 26.900 27.900 F. test * LSD 5 % 0.523
2002/2003 20 kg N + 24 kg K2O/fad 10.543 12.117 10.847 11.593 10.533 12.820 11.523 12.233 8.707 11.647 9.807 10.823 20 kg N + 48 kg K2O/fad 13.497 14.747 13.937 14.450 13.907 15.173 14.173 14.833 11.437 13.823 12.577 13.400 40 kg N + 24 kg K2O/fad 16.33 19.040 17.153 17.020 16.217 20.073 18.100 18.693 13.933 17.527 15.007 17.980 40 kg N + 48 kg K2O/fad 18.943 22.110 19.820 19.930 18.957 23.340 20.770 22.900 17.240 20.300 18.977 19.323 60 kg N + 24 kg K2O/fad 21.680 24.567 23.920 23.960 22.073 25.933 23.480 24.543 21.250 23.637 22.387 22.997 60 kg N + 48 kg K2O/fad 23.950 28.683 27.073 27.650 24.547 28.833 26.763 28.013 23.393 26.467 25.097 25.517 80 kg N + 24 kg K2O/fad 19.577 26.743 25.220 25.343 23.737 27.750 24.967 26.897 22.660 25.110 23.473 24.533 80 kg N + 48 kg K2O/fad 24.173 29.013 27.353 28.093 24.867 29.013 27.020 28.207 23.657 26.813 25.707 25.733 F. test * LSD 5 % 1.064
101
Effect of biofertilization treatments:
In the three growing seasons, biofertilization treatments caused a significant increase in top
yield per faddan. The optimum biofertilization treatments was Rhizobacterin treatment, thereby its
caused significant increase and the greatest values of top yield, which registered data were 9.727,
9.194 and 9.581 t/fad in the first, second and third seasons, respectively (Table 34). However,
Rhizobacterin + Cerialine treatment came in the second rank after aforementioned treatment, then
Cerialine treatment with concern its effect on top yield in the three seasons. On the other hand, the
lowest averages of this character (8.531, 7.999 and 8.256 t/fad) were arised from control treatment
(without biofertilization) in the first, second and third seasons, respectively. This progressive effect
of biofertilizers (Rhizobacterin and Cerialine) may be due to its role in enhancing growth of sugar
beet plants. Moreover, to the effect of nitrogen which produced via bacteria in addition to GA3 and
IAA that stimulate vegetative growth and consequently top yield per faddan. A positive association
between biofertilization treatments and top yield per faddan has been reported by Abo EL-Goud
(2000), Bassal et al. (2001), Kandil et al. (2002 c) and Ramadan et al. (2003).
Effect of nitrogen and potassium combination levels:
Increasing nitrogen fertilizer levels from 20 to 40, 60 and 80 kg N/fad tended to increase top
yield from 6.042 to 8.151, 10.449 and 10.983 t/fad as average during the three seasons, respectively.
Similar trend was established by Attia et al. (1999), EL-Hawary (1999), Abd EL-Moneim (2000),
Sohier, Ouda (2001), Kandil et al. (2002 c), Nemeat Alla et al. (2002) and Ramadan et al. (2003).
Increasing potassium fertilizer levels from 24 to 48 kg K2O/fad tended to increase top yield
from 8.282 to 9.531 t/fad as average in the three seasons. EL-Moursy et al. (1998), Selim and EL-
Ghinbihi (1999), EL-Zayat (2000), Sohier, Ouda (2001) and Kandil et al. (2002 a) came to like
trend.
As shown from tabulated data in Table 34, nitrogen and potassium combination levels
exhibited remarkable differences on top yield (t/fad) in the three seasons. The highest level of
nitrogen and potassium combination (80 kg N + 48 kg K2O/fad) led to record the greatest means of
top yield, which were 11.533, 11.419 and 11.568 t/fad in the first, second and third seasons,
respectively. The best application followed by previous level was fertilizing beet plant with 60 kg N
+ 48 kg K2O/fad, which the differences between them were fewer than those among other levels in
all growing seasons of this study. Whereas, application of 20 kg N + 24 kg K2O/fad resulted in the
lowest values of this trait, 6.560, 4.764 and 5.364 in the first, second and third seasons, respectively.
Further addition of nitrogen and potassium stimulates top growth and cause canopy regeneration to
continuous late into the season and directs photosynthates into top production rather than root
storage. Also it is well known that nitrogen and potassium fertilizers increase dry matter
accumulation as previously mentioned. These findings are in great accordance with those confirmed
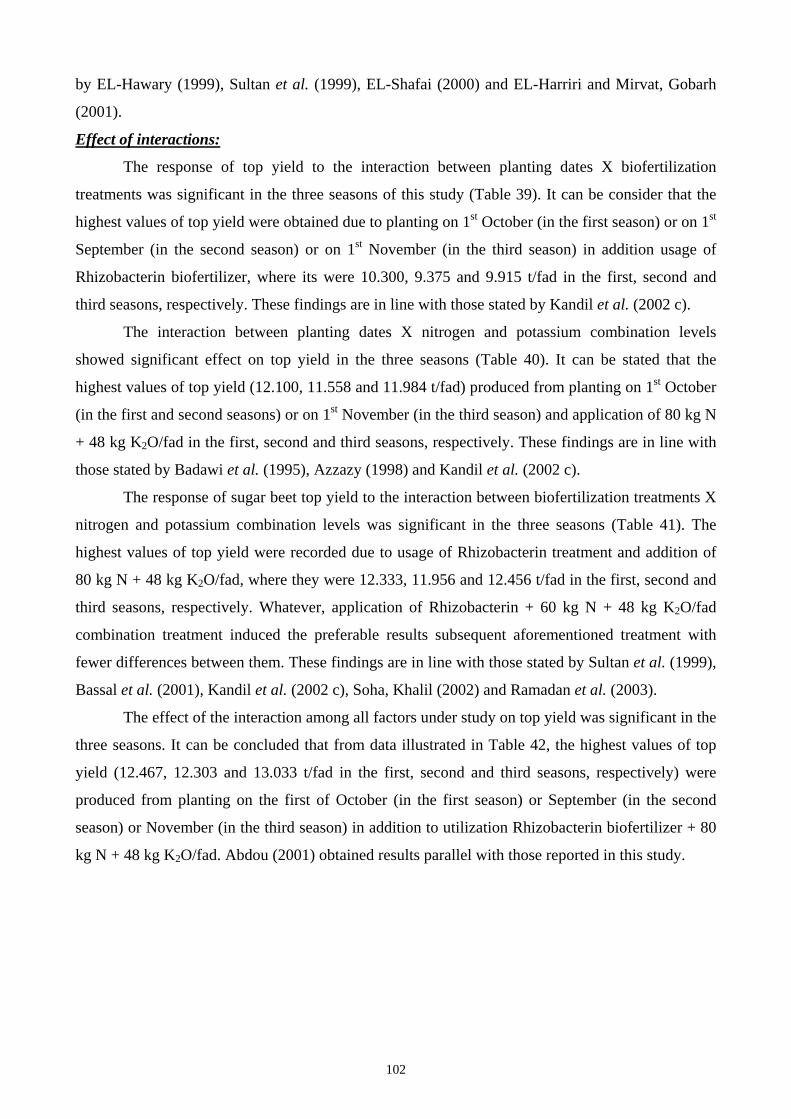
102
by EL-Hawary (1999), Sultan et al. (1999), EL-Shafai (2000) and EL-Harriri and Mirvat, Gobarh
(2001).
Effect of interactions:
The response of top yield to the interaction between planting dates X biofertilization
treatments was significant in the three seasons of this study (Table 39). It can be consider that the
highest values of top yield were obtained due to planting on 1st October (in the first season) or on 1st
September (in the second season) or on 1st November (in the third season) in addition usage of
Rhizobacterin biofertilizer, where its were 10.300, 9.375 and 9.915 t/fad in the first, second and
third seasons, respectively. These findings are in line with those stated by Kandil et al. (2002 c).
The interaction between planting dates X nitrogen and potassium combination levels
showed significant effect on top yield in the three seasons (Table 40). It can be stated that the
highest values of top yield (12.100, 11.558 and 11.984 t/fad) produced from planting on 1st October
(in the first and second seasons) or on 1st November (in the third season) and application of 80 kg N
+ 48 kg K2O/fad in the first, second and third seasons, respectively. These findings are in line with
those stated by Badawi et al. (1995), Azzazy (1998) and Kandil et al. (2002 c).
The response of sugar beet top yield to the interaction between biofertilization treatments X
nitrogen and potassium combination levels was significant in the three seasons (Table 41). The
highest values of top yield were recorded due to usage of Rhizobacterin treatment and addition of
80 kg N + 48 kg K2O/fad, where they were 12.333, 11.956 and 12.456 t/fad in the first, second and
third seasons, respectively. Whatever, application of Rhizobacterin + 60 kg N + 48 kg K2O/fad
combination treatment induced the preferable results subsequent aforementioned treatment with
fewer differences between them. These findings are in line with those stated by Sultan et al. (1999),
Bassal et al. (2001), Kandil et al. (2002 c), Soha, Khalil (2002) and Ramadan et al. (2003).
The effect of the interaction among all factors under study on top yield was significant in the
three seasons. It can be concluded that from data illustrated in Table 42, the highest values of top
yield (12.467, 12.303 and 13.033 t/fad in the first, second and third seasons, respectively) were
produced from planting on the first of October (in the first season) or September (in the second
season) or November (in the third season) in addition to utilization Rhizobacterin biofertilizer + 80
kg N + 48 kg K2O/fad. Abdou (2001) obtained results parallel with those reported in this study.
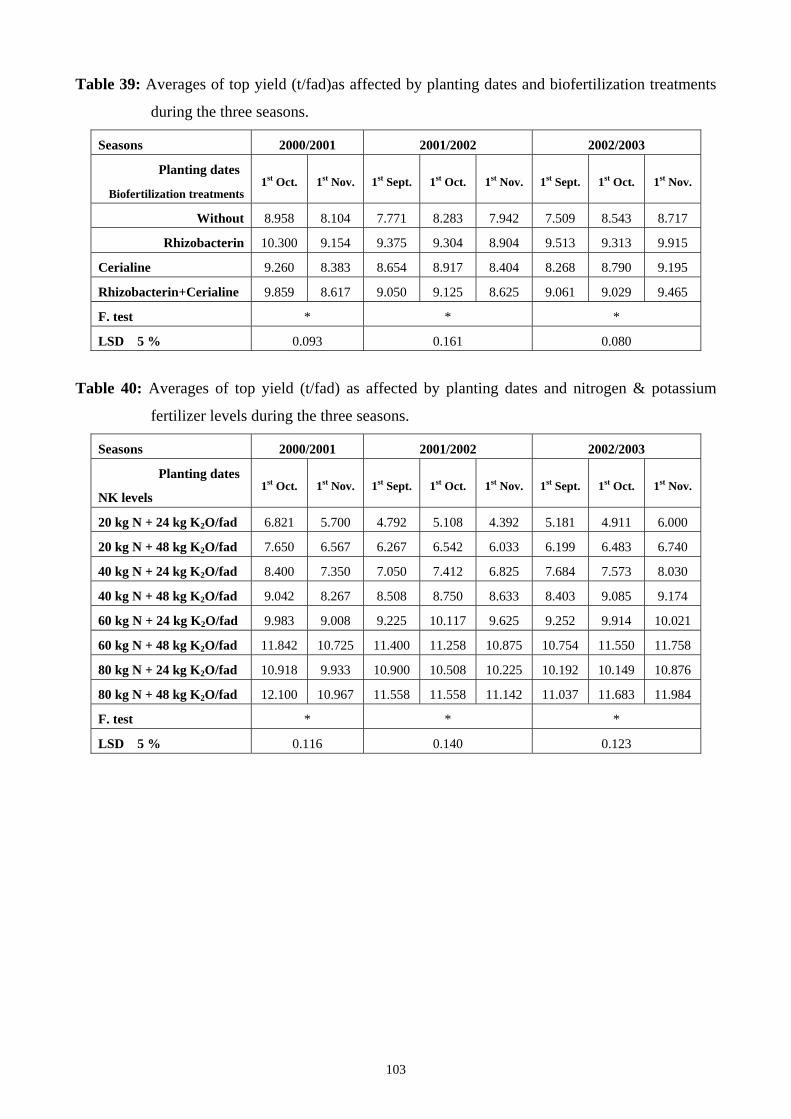
103
Table 39: Averages of top yield (t/fad)as affected by planting dates and biofertilization treatments
during the three seasons.
Seasons 2000/2001 2001/2002 2002/2003
Planting dates
Biofertilization treatments 1st Oct. 1st Nov. 1st Sept. 1st Oct. 1st Nov. 1st Sept. 1st Oct. 1st Nov.
Without 8.958 8.104 7.771 8.283 7.942 7.509 8.543 8.717
Rhizobacterin 10.300 9.154 9.375 9.304 8.904 9.513 9.313 9.915
Cerialine 9.260 8.383 8.654 8.917 8.404 8.268 8.790 9.195
Rhizobacterin+Cerialine 9.859 8.617 9.050 9.125 8.625 9.061 9.029 9.465
F. test * * *
LSD 5 % 0.093 0.161 0.080
Table 40: Averages of top yield (t/fad) as affected by planting dates and nitrogen & potassium
fertilizer levels during the three seasons.
Seasons 2000/2001 2001/2002 2002/2003
Planting dates
NK levels 1st Oct. 1st Nov. 1st Sept. 1st Oct. 1st Nov. 1st Sept. 1st Oct. 1st Nov.
20 kg N + 24 kg K2O/fad 6.821 5.700 4.792 5.108 4.392 5.181 4.911 6.000
20 kg N + 48 kg K2O/fad 7.650 6.567 6.267 6.542 6.033 6.199 6.483 6.740
40 kg N + 24 kg K2O/fad 8.400 7.350 7.050 7.412 6.825 7.684 7.573 8.030
40 kg N + 48 kg K2O/fad 9.042 8.267 8.508 8.750 8.633 8.403 9.085 9.174
60 kg N + 24 kg K2O/fad 9.983 9.008 9.225 10.117 9.625 9.252 9.914 10.021
60 kg N + 48 kg K2O/fad 11.842 10.725 11.400 11.258 10.875 10.754 11.550 11.758
80 kg N + 24 kg K2O/fad 10.918 9.933 10.900 10.508 10.225 10.192 10.149 10.876
80 kg N + 48 kg K2O/fad 12.100 10.967 11.558 11.558 11.142 11.037 11.683 11.984
F. test * * *
LSD 5 % 0.116 0.140 0.123

104
Table 41: Averages of top yield (t/fad) as affected by biofertilization treatments and nitrogen &
potassium fertilizer levels during the three seasons. Biofertilization treatments NK levels Without Rhizobacterin Cerialine Rhizobacterin +
Cerialine 2000/2001
20 kg N + 24 kg K2O/fad 5.867 6.683 6.158 6.333 20 kg N + 48 kg K2O/fad 6.733 7.600 6.933 7.167 40 kg N + 24 kg K2O/fad 7.317 8.517 7.717 7.950 40 kg N + 48 kg K2O/fad 7.917 9.350 8.483 8.867 60 kg N + 24 kg K2O/fad 8.583 10.100 9.333 9.967 60 kg N + 48 kg K2O/fad 10.833 12.067 10.850 11.383 80 kg N + 24 kg K2O/fad 9.867 11.168 10.000 10.668 80 kg N + 48 kg K2O/fad 11.133 12.333 11.100 11.567 F. test * LSD 5 % 0.164
2001/2002 20 kg N + 24 kg K2O/fad 4.300 5.111 4.678 4.967 20 kg N + 48 kg K2O/fad 5.911 6.522 6.256 6.433 40 kg N + 24 kg K2O/fad 6.467 7.522 7.111 7.289 40 kg N + 48 kg K2O/fad 7.533 9.622 8.533 8.833 60 kg N + 24 kg K2O/fad 8.611 10.222 9.722 10.067 60 kg N + 48 kg K2O/fad 10.533 11.633 11.100 11.444 80 kg N + 24 kg K2O/fad 9.800 10.967 10.611 10.800 80 kg N + 48 kg K2O/fad 10.833 11.956 11.256 11.633 F. test * LSD 5 % 0.160
2002/2003 20 kg N + 24 kg K2O/fad 4.909 5.787 5.258 5.502 20 kg N + 48 kg K2O/fad 6.118 6.743 6.423 6.612 40 kg N + 24 kg K2O/fad 7.128 8.348 7.626 7.949 40 kg N + 48 kg K2O/fad 8.393 9.472 8.626 9.059 60 kg N + 24 kg K2O/fad 9.066 10.311 9.682 9.857 60 kg N + 48 kg K2O/fad 10.341 12.293 10.996 11.786 80 kg N + 24 kg K2O/fad 9.496 11.236 10.199 10.693 80 kg N + 48 kg K2O/fad 10.600 12.456 11.198 12.020 F. test * LSD 5 % 0.140
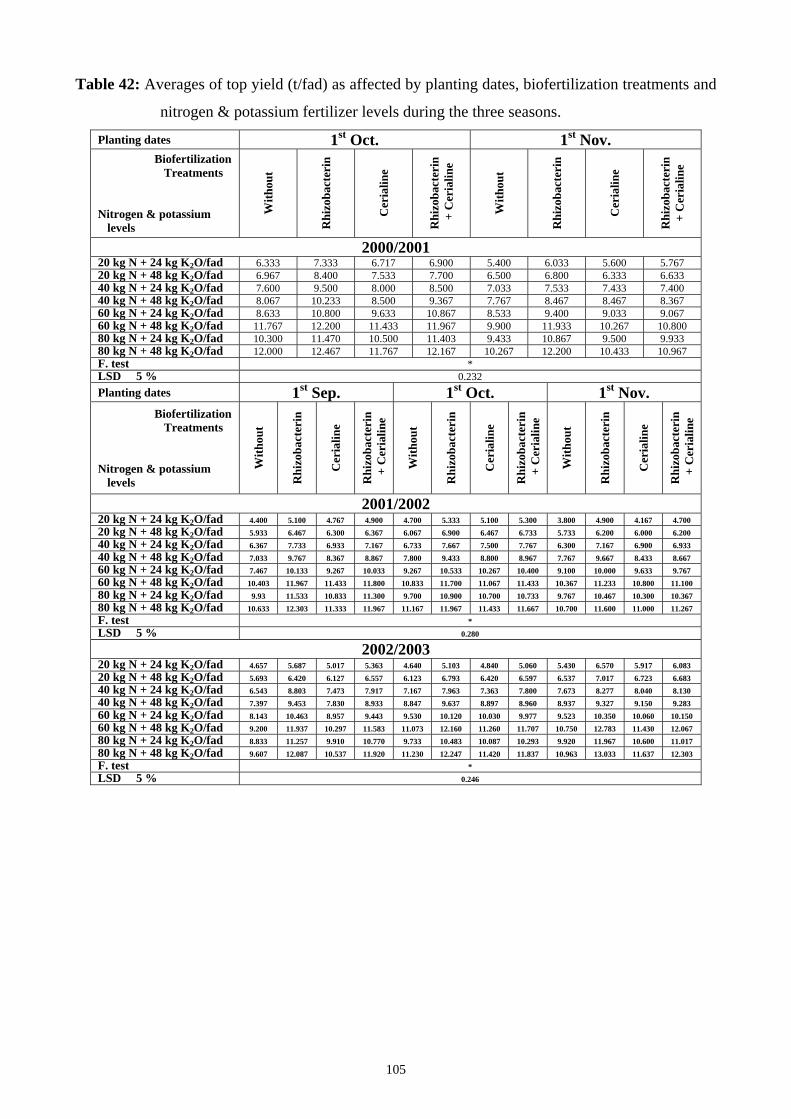
105
Table 42: Averages of top yield (t/fad) as affected by planting dates, biofertilization treatments and
nitrogen & potassium fertilizer levels during the three seasons.
Planting dates 1st Oct. 1st Nov. Biofertilization
Treatments Nitrogen & potassium
levels
With
out
Rhi
zoba
cter
in
Cer
ialin
e
Rhi
zoba
cter
in
+ C
eria
line
With
out
Rhi
zoba
cter
in
Cer
ialin
e
Rhi
zoba
cter
in
+ C
eria
line
2000/2001 20 kg N + 24 kg K2O/fad 6.333 7.333 6.717 6.900 5.400 6.033 5.600 5.767 20 kg N + 48 kg K2O/fad 6.967 8.400 7.533 7.700 6.500 6.800 6.333 6.633 40 kg N + 24 kg K2O/fad 7.600 9.500 8.000 8.500 7.033 7.533 7.433 7.400 40 kg N + 48 kg K2O/fad 8.067 10.233 8.500 9.367 7.767 8.467 8.467 8.367 60 kg N + 24 kg K2O/fad 8.633 10.800 9.633 10.867 8.533 9.400 9.033 9.067 60 kg N + 48 kg K2O/fad 11.767 12.200 11.433 11.967 9.900 11.933 10.267 10.800 80 kg N + 24 kg K2O/fad 10.300 11.470 10.500 11.403 9.433 10.867 9.500 9.933 80 kg N + 48 kg K2O/fad 12.000 12.467 11.767 12.167 10.267 12.200 10.433 10.967 F. test * LSD 5 % 0.232 Planting dates 1st Sep. 1st Oct. 1st Nov.
Biofertilization Treatments
Nitrogen & potassium
levels
With
out
Rhi
zoba
cter
in
Cer
ialin
e
Rhi
zoba
cter
in
+ C
eria
line
With
out
Rhi
zoba
cter
in
Cer
ialin
e
Rhi
zoba
cter
in
+ C
eria
line
With
out
Rhi
zoba
cter
in
Cer
ialin
e
Rhi
zoba
cter
in
+ C
eria
line
2001/2002 20 kg N + 24 kg K2O/fad 4.400 5.100 4.767 4.900 4.700 5.333 5.100 5.300 3.800 4.900 4.167 4.700 20 kg N + 48 kg K2O/fad 5.933 6.467 6.300 6.367 6.067 6.900 6.467 6.733 5.733 6.200 6.000 6.200 40 kg N + 24 kg K2O/fad 6.367 7.733 6.933 7.167 6.733 7.667 7.500 7.767 6.300 7.167 6.900 6.933 40 kg N + 48 kg K2O/fad 7.033 9.767 8.367 8.867 7.800 9.433 8.800 8.967 7.767 9.667 8.433 8.667 60 kg N + 24 kg K2O/fad 7.467 10.133 9.267 10.033 9.267 10.533 10.267 10.400 9.100 10.000 9.633 9.767 60 kg N + 48 kg K2O/fad 10.403 11.967 11.433 11.800 10.833 11.700 11.067 11.433 10.367 11.233 10.800 11.100 80 kg N + 24 kg K2O/fad 9.93 11.533 10.833 11.300 9.700 10.900 10.700 10.733 9.767 10.467 10.300 10.367 80 kg N + 48 kg K2O/fad 10.633 12.303 11.333 11.967 11.167 11.967 11.433 11.667 10.700 11.600 11.000 11.267 F. test * LSD 5 % 0.280
2002/2003 20 kg N + 24 kg K2O/fad 4.657 5.687 5.017 5.363 4.640 5.103 4.840 5.060 5.430 6.570 5.917 6.083 20 kg N + 48 kg K2O/fad 5.693 6.420 6.127 6.557 6.123 6.793 6.420 6.597 6.537 7.017 6.723 6.683 40 kg N + 24 kg K2O/fad 6.543 8.803 7.473 7.917 7.167 7.963 7.363 7.800 7.673 8.277 8.040 8.130 40 kg N + 48 kg K2O/fad 7.397 9.453 7.830 8.933 8.847 9.637 8.897 8.960 8.937 9.327 9.150 9.283 60 kg N + 24 kg K2O/fad 8.143 10.463 8.957 9.443 9.530 10.120 10.030 9.977 9.523 10.350 10.060 10.150 60 kg N + 48 kg K2O/fad 9.200 11.937 10.297 11.583 11.073 12.160 11.260 11.707 10.750 12.783 11.430 12.067 80 kg N + 24 kg K2O/fad 8.833 11.257 9.910 10.770 9.733 10.483 10.087 10.293 9.920 11.967 10.600 11.017 80 kg N + 48 kg K2O/fad 9.607 12.087 10.537 11.920 11.230 12.247 11.420 11.837 10.963 13.033 11.637 12.303 F. test * LSD 5 % 0.246
106
4.3- Sugar yield (t/fad):
Means of sugar yield (t/fad) in response to planting dates, biofertilization treatments,
nitrogen and potassium fertilizer levels in the three seasons are presented in Table 43.
Effect of planting dates:
Significant differences between planting dates of sugar beet were found in the three seasons
of study (Table 43). It can be consider that, the optimum planting date which gave the highest
means of sugar yield i.e. 2.975, 4.111 and 4.035 t/fad in the first, second and third seasons,
respectively were recorded from planting beets on 1st October. In adversely, planting sugar beet on
1st November resulted in the lowest values of this trait, where results were 2.754, 3.840 and 3.603
t/fad in the first, second and third seasons, respectively. This achievement in sugar yield (t/fad) may
be backed to the positive effect of planting sugar beet during the first October on fresh weight/plant,
root yield and sucrose %, which greatly affected sugar production per unit area. These results like to
those reported by Badawi (1985), EL-Kassaby and Leilah (1992 b), Badawi et al. (1995), Abd EL-
Gawad et al. (2000), Abdou (2000), Abo-Salama and EL-Sayiad (2000) and Kandil et al. (2002 c).
Effect of biofertilization treatments:
Concerning the effect of biofertilization treatments on sugar yield per faddan, it was
significant in all growing seasons as shown in Table 43. It was noticeable that, inoculation soil of
sugar beet field with Rhizobacterin was the most favorable biofertilization treatment and produced
the highest averages of sugar yield per unit area. The corresponding data, with respect formerly
treatment were 3.127, 4.263 and 4.179 t/fad in the first, second and third seasons, respectively. On
the contrary, left soil without inoculation with biofertilizers (control treatment) had the opposite
direction, which resulted in the lowest values of this character, 2.63, 3.467 and 3.434 t/fad in the
first, second and third seasons, respectively. It was worthy to mentioned that, Rhizobacterin +
Cerialine treatment came in the second rank, and then Cerialine treatment with regard to their effect
on sugar yield in all growing seasons of this work. The trend of these results may be reflected to the
considerable increase in root weight/plant, root yield/fad and sucrose % by biofertilization
treatments (Rhizobacterin and Cerialine) as mentioned before. Similar trend of sugar yield per unit
area was suggested by EL-Badry and EL-Bassel (1993), Cakmakci et al. (1999), Kandil et al. (2002
c) and Ramadan et al. (2003).
Effect of nitrogen and potassium combination levels:
Increasing nitrogen fertilizer levels from 20 to 40 and 60 kg N/fad tended to increase sugar
yield from 2.388 to 3.353 and 4.308 t/fad as average of the three seasons, respectively. However,
Increasing nitrogen levels from 60 to 80 kg N/fad tended to decrease sugar yield from 4.308 to
4.123 t/fad as average over seasons. These results agree with those suggested by Attia et al. (1999),
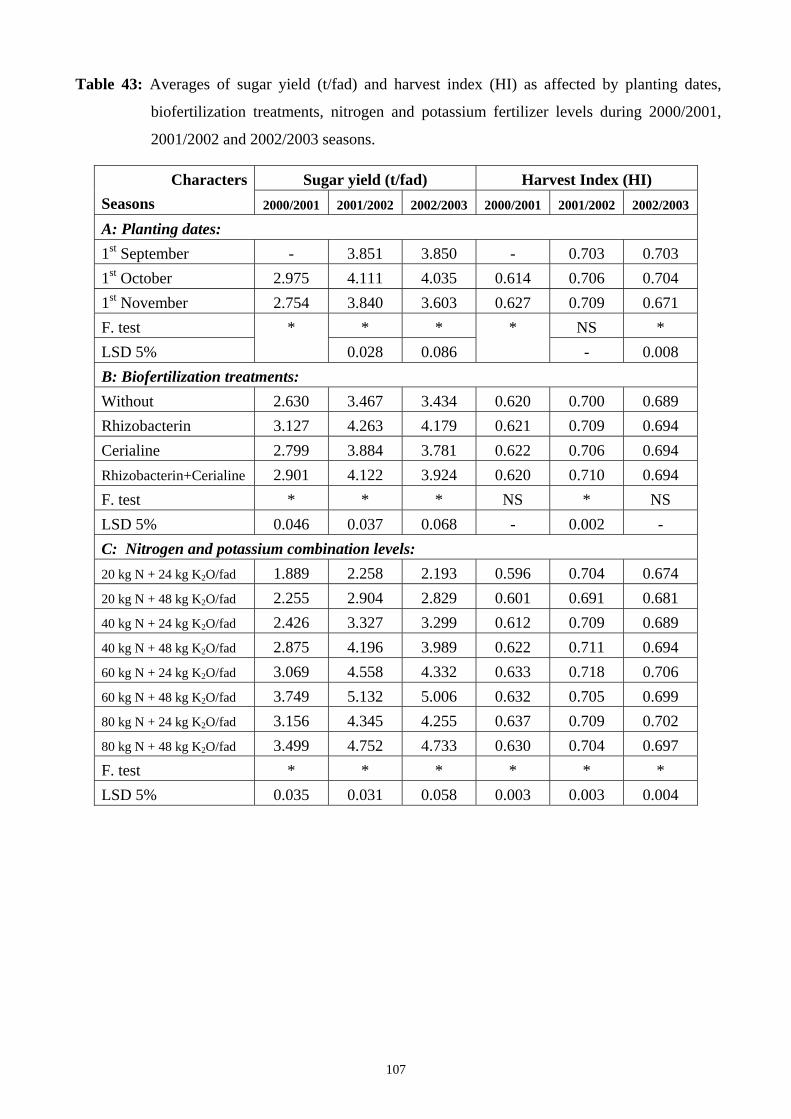
107
Table 43: Averages of sugar yield (t/fad) and harvest index (HI) as affected by planting dates,
biofertilization treatments, nitrogen and potassium fertilizer levels during 2000/2001,
2001/2002 and 2002/2003 seasons.
Sugar yield (t/fad) Harvest Index (HI) Characters Seasons 2000/2001 2001/2002 2002/2003 2000/2001 2001/2002 2002/2003
A: Planting dates: 1st September - 3.851 3.850 - 0.703 0.703 1st October 2.975 4.111 4.035 0.614 0.706 0.704 1st November 2.754 3.840 3.603 0.627 0.709 0.671 F. test * * NS * LSD 5%
* 0.028 0.086
* - 0.008
B: Biofertilization treatments: Without 2.630 3.467 3.434 0.620 0.700 0.689 Rhizobacterin 3.127 4.263 4.179 0.621 0.709 0.694 Cerialine 2.799 3.884 3.781 0.622 0.706 0.694 Rhizobacterin+Cerialine 2.901 4.122 3.924 0.620 0.710 0.694 F. test * * * NS * NS LSD 5% 0.046 0.037 0.068 - 0.002 - C: Nitrogen and potassium combination levels: 20 kg N + 24 kg K2O/fad 1.889 2.258 2.193 0.596 0.704 0.674 20 kg N + 48 kg K2O/fad 2.255 2.904 2.829 0.601 0.691 0.681 40 kg N + 24 kg K2O/fad 2.426 3.327 3.299 0.612 0.709 0.689 40 kg N + 48 kg K2O/fad 2.875 4.196 3.989 0.622 0.711 0.694 60 kg N + 24 kg K2O/fad 3.069 4.558 4.332 0.633 0.718 0.706 60 kg N + 48 kg K2O/fad 3.749 5.132 5.006 0.632 0.705 0.699 80 kg N + 24 kg K2O/fad 3.156 4.345 4.255 0.637 0.709 0.702 80 kg N + 48 kg K2O/fad 3.499 4.752 4.733 0.630 0.704 0.697 F. test * * * * * * LSD 5% 0.035 0.031 0.058 0.003 0.003 0.004
108
EL-Hawary (1999), Mahasen, Fahmi (1999), Abd EL-Moneim (2000), EL-Shahawy et al. (2002)
and Ramadan et al. (2003).
Concerning the effect of potassium fertilizer levels, increasing its levels from 24 to 48 kg
K2O/fad tended to increase sugar yield from 3.259 to 3.827 t/fad as average during the three
seasons. This trend is in line with those supported by EL-Moursy et al. (1998), Selim and EL-
Ghinbihi (1999), EL-Zayat (2000), Sohier, Ouda (2001) and Kandil et al. (2002 a).
From data in Table 43, it can be clearly seen that gross sugar yield (t/fad) was significantly
affected by nitrogen and potassium combination levels in the three seasons. Remarkable increases
in sugar yield were noticed as a results of raising nitrogen and potassium combination levels from
20 kg N + 24 kg K2O/fad to 60 kg N + 48 kg K2O/fad in all seasons. The optimum nitrogen and
potassium combination levels, which produced the greatest values of sugar yield was 60 kg N + 48
kg K2O/fad, where gave 3.749, 5.132 and 5.006 t/fad in the first, second and third seasons,
respectively. Moreover, this combination increased sugar yield by 98.46, 127.28 and 128.27 % over
application of 20 kg N + 24 kg K2O/fad in the first, second and third seasons, respectively. In other
words, excess nitrogen application did not desirable, because it reduced the most quality parameters
and sugar yield per unit area along with its critical effect in increasing environmental pollution. The
increase in gross sugar yield per unit area due to application of nitrogen and potassium fertilizers
can be explained through the fact that nitrogen and potassium has a vital role in improving all
growth attributes and root weight per plant and per faddan as well as sucrose %, consequently
increasing gross sugar yield per unit area. These results agree with those stated by Badawi et al.
(1995), Samia, EL-Maghraby et al. (1998), EL-Hawary (1999), Sultan et al. (1999) and EL-Zayat
(2000).
Effect of interactions:
With regard to the effect of interaction between planting dates X nitrogen and potassium
combination level on sugar yield, it exerted significant response in the three seasons (Table 44). The
highest values could be obtained for sugar yield (3.921, 5.275 and 5.172 t/fad) were produced as
result of planting on 1st October and application of 60 kg N + 48 kg K2O/fad in the first, second and
third seasons, respectively. On the other hand, the lowest ones (1.852, 2.144 and 2.004 t/fad) were
resulted from planting on 1st November and application of 20 kg N + 24 kg K2O/fad in the first,
second and third seasons, respectively. Kandil et al. (2002 c) confirmed these results.
A significant interaction between biofertilization treatments X nitrogen and potassium
combination levels over planting dates on sugar yield t/fad is illustrated in Table 45 during the three
seasons. The highest final yields of sugar which intend producer were obtained from inoculation
soil with Rhizobacterin along with application of 60 kg N + 48 kg K2O/fad, where they were 4.134,
5.564 and 5.444 t/fad in the first, second and third seasons, respectively. It also considers that
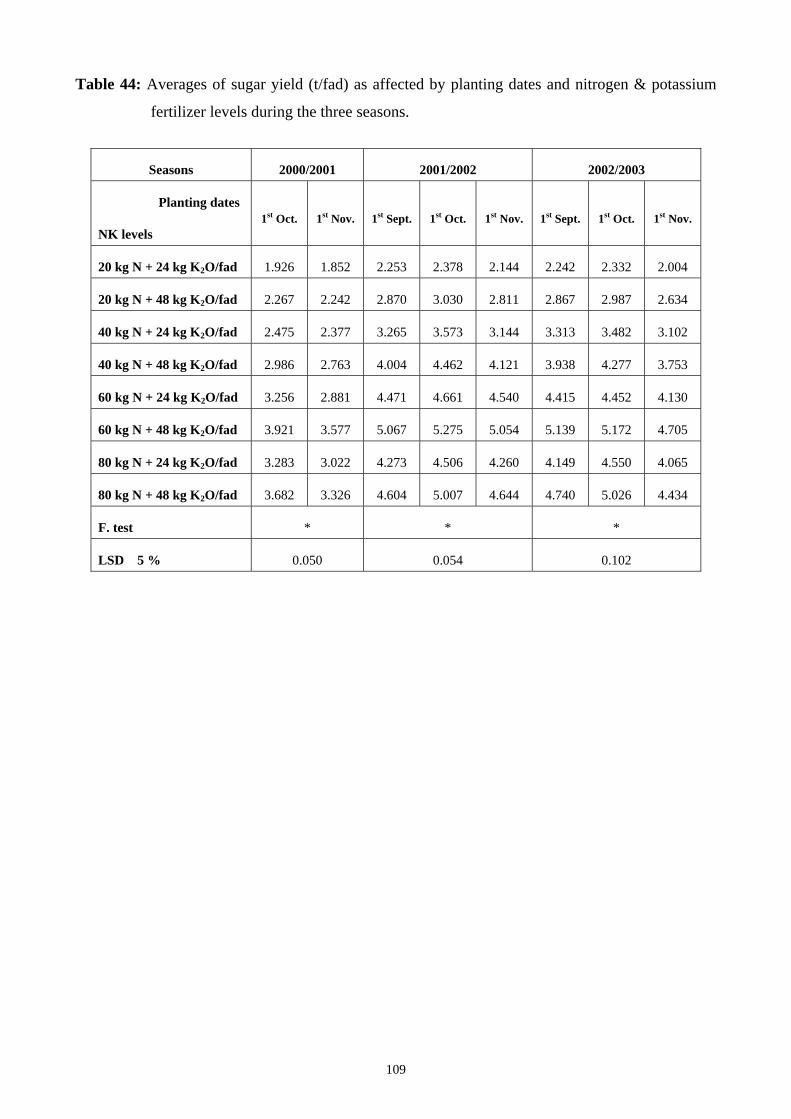
109
Table 44: Averages of sugar yield (t/fad) as affected by planting dates and nitrogen & potassium
fertilizer levels during the three seasons.
Seasons 2000/2001 2001/2002 2002/2003
Planting dates
NK levels 1st Oct. 1st Nov. 1st Sept. 1st Oct. 1st Nov. 1st Sept. 1st Oct. 1st Nov.
20 kg N + 24 kg K2O/fad 1.926 1.852 2.253 2.378 2.144 2.242 2.332 2.004
20 kg N + 48 kg K2O/fad 2.267 2.242 2.870 3.030 2.811 2.867 2.987 2.634
40 kg N + 24 kg K2O/fad 2.475 2.377 3.265 3.573 3.144 3.313 3.482 3.102
40 kg N + 48 kg K2O/fad 2.986 2.763 4.004 4.462 4.121 3.938 4.277 3.753
60 kg N + 24 kg K2O/fad 3.256 2.881 4.471 4.661 4.540 4.415 4.452 4.130
60 kg N + 48 kg K2O/fad 3.921 3.577 5.067 5.275 5.054 5.139 5.172 4.705
80 kg N + 24 kg K2O/fad 3.283 3.022 4.273 4.506 4.260 4.149 4.550 4.065
80 kg N + 48 kg K2O/fad 3.682 3.326 4.604 5.007 4.644 4.740 5.026 4.434
F. test * * *
LSD 5 % 0.050 0.054 0.102
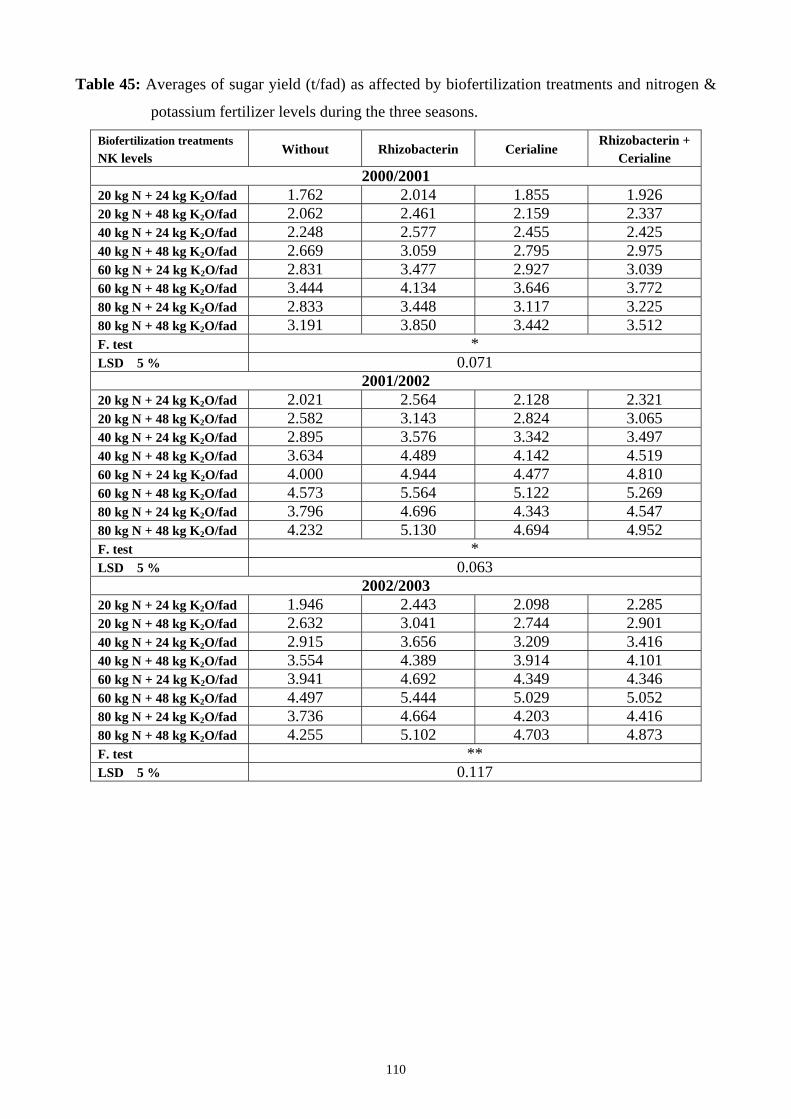
110
Table 45: Averages of sugar yield (t/fad) as affected by biofertilization treatments and nitrogen &
potassium fertilizer levels during the three seasons.
Biofertilization treatments NK levels
Without Rhizobacterin Cerialine Rhizobacterin +
Cerialine 2000/2001
20 kg N + 24 kg K2O/fad 1.762 2.014 1.855 1.926 20 kg N + 48 kg K2O/fad 2.062 2.461 2.159 2.337 40 kg N + 24 kg K2O/fad 2.248 2.577 2.455 2.425 40 kg N + 48 kg K2O/fad 2.669 3.059 2.795 2.975 60 kg N + 24 kg K2O/fad 2.831 3.477 2.927 3.039 60 kg N + 48 kg K2O/fad 3.444 4.134 3.646 3.772 80 kg N + 24 kg K2O/fad 2.833 3.448 3.117 3.225 80 kg N + 48 kg K2O/fad 3.191 3.850 3.442 3.512 F. test * LSD 5 % 0.071
2001/2002 20 kg N + 24 kg K2O/fad 2.021 2.564 2.128 2.321 20 kg N + 48 kg K2O/fad 2.582 3.143 2.824 3.065 40 kg N + 24 kg K2O/fad 2.895 3.576 3.342 3.497 40 kg N + 48 kg K2O/fad 3.634 4.489 4.142 4.519 60 kg N + 24 kg K2O/fad 4.000 4.944 4.477 4.810 60 kg N + 48 kg K2O/fad 4.573 5.564 5.122 5.269 80 kg N + 24 kg K2O/fad 3.796 4.696 4.343 4.547 80 kg N + 48 kg K2O/fad 4.232 5.130 4.694 4.952 F. test * LSD 5 % 0.063
2002/2003 20 kg N + 24 kg K2O/fad 1.946 2.443 2.098 2.285 20 kg N + 48 kg K2O/fad 2.632 3.041 2.744 2.901 40 kg N + 24 kg K2O/fad 2.915 3.656 3.209 3.416 40 kg N + 48 kg K2O/fad 3.554 4.389 3.914 4.101 60 kg N + 24 kg K2O/fad 3.941 4.692 4.349 4.346 60 kg N + 48 kg K2O/fad 4.497 5.444 5.029 5.052 80 kg N + 24 kg K2O/fad 3.736 4.664 4.203 4.416 80 kg N + 48 kg K2O/fad 4.255 5.102 4.703 4.873 F. test ** LSD 5 % 0.117
111
raising nitrogen level upon 60 kg N/fad caused significant decrease in sugar yield in all seasons.
These results are accomplished with those reported by Sultan et al. (1999), Bassal et al. (2001),
Soha, Khalil (2002) and Ramadan et al. (2003).
4.4- Harvest index (HI):
Data collected in Table 43 clear the effect of planting dates, biofertilization treatments,
nitrogen and potassium fertilizer levels on harvest index during 2000/2001, 2001/2002 and
2002/2003 seasons.
Effect of planting dates:
Planting dates manifested significant effect on harvest index in the first and third seasons
only. As shown from data presented in Table 43, the highest means of harvest index (0.627, 0.709
and 0.704 in the first, second and third seasons, respectively) were obtained due to planting beets on
1st November in the first and second season, and on 1st October in the third season. It can be also
noticed that, the differences between planting on 1st September or 1st October did not reach the level
of significance in the second and third seasons.
Effect of biofertilization treatments:
The statistical analysis of obtained data show that biofertilization treatments had significant
effect on harvest index in the second season only. It is prominent from data listed in Table 43 that
biofertilization treatments caused a progressively increase in harvest index over than chick
treatment (without biofertilization) in the second and third season only. The highest values of
harvest index were achieved due to Cerialine treatment in the first season and from Rhizobacterin +
Cerialine treatment in the second and third seasons, where results were 0.622, 0.710 and 0.694 in
the first, second and third seasons, respectively. Generally, the differences among biofertilization
treatments with concern harvest index were insignificant in the first and third seasons of this study.
Such increase in harvest index by this factor certainly attributed to its desirable effect on root and
top yields as discussion previously.
Effect of nitrogen and potassium combination levels:
Increasing nitrogen fertilizer levels from 20 to 40 and 60 kg N/fad tended to increase HI
from 0.658 to 0.673 and 0.682 as average of the three seasons. But, increasing nitrogen levels from
60 to 80 kg N/fad tended to decrease HI from 0.682 to 0.680 as average over the three seasons.
Similar findings were established by other workers including Attia et al. (1999).
Increasing potassium fertilizer levels from 24 to 48 kg K2O/fad tended to decrease HI from
0.674 to 0.672 as average of the three seasons.
Referring to the effect of nitrogen and potassium combination levels on harvest index, it was
significant in the three seasons (Table 43). It can be consider that the highest means of this character
(0.633, 0.718 and 0.706) were recorded by application of 60 kg N + 24 kg K2O/fad in the first,

112
second and third seasons, respectively. On the other side, the lowest ones (0.596, 0.691 and 0.674 in
the first, second and third seasons, respectively) were obtained from fertilizing with 20 kg N + 24
kg K2O/fad in the first and third season, but from application of 20 kg N + 48 kg K2O/fad in the
second season. In general, excess nitrogen and potassium combination levels upon 60 kg N + 24 kg
K2O/fad caused gradual decrease in harvest index over all seasons. This preferable effect of
nitrogen and potassium fertilization on harvest index may be due to the obvious effect of this factor
on root and biological yields.
ECONOMIC EVALUATION:
Total cultivated area of sugar beet in Egypt exceeded 131200 fad produce about 2.43 million
ton root and 0.347 million ton sugar annually, which equal approximately 24 % of total local sugar
production.
Studying economic evaluation of treatments under study, its show that planting sugar beet in
the first of October led to increase root yield by 1.214 t/fad (as an average in the three seasons under
study) as compared with delaying planting to the first of November, moreover its monetary value
reached 125 L.E. (based on the price of ton beet root about 102.93 L.E.).
Furthermore, application of Rhizobacterin as biofertilizers in addition mineral fertilization
with 80 kg N + 48 kg K2O/fad caused an increase in root yield amounted 3.717 t/fad (as an average
in the three seasons under study) and its cash value was 382.6 L.E. as compared with the treatments
of without biofertilization and usage of 80 kg N + 48 kg K2O/fad.
It was worthy to mentioned that this research aimed to reducing amount of mineral nitrogen
fertilizer that applying in sugar beet fields and exchange its with biofertilization in order to
minimize pollution rate and maintenance of environment that consider as national goal. It can be
concluded that, the same root yield could be obtained by reducing mineral nitrogen fertilizer levels
from 80 to 60 kg N/fad and the difference was 293 kg/fad only (as an average in the three seasons
under study) with monetary value about 30 L.E., whereas the price of nitrogen amount reduced (20
kg N/fad) reached to 40 L.E.
113
SUMMARY
Three field experiments were carried out at the Experimental Station, Fac. of Agric.,
Mansoura Univ. during the three successive growing seasons of 2000/2001, 2001/2002 and
2002/2003. This study aimed to investigate the effect of planting dates, biofertilization treatments,
nitrogen and potassium fertilizer levels as well as their interactions on growth, yield and yield
components as well as quality of sugar beet (Beta vulgaris var. altissima, L.) cv. Beta Poly 4.
The experiments were laid-out in a split-split plot design with three replications. The main
plots were assigned to planting dates as follows: two planting dates only in the first season (1st Oct.
and 1st Nov.) and three planting dates in the second and third seasons (1st Sept., 1st Oct. and 1st
Nov.).
The sub-plots were allocated with the following four biofertilization treatments:
B0 - Without biofertilization (control).
B1 - Treated soil with Rhizobacterin (450 g/fad).
B2 - Treated soil with Cerialine (450 g/fad).
B3- Treated soil with Rhizobacterin + Cerialine (225+225 g/fad, respectively).
The sub sub-plots were occupied with the following eight combinations of nitrogen and
potassium fertilizer levels:
1- 20 kg N + 24 kg K2O/fad. 2- 20 kg N + 48 kg K2O/fad.
3- 40 kg N + 24 kg K2O/fad. 4- 40 kg N + 48 kg K2O/fad.
5- 60 kg N + 24 kg K2O/fad. 6- 60 kg N + 48 kg K2O/fad.
7- 80 kg N + 24 kg K2O/fad. 8- 80 kg N + 48 kg K2O/fad.
• The most important results obtained from this investigation can be summarized as
follows:
I- EFFECT OF PLANTING DATES:
The statistical analysis of obtained results manifest that all growth attributes which
estimated at 120 and 150 days after planting i.e. root fresh and dry weight, foliage fresh and dry
weight, leaf area index (LAI), crop growth rate (CGR), relative growth rate (RGR) and net
assimilation rate (NAR) exhibited significant effect due to planting dates in the three growing
seasons. Excluding of that root fresh and dry weight (at 120 and 150 days from planting in the first
season), foliage fresh weight (at 120 days from planting in the second season), LAI (at 120 days
from planting in the first and second seasons and also at 150 days after sowing in the second
season), CGR (in the third season), RGR and NAR (in the first season). Noteworthy, planting sugar
beet on 1st October resulted in the highest values of root fresh and dry weight, foliage fresh and dry
weight, LAI and NAR, except foliage dry weight (at 150 days after planting in the second season),
LAI (at 150 days after sowing in the second season and NAR (in the second season), which the
114
highest ones were followed from planting on 1st November for foliage dry weight and on 1st
September for LAI and NAR. With respect CGR and RGR, the highest means were produced from
planting on 1st November in the first season or planting on 1st September in the second and third
seasons.
From data explained previously, all yield components (root and foliage fresh weight,
root/top ratio and root length and diameter) had significant effect owing to different planting dates
in the three seasons, except root fresh weight (in the first season), root/top ratio and root length (in
the second season) and root diameter (in the first and second seasons). It can be also statement that
in the three growing seasons, planting on 1st October gave the highest values of root and foliage
fresh weight as well as root length and diameter, exclusion root length in the first season only,
which resulted from planting on 1st November. While, root/top ratio has varied trend, which the
highest means resulted from planting on 1st November (in the first season) or from planting on 1st
September (in the second and third seasons).
Planting dates treatments showed significant effect of most quality parameters i.e. TSS,
sucrose and purity percentages, except TSS % (in the first and second seasons), sucrose % (in the
first season) and purity % (in the first and second seasons). The highest values of these parameters
were achieved with planting beets on 1st October, excluding TSS % in the second season (1st
November) and in the third season (1st September).
From obtained results, all yield characters (root, top and sugar yields/fad and harvest index)
significantly affected by planting dates, this comment was mostly true in the three seasons of study,
except HI in the second season only. The optimum planting date that yielded the highest values of
root, top and sugar yields/fad was planting on the first of October, except top yield in the third
season, which resulted from planting on 1st November. The corresponding data were 15.500, 21.596
and 21.278 ton roots/fad, 9.594, 8.907 and 9.323 ton top/fad and 2.975, 4.111 and 4.035 ton
sugar/fad in the first, second and third seasons, respectively. The highest means of HI (0.627, 0.709
and 0.704 in the first, second and third seasons, respectively) were followed from planting on 1st
November in the first and second seasons and from planting on 1st October in the third season.
II- EFFECT OF BIOFERTILIZATION TREATMENTS:
Application of biofertilization treatments (Rhizobacterin, Cerialine and the mixture of
Rhizobacterin + Cerialine) were associated with significant effect on root and foliage fresh and dry
weight, LAI at age 120 and 150 days from sowing (in the three seasons), CGR (in the first season
only), RGR and NAR (in the second and third seasons. Inoculation soil with Rhizobacterin
biofertilizer significantly improved most growth measurements and induced the highest values in
the three growing seasons, with exception CGR and NAR in the second and third seasons only. On
contrary, the lowest ones were accomplished from control treatment, except CGR (in the third
115
season) and NAR (in the second season). It worthy to mentioned that application of the mixture of
Rhizobacterin + Cerialine arranged in the second rank, then followed by Cerialine treatment with
regard to its influence on most growth attributes at both samples in the three seasons.
Root and foliage fresh weight as well as root length and diameter were significantly affected
by biofertilization treatment in the three growing seasons. With respect to root/top ratio, it had
insignificant effect as a result of biofertilization treatments in all seasons of study. The highest
values could be obtained for all yield components were achieved when treated soil with
Rhizobacterin treatment in the three growing seasons, except root/top ratio in the first season only.
On the other hand, the minimum values for whole these characters were resulted from control
treatment (without biofertilization). The trend of other biofertilization treatments was similar to that
mentioned formerly with concern growth attributes.
Biofertilization treatments caused a significant effect on TSS % (in the second season),
sucrose % (in the three seasons) and apparent purity % (in the third season). Rhizobacterin
treatment induced the highest values of yield quality parameters, excluding TSS % (in the first and
third seasons) and purity % (in the second season). Generally, it can be observed that
biofertilization treatments led to gradual tendency to improve all yield quality determinations in all
growing seasons.
All yield characters under study i.e. root, top and sugar yields/fad as well as harvest index
(HI) were significantly responded due to biofertilization treatments in the three seasons, except HI
in the first and third seasons. Noteworthy, application of Rhizobacterin biofertilizer yielded the
highest values of root yield (16.127, 22.485 and 21.887 t/fad), top yield (9.727, 9.194 and 9.581
t/fad) and sugar yield (3.127, 4.263 and 4.179 t/fad) in the first, second and third seasons,
respectively. Concerning application of the mixture of Rhizobacterin + Cerialine and Cerialine
biofertilizer, its ranked after Rhizobacterin treatment, respectively with respecting their effect on
root, top and sugar yields/fad in the three season. On the other hand, chick treatment (without
biofertilization) resulted in the lowest means ones.
III- EFFECT OF NITROGEN FERTILIZER LEVELS:
Increasing nitrogen fertilizer levels from 20 to 40, 60 and 80 kg N/fad tended to increase all
growth attributes, yield and its components under study in the three seasons. Concerning TSS %
and HI, increasing nitrogen fertilizer levels from 20 to 40 and 60 kg N/fad tended to increase its
means, but increasing nitrogen fertilizer levels from 60 to 80 kg N/fad tended to decrease its means
in all seasons. Respecting sucrose and purity percentages, increasing nitrogen fertilizer levels from
20 to 40, 60 and 80 kg N/fad tended to decrease its averages in the three growing seasons.
116
IV- EFFECT OF POTASSIUM FERTILIZER LEVELS:
Increasing potassium fertilizer levels from 24 to 48 kg K2O/fad tended to increase all studied
character with exception HI only in the three seasons.
V- EFFECT OF NITROGEN AND POTASSIUM COMBINATION LEVELS:
Nitrogen and potassium combination levels significantly affected all growth attributes under
study at 120 and 150 days from sowing in the three seasons. It can be easily consider that raising
nitrogen and potassium combination levels accompanied with obvious increase in all growth
measurements at two samples in the three seasons. Application of 80 kg N + 48 kg K2O/fad resulted
in the highest values of root and foliage fresh weight at 120 and 150 days after planting (in the three
seasons), root and foliage dry weight at 120 and 150 days after planting (in the first season), LAI at
120 and 150 days after planting (in the second and third seasons), CGR and RGR (in the first
season) and NAR (in the first and second seasons). In addition, application of 60 kg N + 48 kg
K2O/fad produced the best results after aforementioned combination level and characters, moreover
it gave the highest values of root and foliage dry weight at 120 and 150 days from sowing (in the
second and third seasons), LAI at 120 and 150 days from sowing (in the first season) and CGR as
well as RGR (in the second and third seasons). On contrast, the lowest ones were resulted from
application of 20 kg N + 24 kg K2O/fad in the three seasons.
All yield components (root and foliage fresh weight, root/top ratio and root length and
diameter) significantly increased as a result of increasing nitrogen and potassium combination
levels from 20 kg N + 24 kg K2O/fad to 80 kg N + 48 kg K2O/fad in all seasons. Fertilizing with 80
kg N + 48 kg K2O/fad produced the highest values of all yield components in the three seasons,
except root/top ratio which results from application of 60 kg N + 24 kg K2O/fad in all seasons.
Worthy mentioning, application of 60 kg N + 48 kg K2O/fad resulted in the best findings after the
highest combination level with minimum differences comparison with other combinations. While,
the lowest ones were obtained due to application 20 kg N + 24 kg K2O/fad in the three seasons.
Significant differences in all yield quality determinations were noticed due to nitrogen and
potassium combination levels in all growing seasons. The highest values of TSS % were obtained
by application of 60 kg N + 24 kg K2O/fad (in the first season) or 60 kg N + 48 kg K2O/fad (in the
second and third seasons). However, the highest means of sucrose % and apparent purity % were
resulted from application of 20 kg N + 48 kg K2O/fad in the three growing seasons, except purity %
in the first season only.
Nitrogen and potassium combination levels caused significant effect on all yield characters
in the three seasons. The highest values of root and top yields (19.637, 27.158 and 26.637 t/fad) and
(11.533, 11.419 and 11.568 t/fad) were produced from fertilizing beet plants with 80 kg N + 48 kg
K2O/fad in the first, second and third seasons, respectively. However, application of 60 kg N + 48
117
kg K2O/fad resulted in the maximum sugar yields (3.749, 5.132 and 5.006 t/fad in the first, second
and third seasons, respectively), in addition to induced the best root and top yields/fad after
formerly combination level. Referencing to the highest means of harvest index, its achieved by
application of 60 kg N + 24 kg K2O/fad in the three growing seasons. The lowest values of all yield
measurements were obtained from application 20 kg N + 24 kg K2O/fad in the three seasons, except
harvest index in the second season.
VI- EFFECT OF INTERACTIONS:
The interaction between planting dates X biofertilization treatments exhibited significant
effect on sucrose %, root and top yields/fad in all seasons.
Respecting the effect of the interaction between planting dates X nitrogen and potassium
combination level, it showed significant effect on root and foliage fresh weight (at 120 and 150
days after sowing), LAI (at 120 and 150 days from planting in the first and third seasons), CGR,
root and foliage fresh weight, root length and diameter, TSS %, sucrose % , purity %, root, top and
sugar yields/fad in the three seasons.
The interaction between biofertilization treatments X nitrogen and potassium combination
levels exhibited significant effect on root and foliage fresh weight (at 120 and 150 days after
sowing), LAI (at 120 and 150 days from planting in the first and third seasons), root and foliage
fresh weight, root length and diameter, sucrose %, root, top and sugar yields/fad in the three
seasons.
As regards the interaction among planting dates X biofertilization treatments X nitrogen and
potassium combination levels, it revealed that significant effect on sucrose %, root and top
yields/fad in the three seasons.
CONCLUSION
From obtained data in this study, it can be concluded that in order to maximizing sugar
beet productivity planting it on the first of October and inoculation soil with Rhizobacterin as
biofertilizer in addition to application of 60 or 80 kg N + 48 kg K2O/fad under the environment
conditions of Mansoura region.
118
REFERENCES
Abd EL-Gawad, A.A. ; H.K. Hassan and W.H. Hassany (2000). Transplanting technique to adjust
plant stand of sugar beet under saline conditions: I- Response of sugar beet yield to
transplanting missed hill by different transplant ages. Proc. 9th of Agron., 1-2 Sept. 2000,
Minufiya Univ., II: 533-548.
Abd EL-Moneim, S.A. (2000). Effect of preceding crop and nitrogen fertilizer level on yield and
quality of some sugar beet varieties grown in Fayoum region. Ph. D. Thesis, Fac. of
Agric., EL-Fayoum, Cairo Univ.
Abd EL-Wahab, S.A. ; A.A. Amer ; M.I. EL-Shahawy and M.M. Sobh (1996). Effect of different
irrigation amounts and potassium fertilizer rates on yield and quality of sugar beet and
water efficiencies. J. Agric. Sci. Mansoura Univ., 21(12): 4687-4699.
Abdel-Aal, S.M. (1990). Effect of nitrogen, phosphorus and potassium fertilization on the
productivity of fodder beet (Beta vulgaris, L.). Egypt. J. of Agron., 15(1-2): 159-170.
Abdel-Aal, S.M. and M.E. Ibrahim (1990). Effect of nitrogen and some micro-nutrients fertilization
on the growth, productivity and quality of sugar beet (Beta vulgaris, L.) J. Agric. Res.
Tanta Univ., 16(4): 703-714.
Abdou, M.A. (2000). Effect of planting dates, plant population and nitrogen fertilization on sugar
beet productivity under newly reclaimed sandy soils. Ph. D. Thesis, Fac. of Agric.
Mansoura Univ.
Abdou, U.M.A. (2001). Agronomic studies on sugar beet (Beta vulgaris ,L.). M. Sc. Thesis, Fac. of
Agric., Mansoura Univ.
Abdrabou, R. T. (1995). Effect of planting distance and nitrogen fertilization rates on growth and
yield of fodder beet plants. J. Agric. Sci. Mansoura Univ., 20(4): 1315-1323.
Abo EL-Goud, S.M.M. (2000). Agronomic studies on fodder beet. Ph. D. Thesis, Fac. of Agric.,
Mansoura Univ.
Abo EL-Wafa, A.M. (2002). Effect of plant spacing, nitrogen rates and its frequency on yield and
quality of kawemira sugar beet variety under Upper Egypt conditions. J. Agric. Sci.
Mansoura Univ., 27(2): 707-716.
Abo-Salama, A.M. and S.I. EL-Sayiad (2000). Studies on some sugar beet cultivars under Middle
Egypt conditions: I- Response to planting and harvesting dates. Assiut J. of Agric. Sci.,
31(1): 137-159.
Abou-Amou, Z.N. ; M.S. EL-Yamani and A.A. EL-Leithy (1996). Influence of different levels of N
and K fertilization on sugar beet productivity and NPK uptake in salt affected soil. J.
Agric. Sci. Mansoura Univ., 21(2): 819-825.

119
Abu EL-Fotoh, H.G. ; A.A. Abd EL-Magid and R.E. Knany (2000). Effect of biofertilization on
sugar beet yield, quality and optimization of the chemical fertilizers. Proc. 9th Conf. of
Agron., 1-2 Sept. 2000, Minufiya Univ., II: 561-567.
Ahmed, S.H.H. (1988). The fertilization with maximum rates of N, P and K for sugar beet (Beta
vulgaris, L.) in calcareous soils of Egypt. Egypt. J. of Agron., 13(1-3): 87-100.
Ali, A.A. (1993). Response of some sugar beet (Beta vulgaris, L.) cultivars to nitrogen and nitrogen
+ potassium fertilization. Minufiya J. Agic. Res., 18 (1): 2215-2224.
Ali, M.E.A. (1996). Effects of inoculation with atmosphereic nitrogen fixing Azospirillum on
growth of some sugar crops. M. Sc. Thesis, Fac. of Agric., AL-Azhar Univ.
AL-Labbody, A.H. (1998). Effect of fertilization and harvesting date on yield and quality of sugar
beet. M. Sc. Thesis, Fac. of Agric. AL-Azhar Univ.
Allison, M.F. ; M.J. Armstrong ; K.W. Jaggard ; A.D. Todd and G.F.J. Milford (1996). An analysis
of the agronomic, economic and environmental effects of applying N fertilizer to sugar
beet (Beta vulgaris, L.). J. of Agric. Sci. Cambridge, 127:475-486.
Assey, A.A. ; M.A. Mohamed ; M.E. Saleh and H.A. Basha (1992a). Effect of plant population and
nitrogen fertilization on: 1- Growth and growth analysis of sugar beet. Proc. 5th Conf. of
Agron., 13-15 Sept., Zagazig Univ., 2: 980-996.
Assey, A.A. ; M.E. Saleh ; M.A. Mohamed and H.A. Basha (1992b). Effect of plant population and
nitrogen fertilization on: 2- Yield and quality of sugar beet. Proc. 5th Conf. of Agron., 13-
15 Sept., Zagazig Univ., 2: 997-1008.
Attia, A.N. ; A.T. EL-Kassaby ; M.A. Badawi and S.E.E. Seaadh (1999). Yield, yield components
and quality of sugar beet as affected by growth regulators, nitrogen fertilization and foliar
nutrition treatments. Proc. 1st Intern. Conf. on Sugar and Integrated Industries “Present &
Future”, 15-18 Feb. 1999, Luxor, Egypt, I: 236-256.
Azab, M.A. ; M.A. EL-Hawary M.A. Farag and M.S. Ali (2000). Effect of soil and foliar nitrogen
fertilization on sugar beet in newly reclaimed soils. J. Agric. Sci. Mansoura Univ.,
25(11): 6681-6690.
Azzazy, N.B. (1998). Effect of sowing date, irrigation intervals and nitrogen fertilization on yield
and quality of sugar beet under Upper Egypt conditions. Egypt. J. Agric. Res., 76(3):
1099-1113.
Babu, S.C. ; J.A. Hallam and L.B. Fletcher (1991). Economic of biotechnology: The case of
biofertilizers in South India Agriculture. Studies in Technology and Social Change
Series, No 7, pp. 60 ; BIDS (C.F. CD ROM Computer System).
Badawi, M.A. (1985). Studies on sugar beet (Beta vulgaris ,L.). Ph. D. Thesis, Fac. of Agric.,
Mansoura Univ.
120
Badawi, M.A. (1989). A preliminary study on the effect of some cultural practices on the growth
and yield of sugar beet. J. Agric. Sci. Mansoura Univ., 14(2): 984-993.
Badawi, M.A. (1996). Effect of soil and foliar fertilization with Urea on yield, yield components
and quality of sugar beet (Beta vulgaris, L.). J. Agric. Sci. Mansoura Univ., 21(9): 3083-
3096.
Badawi, M.A. ; M.A. EL-Agroudy and A.N. Attia (1995): Effect of planting dates and NPK
fertilization on growth and yield of sugar beet (Beta vulgaris. L.). J. Agric. Sci. Mansoura
Univ., 20(6): 2683-2689.
Barbanti, L. ; M. Bimbatti ; U. Peruch ; S. Poggiolini ; F. Rosso ; M.T. Amaducci ; S. Mambelli and
G. Venturi (1994). Factors affecting sugar beet quality in the Po river Valley. Part 2:
Nitrogen fertilization. Proc. of the 3rd Cong. of the European Soc. for Agron., Padova
Univ., Abano-Padova, Italy, 18-22 Sept. 1994 pp. 574-575 (C.F. CD ROM Computer
System).
Basha, H.A. (1994). Influence of potassium fertilizer level on yield and quality of some sugar beet
cultivars in newly cultivated sandy soil. Zagazig J. Agric. Res., 21 (6): 1631-1644.
Basha, H.A. (1998). Response of fodder beet time and rate of potassium fertilizer application in
newly cultivated sandy soil. Zagazig J. Agric. Res., 25(1): 31-44.
Basha, H.A. (1999). Response of two sugar beet cultivars to level and method of nitrogen
application in sandy soil. Zagazig J. Agric. Res., 26(1): 11-26.
Bassal, S.A.A. ; A.A. Zohry and K.A. Douby (2001). Effect of row and hill spacings and bio-
mineral N-fertilization rates on sugar beet productivity. J. Agric. Sci. Mansoura Univ.,
26(9): 5217-5226.
Bell, C.I. ; J. Jones ; G.F.J. Milford and R.A. Leigh (1992). The effects of crop nutrition on sugar
beet quality. Aspects of Applied Biology, 32: 19-26 (C.F. CD ROM Computer System).
Beringer, H. ; K. Koch and T. Engels (1988). Sugar and alkali concentrations in the storage root of
sugar beet in dependence on cultivar and K fertilization. Abfallstoffe als Dunger. Proc. of
the 99th VDLUFA Cong., Sept. 1987, Koblenz, German Federal Republic. VDLUFA-
Schriftenreihe, 1988, 23: 787-801 (C.F. CD ROM Computer System).
Besheit, S.Y. ; B.B. Mekki and M.A. EL-Sayed (1995). Yield and technological characters of sugar
beet as affected by rates and time of nitrogen application. J. Agric. Sci. Mansoura Univ.,
20(1): 61-69.
Butorac, A. (1995). Response of sugar beet to agrarvital and waste water fertilizing: II- Heavy
metals toxic elements and born content in sugar beet root and leaf. Polyjoprivredna
Znanstrena Smotra, 60(1): 81-94 (C.F. CD ROM Computer System).
121
Cakmakci, R. ; F. Kantar and F. Sahin (2001). Effect of N2-fixing bacterial inoculation on yield of
sugar beet and barley. J. of plant Nutrition and Soil Sci., 164(5): 527-531.
Cakmakci, R. ; F. Kantar and O.F. Algur (1999). Sugar beet and barley yields in relation to Bacillus
polymyxa and Bacillus megaterium var. phosphaticum inoculation. J. of Plant Nutrition
and Soil Sci., 162 (4): 437-442.
Denesova, O. and E. Andres (1995). New results with potassium and magnesium fertilization of
sugar beet. Agrochema (Bratislava), 35(9-10): 159-162 (C.F. CD ROM Computer
System).
Draycott, A.P (1993). Nutrition P. 239-278. In The Sugar Beet Crop : Science into practices. Edited
by D.A. Cooke and R.K. Scott. Chapman & Hall, 2-6 Boundary Row, London SEI 8HN.
UK.
Egyptian society of sugar technology.
Eid, M.A. (1982). Association of symbiotic N2-fixing bacteria with roots of some major crops. Ph.
D. Thesis, Fac. of Agric., Cairo Univ.
EL-Attar, H.A. ; Y.A. Darweesh ; M.K. EL-Haris and F.A. Askar (1995). The effect of NPK
fertilization on the yield components of sugar beet at Northern Nile Delta. J. Agric. Sci.
Mansoura Univ., 20(7): 3635-3643.
EL-Badry, M. and A. EL-Bassel (1993). Improving sugar beet crop by inoculation with free-living
nitrogen fixing bacteria. 6th Intern. Symp. on Nitrogen Fixation with non Legumes,
Ismalia, Egypt.
EL-Geddawy, I.H. ; Laila, M. Saif and F.A. Abd EL-Latief (2001). Hoeing and nitrogen
fertilization with respect to quality, yield and yield components of some sugar beet
varieties grown in Upper Egypt. J. Agric. Sci. Mansoura Univ., 26(8): 4647-4661.
EL-Harriri, D.M. and Mirvat, E. Gobarh (2001). Response of growth, yield and quality of sugar
beet to nitrogen and potassium fertilizers under newly reclaimed sandy soil. J. Agric. Sci.
Mansoura Univ., 26(10): 5895-5907.
EL-Hawary, M.A. (1999). Influence of nitrogen, potassium and boron fertilizer levels on sugar beet
under saline soil conditions. J. Agric. Sci. Mansoura Univ., 24(4): 1573-1581.
EL-Hennawy, H.H. ; B.S.H. Ramadan and E.A. Mahmoud (1998). Response of sugar beet to
nitrogen fertilization levels and its time of application. J. Agric. Sci. Mansoura Univ.,
23(3): 969-978.
EL-Kammah, M.A. and R.A. Ali (1996). Responsiveness of sugar beet biomass to band-applied
sulpher and its effect on the profitability of potassium and zinc fertilizers under clay soils.
J. Agric. Sci. Mansoura Univ., 21(1): 383-405.
122
EL-Kased, F.A. ; A.A. EL-Gharabawy and S.Y. Besheit (1993). Yield of sugar beet and quality as
affected by nitrogen and phosphorus rates in calcareous soils. J. Agric. Sci. Mansoura
Univ., 18(2): 581-587.
EL-Kassaby, A.T. ; A.N. Attia ; M.A. Badawi and S.E.E. Seaadh (1999). Effect of growth
regulators, nitrogen fertilization and foliar nutrition treatments: I- Growth attributes of
sugar beet. Proc. 1st Intern. Conf. on Sugar and Integrated Industries “Present & Future”,
15-18 Feb. 1999, Luxor, Egypt, I: 124-139.
EL-Kassaby, A.T. ; S.E. EL-Kalla ; A.A. Leilah and H.S. EL-Khatib (1991). Effect of planting
patterns and levels of N, K fertilization on yield and quality of sugar beet. J. Agric. Sci.
Mansoura Univ., 16(7): 1497-1504.
EL-Kassaby, A.T. and A.A. Leilah (1992 a). Influence of plant density and nitrogen fertilizer levels
on sugar beet productivity. Proc. 5th Conf. of Agron., 13-15 Sept., Zagazig Univ., II: 954-
962.
EL-Kassaby, A.T. and A.A. Leilah (1992 b). Effect of sowing and harvesting time on yield and
quality of sugar beet. 5th Conf. of Agron., 13-15 Sept. 1992, Zagazig Univ., II: 963-969.
EL-Moursy, S.A. ; A.T. EL-Kassaby ; A.M. Salama and H.M. Sarhan (1998) Macro-elements
requirements of sugar beet. J. Agric. Sci. Mansoura Univ., 23(2): 701-710.
EL-Shafai, A.M.A. (2000). Effect of nitrogen and potassium fertilization on yield and quality of
sugar beet in Sohag. Egypt. J. Agric. Res., 78(2): 759-767.
EL-Shafei, A.M.A. (1991). Effect of some agronomic treatments on yield and quality of sugar beet
under Kafr EL-Sheikh region. M. Sc. Thesis, Fac. of Agric., Ain Shams Univ.
EL-Shahawy, M.I. ; S.A. Abd EL-Wahab ; M.M. Sobh and E.A.E. Nemeat Alla (2002).
Productivity and NPK uptake of sugar beet as influenced by N, B and Mn fertilization. J.
Agric. Sci. Mansoura Univ., 27(3): 1955-1964.
EL-Shahawy, M.L. ; M.S. EL-Yamani ; Amaani, Z.M. Abou Amou and Asmaa, A. EL-Basuony
(2001). Influence of tillage methods and nitrogen fertilization levels on yield, quality and
chemical composition of sugar beet crop. J. Agric. Sci. Mansoura Univ., 26(2): 1177-
1190.
EL-Yamani, M.S. (1999). Influence of irrigation regimes and potassium fertilization levels on yield
and quality of two sugar beet varieties. J. Agric. Sci. Mansoura Univ., 24(3): 1515-1527.
EL-Zayat, M.M.T. (2000). Effect of irrigation regimes and fertilization on sugar beet. Ph. D. Thesis,
in Agric. Sci. (Agron.), Fac. of Agric., Kafr EL-Sheikh, Tanta Univ.
Emara, T.K.M.S. (1990). Effect of irrigation intervals, growth regulators and NK fertilization on
yield and quality of sugar beet. M. Sc. Thesis, Fac. of Agric., Mansoura Univ.
FAO.org, Statistical database, Faostat agriculture, Primary crops, supplied at 3 Feb. 2004.
123
Favilli, F. ; R. Pastorri and A. Gori (1993). Response of sugar beet to Azospirillum bacterization in
field experiments. Agric. Med., 123: 281-285 (C.F. CD ROM Computer System).
Gasiorowska, B. (1997). The effect of irrigation and NPK fertilization on the chemical composition
of sugar beet roots and leaves. Biuletyn Instytutu Hodowli Aklimatyzacji Roslin, 203:
181-186 (C.F. CD ROM Computer System).
Genaidy, S.A. (1988). Role of potassium, boron and zinc fertilization on yield and quality of sugar
beet grown on Northern Delta soils. Alex. Sci. Exch., 9(1): 25-34.
Geweifel, H.G.M. and R.M. Aly (1996). Effect of nitrogen and potassium fertilization treatments on
growth, yield and quality of some fodder beet varieties. Annals of Agric. Sci. Moshtohor,
34(2): 441-454.
Geypens, M. ; L. Vanongeval ; P. Elst and J. Bries (1998). Evaluation of nitrogen fertilizer
recommendations for sugar beet on the nitrogen-index expert system. Communications in
soil Sci. and Plant Analysis, 29(11-14): 2217-2225 (C.F. CD ROM Computer System).
Ghonema, M.H. (1998). Effect of plating dates and harvesting time on yield, yield components and
quality of sugar beet (Beta vulgaris, L.). J. Agric. Sci. Mansoura Univ., 23(7): 2971-
2979.
Ghonema, M.H. and A.A. Sarhan (1994). Response of direct seeding and transplanted sugar beet to
NPK fertilization rates. J. Agric. Sci. Mansoura Univ., 19(9): 2785-2797.
Gomez, K.N. and A.A. Gomez (1984). Statistical procedures for agricultural research. John Wiley
and Sons, New York, 2nd ed., 68 P.
Hanna, A.S. ; A.T. EL-Kassaby ; A.N. Attia and M.A. Badawi (1988). Studies on the
interrelationships among planting dates, hill spacing, varieties and nitrogen fertilization in
sugar beet (Beta vulgaris, L.). J. Agric. Sci. Mansoura Univ., 13(2): 598-605.
Hannan, Y.M. Yossef (2001). Agronomic studies on sugar beet. M. Sc. Thesis, Fac. of Agric.,
Zagazig Univ.
Hassanin, M.A. and Sohair, E.D. Elayan (2000). Effect of phosphorus and nitrogen rates and time
of nitrogen application on yield and juice quality of sugar beet. J. Agric. Sci. Mansoura
Univ., 25(12): 7389-7398.
Hegazy, M.H. and S.A. Genaidy (1995). Potassium fertilization for some intercropping patterns in
Egyptian Northern Delta soils. Egypt. J. of Agric. Res., 73(1): 25-35.
Ibrahim, M.F.M. (1998). The effect of some fertilization elements on the yield and quality of sugar
beet. Ph. D. Thesis, Fac. of Agric., Zagazig Univ.
Kandil, A.A. (1993). Response of some sugar beet varieties to potassic fertilizers under salinity
conditions. Towards the Rational Use of High Salinity Plants. Vol. II: Agriculture and
124
Frosty under Marginal Soil Water Conditions. Proc. of the ASWAS Conf., 8-15 Dec.
1993, AL-Ain, United Arab Emirates, pp. 199-207
Kandil, A.A. ; M.H. EL-Hindi ; A.M. Said and Y.Y.I. Gomaa (2002 a). Response of sugar beet to
levels and times of potassium fertilization under salinity conditions at Northern Delta
Egypt. J. Agric. Sci. Mansoura Univ., 27(11): 7237-7246.
Kandil, A.A.; M.A. Badawi ; S.A. El-Moursy and U.M.A. Abdou (2002b). Effect of planting dates,
nitrogen levels and biofertilization treatments on: I- Growth attributes of sugar beet (Beta
vulgaris, L.). J. Agric. Sci. Mansoura Univ., 27(11): 7247-7255.
Kandil, A.A.; M.A. Badawi ; S.A. El-Moursy and U.M.A. Abdou (2002c). Effect of planting dates,
nitrogen levels and biofertilization treatments on: II- Yield, yield components and quality
of sugar beet (Beta vulgaris, L.). J. Agric. Sci. Mansoura Univ., 27(11): 7257-7266.
Kasap, Y. and F. Killi (1994). Reseach on the effects of potassium fertilization on yield and quality
of sugar beet (Beta vulgaris, L.) grown at Kahrmanmaras. Turkish J. of Agric. and
Forsty, 18(2): 107-110 (C.F. CD ROM Computer System).
Kemp, P.D. ; A.M. Khani and J.P. Millner (1994). The effect of plant population and nitrogen level
on sugar yield and juice purity of sugar beet (Beta vulgaris, L.). Proc. Annual Conf.
Agron. Soci. of New Zealand, 24: 131-134. (C.F. CD ROM Computer System).
Khalifa, M.R. ; F.I. Header and A. Rabie (1995). Response of sugar beet to rates and methods of K-
fertilizer application under different levels of soil salinity. J. Agric. Res. Tanta Univ.,
21(4): 806-814.
Khan, M.A.A. ; R.A. Singhania and N.P. Mishra (1990). Effect of nitrogen and phosphorus on yield
and quality of sugar beet in saline sodic soils. Acta Agronomica Hungarica, 39(3-4): 381-
387. (C.F. Field Crop Abst., 44(11), 8330, 1991).
Kucke, M. and R. Kleeberg (1998). Nitrogen balance and soil nitrogen dynamics in two areas with
different soil, climatic and cropping conditions. European J. of Agron., 10(1-2): 89-100.
Laila, M. Saif (2000). Stepwise regression and path coefficient analysis for some sugar beet
characters under levels of boron and nitrogen fertilization. Proc. of 9th Conf. in Agron.,
Minufiya Univ., 1-2 Sept. 2000, I: 569-581.
Le-Docte, A. (1927). Commercial determination of sugar beet root using the Sachr Le-Docta
process. International Sugar J., 29: 488-492. (C.F. Sugar beet Nutrition, April, 1927
Applied Sciences Publishers LTD, London, A.P. Draycott).
Leilah, A.A. and S.M. Nasr (1992). The contribution of sowing and harvesting dates on yield and
quality of some sugar beet cultivars. 5th Conf. of Agron., 13-15 Sept., Zagazig Univ., II:
970-979.
125
Lopez, B.L. ; J.E. Castillo and M. Fuentes (1994). Nitrogen uptake by autumn sown sugar beet.
Fertilizer Res., 38(2): 101-109.
Maareg, M.E. and Sohir, T. Badr (2001). Impact of three soil biofertilizers applied separately and in
combinations with a nematicided on Meloidogyne incognita infecting sugar beet.
Egyptian J. of Agronematology, 4(1-2): 1-9.
Mahasen, M.M. Fahmi (1999). Effect of levels and times of nitrogen application on growth and
yield of sugar beet. Ph. D. Thesis, Fac. of Agric., Mansoura Univ.
Mahmoud, E.A. ; E.M.A. EL-Metwally and Mervet, E.M. Gobarh (1999). Yield and quality of
some multigerm sugar beet cultivars as affected by plant densities and nitrogen levels. J.
Agric. Sci. Mansoura Univ., 24(9): 4499-4516.
Mahmoud, E.A. ; N.A. Khalil and S.Y. Besheit (1990a). Effect of nitrogen fertilization and plant
density on sugar beet. 1- Growth and growth analysis. Proc. 4th Conf. of Agron., 15-16
Sept. Cairo Univ., II: 415-431.
Mahmoud, E.A. ; N.A. Khalil and S.Y. Besheit (1990b). Effect of nitrogen fertilization and plant
density on sugar beet. 2- Root weight, root top and sugar yields and sugar quality. Proc.
4th Conf. of Agron., 15-16 Sept. Cairo Univ., II: 433-446.
Marlander, B. (1990). Influence of nitrogen supply on yield and quality of sugar beet. Zeitschrift fur
Pflanzenernahrung und Bodenkunde, 153(5): 327-332 (C.F. Field Crop Abst., 44(1):
8329, 1991).
Meirvenne, M.V. ; M. Vanstallen ; J. Hofman ; J. Vandergeten and P. Demyhenaere (1991).
Influence of row and broad cast N application on the evaluation of the mineral nitrogen
under sugar beet. 54th Winter Cong. of the Intern. Inst. for Sugar Beet Res. Proc. of a
Conf. Held in Brussels, Belgium, 20-21 Feb. 1991 pp. 445-453 (C.F. CD ROM Computer
System).
Mezei, S. ; M. Popovic ; L. Kovacev ; N. MrKovacki ; N. Nagai and D. Malencic (1998). Effect of
Azotobacter strains on sugar beet callus proliferation and nitrogen metabolism enzymes.
Biologia Plantarum, 40(2): 277-283 (C.F. CD ROM Computer System).
Milic, M. ; I. Dosenovic ; M. Jarak ; Z. Vujosevic and E. Rudic (1995). Microbiological
investigation of soil at monitored beet fertilizing: IV- Interdependence of free aerobic
nitrofixators and the content of macroelements in cheronzem and black marsh soil.
Prehrambene Industrija: Industrija Secera, 22(3-4): 55-58 (C.F. CD ROM Computer
System).
Morrsi, E.A. (1997). Some soil properties and sugar beet yield as affected by ploughing depth and
fertilization in salt affected soil. M. Sc. Thesis, Fac. of Agric., Kafr EL-Sheikh, Tanta
Univ.
126
Mrkovack, N. ; S. Mezei ; I. Versboranji ; Z. Saric and L. Kovacev (1997). Association of sugar
beet and nitrogen fixing bacteria in vitro. Biologia Plantarum, 39(3): 419-425 (C.F. CD
ROM Computer System).
Neamet Alla, E.A.E. (1997). Agronomic studies on sugar beet. Ph. D. Thesis, in Agron., Fac. of
Agric., Kafr EL-Sheikh, Tanta Univ.
Nemeat Alla, E.A.E. (2001). Yield and quality of sugar beet as affected by sources, levels and
application time of nitrogen fertilizer. J. Agric. Sci. Mansoura Univ., 26(3): 450-462.
Nemeat Alla, E.A.E. ; A.A.E. Mohamed and S.S. Zalat (2002). Effect of soil and foliar application
of nitrogen fertilization on sugar beet. J. Agric. Sci. Mansoura Univ., 27(3): 1343-1351.
Nemeat Alla, E.A.E. and I.H.M. EL-Geddawy (2001). Response of sugar beet to foliar spraying
time with micronutrients under different levels of nitrogen and phosphorus fertilization. J.
Agric. Sci. Mansoura Univ., 26(4): 670-681.
Nigrila, C. ; C.E. Negrila ; S. Pienescu ; and D. Constantin (1994). The effect of potassium fertilizer
applications on potato and sugar beet crops. Probleme de Agrofitotehnie Teoratica si
Aplicata, 16(1): 55-70 (C.F. CD ROM Computer System).
Nitoses, R.E. and H.G. Evans (1969). Effect of univalent cations on the activity of particulate starch
synthase. Plant Physiol., 44: 1260-1266.
Ostrowska, D. ; K. Kucinska and A. Artyszak (2001). Effectiveness of sugar beet production under
differentiated conditions of organic and mineral nitrogen fertilization in three years
rotation. Roczniki Nauk Rolniczych, Seria A, Produkcja Roslinna, 115(1-4): 67-73 (C.F.
CD ROM Computer System).
Prasad, B. and J. Rokima (1991). Changes in available nutrients status of calcareous soil as
influenced by manures, fertilizers and biofertilizer. J. of the Indian Soc. of Soil Sci.,
39(4): 783-785.
Radford,s, P.J. (1967). Growth analysis formulae, their use and abuse. Crop Sci., 7: 171-175.
Ramadan, B.S.H. (1997). Sugar beet yield and quality as affected by nitrogen and potassium
fertilization. Pakistan Sugar J., 11(1): 8-13.
Ramadan, B.S.H. ; H.R. Hassan and Fatma, A. Abdou (2003). Effect of mineral and biofertilizers
on photosynthetic pigments, root quality, yield components and anatomical structure of
sugar beet (Beta vulgaris, L.) plants grown under reclaimed soils. J. Agric. Sci. Mansoura
Univ., 28(7): 5139-5160.
Ramadan, B.S.H. and M.A. Hassanin (1999). Effect of sowing dates on yield and quality of some
sugar beet (Beta vulgaris, L.) varieties. J. Agric. Sci. Mansoura Univ., 24(7): 3227-3237.
Salama, A.M. and M.A. Badawi (1996). Evaluation of six sugar beet cultivars under N-levels and
harvesting dates. J. Agric. Sci. Mansoura Univ., 21(1): 139-153.

127
Samia, S. EL-Maghraby ; Mona, M. Shehata and Yusreya, H. Tawfik (1998). Effect of soil and
foliar application of nitrogen and potassium on sugar beet. Egypt. J. Agric. Res., 76(2):
665-678.
Sarhan, H.M. (1998). Macro-elements requirements of sugar beet. M. Sc. Thesis, Fac. of Agric.,
Mansoura Univ.
Sayed, K.M. ; M.S. EL-Yamani and Amaani, Z.M. Abou-Amou (1998). Influence of irrigation
intervals, N and K fertilization levels on yield and quality of sugar beet. J. Agric. Sci.
Mansoura Univ., 23(9):4131-4143.
Selim, A.F.H. and F.H. EL-Ghinbihi (1999). Studies on sugar beet plants (Beta vulgaris, L.) cv.
Raspoly as affected by NPK nutrients in sand culture. Minufiya J. Agric. Res., 24(6):
1819-1829.
Shabaev, V.P. ; V. Smolin and O.S. Safrina (1996). Nitrogen fixation in rhizosphere, yield of beet
root and nitrogen balance flood plain and soil using nitrogen fixing bacteria of the genus
Pseudomonas. Agrokhimiya, 11: 3-14 (C.F. CD ROM Computer System).
Shafika, N. Mostafa and S.D. Darwish (2001). Biochemical studies on the efficiency use of some
nitrogen fertilizers for sugar beet production. J. Agric. Sci. Mansoura Univ., 26(4): 2421-
2429.
Shalaby, M.T. ; M.B. Doma ; F.A. Abd EL-Latif and Sohair, M.E. Sadik (2003). Agricultural,
chemical and technological studies on sugar beet. 2-Effect of nitrogen application on
yield, chemical constituents and juice quality characteristics of sugar beet. J. Agric. Sci.
Mansoura Univ., 28(3): 1853-1864.
Sharief, A.E ; Z.A. Mohamed and S.M. Salama (1997): Evaluation of some sugar beet cultivars to
NPK fertilizers and yield analysis. J. Agric. Sci. Mansoura Univ., 22(6): 1887-1903.
Sharief, A.E. and K. Eghbal (1994). Yield analysis of seven sugar beet varieties under different
levels of nitrogen in dry region of Egypt. Agribiol. Res., 47(3-4): 231-241.
Singh, P.K. and R.N. Bisoyi (1995). Biofertilizers for restoration of soil fertility. Restoration of
Degraded Land: Concepts and Strategies, p. 25-47 (C.F. CD ROM Computer System).
Singhania, R.A. and P.K. Sharma (1990). Nitrogen and phosphorus requirements of sugar beet in
saline sodic soil. India J. Soc. of Soil Sci., 38(2): 330-332.
Smit, A.B. ; P.C. Struik ; J.H. Niejenhuis and J.H. Van Niejenhuis (1995). Nitrogen effects in sugar
beet growing: A module fore decision support. Nether lands J. of Agric. Sci., 43(4): 391-
408. (C.F. CD ROM Computer System).
Sobh, M.M. ; S.A. Genaidy ; M.H. Hegazy and A.Y. Negm (1992). Effect of nitrogen, phosphorus
and potassium fertilization on sugar beet (Beta vulgaris ,L.). Proc. 5th Conf. of Agron.,
13-15 Sept., Zagazig Univ., Vol. (2): 945-953.
128
Soha, R.A. Khalil (2002). Reducing environmental pollution in sugar beet fields through
fertilization. M. Sc. Thesis, Inst. of Environmental Studies and Res., Ain Shams Univ.
Sohier, M.M. Ouda (2001). Response of sugar beet to N and K fertilizers levels under sandy soil
conditions. Zagazig J. Agric. Res., 28(2): 275-297.
Sohier, M.M. Ouda (2002). Effect of nitrogen and sulpher fertilization levels on sugar beet in newly
cultivated sandy soil. Zagazig J. Agric. Res., 29(1): 33-50.
Sohier, M.M. Ouda ; A.M.A. EL-Shafai and N.B. Azzazy (1999). Effect of farmyard manure and
nitrogen fertilization on yield and quality of sugar beet in sandy soil. Zagazig J. Agric.
Res., 26(6): 1487-1493.
Sorour, S.R. ; S.H. Abou-Khadrah ; M. Zahran and E.A. Neamet-Alla (1992). Effect of different
potassiun and nitrogen rates on growth and yield of some sugar beet cultivars. Proc. 5th
Conf. of Agron., 13-15 Sept., Zagazig Univ., II: 1027-1043.
Sprenat, J.I. (1990). Nitrogen fixation organisms. P.S. Chapman & Hall, London.
Stajner, D. ; S. Kevresan ; O. Gasic ; N. Mimica and H. Zonghi (1997). Nitrogen and Azotobacter
chroococcum enhance oxidative stress tolerance in sugar beet. Biologia Plantarum, 39(3):
441-445 (C.F. CD ROM Computer System).
Strnad, P. and M. Javurek (1993). Analysis of the effect of some agroecological factors on sugar
beet production. Rostilinna Vyroba, 39(12): 1129-1135 (C.F. CD ROM Computer
System).
Sultan, M.S. ; A.N. Attia ; A.M. Salama ; A.E. Sharief and E.H. Selim (1999). Biological and
mineral fertilization of sugar beet under weed control: I- Sugar beet productivity. Proc. 1st
Intern. Conf. on Sugar and Integrated Industries “Present & Future”, 15-18th Feb. 1999,
Luxor, Egypt, I: 170-181.
Suslow, T.V. ; J.W. Kloepper ; M.N. Schroth and T.J. Burr (1979). Beneficial bacteria enhance
plant growth. California Agric., 33(11-12): 15-17 (C.F. CD ROM Computer System).
Vlassak, K. ; J. Vandergeten and M. Vanstallen (1991). Effect of nitrogen fertilizer placement on
yield and quality of sugar beet. 54th Winter Cong. of the Intern. Inst. for Sugar Beet Res.
Proc. of a Conf. Held in Brussels, Belgium, 20-21 Feb. 1991 pp. 455-463 (C.F. CD ROM
Computer System).
Watson, D.J. (1958). The dependence of net assimilation rate on leaf area index. Ann. Bot.
Lond. N.S., 22:37-54.
Wojcik, S. (1993). The influence of urea and keratin-bark-urea granulate in the yield and
technological quality of sugar beet. Zeszyty Problemowe Postepow Nauk Rolniczych,
399: 273-277 (C.F. CD ROM Computer System).
129
Zeinab, R. Moustafa ; Shafika, N. Moustafa ; Maria, G. Beshay and K.A. Abou Shady (2000).
Influence of nitrogen fertilizer on some quality, technological aspects, productivity and
amino acids accumulation of sugar beet. J. Agric. Sci. Mansoura Univ., 25(8): 4795-
4806.