Embed Size (px)
Citation preview

1
Cloning, multicopy expression and fed-batch production of Rhodotorula araucariae 1
Epoxide Hydrolase in Yarrowia lipolytica 2
3
Dheepak Ramduth, Robyn Roth, Rajesh Lalloo, Clinton Simpson, Kgama Mathiba, 4
Robin Mitra, Johann Görgens and Santosh Ramchuran 5
6
D. Ramduth (� ) • R. Roth • R. Lalloo • C. Simpson • K. Mathiba • S. Ramchuran 7
CSIR Biosciences, Private Bag X2 8
Modderfontein, 1645, South Africa 9
e-mail: [email protected] 10
Fax.: +27 11 6083020; Tel.: +27 826508542 11
12
J. Görgens 13
Department of Process Engineering, Stellenbosh University, Private Bag X1 14
Stellenbosch, 7602, South Africa 15
16
R. Mitra 17
Oxyrane UK (Pty) Ltd. 18
Oxyrane Process Operations, 10 Pencroft Way 19
Manchester, M15 6JJ, United Kingdom 20 21
Keywords: Epoxide hydrolases, Fed batch fermentation, Epoxide hydrolases, Fed batch fermentation, 22
Yarrowia lipolytica; Rhodotorula araucariae. 23
24
25
26
27
28
2
Abstract 1
Epoxide hydrolases (EHs) of fungal origin have the ability to catalyse the enantioselective 2
hydrolysis of epoxides to their corresponding diols. However wild type fungal EHs are 3
limited in the substrate range and enantioselectivity, additionally wild type fungal EH 4
productivities are relatively low. Recombinant DNA technology has been previously used 5
to overproduce these enzymes in expression systems such as E. coli and A.niger and P. 6
pastoris. EH encoding genes from Rhodotorula araucariae were cloned and functionally 7
expressed in Y. lipolytica, under the control of a growth inducible hp4d promoter. The 8
transformation experiments yielded only two positive multicopy transformants, which were 9
assessed in flask cultures. The selected transformant demonstrated a 4 fold enhanced EH 10
activity over the transformant. The transformant was then evaluated in batch and fed batch 11
fermentations, where the batch fermentations resulted in ~ 50% improved EH activity from 12
flask evaluations. In fed batch fermentations, different specific feed rates were tested. A 13
specific feed rate of 0.1 g.g-1.h-1 resulted in the highest EH activity of 1750 mU.mg dw-1, 14
compared to maximum production levels of 0.3 mU.mg dw-1 for the wild type R. araucariae 15
and 52 mU.mg dw-1 E. coli. A 2.7-fold increase was observed from shake-flask 16
fermentation to the fed-batch fermentation. 17
3
Introduction 1
Epoxide hydrolases (EH’s) are enzymes that catalyse the trans addition of water to 2
epoxides, resulting in the formation of the corresponding vicinal diols. EH’s have been 3
found in a wide variety of organisms, such as plants, bacteria, fungi, mammals, insects and 4
yeasts and are hence regarded to be ubiquitous in nature (Weiijers et. al, 1999; Visser et. al., 5
2002 and Labuschagne et. al., 2006). Of these, soluble EH (sEH) and microsomal EH 6
(mEH) are the best studied due to their broad substrate specificity and their role in the 7
detoxification of epoxides derived from xenobiotic or endogenous compounds (Oesch, 8
1973). Stereochemical investigations have concluded that this attractive biocatalyst is 9
responsible for the production of valuable chiral building blocks (enantiopure epoxides and 10
corresponding enantiopure vicinal diols), which are used in the preparation of complex 11
enantiopure bioactive compounds or as end products with biological activity (Krieg et. al, 12
2001, Weijers et. al, 1999; Visser et al., 2000; Botes et al. 1998). 13
14
Highly enantioselctive EHs have been found in bacteria (Archer et al. 1996; Ospiran et al. 15
1997) and fungi (Zhang et al. 1996; Grogan et al. 1996; Botes et al. 1998). A screening of 16
25 different yeast genera for the hydrolysis of 1,2 epoxyoctane resulted in the selection of 17
Trichosporon, Rhodotorula and Rhodosporidium , which belonging to the bacidiomycetes 18
genera and that displayed the asymmetric hydrolysis of the epoxide (Boets et al 1998) . The 19
Rhodotorula araucariae CBS 6031 isolate demonstrated an enantiomeric excess (e.e) 20
values > 98% and enantiomeric ratio (Ee) >200 (Botes et al. 1998; Yeates et al. 2003). As a 21
result, EH encoding genes from Rhodotorula have been expressed in E. coli (Visser et al. 22
2002) and the dimorphic fungus, Yarrowia lipolytica (Labuschagne et al. 2004; 23
Labuschagne et al. 2006). The genes used for this study are as used by Visser et al., (2002) 24

4
In addition to these studies, other novel EHs were cloned from different fungi, including 1
Xanthophyllomyces dendrorhous (Visser et al. 1999); Aspergillus niger (Arand et al. 1999) 2
and Rhodotorula glutins (Visser et al. 2002). 3
4
Heterologous protein production using yeast as host is well documented (Russo M et al., 5
2005; Ramchuran et al., 2005; Kang et al., 1998. Recently Y. lipolytica has been developed 6
as a suitable expression host for a variety of recombinant proteins (Nicaud et al., 2002). The 7
potential capacity of this yeast for heterologous enzyme production has been demonstrated 8
in a cyclic fed batch process strategy for the production of rice α-amylase (Chang et al., 9
1997). Furthermore, heterologous lipase activity of 90500 U.mL-1 was achieved in fed 10
batch fermentations using Y. lipolytica as an expression host and by increasing the number 11
of copies of the LIP2 gene under the control of the POX2 promoter (Nicaud et al.2002). 12
Therefore, it is not surprising that Y. lipolytica is emerging as an efficient host for the 13
production of heterologous proteins. A wide range of selective markers, promoters, 14
secretion signals and stable site directed or random integration of either single or multi-15
copy expression cassettes into genome are available for this expression system. 16
17
Labuschagne et al., 2004 and 2007, expressed EH encoding genes from R. mucilaginosa 18
and R. paludigenum as single copy insertions into Y. lipolytica and demonstrated 19
production levels only at flask scale. In this study we assessed both the multi-copy 20
expression potential of Y. lipolytica using EH encoding genes from R. araucariae and its 21
hetelogous protein production capability in flask, batch and fed batch fermentations. 22
Furthemore, fed batch fermentation employing different specific nutrient feed regimes and 23
evaluation the effect on enzyme production yields was conducted. To our knowledge this 24
5
work is first demonstration of multi-copy expression of EH encoding genes in Y. lipolytica 1
and the evaluation of specific glucose feed rates on the production EH 2
3
Materials and methods 4
Strains and plasmids 5
The expression host Y. lipolytica Po1h was from Madzak et al. (2004) and expression 6
vector pINA1291 was from Nicaud et al. (2002), the eph gene (epoxide hydrolase gene) 7
was from R. araucariae (NCYC 3183). Escherichia coli TB1 (New England Biolabs, 8
Beverley, MA, USA) was used as the host during plasmid construction. Restriction 9
enzymes for DNA cleavage and ligation were from Fermentas (Vilnius, Lithuania) and used 10
according to manufactures instructions. Oligonucleotides were synthesised by Integrated 11
DNA Technologies (Coralville, IA, USA). 12
13
Vector construction 14
Plasmid pGEM-T:25 (Labuschagne, 2003) was digested with BamHI and BlnI and the 15
DNA fragments were separated by electrophoresis and purified using GFX™ PCR DNA 16
and Gel Band Purification Kit (Amersham Biosciences, Amersham, UK). The expression 17
vector (pINA1291) was similarly digested with BamHI and BlnI and dephosphorylated 18
using Antarctic Phosphatase (New England Biolab’s, Beverley, MA, USA). The eph gene 19
and pINA1291 were subsequently ligated overnight at 4°C. The resulting plasmid was 20
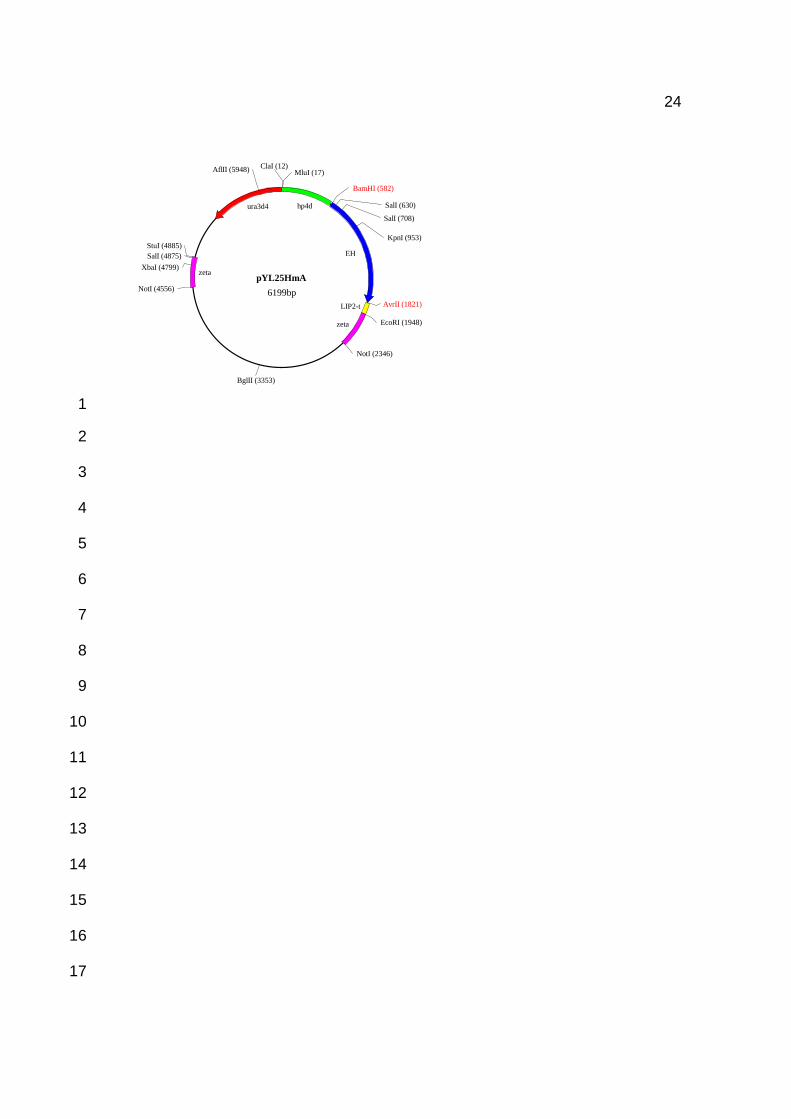
designated pYL25HmA (Figure 1) with the R. aucariae eph gene under the control of the 21
growth-phase inducible hybrid hp4d promoter and transformed into E. coli TB1 using the 22
Bio-Rad Gene-Pulser (Hercules, CA USA). Screening of the E.coli transformants was 23
conducted by PCR screening using the following gene-specific primers: 24

6
25-fwd (19 mer): 5'-GTG GAT CCA TGA GCG AGC A-3' 1
25-rev (20 mer): 5'-GAC CTA GGT CAC GAC GAC AG-3' 2
3
Transformation of Y. lipolytica Po1h 4
Positive E. coli transformants were selected and cultivated overnight at 37°C in 50ml of 5
LM (1% yeast extract, 1% tryptone, 0.5% NaCl) medium supplemented with 50 µg/ml 6
kanamycin on an Innova rotary shaker (New Brunswick, Edison, NJ, USA) at 200rpm. 7
Large-scale plasmid purification of pYL25HmA was carried out using Qiagen’s Plasmid 8
MIDI kit. The isolated plasmid DNA (5 µg) was digested with NotI to release the ~4 kb 9
expression cassette, which was separated by agarose gel electrophoresis and purified 10
similar to above. The cassette is bounded by the zeta regions and contains the ura3d4 11
marker which is required in multiple copies to complement the auxotrophy of the host 12
(Juretzek et al 2001) and the hp4dP - eph gene - LIP2T fragment to be integrated into the 13
host genome. Transformation of Y. lipolytica Po1h was conducted according to Xuan et al. 14
(1988). Colonies appearing on YNBcasa selective plates (2% glucose, 0.4% NH4Cl, 0.2% 15
casamino acids, 0.17% yeast nitrogen base without amino acids and without ammonium 16
sulphate, 0.03% leucine, 1.5% agar) after 7 – 14 days were transferred onto fresh plates and 17
sub-cultured. 18
19
Screening and clone selection 20
The Y. lipolytica transformants were subjected to genomic DNA isolation (Wizard® 21
Genomic DNA Purification Kit, Promega, Madison, WI, USA) from overnight cultures 22
grown in YPD (2% peptone, 2% glucose, 1% yeast extract). The genomic DNA (50ng) 23
was subsequently used as the template for PCR screening using an Eppendorf Mastercycler 24

7
Gradient PCR machine (Hamburg, Germany) using 250 nM of each primer listed above at 1
an annealing temperature of 50ºC for 1 min. The presence of PCR products of the expected 2
size was taken as confirmation that integration of the relevant expression cassette had 3
occurred in the genome of Y. lipolytica Po1h. 4
5
Positive clones were grown on selective agar plates (1.7% m.v-1 yeast nitrogen base; 0.4% 6
m.v-1 NH4Cl; 0.03% m.v-1 leucine; 2.0% m.v-1 glucose and 1.5% m.v-1 agar) for 5 days. 7
Clones were evaluated for recombinant EH activity by transferring a single colony into 8
(100mL) liquid media (1.5% m.v-1 yeast extract; 0.89% m.v-1 malt extract and 0.67% m.v-1 9
dextrose monohydrate) and cultivating flasks at 28oC at 150 RPM (Innova 2300, New 10
Brunswick Scientific, Edison, NJ) for 5 days. A final sample was taken and epoxide 11
hydrolase activity using whole cells were measured. 12
13
Culture Maintenance and Inoculum 14
The selected clone was streaked on selective agar plates (1.7% m.v-1 yeast nitrogen base; 15
0.4% m.v-1 NH4Cl; 0.03% m.v-1 leucine; 2.0% m.v-1 glucose and 1.5% m.v-1 agar) and 16
grown for 5 days, a single colony from this plate was inoculated into growth media (1.5% 17
m.v-1 yeast extract; 0.89% m.v-1 malt extract and 0.67% m.v-1 dextrose monohydrate) pre-18
sterilized for 20 min at 121oC, and cultured for 24 hours at 28oC at 150 RPM (Innova 2300, 19
New Brunswick Scientific, Edison, NJ). Cultures were cryo-preserved using 25% v.v-1 20
sterile glycerol as described by Meza et al. 2004. These cryo-preserved cultures were used 21
as starter inoculate for all experiments by inoculating 1 cryovial into 700mL of growth 22
media and cultured for 21 hours at 28oC and 150RPM (Innova 2300, New Brunswick 23
Scientific, Edison, NJ), before transferring to fermenters. 24

8
1
Evaluation of selected clone in Batch fermentation 2
All fermentation experiments were conducted in Braun C 15L fermenters (Braun, 3
Germany). Duplicate fermentations, containing 9.3L of initial charge fermentation medium 4
(as stipulated in patent WO/2007/010403), was inoculated with 700mL inoculum at an 5
optical density (OD660nm) of ~ 20 and a cell concentration of 1.82 X 10⁸ ± 3.39 X10⁷ 6
CFU.mL-1. The fermentation temperature was maintained at 28oC ± 0.1, aeration at 1 vvm 7
± 0.003, impeller speed at 500 - 1000 rpm and pH at 5.5 ± 0.04 with NH4OH (25% m.v-1) 8
and H2SO4 (20% m.m-1). Dissolved oxygen was maintained above 25% saturation by 9
varying impeller speed. Analysis of the fermentation exhaust gases were conducted using a 10
Uras 10E, Hartman and Braun gas analyzer (Braun, Germany). Oxygen utilization (OUR) 11
and Carbon dioxide evolution (CER) rates were calculated online by MFCS software 12
(Braun, Germany. 13
14
Fed Batch Fermentation 15
The fed batch fermentation evaluation was conducted on the recipe and control parameters 16
as for the batch fermentations. Four fermentations were fed a 60% m.m-1 glucose solution 17
at varying specific feed rates, using a gravimetric feed controller to accurately maintain the 18
desired feed rates. Sugar feed commenced when the residual glucose concentration dropped 19
below 5 g.L-1. Specific feed rates were calculated from an average dry cell weight total 20
obtained from batch fermentation data and each fermentation was fed at different specific 21
feed rates equating to 0.068, 0.085, 0.1 and 0.12 g.g-1.h-1 respectively. Specific feed rate is a 22
representation of the amount of sugar fed per gram of dry cell weight per hour (Hellwig et 23
9
al. 2000). The theoretical OUR at a specific feed rate of 0.12 g.g-1.h-1 was calculated to be 1
200 mMol.L-1.h-1 , which is the near maximum limit obtainable in conventional stirred tank 2
reactors at production scale. This was used as the basis for selection of the highest specific 3
feed rate and varied at 20, 30 and 40 % increments below the maximum. 4
5
Sampling and analysis 6
Fermentations were sampled four hourly and analyzed for optical density at 660 nm using a 7
Genesys 20 spectrophotometer (Spectronic, NY,USA) , dry cell weight (Jolivalt et al., 8
2005), glucose concentration using a Dionex HPLC (CarboPacTM PA1 column, Dionex, 9
MA, USA) and epoxide hydrolase enzyme activity. 10
11
Determination of Epoxide hydrolase activity 12
1,2- Epoxyhexane was selected as the substrate due to availability and it being considered 13
as one of the preferred substrates for the selected clone (Lotter et al., 2000). Samples were 14
assayed for volumetric epoxide hydrolase activity (µmole. minute-1. mL-1) towards 1,2-15
epoxyhexane (200mM). 1,2-Epoxyhexane was added to a final concentration of 200mM to 16
500µl cell suspensions (2.5% wet weight.volume-1) in potassium phosphate buffer (50mM, 17
pH 7.5 containing 20% v.v-1 glycerol). The reactions were incubated (25°C) on an 18
eppendorff shaker with gentle shaking. The reactions were initiated with the addition of 19
substrate and allowed to react for 10 minutes; thereafter the samples were stopped with the 20
addition of 500µl of ethyl acetate for extraction. The samples were vortexed for 30 seconds 21
and centrifuged in a bench top centrifuge (Heraeus Biofuge Pico, Germany) at 13000 rpm. 22
The organic fractions were dried over anhydrous magnesium sulphate and submitted for 23
quantitative non-chiral 1,2-Epoxyhexane analysis by gas chromatography (GC). 24
10
1
Non-chiral GC for the quantitative analysis of 1,2-epoxyhexane bioconversion was 2
performed on a Hewlett Packard 5890 series II gas chromatograph (GC) equipped with 3
Flame Ionisation Detector (FID) and Agilent 6890 series auto sampler injector, using 4
hydrogen as a carrier gas at a constant column head pressure at 10psi. The analysis of 1, 2 - 5
Epoxyhexane was achieved using a non-chiral capillary GC column MDN 5S (Supelco) 6
30m length x 0.25mm internal diameter x 0.25µm film thickness, and 10mM 1- Heptanol 7
(Sigma-Aldrich) as the internal standard. The injection temperature was maintained 8
constant at 250°C, detector temperature at 300°C, and injection volume at 1.0 µL and split 9
ratio at 50:1. The oven temperature programme was as follows: the initial temperature of 10
50°C was maintained for 1 minute, increased at a rate of 20°C per minute to 220°C, and 11
maintained at this temperature for 2.5 minutes. The retention times (Rt) in minutes were as 12
follows: 1,2-epoxyhexane = 2.8, 1-heptanol = 4.3 and 1,2-hexanediol = 5.0. 13
14
Data analysis and calculations 15
All fermentation data was subjected to stringent analysis and modelling. The 2nd order 16
polynomial fit to fed batch dry cell weight totals, plotted against time, was significant, with 17
r2 > 0.9, the resultant quadratic equation was used to model the dry cell weight up to an age 18
of 68 h (Modelled Dry cell weight Total (g) = Aχ2 + Bχ + C), were χ = age (h). The dry cell 19
weight and enzyme productivities were calculated as stipulated by Chang et.al. 1998 and 20
Nori et al. 1983. The specific feed rates were calculated as described by Hellwig et al. 21
2000. Yield co-efficient calculations for dry cell weight and EH on sugar and oxygen was 22
conducted as stipulated by Papanikolaou and Aggelis, 2001. Yield of product on sugar 23

11
(Yps), yield of product on oxygen (Ypo), yield of biomass on sugar (Yxs) and yield of 1
biomass on oxygen (Yxo) were measured. 2
3
Results 4
Multicopy Transformation Y. lipolytica and evaluation of clones in shake flasks 5
Due to the low transformation efficiency of the Y. lipolytivca system (Madzak et al. 2004), 6
only two clones designated YL1 and YL2 were obtained. The screening of these clones, 7
based on recombinant EH activity, revealed a significant difference in enzyme activity 8
levels at the end of the five day flask fermentation between the clones. The YL1-clone 9
displayed the highest final EH activity of 6.82 ± 1.30 mmol.min-1.L-1, which was 10
approximately 4-fold higher than the YL2-clone. Therefore, the YL1 clone was selected for 11
further investigations and subsequently designated construct YL25. 12
13
Batch Fermentation. 14
Clone YL25 HmA was then evaluated in batch fermentation with an initial glucose 15
concentration of 20% m.v-1. A lag phase of ~ 5h was apparent after inoculation and the 16
culture grew at a specific growth rate of 0.2336 h-1. The highest dry cell weight 17
concentration achieved during cultivation was 15.8 ± 1.7 g.L-1 with the total volumetric 18
biomass productivity of 0.91 g.L-1h-1 after 14.6 hours of cultivation (Fig.2). Although the 19
maximum biomass titre (15.8 g.L-1) was attained approximately 17.3 hours after 20
inoculation, the initial glucose was depleted ~2.7 hours earlier (14.6 hours). At this stage of 21
the cultivation the growth rate of the organism was apparently attenuated in response to 22
substrate depletion as observed by the change in dry cell weight productivity (Fig. 2). A 23
final volumetric cell mass concentration of 14.07 g.l-1 was produced during batch 24
12
fermentation. With respect to enzyme activity, a maximum epoxide hydrolase activity of 1
13.93 ± 0.09 mmol.min-1.L-1 was recorded 17.3 hours after inoculation, relating to a total 2
volumetric enzyme activity of 14.12U.L-1. This was approximately double the EH 3
concentration measured in 700ml shake flasks (data not shown), thus indicating increased 4
biomass titres being proportional to enzyme production yields. 5
6
Fed Batch Fermentation 7
The poor epoxide hydrolase activities observed in the batch fermentation led to the 8
investigation of a linear glucose feeding strategy on the production of epoxide hydrolase 9
enzyme. The dry cell weight total obtained from the batch fermentation were plotted and 10
subjected to 2nd order polynomial analysis, the resultant equation (0.2269x2 + 2.5825x - 11
4.3775) was used to predict the dry cell weight totals over a period of 68 hours. An age of 12
68 hours was theoretically calculated to be the age at which the operating volume of the 13
fermenter would be exceeded at the highest feed rate. The average dry cell weight obtained 14
over the entire modelled period was 443.4 g, which equated to a feed rate of 50.3, 62.8, 15
73.9 and 88.7 g.h-1(as 60% glucose) for the designed specific feed rates of 0.068, 0.085, 0.1 16
and 0.12 respectively. 17
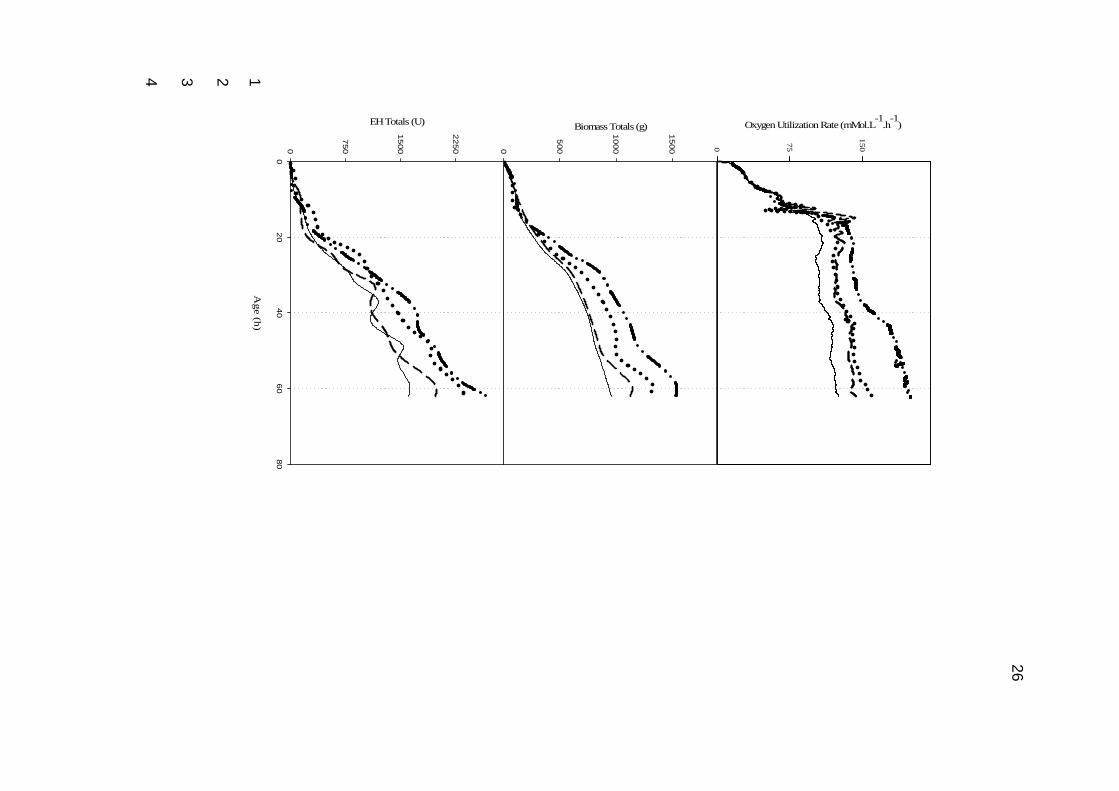
18
The oxygen utilization trends (Fig. 3a) observed for the fed-batch fermentations 19
demonstrated an increased metabolic activity at increased specific feed rates. Figures 3b 20
and c representing Dry cell weight and EH totals respectively clearly demonstrate increased 21
totals for increase specific feed rates. In the feeding regime investigated, an increase in 22
specific EH activity, dry cell weight and enzyme levels was observed in response to 23
increased specific feed rates (Fig 4a, b and c respectively). The measured specific feed rates 24

13
were calculated from the average of the measured dry cell weights over the length of the 1
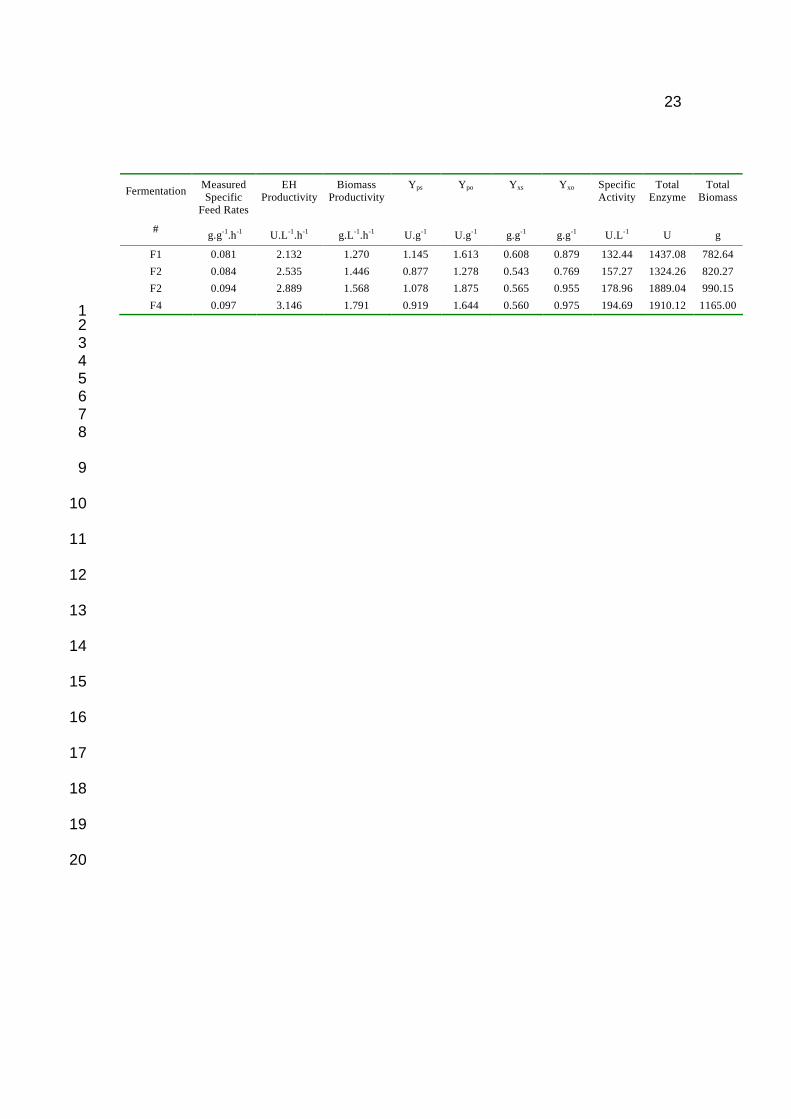
fermentation and the measured glucose feed rates (Table 1). The measured specific feed 2
rates were ~ 1.3 fold higher than the designed specific feed rates. This difference could 3
reflect either inaccuracies in the model predictions, used to determine feed rates, or 4
physiological differences between cultivation in batch and fed-batch culture. The 5
relationship between specific feed rate and EH totals (Fig 4c) was linear (y = 36022x – 6
1561.3; R2 > 0.8). Similar trends are apparent for specific feed rate and biomass totals (y = 7
21330x – 956.16; R2 > 0.9) and specific EH activity (3290.9x – 126.63; R2 > 0.9). The 8
average yield of biomass on sugar (Yxs) for the four fed batch fermentations was 0.57 g.g-9
1.h-1 ± 0.02, thus indicating that no change in Yxs with changing specific feed rates. 10
11
Discussion 12
Labuschagne et al., 2004 and 2007, cloned EH encoding genes from R. paludgenum (2004) 13
and R. mucilaginosa (2007) into Y. lipolytica. The cloning experiments were done soley as 14
single copy insertions into the Y. lipolytica genome, additionally the demonstration of the 15
functional expression of the EH encoding genes in Y. lipolytica was done at flask scale 16
only. Visser et al., 2002, expressed the same EH encoding genes from R. araucariae as 17
used in this study, in E. coli, as a single copy insert. The purpose of this study was to 18
evaluate the multi-copy expression of EH encoding genes from R. araucariae (Visser et al., 19
2002), in recombinant Y. lipolytica, in batch and fed batch fermentation culture as well as a 20
comparison between the EH production obtained in wild type R. araucariae and 21
recombinant E. coli. Due to the lack of published information on recombinant expression of 22
EH encoding genes from R. araucariae in Y. lipolytica, in both single and multi-copy, a 23
direct comparison in EH production levels could not be conducted. 24

14
The flask assessment of the resultant clones led to the conclusive selection of a single clone 1
demonstrating excellent activity toward the substrate 1,2 epoxyhexane, for further 2
investigation in laboratory scale fermenters. 3
4
Growth-associated epoxide hydrolase production in batch fermentation was improved 5
compared to shake-flask cultivation, although the final enzyme activity was still low, partly 6
due to the short production period. The end of the batch fermentation was directly related to 7
depletion of sugar, which was immediately followed by decrease in the product and 8
biomass incremental productivities (Figure 2). The glucose was depleted at ~ 14h, although 9
the production of EH continued for another 5 hours did not decline at this stage. The 10
depletion of glucose would have triggered the early onset of the idiophase (Silva et al., 11
1998 and Moresi, 1994). The YL25 clone selected for investigation is under the strict 12
control of the hp4d promoter, Nicaud et al., (2002) suggested that the hp4d promoter is a 13
growth phase-dependent, with production accelerating at the entry into stationary phase 14
(idiophase). It was therefore hypothesised if the idiophase was sufficiently delayed by 15
additional feeding in fed-batch cultivation, growth-associated EH production and the 16
specific EH activity could be drastically increased. In the fed batch fermentations, the initial 17
glucose concentration was maintained at the same level as for the batch, to induce an early 18
idiophase. Figure 3a demonstrates the drastic change in the slope of the OUR trend at ~ 13h 19
which coincided with the depletion of glucose. Glucose concentrations in all fed batch 20
fermentations after the start of glucose feed was zero, this ensured that the growth of the 21
fermentation was controlled by the sugar feed rate. 22
23
15
Previous research on the production of lipase in recombinant Y. lipolytica under the control 1
of the hp4d promoter demonstrated substantial increases in activities from shake-flask to 2
batch to fed batch fermentations of 2000, 11500 and 90500 U.mL-1 respectively (Nicaud et 3
al., 2000), reflecting an increase in activity of almost 2 orders of magnitude. The results 4
obtained during the present study demonstrated similar trends of 6.82, 13.96 and 132.43 5
U.L-1 for shake-flask, batch and fed batch fermentations equating to ~ 20 fold increase from 6
flask to fed batch. However there is currently no available scientific representation of the 7
effect of specific feed rates on heterologous protein expression in recombinant Y. lipolytica. 8
9
The effect of the specific feed rate on specific EH activity, biomass formation, and final EH 10
concentration, represented in Figure 4, demonstrate a highly linear relationship between all 11
three variables and the specific feed rate. Increasing the specific feed rate from 0.08 to 0.1 12
g.g-1.h-1 resulted in an increase of ~ 68% in specific EH activity and ~ 75% in total EH 13
production. As the residual glucose concentration remained zero during all fed-batch 14
fermentations, cultures remained carbon-limited, while the increase in biomass production 15
was directly translated into an increase in growth-associated EH production. Results 16
indicate that EH production may be increased further by increasing the specific feed rates 17
above maximum of 0.1 g.g.h-1 tested. However, the OUR (Figure 3a) at a specific feed 18
rate of 0.1 g.g.h-1 reaches ~ 200 mMol.L-1, which represents an upper limit in the scale-up 19
of the process in a stirred tank reactor, due to limitations such as cooling and oxygen 20
transfer rates (Ozturk, 1996 and Riviere, 1977). Figure 3b clearly demonstrates that with 21
increased glucose feeds there is a related increase in biomass, this increased biomass 22
requires substantial amounts of cooling to counter the heat generated during metabolism, 23

16
and therefore if specific feed rates are increased to greater than 0.1 g.g-1.h-1, the cooling 1
requirements will not be met within conventional stirred tank reactors. 2
3
The best EH activity observed during this study was 1750 mU.mg dw-1, attained in a fed 4
batch fermentation fed at a specific feed rate of ~ 0.1 g.g-1h-1. Visser et al., (2002) 5
demonstrated an EH activity of 0.3 mU.mg dw-1 for thw wild type R. araucariae and 52 6
mU.mg dw-1 for the recombinant E. coli, containing the EH encoding genes from R. 7
araucariae. For the flask evaluation of the multi-copy expression of this study, an EH 8
activity of 590.6 mU.mg dw-1 was observed, which was greater than 1 order of magnitude 9
higher that observed by Visser et al. (2002) for recombinant E. coli bearing the same genes. 10
This comparison clearly demonstrates the benefits of using multi-copy gene expression in 11
Y. lipolytica system. 12
13
References 14
1. Arand M, Müller F, Mecky A, Hinz W, Urban P, Pompon D, Kellner R, Oesch F 15
(1999) Catalytic triad of microsomal epoxide hydrolase: replacement of Glu404 with 16
Asp leads to a strongly increased turnover rate. J. Biochem. 337: 37-43 17
2. Archer I.V.J, Leak D.J, Widdowson D.A (1996) Chemoenzymic resolution and 18
deracemisation of (±)-1-methyl-1,2-epoxycyclohexane: the synthesis of (1-S, 2-S)-19
1-methylcyclohexane-1,2-diol. Tetrahedron lett. 37: 8819-8822 20
3. Bhargava S, Nandakumar M.P, Roy A, Wenger K.S (2003) Pulsed feeding during 21
fed-batch fungal fermentation leads to reduced viscosity without detrimentally 22
affecting protein expression. Biotechnol and Bioeng. 81: 341-347. DOI: 23
10.1002/bit. 10481 24
17
4. Botes A.L, Labuscagne M, Roth R, Mitra R. K, Lotter J, Lalloo R, Ramduth D.M, 1
Rohitlall N, Simpson C, Van, Zyl P (25.01.2007) Recombinant Yeasts For 2
Synthesizing Epoxide Hydrolases. World Intellectual Property Organization, 3
Publication no.: WO/2007/010403, International application no.: 4
PCT/IB2006/002744. (Patent) 5
5. Botes A.L, Weijers C.A.G.M, van Dyk M.S (1998) Biocatalytic resolution of 1,2-6
epoxyoctane using resting cells of different yeast strains with novel epoxide 7
hydrolase activities. Biotechnol. Letter. 20: 421-426 8
6. Chang C.C, Ryu D.D.Y, Park C.S, Kim J-Y (1998) Improvement of heterologous 9
protein productivity using recombinant Yarrowia lipolytica and a cyclic fed-batch 10
process strategy. Biotechnol and Bioeng. 59: 379-385 11
7. Chang C.C, Ryu D.D.Y, Park C.S, Kim J-Y, Ogrydziak (1998) Recombinant 12
bioprocess optimization for heterologous protein production using two-stage, cyclic 13
fed-batch culture. Applied Microbiol Biotechnol 49: 531-537 14
8. Grogan G, Roberts S.M, Willets A.J (1996) Novel aliphatic epoxide hydrolase 15
activities from dematiaceous fungi. FEMS Microbiol. Lett. 141: 239-243 16
9. Juretzek T, Ledall M, Mauersberger S, Gaillardin C, Barth G and Nicaud J.M 17
(2001) Vectors for gene expression and amplification in the yeast Yarrowia 18
lipolytica. Yeast 18:97-113 19
10. Kang H, Kim J-Y, Ko S-M, Park C.S, Ryu D.D.Y, Sohn J-H, Choi E-S, Rhee S-K 20
(1999) Cloning and characterization of the Hansenula polymorpha homologue of 21
the Saccharomyces cerevisiae PMR1 gene. Yeast. 14: 1233 – 1240 22

18
11. Krieg H.M, Botes A.L, Smit M.S, Breytenbach J.C, Keizer K (2001) The 1
enantioselective catalytic hydrolysis of racemic 1,2-epoxyoctane in a batch and 2
continous process. J Molecular Catalysis B: Enzymatic 13: 37-47 3
12. Labuschagne M (2003) Cloning of yeast epoxide hydrolase genes and expression in 4
Yarrowia lipolytica. MSc Thesis, University of Free State, South Africa 5
13. Labuschagne M, Botes A.L, Albertyn J (2004) Cloning and sequencing of an 6
epoxide hydrolase gene from Rhodosporidium paludigenum. DNA Seq. 15: 202-205 7
14. Labuschagne M, Albertyn J (2007) Cloning of an epoxide hydrolase-encoding gene 8
from Rhodotorula mucilaginosa and functional expression in Yarrowia lipolytica. 9
Yeast. 24: 69-78 10
15. Lotter J, Botes A.L, van Dyk M.S, Breytenbach J.C (2004) Correlation between the 11
physicochemical properties of organic solvents and their biocompatibility toward 12
epoxide hydrolase activity in whole-cells of a yeast, Rhodotorula sp. Biotechnol. 13
Letters. 26: 1191-1195 14
16. Lydersen B.J, D’elia N.A, Nelson K.L (1994) Bioprocess Engineering Systems, 15
Equipment and Facilities. John Wiley and Sons, Inc. , Brisbane Chichester New 16
York Singapore Toronto 17
17. Madzak C, Gaillardin C, Beckerich J-M (2004) Heterologous protein expression 18
and secretion in the non-conventional yeast Yarrowia lipolytica: a review. J. 19
Biotechnol. 109: 63-81 20
18. Meza, R.A., Monroy, A.F., Mercado, M., Poutou, R.A., Rodriguez, P. and Pedroza, 21
A.P. (2004) Study of the stability in real time of cryopreserved strain banks. 22
Universitas Scientiarum 9, 35–42 23

19
19. Moresi M (1994) Effect of glucose concentration on citric acid production by 1
Yarrowia lipolytica. J. Chem. Technol. And Biotechnol. 60: 387-395 2
20. Müller S, Sandal T, Kamp-Hansen P, Dalbøge H (1998) Comparison of expression 3
systems in yeasts Saccharomyces cerevisiae, Hansenula polymorpha, Klyveromyces 4
lactis, Schizosaccharomyces pombe and Yarrowia lipolytica. Cloning of two novel 5
promoters from Yarrowia lipolytica. Yeast. 14: 1267-1283 6
21. Nicaud J.M, Madzak M, van den Broek P, Gysler C, Duboc P, Niederberger P, 7
Gaillardin C (2002) Protein expression and secretion in the yeast Yarrowia 8
lipolytica. FEMS Yeast Research 2: 371-379 9
22. Nori H, Yamane T, Kobayashi T, Shimizu S (1983) Comparison of cell productivity 10
among fed-batch, repeat fed-batch and continuous cultures at high cell 11
concentration. J Ferment Technol 61: 391-401 12
23. Okamoto K, Ikeda M (2000) Development of an industrially stable process for L-13
threonine fermentation by an L-methionine-auxotrophic mutant of Escherichia coli. 14
J Biosci Bioeng. 89: 87-89 15
24. Ospiran I, Kroutil W, Mischitz M, Faber K (1997) Biocatalytic resolution of 2-16
methyl-2-(aryl)alkyloxiranes using novel bacterial epoxide hydrolases Tetrahedron 17
Asymmetry. 8: 65-71 18
25. Papanikolaou S, Aggelis G (2002) Lipid production by Yarrowia lipolytica growing 19
on industrial glycerol in a single-stage continuous culture. Bioresource Technology. 20
82: 43-49 21
26. Pignede G, Wang H, Fudalej, Gaillardin F, Seman C, Nicaud J.M (2000) 22
Characterization of an extracellular lipase encoded by LIP2 in Yarrowia lipolytica. 23
J. Bacteriol. 182: 2802-2810 24

20
27. Ramchuran S.O, Mateus B, Holst O, Karlsson E.N (2005) The methylotrophic yeast 1
Pichia pastoris as a host for the expression and production of thermostable xylanase 2
from the bacterium Rhodothermus marinus. FEMS Yeast Research. 5: 839–850 3
28. Rivière J (1977) Industrial Applications of Microbiology. John Wiley and Sons, 4
Inc., London New York Paris 5
29. Russo M, Rubino L (2005) Saccharomyces cerevisiae as a model host for studying 6
gene expression and RNA replication of positive-strand RNA viruses. Journal of 7
Plant Pathology. 87: 79-89 8
30. Takiguchi N, Shimizu H, Shioya S (1997) An on-line physiological state 9
recognition system for the lysine fermentation process based on a metabolic reaction 10
model. Biotechnol Bioeng. 55: 170-181 11
31. Visser H, Weijer C.A.G.M, van Ooyen A.J.J, Verdoes J.C (2002) Cloning, 12
characterization and heterologous expression of epoxide hydrolase-encoding cDNA 13
sequences from yeasts belonging to the genera Rhodotorula and Rhodosporidium. 14
Biotechnol. Letters. 24: 1687-1694 15
32. Visser H, Vreugdenhil S, de Bont J.A.M, Verdoes J.C (2000) Cloning and 16
characterization of an epoxide hydrolase encoding gene from Rhodotorula glutinis. 17
Appl. Microbiol. Biotechnol. 53: 415-419 18
33. Visser H, de Bont J.A.M, Verdoes J.C (1999) Isolation and characterization of the 19
epoxide hydrolase encoding gene from Xanthophllomyces dendrorhous. App. And 20
Enviro. Microbio. 65: 5459-5463 21
34. Weijers C.A.G.M, de Bont J.A.M (1999) Epoxide hydrolases from yeasts and other 22
sources: versatile tools in biocatalysis. J. of Molecular Catal. B: Enzymatic. 6: 199-23
214 24
21
35. Xuan J-W, Fournier P, Gaillardin C (1988) Cloning of LYS5 gene encoding 1
saccharopine dehydrogenase from the yeast Yarrowia lipolytica by target 2
integration. Curr. Genet. 14: 15-21 3
36. Yeates C.A, van Dyk M.S, Botes A.L, Breytenbach, Krieg H.M (2003) Biocatalysis 4
of nitro substituted styrene oxides by non-conventional yeasts. Biotechnol. Letters 5
25: 675-680 6
7
8
9
10
11
12
13
14
15
16
17
18
19
20
21
22
23
24
22
Table Legends 1
Table 1. Fed Batch fermentation results for varying specific feed rates. 2
3
Figure Legends 4
Figure 1. pYL25HmA, containing the R. auracariae eph gene (EH) under control of the hp4d promoter and 5 LIP2 terminator (LIP2-t). 6
7
Figure 2. The incremental biomass, •, EH ,�, productivities and glucose concentrations ,�, of batch 8
fermentation of Yarrowia lipolytica. 9
10
Figure 3. Fed batch fermentation profiles, A Oxygen utilization rates; B Total Biomass and C Total EH for 11
the four test fermentations. F1 ; F2 ; F3 and F4 . 12
13
Figure 4. Effect of specific feed rate on, A Specific EH activity, B total biomass production and C total EH 14
production. 15
16
17
18 19 20 21 22 23 24 25 26 27
23
Fermentation #
Measured Specific
Feed Rates
g.g-1.h-1
EH Productivity
U.L-1.h-1
Biomass Productivity
g.L-1.h-1
Yps
U.g-1
Ypo
U.g-1
Yxs
g.g-1
Yxo
g.g-1
Specific Activity
U.L-1
Total Enzyme
U
Total Biomass
g
F1 0.081 2.132 1.270 1.145 1.613 0.608 0.879 132.44 1437.08 782.64
F2 0.084 2.535 1.446 0.877 1.278 0.543 0.769 157.27 1324.26 820.27
F2 0.094 2.889 1.568 1.078 1.875 0.565 0.955 178.96 1889.04 990.15
F4 0.097 3.146 1.791 0.919 1.644 0.560 0.975 194.69 1910.12 1165.00 1 2 3 4 5 6 7 8
9
10
11
12
13
14
15
16
17
18
19
20
24
pYL25HmA
6199bp
hp4d
EH
LIP2-t
zeta
zeta
ura3d4
ClaI (12)MluI (17)
BamHI (582)
SalI (630)
NotI (4556)
SalI (708)
AvrII (1821)
AflII (5948)
EcoRI (1948)
BglII (3353)
NotI (2346)
StuI (4885)KpnI (953)
SalI (4875)
XbaI (4799)
1
2
3
4
5
6
7
8
9
10
11
12
13
14
15
16
17

25
Ag
e (h
)
02
46
810
12
14
16
18
20
Incremental EH and DCW productivity (g.L-1h-1)
0.0
0.2
0.4
0.6
0.8
1.0
Glucose concentration (g.L-1)
0 5 10
15
20
25
1
2
3
4
26
Oxygen Utilization Rate (mMol.L-1
.h-1
)
0
75
150
Biomass Totals (g)
0
500
1000
1500
Age
(h)
020
40
60
80
EH Totals (U)
0
750
1500
2250
1
2
3
4

27
Specific Feed Rate (g.g-1.h-1)
0.07 0.08 0.09 0.10 0.11
EH
Tota
ls (U
)
1250
1500
1750
2000
2D Graph 2
Bio
mass
Tota
ls (g)
750
1000
Speci
fic E
H A
ctiv
ity U
.L-1
120
150
180
210
1
2
3