Embed Size (px)
DESCRIPTION
icu care
Citation preview
Rhythm Strips Interpretation: A Step-by-Step Approach
©Eric A. Tungol BSN, MSN, RN.
Rhythm Strips Interpretation: A Step by Step Approach 1
Table of Contents
Objectives………………………………………………………………………………………………..4 The Conduction System……………………………………………………………………………….5 Sinoatrial Node…………………………………………………………………………………..5 Internodal Pathways………………………………………………………………………….....6 Atrioventricular Junction………………………………………………………………………...6 Atrionodal………………………………………………………………………………...7 Nodal……………………………………………………………………………………...7 Nodal His…………………………………………………………………………………7 Bundle of His…………………………………………………………………………….7 Right Bundle Branch…………………………………………………………………………….8 Left Bundle Branch………………………………………………………………………………8 Purkinje Fibers…………………………………………………………………………………...9 Accessory Pathways……………………………………………………………………………………….9 Depolarization and Repolarization………………………………...………………………………………….. 10 Polarity…………………………………………………………………………………………………….. 10 Depolarization…………………………………………………………………………………………….. 10 Repolarization…………………………………………………………………………………………….. 10 ECG Paper and Measurement…………………………………………………………………………………. 11 Time……………………………………………………………………………………………………….. 11 Amplitude (Voltage) Measurement…………………………………………………………………….. 11 ECG Components………………………………………………………………………………………………... 12 Waves and Complexes………………………………………………………………………………….. 12 The Isoelectric Line…………………………………………………………………………….. 12 P Wave…………………………………………………………………………………………... 13 QRS complex……………………………………………………………………………………. 14 T Wave.............................................................................................................................. 16 U Wave…………………………………………………………………………………………... 17 Intervals and Segments………………………………………………………………………………….. 19 PR Interval......................................................................................................................... 19 QT Interval……………………………………………………………………………………….. 20
Rhythm Strips Interpretation: A Step by Step Approach 2
ST Segment……………………………………………………………………………...………. 21 Rhythm and Determination……………………………………………………………………………...…...…. 23 The 11 Step Method……………………………………………………………………………………….23 The 11 Step Method To Rhythm Determination………………………………………………………..24 Atrial Rhythms……………………………………………………………………………………………………...28 Sinus Rhythm………………….……………………………………………………………………………29 Premature Atrial Contraction (PAC)…………………………………...…………………………………30 Most Common Causes…………………………………………………………………………..31 Possible Treatments……………………...……………………………………………………...31 Atrial Tachycardia………………………………………………………………………………………….32 Common Causes…………………………………………………………………………………33 Possible Treatments………….…...……………………………………………………………..33 Atrial Flutter…………………………………………………………………………………………..…….34 Presentation………………………………………………………………………………………35 Common Causes…………………………………………………………………………………35 Possible Treatments……………………………………………………………………………..35 Atrial Fibrillation………………………………………………..…………………………….……….…...37 Presentation……………………………………...…………………………………...…………38 Common Causes……………………..…………………………………………………………38 Possible Treatments.........................................................................................................38 Junctional Rhythms………………………………………………………………………………………………39 Junctional Arrhythmia..……………….…………………………………………………………………..40 Type………………………………………………………………………………………………40 Significance………………………………………………………………………………………40 Common Causes………………………………………………………………………………..40 Possible Treatments…………………………………………………………………………….40 Premature Junctional Contractions………………………………………………..……………………41 Presentation……………………………………………………………………………………..42 Common Causes………………………………………………………………………………..42 Possible Treatments……….……………………………………………………………………42 Junctional Rhythm…………………………….…………………………………………………………..43 Atrioventricular Blocks…………………………………………………………………………………………..45 Does The PR Interval Vary? Can It Be Measured?........................................................................46 1st Degree AV Block…..…………………………………………………………………………………..47 Mobitz Type 1 AV Block (Wenckeback)…......………………………………………………………….49 Common Causes…………………...……………………………………………………………50
Rhythm Strips Interpretation: A Step by Step Approach 3
Presentation………………………………………………………………………………………50 Possible Treatment………………………………………………………………………………51 Mobitz Type II AV block……………….…………………………………………………………………..52 Presentation………...…………………………………………………………………………….53 Common Causes…………………………………………....……………………………………53 Possible Treatment………………………………….……………………………………………54 Third Degree AV Block…………………………………………………………………………………….55 Presentation……………...……………………………………………………………………….56 Common Causes and Treatment……………………………………………………………….56 Ventricular Rhythms………………………………………………………………………………...…………….57 Ventricular Arrhythmia……...……………………………………………………………………………..58
Types……………………………………………………….……………………………………..58 Premature Ventricular Contractions................................................................................................59 Symptoms…………………………………………………………………………………………59 Occurrence………………………………………………………………………………………..62 Idioventricular Rhythm……………………………………………………………………………………..63 Accelerated Idioventricular Rhythm………..…………………………………………………………….64 Common Causes…………………………………………………………………………………65 Possible Treatment…………………………….…………………………………………………65 Ventricular Tachycardia……………………………………………………………………………………66 Common Causes…………………………………………………………………………………67 Presentation……………………………………………………………………………………….68 Treatment………………………………………………………………………………………….68 Torsades de Pointes……………………………………………………………………………………….69 Ventricular Fibrillation……………………………………………………………………………………...71 Common Causes…………………………………………………………………………………72 Symptoms…………………………………………………………………………………………73 Treatment……………………………………………………….……….………………………..73 ECG Glossary……………………………………………………………………………………………………….74 Rhythm Strips Practice………………………………………………………………...………………………….77 Key Answer…………………………………………………………………......…………………………………105 Bibliography……………………………………………………………………………………………………….106
Rhythm Strips Interpretation: A Step by Step Approach 4
Objectives
• Explain the cardiac conduction system. • Identify accessory conduction pathways. • Discuss depolarization and repolarization. • Discuss the characteristics of ECG paper. • Discuss the Normal ECG components. • Describe the relationship between the waveforms and intervals of the ECG and
the electrical activity of the heart. • Outline the process of rhythm strips analysis and interpretation. • Define the characteristics of the following rhythms:
• Atrial Rhythms • Junctional Rhythms • Atrioventricular blocks • Ventricular rhythms • Torsade de Pointes
• Analyze and interpret cardiac rhythm strips.
Rhythm Strips Interpretation: A Step by Step Approach 5
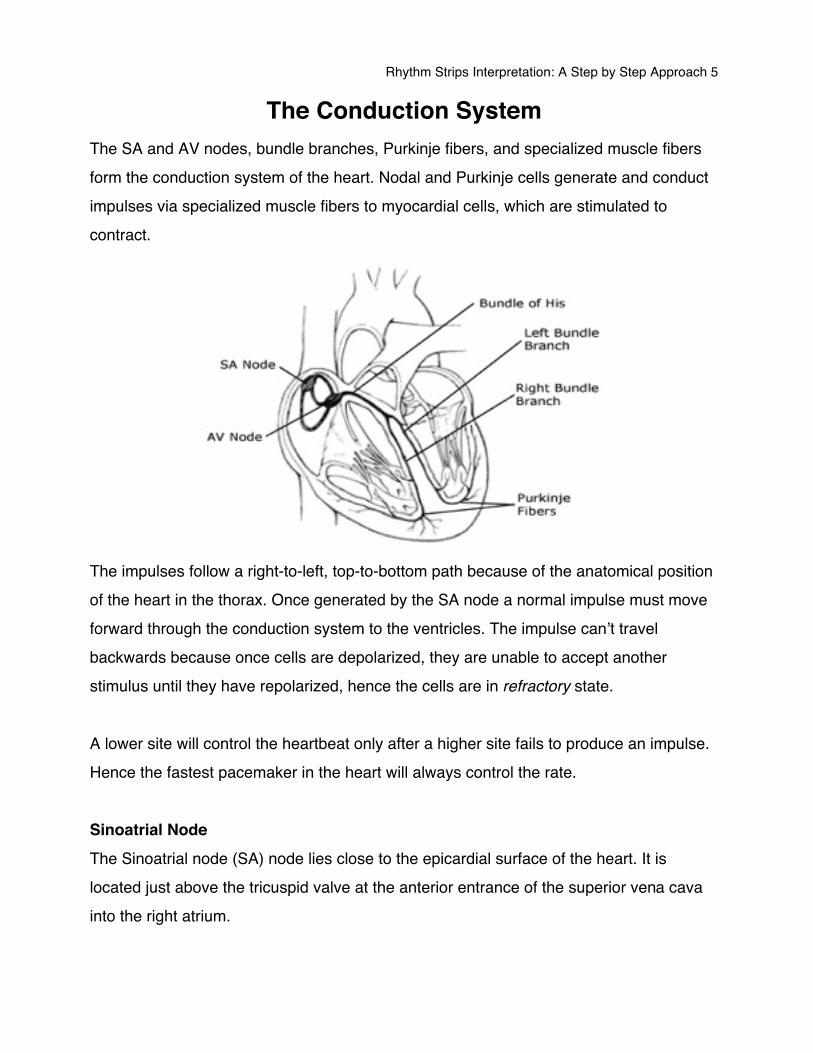
The Conduction System The SA and AV nodes, bundle branches, Purkinje fibers, and specialized muscle fibers form the conduction system of the heart. Nodal and Purkinje cells generate and conduct impulses via specialized muscle fibers to myocardial cells, which are stimulated to contract.
The impulses follow a right-to-left, top-to-bottom path because of the anatomical position of the heart in the thorax. Once generated by the SA node a normal impulse must move forward through the conduction system to the ventricles. The impulse canʼt travel backwards because once cells are depolarized, they are unable to accept another stimulus until they have repolarized, hence the cells are in refractory state. A lower site will control the heartbeat only after a higher site fails to produce an impulse. Hence the fastest pacemaker in the heart will always control the rate. Sinoatrial Node The Sinoatrial node (SA) node lies close to the epicardial surface of the heart. It is located just above the tricuspid valve at the anterior entrance of the superior vena cava into the right atrium.
Rhythm Strips Interpretation: A Step by Step Approach 6
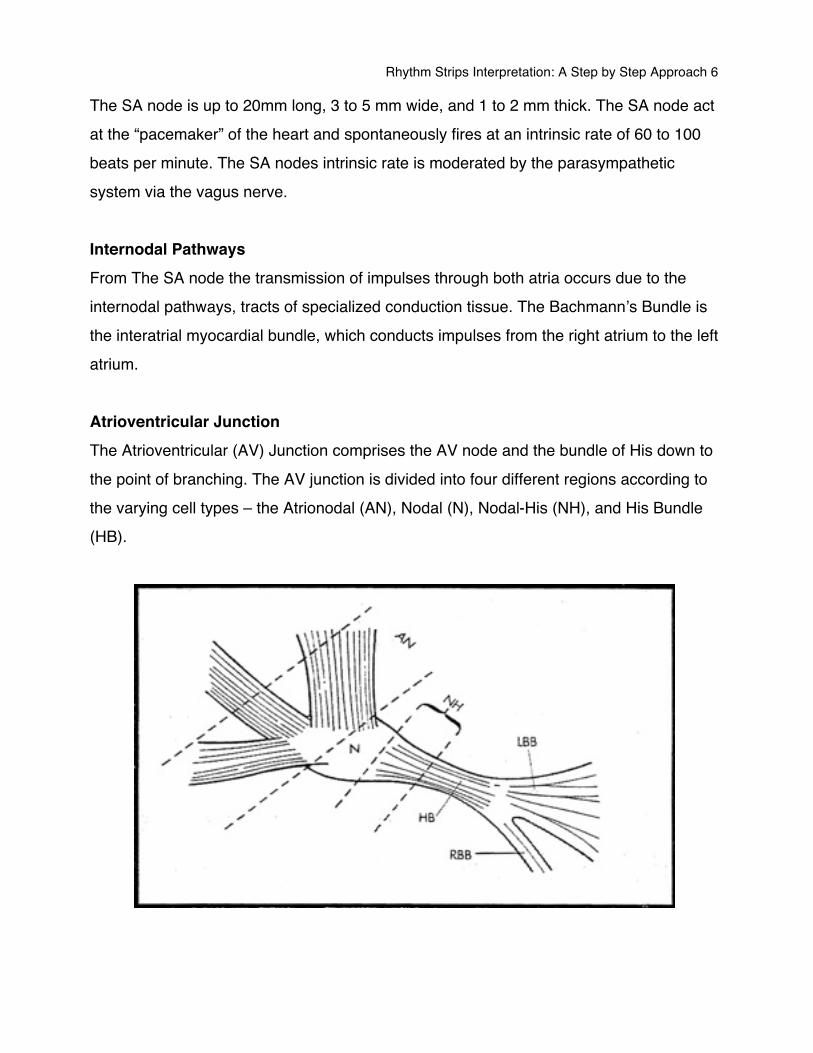
The SA node is up to 20mm long, 3 to 5 mm wide, and 1 to 2 mm thick. The SA node act at the “pacemaker” of the heart and spontaneously fires at an intrinsic rate of 60 to 100 beats per minute. The SA nodes intrinsic rate is moderated by the parasympathetic system via the vagus nerve. Internodal Pathways From The SA node the transmission of impulses through both atria occurs due to the internodal pathways, tracts of specialized conduction tissue. The Bachmannʼs Bundle is the interatrial myocardial bundle, which conducts impulses from the right atrium to the left atrium. Atrioventricular Junction The Atrioventricular (AV) Junction comprises the AV node and the bundle of His down to the point of branching. The AV junction is divided into four different regions according to the varying cell types – the Atrionodal (AN), Nodal (N), Nodal-His (NH), and His Bundle (HB).
Rhythm Strips Interpretation: A Step by Step Approach 7
Atrionodal The Atrionodal region is where the atrial fibers gradually merge with the Atrioventricular node. Nodal The nodal region, or AV node, lies subendocardially in the right atrial wall between the coronary sinus and the tricuspid valveʼs septal cusp. The node is up to 8 mm long, 2 to 4 mm wide, and 1 mm thick. It consists of a network of specialized cardiac muscle fibers, which are noted for the virtual absence of intrinsic junctional beats. This region is responsible for slowing the impulse transmission to allow the completion of atrial systole prior to ventricular depolarization and systole. This is achieved by an increased electrical resistance between cell junctions. AV nodal fibers consist of the slow posterior pathway and the fast anterior pathway. These pathways are responsible for the mechanism of AV nodal reentry, a common cause of paroxysmal supraventricular tachycardia. Nodal His The NH region consist of the lower AV nodal fibers merging with those of the His bundle. This region is believed to be primarily responsible for the initiation of junctional escape rhythm. The intrinsic rate of this region is 40 to 60 beats per minute. Bundle of His The Bundle of His passes from the lower atrial wall anteriorly and laterally through the fibrous skeleton. Thus the His bundle is the only muscular bridge between the atria and ventricles.
Rhythm Strips Interpretation: A Step by Step Approach 8
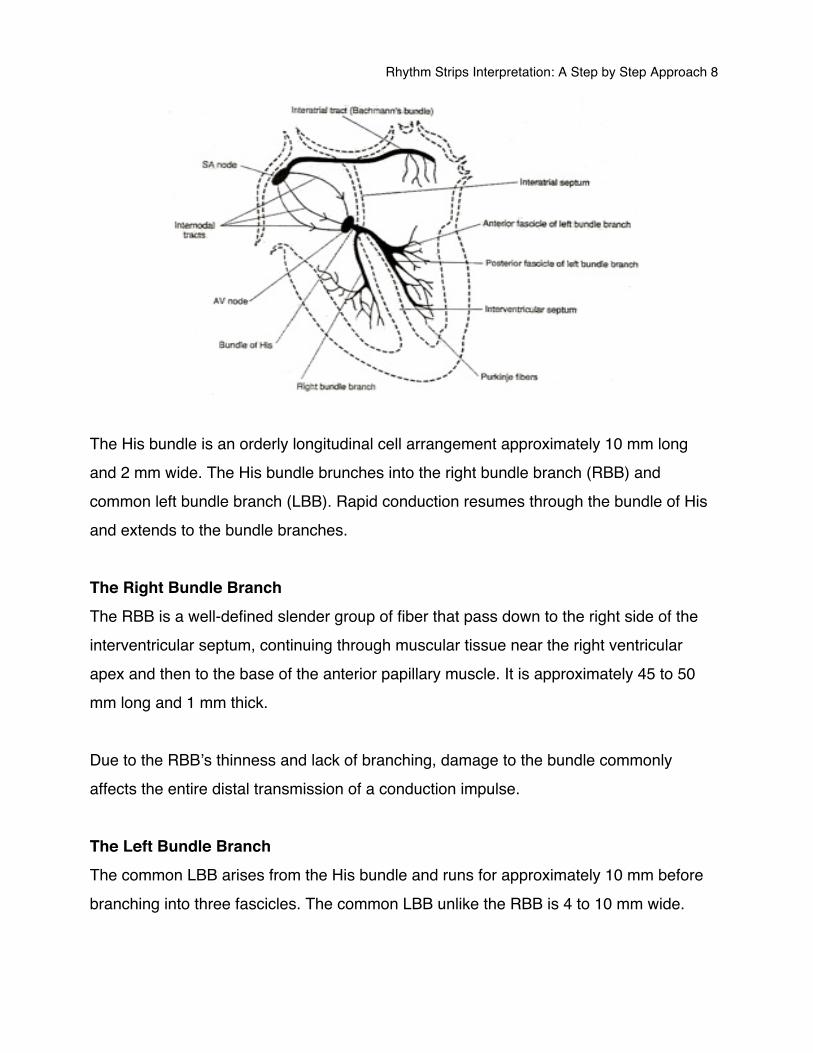
The His bundle is an orderly longitudinal cell arrangement approximately 10 mm long and 2 mm wide. The His bundle brunches into the right bundle branch (RBB) and common left bundle branch (LBB). Rapid conduction resumes through the bundle of His and extends to the bundle branches. The Right Bundle Branch The RBB is a well-defined slender group of fiber that pass down to the right side of the interventricular septum, continuing through muscular tissue near the right ventricular apex and then to the base of the anterior papillary muscle. It is approximately 45 to 50 mm long and 1 mm thick. Due to the RBBʼs thinness and lack of branching, damage to the bundle commonly affects the entire distal transmission of a conduction impulse. The Left Bundle Branch The common LBB arises from the His bundle and runs for approximately 10 mm before branching into three fascicles. The common LBB unlike the RBB is 4 to 10 mm wide.
Rhythm Strips Interpretation: A Step by Step Approach 9
The left anterior-superior fascicle, the posterior-inferior fascicle, and the septal fascicle are responsible for the transmission of conduction impulses through the left ventricle. The left anterior-superior fascicle is approximately 25 mm long and 3 mm wide. The left posterior-inferior is approximately 20 mm long and 6 mm wide. This fascicle seems the least vulnerable of the ventricular conducting system due to its diffuseness and dual blood supply. Conduction velocity in the left bundle branch exceeds that of the right. This gives the larger muscle of the left ventricle the extra time needed to contract simultaneously with the right ventricle. Purkinje Fibers The bundle branches terminate in a diffuse network of conducting fibers, which course toward the ventricular apex and spread up toward the fibrous skeleton. The Purkinje fibers spread from the inner subendocardial surface outward to the myocardium. The intrinsic rate of the Purkinje fiber range from 15 to 40 beats per minute. Accessory Pathways Accessory pathways are part of the intrinsic conduction system in some people These pathways permit impulse conduction between the atria and the ventricles, in addition to normal AV conduction or in place of it. Bundle of Kent is a muscle connection located in the atrioventricular groove that can conduct impulses from the atria to either ventricle. The bundle of Kent is responsible for the pre-excitation syndrome Wolff-Parkinson White (WPW). Mahaim Fibers are abnormal pathways that connect the AV node to the ventricles, or the bundle of His to the ventricles. Conduction down to the fibers and returning up the AV junction can result in a re-entry loop and paroxysmal supraventricular tachycardia (PSVT).
Rhythm Strips Interpretation: A Step by Step Approach 10
Bundle of James is a pathway that connects the atria to the distal part of the AV junction of bundle of His. This results in Lown-Ganong-Levine syndrome.
Depolarization and Repolarization Polarity
• The distinction between positive and negative electrical charge. Depolarize
• The change in the direction of polarity. • This refers to the change in electrical charge of the cell from a negative to more
positive electrical charge. Repolarize
• Is a process by which a cell is restored to its resting electrical state, or polarity.
Rhythm Strips Interpretation: A Step by Step Approach 11
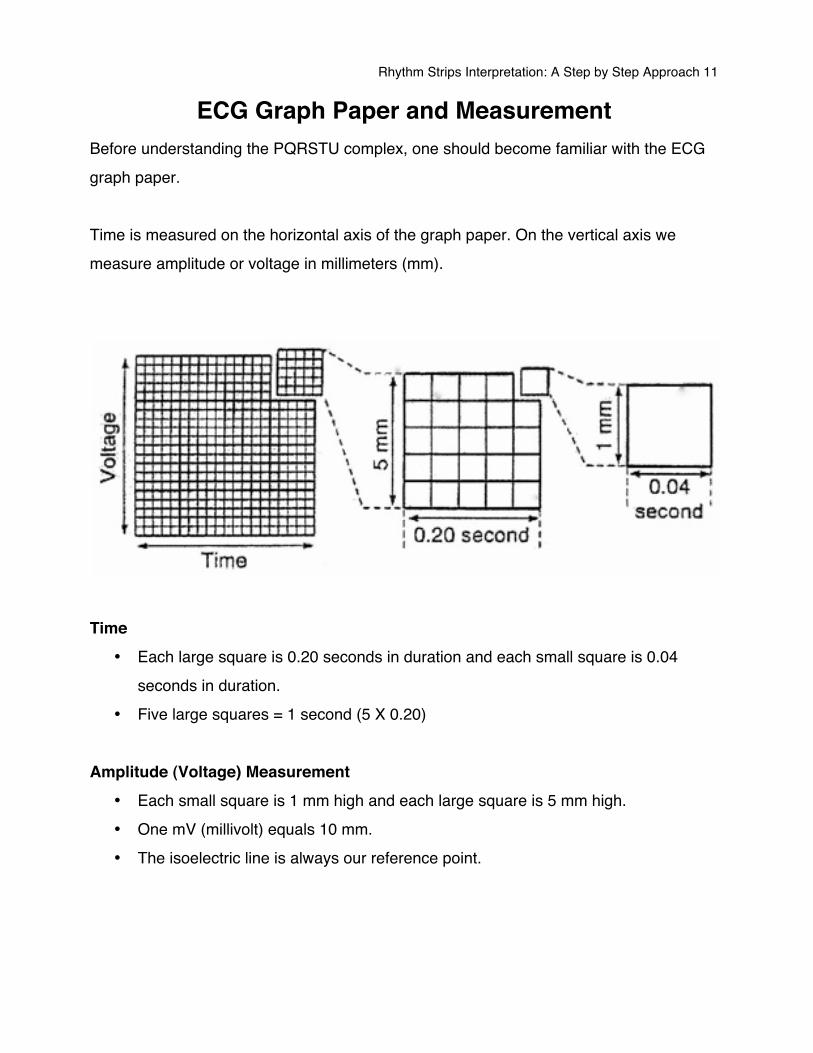
ECG Graph Paper and Measurement Before understanding the PQRSTU complex, one should become familiar with the ECG graph paper. Time is measured on the horizontal axis of the graph paper. On the vertical axis we measure amplitude or voltage in millimeters (mm).
Time
• Each large square is 0.20 seconds in duration and each small square is 0.04 seconds in duration.
• Five large squares = 1 second (5 X 0.20) Amplitude (Voltage) Measurement
• Each small square is 1 mm high and each large square is 5 mm high. • One mV (millivolt) equals 10 mm. • The isoelectric line is always our reference point.
Rhythm Strips Interpretation: A Step by Step Approach 12
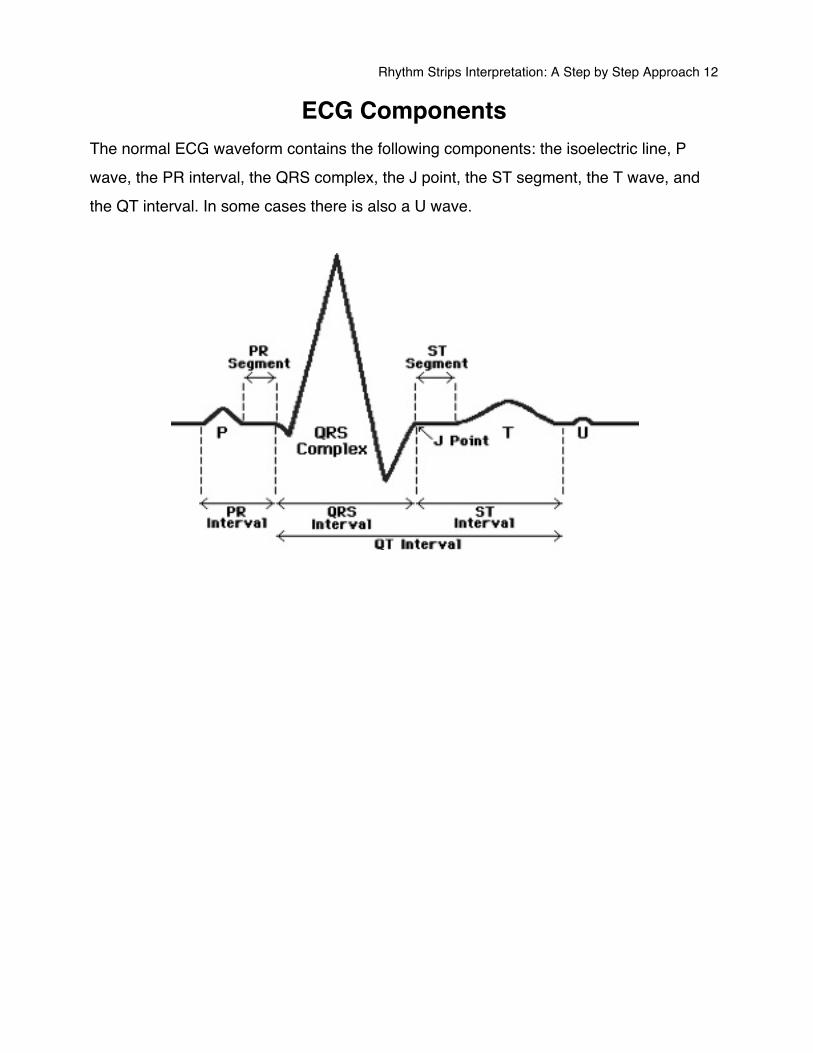
ECG Components The normal ECG waveform contains the following components: the isoelectric line, P wave, the PR interval, the QRS complex, the J point, the ST segment, the T wave, and the QT interval. In some cases there is also a U wave.
Rhythm Strips Interpretation: A Step by Step Approach 13
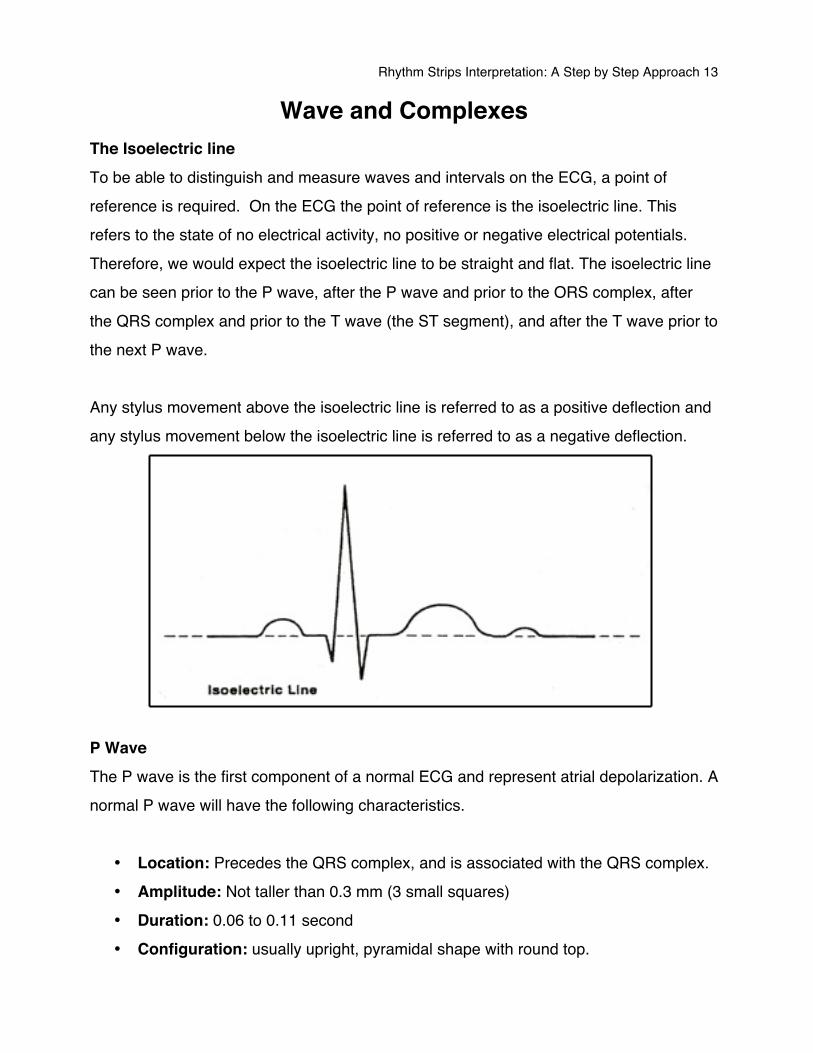
Wave and Complexes The Isoelectric line To be able to distinguish and measure waves and intervals on the ECG, a point of reference is required. On the ECG the point of reference is the isoelectric line. This refers to the state of no electrical activity, no positive or negative electrical potentials. Therefore, we would expect the isoelectric line to be straight and flat. The isoelectric line can be seen prior to the P wave, after the P wave and prior to the ORS complex, after the QRS complex and prior to the T wave (the ST segment), and after the T wave prior to the next P wave. Any stylus movement above the isoelectric line is referred to as a positive deflection and any stylus movement below the isoelectric line is referred to as a negative deflection.
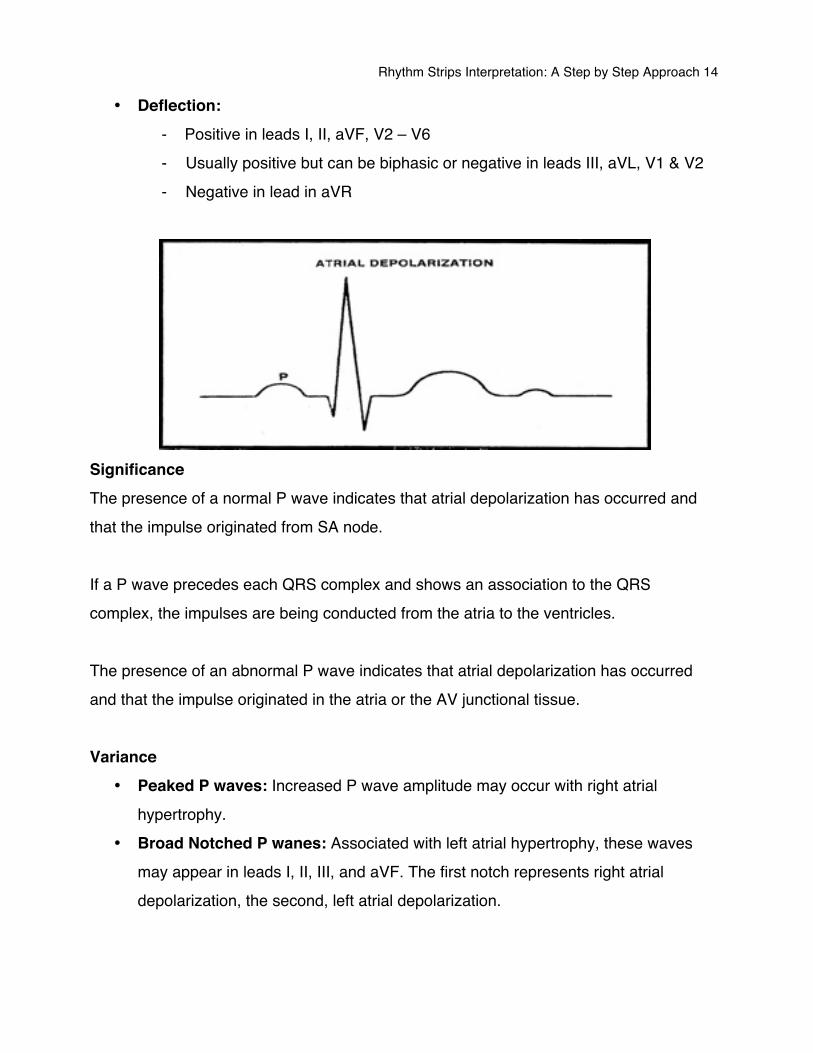
P Wave The P wave is the first component of a normal ECG and represent atrial depolarization. A normal P wave will have the following characteristics.
• Location: Precedes the QRS complex, and is associated with the QRS complex. • Amplitude: Not taller than 0.3 mm (3 small squares) • Duration: 0.06 to 0.11 second • Configuration: usually upright, pyramidal shape with round top.
Rhythm Strips Interpretation: A Step by Step Approach 14
• Deflection: - Positive in leads I, II, aVF, V2 – V6 - Usually positive but can be biphasic or negative in leads III, aVL, V1 & V2 - Negative in lead in aVR
Significance The presence of a normal P wave indicates that atrial depolarization has occurred and that the impulse originated from SA node. If a P wave precedes each QRS complex and shows an association to the QRS complex, the impulses are being conducted from the atria to the ventricles. The presence of an abnormal P wave indicates that atrial depolarization has occurred and that the impulse originated in the atria or the AV junctional tissue. Variance
• Peaked P waves: Increased P wave amplitude may occur with right atrial hypertrophy.
• Broad Notched P wanes: Associated with left atrial hypertrophy, these waves may appear in leads I, II, III, and aVF. The first notch represents right atrial depolarization, the second, left atrial depolarization.
Rhythm Strips Interpretation: A Step by Step Approach 15
• Inverted P waves: Inversion in leads other than aVR may indicate that the SA node is not the pacemaker and that retrograde conduction is occurring through the atria.
• Varying P waves: If the shapes and sizes of P waves vary, the impulses may be originating from various sites, as with wandering pacemaker rhythm.
• A Missing P wave: No visible P waves usually indicate a junctional rhythm. • Non-associated P wave: If the P wave shows no association to the QRS
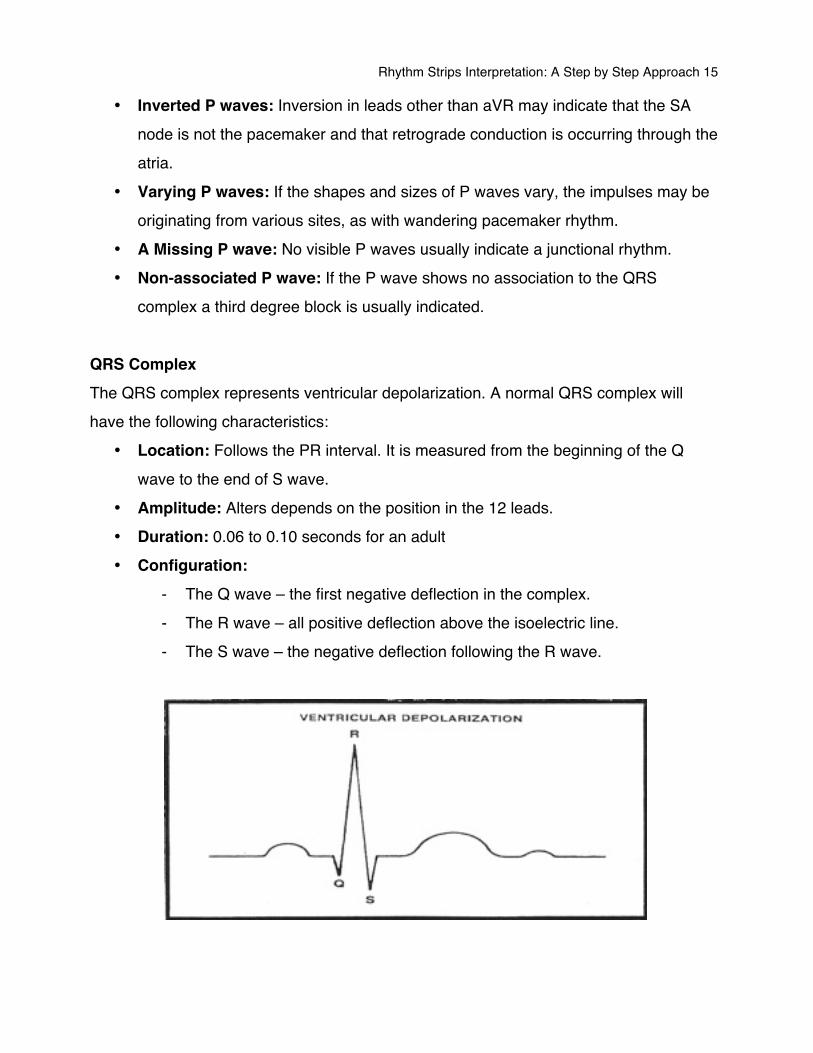
complex a third degree block is usually indicated. QRS Complex The QRS complex represents ventricular depolarization. A normal QRS complex will have the following characteristics:
• Location: Follows the PR interval. It is measured from the beginning of the Q wave to the end of S wave.
• Amplitude: Alters depends on the position in the 12 leads. • Duration: 0.06 to 0.10 seconds for an adult • Configuration:
- The Q wave – the first negative deflection in the complex. - The R wave – all positive deflection above the isoelectric line. - The S wave – the negative deflection following the R wave.
Rhythm Strips Interpretation: A Step by Step Approach 16
You may not always see all three QRS complex waves, yet the term QRS is used to refer to the ventricular complex in rhythm strips analysis. The ventricular depolarization wave (QRS) is larger than the P wave because the ventricles are larger than the atria, so they require a larger electrical impulse to depolarize the ventricular mass. Although the atrial repolarization also usually occurs at this time, it is indistinguishable on the ECG, as the larger electrical impulse depolarizing the ventricles overrides the atrial repolarization wave. Depending on the lead, the QRS complex may be positive, biphasic, or negative. Significance The duration of the ORS complex represents intraventricular conduction time. If the QRS complex duration is between 0.06 and 0.10 seconds then the impulse was initiated above the ventricles, either in the SA node, Atrial tissue, or AV junctional tissue. Variance
• If the QRS complex duration is longer than 0.10 seconds and a P wave is not apparent, then the impulses probably originated in the ventricles indicating a ventricular arrhythmia.
• If the QRS is longer than 0.10 seconds, and a P wave is apparent and associated to the QRS complex, the impulse is most likely of supraventricular origin and delayed in the ventricle due to a conduction defect, such as bundle branch block.
• An Interventricular Conduction Defect (IVCD) will alter the QRS complex configuration. With a bundle branch block, for example, you may see an extra notch in the R wave or S wave.
• If the sizes and shapes of the QRS complexes vary, an ectopic or aberrantly conducted impulse may have occurred.
• If a QRS complex doesnʼt appear after each P wave, suspect a condition in which the impulse conduction to the ventricles is being interrupted such as AV block or ventricular stand still.
Rhythm Strips Interpretation: A Step by Step Approach 17
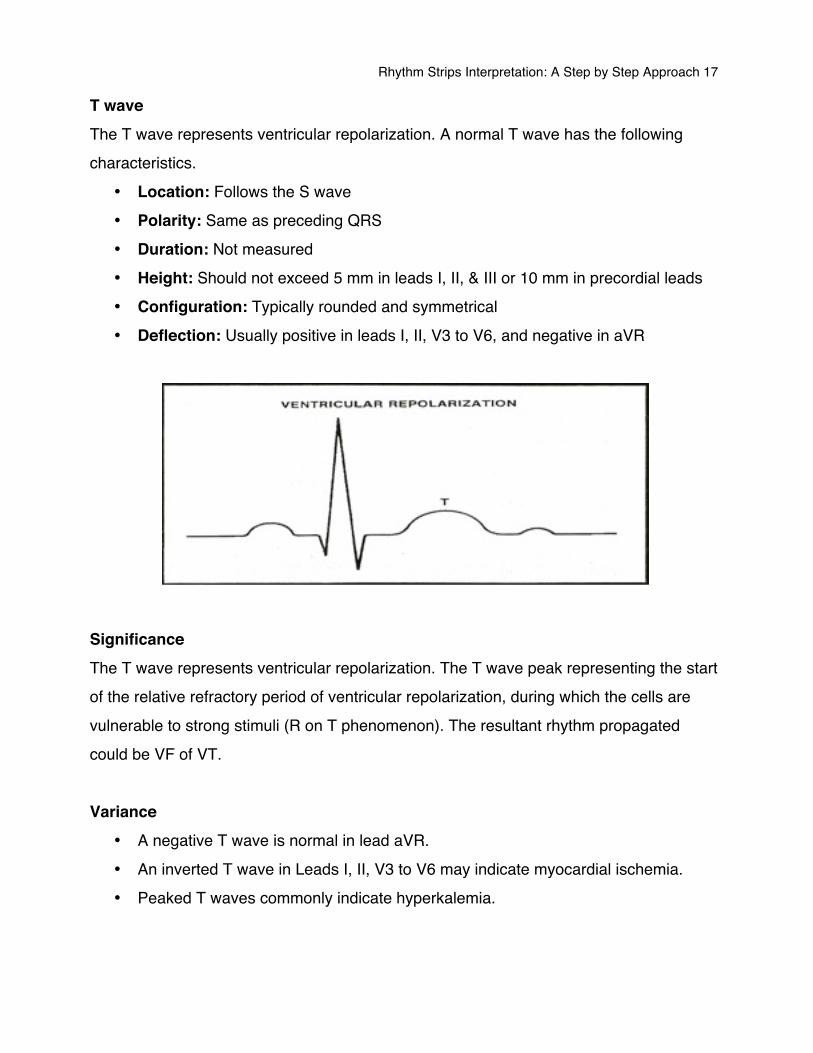
T wave The T wave represents ventricular repolarization. A normal T wave has the following characteristics.
• Location: Follows the S wave • Polarity: Same as preceding QRS • Duration: Not measured • Height: Should not exceed 5 mm in leads I, II, & III or 10 mm in precordial leads • Configuration: Typically rounded and symmetrical • Deflection: Usually positive in leads I, II, V3 to V6, and negative in aVR
Significance The T wave represents ventricular repolarization. The T wave peak representing the start of the relative refractory period of ventricular repolarization, during which the cells are vulnerable to strong stimuli (R on T phenomenon). The resultant rhythm propagated could be VF of VT. Variance
• A negative T wave is normal in lead aVR. • An inverted T wave in Leads I, II, V3 to V6 may indicate myocardial ischemia. • Peaked T waves commonly indicate hyperkalemia.
Rhythm Strips Interpretation: A Step by Step Approach 18
• Although heavily notched T waves are normal variation in children, the may indicate pericarditis in adults.
• Variation in T wave amplitude may indicate an electrolyte imbalance. • Disruption to the smooth contour of the T wave by bumps is most likely due to a P
wave interrupting the T wave. This is apparent in third degree heart block, some junctional rhythm, atrial fibrillation and flutter.
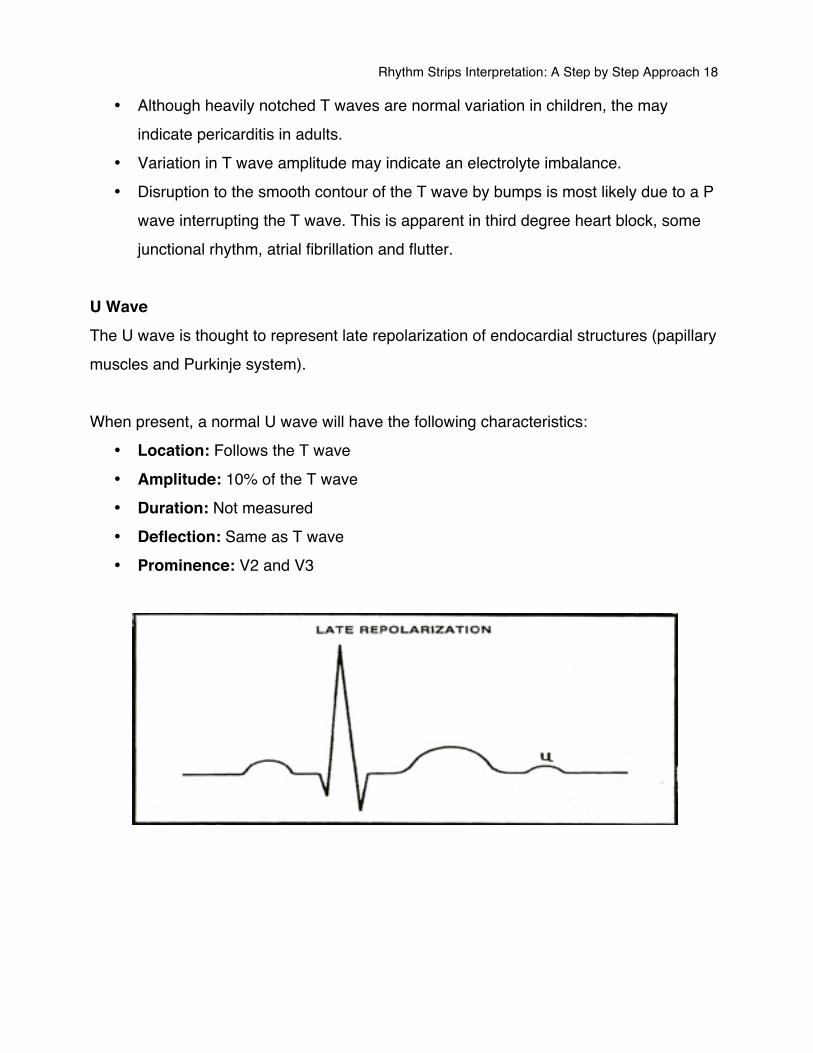
U Wave The U wave is thought to represent late repolarization of endocardial structures (papillary muscles and Purkinje system). When present, a normal U wave will have the following characteristics:
• Location: Follows the T wave • Amplitude: 10% of the T wave • Duration: Not measured • Deflection: Same as T wave • Prominence: V2 and V3
Rhythm Strips Interpretation: A Step by Step Approach 19
Significance The U wave may or may not appear on the ECG. U wave prominences effectively increases the QT interval (QU wave), a state of susceptibility to Torsades de Pointes (a specific polymorphic VT). In hypokalemia the U wave appears due to prolongation of the recovery phase of the action potential due to the low potassium level. Variance
• The U wave amplitude increases in hypokalemia. • U wave inversion can be associated with coronary artery disease, left ventricular
hypertrophy, and aortic and mitral valve regurgitation. • U wave inversion with exercise can be associated with myocardial ischemia.
Rhythm Strips Interpretation: A Step by Step Approach 20
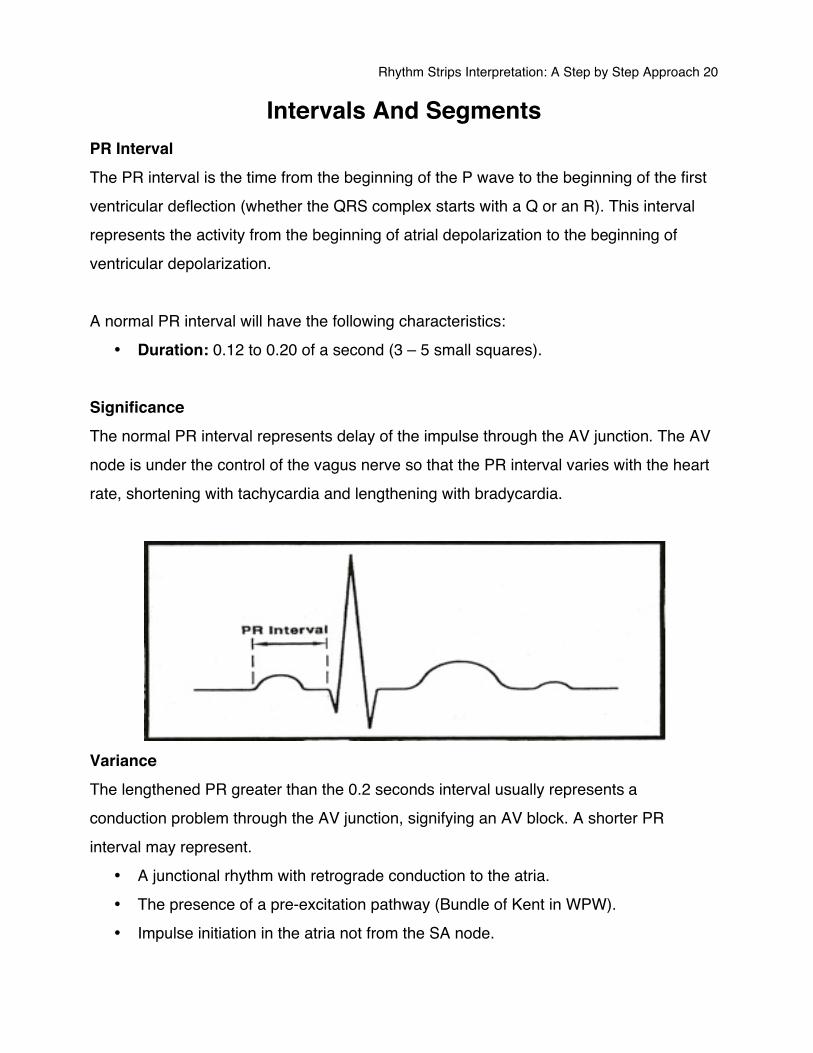
Intervals And Segments PR Interval The PR interval is the time from the beginning of the P wave to the beginning of the first ventricular deflection (whether the QRS complex starts with a Q or an R). This interval represents the activity from the beginning of atrial depolarization to the beginning of ventricular depolarization. A normal PR interval will have the following characteristics:
• Duration: 0.12 to 0.20 of a second (3 – 5 small squares). Significance The normal PR interval represents delay of the impulse through the AV junction. The AV node is under the control of the vagus nerve so that the PR interval varies with the heart rate, shortening with tachycardia and lengthening with bradycardia.
Variance The lengthened PR greater than the 0.2 seconds interval usually represents a conduction problem through the AV junction, signifying an AV block. A shorter PR interval may represent.
• A junctional rhythm with retrograde conduction to the atria. • The presence of a pre-excitation pathway (Bundle of Kent in WPW). • Impulse initiation in the atria not from the SA node.
Rhythm Strips Interpretation: A Step by Step Approach 21
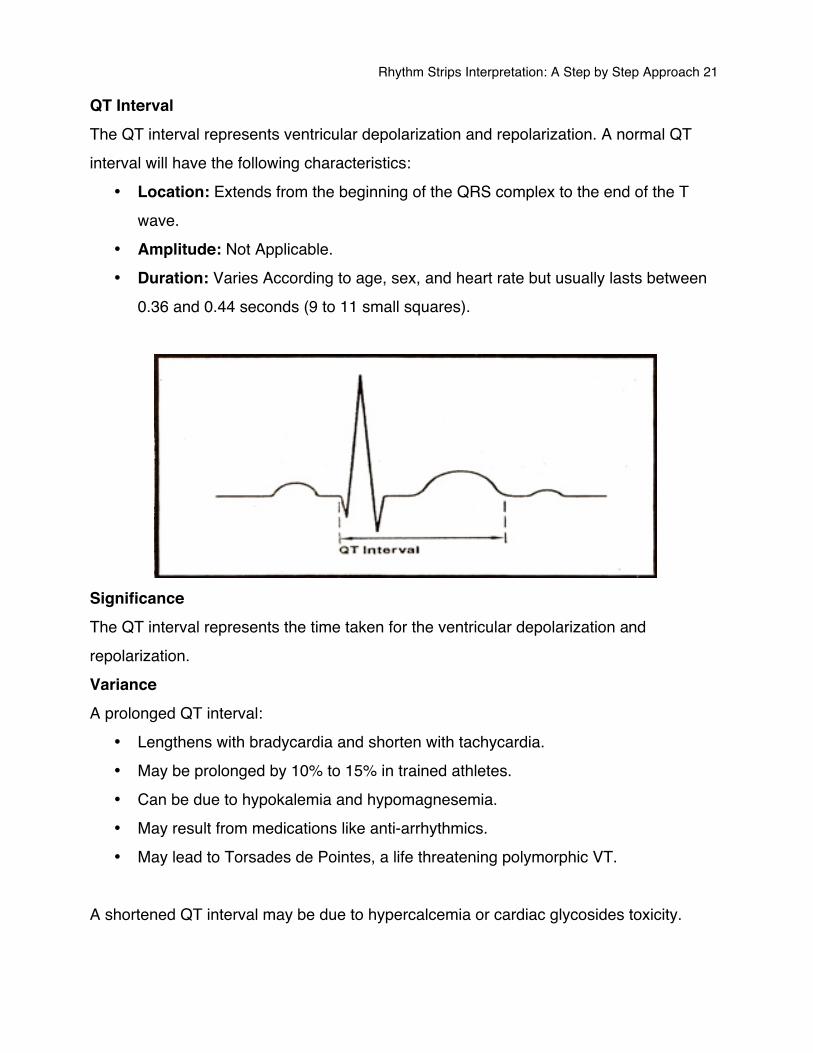
QT Interval The QT interval represents ventricular depolarization and repolarization. A normal QT interval will have the following characteristics:
• Location: Extends from the beginning of the QRS complex to the end of the T wave.
• Amplitude: Not Applicable. • Duration: Varies According to age, sex, and heart rate but usually lasts between
0.36 and 0.44 seconds (9 to 11 small squares).
Significance The QT interval represents the time taken for the ventricular depolarization and repolarization. Variance A prolonged QT interval:
• Lengthens with bradycardia and shorten with tachycardia. • May be prolonged by 10% to 15% in trained athletes. • Can be due to hypokalemia and hypomagnesemia. • May result from medications like anti-arrhythmics. • May lead to Torsades de Pointes, a life threatening polymorphic VT.
A shortened QT interval may be due to hypercalcemia or cardiac glycosides toxicity.
Rhythm Strips Interpretation: A Step by Step Approach 22
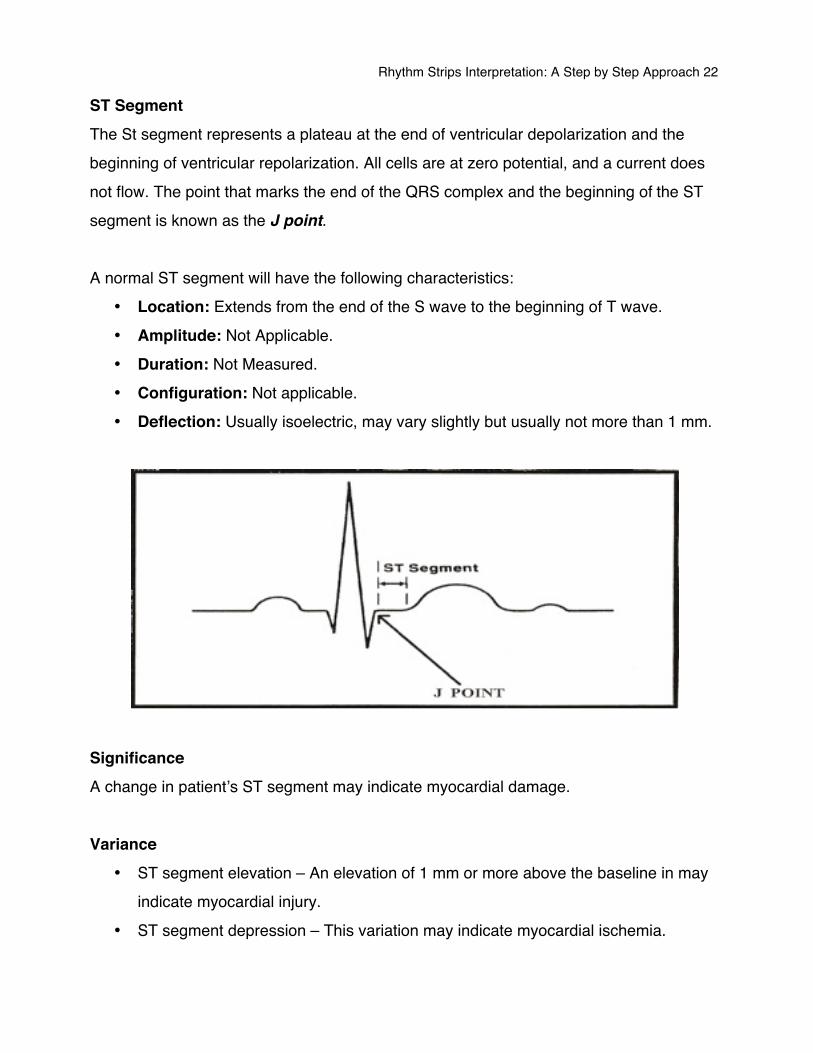
ST Segment The St segment represents a plateau at the end of ventricular depolarization and the beginning of ventricular repolarization. All cells are at zero potential, and a current does not flow. The point that marks the end of the QRS complex and the beginning of the ST segment is known as the J point. A normal ST segment will have the following characteristics:
• Location: Extends from the end of the S wave to the beginning of T wave. • Amplitude: Not Applicable. • Duration: Not Measured. • Configuration: Not applicable. • Deflection: Usually isoelectric, may vary slightly but usually not more than 1 mm.
Significance A change in patientʼs ST segment may indicate myocardial damage. Variance
• ST segment elevation – An elevation of 1 mm or more above the baseline in may indicate myocardial injury.
• ST segment depression – This variation may indicate myocardial ischemia.
Rhythm Strips Interpretation: A Step by Step Approach 23
• ST segment changes – With pericarditis, myocarditis, left ventricular hypertrophy, pulmonary embolism, and electrolyte disturbance, ST segment changes may occur. You may also see these changes if a patient is taking medications that alter depolarization and repolarization. i.e., anti-arrhythmic such as amiodarone.
Rhythm Strips Interpretation: A Step by Step Approach 24
Rhythm Determination Sinus Rhythm is responsible for the normal cardiac cycle, which begins with an impulse in the sinus node. This impulse is conducted through the atria to the AV node, where the conduction slows to allow for ventricular filling. From the AV node, the impulse travels through the AV junction, and conducted via the bundle branches through the Purkinje fibers and the myocardium. If the Sinus rhythm fails, or the conduction impulse is interrupted, the result is an Arrhythmia. The conduction pathway of an arrhythmia and hence itʼs point of origin can be determined and named from analyzing the complexes which make up a rhythm.
The 11 Step Method 1. Other 2. Evaluate the P wave 3. Determine the rhythm 4. Determine the rate 5. Calculate the rate of the duration of PR interval 6. Calculate the duration of QRS complex 7. Evaluate the T wave 8. Calculate the duration of the QT interval 9. Evaluate any other components 10. Interpretation 11. Treatment
Rhythm Strips Interpretation: A Step by Step Approach 25
The 11 Step Method to Rhythm Determination 1. Other
Identify anything you consider unusual or obvious about the rhythm, e.g., extra P waves, and Inverted T waves.
2. Evaluate the P wave • Are P waves Present? • Do the P waves have normal configuration? • Do P waves have similar size and shape? • Is the P wave consistently followed by QRS complex? • Is there a QRS after every P wave?
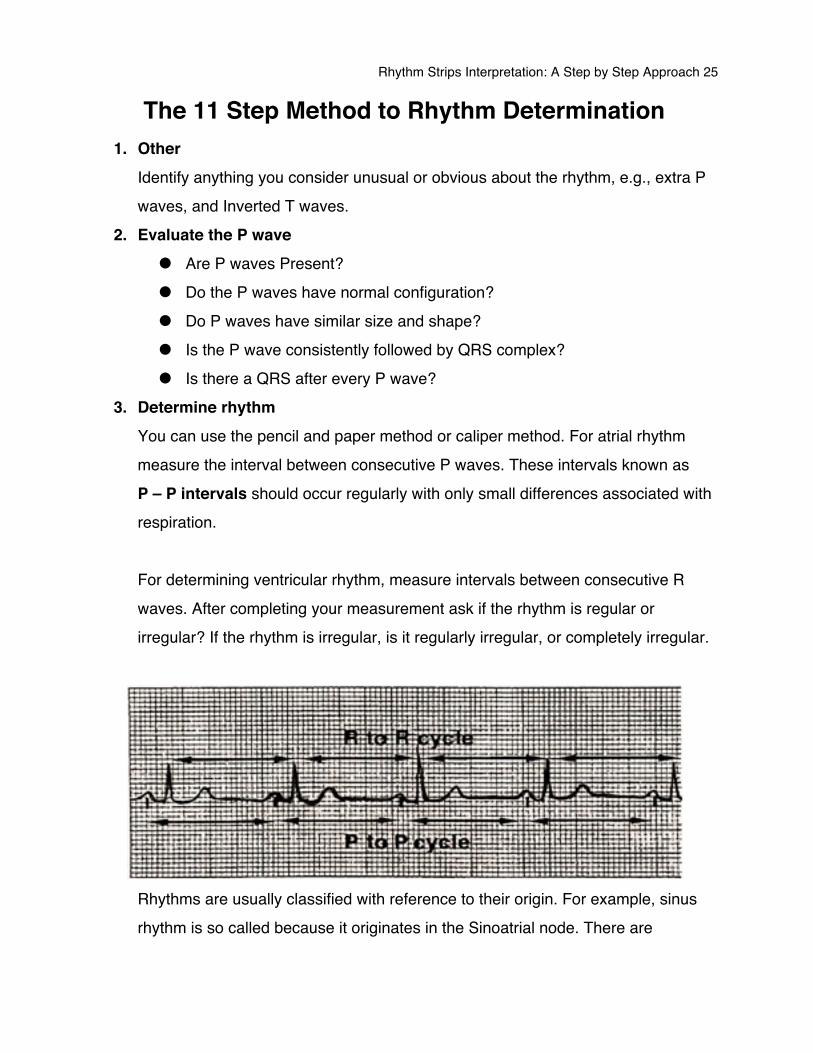
3. Determine rhythm You can use the pencil and paper method or caliper method. For atrial rhythm measure the interval between consecutive P waves. These intervals known as P – P intervals should occur regularly with only small differences associated with respiration. For determining ventricular rhythm, measure intervals between consecutive R waves. After completing your measurement ask if the rhythm is regular or irregular? If the rhythm is irregular, is it regularly irregular, or completely irregular.
Rhythms are usually classified with reference to their origin. For example, sinus rhythm is so called because it originates in the Sinoatrial node. There are
Rhythm Strips Interpretation: A Step by Step Approach 26
basically only 3 areas in the heart where rhythms originate, these being the atria, the AV junction, and the ventricles.
4. Determine the rate Heart rate is the number of heartbeats occurring in 1 minute. On an ECG, the heart rate is measured from R wave to R wave to determine the ventricular rate, and P wave to P wave to determine the atrial rate. Remember that QRS complex represents ventricular depolarization and P wave represents atrial depolarization. There are three method of calculating heart rate:
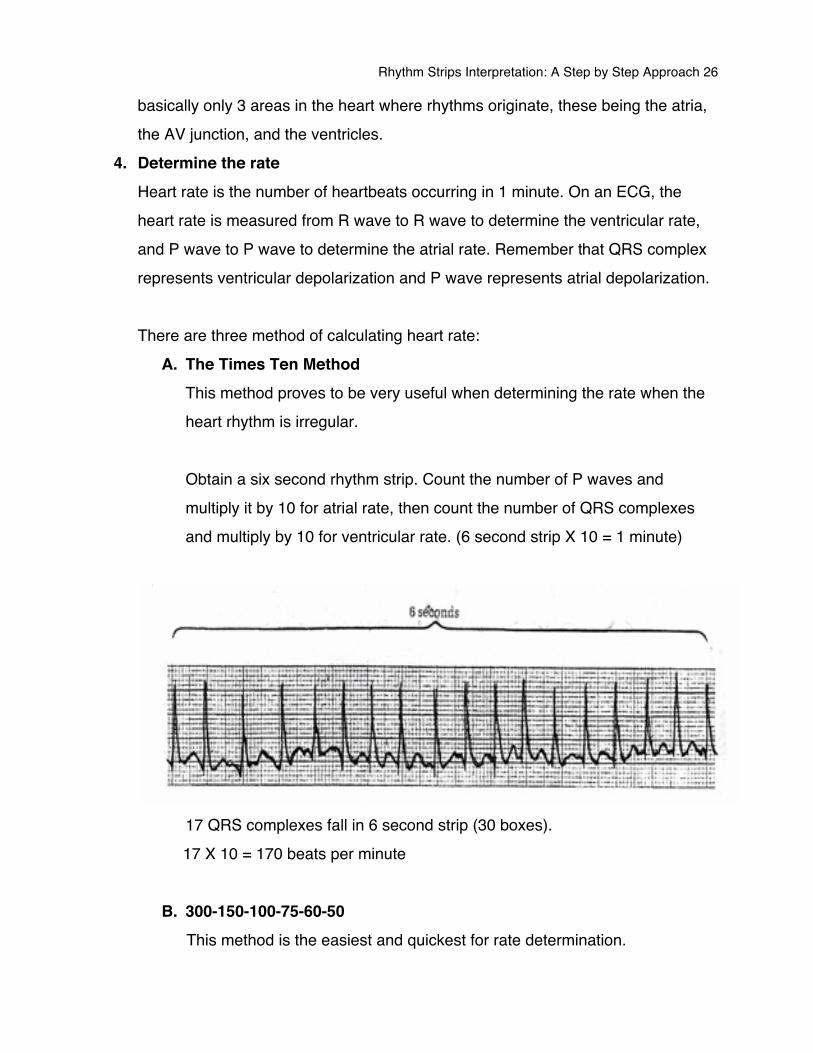
A. The Times Ten Method This method proves to be very useful when determining the rate when the heart rhythm is irregular. Obtain a six second rhythm strip. Count the number of P waves and multiply it by 10 for atrial rate, then count the number of QRS complexes and multiply by 10 for ventricular rate. (6 second strip X 10 = 1 minute)
17 QRS complexes fall in 6 second strip (30 boxes). 17 X 10 = 170 beats per minute
B. 300-150-100-75-60-50 This method is the easiest and quickest for rate determination.
Rhythm Strips Interpretation: A Step by Step Approach 27
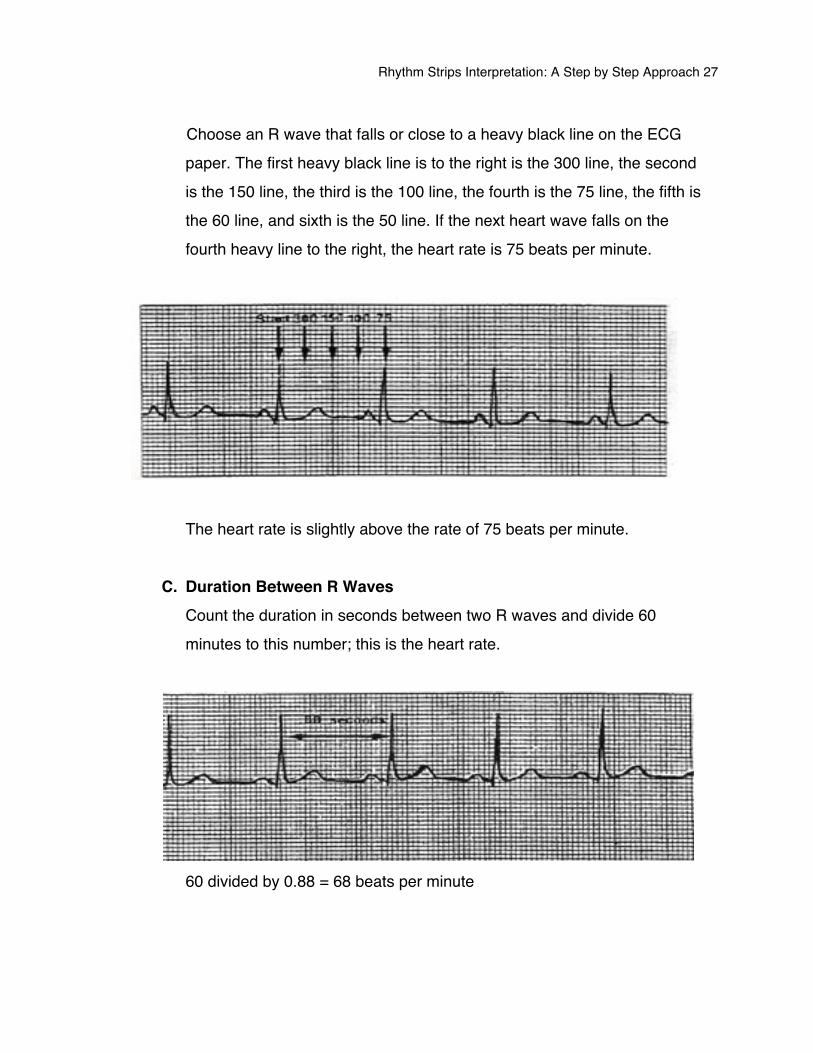
Choose an R wave that falls or close to a heavy black line on the ECG paper. The first heavy black line is to the right is the 300 line, the second is the 150 line, the third is the 100 line, the fourth is the 75 line, the fifth is the 60 line, and sixth is the 50 line. If the next heart wave falls on the fourth heavy line to the right, the heart rate is 75 beats per minute.
The heart rate is slightly above the rate of 75 beats per minute.
C. Duration Between R Waves Count the duration in seconds between two R waves and divide 60 minutes to this number; this is the heart rate.
60 divided by 0.88 = 68 beats per minute
Rhythm Strips Interpretation: A Step by Step Approach 28
5. Calculate the Duration of the PR Interval • Count the number of small squares between the start of the P wave and the
start of the QRS complex. • Then multiply the number of small squares by 0.04 seconds. • The normal PR interval is between 0.12 and 0.20 seconds (3–5 small squares)
6. Calculate the Duration of QRS Complex • Count the number of small squares from the beginning of the Q wave to the
end of the S wave. • Then multiply with 0.04 seconds. • The QRS complex is between 0.06 and 0.10 seconds (1.5–2.5 small squares).
7. Evaluate the T wave • Are the T waves present? • Do they have Normal shape (upright and rounded)? • Do the have normal amplitude.
8. Calculate the Duration of the QT interval • Count the number of small squares from the beginning of the Q wave to the
end of the T wave. • Then multiply the number of squares by 0.04 seconds. • The normal range is between 0.36 and 0.44 seconds (9–11 small squares)
depending on the heart rate. 9. Evaluate Other Components
• Observe for other components including ectopic or aberrantly conducted beats. • Check ST segment for any abnormalities. • Look for a U wave • Note any findings.
10. Interpret the Rhythm 11. Identify Treatments if needed
Rhythm Strips Interpretation: A Step by Step Approach 29
Atrial Rhythm • Sinus Rhythm • Premature Atrial Contractions • Atrial Tachycardia • Atrial Flutter • Atrial Fibrillation
Rhythm Strips Interpretation: A Step by Step Approach 30
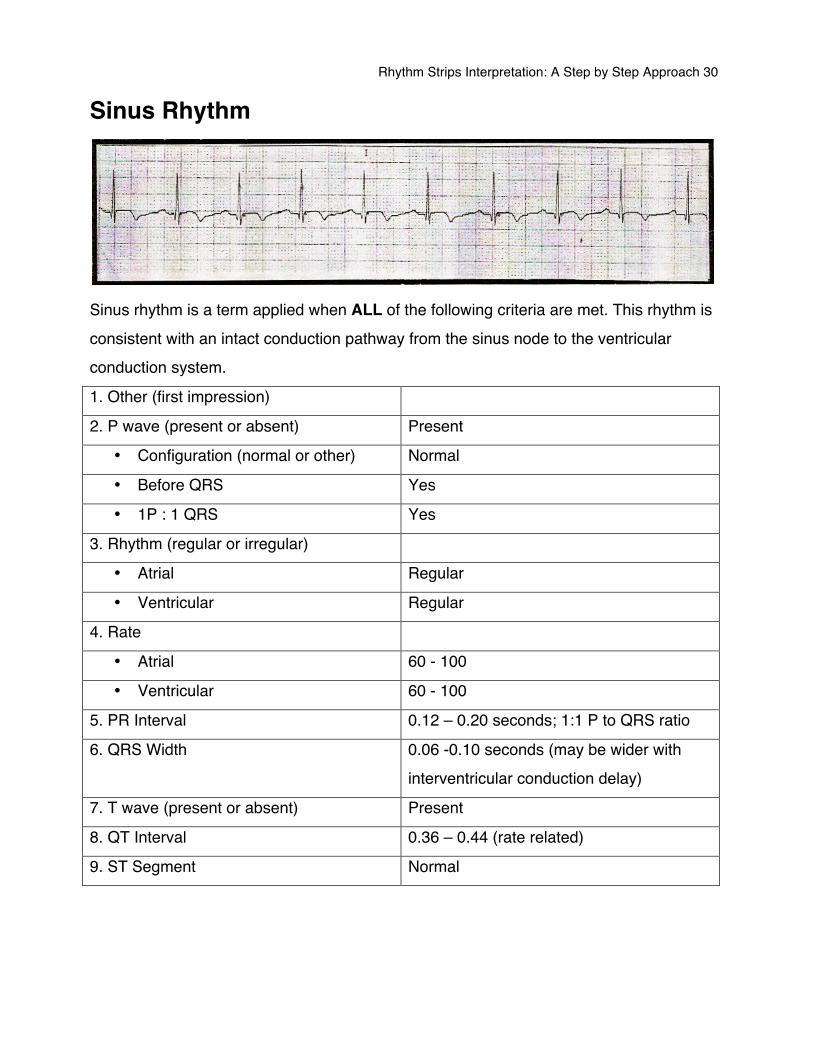
Sinus Rhythm
Sinus rhythm is a term applied when ALL of the following criteria are met. This rhythm is consistent with an intact conduction pathway from the sinus node to the ventricular conduction system.
1. Other (first impression)
2. P wave (present or absent) Present
• Configuration (normal or other) Normal
• Before QRS Yes
• 1P : 1 QRS Yes
3. Rhythm (regular or irregular)
• Atrial Regular
• Ventricular Regular
4. Rate
• Atrial 60 - 100
• Ventricular 60 - 100
5. PR Interval 0.12 – 0.20 seconds; 1:1 P to QRS ratio
6. QRS Width 0.06 -0.10 seconds (may be wider with interventricular conduction delay)
7. T wave (present or absent) Present
8. QT Interval 0.36 – 0.44 (rate related)
9. ST Segment Normal
Rhythm Strips Interpretation: A Step by Step Approach 31
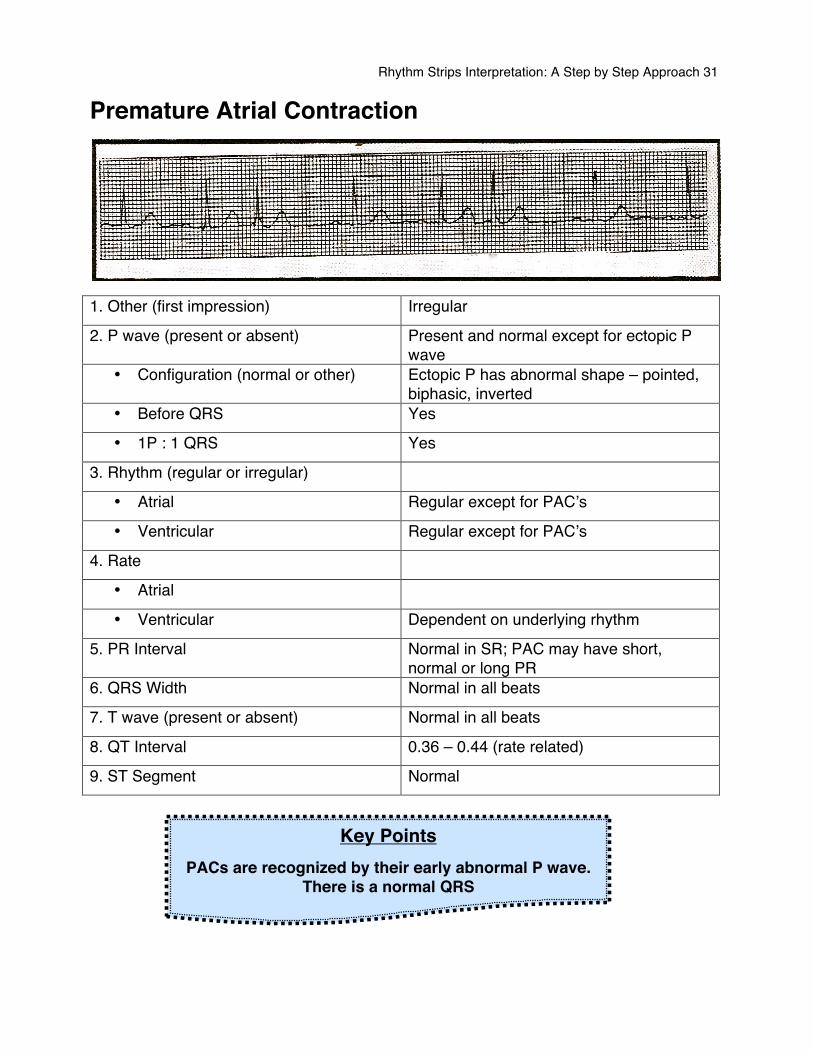
Premature Atrial Contraction
1. Other (first impression) Irregular
2. P wave (present or absent) Present and normal except for ectopic P wave
• Configuration (normal or other) Ectopic P has abnormal shape – pointed, biphasic, inverted
• Before QRS Yes
• 1P : 1 QRS Yes
3. Rhythm (regular or irregular)
• Atrial Regular except for PACʼs
• Ventricular Regular except for PACʼs
4. Rate
• Atrial
• Ventricular Dependent on underlying rhythm
5. PR Interval Normal in SR; PAC may have short, normal or long PR
6. QRS Width Normal in all beats
7. T wave (present or absent) Normal in all beats
8. QT Interval 0.36 – 0.44 (rate related)
9. ST Segment Normal
Key Points PACs are recognized by their early abnormal P wave.
There is a normal QRS
Rhythm Strips Interpretation: A Step by Step Approach 32
PACs are atrial ectopics that originate in areas of the atria other than the Sinoatrial node. PACs are recognized by their abnormal P wave. The impulses originating from this ectopic focus continue to conduct through the AV node and onto the ventricles (as does a normal SA node impulse) resulting to a normal QRS complex. Most Common Causes
• Ischemia • Electrolyte imbalances • Catecholamines • Pericarditis • Caffeine • Hypoxia • Nicotine
Possible Treatment There is no real effect on the cardiac output or hemodynamics of the patient so the treatment is focused on diagnostic and reversal of the cause.
Did You Know?
Ectopic beats appeared earlier than expected. Escape rhythm appear earlier than expected.
Ectopics can arise from any region of the heart, but are normally
Classified into atrial, AV junctional and ventricular ectopics.
Ectopic beats are also called extrasystole and premature beats.
Rhythm Strips Interpretation: A Step by Step Approach 33
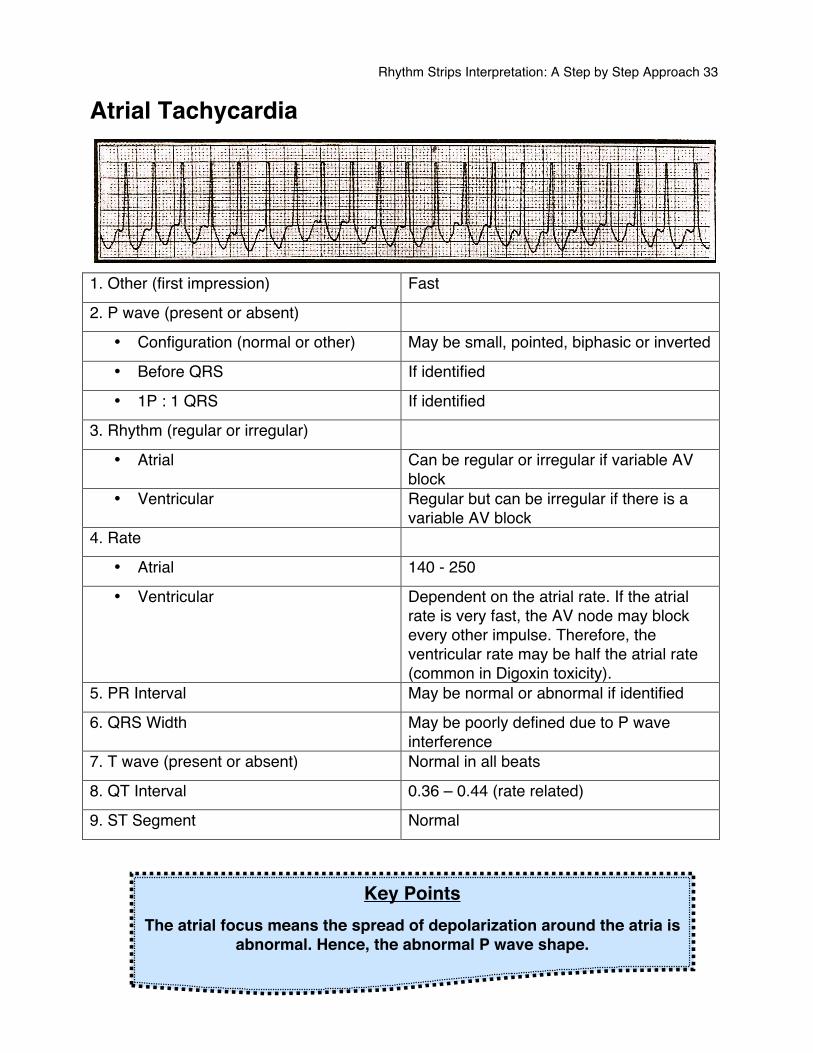
Atrial Tachycardia
1. Other (first impression) Fast
2. P wave (present or absent)
• Configuration (normal or other) May be small, pointed, biphasic or inverted
• Before QRS If identified
• 1P : 1 QRS If identified
3. Rhythm (regular or irregular)
• Atrial Can be regular or irregular if variable AV block
• Ventricular Regular but can be irregular if there is a variable AV block
4. Rate
• Atrial 140 - 250
• Ventricular Dependent on the atrial rate. If the atrial rate is very fast, the AV node may block every other impulse. Therefore, the ventricular rate may be half the atrial rate (common in Digoxin toxicity).
5. PR Interval May be normal or abnormal if identified
6. QRS Width May be poorly defined due to P wave interference
7. T wave (present or absent) Normal in all beats
8. QT Interval 0.36 – 0.44 (rate related)
9. ST Segment Normal
Key Points The atrial focus means the spread of depolarization around the atria is
abnormal. Hence, the abnormal P wave shape.
Rhythm Strips Interpretation: A Step by Step Approach 34
Atrial tachycardia occurs when an ectopic focus in the atria has a faster rate than the SA node, so take over the pacemaker role. Remember… the fastest pacemaker in the heart will control the rate. The resulting rhythm is a tachycardia with abnormal P wave configuration. Impulses start in the atrium, rather than the SA node. The atria contract with small, rapid regular motions that may not be effective in emptying the blood from the atria. Because of the shortened diastole, there is a short ventricular filling time so the amount of blood ejected with each beat is less (low stroke volume). Therefore, the cardiac output (CO) is reduced and congestive heart failure can occur if the rhythm continues. This condition can lead to atrial distension secondary to heart failure. Common Causes
• Digitalis toxicity • Excessive catecholamines • Ischemic heart disease • Rheumatic heart disease • Cardiomyopathy • Sick sinus syndrome
Possible treatments In the event of digitalis toxicity being the cause, cessation of the drug and cardiac monitoring are essential. Often the patient recovers spontaneously. Carotid sinus massage or valsalvaʼs maneuver sometimes terminate AT abruptly and can convert the heart rhythm to Sinus rhythm. Asymptomatic patient that are non-responsive to vagal stimulation may be treated with adenosine rapid IV push, and longer acting AV nodal blocking agent such as diltiazem & beta-blockers; while symptomatic patients require synchronized cardioversion.
Rhythm Strips Interpretation: A Step by Step Approach 35
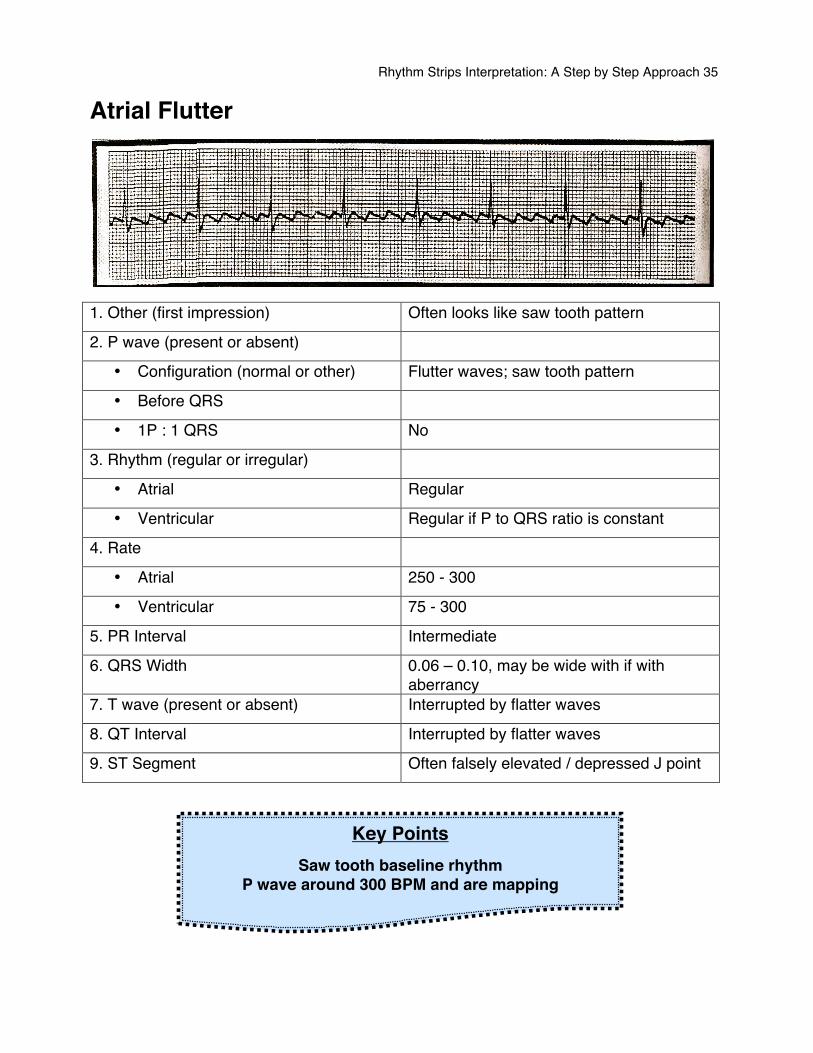
Atrial Flutter
1. Other (first impression) Often looks like saw tooth pattern
2. P wave (present or absent)
• Configuration (normal or other) Flutter waves; saw tooth pattern
• Before QRS
• 1P : 1 QRS No
3. Rhythm (regular or irregular)
• Atrial Regular
• Ventricular Regular if P to QRS ratio is constant
4. Rate
• Atrial 250 - 300
• Ventricular 75 - 300
5. PR Interval Intermediate
6. QRS Width 0.06 – 0.10, may be wide with if with aberrancy
7. T wave (present or absent) Interrupted by flatter waves
8. QT Interval Interrupted by flatter waves
9. ST Segment Often falsely elevated / depressed J point
Key Points Saw tooth baseline rhythm
P wave around 300 BPM and are mapping
Rhythm Strips Interpretation: A Step by Step Approach 36
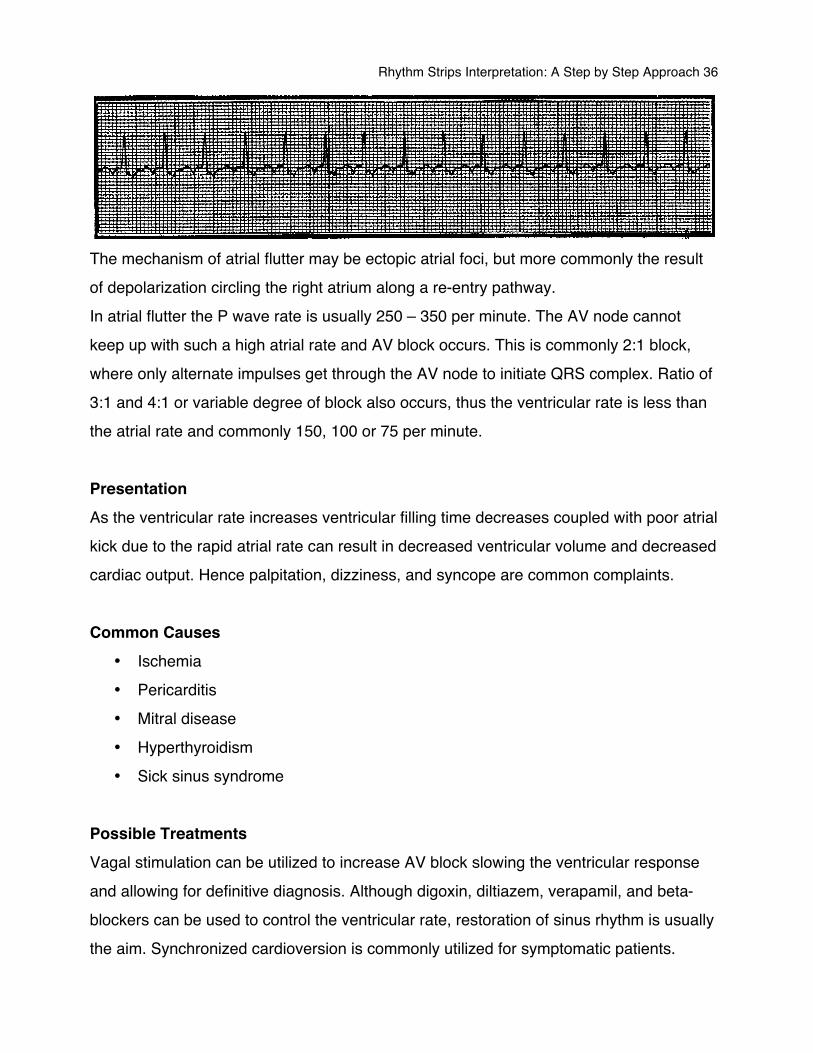
The mechanism of atrial flutter may be ectopic atrial foci, but more commonly the result of depolarization circling the right atrium along a re-entry pathway. In atrial flutter the P wave rate is usually 250 – 350 per minute. The AV node cannot keep up with such a high atrial rate and AV block occurs. This is commonly 2:1 block, where only alternate impulses get through the AV node to initiate QRS complex. Ratio of 3:1 and 4:1 or variable degree of block also occurs, thus the ventricular rate is less than the atrial rate and commonly 150, 100 or 75 per minute. Presentation As the ventricular rate increases ventricular filling time decreases coupled with poor atrial kick due to the rapid atrial rate can result in decreased ventricular volume and decreased cardiac output. Hence palpitation, dizziness, and syncope are common complaints. Common Causes
• Ischemia • Pericarditis • Mitral disease • Hyperthyroidism • Sick sinus syndrome
Possible Treatments Vagal stimulation can be utilized to increase AV block slowing the ventricular response and allowing for definitive diagnosis. Although digoxin, diltiazem, verapamil, and beta-blockers can be used to control the ventricular rate, restoration of sinus rhythm is usually the aim. Synchronized cardioversion is commonly utilized for symptomatic patients.
Rhythm Strips Interpretation: A Step by Step Approach 37
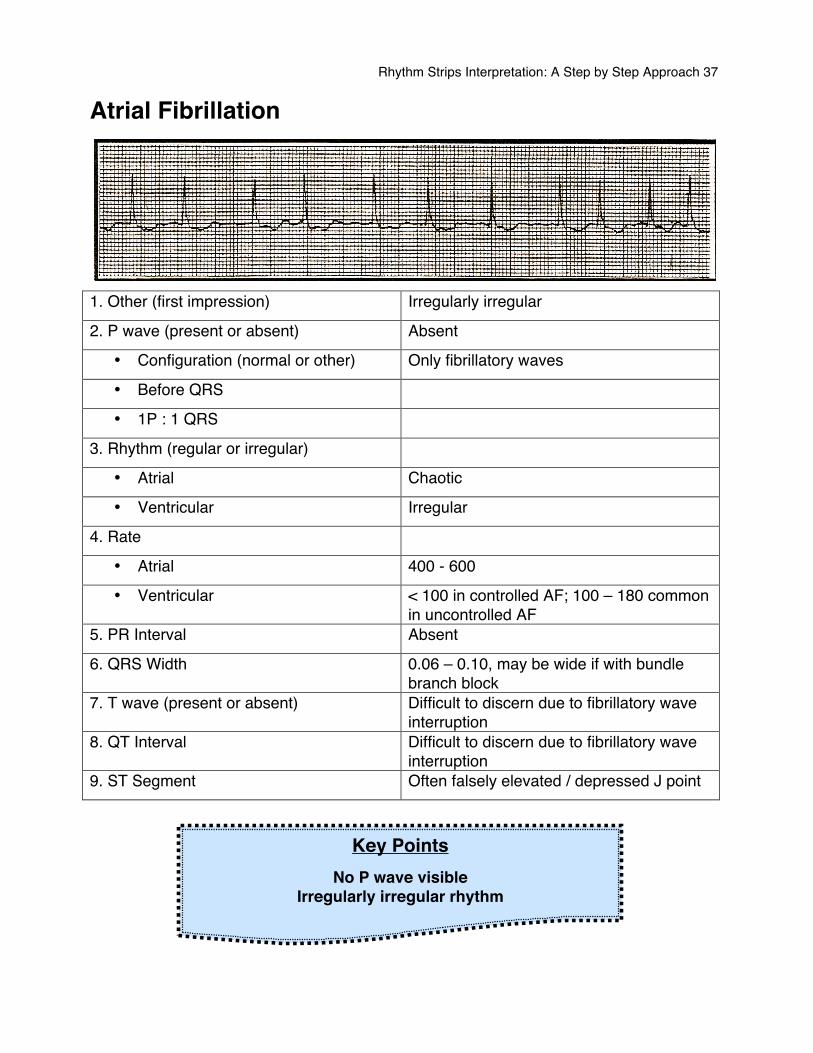
Atrial Fibrillation
1. Other (first impression) Irregularly irregular
2. P wave (present or absent) Absent
• Configuration (normal or other) Only fibrillatory waves
• Before QRS
• 1P : 1 QRS
3. Rhythm (regular or irregular)
• Atrial Chaotic
• Ventricular Irregular
4. Rate
• Atrial 400 - 600
• Ventricular < 100 in controlled AF; 100 – 180 common in uncontrolled AF
5. PR Interval Absent
6. QRS Width 0.06 – 0.10, may be wide if with bundle branch block
7. T wave (present or absent) Difficult to discern due to fibrillatory wave interruption
8. QT Interval Difficult to discern due to fibrillatory wave interruption
9. ST Segment Often falsely elevated / depressed J point
Key Points No P wave visible
Irregularly irregular rhythm
Rhythm Strips Interpretation: A Step by Step Approach 38
The basis of atrial fibrillation is rapid chaotic atrial depolarization. No P waves are seen and the ECG baseline consists of low-amplitude oscillations (fibrillation of “f” waves). Although around 400 – 600 impulses reach the AV node every minute transmission of this impulses through the AV node is erratic, making the ventricular (QRS complex) rhythm “irregularly irregular”. Presentation The erratic atrial depolarization leads to a failure of effective atrial contraction. Loss of the “atrial kick” reduces ventricular filling and can lead to a fall of 10 – 25 % in cardiac output. Hence patients with atrial fibrillation will usually present with palpitations and/or syncope. Common Causes
• Atrial enlargement • Pericarditis (remember that SA node id epicardial) • Ischemia
Possible Treatment Systemic embolism is a significant risk in atrial fibrillation and may also be presenting feature. Hence anti-coagulation is recommended within 24 hours of new AF. Digoxin, Diltiazem, Beta-blockers are commonly prescribed to control the otherwise rapid rate. These drugs can slow the rate enough for the sinus node to take back control. Synchronized cardioversion is an option to restore SA nodal control in symptomatic or unstable patients in atrial fibrillation.
Rhythm Strips Interpretation: A Step by Step Approach 39
Junctional Rhythm
• Premature Junctional Contractions • Junctional Rhythm
Rhythm Strips Interpretation: A Step by Step Approach 40
Junctional Arrhythmia Junctional arrhythmias originate in the atrioventricular junction. Most commonly occurs when a higher pacemaker is suppressed or when impulses are blocked at the AV node. Hence, junctional arrhythmias are referred to as escape rhythms, a safety net to protect the heart from ventricular standstill. Type
• Premature Junctional contractions • Junctional Bradycardia <40 bpm • Junctional Rhythm 40 – 60 bpm • Accelerated Junctional Rhythm 60 – 100 bpm • Junctional Tachycardia >100 bpm
Significance Junctional Arrhythmias may reduce cardiac output because of the loss of coordinated atrial contraction and hence atrial kick (a loss of up to 20% in ventricular blood volume). Whether or not a junctional rhythm is significant depends on the patients ability to tolerate a decreased hear rate and diminished cardiac output. Common Causes Causes can include conditions that produce long pauses in cardiac cycle. Such conditions include SA node ischemia, digitalis toxicity, sick sinus syndrome and increased vagal tone. Possible treatment In most scenarios the heart rate and cardiac output stay in acceptable ranges and treatment isnʼt required immediately. When indicated, treatment may include atropine to increase the sinus and junctional rate, or pacemaker insertion to enhance the atrial rate and control the ventricular rate. Because junctional beats prevent ventricular standstill they should never be suppressed. REMEMBER
The transcutaneous pacemaker is an available bridge to
transvenous pacing
Rhythm Strips Interpretation: A Step by Step Approach 41
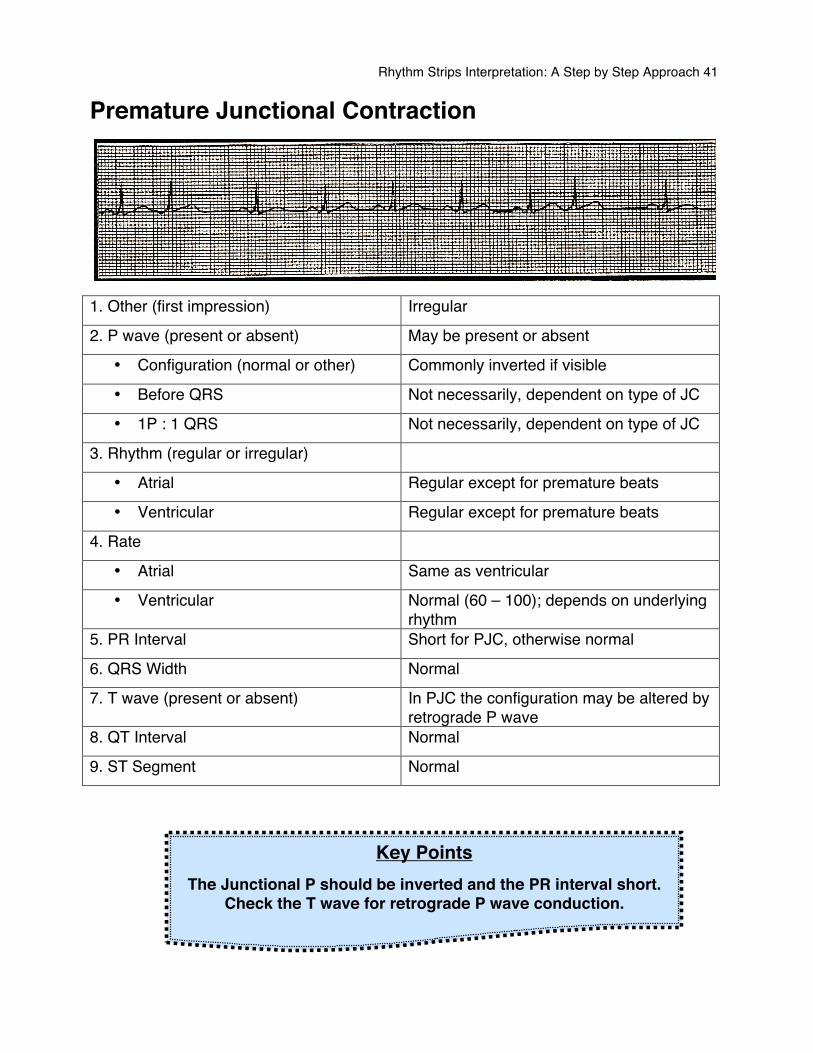
Premature Junctional Contraction
1. Other (first impression) Irregular
2. P wave (present or absent) May be present or absent
• Configuration (normal or other) Commonly inverted if visible
• Before QRS Not necessarily, dependent on type of JC
• 1P : 1 QRS Not necessarily, dependent on type of JC
3. Rhythm (regular or irregular)
• Atrial Regular except for premature beats
• Ventricular Regular except for premature beats
4. Rate
• Atrial Same as ventricular
• Ventricular Normal (60 – 100); depends on underlying rhythm
5. PR Interval Short for PJC, otherwise normal
6. QRS Width Normal
7. T wave (present or absent) In PJC the configuration may be altered by retrograde P wave
8. QT Interval Normal
9. ST Segment Normal
Key Points The Junctional P should be inverted and the PR interval short.
Check the T wave for retrograde P wave conduction.
Rhythm Strips Interpretation: A Step by Step Approach 42
Premature junctional beats occur before the next normal sinus beat, visualized as a QRS complex with the sane configuration as those around it but an abnormal or absent P wave. It is necessary to distinguish between an abnormal P from a PAC origin. Presentation PJCs commonly result from enhanced automaticity in the junctional tissue or bundle of His. They are typically considered harmless unless they occur frequently as this may indicate junctional irritability and can precipitate a more dangerous arrhythmia such as junctional tachycardia. Usually the patient will be asymptomatic but may complain of palpitation. Common Causes
• Digitalis toxicity causes PJCs and so premature junctional contractions are a common early sign of digitalis toxicity.
• Myocardial infarction or ischemia • Excessive caffeine or amphetamine ingestion
Possible treatment In most cases the patient will not require treatment. However, if a patient has symptomatic premature junctional contractions, the underlying causes require treatment. If hemodynamic deterioration occurs, atropine or pacemaker maybe indicated.
Rhythm Strips Interpretation: A Step by Step Approach 43
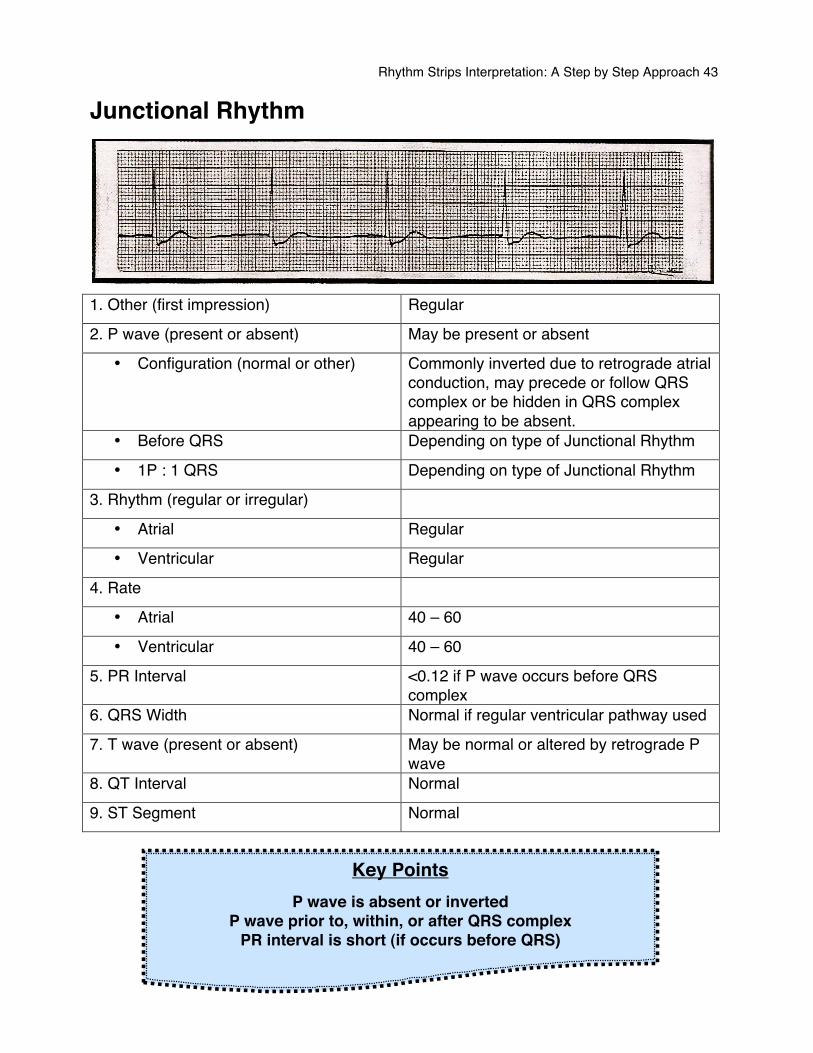
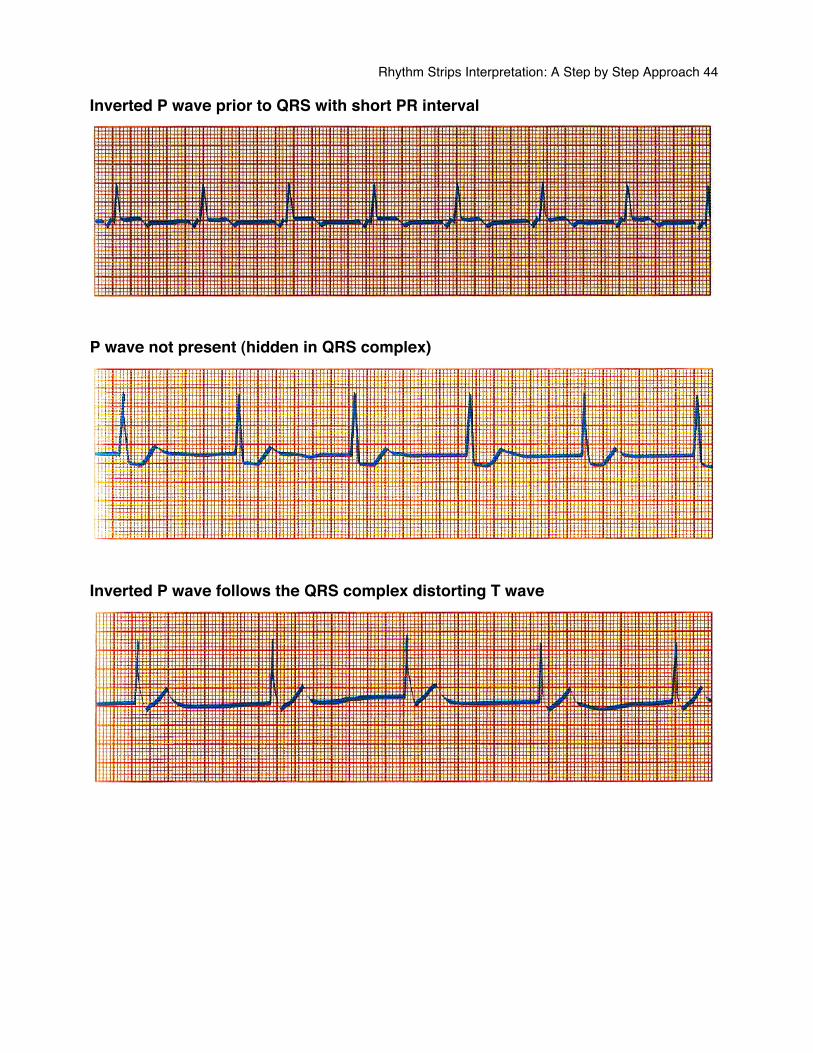
Junctional Rhythm
1. Other (first impression) Regular
2. P wave (present or absent) May be present or absent
• Configuration (normal or other) Commonly inverted due to retrograde atrial conduction, may precede or follow QRS complex or be hidden in QRS complex appearing to be absent.
• Before QRS Depending on type of Junctional Rhythm
• 1P : 1 QRS Depending on type of Junctional Rhythm
3. Rhythm (regular or irregular)
• Atrial Regular
• Ventricular Regular
4. Rate
• Atrial 40 – 60
• Ventricular 40 – 60
5. PR Interval <0.12 if P wave occurs before QRS complex
6. QRS Width Normal if regular ventricular pathway used
7. T wave (present or absent) May be normal or altered by retrograde P wave
8. QT Interval Normal
9. ST Segment Normal
Key Points P wave is absent or inverted
P wave prior to, within, or after QRS complex PR interval is short (if occurs before QRS)
Rhythm Strips Interpretation: A Step by Step Approach 44
Inverted P wave prior to QRS with short PR interval
P wave not present (hidden in QRS complex)
Inverted P wave follows the QRS complex distorting T wave
Rhythm Strips Interpretation: A Step by Step Approach 45
Atrioventricular Blocks • 1st Degree AV Block • 2nd Degree AV Block (Mobitz Type I) • 2nd Degree AV Block (Mobitz Type II) • 3rd Degree AV Block
Rhythm Strips Interpretation: A Step by Step Approach 46
Does the PR interval Vary? Can it be measured? Normally the PR interval is constant. In some conditions, however, the interval between P waves and QRS complexes changes, giving rise to a variable PR interval. Sometimes a QRS complex does not follow a P wave at all and so the PR interval cannot be measured. If either, or both, of these occur, they indicate a number of possible AV conduction problems. These are distinguished by the relationship between P waves and QRS complexes.
1. 1st degree AV block When the PR interval is constantly prolonged followed by a normal QRS complex.
2. 2nd degree Mobitz type I When the PR interval gradually lengthens with AV block (Wenckeback) each beat, until one P wave fails to produce a QRS complex.
3. 2nd degree type II AV block When the PR interval is fixed and a normal but occasionally P wave fails to produce a QRS complex.
4. 2nd degree type II AV block When alternate P waves are not followed by (2:1) QRS complexes.
5. 3rd degree (complete) When there is no relationship between AV block P waves and QRS complexes.
REMEMBER
The AV nodes function is to delay the impulse conduction to allow for right ventricular filling,
measured by the PR interval.
Hence, blocks occur when the AV node is too successful at delaying the conduction.
Rhythm Strips Interpretation: A Step by Step Approach 47
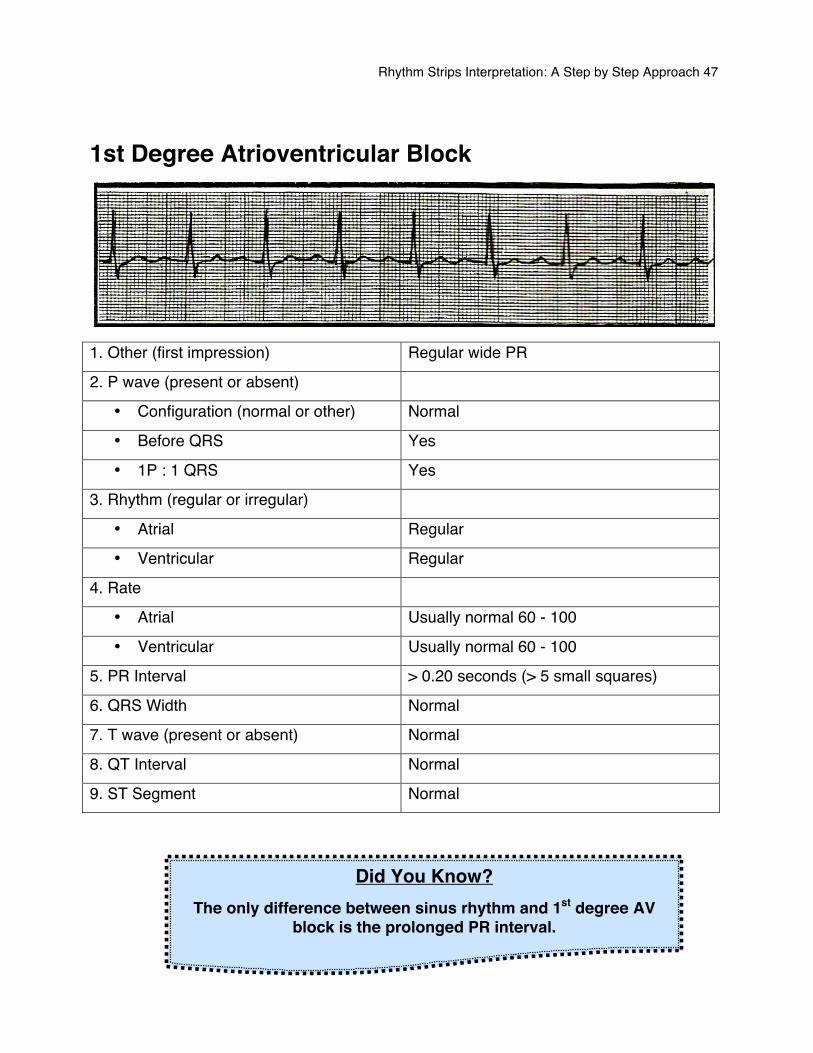
1st Degree Atrioventricular Block
1. Other (first impression) Regular wide PR
2. P wave (present or absent)
• Configuration (normal or other) Normal
• Before QRS Yes
• 1P : 1 QRS Yes
3. Rhythm (regular or irregular)
• Atrial Regular
• Ventricular Regular
4. Rate
• Atrial Usually normal 60 - 100
• Ventricular Usually normal 60 - 100
5. PR Interval > 0.20 seconds (> 5 small squares)
6. QRS Width Normal
7. T wave (present or absent) Normal
8. QT Interval Normal
9. ST Segment Normal
Did You Know? The only difference between sinus rhythm and 1st degree AV
block is the prolonged PR interval.
Rhythm Strips Interpretation: A Step by Step Approach 48
Prolongation of the PR interval indicates that conduction through the AV node has been delayed. When this delay is constant for each cardiac cycle and a QRS complex follows each P wave, it is referred to as first-degree AV block. First degree AV block is normal when it accompanies a vagally induced bradycardia, as an increase in vagal tone decreases AV nodal conduction. It mal also be a feature of:
• Ischemic heart disease • Acute Rheumatic myocarditis • Hypokalemia • Digoxin • Quinidine • Beta blockers • Certain calcium channel blockers
First degree AV block in itself is asymptomatic and in general do not progress to other sort of heart blocks. No specific treatment is necessary for first-degree AV block in its own right, but it should alert you to note one of the above diagnoses which may require treatment. First-degree AV block is not an indication for a pacemaker.
Rhythm Strips Interpretation: A Step by Step Approach 49
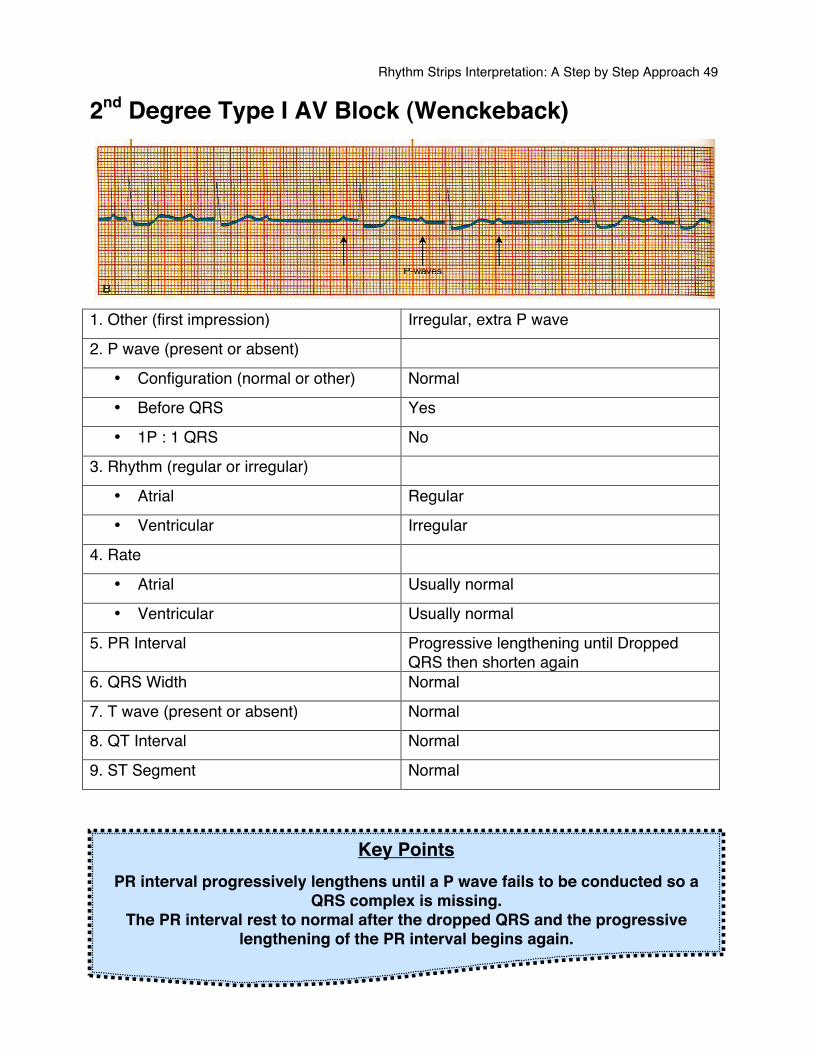
2nd Degree Type I AV Block (Wenckeback)
1. Other (first impression) Irregular, extra P wave
2. P wave (present or absent)
• Configuration (normal or other) Normal
• Before QRS Yes
• 1P : 1 QRS No
3. Rhythm (regular or irregular)
• Atrial Regular
• Ventricular Irregular
4. Rate
• Atrial Usually normal
• Ventricular Usually normal
5. PR Interval Progressive lengthening until Dropped QRS then shorten again
6. QRS Width Normal
7. T wave (present or absent) Normal
8. QT Interval Normal
9. ST Segment Normal
Key Points PR interval progressively lengthens until a P wave fails to be conducted so a
QRS complex is missing. The PR interval rest to normal after the dropped QRS and the progressive
lengthening of the PR interval begins again.
Rhythm Strips Interpretation: A Step by Step Approach 50
Its characteristic features are: • The PR interval shows progressive lengthening until one P wave fails to be
conducted and fails to produce a QRS complex. • The PR interval reset to normal and the cycle repeats.
Mobitz type I AV block is thought to result from abnormal conduction through the A node itself and can result simply from periods of high vagal activity so it sometimes occur during sleep. It may also occur in generalized disease of the conducting tissues of the heart. The affected AV node tissues conduct successive impulses increasingly earlier in the relative refractory period. After several beats, an impulse arrives during the absolute refractory period when the tissue canʼt conduct it. The next impulse arrives during the relative refractory period and is conducted normally. This cycle is then repeated. In this situation the PR interval progressively lengthens until finally one P wave is not conducted and you have the loss of a QRS complex. Common Causes
• Over stimulated vagal system • Inferior wall MI • Cardiac Surgery • Rheumatic heart disease • Digitalis toxicity • Propanolol • Procainamide
Presentation Commonly transient and patients are usually asymptomatic. However, there is a risk the block could progress to a more serious block, so monitoring is recommended in the acute phase.
Rhythm Strips Interpretation: A Step by Step Approach 51
Possible Treatment It is regarded as relatively benign form of AV block and a pacemaker is not required unless the frequency of dropped ventricular beats causes symptomatic bradycardia. In acute myocardial infarction (MI), however, pacing may be required depending upon the type of infarction. In anterior myocardial infarction, a prophylactic temporary pacemaker is recommended in case third degree (complete) heart block develops. In inferior myocardial infarction, a pacemaker is only needed if symptoms of hemodynamic compromise results.
Rhythm Strips Interpretation: A Step by Step Approach 52
2nd Degree Mobitz Type II AV Block
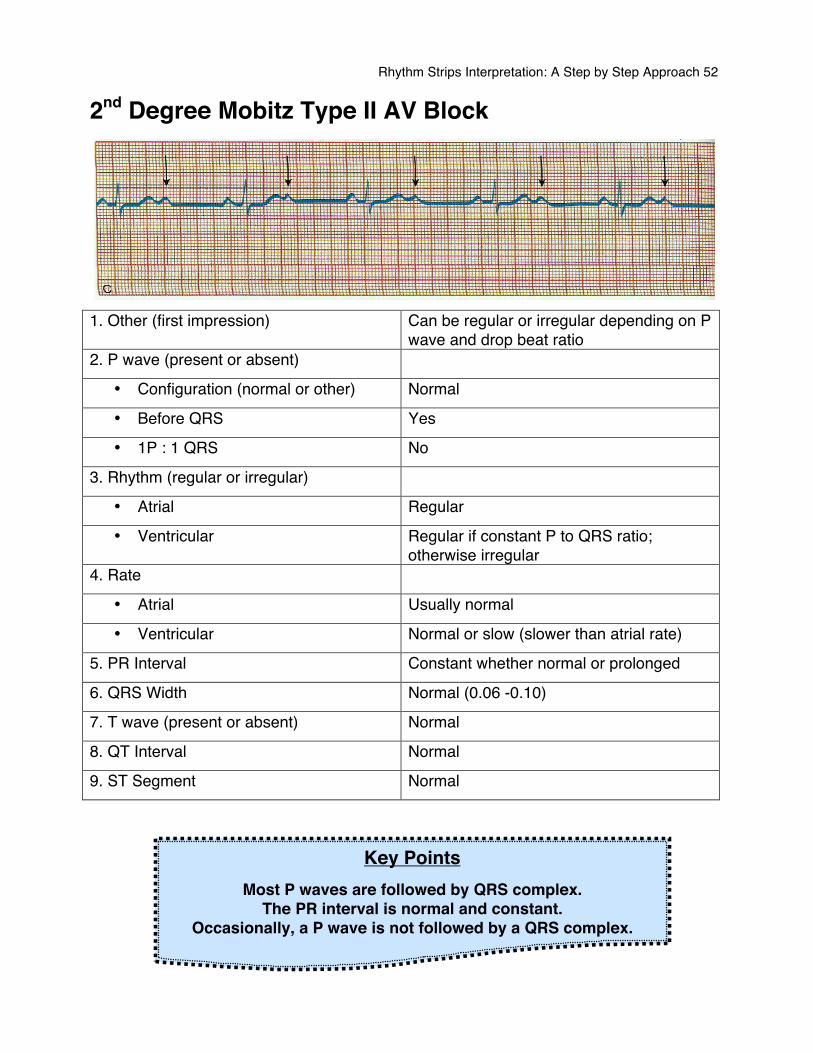
1. Other (first impression) Can be regular or irregular depending on P
wave and drop beat ratio 2. P wave (present or absent)
• Configuration (normal or other) Normal
• Before QRS Yes
• 1P : 1 QRS No
3. Rhythm (regular or irregular)
• Atrial Regular
• Ventricular Regular if constant P to QRS ratio; otherwise irregular
4. Rate
• Atrial Usually normal
• Ventricular Normal or slow (slower than atrial rate)
5. PR Interval Constant whether normal or prolonged
6. QRS Width Normal (0.06 -0.10)
7. T wave (present or absent) Normal
8. QT Interval Normal
9. ST Segment Normal
Key Points Most P waves are followed by QRS complex.
The PR interval is normal and constant. Occasionally, a P wave is not followed by a QRS complex.
Rhythm Strips Interpretation: A Step by Step Approach 53
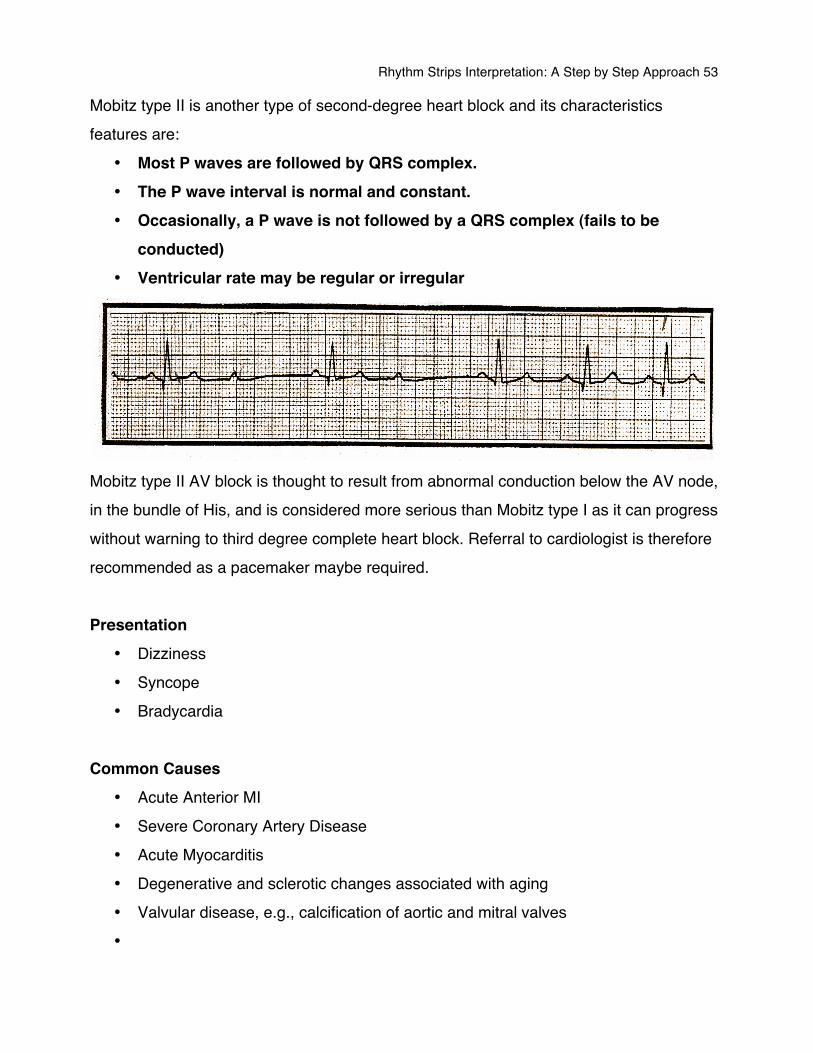
Mobitz type II is another type of second-degree heart block and its characteristics features are:
• Most P waves are followed by QRS complex. • The P wave interval is normal and constant. • Occasionally, a P wave is not followed by a QRS complex (fails to be
conducted) • Ventricular rate may be regular or irregular
Mobitz type II AV block is thought to result from abnormal conduction below the AV node, in the bundle of His, and is considered more serious than Mobitz type I as it can progress without warning to third degree complete heart block. Referral to cardiologist is therefore recommended as a pacemaker maybe required. Presentation
• Dizziness • Syncope • Bradycardia
Common Causes
• Acute Anterior MI • Severe Coronary Artery Disease • Acute Myocarditis • Degenerative and sclerotic changes associated with aging • Valvular disease, e.g., calcification of aortic and mitral valves •
Rhythm Strips Interpretation: A Step by Step Approach 54
Possible Treatments Usually no immediate treatment is needed if the patient doesnʼt have symptoms. If the patientʼs pulse rate is slow and they show signs and symptoms of decreased cardiac output, the treatment aims at increasing the heart rate to improve cardiac output. Because the conduction blocks occur in the His-Purkinje system, drugs that act directly on the myocardium usually prove more effective than those that increase atrial rate. Temporary pacing may be appropriate for short-term management. For long-term management the patient will usually require a permanent pacemaker to prevent ventricular standstill.
Rhythm Strips Interpretation: A Step by Step Approach 55
Third Degree (Complete) AV Block
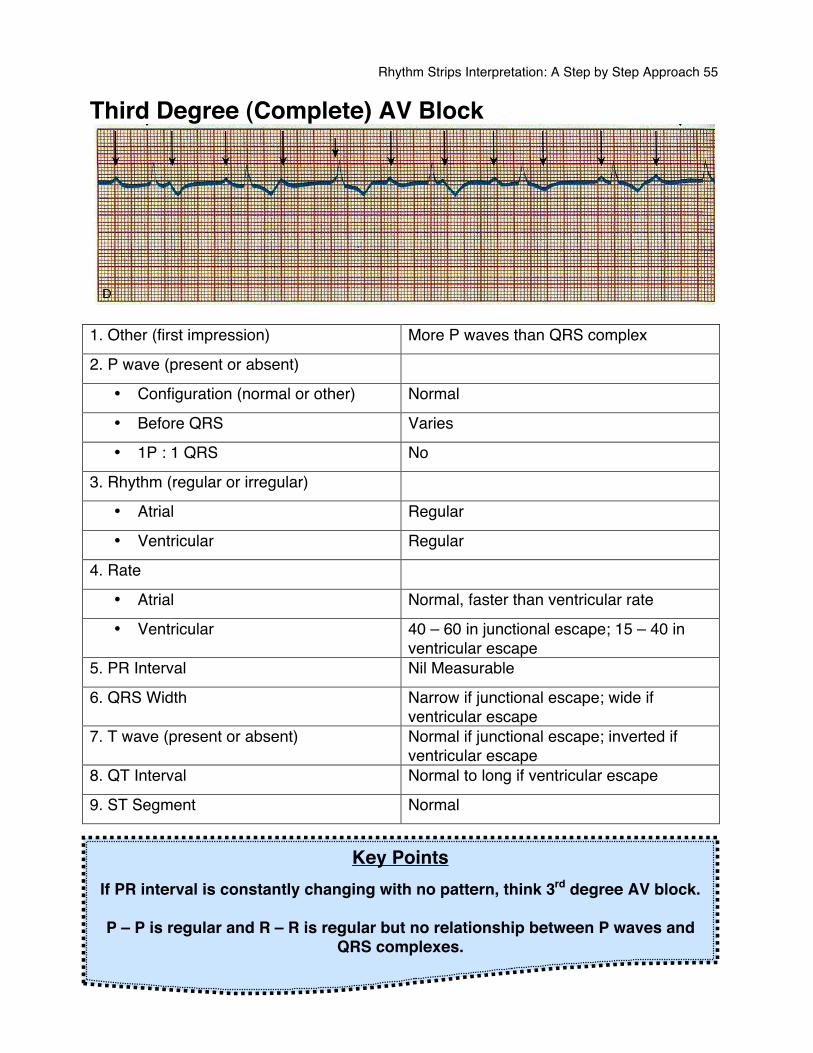
1. Other (first impression) More P waves than QRS complex
2. P wave (present or absent)
• Configuration (normal or other) Normal
• Before QRS Varies
• 1P : 1 QRS No
3. Rhythm (regular or irregular)
• Atrial Regular
• Ventricular Regular
4. Rate
• Atrial Normal, faster than ventricular rate
• Ventricular 40 – 60 in junctional escape; 15 – 40 in ventricular escape
5. PR Interval Nil Measurable
6. QRS Width Narrow if junctional escape; wide if ventricular escape
7. T wave (present or absent) Normal if junctional escape; inverted if ventricular escape
8. QT Interval Normal to long if ventricular escape
9. ST Segment Normal
Key Points If PR interval is constantly changing with no pattern, think 3rd degree AV block.
P – P is regular and R – R is regular but no relationship between P waves and
QRS complexes.
Rhythm Strips Interpretation: A Step by Step Approach 56
In third degree (complete) AV block there is a complete interruption of conduction between atria and ventricles, so that the two are working independently. The atrial P waves bear no relationship to the ventricular QRS complexes which usually arise as a result of a junctional (narrow QRS) or ventricular (wide QRS) escape rhythm. It is important to remember that any atrial rhythm can co-exist with third degree heart block, and so the P waves maybe abnormal or even absent. Presentation If the escape rhythm is junctional in origin (narrow QRS complex) the individual may be hemodynamically stable. If the escape rhythm is ventricular in origin (wide QRS complex) the individual will most likely be hemodynamically compromised; cold, clammy, cyanosed, respiratory distressed, and possibly unconscious. Common Causes and Treatment In acute inferior wall MI, third degree AV block requires pacing if the patient is symptomatic or hemodynamically compromised. A junctional escape (narrow QRS complex) is usually associated with inferior wall MI and may be transitory in nature. In acute anterior wall MI, the development of third degree AV block is usually associated with an escape rhythm of ventricular origin. The block indicates an extensive infarct and thus a poor prognosis. Pacing is a must. Atropine can be tried in attempt to reduce a block due to over stimulation of vagal system. However you may be successful in increasing the atrial rate only. Inotropic support can be called for, however, Inotropic drugs are oxygen demanding so an ischemic myocardium may not tolerate its introduction also.
REMEMBER The transcutaneous pacemaker is an
available bridge until transvenous pacing can be achieved
Rhythm Strips Interpretation: A Step by Step Approach 57
Ventricular Arrhythmias • Premature ventricular contractions • Idioventricular rhythm • Ventricular tachycardia • Torsades de Pointes • Ventricular fibrillation
Rhythm Strips Interpretation: A Step by Step Approach 58
Ventricular Arrhythmias As their name suggests ventricular arrhythmias arise from the ventricles, below the bifurcation of the bundle of His. The most common characteristic with ventricular arrhythmias is the absence of P wave. Because the impulses originated from the ventricles, normal atrial depolarization does not occur. There is an exemption to this rule in the case of the complete heart block, where the atria and ventricles are conducting impulses separately; therefore P waves will be present. The second common feature of ventricular rhythm is their broad and bizarre QRS complex (QRS > 0.12 sec). The third most common characteristic is the T wave deflecting in the opposite direction of the QRS complex. Types
• Premature ventricular contractions • Idioventricular rhythm • Ventricular tachycardia • Torsades de Pointes • Ventricular fibrillation
Of deaths attributed to ischemic heart disease in North America, 66% are sudden and thought to be due to ventricular arrhythmias.
Key Points QRS complex earlier than expected
Absence of a P wave Broad and bizarre QRS complex (QRS > 0.12 sec)
T wave deflects in the opposite direction of the QRS complex
Rhythm Strips Interpretation: A Step by Step Approach 59
Premature Ventricular Contractions (PVCs) In premature ventricular contractions, ventricles are stimulated by an ectopic focus in their walls. They contract early, giving an extra heartbeat. Because the focus of stimulation is outside the normal conduction pathway, the impulse will travel around the ventricles in a slower rate, resulting in a weird bizarre QRS complex.
PVCs are ventricular ectopic beats that occur earlier than you expect. They can occur singularly, as a couplet, or even triplet. They may occur as frequent as every second beat as in bigeminy, or they may only occur once every now and then. PVCs can be generated from one specific ectopic focus in the ventricles (unifocal PVCs) or several different foci (Multifocal PVCs). It is easy to distinguish the difference between unifocal and Multifocal PVCs by looking at the morphology of the QRS complex. If the PVCs are coming from one specific focus, the QRS complexes that represent the ventricular ectopics will all look the same. If they are coming from different foci, the QRS complex will look different. Symptoms The pulse during a PVC is usually weaker or possibly absent to palpitation. The pulse on the beat following a compensatory pause is often stronger than usual. A patient may be aware of PVCs and become apprehensive because of palpitation.
REMEMBER
The normal conduction pathway is the fast conduction pathway
Rhythm Strips Interpretation: A Step by Step Approach 60
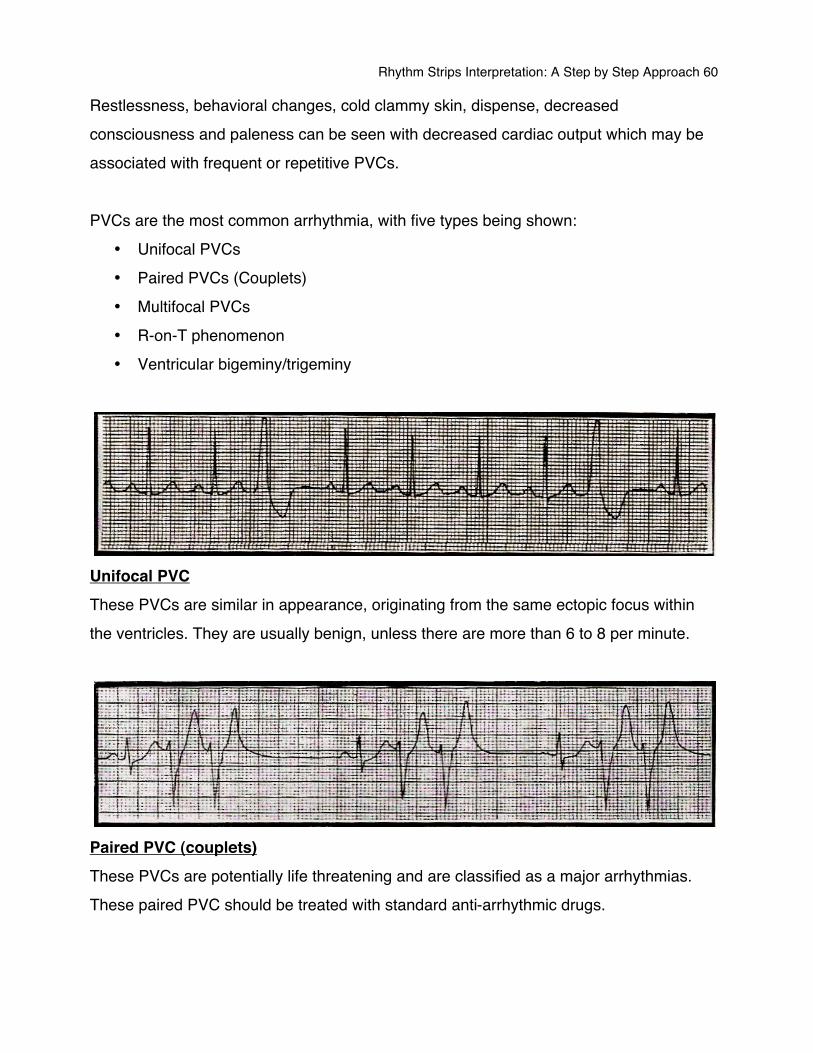
Restlessness, behavioral changes, cold clammy skin, dispense, decreased consciousness and paleness can be seen with decreased cardiac output which may be associated with frequent or repetitive PVCs. PVCs are the most common arrhythmia, with five types being shown:
• Unifocal PVCs • Paired PVCs (Couplets) • Multifocal PVCs • R-on-T phenomenon • Ventricular bigeminy/trigeminy
Unifocal PVC These PVCs are similar in appearance, originating from the same ectopic focus within the ventricles. They are usually benign, unless there are more than 6 to 8 per minute.
Paired PVC (couplets) These PVCs are potentially life threatening and are classified as a major arrhythmias. These paired PVC should be treated with standard anti-arrhythmic drugs.
Rhythm Strips Interpretation: A Step by Step Approach 61
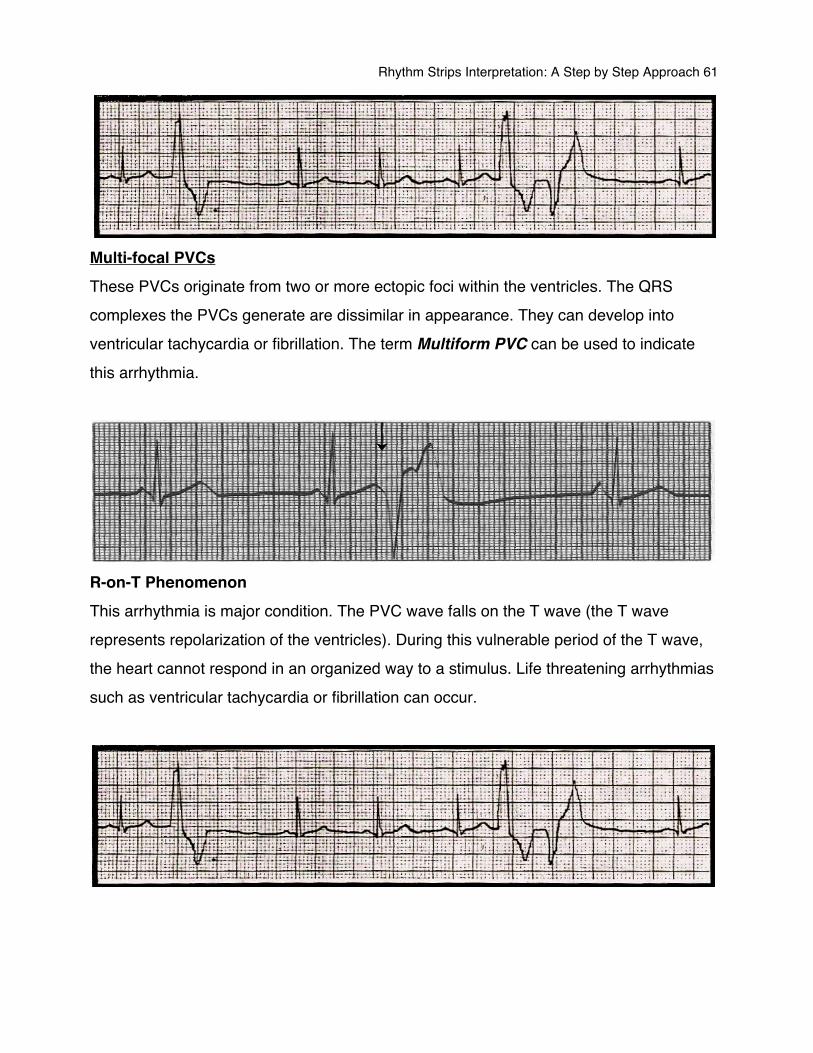
Multi-focal PVCs These PVCs originate from two or more ectopic foci within the ventricles. The QRS complexes the PVCs generate are dissimilar in appearance. They can develop into ventricular tachycardia or fibrillation. The term Multiform PVC can be used to indicate this arrhythmia.
R-on-T Phenomenon This arrhythmia is major condition. The PVC wave falls on the T wave (the T wave represents repolarization of the ventricles). During this vulnerable period of the T wave, the heart cannot respond in an organized way to a stimulus. Life threatening arrhythmias such as ventricular tachycardia or fibrillation can occur.
Rhythm Strips Interpretation: A Step by Step Approach 62
Ventricular Bigeminy/Trigeminy/Salvo (Repetitive activity) In ventricular bigeminy, every other beat is premature. If ectopic beats occur every third beat, it is called trigeminy; every fourth beat it is called quadrigeminy. If the beats occur in runs or repetitive forms, they are called salvos. Occurrence
• Acute myocardial infarction • Idiopathic hypertrophic subaortic stenosis • Electrolyte imbalance • Congestive cardiomyopathy • Fever • Acidosis • Hypokalemia • Coronary heart disease • Myocardial contusion from trauma • Psychotropic drugs • Valvular heart disease • Myocardial ischemia • Congestive heart failure • Digitalis toxicity • Hypoxia • Exercise
Rhythm Strips Interpretation: A Step by Step Approach 63
Idioventricular Rhythm
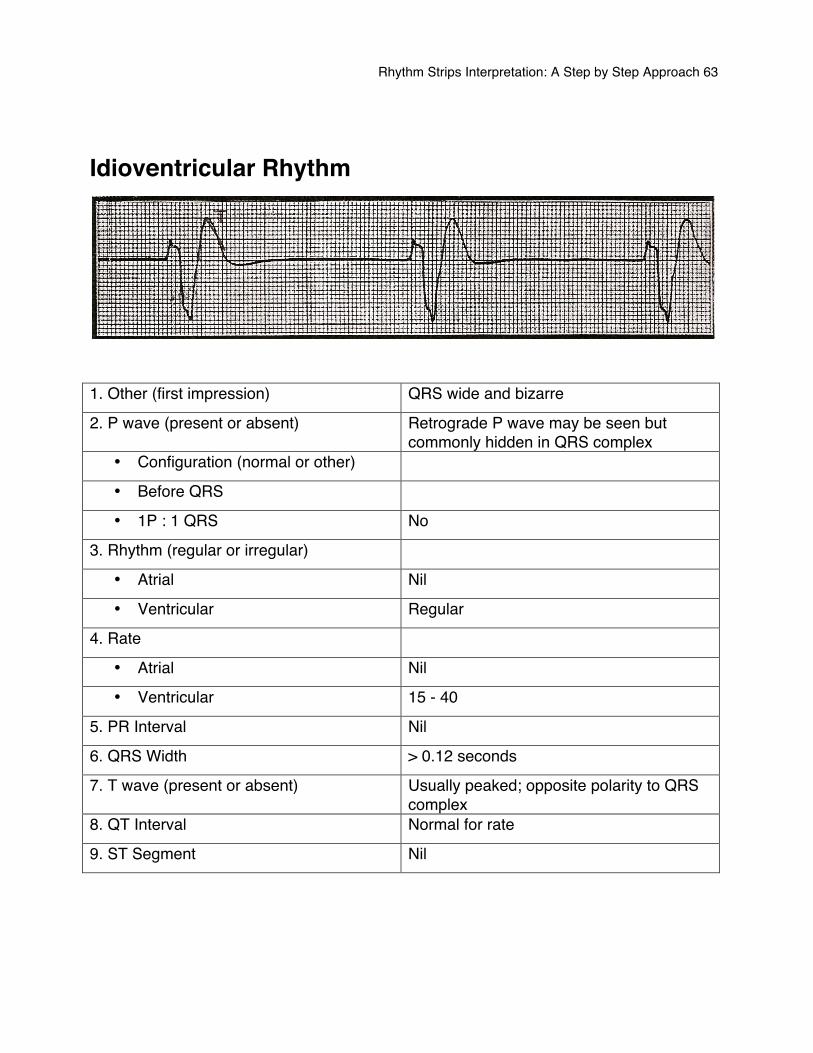
1. Other (first impression) QRS wide and bizarre
2. P wave (present or absent) Retrograde P wave may be seen but commonly hidden in QRS complex
• Configuration (normal or other)
• Before QRS
• 1P : 1 QRS No
3. Rhythm (regular or irregular)
• Atrial Nil
• Ventricular Regular
4. Rate
• Atrial Nil
• Ventricular 15 - 40
5. PR Interval Nil
6. QRS Width > 0.12 seconds
7. T wave (present or absent) Usually peaked; opposite polarity to QRS complex
8. QT Interval Normal for rate
9. ST Segment Nil
Rhythm Strips Interpretation: A Step by Step Approach 64
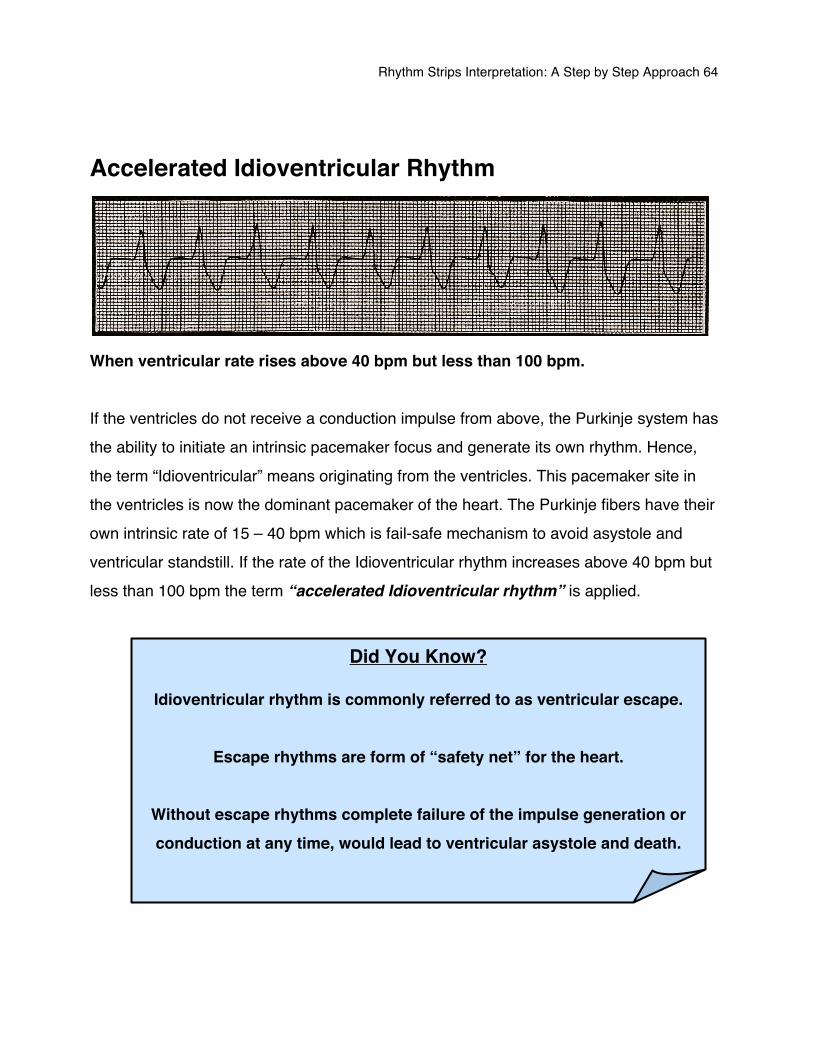
Accelerated Idioventricular Rhythm
When ventricular rate rises above 40 bpm but less than 100 bpm. If the ventricles do not receive a conduction impulse from above, the Purkinje system has the ability to initiate an intrinsic pacemaker focus and generate its own rhythm. Hence, the term “Idioventricular” means originating from the ventricles. This pacemaker site in the ventricles is now the dominant pacemaker of the heart. The Purkinje fibers have their own intrinsic rate of 15 – 40 bpm which is fail-safe mechanism to avoid asystole and ventricular standstill. If the rate of the Idioventricular rhythm increases above 40 bpm but less than 100 bpm the term “accelerated Idioventricular rhythm” is applied.
Did You Know?
Idioventricular rhythm is commonly referred to as ventricular escape.
Escape rhythms are form of “safety net” for the heart.
Without escape rhythms complete failure of the impulse generation or conduction at any time, would lead to ventricular asystole and death.
Rhythm Strips Interpretation: A Step by Step Approach 65
An Idioventricular rhythm may also occur as a result of an excited pacemaker site in the ventricles that fires off faster than the intrinsic rate of the current pacemaker. This situation commonly occurs with thrombolysis post myocardial infarction. It is believed to be due to renewed blood flow and hence stimulation of ischemic myocardium which is electrically unstable. Common Causes Idioventricular rhythm can occur because of complete heart block following a period of sinus arrest, hyperkalemia, post MI, post thrombolysis, or as a terminal cardiac event. Possible treatment The patient will usually require the insertion of a pacemaker electrode. Temporary drug treatment with intravenous atropine or adrenaline may be initiated. If there is no myocardial perfusion, cardiopulmonary resuscitation (CPR) should be initiated.
Rhythm Strips Interpretation: A Step by Step Approach 66
Ventricular Tachycardia
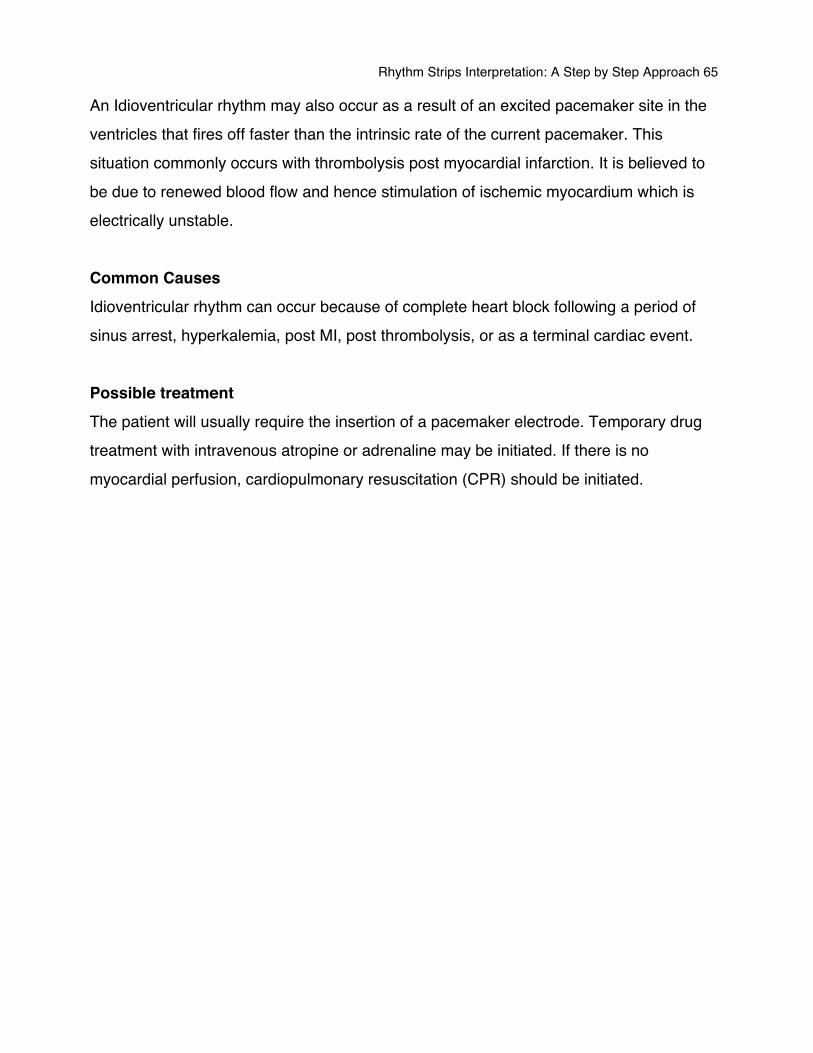
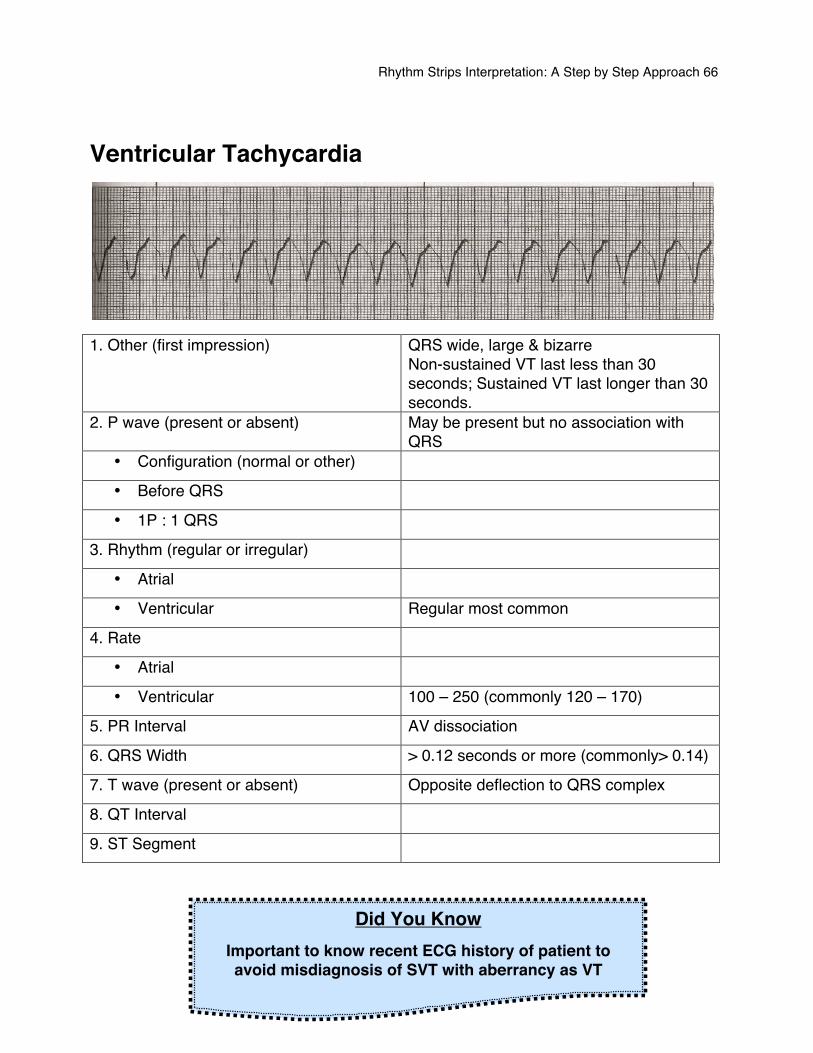
1. Other (first impression) QRS wide, large & bizarre
Non-sustained VT last less than 30 seconds; Sustained VT last longer than 30 seconds.
2. P wave (present or absent) May be present but no association with QRS
• Configuration (normal or other)
• Before QRS
• 1P : 1 QRS
3. Rhythm (regular or irregular)
• Atrial
• Ventricular Regular most common
4. Rate
• Atrial
• Ventricular 100 – 250 (commonly 120 – 170)
5. PR Interval AV dissociation
6. QRS Width > 0.12 seconds or more (commonly> 0.14)
7. T wave (present or absent) Opposite deflection to QRS complex
8. QT Interval
9. ST Segment
Did You Know
Important to know recent ECG history of patient to avoid misdiagnosis of SVT with aberrancy as VT
Rhythm Strips Interpretation: A Step by Step Approach 67
A series of 3 or more consecutive PVCs at a rate of over 100 bpm are seen as a ventricular tachycardia (VT). An ectopic focus in the ventricles takes over to act as the pacemaker. There is no association between the atrial rhythm and the ventricular rhythm. Distinct wide QRS complexes and T waves are seen. Ventricular tachycardia can be paroxysmal in nature lasting for a few beats or it can be sustained nature. Ventricular tachycardia has a ventricular rate that commonly ranges from 120 – 170 bpm. However, an Idioventricular rhythm over 100 bpm is by definition VT. Ventricular tachycardia develops and ends suddenly. It is a major arrhythmia which can reduce cardiac output and lower blood pressure. The patient may not be able to withstand increased myocardial irritability and consequently ventricular fibrillation may develop. An unusual form of multiform ventricular tachycardia is called Torsade de Pointes. Common Causes
• Acute myocardial infarction • Digitalis toxicity • Coronary heart disease • R-on-T phenomenon • Hypoxemia • Advanced cardiomyopathy • Electrolyte imbalance, e.g., hypokalemia, hypomagnesemia • Irritation from a pacemaker electrode or cardiac catheter
Rhythm Strips Interpretation: A Step by Step Approach 68
Presentation
• Rapid rhythm – feeling of palpitation • Low cardiac output due to loss of atrial kick and poor ventricular filling due to the
tachycardia • Diaphoresis • Dizziness – feeling of apprehension • Syncope to loss of consciousness • Cardiac arrest
Possible Treatment Treatment depends on the hemodynamic and neurological response of the patient; some individuals can maintain satisfactory cardiac output and blood pressure.
REMEMBER
Treat the patient, not the rhythm!!!
Rhythm Strips Interpretation: A Step by Step Approach 69
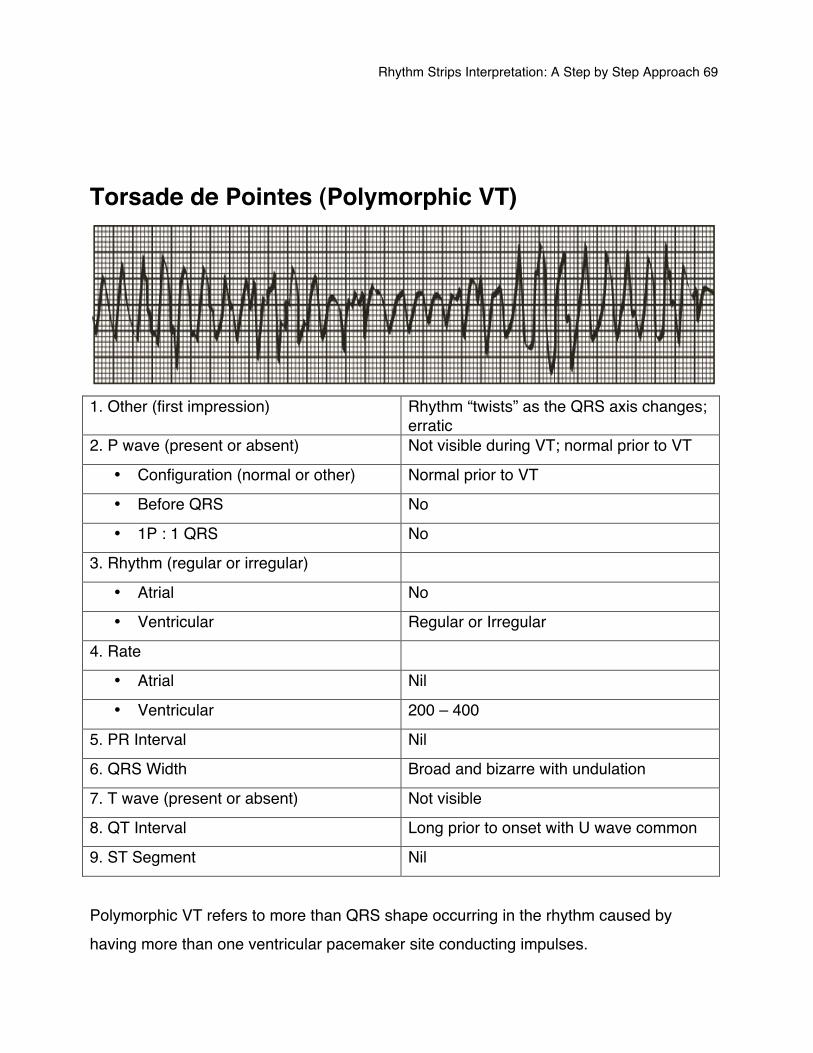
Torsade de Pointes (Polymorphic VT)
1. Other (first impression) Rhythm “twists” as the QRS axis changes;
erratic 2. P wave (present or absent) Not visible during VT; normal prior to VT
• Configuration (normal or other) Normal prior to VT
• Before QRS No
• 1P : 1 QRS No
3. Rhythm (regular or irregular)
• Atrial No
• Ventricular Regular or Irregular
4. Rate
• Atrial Nil
• Ventricular 200 – 400
5. PR Interval Nil
6. QRS Width Broad and bizarre with undulation
7. T wave (present or absent) Not visible
8. QT Interval Long prior to onset with U wave common
9. ST Segment Nil
Polymorphic VT refers to more than QRS shape occurring in the rhythm caused by having more than one ventricular pacemaker site conducting impulses.
Rhythm Strips Interpretation: A Step by Step Approach 70
Torsade de Pointes is recognized by the QRS complexes undulating in a twisting fashion and is preceded by a rhythm with a prolonged QT interval. Torsade de Pointes is initiated by an early depolarization within the QT segment triggering ventricular activity. The anti-arrhythmic drug Quinidine is commonly responsible for Torsade de Pointes but all anti-arrhythmic which causes the QT prolongation can induce the rhythm. Magnesium Sulfate is recommended for this life threatening arrhythmia or if hypomagnesemia is present. A loading those of 1 to 2 grams mixed in 50 – 100 ml of 5% Dextrose in Water over 5 – 60 minutes intravenous or intraosseous (IV/IO), followed by 0.5 to 1 gram per hour titrated to control Torsades.
Rhythm Strips Interpretation: A Step by Step Approach 71
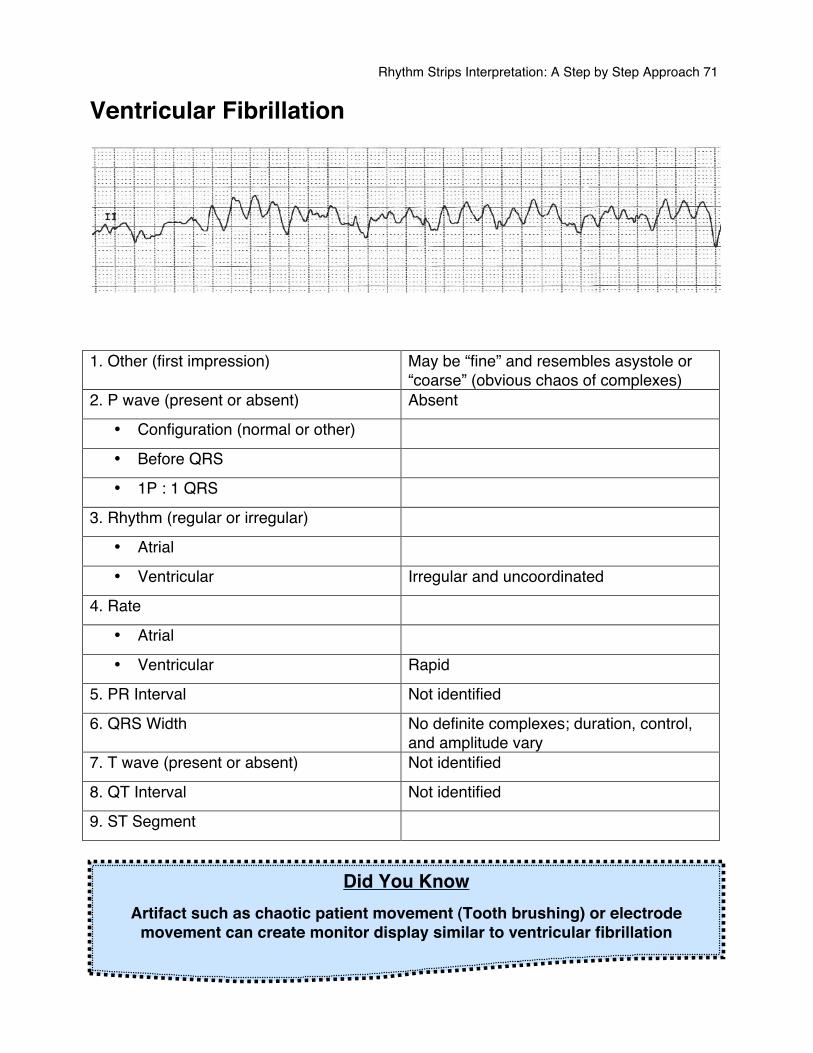
Ventricular Fibrillation
1. Other (first impression) May be “fine” and resembles asystole or
“coarse” (obvious chaos of complexes) 2. P wave (present or absent) Absent
• Configuration (normal or other)
• Before QRS
• 1P : 1 QRS
3. Rhythm (regular or irregular)
• Atrial
• Ventricular Irregular and uncoordinated
4. Rate
• Atrial
• Ventricular Rapid
5. PR Interval Not identified
6. QRS Width No definite complexes; duration, control, and amplitude vary
7. T wave (present or absent) Not identified
8. QT Interval Not identified
9. ST Segment
Did You Know Artifact such as chaotic patient movement (Tooth brushing) or electrode
movement can create monitor display similar to ventricular fibrillation
Rhythm Strips Interpretation: A Step by Step Approach 72
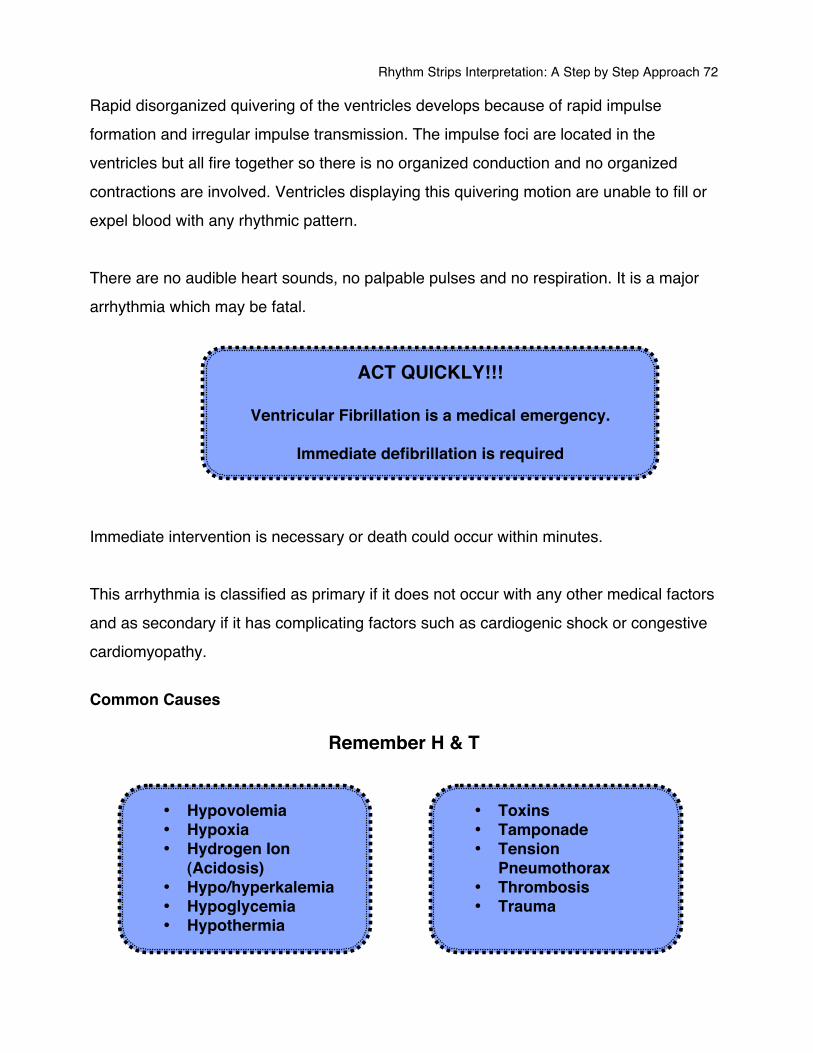
Rapid disorganized quivering of the ventricles develops because of rapid impulse formation and irregular impulse transmission. The impulse foci are located in the ventricles but all fire together so there is no organized conduction and no organized contractions are involved. Ventricles displaying this quivering motion are unable to fill or expel blood with any rhythmic pattern. There are no audible heart sounds, no palpable pulses and no respiration. It is a major arrhythmia which may be fatal. Immediate intervention is necessary or death could occur within minutes. This arrhythmia is classified as primary if it does not occur with any other medical factors and as secondary if it has complicating factors such as cardiogenic shock or congestive cardiomyopathy. Common Causes
Remember H & T
ACT QUICKLY!!!
Ventricular Fibrillation is a medical emergency.
Immediate defibrillation is required
• Hypovolemia • Hypoxia • Hydrogen Ion
(Acidosis) • Hypo/hyperkalemia • Hypoglycemia • Hypothermia
• Toxins • Tamponade • Tension
Pneumothorax • Thrombosis • Trauma
Rhythm Strips Interpretation: A Step by Step Approach 73
Symptoms • Loss of consciousness • No heart sound • No peripheral pulse • No Blood pressure • Convulsion • Cyanosis or pallor
Treatment Immediate CPR should be initiated before a more advanced treatment is available. Defibrillation together with an early-uninterrupted CPR increases the chance of patient survival. Drugs such as epinephrine, vasopressors, and amiodarone are commonly used during the advance cardiac life support.
REMEMBER
Treat the patient, not the rhythm!!!
Rhythm Strips Interpretation: A Step by Step Approach 74
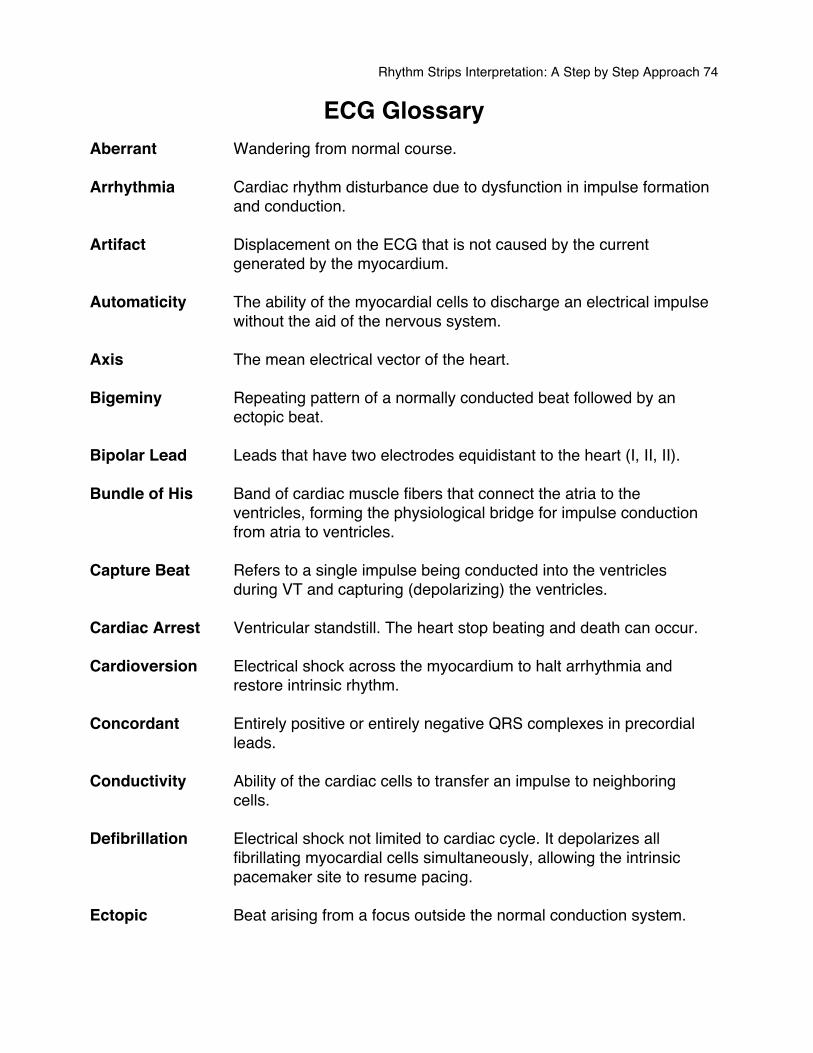
ECG Glossary Aberrant Wandering from normal course. Arrhythmia Cardiac rhythm disturbance due to dysfunction in impulse formation and conduction. Artifact Displacement on the ECG that is not caused by the current generated by the myocardium. Automaticity The ability of the myocardial cells to discharge an electrical impulse without the aid of the nervous system. Axis The mean electrical vector of the heart. Bigeminy Repeating pattern of a normally conducted beat followed by an ectopic beat. Bipolar Lead Leads that have two electrodes equidistant to the heart (I, II, II). Bundle of His Band of cardiac muscle fibers that connect the atria to the ventricles, forming the physiological bridge for impulse conduction from atria to ventricles. Capture Beat Refers to a single impulse being conducted into the ventricles during VT and capturing (depolarizing) the ventricles. Cardiac Arrest Ventricular standstill. The heart stop beating and death can occur. Cardioversion Electrical shock across the myocardium to halt arrhythmia and restore intrinsic rhythm. Concordant Entirely positive or entirely negative QRS complexes in precordial leads. Conductivity Ability of the cardiac cells to transfer an impulse to neighboring cells. Defibrillation Electrical shock not limited to cardiac cycle. It depolarizes all
fibrillating myocardial cells simultaneously, allowing the intrinsic pacemaker site to resume pacing.
Ectopic Beat arising from a focus outside the normal conduction system.
Rhythm Strips Interpretation: A Step by Step Approach 75
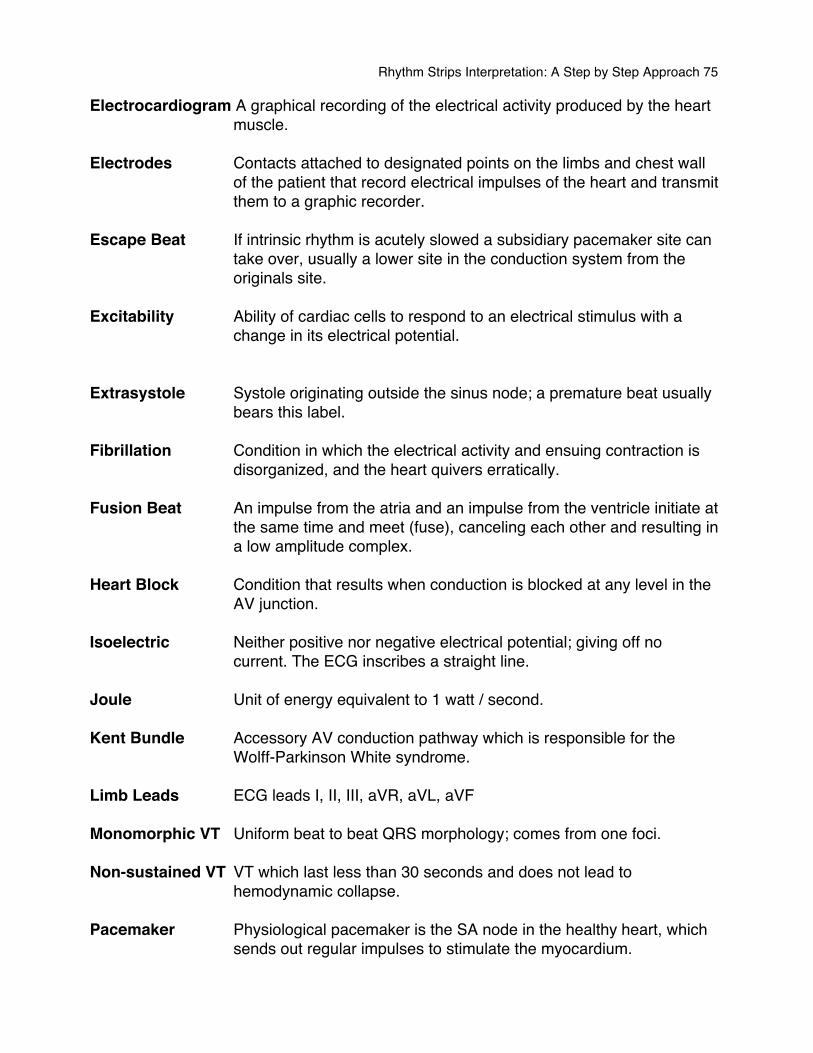
Electrocardiogram A graphical recording of the electrical activity produced by the heart muscle.
Electrodes Contacts attached to designated points on the limbs and chest wall
of the patient that record electrical impulses of the heart and transmit them to a graphic recorder.
Escape Beat If intrinsic rhythm is acutely slowed a subsidiary pacemaker site can
take over, usually a lower site in the conduction system from the originals site.
Excitability Ability of cardiac cells to respond to an electrical stimulus with a
change in its electrical potential. Extrasystole Systole originating outside the sinus node; a premature beat usually
bears this label. Fibrillation Condition in which the electrical activity and ensuing contraction is
disorganized, and the heart quivers erratically. Fusion Beat An impulse from the atria and an impulse from the ventricle initiate at
the same time and meet (fuse), canceling each other and resulting in a low amplitude complex.
Heart Block Condition that results when conduction is blocked at any level in the
AV junction. Isoelectric Neither positive nor negative electrical potential; giving off no
current. The ECG inscribes a straight line. Joule Unit of energy equivalent to 1 watt / second. Kent Bundle Accessory AV conduction pathway which is responsible for the
Wolff-Parkinson White syndrome. Limb Leads ECG leads I, II, III, aVR, aVL, aVF Monomorphic VT Uniform beat to beat QRS morphology; comes from one foci. Non-sustained VT VT which last less than 30 seconds and does not lead to
hemodynamic collapse. Pacemaker Physiological pacemaker is the SA node in the healthy heart, which
sends out regular impulses to stimulate the myocardium.
Rhythm Strips Interpretation: A Step by Step Approach 76
Paroxysmal Sudden burst, usually self-limiting. PAC Premature atrial contraction. PAT Paroxysmal atrial tachycardia. Polymorphic VT Constantly changing beat-to-beat QRS morphology. P-Pulmonale Increased P amplitude (II, III, aVF) with P axis rightward, associated
with diffuse lung disease. Precordial Leads Those emanating from chest leads (V1 – V6). Pre-excitation Premature activation of a portion of the ventricle. Reentry A cardiac impulse remains active in the portion of the heart and
reactivates the myocardium after the main impulse has passed and the surrounding cells have repolarized.
Refractory Not responsive to stimuli. Retrograde Conduction Conduction from the AV junction back into the atria, resultant
P wave is inverted. Sick Sinus Syndrome Term used to indicate a failing sinus node, seen as severe
slowing blocking or arresting of the SA node; or as an alternating sinus tachycardia – sinus bradycardia pattern.
Sustained VT VT that last more than 30 seconds, leads to hemodynamic collapse. Systole Contraction part of the cardiac cycle. Unipolar Unipolar leads have an exploring electrode close to the heartʼs
electrical field that reads impulses between it and the limb leads. Vector An electrical force of a known magnitude and direction.
Rhythm Strips Interpretation: A Step by Step Approach 77
Rhythm Strips Practice
Rhythm Strips Interpretation: A Step by Step Approach 78
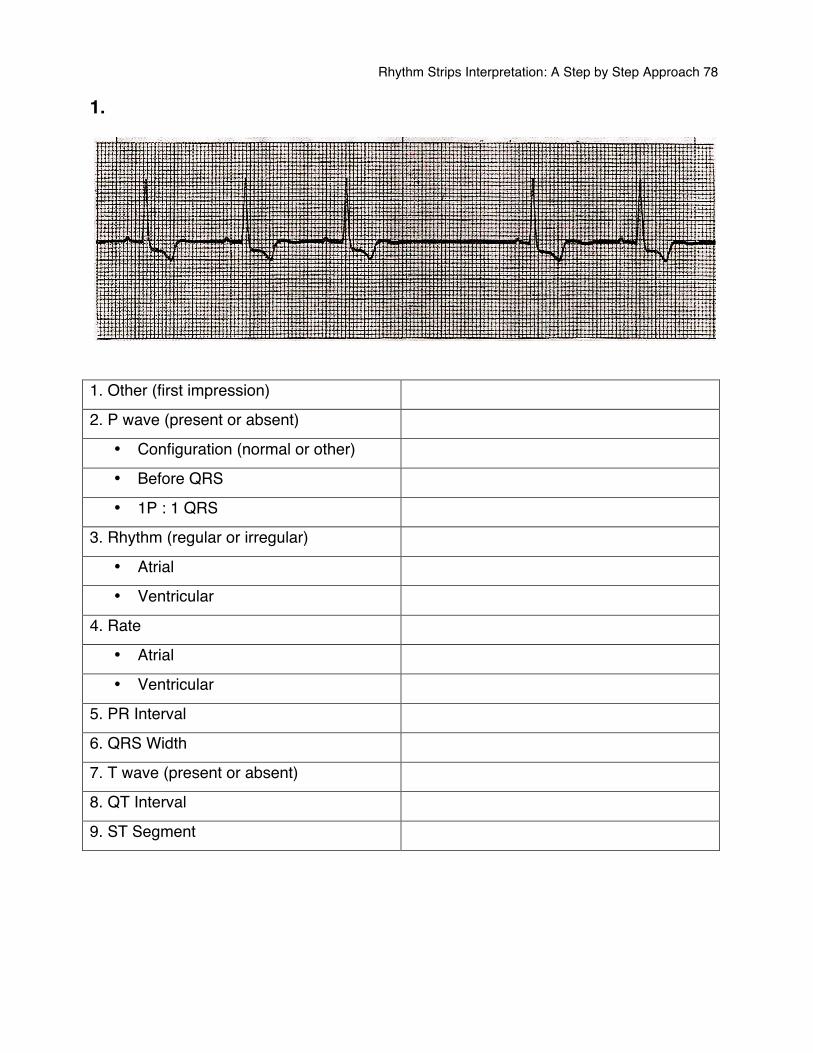
1.
1. Other (first impression)
2. P wave (present or absent)
• Configuration (normal or other)
• Before QRS
• 1P : 1 QRS
3. Rhythm (regular or irregular)
• Atrial
• Ventricular
4. Rate
• Atrial
• Ventricular
5. PR Interval
6. QRS Width
7. T wave (present or absent)
8. QT Interval
9. ST Segment
Rhythm Strips Interpretation: A Step by Step Approach 79
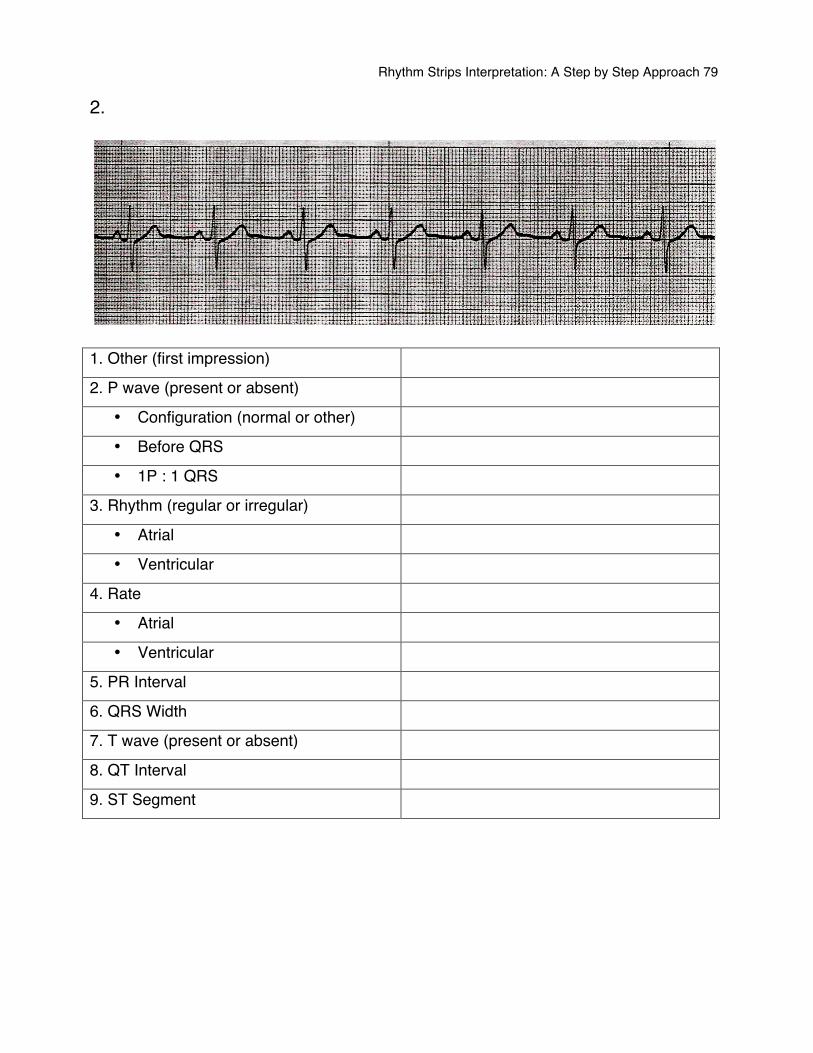
2.
1. Other (first impression)
2. P wave (present or absent)
• Configuration (normal or other)
• Before QRS
• 1P : 1 QRS
3. Rhythm (regular or irregular)
• Atrial
• Ventricular
4. Rate
• Atrial
• Ventricular
5. PR Interval
6. QRS Width
7. T wave (present or absent)
8. QT Interval
9. ST Segment
Rhythm Strips Interpretation: A Step by Step Approach 80
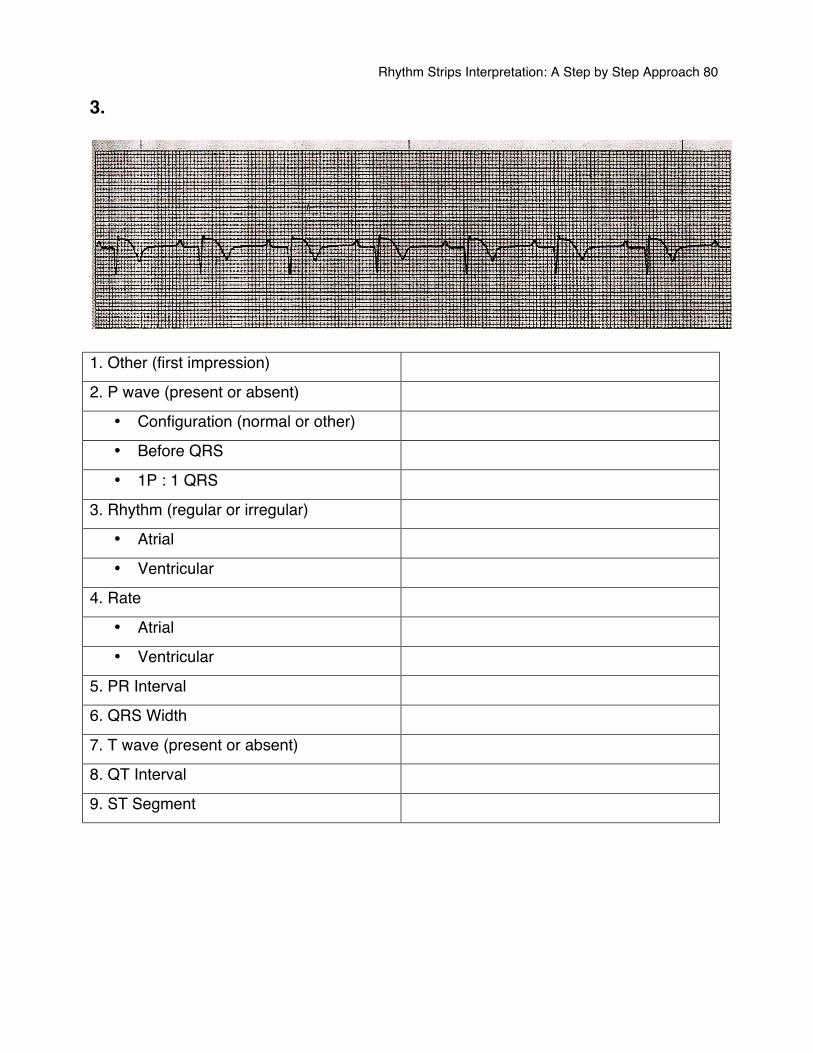
3.
1. Other (first impression)
2. P wave (present or absent)
• Configuration (normal or other)
• Before QRS
• 1P : 1 QRS
3. Rhythm (regular or irregular)
• Atrial
• Ventricular
4. Rate
• Atrial
• Ventricular
5. PR Interval
6. QRS Width
7. T wave (present or absent)
8. QT Interval
9. ST Segment
Rhythm Strips Interpretation: A Step by Step Approach 81
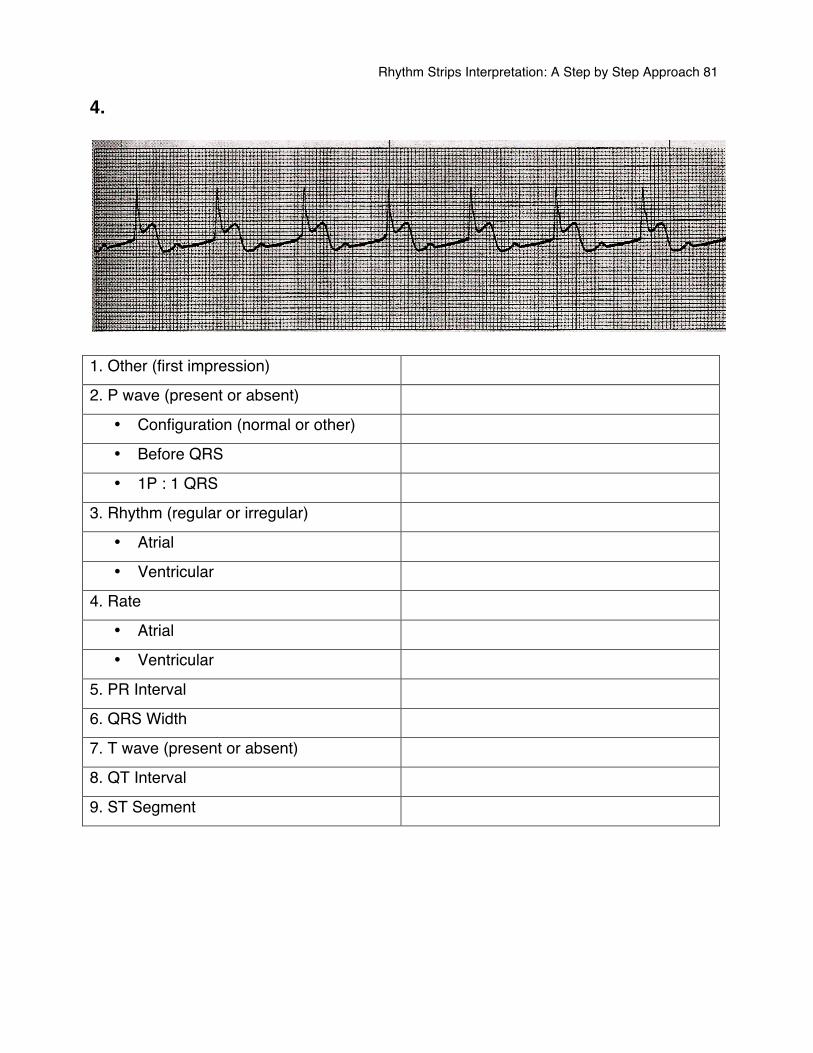
4.
1. Other (first impression)
2. P wave (present or absent)
• Configuration (normal or other)
• Before QRS
• 1P : 1 QRS
3. Rhythm (regular or irregular)
• Atrial
• Ventricular
4. Rate
• Atrial
• Ventricular
5. PR Interval
6. QRS Width
7. T wave (present or absent)
8. QT Interval
9. ST Segment
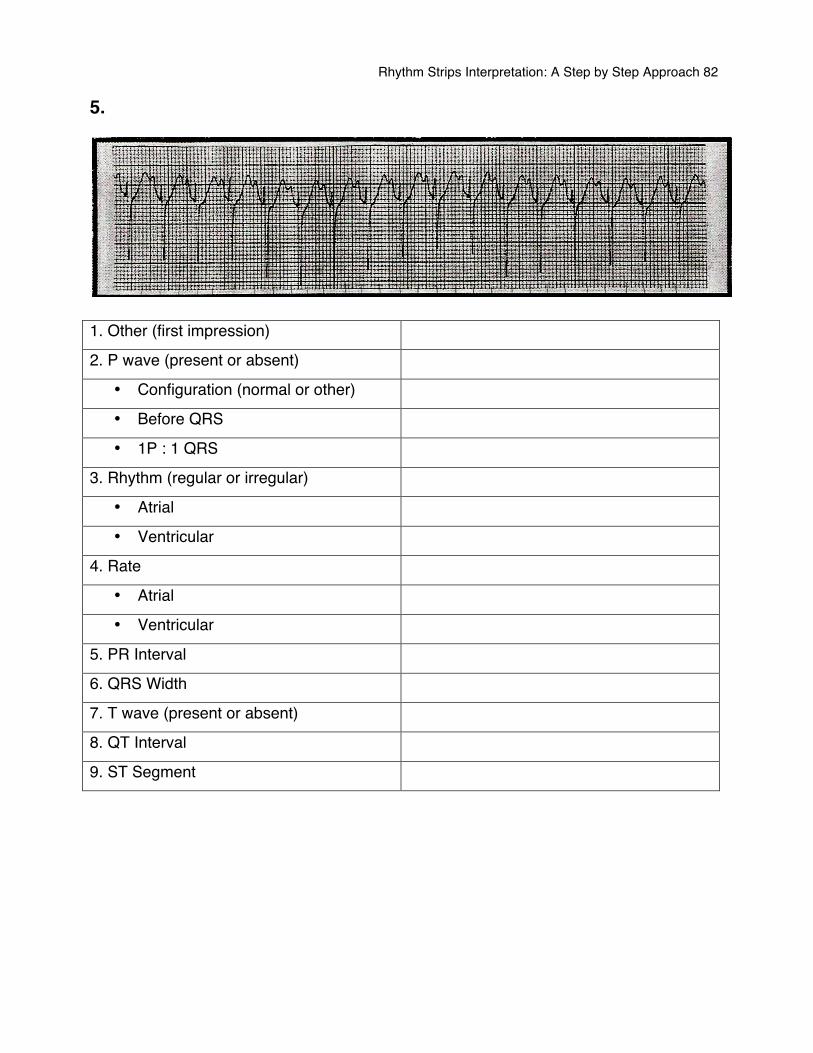
Rhythm Strips Interpretation: A Step by Step Approach 82
5.
1. Other (first impression)
2. P wave (present or absent)
• Configuration (normal or other)
• Before QRS
• 1P : 1 QRS
3. Rhythm (regular or irregular)
• Atrial
• Ventricular
4. Rate
• Atrial
• Ventricular
5. PR Interval
6. QRS Width
7. T wave (present or absent)
8. QT Interval
9. ST Segment
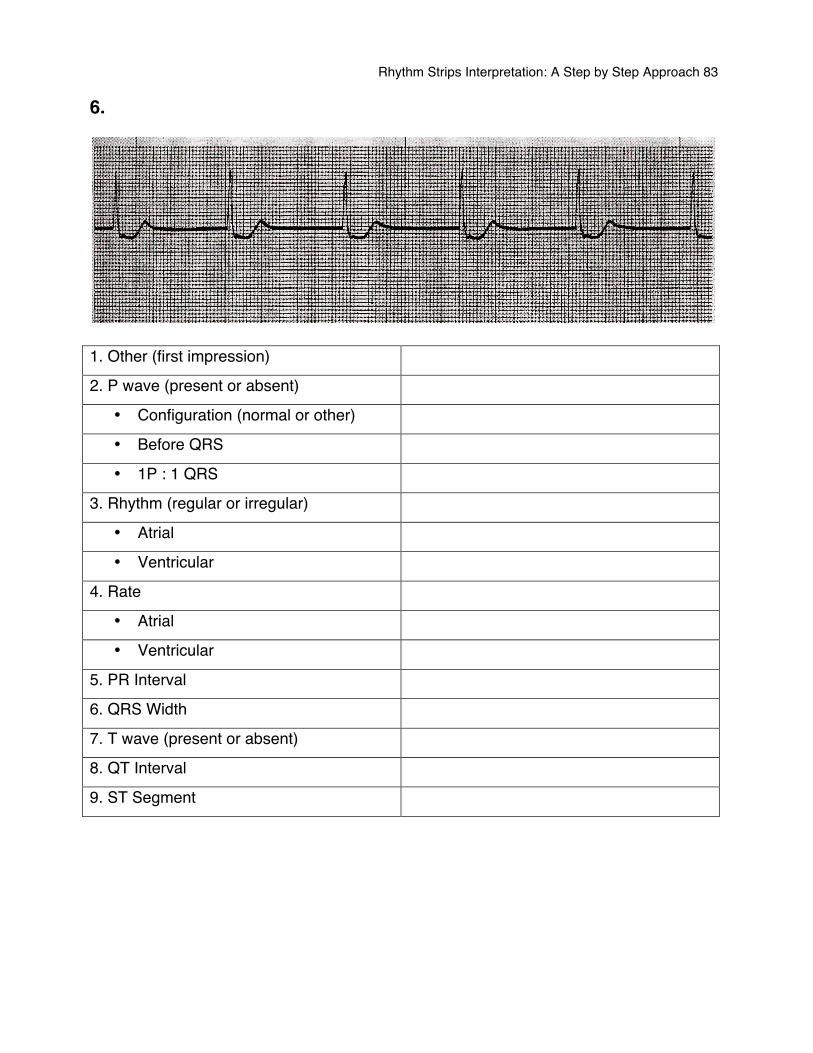
Rhythm Strips Interpretation: A Step by Step Approach 83
6.
1. Other (first impression)
2. P wave (present or absent)
• Configuration (normal or other)
• Before QRS
• 1P : 1 QRS
3. Rhythm (regular or irregular)
• Atrial
• Ventricular
4. Rate
• Atrial
• Ventricular
5. PR Interval
6. QRS Width
7. T wave (present or absent)
8. QT Interval
9. ST Segment
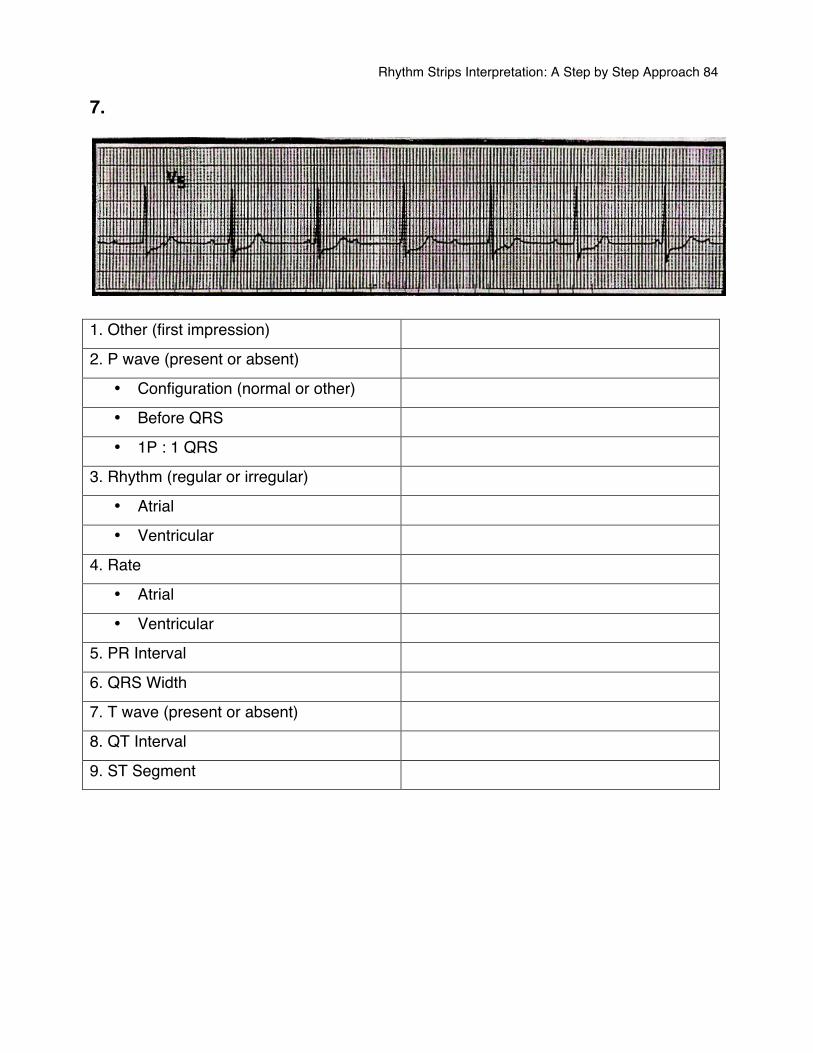
Rhythm Strips Interpretation: A Step by Step Approach 84
7.
1. Other (first impression)
2. P wave (present or absent)
• Configuration (normal or other)
• Before QRS
• 1P : 1 QRS
3. Rhythm (regular or irregular)
• Atrial
• Ventricular
4. Rate
• Atrial
• Ventricular
5. PR Interval
6. QRS Width
7. T wave (present or absent)
8. QT Interval
9. ST Segment
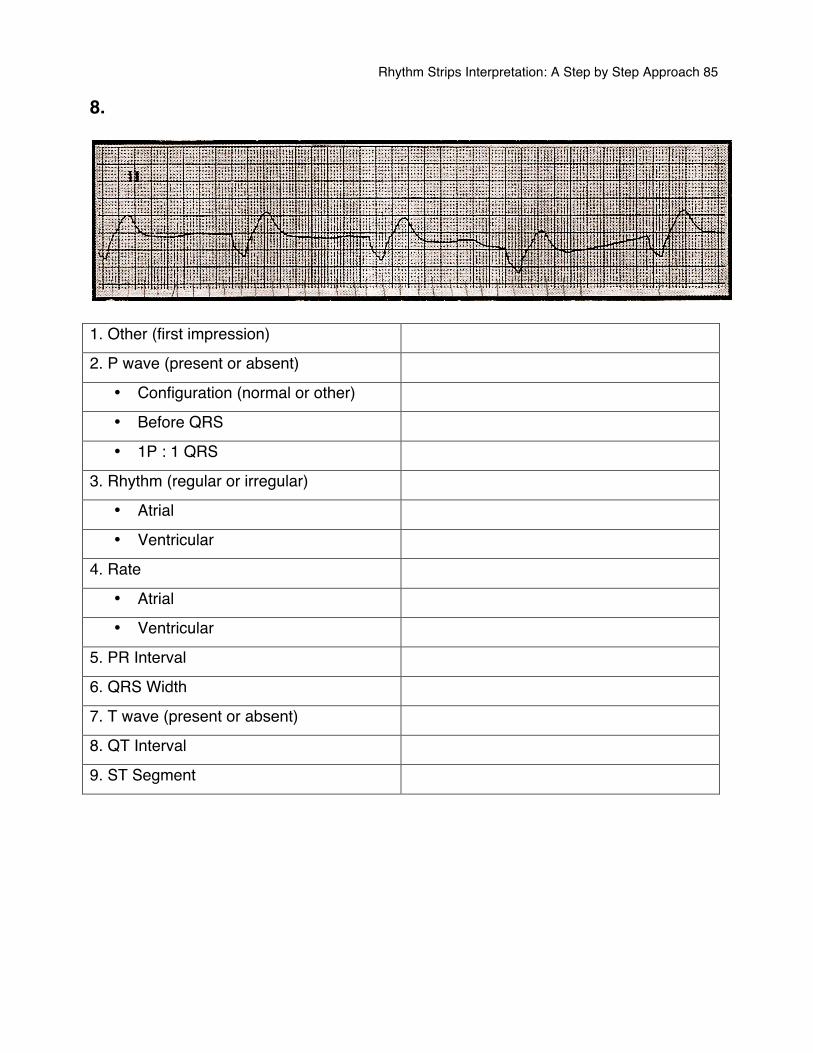
Rhythm Strips Interpretation: A Step by Step Approach 85
8.
1. Other (first impression)
2. P wave (present or absent)
• Configuration (normal or other)
• Before QRS
• 1P : 1 QRS
3. Rhythm (regular or irregular)
• Atrial
• Ventricular
4. Rate
• Atrial
• Ventricular
5. PR Interval
6. QRS Width
7. T wave (present or absent)
8. QT Interval
9. ST Segment
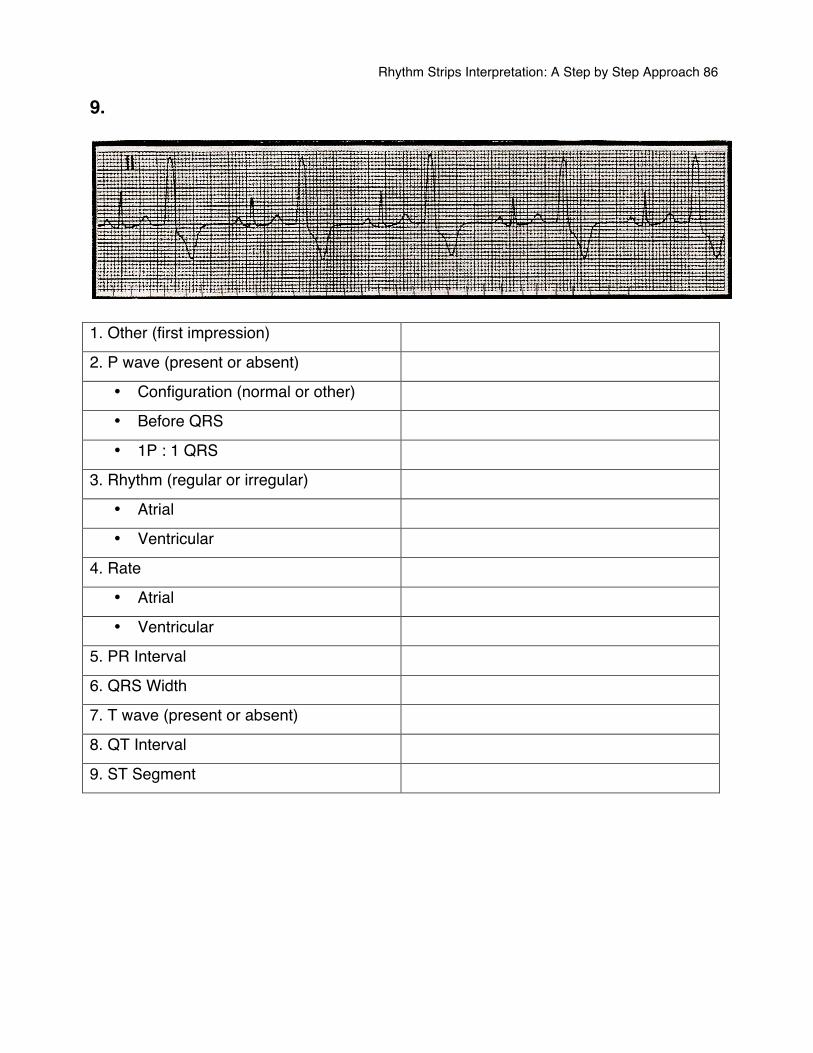
Rhythm Strips Interpretation: A Step by Step Approach 86
9.
1. Other (first impression)
2. P wave (present or absent)
• Configuration (normal or other)
• Before QRS
• 1P : 1 QRS
3. Rhythm (regular or irregular)
• Atrial
• Ventricular
4. Rate
• Atrial
• Ventricular
5. PR Interval
6. QRS Width
7. T wave (present or absent)
8. QT Interval
9. ST Segment
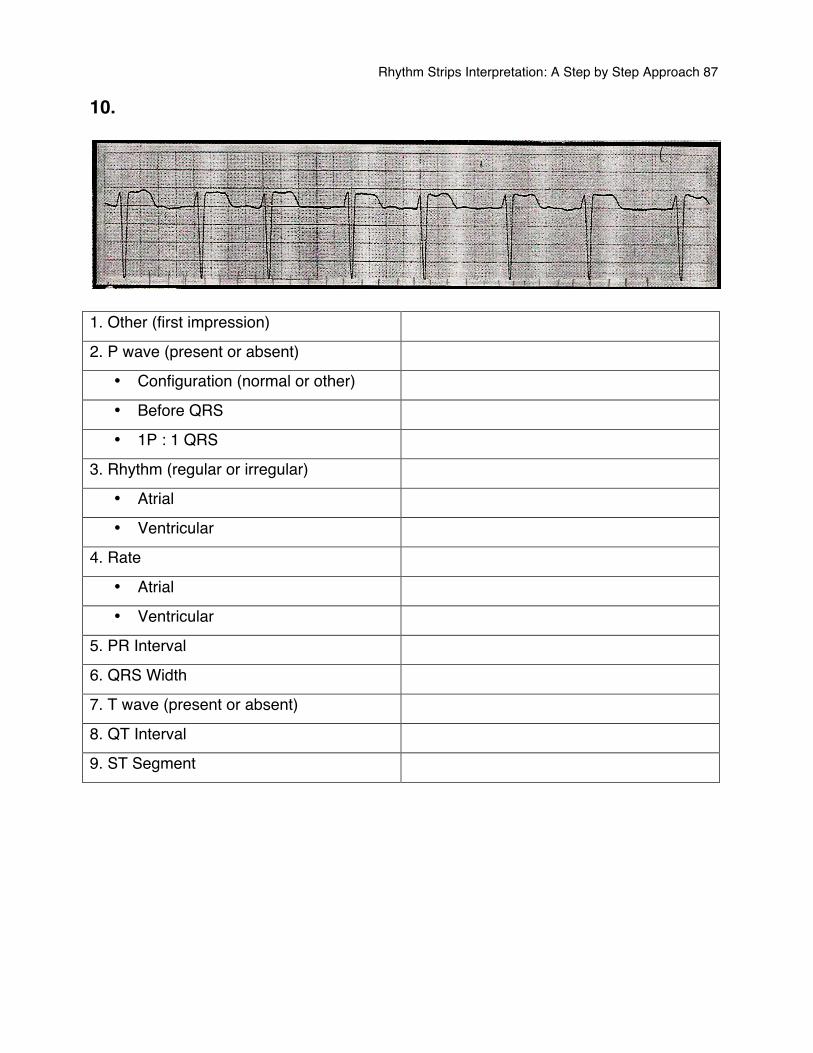
Rhythm Strips Interpretation: A Step by Step Approach 87
10.
1. Other (first impression)
2. P wave (present or absent)
• Configuration (normal or other)
• Before QRS
• 1P : 1 QRS
3. Rhythm (regular or irregular)
• Atrial
• Ventricular
4. Rate
• Atrial
• Ventricular
5. PR Interval
6. QRS Width
7. T wave (present or absent)
8. QT Interval
9. ST Segment
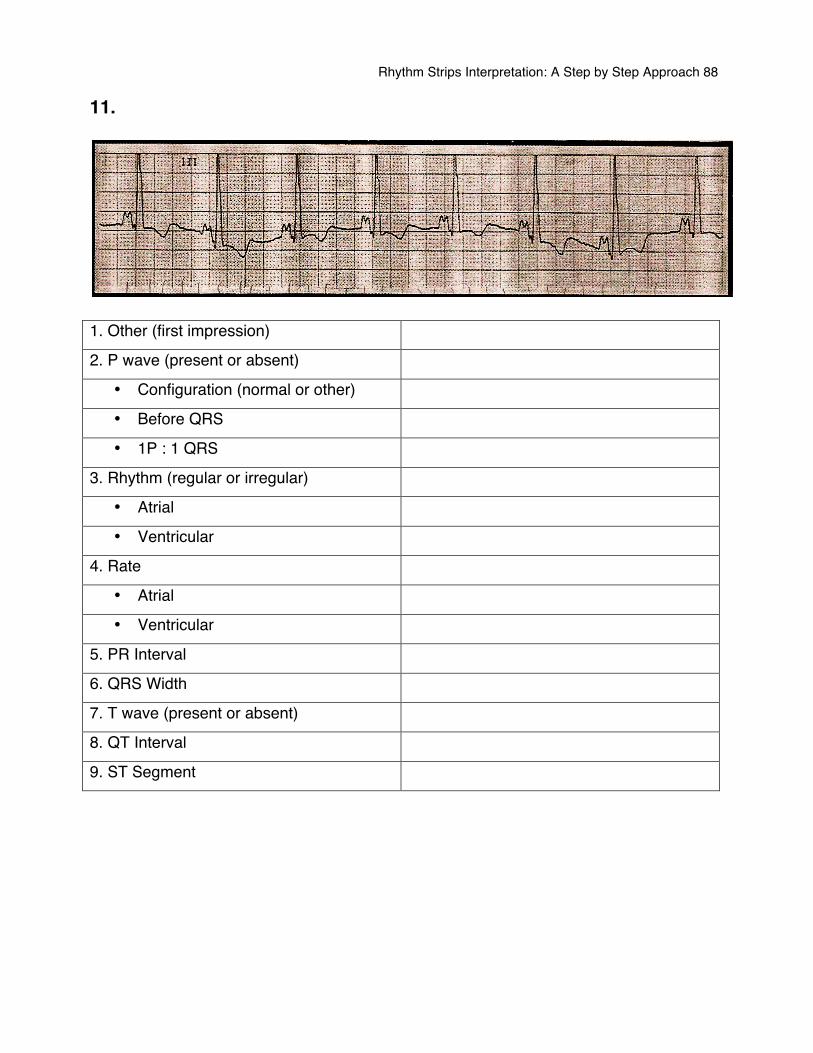
Rhythm Strips Interpretation: A Step by Step Approach 88
11.
1. Other (first impression)
2. P wave (present or absent)
• Configuration (normal or other)
• Before QRS
• 1P : 1 QRS
3. Rhythm (regular or irregular)
• Atrial
• Ventricular
4. Rate
• Atrial
• Ventricular
5. PR Interval
6. QRS Width
7. T wave (present or absent)
8. QT Interval
9. ST Segment
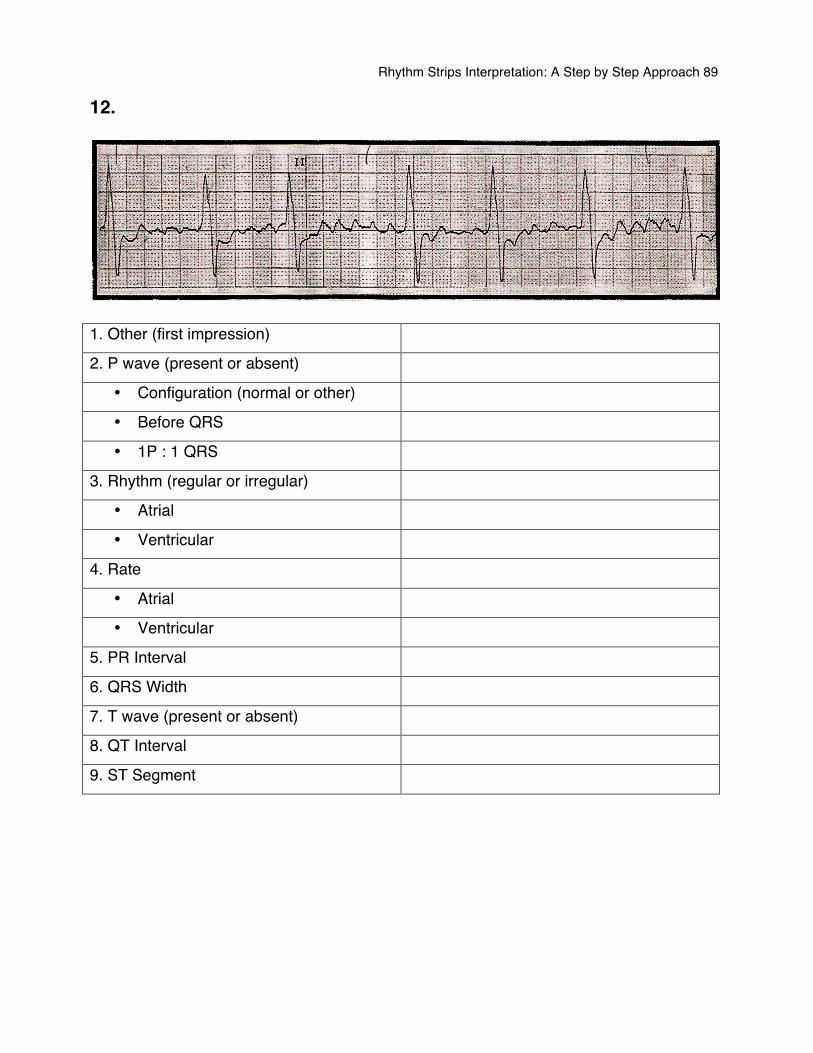
Rhythm Strips Interpretation: A Step by Step Approach 89
12.
1. Other (first impression)
2. P wave (present or absent)
• Configuration (normal or other)
• Before QRS
• 1P : 1 QRS
3. Rhythm (regular or irregular)
• Atrial
• Ventricular
4. Rate
• Atrial
• Ventricular
5. PR Interval
6. QRS Width
7. T wave (present or absent)
8. QT Interval
9. ST Segment
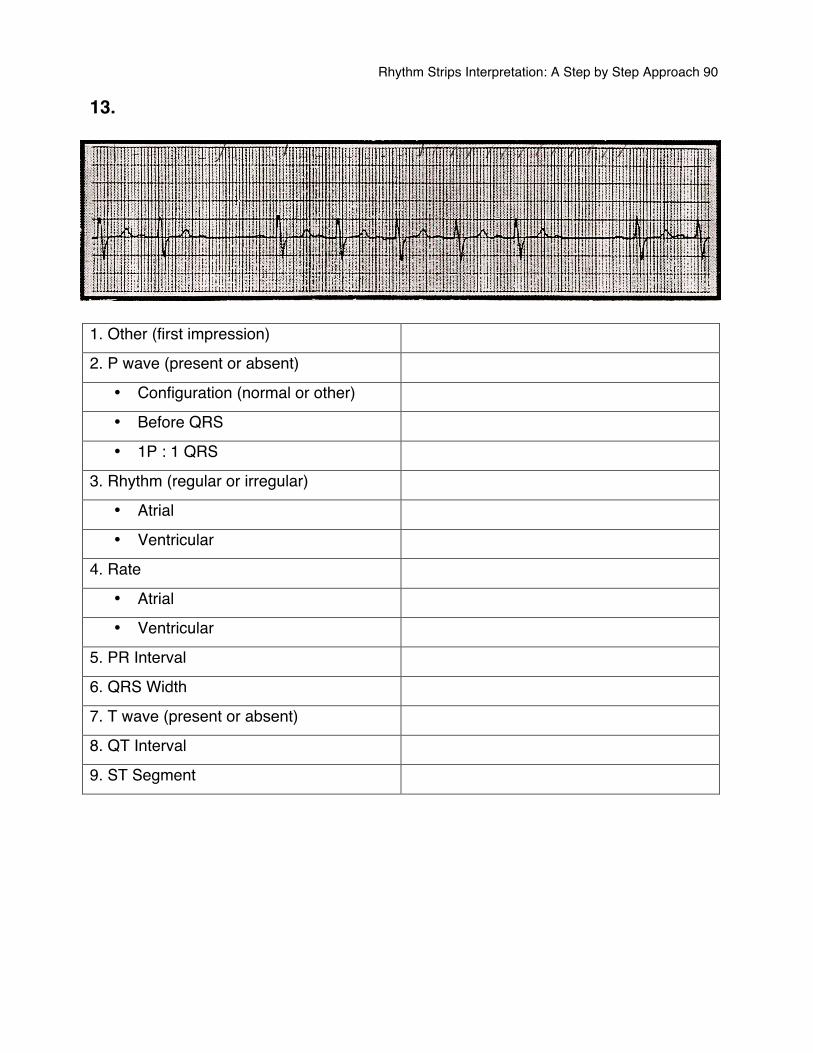
Rhythm Strips Interpretation: A Step by Step Approach 90
13.
1. Other (first impression)
2. P wave (present or absent)
• Configuration (normal or other)
• Before QRS
• 1P : 1 QRS
3. Rhythm (regular or irregular)
• Atrial
• Ventricular
4. Rate
• Atrial
• Ventricular
5. PR Interval
6. QRS Width
7. T wave (present or absent)
8. QT Interval
9. ST Segment
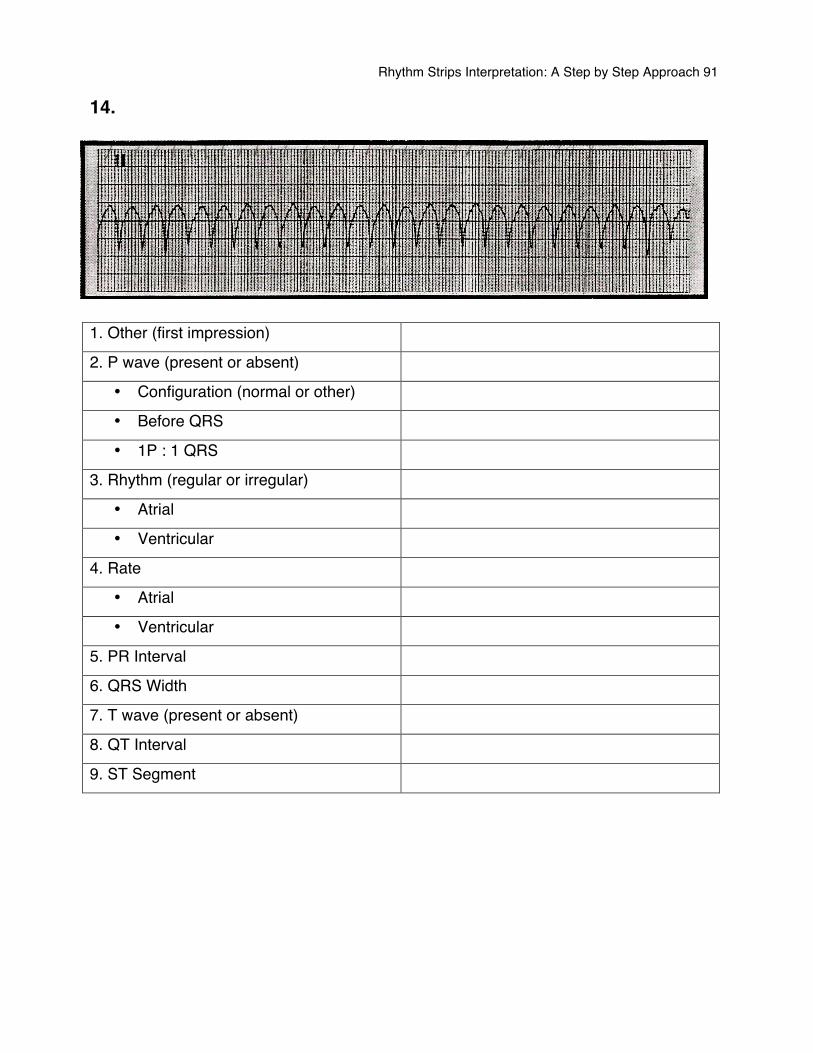
Rhythm Strips Interpretation: A Step by Step Approach 91
14.
1. Other (first impression)
2. P wave (present or absent)
• Configuration (normal or other)
• Before QRS
• 1P : 1 QRS
3. Rhythm (regular or irregular)
• Atrial
• Ventricular
4. Rate
• Atrial
• Ventricular
5. PR Interval
6. QRS Width
7. T wave (present or absent)
8. QT Interval
9. ST Segment
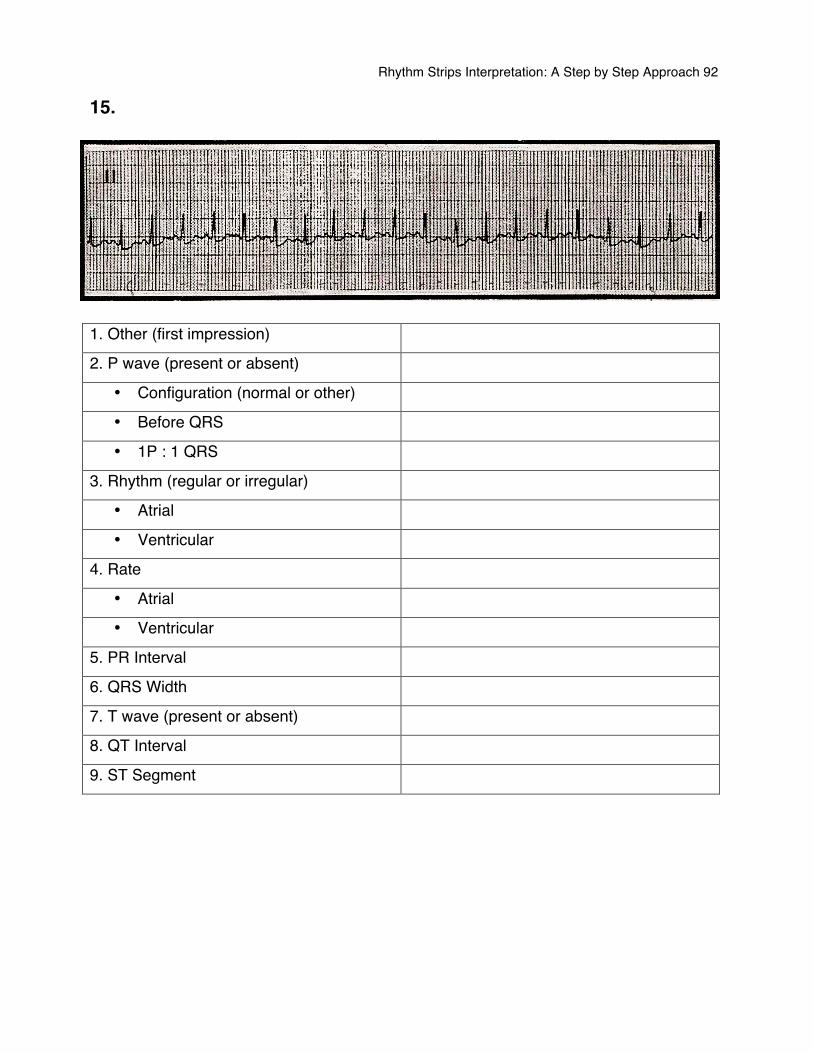
Rhythm Strips Interpretation: A Step by Step Approach 92
15.
1. Other (first impression)
2. P wave (present or absent)
• Configuration (normal or other)
• Before QRS
• 1P : 1 QRS
3. Rhythm (regular or irregular)
• Atrial
• Ventricular
4. Rate
• Atrial
• Ventricular
5. PR Interval
6. QRS Width
7. T wave (present or absent)
8. QT Interval
9. ST Segment
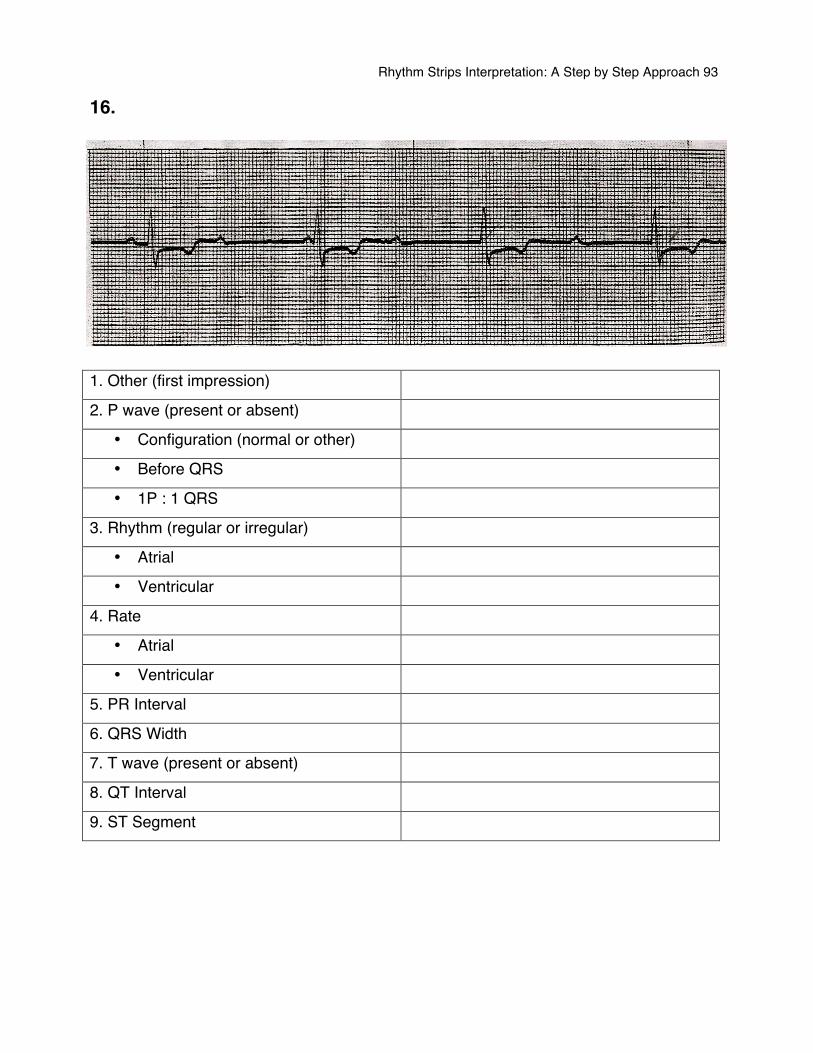
Rhythm Strips Interpretation: A Step by Step Approach 93
16.
1. Other (first impression)
2. P wave (present or absent)
• Configuration (normal or other)
• Before QRS
• 1P : 1 QRS
3. Rhythm (regular or irregular)
• Atrial
• Ventricular
4. Rate
• Atrial
• Ventricular
5. PR Interval
6. QRS Width
7. T wave (present or absent)
8. QT Interval
9. ST Segment
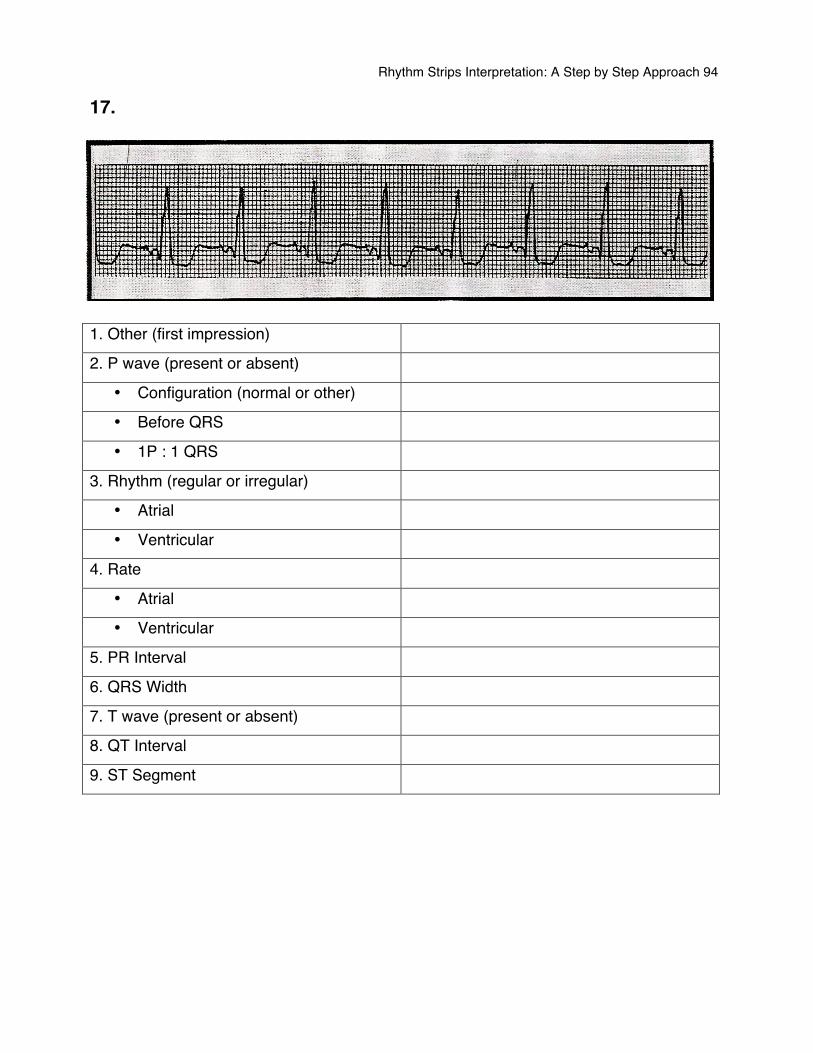
Rhythm Strips Interpretation: A Step by Step Approach 94
17.
1. Other (first impression)
2. P wave (present or absent)
• Configuration (normal or other)
• Before QRS
• 1P : 1 QRS
3. Rhythm (regular or irregular)
• Atrial
• Ventricular
4. Rate
• Atrial
• Ventricular
5. PR Interval
6. QRS Width
7. T wave (present or absent)
8. QT Interval
9. ST Segment
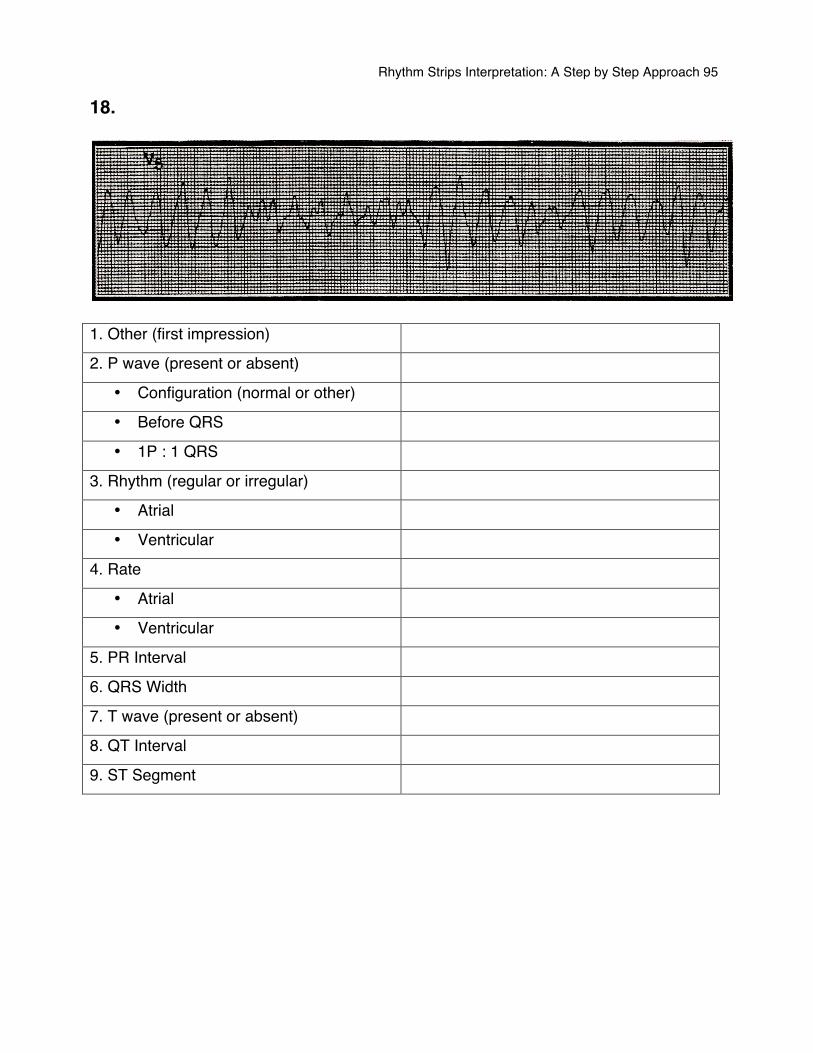
Rhythm Strips Interpretation: A Step by Step Approach 95
18.
1. Other (first impression)
2. P wave (present or absent)
• Configuration (normal or other)
• Before QRS
• 1P : 1 QRS
3. Rhythm (regular or irregular)
• Atrial
• Ventricular
4. Rate
• Atrial
• Ventricular
5. PR Interval
6. QRS Width
7. T wave (present or absent)
8. QT Interval
9. ST Segment
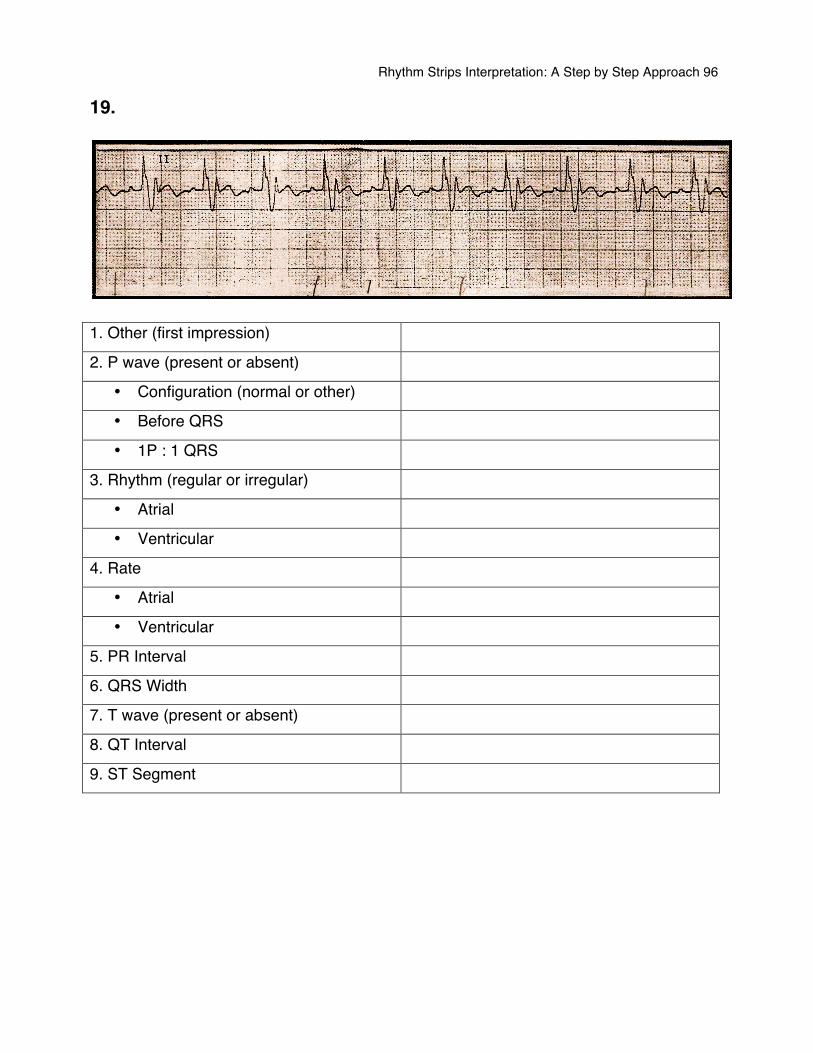
Rhythm Strips Interpretation: A Step by Step Approach 96
19.
1. Other (first impression)
2. P wave (present or absent)
• Configuration (normal or other)
• Before QRS
• 1P : 1 QRS
3. Rhythm (regular or irregular)
• Atrial
• Ventricular
4. Rate
• Atrial
• Ventricular
5. PR Interval
6. QRS Width
7. T wave (present or absent)
8. QT Interval
9. ST Segment
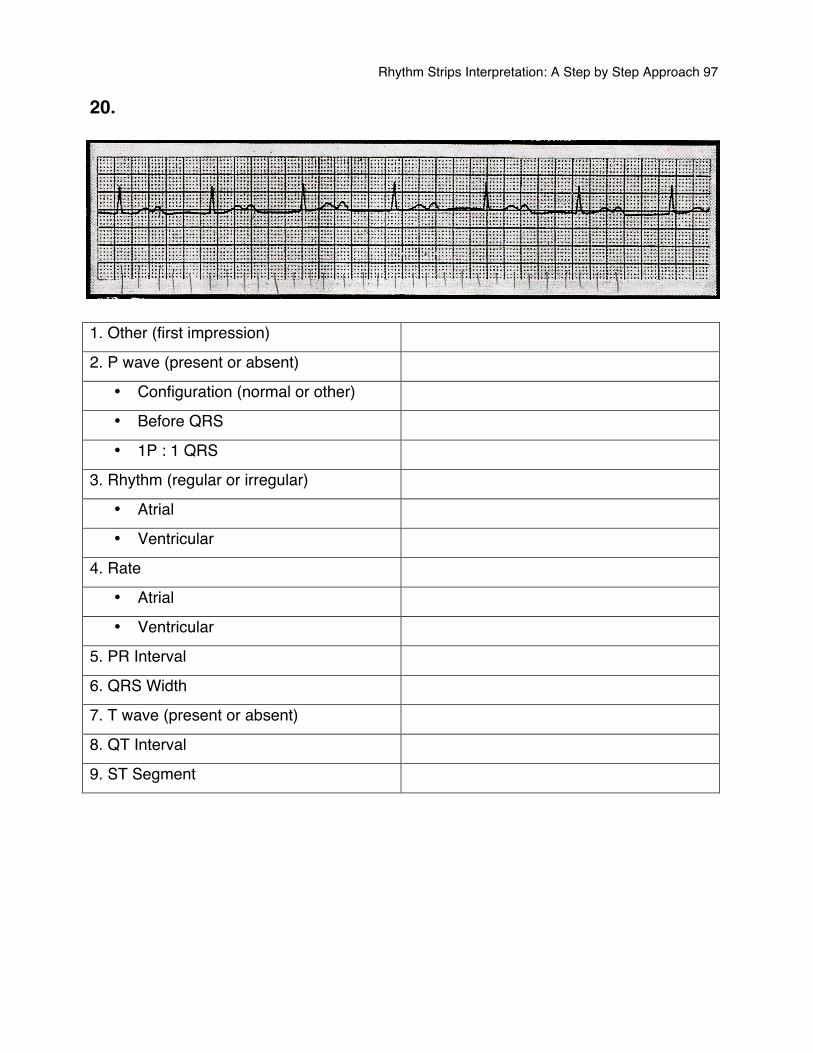
Rhythm Strips Interpretation: A Step by Step Approach 97
20.
1. Other (first impression)
2. P wave (present or absent)
• Configuration (normal or other)
• Before QRS
• 1P : 1 QRS
3. Rhythm (regular or irregular)
• Atrial
• Ventricular
4. Rate
• Atrial
• Ventricular
5. PR Interval
6. QRS Width
7. T wave (present or absent)
8. QT Interval
9. ST Segment
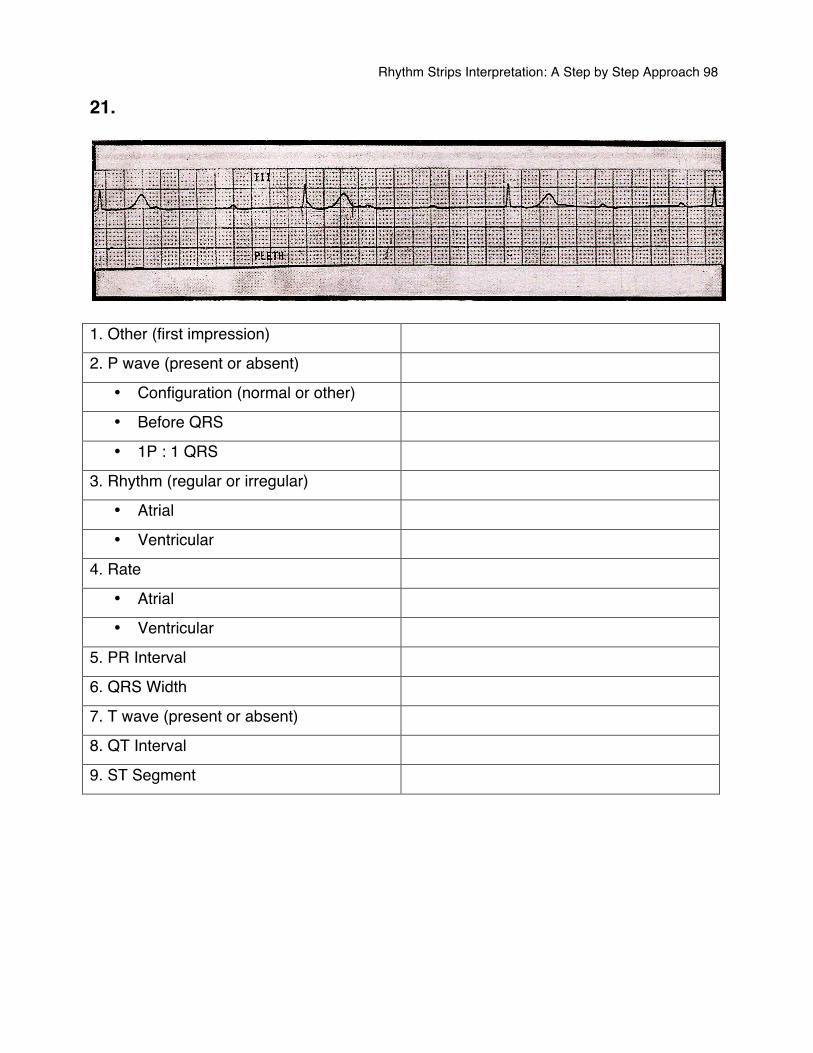
Rhythm Strips Interpretation: A Step by Step Approach 98
21.
1. Other (first impression)
2. P wave (present or absent)
• Configuration (normal or other)
• Before QRS
• 1P : 1 QRS
3. Rhythm (regular or irregular)
• Atrial
• Ventricular
4. Rate
• Atrial
• Ventricular
5. PR Interval
6. QRS Width
7. T wave (present or absent)
8. QT Interval
9. ST Segment
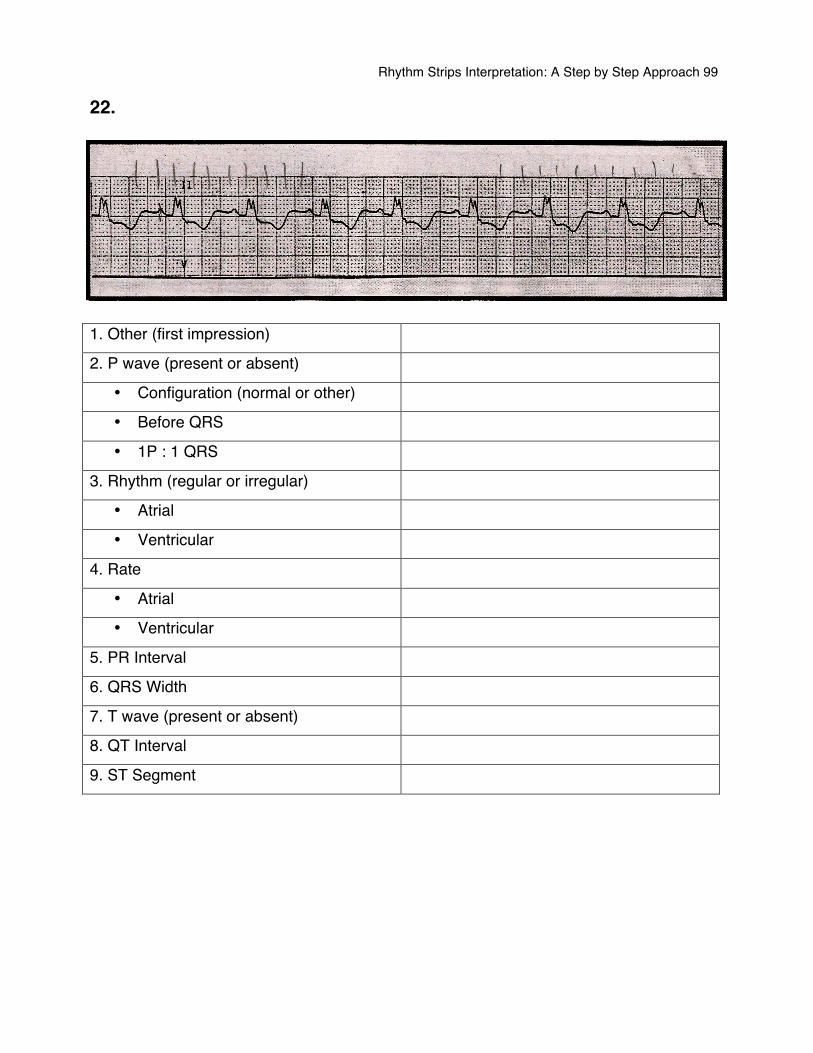
Rhythm Strips Interpretation: A Step by Step Approach 99
22.
1. Other (first impression)
2. P wave (present or absent)
• Configuration (normal or other)
• Before QRS
• 1P : 1 QRS
3. Rhythm (regular or irregular)
• Atrial
• Ventricular
4. Rate
• Atrial
• Ventricular
5. PR Interval
6. QRS Width
7. T wave (present or absent)
8. QT Interval
9. ST Segment
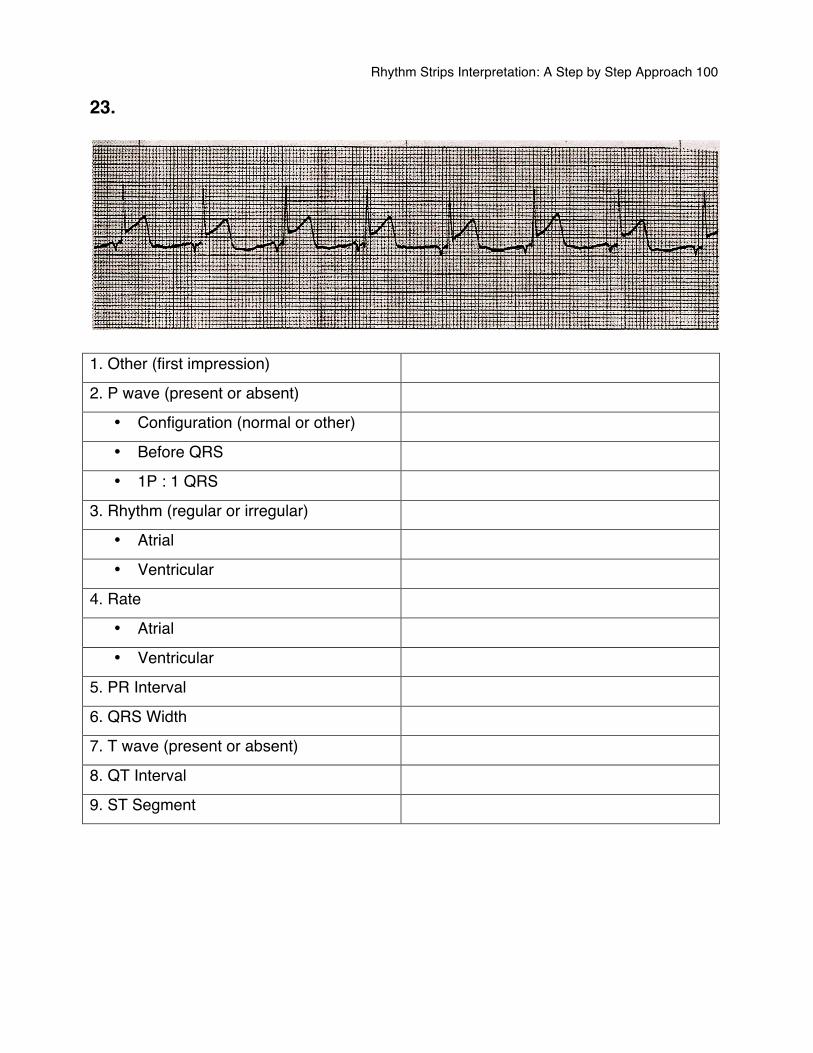
Rhythm Strips Interpretation: A Step by Step Approach 100
23.
1. Other (first impression)
2. P wave (present or absent)
• Configuration (normal or other)
• Before QRS
• 1P : 1 QRS
3. Rhythm (regular or irregular)
• Atrial
• Ventricular
4. Rate
• Atrial
• Ventricular
5. PR Interval
6. QRS Width
7. T wave (present or absent)
8. QT Interval
9. ST Segment
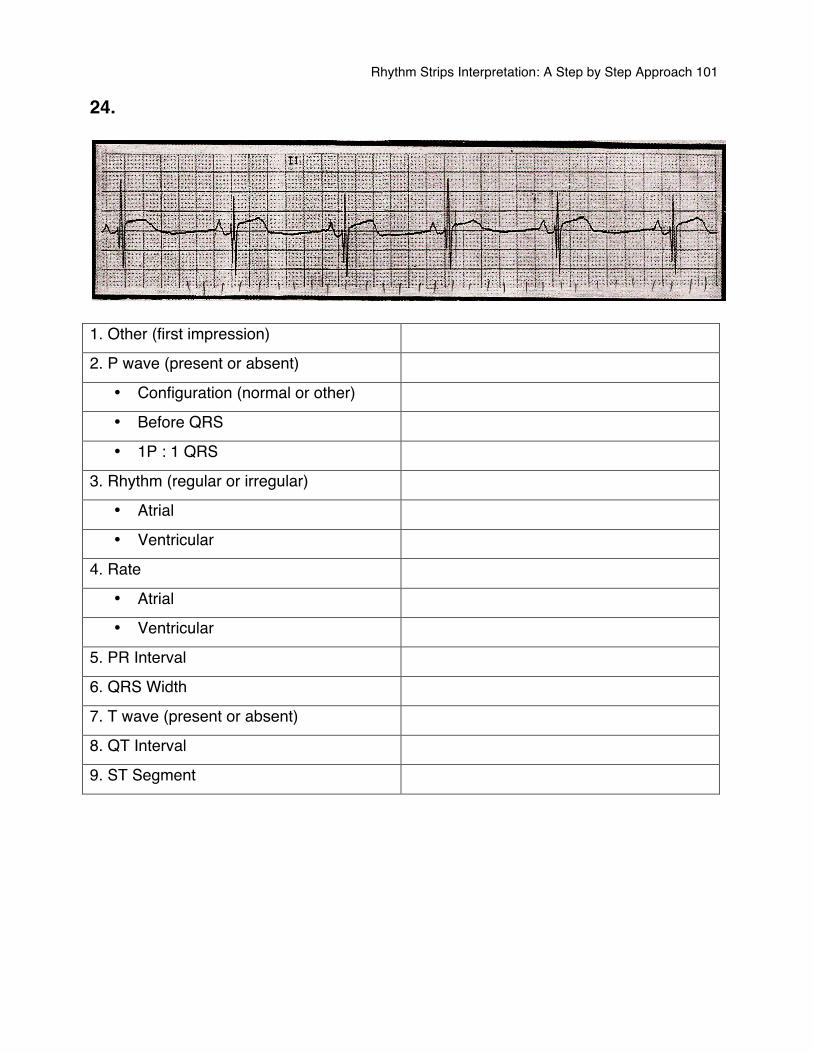
Rhythm Strips Interpretation: A Step by Step Approach 101
24.
1. Other (first impression)
2. P wave (present or absent)
• Configuration (normal or other)
• Before QRS
• 1P : 1 QRS
3. Rhythm (regular or irregular)
• Atrial
• Ventricular
4. Rate
• Atrial
• Ventricular
5. PR Interval
6. QRS Width
7. T wave (present or absent)
8. QT Interval
9. ST Segment
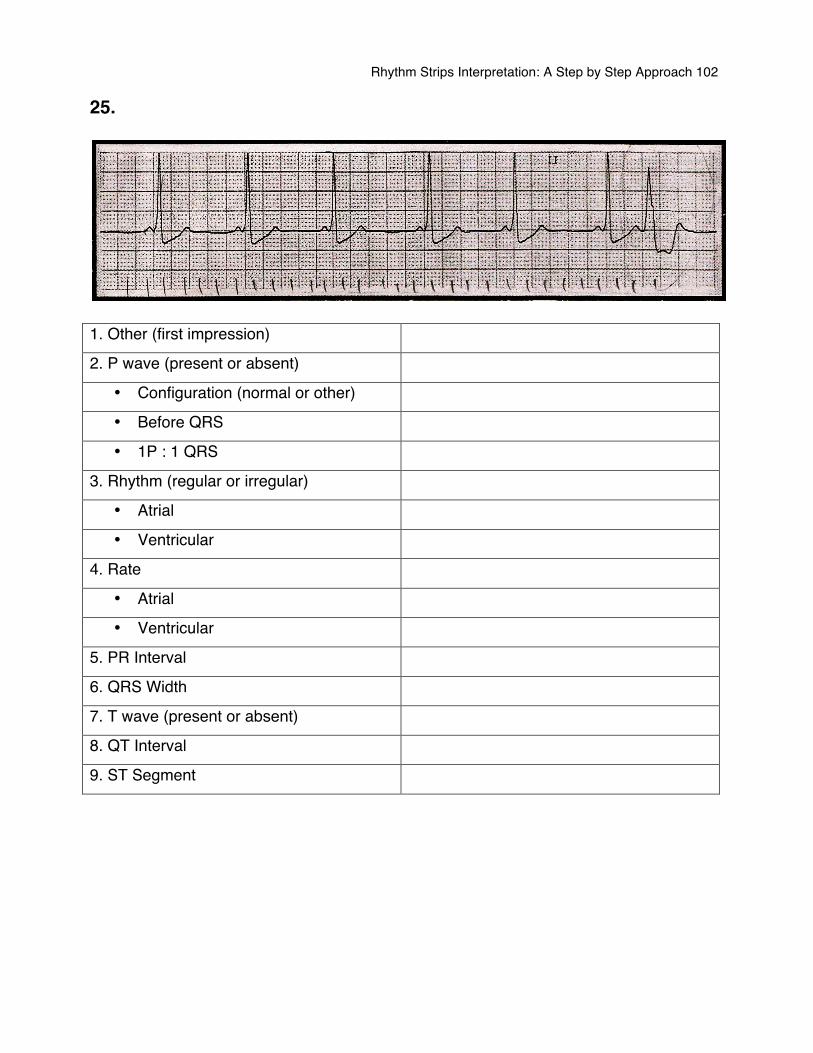
Rhythm Strips Interpretation: A Step by Step Approach 102
25.
1. Other (first impression)
2. P wave (present or absent)
• Configuration (normal or other)
• Before QRS
• 1P : 1 QRS
3. Rhythm (regular or irregular)
• Atrial
• Ventricular
4. Rate
• Atrial
• Ventricular
5. PR Interval
6. QRS Width
7. T wave (present or absent)
8. QT Interval
9. ST Segment
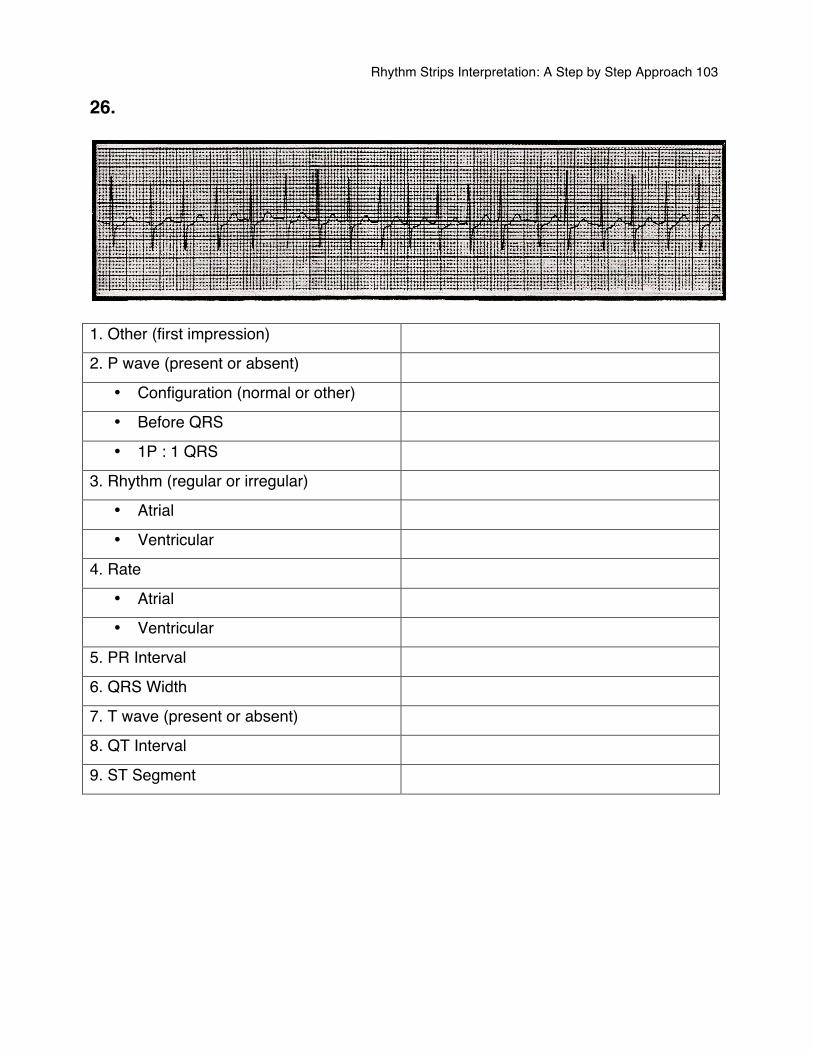
Rhythm Strips Interpretation: A Step by Step Approach 103
26.
1. Other (first impression)
2. P wave (present or absent)
• Configuration (normal or other)
• Before QRS
• 1P : 1 QRS
3. Rhythm (regular or irregular)
• Atrial
• Ventricular
4. Rate
• Atrial
• Ventricular
5. PR Interval
6. QRS Width
7. T wave (present or absent)
8. QT Interval
9. ST Segment
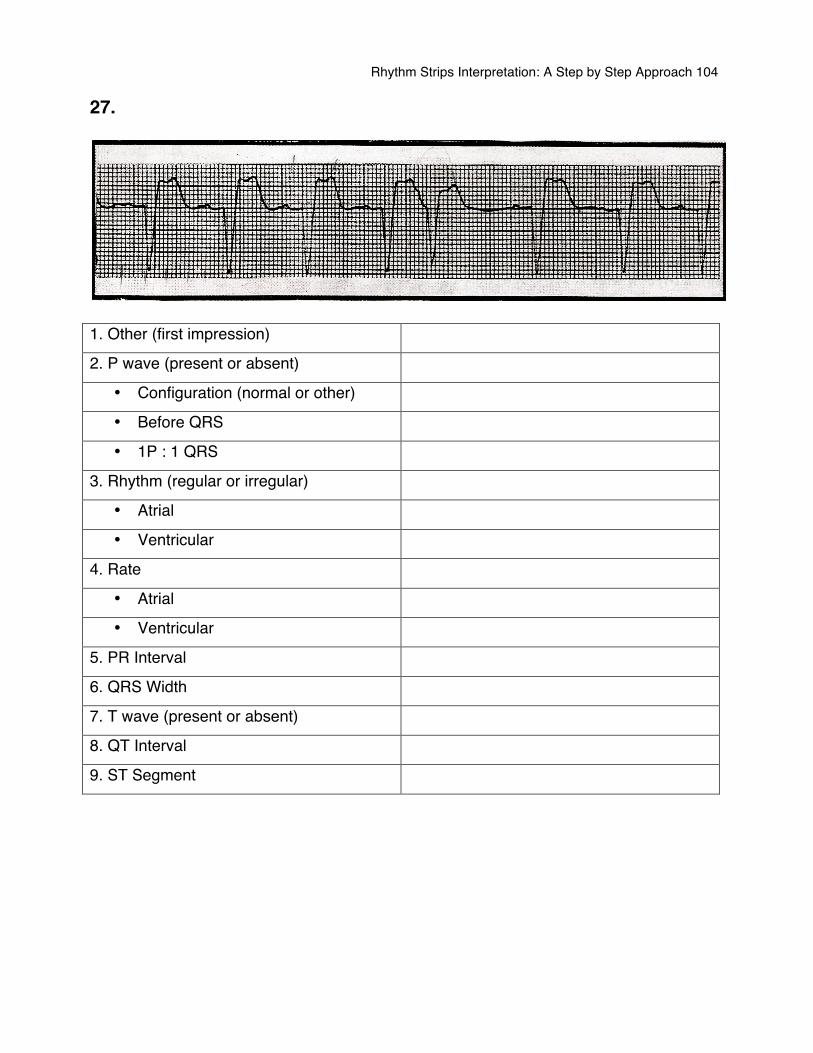
Rhythm Strips Interpretation: A Step by Step Approach 104
27.
1. Other (first impression)
2. P wave (present or absent)
• Configuration (normal or other)
• Before QRS
• 1P : 1 QRS
3. Rhythm (regular or irregular)
• Atrial
• Ventricular
4. Rate
• Atrial
• Ventricular
5. PR Interval
6. QRS Width
7. T wave (present or absent)
8. QT Interval
9. ST Segment
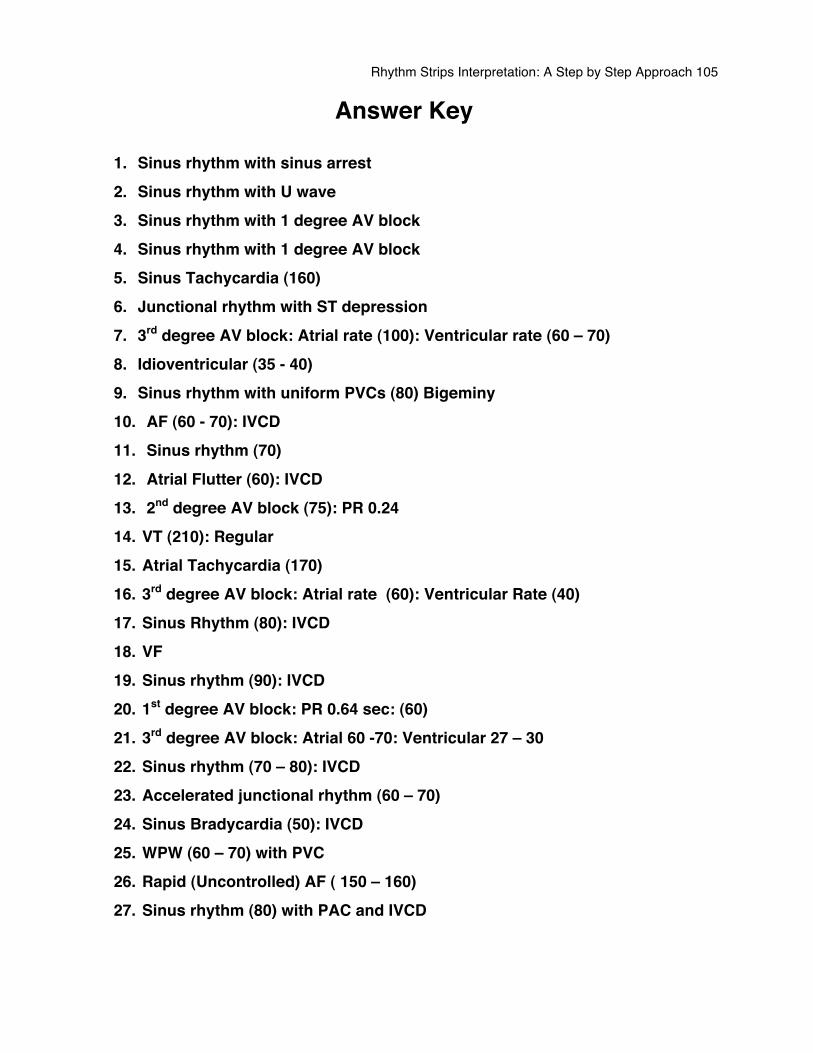
Rhythm Strips Interpretation: A Step by Step Approach 105
Answer Key
1. Sinus rhythm with sinus arrest 2. Sinus rhythm with U wave 3. Sinus rhythm with 1 degree AV block 4. Sinus rhythm with 1 degree AV block 5. Sinus Tachycardia (160) 6. Junctional rhythm with ST depression 7. 3rd degree AV block: Atrial rate (100): Ventricular rate (60 – 70) 8. Idioventricular (35 - 40) 9. Sinus rhythm with uniform PVCs (80) Bigeminy 10. AF (60 - 70): IVCD 11. Sinus rhythm (70) 12. Atrial Flutter (60): IVCD 13. 2nd degree AV block (75): PR 0.24 14. VT (210): Regular 15. Atrial Tachycardia (170) 16. 3rd degree AV block: Atrial rate (60): Ventricular Rate (40) 17. Sinus Rhythm (80): IVCD 18. VF 19. Sinus rhythm (90): IVCD 20. 1st degree AV block: PR 0.64 sec: (60) 21. 3rd degree AV block: Atrial 60 -70: Ventricular 27 – 30 22. Sinus rhythm (70 – 80): IVCD 23. Accelerated junctional rhythm (60 – 70) 24. Sinus Bradycardia (50): IVCD 25. WPW (60 – 70) with PVC 26. Rapid (Uncontrolled) AF ( 150 – 160) 27. Sinus rhythm (80) with PAC and IVCD
Rhythm Strips Interpretation: A Step by Step Approach 106
References 1. American Heart Association (2006) Advanced cardiac life support provider manual. Dallas, Texas. www.americanheart.org 2. Conover, M.B. (2002). Understanding Electrocardiography, (8th ed). Mosby
publications. Missouri. 3. Davis, D. (1992). How to quickly and accurately master ECG interpretation (2nd
ed). Lippincott Co. Philadelphia.
4. Gonce Morton, p., Fontaine, D.K., Hudak, C.M., Gallo, B.M. (2005). Critical
Care Nursing: A Holistic Approach. Lippincott William & Wilkins. Philadelphia.
5. Guyton, A.C. & Hall, J.E. (2006). Textbook of medical physiology, (11th Ed).
Copyright 2006, Elsevier publications. 6. Houghton, A.R. & Gray, D. (2003). Making sense of ECG (2nd ed). Oxford
University press. New York. 7. Huff, J. (2005). ECG workout: Exercises in arrhythmia interpretation (5th ed).
Lippincott Co. 8. Macfarlane, P.S., Reid, R., Callander, R. (2000). Pathology illustrated (5th ed).
Churchill Livingstone an imprint of Harcourt publisher limited. London UK. 9. Seeley, Stephens, & Tate (2002). Essentials of anatomy and physiology. (4th ed).
McGraw-Hill Higher Education. New York. 10. Stuart Ira Fox (2002). Human Physiology, (7th ed.). McGraw-Hill publishing. New
York.