Embed Size (px)
Citation preview

A N N U A L R E P O R T 2 0 1 6
RIN
GK
JØB
ING
LA
ND
BO
BA
NK
Rasm
usse
ns B
ogtr
ykke
ri, R
ingk
øbin
g
AN
NU
AL
RE
PO
RT
20
16
Ringkjøbing Landbobank A/S Torvet 1 DK-6950 RingkøbingDenmark
Telephone +45 9732 1166
Telefax +45 7624 4913
Web www.landbobanken.com
CVR-no. 37 53 68 14
SWIFT RINGDK22


A N N U A L R E P O R T 2 0 1 6 PA G E 1
C O N T E N T S
Page 2 Dear shareholder 3 Annual report - highlights 3 Main and key figures
Management’s review: 6 Financial review 17 Capital structure 21 Risks and risk management 33 Corporate governance 37 Diversity in the board of directors 38 The under-represented gender 39 Corporate social responsibility 40 Information on listed companies
Statement and reports: 44 Management statement 45 Auditors’ reports
Financial statements: 52 Statements of income and comprehensive income 52 Proposed distribution of profit 53 Core earnings 54 Balance sheet 56 Statement of changes in equity 57 Statement of capital 58 Cash flow statement 60 Accounting policies 65 Accounting estimates and assessments 66 Overview of notes 67 Notes 92 Five-year main figures 94 Five-year key figures
Other information: 98 Shareholders’ committee 99 Board of directors 105 General management 106 Company information 107 Stock exchange reports 107 Financial calendar 108 The bank’s branches etc.

PA G E 2 R I N G K J Ø B I N G L A N D B O B A N K A / S
DEAR SHAREHOLDER
2016 was a really good year for Ringkjøbing Landbobank. The profit of DKK 661 million before tax is the best in the bank’s history, and results in a 21% return on equity. The bank’s core earnings also exceeded expectations at DKK 617 million. These results were achieved on the basis of a very good increase in customer numbers, which led to a 3% increase in the bank’s loans and an 8% increase in deposits.
We again saw a year with high levels of customer satisfaction and willingness to recommend the bank to others. The mantra "the Customer is King" is not new to Ringkjøbing Land-bobank, and our strong focus on customers is valued by our customers and staff. Trust, a high level of expertise and fast decision-making have been keywords for the many new customers we welcomed in 2016.
This was another year with modest growth and a record low interest rate level in Den-mark. The very low rate of inflation ensured consumers a handsome real-earnings incre-ase and employment was high. This combination resulted in an increase in consumer spending without an increase in the granting of credit. Exports, on the other hand, were hampered by international events such as Brexit and the US election.
We expect the rising trend in consumer spending to continue and exports to develop positively. Growth will thus increase in 2017. However, the long list of threats to the in-ternational economy and trade and the continuing substantial global imbalances could derail the positive development.
The general meeting is recommended to approve an increase in ordinary dividend to DKK 36 per share. A new buy-back programme for up to DKK 170 million is also proposed. 62% of the bank’s profit will thus be paid to shareholders, and the rest will be transferred to equity to support future growth in the bank’s lending.
The bank’s rate of costs was 32.3, and we thus remain the most efficient bank in Den-mark. This is a situation we are happy about because it makes us very competitive and makes our results highly robust, for the benefit of all our stakeholders.
The bank’s highly skilled employees again did a fantastic job in 2016. Their expertise, stability, loyalty and fighting spirit are an unsurpassed combination.
We expect 2017 to be an interesting year, in which our main task will be to serve our cur-rent customers and continue to increase our market share with additional new customers. We expect core earnings in the range DKK 515 - 615 million, to which the result for the securities portfolio must be added.
Finally we would like to thank our customers and shareholders for the high level of sup-port which they have shown the bank.
John Bull Fisker Jørn Nielsen

A N N U A L R E P O R T 2 0 1 6 PA G E 3
MAIN AND KEY FIGURES 2016 2015 2014 2013 2012Main figures for the bank (million DKK)Total core income 983 954 907 844 823Total expenses and depreciation -318 -306 -298 -273 -265Core earnings before impairments 665 648 609 571 558Impairment charges for loans etc. -48 -60 -87 -120 -157Core earnings 617 588 522 451 401Result for the portfolio etc. +44 0 +65 +21 +47Profit before tax 661 588 587 472 448Net profit for the year 539 459 446 358 328
Equity 3,555 3,296 3,099 2,901 2,676Deposits 18,314 16,987 15,450 14,114 12,867Loans 17,482 17,017 14,924 13,849 12,424Balance sheet total 24,258 22,317 21,238 19,583 17,682Guarantees 2,460 2,234 2,218 1,902 1,667
Key figures for the bank (per cent)Return on equity before tax, beginning of year 20.9 19.8 21.1 18.1 18.5Return on equity after tax, beginning of year 17.1 15.4 16.0 13.7 13.6Rate of costs 32.3 32.1 32.8 32.4 32.2Common equity tier 1 capital ratio 16.9 17.1 17.5 18.7 19.6Tier 1 capital ratio 16.9 17.1 17.5 19.2 20.9Total capital ratio 18.3 18.8 17.5 20.0 22.4Individual solvency requirement 9.0 9.0 8.9 8.9 8.0
Key figures per DKK 5 share (DKK)Core earnings 138 129 112 94 83Profit before tax 148 129 126 99 93Net profit for the year 121 100 95 75 68Book value 795 721 664 607 553Price, end of year 1,463 1,500 1,152 1,099 770Dividend 36 30 26 25 14
ANNUAL REPORT - HIGHLIGHTS
• The best profit in the bank’s history• 12% improvement in profit before tax to DKK 661 million, equivalent to a 21% return on equity• Core earnings increased to DKK 617 million, exceeding expectations • High levels of customer satisfaction and willingness to recommend the bank• The rate of costs was 32.3 - the lowest in Denmark• Increase in loans of 3% and in deposits of 8%• Proposed dividend raised from DKK 30 to DKK 36 per share. A new buy-back programme for
up to DKK 170 million is also proposed, increasing the total pay-out ratio to 62%• Expectations for core earnings of DKK 515 - 615 million in 2017, plus the result for the portfolio

PA G E 4 R I N G K J Ø B I N G L A N D B O B A N K A / S

A N N U A L R E P O R T 2 0 1 6 PA G E 5
M A N A G E M E N T ’ S R E V I E W
Page 6 Financial review 17 Capital structure 21 Risks and risk management 33 Corporate governance 37 Diversity in the board of directors 38 The under-represented gender 39 Corporate social responsibility 40 Information on listed companies

PA G E 6 R I N G K J Ø B I N G L A N D B O B A N K A / S
F I N A N C I A L R E V I E W
Financial reviewProfit before tax increased by 12% to DKK 661 million, which equates to a 21% return on equity. Core earnings show an increase of 5% to DKK 617 million and are thus above the upwardly adjusted DKK 525 - 600 million range.
Both profit before tax and core earnings are the best in the bank’s history and conside-red highly satisfactory.
Core incomeTotal core income increased by 3% from DKK 954 million in 2015 to DKK 983 million in 2016. The bank considers the increase highly satisfactory given the market conditions for the sector.
Net interest income was DKK 665 million in 2016 compared to DKK 638 million in 2015, an increase of 4%. In 2016, the bank earned extraordinary one-off interest in-come of approximately DKK 13 million from early repayment of longer-term loans. After adjusting for this, interest income in 2016 thus increased by 2% compared to 2015. The increase in net interest income should be compared to a 3% increase in lending, exclu-ding reverse repo transactions. Net interest income is thus still influenced by competi-tion in the sector, a changed mix of loans and the continuing low interest rate level.
Fee, commission and foreign exchange income amounted to net DKK 271 million in 2016 compared to net DKK 275 million in 2015, a fall of 1%. This development reflects opposite trends. Income decreased in 2016 due to lower income from the conversion of mortgage loans. The decrease can also be attributed to lower income from trading and
328 36
8 417
511
609
696 73
5
753
758
767 82
3 844
907 95
4 983
200
300
400
500
600
700
800
900
1.000
2002
2003
2004
2005
2006
2007
2008
2009
2010
2011
2012
2013
2014
2015
2016
Mill
ion
DK
K
Core income
,

A N N U A L R E P O R T 2 0 1 6 PA G E 7
the loss of subscription commissions concerning investment fund certificates. The fact that the bank started to receive an outsourcing fee for tasks performed in connection with the investment fund certificates is pulling in the opposite direction. There was also an increase in guarantee commission and other fee income, among others from insu-rance.
Net fee, commission and foreign exchange income was derived as follows:
(Million DKK) 2016 2015Securities trading 41 48Asset management and custody accounts 97 106Payment handling 20 17Loan fees 6 13Guarantee commission and mortgage credit commission 65 56Other fees and commission 26 19Foreign exchange income 16 16Total 271 275
Earnings from sector shares increased by DKK 2 million to DKK 39 million in 2016. The earnings for the year derive primarily from return on the bank’s ownership in DLR Kredit, BankInvest Holding and PRAS.
Costs and depreciationTotal costs including depreciation and write-downs on tangible assets were DKK 318 million in 2016 compared to DKK 306 million last year, an increase of 4%.
Expenses for the Guarantee Fund and the Resolution Fund decreased by DKK 15 million to DKK 2 million in 2016 compared to DKK 17 million in 2015.
On the other hand, the bank had higher costs due to its growth strategy. The bank increased its staff during the year, spent more money on national marketing via adverti-sements and TV commercials, and head office was expanded by a big new lease, which was thoroughly renovated and fitted up as bank premises during the year. As the new lease was taken into use, the bank’s own premises at Torvet in Ringkøbing were reno-vated. In 2016, the bank also invested in TV and video-conference equipment with a view to ensuring cohesion between the different branches and increasing efficiency.
Finally, the bank had higher IT expenses in 2016. The bank is a co-owner of the data centre, Bankdata, and uses it as its primary supplier and partner. The bank’s proportio-nate share of the data centre’s costs increased during the year. In addition, expenses in Bankdata’s basic budget are increasing as a result of its ambitious IT strategy. Bankdata has also solved a record number of legislation and sector-related IT tasks in recent years, which will continue in the next few years. In addition the bank paid IT expenses for the digitalisation of processes and the implementation of MobilePay as part of its product range.

PA G E 8 R I N G K J Ø B I N G L A N D B O B A N K A / S
F I N A N C I A L R E V I E W
The rate of costs was unchanged relative to the 2015 level and was computed at 32.3 for 2016, which continues to be the lowest in Denmark.
Impairment charges for loansImpairment charges for loans amounted to DKK 48 million compared with DKK 60 million in the previous year. The falling trend from previous years thus continues for impairment charges, which are equivalent to 0.2% of the total average of loans and guarantees, compared to 0.3% in 2015.
The average credit quality of the bank’s loans portfolio in general improved marginally compared to 2015.
During 2016, individual impairment charges were reversed on a number of customers. The bank also terminated and wrote off a small quantity of agricultural exposures during the financial year. These two circumstances contributed to a reduction of the bank’s total balance of individual impairment charges during the financial year, from DKK 665 million at the beginning of the year to DKK 589 million at the end of the year.
The bank expects poor financial results for livestock farmers for 2016, in particular for dairy farmers. Many livestock farmers must thus be expected to have negative earnings in 2016.
On this basis, the bank assessed that there was a need to increase collective impairment charges by DKK 68 million, from DKK 273 million at the beginning of the year to DKK 341 million at the end of the year. The increased collective impairment charges are thus mainly related to the livestock farmers in the bank’s agricultural portfolio.
32.3
32.1
32.8
32.4
32.2
32.4
31.6
31.6
32.4
33.7
34.2
37.2
44.1
44.3
47.3
10 20 30 40 50
201620152014201320122011201020092008200720062005200420032002
Percent
Rate of costs

A N N U A L R E P O R T 2 0 1 6 PA G E 9
Given the current prices to producers and the outlook for livestock production in Den-mark, the bank expects that the majority of pig and dairy producers again have pro-spects of profitable production in 2017.
The bank’s total account for impairment charges and provisions was DKK 937 million at the end of the year, equivalent to 4.5% of total loans and guarantees.
Actual losses on loans for the year, less interest on the impaired part of loans and recei-vables previously written off, were on a par with the impairment charges recognised as expenses. Total impairment charges and provisions for the year thus decreased only marginally, by DKK 6 million.
The portfolio of loans with suspended calculation of interest amounts to DKK 60 million, equivalent to 0.3% of the bank’s total loans and guarantees at the end of the year. The portfolio thus decreased compared with the end of 2015, when the amount was DKK 74 million.
On the basis of the quality of the bank’s loans portfolio and prospects for economic development in the coming year, the bank expects total impairment charges in 2017 to be lower than in 2016.
From the beginning of 2018, new impairment rules based on the IFRS 9 will enter into force. The implementation of these rules is not expected to materially influence the bank’s situation.
Core earnings
(Million DKK) 2016 2015 2014 2013 2012 2011 2010 2009 2008 2007Total core income 983 954 907 844 823 767 758 753 735 696Total expenses etc. -318 -306 -298 -273 -265 -248 -240 -238 -239 -234Core earnings before impairment charges 665 648 609 571 558 519 518 515 496 462Impairment charges for loans -48 -60 -87 -120 -157 -129 -138 -159 -77 +11Core earnings 617 588 522 451 401 390 380 356 419 473
Core earnings were DKK 617 million, compared with DKK 588 million last year, an increase of 5% and the best in the bank’s history. At the beginning of the year, the bank announced expected core earnings for the year in the DKK 475 - 575 million range. This range was upwardly adjusted to DKK 525 - 600 million in connection with the presen-tation of the bank’s interim report, and the core earnings realised are thus above the upwardly adjusted range.
Result for the portfolio and market riskThe result for the portfolio for 2016 was DKK 44 million, including funding costs for the portfolio. The falling interest rate level in 2016 positively affected the result for the portfolio.
PA G E 1 0 R I N G K J Ø B I N G L A N D B O B A N K A / S
F I N A N C I A L R E V I E W
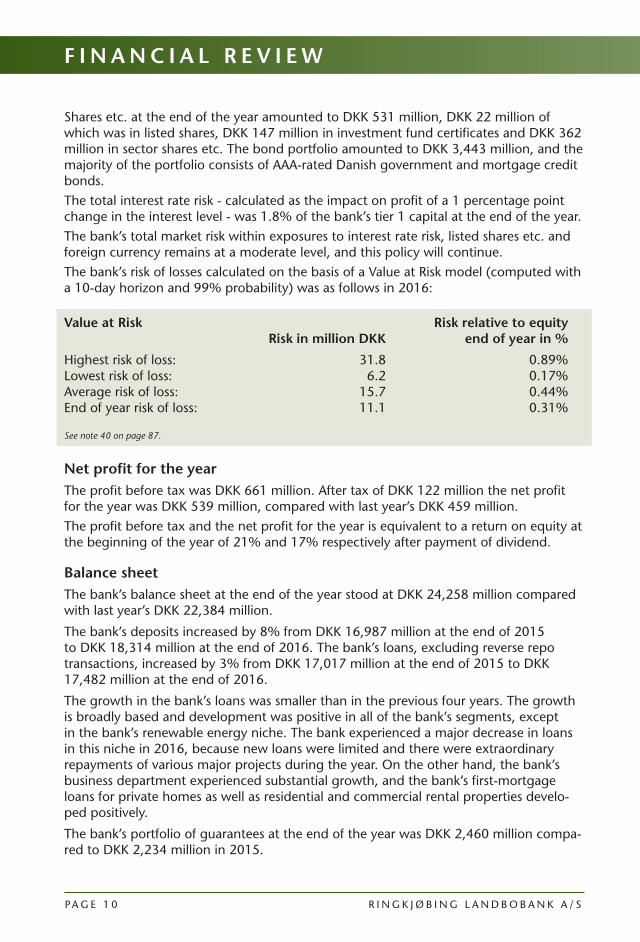
Shares etc. at the end of the year amounted to DKK 531 million, DKK 22 million of which was in listed shares, DKK 147 million in investment fund certificates and DKK 362 million in sector shares etc. The bond portfolio amounted to DKK 3,443 million, and the majority of the portfolio consists of AAA-rated Danish government and mortgage credit bonds.The total interest rate risk - calculated as the impact on profit of a 1 percentage point change in the interest level - was 1.8% of the bank’s tier 1 capital at the end of the year.The bank’s total market risk within exposures to interest rate risk, listed shares etc. and foreign currency remains at a moderate level, and this policy will continue.The bank’s risk of losses calculated on the basis of a Value at Risk model (computed with a 10-day horizon and 99% probability) was as follows in 2016:
Value at Risk Risk relative to equity Risk in million DKK end of year in %
Highest risk of loss: 31.8 0.89% Lowest risk of loss: 6.2 0.17% Average risk of loss: 15.7 0.44% End of year risk of loss: 11.1 0.31%
See note 40 on page 87.
Net profit for the yearThe profit before tax was DKK 661 million. After tax of DKK 122 million the net profit for the year was DKK 539 million, compared with last year’s DKK 459 million. The profit before tax and the net profit for the year is equivalent to a return on equity at the beginning of the year of 21% and 17% respectively after payment of dividend.
Balance sheetThe bank’s balance sheet at the end of the year stood at DKK 24,258 million compared with last year’s DKK 22,384 million.
The bank’s deposits increased by 8% from DKK 16,987 million at the end of 2015 to DKK 18,314 million at the end of 2016. The bank’s loans, excluding reverse repo transactions, increased by 3% from DKK 17,017 million at the end of 2015 to DKK 17,482 million at the end of 2016.
The growth in the bank’s loans was smaller than in the previous four years. The growth is broadly based and development was positive in all of the bank’s segments, except in the bank’s renewable energy niche. The bank experienced a major decrease in loans in this niche in 2016, because new loans were limited and there were extraordinary repayments of various major projects during the year. On the other hand, the bank’s business department experienced substantial growth, and the bank’s first-mortgage loans for private homes as well as residential and commercial rental properties develo-ped positively.
The bank’s portfolio of guarantees at the end of the year was DKK 2,460 million compa-red to DKK 2,234 million in 2015.

A N N U A L R E P O R T 2 0 1 6 PA G E 1 1
LiquidityThe bank’s liquidity situation is good. The bank’s short-term funding with term to ma-turity of less than 12 months amounts to DKK 0.4 billion, balanced by DKK 5.8 billion primarily in short-term investments in the Danish central bank and in liquid securities.
During 2016, the bank raised longer-term funding to the equivalent value of a total of DKK 0.5 billion with an average term of approximately 3 years. In 2016 the bank also initiated a joint funding partnership with Totalkredit and, in both the third and fourth quarters of 2016, home loans were sold to Totalkredit for funding.
The bank’s deposits at the end of the year exceeded the its loans by DKK 833 million. The loans portfolio is thus more than fully financed by the bank’s deposits and equity. In addition, part of the loans portfolio for wind turbines in Germany is refinanced "back-to-back" with KfW Bankengruppe, which means that DKK 1,010 million can be disregarded in terms of liquidity.
The bank thus requires no financing for the coming year to meet the internal goal that it must always be able to manage for up to 12 months without access to the financial markets.
In terms of liquidity, the bank must comply with the LCR (Liquidity Coverage Ratio) requirement. This key ratio expresses the ability of banks to honour their payment obli-gations for a 30-day period without access to market funds. The LCR figure is computed as the ratio of the bank’s cash and cash equivalents / liquid assets to its payment obliga-tions for the next 30 days as computed in accordance with specific rules.
4,56
7
5,20
7 7,20
9
10,0
23
12,7
60 14,1
35
13,8
97
13,0
47
13,1
51
12,7
47
12,4
24 13,8
49
14,9
24 17,0
17
17,4
82
0,000
2,000
4,000
6,000
8,000
10,000
12,000
14,000
16,000
18,00020
02
2003
2004
2005
2006
2007
2008
2009
2010
2011
2012
2013
2014
2015
2016
Mill
ion
DK
K
Loans*
,
* Excluding reverse repo transactions.

PA G E 1 2 R I N G K J Ø B I N G L A N D B O B A N K A / S
F I N A N C I A L R E V I E W
On 1 January 2016, the requirement for non-SIFI banks was cover of at least 70%. On 1 January 2017, the requirement increased by 10 percentage points to 80%, and on 1 January 2018 it will increase by an additional 20 percentage points, which means that as of this date, the LCR must be at least 100%. The requirement for SIFI banks has been cover of 100% since implementation of the LCR requirement.
Since its introduction on 1 October 2015, Ringkjøbing Landbobank has sought to follow the same rules that apply to SIFI banks, and the bank’s internal LCR target is thus 100%.
On 31 December 2016 the bank’s LCR was 185% and the bank thus met the target.
On 31 December 2016, the LCR requirement replaced the statutory Section 152 re-quirement, which was phased out on the same date. However, it must still be disclosed, and the figure at the end of the year was 140%.
RatingRingkjøbing Landbobank was rated for the first time by the international credit rating bureau Moody’s Investors Service in May 2007.
The bank’s ratings at the end of 2016 were as follows:
Baseline Credit Long-term Short-term Counterparty Assessment (BCA) Deposit Rating Deposit Rating Risk Assessment Outlook
A3 A1 P-1 Aa3 / P-1 Stable
The bank’s Baseline Credit Assessment and Long-term Deposit Rating are among the highest for Danish banks rated by Moody’s Investors Service.
The supervisory diamondThe Danish Financial Supervisory Authority has prepared a set of rules with five different benchmarks and associated limit values which Danish banks must observe.
The FSA’s benchmarks and limit values and the bank’s key figures are given in the table below.
Ringkjøbing Landbobank observes all five limit values by a good margin.
Key figuresBenchmarks Limit values 2016 2015
Stable funding (funding ratio) < 1 0.7 0.8Excess liquidity > 50% 139.6% 99.7% Total large exposures < 125% 29.5% 63.4% Growth in loans < 20% 2.7% 14.0% Real property exposure < 25% 14.8% 14.1%

A N N U A L R E P O R T 2 0 1 6 PA G E 1 3
With effect from 1 January 2018, the benchmark for large exposures will change. In future it will be calculated on the basis of the sum of the bank’s 20 largest exposures relative to its common equity tier 1 capital with a limit value of 175%. The FSA will also at some point implement a new benchmark to replace the current excess liquidity coverage benchmark, which is calculated on the basis of the minimum requirement in Section 152 of the Financial Business Act. The future benchmark and limit value are expected to be related to the LCR requirement. The bank expects to be able to comply with the new benchmarks without any problems.
Capital reduction, dividends and share buy-back programmeUnder the share buy-back programme which was adopted by the annual general meet-ing in February 2016, 100,000 shares have been bought and reserved during the year. It is proposed to the general meeting that these 100,000 shares be finally cancelled in connection with a capital reduction, thus reducing the number of shares in the bank from 4,570,000 to 4,470,000.
The bank’s board of directors will also propose to the general meeting that a dividend of DKK 36 per share, equivalent to DKK 165 million, be paid for the 2016 financial year. A dividend of DKK 30 per share was paid for the 2015 financial year.
A proposal will also be made to the general meeting that a new share buy-back pro-gramme be established, under which shares for up to DKK 170 million can be bought for cancellation at a future general meeting.
The total pay-out ratio increases from 61% in 2015 to 62% in 2016 on the basis of the above proposals.
Capital structureEquity at the beginning of 2016 was DKK 3,296 million. To this must be added the net profit for the year, while the dividend paid and the value of the bank’s own sha-res bought must be subtracted, after which the equity at the end of the year was DKK 3,555 million, an increase of 8%.
The bank’s total capital ratio was computed at 18.3% at the end of 2016, and the tier 1 capital ratio at 16.9%.
Capital ratios 2016 2015 2014 2013 2012
Common equity tier 1 capital ratio (%) 16.9 17.1 17.5 18.7 19.6Tier 1 capital ratio (%) 16.9 17.1 17.5 19.2 20.9Total capital ratio (%) 18.3 18.8 17.5 20.0 22.4
Individual solvency requirement (%) 9.0 9.0 8.9 8.9 8.0
The bank made a strategic investment in 2016 and bought additional shares in DLR Kredit for the equivalent of a total of DKK 85 million net. In January 2017, the bank acquired shares for an additional DKK 53 million. The bank believes that the acquisition is a good investment which will secure a satisfactory return for the bank. The acquisition also ensures that the bank can supply DLR Kredit loans without equity commitments.

PA G E 1 4 R I N G K J Ø B I N G L A N D B O B A N K A / S
The bank calculates the individual solvency requirement using the so-called 8+ model. This means the calculation method is based on 8% plus any supplements calculated for customers with financial problems, and others. The model takes no account of the bank’s earnings and cost base or its robust business concept.
Based on the model, the bank has calculated the individual solvency requirement at the end of 2016 at 9.0%. To this should be added a capital conservation buffer of 0.6%, and the total requirement for the bank’s total capital is thus 9.6%. Compared with the actual total capital of DKK 3.4 billion, the capital buffer at the end of 2016 was thus DKK 1.6 billion, equivalent to 8.7 percentage points.
During 2017, the authorities will require all banks in Denmark to comply with a Mini-mum Requirement of Eligible Liabilities (MREL). The implementation of these rules is not expected to materially influence the bank’s situation.
The bank’s sharesThe bank’s share capital on 31 December 2016 was DKK 22.850 million in 4,570,000 nom. DKK 5 shares.
The bank’s shares at the beginning of the year were listed on the Nasdaq Copenhagen at 1,500. During 2016, the share price fell to 1,463 at the end of the year but, including the dividend of DKK 30 paid in 2016, the share value at the end of the year is almost unchanged compared to the beginning of the year.
Including dividend, an investment in the bank’s shares at the beginning of 2001 had increased by over 18 times by the end of 2016.
30 00 00 0 9 25 28 30 12 13 14 25 26 3630 0
5
10
15
20
25
30
35
40
45
0
200
400
600
800
1.000
1.200
1.400
1.600
1.800
jan-
01ju
l-01
jan-
02ju
l-02
jan-
03ju
l-03
jan-
04ju
l-04
jan-
05ju
l-05
jan-
06ju
l-06
jan-
07ju
l-07
jan-
08ju
l-08
jan-
09ju
l-09
jan-
10ju
l-10
jan-
11ju
l-11
jan-
12ju
l-12
jan-
13ju
l-13
jan-
14ju
l-14
jan-
15ju
l-15
jan-
16ju
l-16
jan-
17
Div
iden
d (
DK
K)
Shar
ep
rice
(DK
K)
Share price and dividend
Dividend inDKK per share of nom. DKK 5
F I N A N C I A L R E V I E W

A N N U A L R E P O R T 2 0 1 6 PA G E 1 5
High levels of customer satisfaction and willingness to give referralsThe bank has gained a large number of satisfied and loyal customers over many years. These good customer relationships have greatly contributed to the bank’s growth in re-cent years, because existing customers have referred many new customers to the bank. The bank also spends significant resources on enhancing customer experience.
The bank places great weight on its good customer experience and the high levels of customer satisfaction and willingness to refer new customers to the bank. We are very humbled by and proud of the confirmation of these three parameters by two large-scale surveys of Danish banks (Voxmeter’s Customer Experience Management 2016-survey with 52,000 interviews published in January 2017 and Wilke / FinansWatch Insight’s 2016-survey published in October 2016). Both surveys placed the bank at the top on these parameters.
Good increase in customer numbersIn 2016, as in previous years, the bank implemented a large number of outreach initia-tives to both current and new customers. In addition, the bank’s new Private Banking branch in Vejle opened in January 2016.
As a result of these initiatives, combined with recommendations and referrals from the bank’s existing customer portfolio, the bank saw a highly satisfactory net increase in new customers in both the branch network and within certain niche concepts during the year.
The outreach initiatives are scheduled to continue in 2017 at both regional and national levels.
Expected results and plans for 2017The bank’s core earnings in 2016 were DKK 617 million, which is above the upwardly adjusted DKK 525 - 600 million range for the year.
The bank’s general goal continues to be a growth-oriented strategy with the wish to at-tract new customers and gain market shares.
Ringkjøbing Landbobank’s market share is about 50% in that part of West Jutland where the bank’s old branches are located. The bank also has well-established branches in Her-ning, Holstebro and Viborg, which are continuing to operate positively. The bank’s goal for 2017 is to retain and develop this portion of the customer portfolio with sound and competitive products, focus on employee expertise, and work in providing skilled advice to customers on the financial products. An additional goal is an inflow of new customers to the bank’s branches in Central and West Jutland, deriving from its long-term outreach marketing and market position in general.
The bank will also continue to focus on developing the activities in its niche concepts in the forthcoming year. Focus will thus be placed on serving the bank’s existing customers and further developing the portfolio within renewable energy, wholesale lending, and medical practitioners / dentists etc.

PA G E 1 6 R I N G K J Ø B I N G L A N D B O B A N K A / S
The bank’s Private Banking branches in Ringkøbing, Herning, Holte and Aarhus and the newly established branch in Vejle have all been successful in 2016. The bank continues to see major opportunities in this segment, and will continue to focus on it with regard to both existing and potential customers. The bank will thus deploy highly competent and dedicated staff to serve the segment, and expects to be able to continue develo-ping this business area in the future.
Based on the prospects for 2017 and the activities and initiatives we want to carry out in 2017, the bank expects to be able to realise lending growth during 2017. Continuing pressure on the bank’s interest margin is, however, also expected. The bank also expects a positive development in net fee income. Finally, an increase in the level of cost of ap-proximately 3% relative to the total costs in 2016 is expected, and impairment charges in 2017 are expected to be lower than in 2016.
As a whole, core earnings in 2017 are expected to be in the range DKK 515 - 615 mil-lion. To this must be added the result from the bank’s portfolio of securities.
Accounting policies and key figuresThe accounting policies are changed in one minor area relative to those of the sub-mitted and audited financial statements for 2015: the classification of collateral under CSA agreements. The accounting policies are otherwise unchanged since last financial year. See "Accounting policies" for a detailed description of the policy change.
Events after the end of the financial yearFrom the date of the balance sheet to today, no events have occurred which may affect the assessment of the bank’s 2016 annual report.
F I N A N C I A L R E V I E W

A N N U A L R E P O R T 2 0 1 6 PA G E 1 7
C A P I T A L S T R U C T U R E
Profit distributionThe bank’s general meeting in February 2016 authorised the bank’s management to implement a share buy-back programme for up to DKK 140 million on the basis of the 2015 profit, with a view to cancelling the shares bought back under the programme at a future general meeting.
Under the share buy-back programme, shares to the value of DKK 140.4 million, equivalent to 100,000 shares, have been bought and reserved during the year, as shown in the following table:
Average Transaction Number of purchase price value shares - in DKK - in DKK 1,000
Reserved on 9 March 2016 20,000 1,403.53 28,071Reserved on 1 June 2016 29,000 1,371.46 39,772Reserved on 14 September 2016 23,000 1,429.02 32,867Reserved on 7 December 2016 28,000 1,415.85 39,644Total reserved on 7 December 2016 100,000 140,354
It is thus proposed to the general meeting to cancel the 100,000 shares, which will reduce the number of shares from 4,570,000 to 4,470,000 by a capital reduction.
The board of directors further proposes to the general meeting that a dividend of DKK 36 per share, equivalent to DKK 165 million, be paid for the 2016 financial year. A divi-dend of DKK 30 per share was paid for the 2015 financial year.
Finally, it is proposed to the general meeting that a new share buy-back programme be established for up to DKK 170 million, with a view to cancelling the shares bought back under the programme at a future general meeting. It is also proposed that the board of directors be authorised to cancel or reduce the share buy-back programme if this is con-sidered commercially appropriate for the bank, in the bank’s long-term interest, or the bank’s circumstances with respect to capital otherwise so require. If the general meeting adopts the proposal for a new share buy-back programme, the amount of the share buy-back programme must be deducted from the bank’s total capital which, seen in isolation, will mean a reduction of the bank’s common equity tier 1 capital ratio by 0.9 percentage point calculated on the basis of the capital structure on 31 December 2016.

PA G E 1 8 R I N G K J Ø B I N G L A N D B O B A N K A / S
C A P I T A L S T R U C T U R E
Capital objectiveIn management’s general assessment, the bank’s strong capitalisation in recent years contributed to securing competitive funding and a considerable increase in new custo-mers.The bank’s management wants the bank to be capitalised in such a way that it has suf-ficient capital for future growth, and there must also be sufficient capital to cover any fluctuations in the risks assumed by the bank.Given these general objectives, the bank’s management has set a long-term capital tar-get of approximately 15% for the bank’s common equity tier 1 capital.The long-term capital target will be met by continuing the policy for distributions practi-sed in recent years. The policy is characterised by stable dividends combined with share buy-backs / extraordinary dividends to regularly adjust the capital structure relative to the development in the bank’s total risk exposure amount and the bank’s future growth opportunities as envisaged by the bank’s management.The following summary shows the actual pay-out ratios in per cent in recent years. The summary lists the actual pay-out ratios for the 2012 - 2015 financial years and the ex-pected ratio for 2016.
Pay-out ratios
(Million DKK) 2016 2015 2014 2013 2012Net profit for the year 539.5 458.7 445.9 357.7 328.0Distributions Ordinary dividend 164.5 140.1 124.3 72.6 69.2 Extraordinary dividend 0.0 0.0 0.0 0.0 48.4 Buy-back programme 170.0 140.4 142.6 127.6 58.7 Total 334.5 280.5 266.9 200.2 176.3Pay-out ratio in % 62 61 60 56 54
See page 64 for detailed comments on the pay-out ratios.
During 2016 the bank realised an increase in the total risk exposure amount of 5%, partly attributable to the growth in loans for the year. This contributed to an adjustment of the bank’s capital structure towards the long-term capital target. The bank also expects to be able to create growth in total risk exposure in the years to come and to make profitable investments, which will enable the bank to continue work-ing towards the long-term target.

A N N U A L R E P O R T 2 0 1 6 PA G E 1 9
Current capital structureThe bank’s capital ratios as of the end of December 2012 - 2016 were as follows:
Capital ratios 2016 2015 2014 2013 2012Common equity tier 1 capital ratio (%) 16.9 17.1 17.5 18.7 19.6Tier 1 capital ratio (%) 16.9 17.1 17.5 19.2 20.9Total capital ratio (%) 18.3 18.8 17.5 20.0 22.4
Individual solvency requirement (%) 9.0 9.0 8.9 8.9 8.0
Subordinated debtThe maturity structure of the bank’s external subordinated debt is presented in the fol-lowing overview:
Tier 2 capital
• Nom. EUR 50 million issued on 20 May 2015, term 10 years to 20 May 2025, option of early redemption from 20 May 2020 if approved by the Danish Financial Supervisory Authority.
Capital adequacy rulesThe bank uses the following methods for the calculation of the total risk exposure amount as provided by the CRD IV rules:
Calculation of capital adequacy - methods used
• Credit risk outside the trading portfolio Standardised Approach• Counterparty risk Mark-to-Market Method• Credit risk reducing method - financial collateral Comprehensive Method• Market risk Standardised Approach• Operational risk Basic Indicator Method
As evident from the above, the bank uses the standardised method for calculation of its credit risk and thereby the total risk exposure amount. This approach uses fixed risk weightings.
The method means that the bank does not apply the same down-weighting of risks as those banks which apply one of the advanced methods.
On the other hand, the bank does not experience increasing risk weightings in periods of recession. Relative to the advanced methods, use of the standardised method means that there is significantly greater robustness in the calculated capital ratios and a smaller volatility in the total risk exposure amount.
The calculation of the total risk exposure amount includes a discount on the risk weighting of exposures with small and medium-sized enterprises (SMEs). The European Commission has proposed continuing the present discount for SMEs as well as expan-ding it for SMEs.
PA G E 2 0 R I N G K J Ø B I N G L A N D B O B A N K A / S
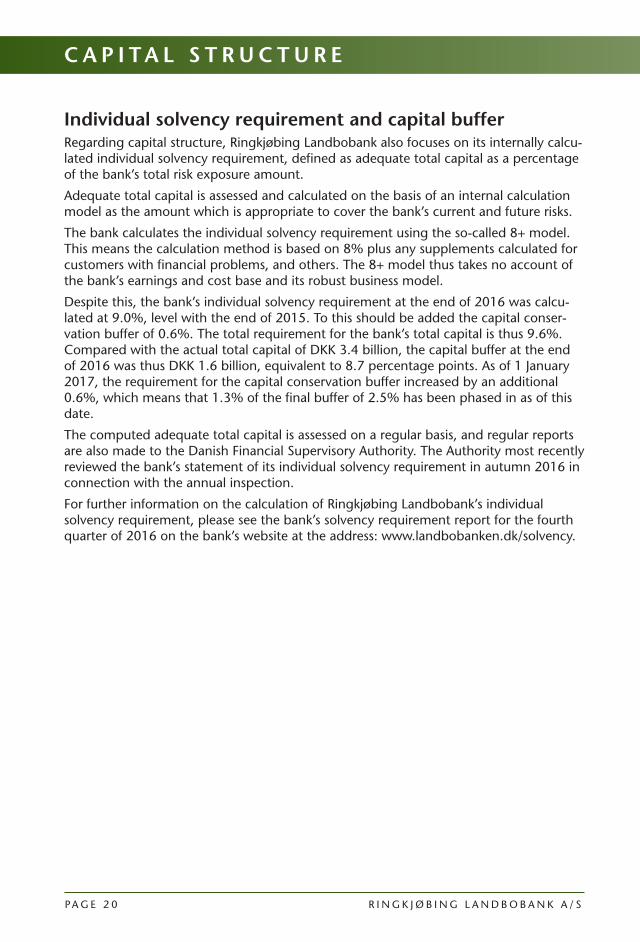
Individual solvency requirement and capital buffer Regarding capital structure, Ringkjøbing Landbobank also focuses on its internally calcu-lated individual solvency requirement, defined as adequate total capital as a percentage of the bank’s total risk exposure amount.
Adequate total capital is assessed and calculated on the basis of an internal calculation model as the amount which is appropriate to cover the bank’s current and future risks.
The bank calculates the individual solvency requirement using the so-called 8+ model. This means the calculation method is based on 8% plus any supplements calculated for customers with financial problems, and others. The 8+ model thus takes no account of the bank’s earnings and cost base and its robust business model.
Despite this, the bank’s individual solvency requirement at the end of 2016 was calcu-lated at 9.0%, level with the end of 2015. To this should be added the capital conser-vation buffer of 0.6%. The total requirement for the bank’s total capital is thus 9.6%. Compared with the actual total capital of DKK 3.4 billion, the capital buffer at the end of 2016 was thus DKK 1.6 billion, equivalent to 8.7 percentage points. As of 1 January 2017, the requirement for the capital conservation buffer increased by an additional 0.6%, which means that 1.3% of the final buffer of 2.5% has been phased in as of this date.
The computed adequate total capital is assessed on a regular basis, and regular reports are also made to the Danish Financial Supervisory Authority. The Authority most recently reviewed the bank’s statement of its individual solvency requirement in autumn 2016 in connection with the annual inspection.
For further information on the calculation of Ringkjøbing Landbobank’s individual solvency requirement, please see the bank’s solvency requirement report for the fourth quarter of 2016 on the bank’s website at the address: www.landbobanken.dk/solvency.
C A P I T A L S T R U C T U R E

A N N U A L R E P O R T 2 0 1 6 PA G E 2 1
R I S K S A N D R I S K M A N A G E M E N T
Risks and risk managementRingkjøbing Landbobank is exposed to various types of risk in its operations: credit risk, market risk, liquidity risk and operational risk.
The credit risk is defined as the risk that payments owing to the bank have to be judged non-recoverable because of a lack of either ability or willingness to pay at the agreed time.
The market risk is defined as the risk that the market value of the bank’s assets and liabi-lities will change as a result of changes in market conditions. The bank’s total market risk includes interest rate risks, foreign currency risks, share price risks and property risks.
The liquidity risk is defined as the risk that the bank’s obligations to make payments can-not be honoured under the bank’s cash flow position.
Finally, the operational risk is defined as the risk of either direct or indirect financial los-ses as a result of flaws in internal processes and systems, human error or external events.
Policy on risk-taking and managementThe framework for the bank’s risk-taking is specified by the board of directors, which has adopted a policy for each individual risk area which includes a definition of the bank’s risk profile in the area. The board reviews and reassesses each policy at least once a year in connection with its position on the bank’s general business model and risk profile.
The bank’s general principle for risk-taking is only to take risks within a moderate risk profile which it has the expertise to manage.
The basis for the board of directors’ review of the bank’s business model and associa-ted policies for each individual risk area is a general risk report which is provided to the board. The report covers the various risks to which the bank is exposed, and gives the board a complete picture of the bank’s general risk profile. In comparison with the mar-ket possibilities, the board then assesses whether to adjust the bank’s business model and risk profile. The report also acts as a basis for a possible decision on adaptation of the policies in the various risk areas.
Apart from the strategic risk management, there is ongoing central operational manage-ment and monitoring of the bank’s risks in each area. This monitoring is reported to the bank’s general management and board of directors. The management function and the control and reporting functions are separate, and the work is performed by different central staff functions in the bank. The bank’s risk manager ensures full reporting of risks which provides a meaningful picture of the bank’s actual risk taking. In this context, the risk manager prepares a risk management report to the board of directors’ risk commit-tee.
The various types of risk are described in more detail below.

PA G E 2 2 R I N G K J Ø B I N G L A N D B O B A N K A / S
R I S K S A N D R I S K M A N A G E M E N T
Credit risks loansOver the years, Ringkjøbing Landbobank has developed to its present status as primarily a regional bank in Central and West Jutland while also operating within selected niches.
This development has been a part of the bank’s strategy, and the management notes with satisfaction that the bank has achieved a loan portfolio significant diversified across industries, geographical areas and otherwise.
In general, Ringkjøbing Landbobank assumes credit risks on the basis of a policy, the objectives of which are to strike the right balance between assumed risks and the return gained by the bank, the bank’s losses must be at an acceptable level relative to the Da-nish financial sector, and finally, absorb losses suffered even in extreme situations within the bank’s results.
The bank’s ratio of loans to total capital is more than five, and its objective is to achieve results with a credit gearing less than or equal to Denmark’s major banks.
Historically, the bank has always had a sound and conservative credit policy, and focus will remain on ensuring efficient management and monitoring of its total portfolio of loans via its central credit department.
The central credit department regularly reviews and follows up all large exposures. Apart from this normal credit monitoring and management, the bank has developed a set of credit evaluation models which are used to assess the quality of the credit exposure.
Statistical models are used for personal and small business customers, while expert models are used for major business customers. The statistical models use various factors, including information on the customer’s assets and a quantity of behavioural data.
The expert models for major business customers are based on information on the custo-mer’s financial standing and earning capacity.
Using these models, the bank’s judgment is that the credit quality for those of the bank’s loans and guarantees which have not been impaired has improved marginally relative to 2015. The bank gained many new customers throughout 2016. When estab-lishing new customer relationships, the bank is highly attentive to the customers’ credit-worthiness and potential risks. A separate review of new customers in 2016 shows that these customers’ credit quality is satisfactory on average. The bank’s many customers with high credit quality also repay debts at a high rate. In 2016, the bank was successful in selling home loans to some of its creditworthy personal customers. This meant that loans to personal customers with high credit quality increased substantially and, over-all, the result is a credit quality which is marginally better than in 2015 (see note 37 on page 83).

A N N U A L R E P O R T 2 0 1 6 PA G E 2 3
Actual net losses(DKK 1,000) Loans and other receivables with Impairments Actual suspended for loans and Percentage Percentage Actual net losses calculation provisions for Total loans and loss before loss afterYear net losses after interest of interest guarantees guarantees etc. interest* interest*1987 -6,696 304 10,544 75,000 1,358,464 -0.49% 0.02%1988 -14,205 -5,205 4,522 93,900 1,408,830 -1.01% -0.37%1989 -18,302 -5,302 13,107 117,270 1,468,206 -1.25% -0.36%1990 -15,867 -1,867 47,182 147,800 1,555,647 -1.02% -0.12%1991 -11,429 3,571 47,626 170,000 1,805,506 -0.63% 0.20%1992 -32,928 -14,928 43,325 177,900 1,933,081 -1.70% -0.77%1993 -27,875 -6,875 30,964 208,700 1,893,098 -1.47% -0.36%1994 -14,554 4,446 33,889 223,500 1,938,572 -0.75% 0.23%1995 -10,806 10,194 27,292 238,800 2,058,561 -0.52% 0.50%1996 -19,802 -1,802 18,404 233,400 2,588,028 -0.77% -0.07%1997 -31,412 -12,412 39,846 236,600 3,261,429 -0.96% -0.38%1998 -2,914 18,086 4,905 263,600 3,752,602 -0.08% 0.48%1999 -442 21,558 18,595 290,450 5,148,190 -0.01% 0.42%2000 -405 27,595 12,843 316,750 5,377,749 -0.01% 0.51%2001 -8,038 20,962 14,222 331,950 6,113,523 -0.13% 0.34%2002 -8,470 20,530 26,290 382,850 7,655,112 -0.11% 0.27%2003 -22,741 2,259 23,412 394,850 8,497,124 -0.27% 0.03%2004 -14,554 9,446 18,875 404,855 11,523,143 -0.13% 0.08%2005 -22,908 192 35,796 357,000 15,522,264 -0.15% 0.00%2006 -13,531 7,028 20,578 295,000 17,858,787 -0.08% 0.04%2007 -15,264 4,888 13,190 289,097 19,227,573 -0.08% 0.03%2008 -34,789 -10,237 22,110 356,083 16,475,975 -0.21% -0.06%2009 -73,767 -47,658 62,649 467,025 14,890,027 -0.50% -0.32%2010 -69,428 -40,207 66,237 565,035 14,758,234 -0.47% -0.27%2011 -78,813 -43,073 61,419 649,856 14,448,638 -0.55% -0.30%2012 -90,022 -48,337 113,312 758,363 14,849,602 -0.61% -0.33%2013 -69,030 -25,117 85,258 853,421 16,604,640 -0.42% -0.15%2014 -53,427 -9,206 58,244 931,398 18,073,200 -0.30% -0.05% 2015 -87,250 -48,815 74,220 942,950 20,194,063 -0.43% -0.24% 2016 -86,666 -54,200 59,904 937,128 20,878,475 -0.42% -0.26%30-year average (1987 - 2016) -0.52% -0.04%10-year average (2007 - 2016) -0.40% -0.20%
*) Actual net losses relative to total loans, guarantees, impairment charges for loans and provisions for guarantees.
Explanation: The percentage losses are computed as the actual net losses for the year before and after interest on the impaired part of loans as a percentage of total loans, guarantees, impairments for loans and provisions for guarantees. A minus in front of a percentage loss indicates a loss, while a positive percentage loss means that the interest on the impaired part of loans was greater than the actual net losses for the year. All the above figures are computed exclusive of amounts concerning reverse repo transactions and the national Bank Package I etc.
The above table documents the bank’s sound credit policy. As will be evident, the bank’s average percentage loss after interest over the last 30 years (1987 - 2016) was -0.04%, with -0.77% (1992) as the highest percentage loss and +0.51% (2000) the most posi-tive figure. The average percentage loss before interest over the last 30 years is -0.52%, with -1.70% (1992) the highest percentage loss and -0.01% (1999 and 2000) the lowest percentage loss. The average percentage loss after interest over the last ten years (2007 - 2016) was -0.20%; the average percentage loss before interest was -0.40%.
The regional section of the bank is run partly via branches in the bank’s West Jutland heartland and partly via branches in the three big central and western Jutland cities of Herning, Holstebro and Viborg.
The most important areas within the bank’s niche section are a Private Banking concept covering asset management for affluent personal customers and financing of securities, medical practitioners’ and dentists’ purchases of private practices, loans for the financing

PA G E 2 4 R I N G K J Ø B I N G L A N D B O B A N K A / S
of renewable energy, including wind turbines and solar cell systems, and selected whole-sale loans, including real estate financing. The financing of wind turbines is primarily for Danish end investors’ purchases of wind turbines erected in Denmark and Germany.
An important common factor in the niche loans is that the bank attempts to obtain a first mortgage, and thereby satisfactory security in the mortgaged assets, which is an important part of its business philosophy.
Credit concentrationAs indicated in the summary below, total large exposures amount to 29.5% on two good quality exposures and fully hedged with adequate security.
Credit concentration
2016 2015 2014 2013 2012Total large exposures 29.5% 63.4% 47.8% 35.0% 27.2%Explanation: The Danish Financial Supervisory Authority key figure "Total large exposures".
Geographic spread of the bank’s loans and guarantee portfolioAs the figure shows, a significant geographical diversification of the bank’s portfolio of loans and guarantees has been achieved via both the regional section and the niche section.
The loans via the bank’s niche section have also helped to ensure a major diversification in the bank’s loans portfolio, so that this portfolio is less exposed to cyclical economic fluctuations than it would be if the bank were run exclusively as a regional bank.
R I S K S A N D R I S K M A N A G E M E N T
Explanation: Distribution of the bank’s portfolio of loans and guarantees (excluding reverse repo transactions) before impairments and provisions, based on the customers’ addresses.

A N N U A L R E P O R T 2 0 1 6 PA G E 2 5
Credit risks on financial counterpartiesExposure to financial counterparties, and consequently a credit risk, including a settle-ment risk, arises from the bank’s trading in securities, foreign currency and derivative financial instruments, its loans to other banks, its possession of bonds and payment handling.
The settlement risk is the risk that in connection with the settlement of trades in securi-ties and / or currency, the bank will not receive payment or securities corresponding to the securities and / or payments which it had made and delivered.
The bank’s board of directors grants lines of credit for credit risks and settlement risks on financial counterparties. When granting lines, account is taken of the individual counter-party’s risk profile, rating, if any, size and financial circumstances, and there is constant follow-up on the lines which are granted. The bank also mitigates its settlement risk concerning clearing of foreign exchange via its membership of a clearing partnership (referred to as the CLS partnership).
The bank has also entered into a number of CSA agreements in connection with ISDA agreements which had been signed. The CSA agreements contribute to reducing the credit risks for either the bank or the financial counterparties in derivatives contracts. Whether it is the bank or the financial counterparty (with whom the individual derivati-ves contract was signed) which is hedged, depends on the market value of the derivati-ves in question.
During 2017, the risk in relation to non-cleared OTC derivatives in the sector will be further eliminated. The EMIR regulation thus requires financial counterparties trading in non-cleared OTC derivatives to protect themselves against risk exposure in the derivati-ves market by providing collateral. The collateral consists in the exchange of a variation margin, which will protect the parties against value fluctuations in non-cleared OTC derivatives agreements outstanding.
A requirement concerning clearing of derivatives (referred to as CCP clearing) has also been introduced gradually. The gradual implementation means that, so far, the largest banks are clearing through CCPs. The bank also wants to participate in CCP clearing to further mitigate the counterparty risk concerning derivatives, and wants to be able to continue to offer competitive products to its customers.
The bank’s policy is to keep the credit risk exposure to financial counterparties at a ba-lanced level relative to the bank’s size, and to credit institutions with good credit quality.
Receivables from central banks and credit institutionsOne of the major items of credit risk exposure to financial counterparties is receivables from central banks and credit institutions. The bank has assumed only a moderate risk on this item and, of the total receivables from central banks and credit institutions, 85% is thus due within three months.

PA G E 2 6 R I N G K J Ø B I N G L A N D B O B A N K A / S
The bond portfolioThe bank’s bond portfolio is another major item involving credit risk exposure to finan-cial counterparties.The majority of the bond portfolio consists of AAA-rated Danish government and mort-gage credit bonds. There is also a holding of corporate bonds. The credit quality of the bonds in the portfolio of corporate bonds is good, but their market value can vary over time in connection with general changes in credit spreads in the market, and company-specific circumstances can also affect the value of these bonds.
Market risksThe bank’s basic policy with respect to market risks is to keep the total of such risks at a moderate level.
The bank has determined concrete exposure limits for each type of market risk, and the risk assessment includes the objective of a sensible and balanced relationship between risk and return.
The bank uses derivatives to hedge and manage the various market risk types if it wishes to reduce or eliminate the market risks which it has assumed. To supplement the more traditional measures of market risk, the bank has a mathematical / statistical model to compute market risks. The model is used to compute Value at Risk (VaR), which is regu-larly reported to the bank’s management.
VaR is a measure of risk which describes the bank’s risk under normal market conditions.
A separate VaR is calculated for interest rate positions, foreign exchange positions and listed share positions etc., and a total VaR is also calculated for all of the bank’s market risks consisting of interest rate positions, foreign exchange positions and listed share
R I S K S A N D R I S K M A N A G E M E N T
Baa2/BBB2%
Baa3/BBB-1%
Ba1/BB+2%
Ba2/BB1%
Not rated10%
Aaa/AAA82%
A2/A1%
A3/A-1%
Bonds distributed by rating classes
Explanation: The bond portfolio distributed by rating classes. Ratings from the credit rating agencies Moody’s Investors Service, Standard & Poor’s and Fitch were used in the specification.

A N N U A L R E P O R T 2 0 1 6 PA G E 2 7
positions etc. This possibility of calculating a VaR for the bank’s market risks is one of the major advantages of the VaR model over more traditional measures of risk. The reader is referred to the section "Value at Risk" below for the specific results etc. under the VaR model.
Interest rate riskThe bank’s lending and deposit activities and accounts with credit institutions are mostly based on a floating rate. The bank also has certain fixed-rate financial assets and liabi-lities which are monitored continuously, and hedging transactions are entered into as needed, with a consequent reduction of the interest rate risk.Ringkjøbing Landbobank’s policy is to maintain a moderate interest rate risk, and the bank thus does not assume high levels of exposure to movements in interest rates.The bank’s interest rate risk is monitored and managed daily by its securities department. The bank’s accounts department checks that the limits for assumption of interest rate risk are observed, and reports to the bank’s board of directors and general management.
As the figure shows, the bank has had a moderate interest rate risk over the last five years, in accordance with its policy for this type of risk.
Foreign exchange riskThe bank’s principal currency is the Danish krone, but it has also entered into lending and deposit activities in other currencies.
The bank’s policy is to maintain a low foreign exchange risk, and the bank thus reduces ongoing positions in foreign currencies via hedging.
The bank’s positions in foreign exchange are managed daily by the foreign department,
0
1
2
3
4
5
6
7
dec-
11
jun-
12
dec-
12
jun-
13
dec-
13
jun-
14
dec-
14
jun-
15
dec-
15
jun-
16
dec-
16
Per
cen
t
Interest rate risk
Explanation: The interest rate risk shows the impact on profit of a one percentage point change in interest rate level as a percentage of tier 1 capital.

PA G E 2 8 R I N G K J Ø B I N G L A N D B O B A N K A / S
while the bank’s accounts department monitors compliance with limits and reports to the board of directors and general management.
As in previous years, the bank’s foreign exchange risk in 2016 was at an insignificant level.
Share price riskThe bank is co-owner of various sector companies via equity interests in BankInvest Holding A/S, Bokis A/S, DLR Kredit A/S, Letpension Holding A/S, PRAS A/S, Sparinvest Holdings SE, Stonehenge Fondsmæglerselskab A/S, Swift, VP Securities A/S and others.
These holdings are comparable with the wholly owned subsidiaries of major banks, and the equity interests are thus not deemed to be a part of the bank’s share price risk. The bank also holds a small portfolio of listed shares and a portfolio of investment fund certificates.
The holding of shares etc. amounted to DKK 531 million at the end of the year, with DKK 22 million in listed shares, DKK 147 million in investment fund certificates and DKK 362 million in sector shares etc. The holding of investment fund certificates is mainly in funds investing all or most of their capital in bonds.
The bank’s policy is to maintain a moderate share price risk. The daily management of the bank’s share portfolio is undertaken by the securities department, while monitoring of limits and reporting to general management and the board of directors are perfor-med by the bank’s accounts department.
As will be evident from the figure below, the bank’s exposure to shares (excluding sector shares and bond-based investment fund certificates) as a percentage of the bank’s equity has been in accordance with the bank’s policy for this type of risk over the last five years, thereby documenting the bank’s goal of maintaining a moderate risk on share prices.
R I S K S A N D R I S K M A N A G E M E N T
0
1
2
3
4
5
6
7
dec-
11
dec-
12
dec-
13
dec-
14
dec-
15
dec-
16
Per
cen
t
Share exposure
Explanation: The share price exposure is computed as the bank’s portfolio of shares (excluding sector shares and bond-based invest-ment fund certificates etc.) as a percentage of the bank’s equity.

A N N U A L R E P O R T 2 0 1 6 PA G E 2 9
Property riskThe bank primarily wishes to possess only properties for use in banking operations, and also to maintain minimal property risks.
The bank’s portfolio of both domicile and investment properties is thus quite modest relative to both the bank’s balance sheet total and equity.
Value at RiskThe bank’s total VaR was DKK 11.1 million at the end of 2016. This sum is an expression of the maximum loss in a statistical perspective which the bank could risk losing with 99% probability if all market positions were retained unchanged for a period of 10 days.
Value at Risk summary
(DKK million) Average Min. Max. End of year Risk VaR figure VaR figure* VaR figure* VaR figureInterest 14.5 3.2 31.2 11.1 Foreign currency 1.0 2.1 2.7 0.1 Share 4.9 5.2 5.2 3.4 Diversification -4.7 -4.3 -7.3 -3.5 Total VaR figure 15.7 6.2 31.8 11.1* Determined by the total VaR figure. Reference is made to note 40 on page 87.
As indicated in the table, the bank’s total VaR throughout 2016 varied from DKK 6.2 million to DKK 31.8 million. The average VaR figure was DKK 15.7 million, on a par with last year.
Reference is made to note 40 on page 87 for the VaR figures for the years 2012 - 2016.
The model in briefThe model is a parametric VaR model based on a historical analysis of the covariance (correlations) between the prices of various financial assets etc., including different share indices, various official interest rates and interest swap rates, and different exchange rate indices. By combining historical knowledge of the covariance on the financial markets with the bank’s current positions, the model can calculate a risk of losses for a forthcoming 10-day period. All of the bank’s interest rate positions, foreign currency positions and listed share positions etc. are included in the calculation, while positions in sector shares etc. are not included. The model does not take account of credit spread risks on the bank’s bond portfolio. The model is unchanged relative to last year.
Back tests and stress testsBack tests are made to document that the VaR model provides a sensible picture of the bank’s risk. The test compares the calculated loss under the model with the losses which the bank would actually have suffered if the positions in question had been retained for a 10-day period. A number of stress tests are also carried out to indicate the bank’s risk of loss in abnormal market situations. Back tests of the model were performed throug-hout the year with satisfactory results.

PA G E 3 0 R I N G K J Ø B I N G L A N D B O B A N K A / S
Liquidity riskIn general with respect to liquidity management, it is the bank’s objective not to have any uncovered net funding requirements and not to be dependent on the short-term money market. An internal objective is thus that the bank must be able to manage for up to 12 months without access to the financial markets.
In terms of liquidity, the bank must comply with the LCR (Liquidity Coverage Ratio) requirement. This key ratio expresses the ability of banks to honour their payment obli-gations for a 30-day period without access to market funds. The LCR figure is computed as the ratio of the bank’s cash and cash equivalents / liquid assets to its payment obliga-tions for the next 30 days as computed in accordance with specific rules.
On 1 January 2016, the requirement for non-SIFI banks was cover of at least 70%. On 1 January 2017, the requirement increased by 10 percentage points to 80%, and on 1 January 2018 it will increase by an additional 20 percentage points, which means that as of this date, the LCR must be at least 100%. The requirement for SIFI banks has been cover of 100% since implementation of the LCR requirement.
Since its introduction on 1 October 2015, Ringkjøbing Landbobank has sought to follow the same rules that apply to SIFI banks, and the bank’s internal LCR target is thus 100%.
The bank’s assets and thus its loans portfolio are funded via a range of sources, primarily the bank’s deposits, by joint funding (bond issue) of the bank’s home loans, by taking out longer-term loans with other credit institutions, via the subordinated capital issued by the bank and, finally, the bank’s equity.
The bank’s deposit base consists of core deposits and deposits from customers with a long-term relationship with the bank. Ringkjøbing Landbobank has also entered into longer-term bilateral loan agreements with various European business partners.
The composition of the bank’s funding situation does not leave the bank dependent on individual business partners or partners in a single country.
To ensure diversification in funding, the bank also has an EMTN bond programme of EUR 2 billion. The programme helps to ensure alternative funding sources for the bank. Funds were raised under the programme in 2016.
As a whole, the bank entered into longer-term funding agreements with its partners during 2016 of total value equivalent to DKK 0.5 billion with an average term of appro-ximately three years.
The bank has joint funding agreements with Totalkredit / Nykredit and BRFkredit. The agreements mean that the bank can procure liquidity by letting Totalkredit / Nykredit or BRFkredit issue SDO bonds against security in the loans which the bank has provided to customers with security in real property. In 2016, the bank implemented the practical joint funding partnership with Totalkredit / Nykredit, and in both the third and fourth quarters of 2016, home loans were sold to Totalkredit / Nykredit for funding.
R I S K S A N D R I S K M A N A G E M E N T

A N N U A L R E P O R T 2 0 1 6 PA G E 3 1
Total capital base
Other liabilities
Deposits and other debt
Issued bonds - term to maturity more than 1 year
Debt to credit institutions - term to maturity more than 1 year
Debt to credit institutions - term to maturity less than 1 year
Distribution of funding
4%
76%
1%
16% 2%
1%
As evident from the above, the short-term funding (time to maturity less than one year) is supported via the bank’s cash in hand and demand deposits with the central bank of Denmark, certificates of deposit, short-term placings with other banks etc., and the bank’s own portfolio of liquid securities. Excess liquidity at the end of 2016 was DKK 5.4 billion, while the corresponding figures at the end of 2015 and 2014 were DKK 3.6 bil-lion and DKK 3.7 billion respectively.
(DKK 1,000)
The short-term funding (term to maturity less than 1 year): Debt to credit institutions and central banks - term to maturity less than 1 year 442,918 Total 442,918 Covered as follows: Cash in hand and demand deposits with the central bank of Denmark 284,139 Receivables with notice from central banks - certificates of deposit 1,572,198 Receivables from credit institutions - term to maturity less than 1 year 355,618 Listed bonds, shares and investment fund certificates at fair value 3,612,018 Total 5,823,973Excess cover 5,381,055

PA G E 3 2 R I N G K J Ø B I N G L A N D B O B A N K A / S
Operational riskThe capital adequacy rules require the banks to quantify and recognise an amount for operational risks when computing their capital adequacy.
The bank uses the so-called basic indicator method which bases the calculation on an average of the most recent three financial years’ net incomes. A sum is then quantified and added to the total risk exposure to cover the bank’s operational risks.
The bank regularly produces reports on the losses and events which are judged to be attributable to operational risks. From the reports, an assessment is made whether pro-cedures etc. can be adjusted and improved in order to avoid or minimise any operatio-nal risks. The bank’s procedures are also regularly reviewed and assessed by the bank’s internal and external auditors. In addition, the bank makes thematic reviews of selected business areas, identifying and assessing the potential risk scenarios for each area and subsequently adjusting the bank’s procedures accordingly.
An important area in the assessment of the bank’s operational risks is IT.
The bank’s IT organisation and management keep a watchful eye on IT security, inclu-ding preparation of IT emergency plans, in connection with which the bank specifies requirements and levels for availability and stability of the IT systems and data used by the bank. These requirements apply to both the bank’s internal IT organisation and its primary external IT supplier Bankdata, which the bank owns together with a number of other banks.
Further information on the bank’s risksDanish banks are required by law to disclose information on risk. Some of the required risk information is given in this annual report but, for a more detailed overview of the bank’s disclosure requirement, the reader is referred to the bank’s website at the ad-dress: www.landbobanken.dk/risk-information.
R I S K S A N D R I S K M A N A G E M E N T

A N N U A L R E P O R T 2 0 1 6 PA G E 3 3
C O R P O R A T E G O V E R N A N C E
Statement on corporate governance
GoalRingkjøbing Landbobank has set a goal for corporate governance which focuses on the bank’s primary stakeholders, namely its shareholders, customers, employees, and the local areas where the bank has branches.
For the bank’s owners, its shareholders, the bank’s goal is to realise the best possible return for them in the long term. It is also the bank’s goal to realise operating results among the top 1/3 of the Danish financial sector, to be achieved via rational operation of the bank and a sound credit policy.
For its customers, the bank’s goal is to play a central role in Central and West Jutland, of which the bank is an integral part. The bank’s goal is thus to retain and further develop that section of its customer portfolio which is situated in Central and West Jutland.
It also seeks to serve selected customer groups throughout Denmark via the bank’s di-stance customer department and niche concepts and the bank’s Private Banking bran-ches via a high level of expertise and competitive products.
In general, the bank will thus meet the expectations of a full-service bank for both per-sonal and business customers via its strengths in both capital and consultancy.
It is also a goal for Ringkjøbing Landbobank to be a good and attractive place to work for its employees. On the basis of its chosen strategy, the bank wishes to create an inte-resting and challenging workplace which can attract and retain competent employees.
Finally, the bank’s goal is to support development in those areas where it has branches.
Codes of managementAs a listed financial institution and member of the Danish Bankers Association (follo-wing a merger now FinanceDenmark), the bank is covered by a number of codes. As a company listed on the Nasdaq Copenhagen, the bank is covered by the "Recommenda-tions on Corporate Governance" issued by the Committee for Corporate Governance, and as a member of the Danish Bankers Association, the bank is covered by "The Corpo-rate Governance Code of the Danish Bankers Association".
The corporate governance recommendationsCorporate governance in Ringkjøbing Landbobank concerns the objectives, general principles and structures governing the bank and the interplay between the bank, the bank’s management and its primary stakeholders: shareholders, customers and emplo-yees, and the local areas in which the bank has branches.
Since 2002, the bank’s management has pursued an active approach to the recommen-dations issued on corporate governance, and the bank’s attitude and position on corpo-rate governance have been recorded in the annual reports since that year.

PA G E 3 4 R I N G K J Ø B I N G L A N D B O B A N K A / S
C O R P O R A T E G O V E R N A N C E
The Committee on Corporate Governance issued the latest updated revision of the recommendations in May 2013 with a minor update in November 2014. The number of recommendations is 47, and in the latest edition of the recommendations, the Commit-tee has particularly focused on companies’ value creation, on the self-evaluation of the boards of directors and their involvement in the companies’ development.
When preparing the 2016 annual report, under the "comply or explain" principle, the bank’s board of directors and general management have re-assessed the bank’s po-sitions and actions on the recommendations. The bank’s management supports the efforts in the area of corporate governance, and the general management and board of directors have adopted almost all of the recommendations in this area. In a small number of areas, the bank’s management has, however, elected either not to follow the recommendations or to follow them only in part. The bank thus follows 43 of the total of 47 recommendations.
The Corporate Governance Code of the Danish Bankers AssociationIn 2013, the Danish Bankers Association adopted and published a new corporate gover-nance code. The Corporate Governance Code of the Danish Bankers Association repla-ced and expanded its "Recommendations for member companies of the Danish Bankers Association".
The object of the recommendations in the Association’s corporate governance code is that member companies must actively consider a number of managerial matters and achieve greater openness concerning the frameworks for management of the individual member companies.
On the "comply or explain" principle, the Association’s member companies must specify how they view the Association’s corporate governance code in connection with the presentation of the annual report.
The bank’s management generally also supports the Association’s corporate governance code, and the board of directors and the general management have thus elected to fol-low all 12 recommendations.
Communication with the bank’s stakeholdersThe bank also places great weight on communication with its stakeholders. It has always been a priority to the bank that its advisers and other staff must be available to both customers and other stakeholders. This will remain a top priority in the future. The bank also gives high priority to having a website and an online banking platform which are accessible, easy to understand and can be used in the bank’s communication with its customers and other stakeholders.
The bank has prepared an Investor Relations Policy dealing with the bank’s information to, and communication with, investors and other stakeholders. A code of conduct has also been prepared which includes general guidelines for the bank’s interaction with its stakeholders.

A N N U A L R E P O R T 2 0 1 6 PA G E 3 5
Investor Relations PolicyThe bank’s Investor Relations Policy states among other things that the bank must strive for openness and for good dialogue with its shareholders, investors and other stakehol-ders.
The bank’s goal is thus to give• the stock exchanges on which the bank has listed issues• existing and potential shareholders and investors• share analysts and securities brokers• other stakeholdersquick information which gives a true and fair view of both price-related and other signi-ficant matters.
The Investor Relations policy is available at the bank’s website at the address: www.landbobanken.dk/policies.
Code of conductIn December 2014, the bank’s board of directors for the first time adopted a code of conduct which designates the guidelines for the bank’s employees (including the bank’s board of directors and general management) concerning the conduct which is expected of them, i.e. their conduct towards stakeholders, such as customers, suppliers and authorities. In 2016, the board of directors adopted an update of the code of conduct which comprised a minor rewording.
The object of the current code of conduct is to assist employees in their daily decisions and conduct. The code is general and in no way exhaustive, but provides examples of unacceptable behaviour posing particular risk to the bank and its employees.
The complete code of conduct is available at the bank’s website at the address: www.landbobanken.dk/policies.
The bank’s financial reporting process, management organs and their functionsThe board of directors, the audit committee and the general management regularly ensure that the bank’s controls and risk management in connection with the financial reporting process are functioning satisfactorily.
The process is arranged in order to ensure that the annual report is presented in accor-dance with statutory requirements and free of material misstatement, whether due to fraud or error.
The financial reporting process is further organised so that the bank’s annual report is prepared by the bank’s accounts department in cooperation with the bank’s general management and other relevant departments.

PA G E 3 6 R I N G K J Ø B I N G L A N D B O B A N K A / S
C O R P O R A T E G O V E R N A N C E
A general rule for the financial reporting process is that the bank’s general management and the accounts department continuously monitor compliance with relevant legislation and other regulations and provisions in connection with the financial reporting process and report regularly to the bank’s board of directors and the audit committee.
The complete statement on corporate governance describes in detail various matters in-cluding processes, internal systems, recognition and measurement, the control environ-ment, risk assessment, control activities, monitoring and reporting.
The statement also describes the bank’s management organs and their functions in detail.
Remuneration policyIn 2012 the bank’s board of directors for the first time adopted a remuneration policy which includes guidelines for the remuneration paid to Ringkjøbing Landbobank’s board of directors and general management. The policy was submitted to the 2013 annual general meeting for approval and the meeting approved the policy.
The board of directors and the remuneration committee reviewed the remuneration policy in 2016 and in January 2017 and found that updating was required, among other things due to the introduction of the Mortgage Credit Directive. The updated remune-ration policy will be submitted to the bank’s annual general meeting in February 2017 for approval.
The current policy for management specifies that the bank’s management is paid remu-neration which is both in line with the market and reflects the management’s perfor-mance for the bank. It has also been decided that the remuneration paid to the board of directors and the general management should be a fixed amount without any form of incentive component.
Within the financial framework for payment of personal allowances under a current workplace agreement, within the minimum threshold for variable salary components and subject to the provisions in point 3 of the remuneration policy, variable salary components may be paid in cash to other major risk-takers and employees in control functions. Severance pay may also be paid unless deemed to be variable salary in ap-plicable law.
The complete remuneration policy is available at the bank’s website at the address: www.landbobanken.dk/policies.
Complete statementThe complete statement on management and corporate governance in Ringkjøbing Landbobank is available on the bank’s website at the address: www.landbobanken.dk/cg.

A N N U A L R E P O R T 2 0 1 6 PA G E 3 7
DIVERS ITY IN THE BOARD OF D IRECTORS
Statement on diversity in the board of directorsThe bank’s nomination committee has adopted a policy on diversity on the board of directors.
This policy expresses the desire for a board composition with diverse competencies and backgrounds, including differences in professional identity, work experience, gender, age, etc.
The policy further lays down that recruitment of candidates for the board of directors must focus on ensuring that the candidates possess different competencies, back-grounds, knowledge and resources which match the bank’s business model etc.
Compliance with the adopted policy on diversity on the board of directors was assessed by the nomination committee and the board of directors during the annual evaluation process.
The board of directors’ assessment on this basis confirms compliance, through focus on the policy criteria in the recruitment process for candidates both for the board of direc-tors and shareholders’ committee, and otherwise. The reason for focus on the criteria when recruiting candidates for the shareholders’ committee is that the shareholders’ committee elects the bank’s board of directors, and five of the current six board mem-bers, elected by the shareholders’ committee, were elected among the members of the shareholders’ committee, while only one board member (the member with managerial experience from another financial undertaking) was not elected among the members of the shareholders’ committee.

PA G E 3 8 R I N G K J Ø B I N G L A N D B O B A N K A / S
Statement on the under-represented gender In March 2013, the bank’s board of directors adopted a target figure for the percentage of the under-represented gender to be represented on the board of directors and a po-licy aiming at increasing the percentage of the under-represented gender at the bank’s other management levels.
The board’s nomination committee adopted a few adjustments in 2016 to the "Policy to increase the percentage of the under-represented gender at the bank’s other management levels".
The bank’s target figure for the proportion of board members of the under-represented gender elected by the shareholders’ committee should be at least 17% - 33% from 2017 (provided that the number of board members elected by the shareholders’ com-mittee is 6).
Figures on the date of closing the accounts were:
• 17% women
• 83% men
The bank thus meet the target.
The policy adopted to increase the percentage of the under-represented gender at the bank’s other management levels aims at creating a basis for a more equal gender distri-bution at these management levels.
It is the bank’s overall and long-term aim to provide a more equal gender distribution at the bank’s other management levels (the management). The bank wants to be able to follow up on developments with respect to gender distribution in management and to adjust the effort continually in relation to the target.
Based on these wishes, the bank has set the following specific targets for the under-represented gender in the bank’s management:
• The employees must, irrespective of gender, feel that they have equal career and management opportunities.
• The percentage of managers from the under-represented gender must be at least 20%.
At the end of 2016, the gender distribution in the bank’s management was as follows:
• 21% women
• 79% men
The distribution thus meets the target. In future recruiting processes for management positions, the bank will take its policy and the above targets etc. into consideration.
In accordance with Section 135a of the executive order on financial reports for credit institutions and investment companies etc., the statutory complete statement on the under-represented gender is available on the bank’s website at the address: www.landbobanken.dk/gender.
T H E U N D E R - R E P R E S E N T E D G E N D E R

A N N U A L R E P O R T 2 0 1 6 PA G E 3 9
T H E U N D E R - R E P R E S E N T E D G E N D E R C O R P O R A T E S O C I A L R E S P O N S I B I L I T Y
Statement on corporate social responsibility Ringkjøbing Landbobank wants to be a responsible and value-creating bank, and works to create the best results for its shareholders, customers and employees, the local communities, the surrounding environment and finally the bank itself as a financial institution.It is also the bank’s overall goal to be seen as a solid and attentive partner among all its stakeholders.On the basis of this goal and the bank’s deep roots in the local communities in which the bank is represented, the board of directors has prepared and adopted a corporate social responsibility (CSR) policy. The bank’s CSR policy is divided to focus specifically on the four stakeholder groups: customers, employees, the environment and the local community. The bank’s CSR policy is available on the bank’s website at the address: www.landbobanken.dk/csr. In accordance with Section 135 of the executive order on financial reports for credit institutions and investment companies etc., the statutory complete statement on corporate social responsibility is available at the same address.Further to the above, please note that the bank has not prepared specific policies on human rights or climate. The bank supports the efforts to put human rights and the climate high on the agenda but, as a local and regional bank, has not currently found it necessary to develop separate policies for these areas.

PA G E 4 0 R I N G K J Ø B I N G L A N D B O B A N K A / S
INFORMATION ON LISTED COMPANIES
Information on listed companiesIn accordance with Section 133a of the executive order on financial reports for credit institutions and investment firms etc., the bank advises as follows:
The bank’s share capital on 31 December 2016 was DKK 22.850 million in 4,570,000 nom. DKK 5 shares.
The bank has only one share class, and the entire share capital, and thus all shares, are listed on the Nasdaq Copenhagen. There are no restrictions on the shares’ negotiability.
Parvus Asset Management Europe Limited, London, Great Britain, and ATP, Hillerød, Denmark, have advised that they own more than 5% of the bank’s share capital. Both shareholders have 2 votes each.
With respect to the exercising of voting rights, each shareholding up to and including nom. DKK 500 carries 1 vote. Shareholdings above this level carry a total of 2 votes, which is the highest number of votes a shareholder can exercise when the shares are listed in the company’s register of shareholders or when the shareholder has reported and documented his or her entitlement.
The members of the bank’s board of directors are elected by the members of the bank’s shareholders’ committee, and the bank’s employees also elect members to the bank’s board of directors in accordance with rules in force.
With respect to amendments of the bank’s articles of association, a decision to change these is only valid if the proposal is adopted by at least 2/3 of votes cast and 2/3 of the voting capital represented at the general meeting.
On the date of closing the accounts, the board of directors holds the following authori-ties pursuant to the articles of association to issue shares:
The board of directors is authorised to increase the share capital, by cash payment of up to nom. DKK 14,210,980, to nom. DKK 37,060,980 in one or more new issues for which the board of directors will determine the price. The capital increase must be fully paid up. The authorisation is valid until 23 February 2021. The capital increase will take place with pre-emption for existing shareholders.
The board of directors is authorised to increase the share capital by payment of values other than cash of up to nom. DKK 14,210,980 to nom. DKK 37,060,980 in one or more new issues, for which the board of directors will determine the price, as payment for the bank’s takeover of an existing business or specific asset values corresponding to the value of the shares issued. The capital increase must be fully paid up. The authorisa-tion is valid until 23 February 2021. The capital increase will take place without pre-emption for existing shareholders.
Use of the authorisations may not exceed a total of nom. DKK 14,210,980, and each use of the authorisations will trigger simultaneous reductions in the amounts authorised under both authorisations, by the amount of the nominal capital issued.

A N N U A L R E P O R T 2 0 1 6 PA G E 4 1
The board of directors has the following powers with respect to the possibility of ac-quiring own shares:
The bank’s annual general meeting of 24 February 2016 has authorised the board of directors, before the next annual general meeting and in accordance with applicable law, to permit the bank to acquire its own shares to a total nominal value of 10% of the bank’s share capital, so that the shares can be acquired at the current listed price +/- 10%.
At the annual general meeting in 2016, the board was also authorised to buy back the bank’s own shares under a separate buy-back programme up to a market value of DKK 140 million, but with a maximum of 140,000 nom. DKK 5 shares, and set them aside for later cancellation. This authority was exercised in 2016 to the sum of DKK 140.354 million, the equivalent of 100,000 nom DKK 5 shares, which are recommended to be cancelled at the bank’s annual general meeting in February 2017 (including 251 shares with an acquisition price of DKK 0.354 million, which the bank’s board recommends be cancelled together with the shares which were bought back and reserved under the buy-back programme adopted in February 2016).
In conclusion, the bank has accepted change of control clauses in certain funding agree-ments. For reasons of competition, no further details are given.

PA G E 4 2 R I N G K J Ø B I N G L A N D B O B A N K A / S

A N N U A L R E P O R T 2 0 1 6 PA G E 4 3
Page 44 Management statement 45 Auditors’ reports
S T A T E M E N T A N D R E P O R T S
PA G E 4 4 R I N G K J Ø B I N G L A N D B O B A N K A / S
Management statementThe board of directors and the general management have today discussed and approved the annual report of Ringkjøbing Landbobank A/S for the financial year 1 January - 31 December 2016.
The annual report is prepared in accordance with the provisions of the Danish Financial Business Act and other Danish disclosure requirements for the financial statements of listed financial companies. We consider the chosen accounting policies to be appropriate and the estimates made responsible, so that the financial statements provide a true and fair view of the bank’s assets, liabilities and financial position as of 31 December 2016 and of the result of the bank’s activities and cash flows for the financial year 1 January - 31 December 2016. We also believe that the management’s review contains a true and fair account of the development in the bank’s activities and financial circumstances as well as a description of the most important risks and uncertainties which can affect the bank.
The annual report is recommended for approval by the general meeting.
Ringkøbing, 31 January 2017
General management:
John Bull Fisker Jørn Nielsen CEO General Manager
Ringkøbing, 31 January 2017
Board of directors:
Jens Lykke Kjeldsen Martin Krogh Pedersen Chairman Deputy Chairman
Gert Asmussen Inge Sandgrav Bak
Jens Møller Nielsen Jørgen Lund Pedersen
Bo Fuglsang Bennedsgaard Dan Astrup Sørensen Employee board member Employee board member
Gitte E. S. Vigsø Employee board member
M A N A G E M E N T S T A T E M E N T
A N N U A L R E P O R T 2 0 1 6 PA G E 4 5
Internal auditor’s report
To the shareholders of Ringkjøbing Landbobank A/S
OpinionIn my opinion, the financial statements for Ringkjøbing Landbobank A/S give a true and fair view of the bank’s assets, liabilities and financial position at 31 December 2016, and of the results of the bank operations and cash flows for the financial year 1 January - 31 December 2016 in accordance with the Danish Financial Business Act.
The auditI have audited the financial statements for Ringkjøbing Landbobank A/S for the financial year 1 January - 31 December 2016, which comprise income statement and statement of comprehensive income, core earnings, balance sheet, statement of changes in equity, statement of capital, cash flow statement, ac-counting policies, accounting estimates and assessments, notes and five-year main and key figures. The financial statements were prepared in accordance with the Danish Financial Business Act.
The audit was performed on the basis of the Danish FSA’s executive order on auditing financial under-takings etc. and financial groups, and in accordance with international auditing standards regarding planning and performing the audit.
I have planned and performed the audit to obtain reasonable assurance as to whether the financial state-ments are free from material misstatement. I participated in the audit of all material and high-risk areas.
I believe that the audit evidence I have obtained is sufficient and appropriate to provide a basis for my opinion.
Statement on management’s reviewThe management is responsible for the management’s review.
My opinion on the financial statements does not cover the management’s review, and I express no form of assurance opinion on that review.
In connection with my audit of the financial statements, my responsibility is to read the management’s review and, in doing so, consider whether it is materially inconsistent with the financial statements or my knowledge obtained in the audit, or otherwise appears to be materially misstated.
I also considered whether management’s review includes the disclosures required by the Danish Finan-cial Business Act.
Based on the work I have performed, in my view, the management’s review is in accordance with the fi-nancial statements and has been prepared in accordance with the requirements of the Danish Financial Business Act. I did not identify any material misstatement in management’s review.
Ringkøbing, 31 January 2017
Henrik Haugaard Chief auditor
A U D I T O R S ’ R E P O R T S

PA G E 4 6 R I N G K J Ø B I N G L A N D B O B A N K A / S
The independent auditor’s report
To the shareholders of Ringkjøbing Landbobank A/S
OpinionIn our opinion, the financial statements give a true and fair view of the financial position of the bank at 31 December 2016, and of the results of the bank operations and cash flows for the financial year 1 January - 31 December 2016 in accordance with the Danish Financial Business Act.
What we have auditedRingkjøbing Landbobank A/S’s financial statements for the financial year 1 January - 31 December 2016 comprise income statement and statement of comprehensive income, core earnings, balance sheet, statement of changes in equity, statement of capital, cash flow statement, accounting policies, accounting estimates and assessments, notes and five-year main and key figures ("the financial state-ments").
Basis of opinionWe conducted our audit in accordance with International Standards on Auditing (ISAs) and the additio-nal requirements applicable in Denmark. Our responsibilities under those standards and requirements are further described in the auditor’s responsibilities for the audit of the financial statements section of our report.
We believe that the audit evidence we have obtained is sufficient and appropriate to provide a basis for our opinion.
IndependenceWe are independent of the bank in accordance with International Ethics Standards Board for Ac-countants’ Code of Ethics for Professional Accountants (IESBA Code) and the additional requirements applicable in Denmark, and we have fulfilled our other ethical responsibilities in accordance with these requirements.
Key audit mattersKey audit matters are those matters that, in our professional judgment, were of most significance in our audit of the financial statements for 2016. These matters were addressed in the context of our audit of the financial statements as a whole, and in forming our opinion thereon, and we do not provide a separate opinion on these matters.
A U D I T O R S ’ R E P O R T S

A N N U A L R E P O R T 2 0 1 6 PA G E 4 7
The independent auditor’s report - continued
Key audit matter How our audit addressed the key audit matter
Impairment of loans
Loans are measured at amortised cost less impairment charges. Impairment of loans constitutes the management’s best esti-mate of expected losses on loans at the balance sheet date ba-sed on events occurred.
Impairment of the bank’s loans is made both individually and collectively. Impairment charges are made if objective evidence of impairment (OEI) has been established based on events oc-curred that have an effect on the amounts expected to be paid. The collective assessment is based on a segmentation model developed by the association Lokale Pengeinstitutter (The As-sociation of Local Banks, Savings Banks and Cooperative Savings Banks in Denmark) adjusted by the management to allow for changes in economic trends, including previous events.
Due to the continuing considerable financial challenges facing the agricultural sector, a material part of the bank’s impairment charges relates to this sector. The situation of the agricultural sec-tor implies increased uncertainty with respect to the statement of the required impairment relating to the agricultural sector.
Impairment of loans constitutes a key focus area as the ma-nagement makes material estimates with respect to whether impairment charges are to be recorded on loans as well as the amount of the impairment charges.
Our audit focused on the following types of impairment:
• The bank’s procedures to ensure complete registration of loans with OEI included in the calculation of the impair-ment charges.
• The most material assumptions and estimates applied by the management in the calculation of the impairment charges, including principles for assessment of collateral with respect to e.g. properties and agricultural land included in the cal-culation of the impairment charges.
• The bank’s statement of collective impairment charges, including procedures for the identification and assessment of the effect of previous events in relation to customers who may be suffering from significant financial difficulties at the balance sheet date but where this has not yet materialised through delinquency or other indication of OEI. This inclu-des the management’s assessment of the effect of the cur-rent market conditions, including price conditions in the agricultural sector, at the balance sheet date.
We refer to note 36 "Risks and risk management" and note 37 "Credit risk" to the financial statements which show factors that may affect the impairment of loans.
We reviewed and assessed the pro-cedures prepared by the bank, inclu-ding the involvement of the credit department, established to ensure that loans with OEI are identified in due time, and that impairment charges are calculated in accordance with the accounting provisions.
We assessed and tested the princip-les applied by the management for the measurement of collateral with respect to e.g. property and agricul-tural land included in the calculation of the impairment of loans with OEI.
We performed detailed testing of a sample of loans with OEI for which the bank had calculated individual impairment charges; we tested the calculation and data applied against underlying documentation. We mo-reover performed detailed testing of a sample of loans not classified as being subject to OEI and made our own assessment of whether the rating classification was appropriate. The samples comprised primarily ma-jor loans and loans to segments with generally increased risks, including the agricultural segment.
We examined the bank’s statement of collective impairment charges, including the management’s assess-ment of the effect of changed eco-nomic trends and previous events. We challenged the management’s estimates based on our knowledge of the portfolio, the industry and the current economic trends.

PA G E 4 8 R I N G K J Ø B I N G L A N D B O B A N K A / S
A U D I T O R S ’ R E P O R T S
The independent auditor’s report - continued
Statement on management’s review The management is responsible for the management’s review.
Our opinion on the financial statements does not cover the management’s review, and we do not express any form of assurance conclusion thereon.
In connection with our audit of the financial statements, our responsibility is to read the management’s review and, in doing so, consider whether the management’s review is materially inconsistent with the financial statements or our knowledge obtained in the audit, or otherwise appears to be materially mis-stated.
Moreover, we considered whether the management’s review includes the disclosures required by the Danish Financial Statements Act.
Based on the work we have performed, in our view, the management’s review is in accordance with the financial statements and has been prepared in accordance with the requirements of the Danish Finan-cial Business Act. We did not identify any material misstatement in the management’s review.
Management’s responsibilities for the financial statementsThe management is responsible for the preparation of financial statements that give a true and fair view in accordance with the Danish Financial Business Act, and for such internal control as the management determines is necessary to enable the preparation of financial statements that are free from material misstatement, whether due to fraud or error.
In preparing the financial statements, the management is responsible for assessing the bank’s ability to continue as a going concern, disclosing, as applicable, matters related to going concern and using the going concern basis of accounting in preparing the financial statements unless the management either intends to liquidate the bank or to cease operations, or has no realistic alternative but to do so.
Auditor’s responsibilities for the audit of the financial statementsOur objectives are to obtain reasonable assurance about whether the financial statements as a whole are free from material misstatement, whether due to fraud or error, and to issue an auditor’s report that includes our opinion. Reasonable assurance is a high level of assurance, but is not a guarantee that an audit conducted in accordance with ISAs and the additional requirements applicable in Denmark will al-ways detect a material misstatement when it exists. Misstatements can arise from fraud or error and are considered material if, individually or in the aggregate, they could reasonably be expected to influence the economic decisions of users taken on the basis of these financial statements.
As part of an audit conducted in accordance with ISAs and the additional requirements applicable in Denmark, we exercise professional judgment and maintain professional scepticism throughout the audit. We also:
• Identify and assess the risks of material misstatement of the financial statements, whether due to fraud or error, design and perform audit procedures responsive to those risks, and obtain audit evi-dence that is sufficient and appropriate to provide a basis for our opinion. The risk of not detecting a material misstatement resulting from fraud is higher than for one resulting from error as fraud may involve collusion, forgery, intentional omissions, misrepresentations or the override of internal control.
• Obtain an understanding of internal control relevant to the audit in order to design audit procedu-res that are appropriate in the circumstances, but not for the purpose of expressing an opinion on the effectiveness of the bank’s internal control.

A N N U A L R E P O R T 2 0 1 6 PA G E 4 9
The independent auditor’s report - continued
• Evaluate the appropriateness of accounting policies used and the reasonableness of accounting estimates and related disclosures made by the management.
• Conclude on the appropriateness of the management’s use of the going concern basis of ac-counting in preparing the financial statements and, based on the audit evidence obtained, whether a material uncertainty exists related to events or conditions that may cast significant doubt on the bank’s ability to continue as a going concern. If we conclude that a material uncertainty exists, we are required to draw attention in our auditor’s report to the related disclosures in the financial statements or, if such disclosures are inadequate, to modify our opinion. Our conclusions are based on the audit evidence obtained up to the date of our auditor’s report. However, future events or conditions may cause the bank to cease to continue as a going concern.
• Evaluate the overall presentation, structure and contents of the financial statements, including the disclosures, and whether the financial statements represent the underlying transactions and events in a manner that gives a true and fair view.
We communicate with those charged with governance regarding, among other matters, the planned scope and timing of the audit and significant audit findings, including any significant deficiencies in internal control that we identify during our audit.
We also provide those charged with governance with a statement that we have complied with relevant ethical requirements regarding independence, and to communicate with them all relationships and other matters that may reasonably be thought to bear on our independence, and where applicable, related safeguards.
From the matters communicated with those charged with governance, we determine those matters that were of most significance in the audit of the financial statements of the current period and are therefore the key audit matters. We describe these matters in our auditor’s report unless law or regulation precludes public disclosure about the matter or when, in extremely rare circumstances, we determine that a matter should not be communicated in our report because the adverse consequences of doing so would reasonably be expected to outweigh the public interest benefits of such communica-tion.
Ringkøbing, 31 January 2017
PricewaterhouseCoopers Statsautoriseret Revisionspartnerselskab
CVR No 33 77 12 31
H. C. KroghState Authorised Public Accountant

PA G E 5 0 R I N G K J Ø B I N G L A N D B O B A N K A / S

A N N U A L R E P O R T 2 0 1 6 PA G E 5 1
Page 52 Statements of income and comprehensive income 52 Proposed distribution of profit 53 Core earnings 54 Balance sheet 56 Statement of changes in equity 57 Statement of capital 58 Cash flow statement 60 Accounting policies 65 Accounting estimates and assessments 66 Overview of notes 67 Notes 92 Five-year main figures 94 Five-year key figures
F I N A N C I A L S T A T E M E N T S

PA G E 5 2 R I N G K J Ø B I N G L A N D B O B A N K A / S
Note 2016 2015no. DKK 1,000 DKK 1,000
1 Interest income 749,021 736,995
2 Interest expenses 69,743 91,165
Net interest income 679,278 645,830
3 Dividends from shares etc. 18,995 13,010
4 Fee and commission income 297,328 301,076
4 Fee and commission expenses 42,417 41,687
Net interest and fee income 953,184 918,229
5 Value adjustments +63,784 +29,583
Other operating income 7,560 4,964
6,7,8,9 Staff and administration costs 306,670 281,634
10 Amortisation, depreciation and write-downs on intangible and tangible assets 8,638 7,351Other operating expenses Miscellaneous other operating expenses 26 68 Costs Guarantee Fund and Resolution Fund 2,292 17,233
11 Impairment charges for loans and other receivables etc. -48,378 -60,367
Results from investments in associated companies +2,842 +2,137
Profit before tax 661,366 588,260
12 Tax 121,868 129,595
Net profit for the year 539,498 458,665
Other comprehensive income 0 0
Total comprehensive income for the year 539,498 458,665
STATEMENTS OF INCOME AND COMPREHENSIVE INCOME
2016
DKK 1,000
2015
DKK 1,000
Net profit for the year 539,498 458,665
Total amount available for distribution 539,498 458,665
Appropriated for ordinary dividend 164,520 140,100
Appropriated for charitable purposes 500 500
Transfer to net revaluation reserve under the equity method -2,159 +2,137
Transfer to retained earnings 376,637 315,928
Total distribution of the amount available 539,498 458,665
P R O P O S E D D I S T R I B U T I O N O F P R O F I T

A N N U A L R E P O R T 2 0 1 6 PA G E 5 3
C O R E E A R N I N G S
Note
no.
2016
DKK 1,000
2015
DKK 1,000
Net interest income 665,312 637,960
4 Net fee and commission income excl. trading income 214,415 211,541
Income from sector shares etc. 38,611 36,413
4 Foreign exchange income 16,396 15,812
Other operating income 7,560 4,964
Total core income excl. trading income 942,294 906,690
4 Trading income 40,496 47,848
Total core income 982,790 954,538
6 Staff and administration costs 306,670 281,634
10 Amortisation, depreciation and write-downs on intangible and tangible assets 8,638 7,351Other operating expenses 2,318 17,301
Total expenses etc. 317,626 306,286
Core earnings before impairment charges for loans 665,164 648,252
11 Impairment charges for loans and other receivables etc. -48,378 -60,367
Core earnings 616,786 587,885
Result for the portfolio +44,580 +375
Profit before tax 661,366 588,260
12 Tax 121,868 129,595
Net profit for the year 539,498 458,665

PA G E 5 4 R I N G K J Ø B I N G L A N D B O B A N K A / S
B A L A N C E S H E E T
Noteno.
31 Dec. 2016DKK 1,000
31 Dec. 2015DKK 1,000
Assets
Cash in hand and demand deposits with central banks 284,139 331,563
13 Receivables from credit institutions and central banks 2,077,096 717,602 Receivables with notice from central banks 1,572,198 130,019 Money market operations and bilateral loans
- term to maturity less than 1 year
355,898
262,583 Bilateral loans - term to maturity more than 1 year 149,000 325,000
14,15 Loans and other receivables at amortised cost 17,481,838 17,299,920 Loans and other receivables at amortised cost 17,481,838 17,016,732 Loans and other receivables at amortised cost 16,472,015 15,914,993 Wind turbine loans with direct funding 1,009,823 1,101,739 Collateralised repurchase agreements / reverse repo transactions 0 283,188
16 Bonds at fair value 3,443,359 3,114,721
17 Shares etc. 530,503 467,049
Investments in associated companies 509 2,667
18 Land and buildings, total 56,177 64,287 Investment properties 3,561 6,056 Domicile properties 52,616 58,231
19 Other tangible assets 18,874 4,206
Current tax assets 20,444 71,624
20 Deferred tax assets 8,153 0
Temporary assets 5,200 5,200
21 Other assets 323,848 296,871
Prepayments 7,997 7,970
Total assets 24,258,137 22,383,680
B A L A N C E S H E E T

A N N U A L R E P O R T 2 0 1 6 PA G E 5 5
Note no.
31 Dec. 2016 DKK 1,000
31 Dec. 2015 DKK 1,000
Liabilities and equity
22 Debt to credit institutions and central banks 1,457,792 1,502,586 Money market operations and bilateral credits
- term to maturity less than 1 year
280,698
344,879 Bilateral credits - term to maturity more than 1 year 167,271 55,968 Bilateral credits from KfW Bankengruppe 1,009,823 1,101,739
23 Deposits and other debt 18,314,427 16,986,543
24 Issued bonds at amortised cost 297,370 0
25 Other liabilities 254,062 208,988
Deferred income 2,449 1,130
Total debt 20,326,100 18,699,247
20 Provisions for deferred tax 0 10,579
15 Provisions for losses on guarantees 6,287 5,478
Total provisions for liabilities 6,287 16,057
Tier 2 capital 371,095 372,278
26 Total subordinated debt 371,095 372,278
27 Share capital 22,850 23,350
Net revaluation reserve under the equity method 158 2,317
Retained earnings 3,366,627 3,129,831
Proposed dividend etc. 165,020 140,600
Total shareholders’ equity 3,554,655 3,296,098
Total liabilities and equity 24,258,137 22,383,680

PA G E 5 6 R I N G K J Ø B I N G L A N D B O B A N K A / S
S T A T E M E N T O F C H A N G E S I N E Q U I T Y
DKK 1,000Share
capital
Net revaluation
reserve under the
equity method
Retained earnings
Proposed dividend
etc.
Total share-
holders’ equity
2015
Shareholders’ equity at the end of the previous financial year
23,900
178
2,949,750
124,780
3,098,608
Reduction of share capital -550 550 0
Dividend etc. paid -124,780 -124,780
Dividend received on own shares 3,385 3,385
Shareholders’ equity after distribution of dividend etc.
23,350
178
2,953,685
0
2,977,213
Purchase of own shares -640,370 -640,370
Sale of own shares 500,590 500,590
Total comprehensive income for the year 2,139 315,926 140,600 458,665
Shareholders’ equity on the balance sheet date
23,350
2,317
3,129,831
140,600
3,296,098
2016
Shareholders’ equity at the end of the previous financial year
23,350
2,317
3,129,831
140,600
3,296,098
Reduction of share capital -500 500 0
Dividend etc. paid -140,600 -140,600
Dividend received on own shares 3,344 3,344
Shareholders’ equity after distribution of dividend etc.
22,850
2,317
3,133,675
0
3,158,842
Purchase of own shares -481,310 -481,310
Sale of own shares 337,625 337,625
Total comprehensive income for the year -2,159 376,637 165,020 539,498
Shareholders’ equity on the balance sheet date
22,850
158
3,366,627
165,020
3,554,655

A N N U A L R E P O R T 2 0 1 6 PA G E 5 7
S T A T E M E N T O F C A P I T A L
31 Dec. 2016 DKK 1,000
31 Dec. 2015 DKK 1,000
Credit risk 14,743,046 14,173,867
Market risk 1,749,099 1,539,489
Operational risk 1,827,053 1,750,809
Total risk exposure 18,319,198 17,464,165
Shareholders’ equity 3,554,655 3,296,098
Proposed dividend etc. -165,020 -140,600
Deduction for prudent valuation -5,834 -3,910
Deduction for the sum of equity investments etc. above 10% -233,381 -118,672
Deduction of trading limit for own shares -55,000 -55,000
Actual utilisation of the trading limit for own shares 4,649 1,221
Common equity tier 1 capital 3,100,069 2,979,137
Tier 1 capital 3,100,069 2,979,137
Tier 2 capital 371,713 373,125
Deduction for the sum of equity investments etc. above 10% -117,109 -76,769
Total capital 3,354,673 3,275,493
Common equity tier 1 capital ratio (%) 16.9 17.1
Tier 1 capital ratio (%) 16.9 17.1
Total capital ratio (%) 18.3 18.8
Total capital requirement 1,465,536 1,397,133

PA G E 5 8 R I N G K J Ø B I N G L A N D B O B A N K A / S
C A S H F L O W S T A T E M E N T
2016 DKK 1,000
2015 DKK 1,000
Operating activities
Net profit for the year 539,498 458,665
Amortisation, depreciation and write-downs on intangible and tangible assets 8,638 7,351Impairment charges for loans and other receivables etc. 80,844 98,802
Other items not affecting cash flow -20,423 -6,832
Adjusted operating profit 608,557 557,986
Changes in working capital
Receivables from and debt to credit institutions etc., net 135,271 -776,153
Loans and other receivables at amortised cost -262,762 -1,891,588
Securities, not liquid and pledged 96,406 -184,317
Deposits and other debt 1,327,884 1,536,270
Issued bonds at amortised cost 297,370 -236,238
Other assets and liabilities, net 71,378 17,772
Cash flows from operating activities 2,274,104 -976,268
Investment activities
Tangible assets, purchase -19,272 -3,979
Tangible assets, sale 2,925 0
Investments in associated companies, sale 5,000 0
Cash flows from investment activities -11,347 -3,979
Financing activities
Dividend etc. paid, net -137,256 -121,395
Own shares etc. -143,685 -139,780
Subordinated debt, issued 0 372,278
Subordinated debt, repaid etc. -1,183 -365,667
Cash flows from financing activities -282,124 -254,564
Movement in cash and cash equivalents for the year 1,980,633 -1,234,811
Cash and cash equivalents, beginning of year 3,603,408 4,838,219
Total cash and cash equivalents, end of year 5,584,041 3,603,408
Cash and cash equivalents, end-of-year breakdown:
Cash in hand and demand deposits with central banks 284,139 331,563
Receivables from credit institutions and central banks 1,768,161 228,602
Securities, unpledged 3,531,741 3,043,243
Total cash and cash equivalents, end of year 5,584,041 3,603,408
The cash flow statement cannot be derived from this annual report, and has also been adapted to the special format etc. for banks.

A N N U A L R E P O R T 2 0 1 6 PA G E 5 9
O V E R V I E W O F N O T E S

PA G E 6 0 R I N G K J Ø B I N G L A N D B O B A N K A / S
Basis for preparing the annual report
General
The annual report is prepared in accordance with the provisions of the Danish Financial Business Act and other Danish disclosure requirements for the financial statements of listed financial companies.
The annual report is presented in DKK.
The bank has changed its accounting policy for the classification of collateral under CSA agreements, which is shown under the item "Other assets" from and including the 2016 financial year, while in 2015 it was offset under the item "Other liabilities". The comparative figures have been adjusted. The ac-counting policies are otherwise unchanged since last financial year.
Recognition and measurement - general
Assets are recognised in the balance sheet when it is probable that future financial advantages will ac-crue to the bank and the value can be measured reliably. Liabilities are recognised in the balance sheet when they are probable and can be measured reliably.
Income is recognised in the income statement as it is earned. Costs paid to achieve the income for the year are recognised in the income statement, and value adjustments made to financial assets, financial liabilities and derivative financial instruments are also recognised in the income statement.
We refer to the following sections regarding the criteria for recognition and the basis of measurement.
Foreign currency
Assets and liabilities in foreign currency are converted to Danish kroner at the closing exchange rate for the currency on the balance sheet date, corresponding to the rate published by the central bank of Denmark. Income and expenses are converted continuously at the exchange rate on the transaction date.
Financial instruments - general
In general, the bank measures financial assets and liabilities at fair value on initial recognition. Mea-suring is subsequently made at fair value unless otherwise specifically stated in the following sections on the individual items. The bank uses the date of payment as the date of recognition for financial instruments.
Derivative financial instruments
Forward transactions, interest rate swaps and other derivative financial instruments are measured at fair value on the balance sheet date.
Hedging transactions which, under the terms of the Danish Financial Supervisory Authority’s Executive Order on Financial Reports for Credit Institutions and Investment Firms etc., are regarded as hedge accounting at fair value, are recognised at fair value on the balance sheet date with respect to both the hedging instrument and the hedged part of the financial instrument.
All value adjustments concerning derivative financial instruments and items subject to hedge accoun-ting are entered under the item "Value adjustments" in the income statement.
The income statement
Interest income
Interest income is recognised by the effective interest method, under which interest income includes the allocated portion of establishment fees etc., which are considered to be part of the effective interest on the loan.
On loans which in have been written down or off, the interest income relating to the written-down part is entered under the item "Impairment charges for loans and receivables etc.".
Net fee and commission income
Fees and commissions relating to loans and receivables are recognised as part of the book value of loans and receivables. They are recognised as interest income in the income statement over the term of the loans and receivables, as part of the effective interest rate on the loans. See "Interest income" section above. Guarantee-related commission is carried to income over the guarantee term. Income generated on performing a given transaction, including securities and custodianship fees plus payment handling fees, is recognised as income when the transaction has been completed.
A C C O U N T I N G P O L I C I E S

A N N U A L R E P O R T 2 0 1 6 PA G E 6 1
Staff and administration costs
Staff and administration costs include salaries, pension costs, IT costs, etc.
Other operating expenses
Other operating expenses include contributions to the Guarantee Fund and the Resolution Fund. Other operating expenses also include items which, by nature, are secondary to the banking activities.
Impairment charges for loans and receivables etc.
This item includes losses and impairment charges for loans and losses and provisions on guarantees. The item also includes losses and impairment charges on receivables from credit institutions.
Tax
Tax on the profit for the year is booked as a cost in the income statement.
Net deferred tax is calculated on the items which cover the temporary differences in accounting and booking of taxable income and expenses. Changes in the corporate tax rate will be taken into account.
Core earnings
The bank uses the alternative performance measure "Core earnings". Core earnings are used as a mea-sure of performance for both external and internal financial reporting because they are deemed to give a true and fair view of the actual banking operations. Overall, core earnings contain the same items as the traditional measure of performance "Profit before tax", but the calculation method and degree of specification are different.
Core earnings show the bank’s income and expenses adjusted for temporary fluctuations following from the development in the bank’s trading portfolio of securities (the securities portfolio less sector shares etc.), and the profit before tax is divided into two main elements: core earnings and result for the port-folio.
The result for the trading portfolio is composed of value adjustments for the portfolio plus the actual return in the form of interest and dividends from the portfolio and less the calculated funding costs for the portfolio.
The balance sheet
Receivables from credit institutions and central banks
Initial recognition is made at fair value plus transaction costs, less establishment fees etc., and subse-quent measurement is at amortised cost. Reference is made to the section "Derivative financial instru-ments" with respect to hedge accounting.
Loans and other receivables
Initial recognition is made at fair value plus transaction costs, less establishment fees etc., and subse-quent measurement is at amortised cost. Establishment fees etc. which are comparable with ongoing interest payments, and thus deemed part of the effective interest on the loan, are accrued over the life of the individual loan.
If objective evidence of impairment is found on an individually assessed loan, an impairment charge is made to cover the bank’s loss on the basis of expected future payment series. This is based on an as-sessment of the most likely outcome.
Loans and receivables which have not been individually impaired are collectively assessed for objective evidence of impairment in value for the group.
This collective assessment is made on groups of loans and receivables with uniform credit risk charac-teristics. 12 groups are used: one of public clients, one of private clients and 10 of business clients, the latter further grouped by sector.
The collective assessment is made on a segmentation model developed by Lokale Pengeinstitutter (The the Association of Local Banks, Savings Banks and Cooperative Savings Banks in Denmark), which hand-les ongoing maintenance and development. The segmentation model sets the relations in the individual groups between losses suffered and a number of significant explanatory macroeconomic variables via a linear regression analysis. The explanatory macroeconomic variables include unemployment, house prices, interest rates, number of bankruptcies / forced sales etc.

PA G E 6 2 R I N G K J Ø B I N G L A N D B O B A N K A / S
A C C O U N T I N G P O L I C I E S
The macroeconomic segmentation model is initially calculated from loss data for the entire banking sector. The bank has therefore assessed whether the model estimates reflect the credit risk for the bank’s own loan portfolio.
This assessment has resulted in an adaptation of the estimates under the model to the bank’s own cir-cumstances, whereby the adapted estimates form the basis of calculation of the collective impairment charges. The adjusted estimates were further adjusted, by management estimate, to take account of changed economic conditions, including early events. For each group of loans and receivables, there is an estimate which expresses the percentage decrease in value associated with a given group of loans and receivables on the balance sheet date. A comparison of the individual loan’s current risk of loss with its original risk of loss and its risk of loss at the beginning of the current accounting period provides the individual loan’s contribution to the collective impairments. Impairment is calculated as the difference between book value and discounted value of expected future payments.
Changes made to impairments are adjusted in the income statement under the item "Impairment charges for loans and receivables etc.".
Sales and repurchase agreements (repo / reverse repo transactions)
Securities which have been sold under associated repurchase agreements remain listed under securities in the balance sheet. Amounts received are recognised as deposits or debt to credit institutions.
Securities which have been bought under associated resale agreements are recognised as loans to, or receivables from, credit institutions and the return is recognised under "Interest income".
Bonds and shares
Securities listed on a stock exchange are measured at fair value determined at the quoted price, best expressed as the closing price on the balance sheet date.
Unlisted securities and other ownership interests (including level 3 assets) are included at fair value, computed on the basis of the price of a transaction between independent parties. If no current market data exist, fair value is determined from published announcements of financial results, or alternatively using a yield model based on payment flows and other available information.
The management actively considers the fair value computations.
All ongoing value adjustments to listed and unlisted securities are entered in the income statement under the item "Value adjustments".
Investments in associated companies
Investments in associated companies are measured in the balance sheet by the equity method.
Land and buildings
Land and buildings cover the two items "Investment properties" and "Domicile properties". The proper-ties which house the bank’s branches are included under domicile properties, while other properties are considered to be investment properties.
Investment properties are included in the balance sheet at fair value, computed by the return method. Ongoing changes in value of investment properties are recognised in the income statement.
Domicile properties are included in the balance sheet at reassessed value, which is the fair value computed by the return method less cumulative depreciation and any impairment loss. Depreciation is calculated on the basis of an expected useful life of 50 years, computing depreciation as cost plus or minus revaluation less scrap value. Depreciation and losses due to impairment are recognised in the income statement, while increases in reassessed value are recognised in total comprehensive income in shareholders’ equity under the item "Provisions for revaluation" unless the increase corresponds to a reduction in value which was previously recognised in the income statement.
Other tangible assets
Other tangible assets, including operating equipment and improvements to rented premises, are re-cognised in the balance sheet at cost less cumulative depreciation and write-downs for any loss due to impairment.
Depreciation is calculated on the basis of the assets’ expected useful lives, which are 1 - 5 years for operating equipment and 30 years for improvement to rented premises, on the basis of depreciation computed as cost less scrap value. Depreciation and losses due to impairment are recognised in the income statement.

A N N U A L R E P O R T 2 0 1 6 PA G E 6 3
Temporary assets
Temporary assets comprise assets taken over as a result of termination of customer exposures, the in-tention being to sell off the assets as soon as possible. Temporary assets are included at cost on transfer and will subsequently be written down to a possibly lower realisation value.
Other assets
Other assets include interest and commission receivables as well as the positive market value of deriva-tive financial instruments.
Tax
Actual tax assets and actual tax liabilities are recognised in the balance sheet as tax calculated on the taxable income for the year, adjusted for tax paid on account.
A deferred tax liability is allocated under the item "Provisions for deferred tax". A deferred tax asset is booked under the item "Deferred tax assets" following a prudent assessment of the asset’s value.
The effect of changes in the corporate tax rate is recognised in "Deferred tax assets" / "Provisions for deferred tax".
Debt to credit institutions and central banks / Deposits and other debt / Issued bonds at amortised cost / Subordinated debt
Measurement is at amortised cost, but reference is made to the section "Derivative financial instru-ments" with respect to hedge accounting.
Other liabilities
Other liabilities include interest and commissions payable and the negative market value of derivative financial instruments.
Provisions for liabilities
Provisions for liabilities include deferred tax and provisions for losses on guarantees. A provision is recognised in respect of a guarantee or an irrevocable credit commitment if it is probable that the guarantee or credit commitment will be called and the amount of the commitment can be reliably determined. Provisions are based on management’s best estimate of the amount of the commitments. In measuring provisions for liabilities, discounting to net present value is made where deemed material.
Various information
Contingent liabilities / guarantees
The bank’s outstanding guarantees are given in the notes under the item "Contingent liabilities". If the bank considers it likely that it will incur loss on an outstanding guarantee, the liability is shown under the item "Provisions for losses on guarantees" and recognised as an expense in the income statement under the item "Impairment charges for loans and receivables etc.".
Cash flow statement
The cash flow statement is presented by the indirect method based on net profit for the year, adjusted for non-liquid items.
The statement shows net changes in the balance sheet, and on some points it will therefore not provide a full picture of actual cash flows.
Cash flows from operating activities are computed as net profit for the year, adjusted for non-liquid operating items and changes in working capital. Cash flows from investment activities cover purchases and sales of fixed assets etc. Cash flows from financing activities cover movements and allocations in subordinated debt and in shareholders’ equity.
Cash and cash equivalents cover cash in hand, demand deposits with the central bank of Denmark, fully secured and liquid demand deposits in banks, unpledged certificates of deposit issued by the central bank of Denmark, and secured easily saleable listed unpledged securities, under Section 152 of the Danish Financial Business Act.
Information and main and key figures
"Loans" on page 3 are stated exclusive of reverse repo transactions etc.
The "Return on equity before tax, beginning of year", and the "Return on equity after tax, beginning of year" shown on page 3 under "Main and key figures for the bank" were calculated after deduction of dividend etc., net.

PA G E 6 4 R I N G K J Ø B I N G L A N D B O B A N K A / S
A C C O U N T I N G P O L I C I E S
"Key figures per DKK 5 share" on page 3 were calculated on the basis of 2016: 4,470,000 shares, 2015: 4,570,000 shares, 2014: 4,670,000 shares, 2013: 4,780,000 shares and 2012: 4,840,000 shares.
The rate of costs is calculated as "Total expenses etc." in per cent of "Total core income". Both "Total expenses etc." and "Total core income" are indicated under "Core earnings" on page 53.
Pay-out ratios
Detailed comments on the pay-out ratios on page 18.
The pay-out ratios in general: Pay-out ratios for the individual years were computed as the actual distributions for the year in per cent of "Net profit for the year". Actual distributions were calculated as the proposed and subsequently paid dividend, any proposed and subsequently paid extraordinary dividend and the actual cost of buying back the shares under an adopted share buy-back programme which were actually cancelled, on the basis of the profit for a given financial year.
Extraordinary dividend 2012: At the bank’s annual general meeting in February 2014, a proposal was made and accepted for payment of extraordinary dividend relating to the 2012 financial year, and the extraordinary dividend is therefore included in the pay-out ratio calculated for that financial year.
2015 buy-back programme: The buy-back programme adopted at the bank’s annual general meeting in February 2016 was fully used at DKK 140 million (the equivalent of 99,749 shares). To this must be added 251 shares (the equivalent of DKK 0.4 million) from the bank’s trading portfolio of own shares. The total distribution is thus DKK 140.4 million, and it is recommended that 100,000 shares be cancelled in connection with a capital reduction at the annual general meeting in February 2017.
Pay-out ratios for 2016: The percentage for 2016 is the expected distribution. The percentage was thus calculated on the basis of the proposed ordinary dividend and the maximum value of the proposed share buy-back programme.
Future accounting rules
At the time of publication of this annual report, a number of provisions are being changed in the Da-nish executive order on financial statements which is compatible with the IFRS. The reason is the new international reporting standard IFRS 9 Financial Instruments.
The general provisions of IFRS 9 will be incorporated in the Danish order on financial statements.
The updated Danish order is expected to enter into force for financial reporting periods starting on 1 January 2018.
IFRS 9, which is being incorporated in the Danish accounting rules, materially changes the current impairment rules.
With the introduction of IFRS 9, the current impairment model, which is an incurred loss model, will be replaced by an expected loss model. The new expected loss model means that, on initial recognition, a financial asset must be impaired by the expected credit loss for a 12-month period (stage 1). If the credit risk for the asset subsequently increases significantly relative to initial recognition, the asset must be impaired by the expected credit loss over the asset’s expected remaining life (stage 2). If there is objective evidence of impairment (stage 3), the asset must also be impaired by the expected credit loss over the asset’s expected remaining life, but based on an increased probability of loss.
Development work is in progress under the auspices of the bank’s data centre, Bankdata, with participants from the attached banks and Lokale Pengeinstitutter (The Association of Local Banks, Savings Banks and Cooperative Banks in Denmark), with a view to developing an impairment model compatible with IFRS 9.
It is not possible to provide a reasonable estimate now of the effect on the accounts of first applica-tion of the new IFRS 9 compatible impairment rules. However the implementation of these rules is not expected to materially influence the bank’s situation.
Any negative impact of the new expected loss-based IFRS 9 impairment rules on the accounts will in principle apply similarly to total capital. With a view to countering an unintended effect on total capital and consequently the banks’ possibilities of supporting credit granting, the European Commission has proposed a five-year transition programme as part of the reform package introduced by the Commis-sion on 23 October 2016 (the capital requirements package), under which any negative effect of the new IFRS 9 impairment rules will not have the full impact on total capital until after five years.

A N N U A L R E P O R T 2 0 1 6 PA G E 6 5
ACCOUNTING ESTIMATES AND ASSESSMENTS
General
In computing the book value of certain assets and liabilities, an estimate has been made of how future events will affect the value of the assets and liabilities on the balance sheet date.
The estimates are based on assumptions which management judges to be responsible, but which are not certain and predictable. The final actual results may thus deviate from the estimates, as the bank is subject to risks and uncertainties which can affect the results.
The most important estimates concern the following areas:
• Valuation of loans and other receivables at amortised cost
• Fair value of unlisted financial instruments
• Fair value of domicile properties
Valuation of loans and other receivables at amortised costImpairment charges for loans are made to take account of any impairment after initial recognition. Impairment charges are made as a combination of individual and collective impairment. They involve a number of estimates, including estimates of which loans, or loan portfolios, are associated with objec-tive evidence of impairment.
Impairment testing of individual loans involves estimating circumstances which are highly uncertain. The assessment involves estimating the most probable future cash flows which the customer is ex-pected to generate.
Loans without objective evidence of impairment, or for which an individual need for impairment has not been identified, are part of a group, and the need for impairment is assessed at portfolio level. The key aspect of impairment testing of a group of loans is to identify the events which provide an objective indication that losses have been incurred on the group. Assessment of the present value of cash flows generated by the customers in the group involves uncertainty when historical data is used to reflect the current situation. Loans are placed in groups with uniform credit risk characteristics. The reader is refer-red to "Accounting policies" under "Loans and other receivables" for details on collective impairment.
To reduce the risk of the individual exposures, the bank receives security mainly in the form of physical assets (with real property as the main form), securities etc. Material managerial estimates are involved in valuing the security. A detailed description of security is provided in note 37 "Credit risk".
Fair value of unlisted financial instrumentsThe bank measures a number of financial instruments at fair value, including all derivative financial instruments and unlisted shares and bonds.
As part of its operations, the bank has acquired strategic shares in different sector companies. Strategic shares in sector companies are measured at fair value on the basis of available information on transacti-ons in the relevant company’s shares or, alternatively, by a valuation model using recognised methods and various data. Valuation is also influenced by co-ownership, trading, shareholders’ agreements etc.
Valuation of financial instruments, which is based on observable market data only to a lesser extent, is influenced by estimates. This is the case, for example, with respect to unlisted shares and certain bonds where there is no active market. Please also see the sections "Derivative financial instruments" and "Bonds and shares" under "Accounting policies".
Fair value of domicile propertiesThe return method is used for measuring domicile properties at fair value. The future cash flows are based on the bank’s best estimate of the future profit or loss from ordinary activities and the required rate of return for each property, taking into account factors such as location and maintenance. A num-ber of these assumptions and estimates significantly influence the calculations. Any changes in these parameters as a result of changes in market conditions affect the expected returns and consequently the domicile properties’ fair values. Please also see the section "Land and buildings" under "Accounting policies" and note 18 "Land and buildings".
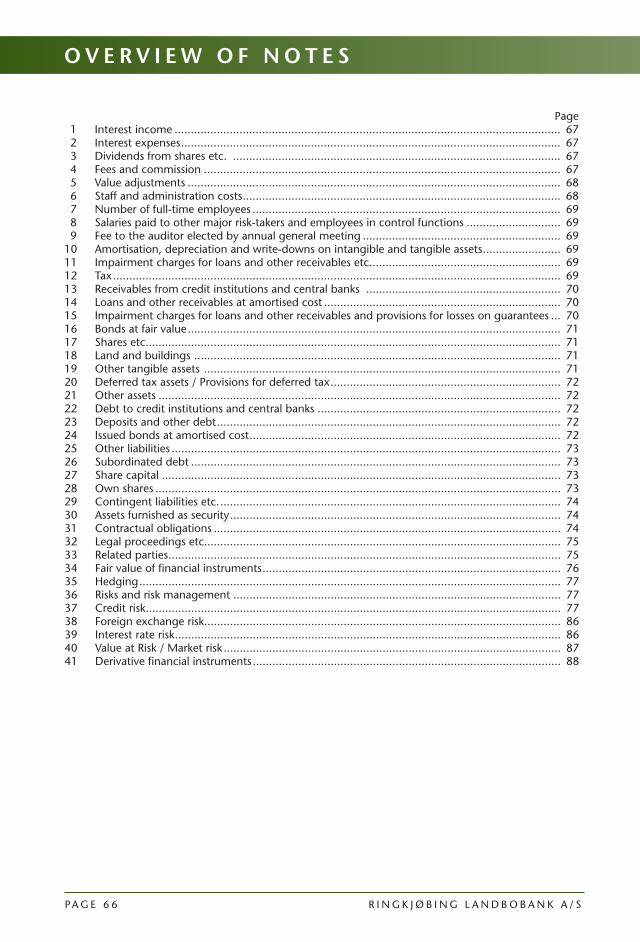
PA G E 6 6 R I N G K J Ø B I N G L A N D B O B A N K A / S
O V E R V I E W O F N O T E S
Page 1 Interest income ....................................................................................................................... 67 2 Interest expenses ..................................................................................................................... 67 3 Dividends from shares etc. ..................................................................................................... 67 4 Fees and commission .............................................................................................................. 67 5 Value adjustments ................................................................................................................... 68 6 Staff and administration costs .................................................................................................. 68 7 Number of full-time employees ............................................................................................... 69 8 Salaries paid to other major risk-takers and employees in control functions ............................. 69 9 Fee to the auditor elected by annual general meeting ............................................................. 6910 Amortisation, depreciation and write-downs on intangible and tangible assets ........................ 6911 Impairment charges for loans and other receivables etc. .......................................................... 6912 Tax .......................................................................................................................................... 6913 Receivables from credit institutions and central banks ............................................................ 7014 Loans and other receivables at amortised cost ......................................................................... 7015 Impairment charges for loans and other receivables and provisions for losses on guarantees ... 7016 Bonds at fair value ................................................................................................................... 7117 Shares etc................................................................................................................................ 7118 Land and buildings ................................................................................................................. 7119 Other tangible assets .............................................................................................................. 7120 Deferred tax assets / Provisions for deferred tax ....................................................................... 7221 Other assets ............................................................................................................................ 7222 Debt to credit institutions and central banks ........................................................................... 7223 Deposits and other debt .......................................................................................................... 7224 Issued bonds at amortised cost ................................................................................................ 7225 Other liabilities ........................................................................................................................ 7326 Subordinated debt .................................................................................................................. 7327 Share capital ........................................................................................................................... 7328 Own shares ............................................................................................................................. 7329 Contingent liabilities etc. ......................................................................................................... 7430 Assets furnished as security ...................................................................................................... 7431 Contractual obligations ........................................................................................................... 7432 Legal proceedings etc.............................................................................................................. 7533 Related parties ......................................................................................................................... 7534 Fair value of financial instruments ............................................................................................ 7635 Hedging .................................................................................................................................. 7736 Risks and risk management ..................................................................................................... 7737 Credit risk ................................................................................................................................ 7738 Foreign exchange risk .............................................................................................................. 8639 Interest rate risk ....................................................................................................................... 8640 Value at Risk / Market risk ........................................................................................................ 8741 Derivative financial instruments ............................................................................................... 88
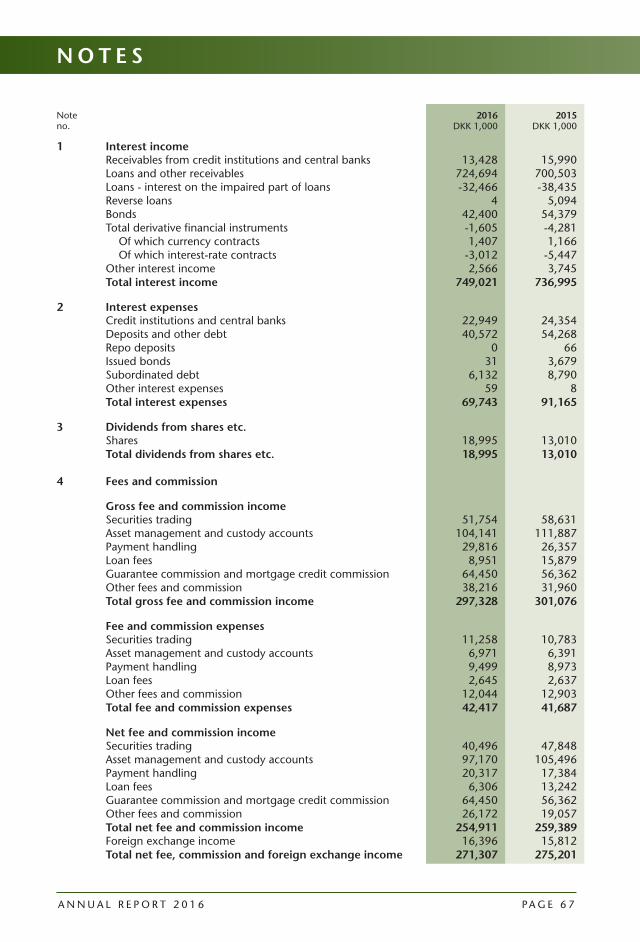
A N N U A L R E P O R T 2 0 1 6 PA G E 6 7
Note no.
2016 DKK 1,000
2015 DKK 1,000
1 Interest incomeReceivables from credit institutions and central banks 13,428 15,990Loans and other receivables 724,694 700,503Loans - interest on the impaired part of loans -32,466 -38,435Reverse loans 4 5,094Bonds 42,400 54,379Total derivative financial instruments -1,605 -4,281 Of which currency contracts 1,407 1,166 Of which interest-rate contracts -3,012 -5,447Other interest income 2,566 3,745Total interest income 749,021 736,995
2 Interest expensesCredit institutions and central banks 22,949 24,354Deposits and other debt 40,572 54,268Repo deposits 0 66Issued bonds 31 3,679Subordinated debt 6,132 8,790Other interest expenses 59 8Total interest expenses 69,743 91,165
3 Dividends from shares etc.Shares 18,995 13,010Total dividends from shares etc. 18,995 13,010
4 Fees and commission
Gross fee and commission incomeSecurities trading 51,754 58,631Asset management and custody accounts 104,141 111,887Payment handling 29,816 26,357Loan fees 8,951 15,879Guarantee commission and mortgage credit commission 64,450 56,362Other fees and commission 38,216 31,960Total gross fee and commission income 297,328 301,076
Fee and commission expensesSecurities trading 11,258 10,783Asset management and custody accounts 6,971 6,391Payment handling 9,499 8,973Loan fees 2,645 2,637Other fees and commission 12,044 12,903Total fee and commission expenses 42,417 41,687
Net fee and commission incomeSecurities trading 40,496 47,848Asset management and custody accounts 97,170 105,496Payment handling 20,317 17,384Loan fees 6,306 13,242Guarantee commission and mortgage credit commission 64,450 56,362Other fees and commission 26,172 19,057Total net fee and commission income 254,911 259,389Foreign exchange income 16,396 15,812Total net fee, commission and foreign exchange income 271,307 275,201
N O T E S

PA G E 6 8 R I N G K J Ø B I N G L A N D B O B A N K A / S
Note no.
2016 DKK 1,000
2015 DKK 1,000
5 Value adjustmentsOther loans and receivables, fair value adjustment* -58 9,249Bonds 33,900 -29,648Shares etc. 22,499 34,659Investment properties -2,495 0Foreign exchange 16,396 15,812Total derivative financial instruments -6,458 -489 Of which currency contracts -2,930 -1,230 Of which interest-rate contracts -4,169 -420 Of which share contracts 641 1,161Total value adjustments 63,784 29,583* Cf. note 35.
6 Staff and administration costsPayments to general management, board of directors and shareholders’ committee:General management*: John Bull Fisker 4,743 4,367 Salary** 4,176 4,100 Pension 567 267 Jørn Nielsen (joined on 1 September 2015) 2,275 741 Salary*** 2,275 741 Pension 0 0 Total payments 7,018 5,108
Board of directors*: Jens Lykke Kjeldsen, chairman 334 328 Martin Krogh Pedersen, deputy chairman 222 218 Gert Asmussen 166 163 Inge Sandgrav Bak 166 163 Gravers Kjærgaard (retired on 25 February 2015) 0 27 Jens Møller Nielsen (joined on 22 April 2015) 166 109 Jørgen Lund Pedersen 166 163 Bo Fuglsang Bennedsgaard 166 163 Dan Astrup Sørensen (joined on 1 March 2015) 166 136 Gitte E. S. Vigsø 166 163 Total payments 1,718 1,633
Shareholders’ committee*: Total payments 451 415
Total 9,187 7,156
Staff costs: Salaries 131,890 130,169 Pensions 14,072 13,872 Social security expenses 2,198 2,301 Costs depending on number of staff 20,538 18,525 Total 168,698 164,867
Other administration costs 128,785 109,611
Total staff and administration costs 306,670 281,634
* The general management, board of directors and shareholders’ committee do not receive variable remuneration.
** The member of general management has a company car and the taxable amounts were: 2016: tDKK 125 / 2015: tDKK 124. The amounts are not included in the salary amounts stated.
*** The member of general management has a company car and the taxable amounts were: 2016: tDKK 91 / 2015: tDKK 63. The amounts are not included in the salary amounts stated.
N O T E S

A N N U A L R E P O R T 2 0 1 6 PA G E 6 9
Note no.
2016 DKK 1,000
2015 DKK 1,000
7 Number of full-time employeesAverage number of employees during the financial yearconverted into full-time employees 271 269
8 Salaries paid to other major risk-takers and employees in control functionsFixed salary 11,259 11,763Variable salary 250 225Pension 1,201 1,248Total 12,710 13,236Number of full-time employees end of year 14 14
9 Fee to the auditor elected by the general meetingStatutory audit 629 625Other assurance engagements 60 60Advice on tax 0 0Other services 100 114Total fee to the auditor elected by the general meeting 789 799The bank has also an internal auditor.
10 Amortisation, depreciation and write-downs on intangible and tangible assets
Tangible assetsDomicile properties, depreciation 530 613Domicile properties, write-downs 3,585 1,500Other tangible assets, depreciation 4,523 5,238Total amortisation, depreciation and write-downs on intangible and tangible assets
8,638
7,351
11 Impairment charges for loans and other receivables etc.Net changes in impairment charges for loans and other receivables etc. and provisions for losses on guarantees
-5,822
11,552
Actual realised net losses 86,666 87,250Interest on the impaired part of loans -32,466 -38,435Total impairment charges for loans and other receivables etc. 48,378 60,367
12 TaxTax calculated on income for the year 140,413 133,489Adjustment of deferred tax -18,732 -2,973Adjustment of deferred tax due to change in tax rate 0 -924Adjustment of tax calculated for previous years 187 3Total tax 121,868 129,595
Effective tax rate (%):Tax rate currently paid by the bank 22.0 23.5Permanent deviations -3.6 -1.3Adjustment of deferred tax due to change in tax rate 0.0 -0.2Adjustment of tax calculated for previous years 0.0 0.0Total effective tax rate 18.4 22.0
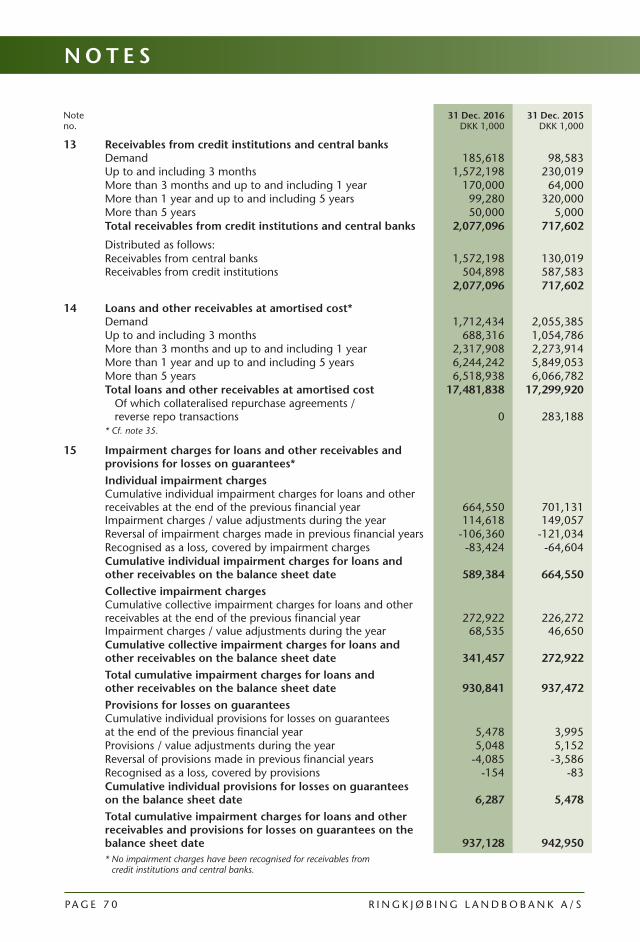
PA G E 7 0 R I N G K J Ø B I N G L A N D B O B A N K A / S
Note no.
31 Dec. 2016 DKK 1,000
31 Dec. 2015 DKK 1,000
13 Receivables from credit institutions and central banksDemand 185,618 98,583Up to and including 3 months 1,572,198 230,019More than 3 months and up to and including 1 year 170,000 64,000More than 1 year and up to and including 5 years 99,280 320,000More than 5 years 50,000 5,000Total receivables from credit institutions and central banks 2,077,096 717,602
Distributed as follows:Receivables from central banks 1,572,198 130,019Receivables from credit institutions 504,898 587,583
2,077,096 717,602
14 Loans and other receivables at amortised cost*Demand 1,712,434 2,055,385Up to and including 3 months 688,316 1,054,786More than 3 months and up to and including 1 year 2,317,908 2,273,914More than 1 year and up to and including 5 years 6,244,242 5,849,053More than 5 years 6,518,938 6,066,782Total loans and other receivables at amortised cost 17,481,838 17,299,920 Of which collateralised repurchase agreements / reverse repo transactions
0
283,188
* Cf. note 35.
15 Impairment charges for loans and other receivables and provisions for losses on guarantees*Individual impairment chargesCumulative individual impairment charges for loans and other receivables at the end of the previous financial year
664,550
701,131
Impairment charges / value adjustments during the year 114,618 149,057Reversal of impairment charges made in previous financial years -106,360 -121,034Recognised as a loss, covered by impairment charges -83,424 -64,604Cumulative individual impairment charges for loans and other receivables on the balance sheet date
589,384
664,550
Collective impairment chargesCumulative collective impairment charges for loans and other receivables at the end of the previous financial year
272,922
226,272
Impairment charges / value adjustments during the year 68,535 46,650Cumulative collective impairment charges for loans and other receivables on the balance sheet date
341,457
272,922
Total cumulative impairment charges for loans and other receivables on the balance sheet date
930,841
937,472
Provisions for losses on guaranteesCumulative individual provisions for losses on guaranteesat the end of the previous financial year 5,478 3,995Provisions / value adjustments during the year 5,048 5,152Reversal of provisions made in previous financial years -4,085 -3,586Recognised as a loss, covered by provisions -154 -83Cumulative individual provisions for losses on guarantees on the balance sheet date
6,287
5,478
Total cumulative impairment charges for loans and other receivables and provisions for losses on guarantees on the balance sheet date
937,128
942,950* No impairment charges have been recognised for receivables from
credit institutions and central banks.
N O T E S

A N N U A L R E P O R T 2 0 1 6 PA G E 7 1
Note no.
31 Dec. 2016 DKK 1,000
31 Dec. 2015 DKK 1,000
16 Bonds at fair value*Listed on the stock exchange** 3,443,359 3,114,721Total bonds at fair value 3,443,359 3,114,721* The bank has no held-to-maturity bonds.** See page 26 of the management review, where the rating classes are stated.
17 Shares etc.Listed on Nasdaq Copenhagen 21,382 11,492Investment fund certificates 147,277 196,590Unlisted shares at fair value 1,428 1,450Sector shares at fair value 360,416 257,517Total shares etc. 530,503 467,049
18 Land and buildingsInvestment propertiesFair value at the end of the previous financial year 6,056 6,056Additions during the year, including improvements 0 0Disposals during the year 0 0Value adjustments to fair value for the year -2,495 0Reversal of previous years’ write-downs during the year and reversal of total depreciation and write-downs on assets which were disposed of or taken out of operation during the year
0
0Fair value on the balance sheet date 3,561 6,056
Domicile propertiesRevalued amount at the end of the previous financial year 58,231 60,345Additions during the year, including improvements 0 0Disposals during the year -4,768 0Depreciation for the year -530 -614Write-downs after revaluation for the year -3,585 -1,500Reversal of previous years’ write-downs for the year and reversal of total depreciation and write-downs on assets which were disposed of or taken out of operation during the year
3,268
0Total revalued amount on the balance sheet date 52,616 58,231When measuring investment and domicile properties, a required rate of return between 6% and 8% is applied.No external experts were involved in the measurement of investment and domicile properties.
19 Other tangible assetsCostCost at the end of the previous financial year without depreciation and write-downs 34,718 33,515Additions during the year, including improvements 19,271 3,979Disposals during the year -1,654 -2,776Total cost on the balance sheet date 52,335 34,718
Depreciation and write-downsDepreciation and write-downs at the end of the previous financial year
30,512
28,849
Depreciation for the year 4,523 4,371Reversal of previous years’ write-downs for the year and reversal of total depreciation and write-downs on assets which were disposed of or taken out of operation during the year
-1,574 -2,708Total depreciation and write-downs on the balance sheet date 33,461 30,512
Total other tangible assets on the balance sheet date 18,874 4,206

PA G E 7 2 R I N G K J Ø B I N G L A N D B O B A N K A / S
Note no.
31 Dec. 2016 DKK 1,000
31 Dec. 2015 DKK 1,000
20 Deferred tax assets / Provisions for deferred taxThe calculated provisions for deferred tax relates to the following balance sheet items:Loans and other receivables 8,260 5,864Tangible assets -186 455Temporary assets 224 224Other balance sheet items -145 -17,122Total deferred tax assets / provisions for deferred tax 8,153 -10,579
21 Other assetsInterest and commission receivable 54,124 55,181Positive market value of derivative financial instruments 185,143 133,559Collateral under CSA agreements 38,784 66,251Miscellaneous debtors and other assets 28,744 24,827Other deposits 17,053 17,053Total other assets 323,848 296,871
22 Debt to credit institutions and central banksDemand 280,698 268,254Up to and including 3 months 60,254 55,023More than 3 months and up to and including 1 year 101,966 171,936More than 1 year and up to and including 5 years 659,525 593,775More than 5 years 355,349 413,598Total debt to credit institutions and central banks 1,457,792 1,502,586
Distributed as follows:Debt to credit institutions 1,457,792 1,502,586
1,457,792 1,502,586
23 Deposits and other debtDemand* 11,952,063 11,182,881Deposits and other debt with notice:Up to and including 3 months 2,204,934 1,891,994More than 3 months and up to and including 1 year 1,297,037 667,677More than 1 year and up to and including 5 years 1,192,377 966,866More than 5 years 1,668,016 2,277,125Total deposits and other debt 18,314,427 16,986,543 Of which deposits covered by the Guarantee Fund 42.7% 41.7%
Distributed as follows:Demand 11,750,246 10,912,726With notice 357,633 327,306Time deposits 3,136,479 2,352,697Long-term deposit agreements 1,769,783 2,192,532Special types of deposits* 1,300,286 1,201,282
18,314,427 16,986,543* Special types of deposits are entered under the item "Demand"
pending payment, while in the specification of the different types of deposits, the sum is instead included under "Special types of deposit".
24 Issued bonds at amortised costMore than 1 year and up to and including 5 years 297,370 0Total issued bonds at amortised cost 297,370 0
Distributed as follows:Issues in euros Nom. EUR 40 million* 297,370 0
297,370 0
N O T E S
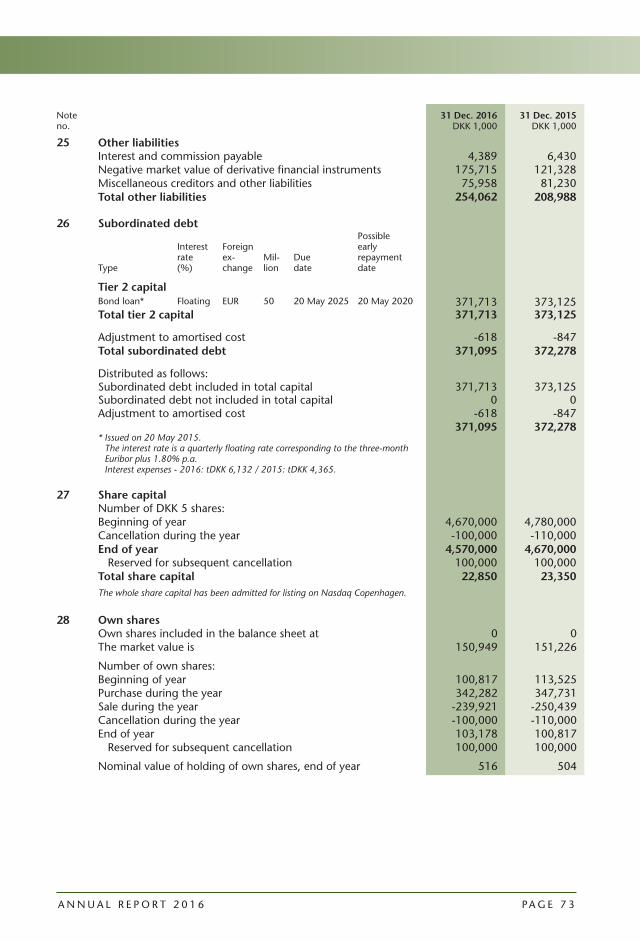
A N N U A L R E P O R T 2 0 1 6 PA G E 7 3
Note no.
31 Dec. 2016 DKK 1,000
31 Dec. 2015 DKK 1,000
25 Other liabilitiesInterest and commission payable 4,389 6,430Negative market value of derivative financial instruments 175,715 121,328Miscellaneous creditors and other liabilities 75,958 81,230Total other liabilities 254,062 208,988
26 Subordinated debt
Type
Interest rate (%)
Foreign ex-change
Mil-lion
Due date
Possible early repayment date
Tier 2 capitalBond loan* Floating EUR 50 20 May 2025 20 May 2020 371,713 373,125Total tier 2 capital 371,713 373,125
Adjustment to amortised cost -618 -847Total subordinated debt 371,095 372,278
Distributed as follows: Subordinated debt included in total capital
371,713 373,125
Subordinated debt not included in total capital 0 0Adjustment to amortised cost -618 -847
371,095 372,278* Issued on 20 May 2015.
The interest rate is a quarterly floating rate corresponding to the three-month Euribor plus 1.80% p.a. Interest expenses - 2016: tDKK 6,132 / 2015: tDKK 4,365.
27 Share capitalNumber of DKK 5 shares:Beginning of year 4,670,000 4,780,000Cancellation during the year -100,000 -110,000End of year 4,570,000 4,670,000 Reserved for subsequent cancellation 100,000 100,000Total share capital 22,850 23,350The whole share capital has been admitted for listing on Nasdaq Copenhagen.
28 Own sharesOwn shares included in the balance sheet at 0 0The market value is 150,949 151,226
Number of own shares:Beginning of year 100,817 113,525Purchase during the year 342,282 347,731Sale during the year -239,921 -250,439Cancellation during the year -100,000 -110,000End of year 103,178 100,817 Reserved for subsequent cancellation 100,000 100,000
Nominal value of holding of own shares, end of year 516 504

PA G E 7 4 R I N G K J Ø B I N G L A N D B O B A N K A / S
Note no.
31 Dec. 2016 DKK 1,000
31 Dec. 2015 DKK 1,000
28 Own shares - continuedOwn shares’ proportion of share capital, end of year (%):Beginning of year 2.2 2.4Purchase during the year 7.5 7.5Sale during the year -5.2 -5.4Cancellation during the year -2.2 -2.3End of year 2.3 2.2
The purchases and sales of own shares during the year were effected on the basis of the bank’s ordinary trading in shares and the share buy-back programme.
29 Contingent liabilities etc.
Contingent liabilitiesFinancial guarantees 1,219,287 1,112,688Guarantees against losses on mortgage credit loans 119,288 80,981Guarantees against losses, Totalkredit 109,019 116,104Registration and refinancing guarantees 642,705 641,756Sector guarantees 39,453 45,321Other contingent liabilities 329,757 237,531Total contingent liabilities 2,459,509 2,234,381
Other contractual obligationsIrrevocable credit commitments 516,724 0Total other contractual obligations 516,724 0
30 Assets furnished as securityFirst-mortgage loans are provided for German wind turbine projects. The loans are funded directly by KfW Bankengruppe, to which security in the associated loans has been provided. Each reduction of the first-mortgage loans is deducted directly from the funding at KfW Bankengruppe.The balance sheet item is 1,009,823 1,101,739
As security for clearing etc., the bank has pledged securities from its holding to the central bank of Denmark to a total market price of
380,459
231,505
Collateral under CSA agreements 38,784 66,251
31 Contractual obligationsThe following information is provided on material contractual obligations:
The bank is a member of the association Bankdata. If the bank terminates its membership, it is liable to pay an exit charge.
Like the rest of the Danish banking sector, the bank has an obligation to make payments to the Guarantee Fund and the Resolution Fund.
The bank has entered into a number of leases in connection with its operations and is liable to pay rent.
N O T E S

A N N U A L R E P O R T 2 0 1 6 PA G E 7 5
Note no.
32 Legal proceedings etc.The bank is not party to any legal proceedings expected to result in major losses and therefore to substantial alteration of the accounts.
33 Related partiesRelated parties are the bank’s board of directors and general management and their related parties. Ringkjøbing Landbobank advises that it has no related parties with a controlling interest.
There were no transactions during the year with the board of directors and the general manage-ment, apart from payments of salaries and fees etc., securities trading, loans and the provision of collateral security.
All transactions performed in 2016 and 2015 with related parties were on market terms or on an at-cost basis.
Information on the remuneration paid to the board of directors and the general management is given in note 6.
Information on the size of loans, mortgages, sureties and guarantees provided to members of the bank’s board of directors and general management and the security received is given in this note. The information in the note covers these parties’ personal exposures and those of their related parties.
Information on the shareholdings held by the board of directors and the general managers is also given in this note.
31 Dec. 2016 DKK 1,000
31 Dec. 2015 DKK 1,000
The amount of loans issued to and mortgages, sureties or guarantees issued for the members of the bank’s: General management 350 350 Interest rate (MasterCard) (MasterCard)
Board of directors, including elected by the employees 8,839 10,249 Interest rate 0.75% - 12.0% 0.75% - 12.0%
New exposures during the year have been granted for a net 4,200 2,810All exposures are performed on market terms, including both interest and guarantee commission rates.
Security provided by members of the bank’s: General management 0 0 Board of directors, including elected by the employees 160 1,805
31 Dec. 2016 Number
31 Dec. 2015 Number
The board of directors’ and the general management share- holdings* in Ringkjøbing Landbobank at the end of the year
Board of directors:Jens Lykke Kjeldsen 7,070 7,070Martin Krogh Pedersen 6,501 6,501Gert Asmussen 6,154 4,528Inge Sandgrav Bak 2,448 2,521Jens Møller Nielsen (joined on 22 April 2015) 138 138Jørgen Lund Pedersen 210 200Bo Fuglsang Bennedsgaard 532 532Dan Astrup Sørensen (joined on 1 March 2015) 5 1Gitte E. S. Vigsø 23 23
General management:John Bull Fisker 14,994 14,994Jørn Nielsen (joined on 1 September 2015) 2,249 2,264
* Stated in accordance with the rules on insiders.

PA G E 7 6 R I N G K J Ø B I N G L A N D B O B A N K A / S
34 Fair value of financial instrumentsFinancial instruments are measured in the balance sheet at either fair value or amortised cost (with consideration to risk cover that fulfils the conditions applying to hedge accounting).
Fair value is the amount at which a financial asset can be traded or at which a financial liabi-lity can be repaid between agreed independent parties. The fair values of financial assets and liabilities priced on active markets are calculated on the basis of observed market prices on the balance sheet date. The fair values of financial instruments which are not priced on active mar-kets are calculated on the basis of generally recognised pricing methods.
Shares etc. and derivative financial instruments are measured in the accounts at fair value. Re-cognised amounts equal fair values.
Loans are measured in the balance sheet at amortised cost. The difference from fair values is calculated as fees and commissions received, costs paid in the lending activities, and for fixed-interest loans, the value adjustment which is dependent on the interest level and which can be calculated by comparing the actual market interest rate with the nominal rate applying to the loans.
The fair value of receivables from credit institutions and central banks is determined under the same method as for loans, but the bank has not currently made any impairment charges for receivables from credit institutions and central banks.
Issued bonds and subordinated debt are measured at amortised cost, which is estimated to be the fair value.
For floating-rate financial liabilities in the form of deposits and debt to credit institutions measu-red at amortised cost, it is estimated that the carrying value corresponds to the fair value.
For fixed-rate financial liabilities in the form of deposits and debt to credit institutions measured at amortised cost, the difference from fair values is estimated to be the value adjustment which is dependent on interest level.
Note no.
Book value
31 Dec. 2016 Fair value
Book value
31 Dec. 2015 Fair value
DKK 1,000 DKK 1,000 DKK 1,000 DKK 1,000
Financial assetsCash in hand and demand deposits with central banks
284,139
284,139
331,563
331,563
Receivables from credit institutions and central banks
2,077,096
2,077,096
717,602
717,602
Loans and other receivables at amortised cost
17,510,202
17,565,800
17,329,606
17,366,133
Bonds at fair value* 3,443,359 3,443,349 3,114,721 3,114,721Shares etc. 530,503 530,503 469,716 469,716Derivative financial instruments 185,143 185,143 133,559 133,559Total financial assets 24,030,442 24,086,030 22,096,767 22,133,294
Financial liabilitiesDebt to credit institutions and central banks*
1,457,792
1,457,792
1,502,586
1,502,586
Deposits and other debt* 18,317,848 18,328,345 16,991,639 17,003,076Issued bonds at amortised cost* 297,401 297,401 0 0Derivative financial instruments 107,464 107,464 121,328 121,328Subordinated debt* 371,749 371,749 373,057 373,057Total financial liabilities 20,552,254 20,562,751 18,988,610 19,000,047
* The item includes calculated interest on the balance sheet date. The calculated interest in the balance sheet is included under the items "Other assets" and "Other liabilities".
N O T E S

A N N U A L R E P O R T 2 0 1 6 PA G E 7 7
Note no.
31 Dec. 2016 DKK 1,000
31 Dec. 2015 DKK 1,000
35 Hedging*
The following are hedged: Fixed-rate loans Fixed-rate loans
Hedging of: Interest rate risk Foreign exchange risk
Interest rate risk Foreign exchange risk
Book values:Loans 86,674 218,846
Hedging is thus:Interest swaps - total synthetic principal 71,000 182,000Currency swaps - total synthetic principal 15,674 36,846Total market value -141 -3,616
* Fair value hedging only.
36 Risks and risk managementAs described in the section on risk "Risks and risk management" in the management review, Ringkjøbing Landbobank is exposed to various types of risk. See the section on risks on pages 21 - 32 of the management review for a description of financial risks and policies and objectives for their management:
• Credit risk - page 22
• Interest rate risk - page 27
• Foreign exchange risk - page 27
• Share price risk - page 28
• Liquidity risk - page 30
The following notes to the annual report contain some additional information and a more detailed description of the bank’s credit and market risks.
31 Dec. 2016 DKK 1,000
31 Dec. 2015 DKK 1,000
37 Credit risk
Maximum credit exposure classified by balance sheet and off-balance sheet items
Loans and other receivables at amortised cost 17,481,838 17,299,920Guarantees (contingent liabilities) 2,459,509 2,228,903Unutilised credit facilities* 7,224,510 6,100,991Other exposures, including derivative financial instruments 824,492 404,455Total maximum credit exposure 27,990,349 26,034,269
* The bank has made unutilised credit facilities available to a total of DKK 7.2 billion. The amount of committed credit facili-ties is limited and the bank will be able to terminate the non-committed credit facilities with immediate effect.

PA G E 7 8 R I N G K J Ø B I N G L A N D B O B A N K A / S
37 Credit risk - continued
Security received
Security received for maximumcredit exposure
Maximumcredit
exposureLoans and
guaranteesReal
property MovablesSecuritiesand cash
Other security* Total
DKK 1,000 DKK 1,000 DKK 1,000 DKK 1,000 DKK 1,000 DKK 1,000 DKK 1,000
2016
Public authorities
59,049
34,126
87
289
23,741
0
24,117
Business customers:Agriculture, forestry and fishing
2,748,973
2,040,562
550,381
421,111
163,811
596,317
1,731,620
Industry and raw materials extraction
1,009,002
506,395
93,446
178,713
39,858
3,691
315,708
Energy supply 3,879,389 3,142,007 88,729 0 33,536 2,703,938 2,826,203Building and construction
627,492
443,168
112,696
65,494
20,825
2,670
201,685
Trade 1,100,427 685,288 169,418 122,133 35,823 21,546 348,920Transport, hotels and restaurants
350,812
299,590
34,036
60,912
32,179
150,386
277,513
Information and communication
96,166
52,926
15,890
9,404
10,640
3,013
38,947
Finance and insurance
4,109,785
2,849,488
207,258
106,498
1,939,829
346,498
2,600,083
Real property 4,318,815 2,988,838 1,509,226 2,257 228,267 132,530 1,872,280Other business customers
2,129,918
1,335,662
430,683
58,261
255,824
40,248
785,016
Total business customers
20,370,779
14,343,924
3,211,763
1,024,783
2,760,592
4,000,837
10,997,975
Private individuals 7,560,521 5,563,297 2,754,483 229,392 417,785 51,808 3,453,468
Total 27,990,349 19,941,347 5,966,333 1,254,464 3,202,118 4,052,645 14,475,560
* Includes security in the form of wind turbines, production farms, mortgaged share capital, surety etc.
Note no.
N O T E S

A N N U A L R E P O R T 2 0 1 6 PA G E 7 9
Note no.
37 Credit risk - continued
Security received
Security received for maximumcredit exposure
Maximumcredit
exposureLoans and
guaranteesReal
property MovablesSecuritiesand cash
Other security* Total
DKK 1,000 DKK 1,000 DKK 1,000 DKK 1,000 DKK 1,000 DKK 1,000 DKK 1,000
2015
Public authorities
33,429
12,976
1,640
179
11,300
0
13,119
Business customers:Agriculture, forestry and fishing
2,614,403
1,969,487
463,844
297,646
138,758
553,324
1,453,572
Industry and raw materials extraction
834,174
505,223
83,549
187,830
15,283
40,487
327,149
Energy supply 5,037,869 4,175,046 112,157 0 49,366 2,934,401 3,095,924Building and construction
530,745
358,043
103,339
45,038
20,148
5,865
174,390
Trade 1,089,733 707,035 180,548 48,620 55,088 19,583 303,839Transport, hotels and restaurants
385,118
342,699
40,550
50,997
59,347
156,272
307,166
Information and communication
79,743
42,269
11,923
5,124
11,000
2,927
30,974
Finance and insurance
3,979,826
2,932,431
79,563
1,246
2,128,096
205,812
2,414,717
Real property 3,137,172 2,686,575 1,405,638 1,650 120,828 145,697 1,673,813Other business customers
1,797,293
1,191,704
302,540
58,230
248,404
43,812
652,986
Total business customers
19,486,076
14,910,512
2,783,651
696,381
2,846,318
4,108,180
10,434,530
Private individuals 6,514,764 4,605,333 1,842,484 188,221 390,687 70,469 2,491,861
Total 26,034,269 19,528,823 4,627,775 884,781 3,248,305 4,178,649 12,939,510
* Includes security in the form of wind turbines, production farms, mortgaged share capital, surety etc.
Description of security
When entering into transactions with its customers, Ringkjøbing Landbobank wants to reduce the risk as much as possible by obtaining collateral in the form of physical assets, securities, bank deposits etc. as well as guarantees, including by surety.
The bank regularly monitors the value of security obtained, and the related loan values are cal-culated in accordance with the bank’s internal procedures as follows:
• Detached houses, owner-occupied flats and holiday homes are valued at fair value.
• Rental properties are valued at calculated fair values on the basis of profitability calculations.
• Movables are in principle valued at book value less a deduction.
• Agricultural properties are valued on the same principles as used by the Financial Supervi-sory Authority, except that the bank applies lower prices for land and buildings.
• Securities are valued at fair value less a safety margin.
• Wind turbines are valued at the present value of the calculated cash flow over their expected lives / remaining lives. The calculation is based on the wind turbine’s expected production in a normal wind year.
When computing loan values, a deduction is made to cover the risk in connection with realisa-tion, costs etc.

PA G E 8 0 R I N G K J Ø B I N G L A N D B O B A N K A / S
Distribution by sector and industry
A more detailed distribution by sector and industry of the items "Loans and other receivables at amortised cost", "Guarantees" and "Unutilised credit facilities" are given below. There is also a distribution by sector and industry covering only the items "Loans and other receivables at amortised cost" and "Guarantees".
31 Dec. 2016
Per cent31 Dec. 2015
Per cent
Loans, guarantees and unutilised credit facilities in per cent, end of year, by sector*
Public authorities 0.2 0.1
Business customers:Agriculture, hunting and forestry Cattle farming etc. 1.2 1.5 Pig farming etc. 1.5 1.5 Other agriculture, hunting and forestry 4.1 4.1Fishing 2.3 2.0Mink production 0.9 1.0Industry and raw materials extraction 3.4 3.2Energy supply 1.8 3.1Wind turbines - Denmark 3.0 5.3Wind turbines - abroad 8.4 10.5Building and construction 2.3 2.3Trade 4.0 4.3Transport, hotels and restaurants 1.3 1.5Information and communication 0.4 0.3Finance and insurance 15.1 15.7Real property First-priority without prior creditors** 10.9 8.2 Other real estate financing** 4.3 3.6Other business customers 7.5 6.8Total business customers 72.4 74.9
Private individuals 27.4 25.0
Total 100.0 100.0
Note no.
37 Credit risk - continued
The tables above only show values corresponding to the maximum credit exposure for the individual exposure. If the loan value for the individual exposure exceeds the maximum credit exposure allowed, the surplus loan value is not included in the tables.
As a result of general cautiousness when computing loan values, the possible realisation values are often higher than the loan values shown. In a number of instances, customers’ utilisation of their maximum credit facilities is also conditional upon their ability to deposit additional security. The real collateral values for the maximum credit risk are therefore actually higher than indi-cated in the tables.
In addition, a portion of the undrawn credit limits which are part of the maximum credit ex-posure is in closed circuits, where the bank has financed assets without enabling the customers to claim any undrawn credit facilities. The maximum credit exposure is consequently lower in practice than indicated in the tables.
N O T E S

A N N U A L R E P O R T 2 0 1 6 PA G E 8 1
Note no.
31 Dec. 2016 Per cent
31 Dec. 2015 Per cent
37 Credit risk - continued
Loans and guarantees in per cent, end of year, by sector and industry*
Public authorities 0.2 0.1
Business customers:Agriculture, hunting and forestry Cattle farming etc. 1.2 1.5 Pig farming etc. 1.6 1.5 Other agriculture, hunting and forestry 3.9 3.9Fishing 2.5 2.2Mink production 1.0 1.0Industry and raw materials extraction 2.5 2.6Energy supply 2.1 3.5Wind turbines - Denmark 3.7 6.0Wind turbines - abroad 10.0 11.9Building and construction 2.2 1.8Trade 3.4 3.6Transport, hotels and restaurants 1.5 1.8Information and communication 0.3 0.2Finance and insurance 14.3 15.0Real property First-priority without prior creditors** 10.7 9.5 Other real estate financing** 4.3 4.2Other business customers 6.7 6.1Total business customers 71.9 76.3
Private individuals 27.9 23.6
Total 100.0 100.0
* The distribution by sector and industry is made on the basis of Statistics Denmark’s sector codes etc. ** The comparative figures for 2015 are partly calculated on the basis of an approximate computation principle
compared with 2016.
Comments on distribution by sector and industry
The bank’s general assessment is that the credit quality of its loans is high. The ability of the bank’s customers to pay is generally good, and combined with the bank’s solid cover of many exposures through collateral, the result is low credit risks.
Personal customers account for a total of 27.9% of Ringkjøbing Landbobank’s total loans and guarantees showing considerable growth in 2016. The growth is attributable partly to a sub-stantial increase in the home loans which the bank offers to creditworthy home owners. The bank experienced improved credit quality in 2015 and 2016. However, the bank also expe-riences weak housing markets locally with slow marketability and realisation of properties in some cases resulting in losses for the bank. Collateral received from personal customers consists primarily of mortgages on real property (private homes).
The bank has a well-diversified portfolio related to agriculture, with pig farms accounting for 1.6% of the total volume of loans and guarantees, cattle farms accounting for 1.2%, and others for 3.9%. The terms of trade for agriculture have been poor in recent years, but the expecta- tions for 2017 are somewhat better, although with considerable variation between different lines of production. Expected grain prices are low, making it difficult to obtain satisfactory returns on current land prices. Earnings within agriculture are still generally weak, and although the bank’s agricultural customers are less indebted than the sector in general, the bank has allocated considerable impairment charges to this sector. These impairment charges increased throughout 2016, reflecting the fact that the situation in agriculture means increased uncertainty in the computation of impairment needs.

PA G E 8 2 R I N G K J Ø B I N G L A N D B O B A N K A / S
37 Credit risk - continued Security consists primarily of mortgages on agricultural property (land, buildings and other pro-
duction facilities on the farms). To this must be added assignment to the bank of aid per hectare and other accounts etc.
Wind turbine funding has been a core competence for the bank for over 20 years, and the bank’s loans to wind farms account for a total of 13.7%. The exposure to wind turbines primari-ly concerns wind turbines erected in Germany, but many turbines were also erected in Denmark from 2010 - 2014, and the bank’s loans for these increased appreciably. However, the level of activity within installation of new wind turbines in Denmark in 2015 and 2016 was low, because low prices to producers for power generated by wind turbines reduced the profitability and willingness to invest. The bank’s concept for wind turbine financing is based on first mortgage financing and the concept includes a legal and commercial due diligence which, combined with subsidy schemes, provides a high degree of security for the bank’s loans. Fixed prices to the producers on the German market provide additional security that the bank will be paid. The low prices to the producers for power generated by wind turbines in Denmark weaken the profitabi-lity of the Danish wind turbines, but the bank’s conservative fixing of lending limits means that the projects are highly resilient to low prices. The bank’s realised losses in this sector have been minimal, and the financial crisis confirmed that the risk in this sector is limited. Security consists primarily of first mortgages on wind turbines as well as assignment to the bank of electricity accounts and possible subsidies. The bank is still experiencing an efficient wind turbine market with high marketability.
Real property accounts for a total of 15.0% of the bank’s total loans and guarantees, which is an increasing share. Loans and security can be divided into the following main groups:
• Loans with first mortgages on real property and construction financing without prior credi-tors.
• Other forms of real estate financing, including loans with second mortgage on real property and a strong lessee with an irrevocable lease.
In the context of loans with a second mortgage on real property, the bank emphasises the pro-ject’s ability to settle the debt prior to expiration of the lease.
Financing and insurance comprise a total of 14.3% of the bank’s total loans and guarantees and include exposure to well-consolidated financial counterparties and the bank’s concept for securities lending. Security in this concept is primarily provided in the form of listed securities. The concept certainly demonstrated its strength during the extremely volatile periods on the financial markets during the financial crisis.
Note no.
N O T E S

A N N U A L R E P O R T 2 0 1 6 PA G E 8 3
Note no.
0
10
20
30
40
50
60
70
80
High Medium Low Not classi�ed
Perc
ent
Credit quality
Distribution of loans* and guaranteeswithout individual impairments or arrears
2013 20142015 2016
Total loans* and guarantees without individual impairments or arrears (million DKK) 2016 2015 2014 2013 19,161 18,573 15,789 14,859* Excluding reverse repo transactions.
0
10
20
30
40
50
60
70
80
High Medium Low Not classi�ed
Perc
ent
Credit quality
Distribution of loans* and guaranteeswithout individual impairments or arrears
2013 20142015 2016
37 Credit risk - continued
Credit quality of loans and guarantees which are neither in arrears nor impaired The bank has credit rated a substantial number of customers internally. Statistical models are
used for the rating of personal and small business customers (based on the probability of de-fault), while an expert model is used for major business customers.
The statistical models use various factors, including information on the customer’s assets and a quantity of behavioural data. The factors are chosen from a number of possible factors which best describe previously distressed accounts.
The expert models for major business customers are based on information on the customer’s financial standing and earning capacity.
The figure below indicates that the credit quality was high for 67% of loans and guarantees at the end of 2016, which is marginally higher than at the end of 2015. The group with medium quality increased from 17% to 18%, whereas the group with low credit quality decreased from 12% to 11%. The group of non-classified exposures was 4%, the same level as 2015. This group mainly consists of a mix of new customers who have not yet been rated and of older exposures which are running without any comments and which the bank’s systems cannot rate for various reasons.
The bank gained many new customers throughout 2016, and when establishing new custo-mer relationships, the bank is highly attentive to the customers’ creditworthiness and potential risks. A separate review of new customers in 2016 shows that these customers’ credit quality is satisfactory on average. The bank’s many customers with high credit quality also repay debts at a high rate, however, in 2016, the bank was successful in selling home loans to some of the bank’s creditworthy personal customers. This meant that loans to personal customers with high credit quality increased substantially, and in combination, the result is a credit quality which is marginally better than in 2015. The bank thus further enhanced the credit quality which was experienced from 2013 to 2014.

PA G E 8 4 R I N G K J Ø B I N G L A N D B O B A N K A / S
37 Credit risk - continued
Distribution by time frommaturity for loan exposuresin arrears but not impaired
Arrearsless than
90 days
Arrearsmore than
90 daysTotal
arrears
Loansincluding
arrearsless than
90 days
Loansincluding
arrearsmore than
90 days
Total loansincluding
arrears DKK 1,000 DKK 1,000 DKK 1,000 DKK 1,000 DKK 1,000 DKK 1,000
2016
Public authorities 0 0 0 0 0 0
Business customers:Agriculture, forestry and fishing 8,957 640 9,597 168,338 2,670 171,008Industry and raw materials extraction
21,207
1
21,208
41,128
6
41,134
Energy supply 3,110 442 3,552 19,231 2,908 22,139Building and construction 5,609 189 5,798 32,439 399 32,838Trade 3,439 1,194 4,633 48,970 4,959 53,929Transport, hotels and restaurants
65,726
5
65,731
82,965
205
83,170
Information and communication 1,151 115 1,266 6,639 145 6,784Finance and insurance 944 16 960 50,380 16 50,396Real property 8,091 1,380 9,471 51,998 11,315 63,313Other business customers 4,026 892 4,918 84,968 2,682 87,650Total business customers 122,260 4,874 127,134 587,056 25,305 612,361
Private individuals 17,693 5,954 23,647 99,614 23,628 123,242
Total 139,953 10,828 150,781 686,670 48,933 735,603
2015
Public authorities 0 0 0 0 0 0
Business customers:Agriculture, forestry and fishing 25,138 7,523 32,661 122,723 23,133 145,856Industry and raw materials extraction
2,170
68
2,238
13,192
688
13,880
Energy supply 2,299 757 3,056 65,842 12,495 78,337Building and construction 29,169 555 29,724 53,220 10,240 63,460Trade 6,474 450 6,924 60,628 2,120 62,748Transport, hotels and restaurants
779
946
1,725
4,074
946
5,020
Information and communication 175 38 213 725 153 878Finance and insurance 7,344 12 7,356 139,009 262 139,271Real property 8,186 95 8,281 40,631 1,395 42,026Other business customers 10,228 2,146 12,374 45,444 5,966 51,410Total business customers 91,962 12,590 104,552 545,488 57,398 602,886
Private individuals 31,174 12,237 43,411 145,550 28,146 173,696
Total 123,136 24,827 147,963 691,038 85,544 776,582
Note no.
N O T E S

A N N U A L R E P O R T 2 0 1 6 PA G E 8 5
Note no.
37 Credit risk - continued
Value of individually impaired loans
Credit exposure by reason for impairment
Major financial
difficultiesBreach of contract
Relaxation of terms
Probable bankruptcy
Total credit
exposure
Individual impairment
charges
DKK 1,000 DKK 1,000 DKK 1,000 DKK 1,000 DKK 1,000 DKK 1,000
2016
Public authorities 0 0 0 0 0 0
Business customers:Agriculture, forestry and fishing 174,842 115,763 65,215 25,942 381,762 306,420Industry and raw materials extraction
13,907
1,364
0
0
15,271
9,988
Energy supply 6,338 3,469 2,042 0 11,849 5,005Building and construction 5,222 6,726 0 845 12,793 1,642Trade 8,595 6,356 1,208 1,795 17,954 9,049Transport, hotels and restaurants
7,580
2,601
3,159
992
14,332
12,778
Information and communication 97 93 714 3,112 4,016 2,564Finance and insurance 0 0 0 986 986 973Real property 36,247 24,571 1,498 52,815 115,131 49,492Other business customers 40,928 15,973 6,928 5,855 69,684 39,798Total business customers 293,756 176,916 80,764 92,342 643,778 437,709
Private individuals 134,800 81,021 29,572 23,951 269,344 151,675
Total credit exposure 428,556 257,937 110,336 116,293 913,122 589,384
Individual impairment charges
266,456
174,558
80,637
67,733
589,384
2015
Public authorities 0 0 0 0 0 0
Business customers:Agriculture, forestry and fishing 183,656 96,117 105,333 62,373 447,479 332,628Industry and raw materials extraction
7,996
2,025
5
0
10,026
7,983
Energy supply 1,941 5,125 3,679 0 10,745 8,435Building and construction 6,576 4,021 1,374 3,602 15,573 6,542Trade 8,702 7,248 2,096 2,740 20,786 12,900Transport, hotels and restaurants
7,835
2,669
5,579
916
16,999
14,129
Information and communication 579 163 574 2,730 4,046 2,675Finance and insurance 0 0 0 949 949 931Real property 60,754 33,619 1,592 50,848 146,813 60,315Other business customers 21,965 17,325 7,920 12,079 59,289 38,049Total business customers 300,004 168,312 128,152 136,237 732,705 484,587
Private individuals 151,106 89,923 34,763 30,125 305,917 179,963
Total credit exposure 451,110 258,235 162,915 166,362 1,038,622 664,550
Individual impairment charges
290,815
161,116
120,736
91,883
664,550

PA G E 8 6 R I N G K J Ø B I N G L A N D B O B A N K A / S
37 Credit risk - continued The bank is particularly focused on covering the risk on exposures which have been impaired. Under
the bank’s credit policy, these exposures must be covered to the greatest possible extent by collate-ral. When determining the need for an impairment charge, the value of collateral is included at the expected net realisation value. The bank only includes the ability to make payments over and above the value of collateral to a modest extent when determining the need for an impairment charge.
The bank has also made collective impairment charges of DKK 341 million as of the end of December 2016.
31 Dec. 2016 DKK 1,000
31 Dec. 2015 DKK 1,000
Loans and other receivables with objective evidence of impairment recognised in the balance sheet at a book value greater than zeroIndividually impaired loansBalance for loans and other receivables before impairment 1,085,657 1,238,474Impairment charges -557,037 -612,462Balance for loans and other receivables after impairment 528,620 626,012
Collectively impaired loansBalance for loans and other receivables before impairment 16,343,443 16,239,543Impairment charges -341,457 -272,922Balance for loans and other receivables after impairment 16,001,986 15,966,621
Suspended calculation of interestLoans and other receivables with suspended calculation ofinterest on the balance sheet date 59,904 74,220
Credit risk on derivative financial instrumentsPositive market value (by counterpart risk) after nettingCounterparty risk weight 20% 46,993 38,372Counterparty risk weight 50% 19,909 8,695Counterparty risk weight 75% 35,172 35,227Counterparty risk weight 100% 156,585 101,560Counterparty risk weight 150% 1,129 0Total risk weight 259,788 183,854
38 Foreign exchange riskTotal assets in foreign currency 3,830,833 4,532,752Total liabilities in foreign currency 3,961,843 3,916,791
Foreign exchange indicator 1 17,034 23,440Foreign exchange indicator 1 in per cent of tier 1 capital (%) 0.6 0.8Foreign exchange indicator 2 71 101Foreign exchange indicator 2 in per cent of tier 1 capital (%) 0.0 0.0
39 Interest rate risk
Total interest rate risk 55,669 64,203Interest rate risk (%) 1.8 2.2Interest rate risk by foreign currency:DKK 75,970 51,802NOK 100 58EUR -20,818 12,103CHF -205 -266USD 40 -238GBP 195 0SEK 406 694Other currencies -19 50Total 55,669 64,203
Note no.
N O T E S

A N N U A L R E P O R T 2 0 1 6 PA G E 8 7
Noteno.
0
5
10
15
20
25
30
Q1
2012
Q2
2012
Q3
2012
Q4
2012
Q1
2013
Q2
2013
Q3
2013
Q4
2013
Q1
2014
Q2
2014
Q3
2014
Q4
2014
Q1
2015
Q2
2015
Q3
2015
Q4
2015
Q1
2016
Q2
2016
Q3
2016
Q4
2016
Val
ue a
t R
isk
(mill
ion
DK
K)
10-d
ay p
erio
dw
ith
99%
pro
bab
ility
Development in Value at Risk
Interest Foreign currency
Share Total
40 Value at Risk / Market risk Ringkjøbing Landbobank uses a Value at Risk (VaR) model as a sensitivity analysis for market
risks. The model is a parametric VaR model based on a historic analysis of the covariance (the correlations) between the prices of various financial assets etc. The model combines historical knowledge of covariance on the financial markets with the bank’s current positions, and on this basis calculates the risk of losses for a forthcoming 10-day period. The bank’s interest rate positions, foreign currency positions and listed share positions etc. are included in the calcu-lation, while positions in sector shares etc. are not included. The model does not include the credit spread risks on the bank’s portfolio of bonds. The calculated VaR thus indicates the bank’s sensitivity to losses on the basis of its positions. The model is used as one of a number of tools in the bank’s management of market risks.
Reference is made to pages 26 - 27 and 29 of this annual report for further description of the model etc.
Average Minimum Maximum End of yearRisk type VaR figure VaR figure* VaR figure* VaR figure
(DKK million)Interest 14.5 3.2 31.2 11.1Foreign exchange 1.0 2.1 2.7 0.1Share price 4.9 5.2 5.2 3.4Diversification -4.7 -4.3 -7.3 -3.5Total VaR figure 15.7 6.2 31.8 11.1* Determined by the total VaR figure.
Sensitivity analysis of sector shares (DKK 1,000)Sector shares cf. note 17 360,416Impact on the profit of a 10% price change 36,042
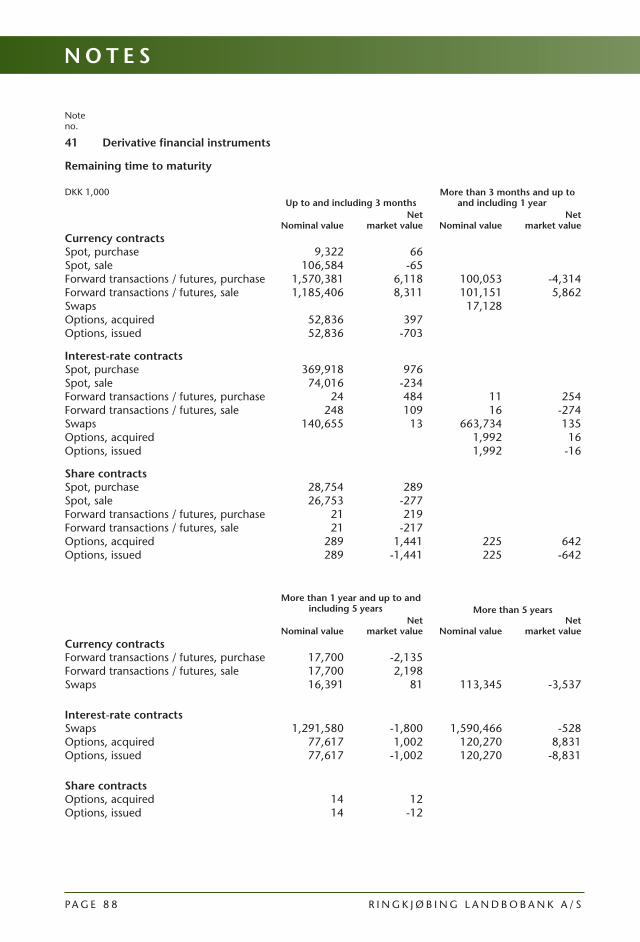
PA G E 8 8 R I N G K J Ø B I N G L A N D B O B A N K A / S
41 Derivative financial instruments
Remaining time to maturity
DKK 1,000 Up to and including 3 months
More than 3 months and up to and including 1 year
Nominal value
Net market value
Nominal value
Net market value
Currency contractsSpot, purchase 9,322 66Spot, sale 106,584 -65Forward transactions / futures, purchase 1,570,381 6,118 100,053 -4,314Forward transactions / futures, sale 1,185,406 8,311 101,151 5,862Swaps 17,128Options, acquired 52,836 397Options, issued 52,836 -703
Interest-rate contractsSpot, purchase 369,918 976Spot, sale 74,016 -234Forward transactions / futures, purchase 24 484 11 254Forward transactions / futures, sale 248 109 16 -274Swaps 140,655 13 663,734 135Options, acquired 1,992 16Options, issued 1,992 -16
Share contractsSpot, purchase 28,754 289Spot, sale 26,753 -277Forward transactions / futures, purchase 21 219Forward transactions / futures, sale 21 -217Options, acquired 289 1,441 225 642Options, issued 289 -1,441 225 -642
More than 1 year and up to and including 5 years
More than 5 years
Nominal value
Netmarket value
Nominal value
Netmarket value
Currency contractsForward transactions / futures, purchase 17,700 -2,135Forward transactions / futures, sale 17,700 2,198Swaps 16,391 81 113,345 -3,537
Interest-rate contractsSwaps 1,291,580 -1,800 1,590,466 -528Options, acquired 77,617 1,002 120,270 8,831Options, issued 77,617 -1,002 120,270 -8,831
Share contractsOptions, acquired 14 12Options, issued 14 -12
Noteno.
N O T E S

A N N U A L R E P O R T 2 0 1 6 PA G E 8 9
Noteno.
41 Derivative financial instruments - continued
DKK 1,000 Total nominal value Total net market value2016 2015 2016 2015
Currency contractsSpot, purchase 9,322 46,863 66 2,177Spot, sale 106,584 45,372 -65 -222Forward transactions / futures, purchase 1,688,134 927,038 -331 4,973Forward transactions / futures, sale 1,304,257 1,642,347 16,371 18,310Swaps 146,864 54,040 -3,456 -1,311Options, acquired 52,836 52,320 397 492Options, issued 52,836 52,320 -703 -501
Interest-rate contractsSpot, purchase 369,918 118,511 976 44Spot, sale 74,016 107,508 -234 220Forward transactions / futures, purchase 35 22,232 738 59Forward transactions / futures, sale 264 73,131 -165 -26Swaps 3,686,435 2,818,376 -2,180 -12,081Options, acquired 199,879 247,063 9,849 11,764Options, issued 199,879 247,063 -9,849 -11,764
Share contractsSpot, purchase 28,754 20,232 289 156Spot, sale 26,753 22,018 -277 -97Forward transactions / futures, purchase 21 8 219 -69Forward transactions / futures, sale 21 6 -217 107Options, acquired 528 384 2,095 33Options, issued 528 384 -2,095 -33
Total net market value 11,428 12,231

PA G E 9 0 R I N G K J Ø B I N G L A N D B O B A N K A / S
N O T E S
41 Derivative financial instruments - continued
DKK 1,000 Market value Average market value Positive Negative Positive Negative
2016 2015 2016 2015 2016 2015 2016 2015
Currency contractsSpot, purchase 66 2,177 268 601 7 109Spot, sale 65 222 36 865 25 87Forward transactions / futures, purchase
13,295
19,498
13,626
14,525
14,192
29,916
16,186
14,046
Forward transactions / futures, sale
22,802
28,918
6,431
10,608
21,002
28,838
6,293
20,809
Swaps 1,071 785 4,527 2,096 776 583 3,806 1,787Options, acquired 397 492 112 470Options, issued 703 501 189 479
Interest-rate contractsSpot, purchase 989 75 13 31 293 2,581 50 542Spot, sale 10 279 244 59 39 425 102 191Forward transactions / futures, purchase
738
87
28
670
569
10
1,050
Forward transactions / futures, sale
782
120
947
146
254
1,185
1,168
380
Swaps 131,237 68,426 133,417 80,507 150,122 58,005 154,339 66,907Options, acquired 9,849 11,764 11,207 12,950Options, issued 9,849 11,764 11,207 12,950
Share contractsSpot, purchase 656 439 367 283 2,059 981 511 793Spot, sale 376 321 653 418 575 766 2,013 875Forward transactions / futures, purchase
499
38
280
107
174
9,553
100
100
Forward transactions / futures, sale
281
107
498
101
102
171
9,600
Options, acquired 2,095 33 704 207Options, issued 2,095 33 704 207
Other derivative contractsCredit Default Swaps 243
Total net market value
185,143
133,559
173,715
121,328
202,584
148,840
196,881
130,912
All contracts of derivative financial instruments are non-guaranteed contracts.
Noteno.

A N N U A L R E P O R T 2 0 1 6 PA G E 9 1
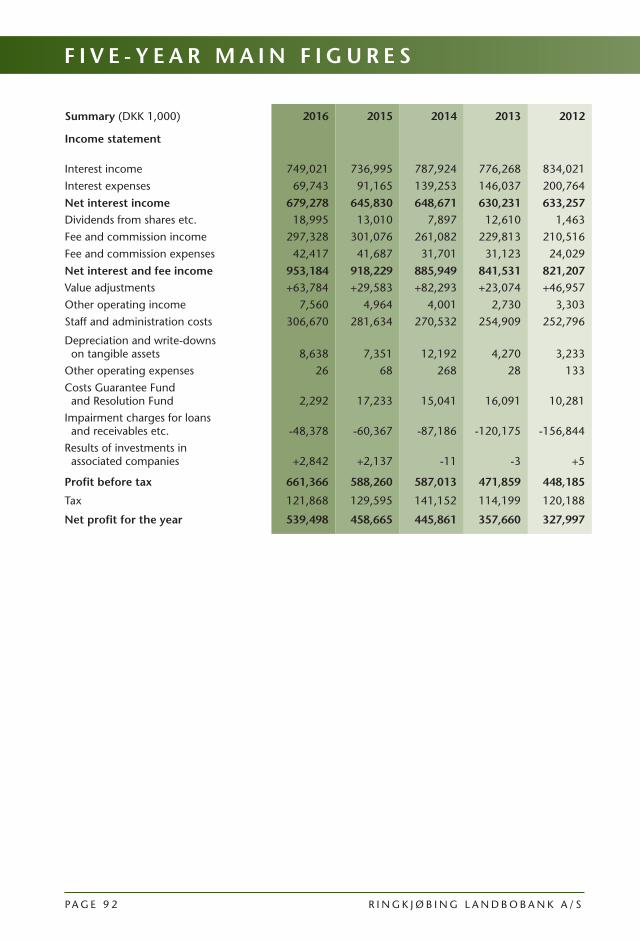
PA G E 9 2 R I N G K J Ø B I N G L A N D B O B A N K A / S
Summary (DKK 1,000) 2016 2015 2014 2013 2012
Income statement
Interest income 749,021 736,995 787,924 776,268 834,021
Interest expenses 69,743 91,165 139,253 146,037 200,764
Net interest income 679,278 645,830 648,671 630,231 633,257Dividends from shares etc. 18,995 13,010 7,897 12,610 1,463
Fee and commission income 297,328 301,076 261,082 229,813 210,516
Fee and commission expenses 42,417 41,687 31,701 31,123 24,029
Net interest and fee income 953,184 918,229 885,949 841,531 821,207Value adjustments +63,784 +29,583 +82,293 +23,074 +46,957
Other operating income 7,560 4,964 4,001 2,730 3,303
Staff and administration costs 306,670 281,634 270,532 254,909 252,796
Depreciation and write-downs on tangible assets
8,638
7,351
12,192
4,270
3,233
Other operating expenses 26 68 268 28 133
Costs Guarantee Fund and Resolution Fund
2,292
17,233
15,041
16,091
10,281
Impairment charges for loans and receivables etc.
-48,378
-60,367
-87,186
-120,175
-156,844
Results of investments in associated companies
+2,842
+2,137
-11
-3
+5
Profit before tax 661,366 588,260 587,013 471,859 448,185
Tax 121,868 129,595 141,152 114,199 120,188
Net profit for the year 539,498 458,665 445,861 357,660 327,997
F I V E - Y E A R M A I N F I G U R E S

A N N U A L R E P O R T 2 0 1 6 PA G E 9 3
Summary (DKK 1,000) End of 2016
End of 2015
End of 2014
End of 2013
End of 2012
Balance sheet
AssetsCash in hand and deposits with credit institutions and central banks
2,361,235
1,049,165
371,363
479,977
856,488Loans and other receivables at amortised cost
17,481,838
17,299,920
15,507,134
13,849,285
12,424,139
Securities 3,974,371 3,584,437 4,943,072 4,878,969 4,013,342
Tangible assets 75,051 68,493 71,067 78,256 79,811
Other assets 365,642 315,414 345,272 296,334 307,766
Total assets 24,258,137 22,317,429 21,237,908 19,582,821 17,681,546
Liabilities and equityDebt to credit institutions and central banks Remaining term less than 1 year 442,918 495,213 813,124 750,834 414,472
Remaining term more than 1 year 1,014,874 1,007,373 1,098,091 1,004,050 783,599
Deposits and other debt 18,314,427 16,986,543 15,450,273 14,113,816 12,866,748
Issued bonds 297,370 0 236,238 249,814 340,809
Other liabilities 256,511 143,867 157,436 174,723 191,035
Provisions for liabilities 6,287 16,057 18,471 17,444 26,109
Subordinated debt 371,095 372,278 365,667 371,040 382,634
Share capital 22,850 23,350 23,900 24,200 24,700
Reserves 3,531,805 3,272,748 3,074,708 2,876,900 2,651,440
Total shareholders’ equity 3,554,655 3,296,098 3,098,608 2,901,100 2,676,140
Total liabilities and equity 24,258,137 22,317,429 21,237,908 19,582,821 17,681,546
Contingent liabilities etc.Contingent liabilities 2,459,509 2,234,381 2,217,810 1,901,934 1,667,100
Irrevocable credit commitments 516,724 0 0 0 0
Total contingent liabilities etc. 2,976,233 2,234,381 2,217,810 1,901,934 1,667,100

PA G E 9 4 R I N G K J Ø B I N G L A N D B O B A N K A / S
2016 2015 2014 2013 2012Capital ratios:Total capital ratio % 18.3 18.8 17.5 20.0 22.4
Tier 1 capital ratio % 16.9 17.1 17.5 19.2 20.9
Earnings:Return on equity before tax % 19.3 18.4 19.6 16.9 17.4
Return on equity after tax % 15.8 14.3 14.9 12.8 12.7
Income / cost ratio DKK 2.81 2.60 2.52 2.19 2.06
Return on assets % 2.2 2.1 2.1 1.8 1.9
Market risk:Interest rate risk % 1.8 2.2 1.2 0.6 0.6
Foreign exchange position % 0.6 0.8 0.4 1.6 0.6
Foreign exchange risk % 0.0 0.0 0.0 0.0 0.0
Liquidity risk:
Liquidity Coverage Ratio (LCR) % 185 106 - - -Excess cover relative to statutory liquidity requirement
%
139.6
99.7
140.7
166.2
185.5
Loans and impairments thereon relative to deposits
%
100.5
107.4
106.4
104.1
102.4
Credit risk:Loans relative to shareholders’ equity 4.9 5.2 5.0 4.8 4.6
Growth in loans for the year % 2.7 14.0 12.0 11.5 -2.5
Total large exposures % 29.5 63.4 47.8 35.0 27.2
Cumulative impairment ratio % 4.5 4.6 5.0 5.1 5.1
Impairment ratio for the year % 0.23 0.29 0.47 0.72 1.06
Proportion of receivables at reduced interest
%
0.3
0.4
0.3
0.5
0.8
Share return:Earnings per share*/*** DKK 2,335.5 1,941.4 1,853.9 1,462.8 1,314.6
Book value per share*/** DKK 15,916 14,428 13,280 12,145 11,049
Dividend per share* DKK 720 600 520 500 280
Market price relative to earnings per share*/*** 12.5 15.5 12.4 15.0 11.7
Market price relative to book value per share*/** 1.84 2.08 1.73 1.81 1.39
* Calculated on the basis of a denomination of DKK 100 per share.** Calculated on the basis of number of shares in circulation at the end of the year.*** Calculated on the basis of the average number of shares. The average number of shares is calculated as a simple average of the
shares at the beginning of the year and at the end of the year.
F I V E - Y E A R K E Y F I G U R E S

A N N U A L R E P O R T 2 0 1 6 PA G E 9 5
Definitions of the official key figures / ratios from the Danish Financial Supervisory Authority etc. Total capital ratio Total capital in per cent of total risk exposure.Tier 1 capital ratio Tier 1 capital in per cent of total risk exposure. Return on equity before tax Profit before tax in per cent of average shareholders’ equity. The average shareholders’ equity is calculated as a simple average of the shareholders’ equity at the beginning of the year and at the end of the year.Return on equity after tax Net profit for the year in per cent of average shareholders’ equity. The average shareholders’ equity is calcu-lated as a simple average of the shareholders’ equity at the beginning of the year and at the end of the year.Income / cost ratio Income for the year divided by expenses for the year including impairment charges for loans and other receivables etc.Return on assetsNet profit for the year in per cent of total assets.Interest rate risk Interest rate risk in per cent of tier 1 capital.Foreign exchange position Foreign exchange indicator 1 in per cent of tier 1 capital.Foreign exchange risk Foreign exchange indicator 2 in per cent of tier 1 capital.Liquidity Coverage Ratio (LCR) Holding of liquid assets in per cent of net outflows over 30 days.Excess cover relative to statutory liquidity requirement Cash in hand, demand deposits with the central bank of Denmark, fully secured and liquid receivables due on demand from credit institutions and insurance companies, unencumbered certificates of deposit issued by the central bank of Denmark, secured readily negotiable listed unencumbered securities and other secured readily negotiable unencumbered securities. The total of all elements is measured in per cent relative to 10% of the reduced debt and guarantee liabilities.Loans and impairments thereon relative to deposits Loans plus impairments thereon in per cent of deposits.Loans relative to shareholders’ equity Loans / shareholders’ equity.Growth in loans for the year Growth in loans from the beginning of the year to the end of the year, in per cent.Total large exposures The total sum of large exposures in per cent of total capital.Cumulative impairment ratio Impairment charges for loans and provisions for losses on guarantees in per cent of loans plus impairment charges for loans plus guarantees plus provisions for losses on guarantees.Impairment ratio for the year Impairment charges for the year in per cent of loans plus impairment charges for loans plus guarantees plus provisions for losses on guarantees.Proportion of receivables at reduced interest Proportion of receivables at reduced interest before impairment charges in per cent of loans plus impairment charges for loans plus guarantees plus provisions for losses on guarantees.Earnings per share*/*** Net profit for the year / average number of shares.Book value per share*/** Shareholders’ equity / share capital excluding own shares.Dividend per share* Proposed dividend / share capital.Market price relative to earnings per share*/*** Market price / earnings per share.Market price relative to book value per share*/** Market price / book value per share.*/**/***: See page 94.

PA G E 9 6 R I N G K J Ø B I N G L A N D B O B A N K A / S

A N N U A L R E P O R T 2 0 1 6 PA G E 9 7
Page 98 Shareholders’ committee 99 Board of directors 105 General management 106 Company information 107 Stock exchange reports 107 Financial calendar 108 The bank’s branches etc.
O T H E R I N F O R M A T I O N

PA G E 9 8 R I N G K J Ø B I N G L A N D B O B A N K A / S
S H A R E H O L D E R S ’ C O M M I T T E E
Shareholders’ committee
Name Position Home town Born
Jacob Møller, CEO Ringkøbing 02 August 1969chairman of the shareholders’ committee
Kristian Skannerup, manufacturer Tim 14 June 1959 deputy chairman of the shareholders’ committee
Hejne Fomsgaard Andersen manufacturer Ringkøbing 30 August 1954
Gert Asmussen* printer Tarm 14 April 1950
Inge Sandgrav Bak* administrative manager Ringkøbing 31 July 1960
Claus Dalgaard deputy manager Ringkøbing 28 April 1962
Ole Kirkegård Erlandsen butcher Snejbjerg 19 December 1962
Niels Ole Hansen business consultant Ringkøbing 01 September 1951
Tonny Hansen college principal Ringkøbing 27 May 1958
Leif Haubjerg farmer No 18 December 1959
Poul Johnsen Høj fishing boat skipper Hvide Sande 10 November 1964
Erik Jensen manager Skjern 07 September 1965
Claus Kaj Junge manager Filskov 25 May 1968
Jens Lykke Kjeldsen* timber merchant Ringkøbing 02 September 1950
Carl Erik Kristensen manager Hvide Sande 28 January 1978
Niels Erik Burgdorf Madsen manager Ølgod 25 October 1959
Lars Møller municipal chief executive Holstebro 30 November 1957
Bjarne Bjørnkjær Nielsen manager Skjern 11 March 1973
Jens Møller Nielsen* manager Ringkøbing 25 August 1956
Martin Krogh Pedersen* CEO Ringkøbing 07 June 1967
Ole Christian Pedersen manager Vostrup 15 February 1950
Poul Kjær Poulsgaard farmer Madum 21 February 1974
Lone Rejkjær Söllmann finance manager Tarm 26 January 1968
Allan Brunsvig Sørensen lawyer Ringkøbing 26 June 1982
Egon Sørensen insurer Spjald 16 June 1965
Jørgen Kolle Sørensen car dealer Hvide Sande 17 September 1970
* Member of the board of directors.
A N N U A L R E P O R T 2 0 1 6 PA G E 9 9
Board of directors
Jens Lykke Kjeldsen, timber merchant, Ringkøbing, chairman of the board of directors
Born on 2 September 1950 Member of the board of directors since 28 March 1995 End of current term of office: 2020
Other managerial activities - member of the management of: A/S Henry Kjeldsen A/S Miljøpark Vest Aktieselskabet af 1. august 1989 Asta og Henry Kjeldsens Familiefond Henry Kjeldsen, Ringkøbing Tømmerhandel A/S Høgildgaard Plantage A/S Pensionstilskudsfonden for medarbejdere i Ringkjøbing Landbobank VT Hallen A/S
Martin Krogh Pedersen, CEO, Ringkøbing, deputy chairman of the board of directors
Born on 7 June 1967 IndependentMember of the board of directors since 27 April 2011 End of current term of office: 2019
Other managerial activities - member of the management of: A/S Maskinfabrikken PCP Ejendomsselskabet Ringkøbing ApS KP Group ApS KP Group Holding ApS K. P. Components Inc. K. P. Holding A/S K. P. Komponenter A/S MHKP Holding ApS MHKPO ApS MHKPS ApS PF Group A/S
Gert Asmussen, printer, Tarm
Born on 14 April 1950Member of the board of directors since 25 September 2002 End of current term of office: 2018
Other managerial activities - member of the management of: Gert Asmussen Holding A/S Gullanders Bogtrykkeri A/S Tarm Bogtryk A/S Tarm Ugeblad ApS TB Anlæg ApS
B O A R D O F D I R E C T O R S

PA G E 1 0 0 R I N G K J Ø B I N G L A N D B O B A N K A / S
Inge Sandgrav Bak, administrative manager, Ringkøbing
Born on 31 July 1960 Independent Member of the board of directors since 27 April 2011 End of current term of office: 2019
Other managerial activities - member of the management of: International A/S Rindum ApS
Jens Møller Nielsen, general manager, Ringkøbing
Born on 25 August 1956Independent Member of the board of directors since 22 April 2015 End of current term of office: 2019
Other managerial activities - member of the management of: Byggeri & Teknik I/S SvineRådgivning I/S Vestjysk Landboforening VL Revision, registreret revisionsaktieselskab
Jørgen Lund Pedersen, manager, Skanderborg
Born on 7 October 1949Independent Member of the board of directors since 27 February 2013 End of current term of office: 2017
Other managerial activities - member of the management of: Løvbjerg Fonden Tove og Carsten Løvbjergs Almene Fond
Bo Fuglsang Bennedsgaard, IT consultant, Holstebro, elected by the employees
Born on 23 January 1972 Member of the board of directors since 1 March 2007 End of current term of office: 2019
Other managerial activities - member of the management of: Pensionstilskudsfonden for medarbejdere i Ringkjøbing Landbobank
Dan Astrup Sørensen, business customer manager, Videbæk, elected by the employees
Born on 20 January 1989 Member of the board of directors since 1 March 2015 End of current term of office: 2019
No other managerial activities
Gitte Elisa Sigersmunda Høgholm Vigsø, MA (Laws) / administrative employee, Holstebro, elected by the employees
Born on 24 April 1976 Member of the board of directors since 1 March 2011 End of current term of office: 2019
Other managerial activities - member of the management of: Finansforbundet
B O A R D O F D I R E C T O R S

A N N U A L R E P O R T 2 0 1 6 PA G E 1 0 1
Board committeesThe board of directors has appointed a remuneration committee, a nomination committee, an audit committee and a risk committee.
Information on the individual committees is provided below:
Remuneration committee
The following are members of the remuneration committee:
• Jens Lykke Kjeldsen, chairman of the committee• Martin Krogh Pedersen*• Gitte E. S. Vigsø
The bank’s board of directors has agreed a brief for the remuneration committee which includes provisions on scope and objective, members and how it is constituted, tasks, meetings, authority and resources, reporting and minutes of meetings, publication, evaluation and self-assessment, as well as changes to its brief.
The remuneration committee is, as a minimum, responsible for the following tasks:
• Negotiation with the general management on remuneration of the general management. • Undertaking the preparatory work for the board of directors’ decisions on remuneration in the bank,
including assessing the need for changes to the bank’s remuneration policy, and, if deemed neces-sary, drafting and recommending policy changes for approval by the board of directors prior to adoption by the general meeting. In its preparatory work, and with reference to the adopted remu-neration policy, the committee must protect the bank’s long-term interests, including ensuring that remuneration of the bank’s employees is in accordance with statutory provisions on the protection of customers and investors and other legislation.
• Drafting and recommending guidelines for the board of directors’ monitoring of compliance with the remuneration policy etc. for approval by the board of directors, including ensuring that compli-ance with the policy is monitored.
• Monitoring remuneration of the management of the part of the organisation in charge of moni-toring the limits of risk-taking, and the management of the part of the organisation otherwise in charge of monitoring and auditing, including the management of the compliance function and the chief internal auditor.
• Tasks in connection with the bank’s compliance with the remuneration policy under the Mortgage Credit Directive etc.
• Submitting annual proposals for remuneration of the members of the bank’s board of directors and shareholders’ committee for approval by the shareholders’ committee, and ensuring that the remu-neration is in accordance with the bank’s remuneration policy.
• Other remuneration-related tasks, including supporting the board of directors in its task of identify-ing significant risk takers.

PA G E 1 0 2 R I N G K J Ø B I N G L A N D B O B A N K A / S
Nomination committee
The following are members of the nomination committee:
• Jens Lykke Kjeldsen, chairman of the committee• Martin Krogh Pedersen*• Gert Asmussen• Inge Sandgrav Bak*• Jens Møller Nielsen*• Jørgen Lund Pedersen*• Bo Fuglsang Bennedsgaard • Dan Astrup Sørensen• Gitte E. S. Vigsø
The bank’s board of directors has agreed a brief for the nomination committee which includes provisi-ons on scope and objective, members and how the committee is constituted, tasks, meetings, authority and resources, reporting and minutes of meeting, publication, evaluation and self-assessment, as well as changes to the brief.
The nomination committee is, as a minimum, responsible for the following tasks:
• Preparing proposals and recommendations for the election and re-election of members to the bank’s shareholders’ committee and the board of directors and appointment of the bank’s general management, including describing the qualifications required of the board of directors and the bank’s general management etc. The process for recruitment of candidates for the board of direc-tors is carried out on the basis of discussions in the committee.
• Regularly and at least once a year assessing the board of directors’ size, structure, composition and results in relation to its tasks and reporting and making recommendations for possible changes thereof to the full board of directors.
• Regularly and at least once a year assessing whether the full board of directors has the required combination of knowledge, professional skills, diversity and experience, and whether individual members meet the requirements of Section 64 of the Danish Financial Business Act, and reporting and making recommendations for possible changes thereof to the full board of directors, including a possible action plan for the future composition and proposals for specific changes. An individual member of the management (board of directors) must also regularly assess that he or she has allocated sufficient time to his or her duties cf. Section 64a of the Danish Financial Business Act. The nomination committee must assess at least once a year whether it agrees with the individual’s assessment.
• Regularly and at least once a year evaluating the bank’s general management, making recommen-dations to the board of directors and ensuring that the board of directors discusses succession plans when judged to be necessary.
• Regularly reviewing the board of directors’ policy for selection and appointment of members to the general management if such a policy has been prepared, and making recommendations to the board of directors (currently there is no such policy).
• Setting a target percentage of the under-represented gender on the board of directors and prepa-ring a policy on how to reach this target figure.
• Preparing a policy for diversity on the board of directors.
Audit committee
The following are members of the audit committee:
• Martin Krogh Pedersen*, chairman of the committee• Jens Lykke Kjeldsen • Jens Møller Nielsen*
Martin Krogh Pedersen is the specially qualified member of the audit committee. Given the bank’s size and complexity and Mr Pedersen’s education, professional experience and experience on the bank’s board of directors and committees, including the audit committee, the bank’s board of directors judges that Mr Pedersen is independent and that he possesses the qualifications required pursuant to the Danish executive order on audit committees in companies and groups subject to the supervision of the Danish Financial Supervisory Authority.
B O A R D O F D I R E C T O R S

A N N U A L R E P O R T 2 0 1 6 PA G E 1 0 3
The bank’s board of directors has agreed a brief for the audit committee which includes provisions on how the committee is constituted and its objective, members, meetings, authority etc., tasks, reporting and self-assessment.
The audit committee is, as a minimum, responsible for the following tasks:
• Monitoring the financial reporting process.• Monitoring whether the bank’s internal control system, risk management systems and internal audit
are effective.• Monitoring the statutory auditing of the financial statements etc.• Monitoring and verifying the auditor’s independence, pursuant to Section 24 of the Danish act on
approved auditors and audit firms, in particular the delivery of additional services to the bank.• Making a recommendation on election of an auditor to the board of directors.
Risk committee
The following are members of the risk committee:
• Jens Lykke Kjeldsen, chairman of the committee• Martin Krogh Pedersen*• Gert Asmussen• Inge Sandgrav Bak*• Jens Møller Nielsen*• Jørgen Lund Pedersen*• Bo Fuglsang Bennedsgaard • Dan Astrup Sørensen• Gitte E. S. Vigsø
The bank’s board of directors has agreed a brief for the risk committee which includes provisions on scope and objective, members and how the committee is constituted, tasks, meetings, authority and resources, reporting and minutes of meetings, publication, evaluation and self-assessment, as well as changes to the brief.
The risk committee is, as a minimum, responsible for the following tasks:
• Advising the board of directors on the bank’s general existing and future risk profile and risk strategy.• Assisting the board of directors with ensuring that the board’s risk strategy is implemented correctly
in the organisation. • Assessing whether the financial products and services traded by the bank are in accordance with
the bank’s business model and risk profile, including whether the earnings on such products and services reflect the associated risks, and preparing proposals for remedies if the products or services and the associated earnings are not in accordance with the bank’s business model and risk profile;
• Assessing whether the incentive components of the bank’s remuneration structure take account of the bank’s risks, capital, liquidity and the probability and time of payment of remuneration (under the bank’s remuneration policy, no forms of incentive components are used for the bank’s board of directors and general management).
• Conducting a review of the quarterly credit reports.
Regarding the committees in general, in cases where a committee consists of the bank’s full board of directors or where the full board of directors participates in a committee meeting, both the committee and the board of directors’ proceedings may take place simultaneously.
* Independent.

PA G E 1 0 4 R I N G K J Ø B I N G L A N D B O B A N K A / S
Board of directors - competenciesThe members of the bank’s board of directors together possess all the competencies required for the overall management of the bank on the basis of the business model for the bank’s operations.
The members of the bank’s full board of directors thus possess competencies concerning:
• The business model and relevant related matters• Credit risks and relevant related matters• Market risks and relevant related matters• Liquidity risks and relevant related matters• Operational risks and relevant related matters including IT• Budgets, accounting and auditing• Capital structure consisting of capital adequacy and solvency requirement• Insurance risks• Risk management including interdisciplinary risk management• General managerial experience• Managerial experience from other financial undertakings• Legal insight, including in relation to financial legislation
We advise as follows concerning the individual board members’ special competencies within specific areas:• Jens Lykke Kjeldsen has special competencies, knowledge and experience within the areas of the
business model, credit risks, liquidity risks, operational risks, insurance risks, risk management and general managerial experience and within sections of the market risk area.
• Martin Krogh Pedersen has special competencies, knowledge and experience within the areas of the business model, market risks, budgets, accounting and auditing, insurance risks and general mana-gerial experience and within sections of the credit risk area. Martin Krogh Pedersen is the chairman of the bank’s audit committee and has competencies within accounting or auditing.
• Gert Asmussen has special competencies, knowledge and experience within the areas of the business model, budgets, accounting and auditing and general managerial experience and within sections of the credit risk and market risk areas.
• Inge Sandgrav Bak has special competencies, knowledge and experience within the areas of the business model, budgets, accounting and auditing, general managerial experience, and within sec-tions of the credit risk and market risk areas.
• Jens Møller Nielsen has special competencies, knowledge and experience within the areas of the business model, credit risks, market risks, operational risks, budgets, accounting and auditing, insu-rance risks, risk management and general managerial experience.
• Jørgen Lund Pedersen has special competencies, knowledge and experience within the areas of the business model, credit risks, market risks, liquidity risks, operational risks, capital structure, risk ma-nagement, general managerial experience, managerial experience from other financial undertakings and legal insight.
• Bo Fuglsang Bennedsgaard has special competencies, knowledge and experience within the area operational risks and within a section of the credit risk area.
• Dan Astrup Sørensen has special competencies, knowledge and experience within the areas of the business model, credit risks, budgets, accounting and auditing, and within sections of the market risk area.
• Gitte E. S. Vigsø has special competencies, knowledge and experience within the area of legal insight and within sections of the business model and credit risk areas.
Holdings of Ringkjøbing Landbobank shares by members of the board of directorsReference is made to note 33 on page 75 for information on holdings of Ringkjøbing Landbobank shares by members of the board of directors.
B O A R D O F D I R E C T O R S

A N N U A L R E P O R T 2 0 1 6 PA G E 1 0 5
General management
John Bull Fisker, CEO
Born on 3 December 1964 Member of the general management since 1999
On the board of directors of the following companies etc.: Chairman of Letpension A/S, Copenhagen Deputy chairman of Bankdata, Fredericia Deputy chairman of BI Holding A/S, Copenhagen Deputy chairman of BI Asset Management Fondsmæglerselskab A/S, Copenhagen Board member of PRAS A/S, Copenhagen Board member of AUHE Midtvests Støttefond, Herning Board member of Pensionstilskudsfonden for medarbejdere i Ringkjøbing Landbobank,
Ringkøbing
Member of the customer board of: PFA Pension A/S, Copenhagen
Jørn Nielsen, General Manager
Born on 9 November 1972 Member of the general management since 2015
No other managerial activities
Holdings of Ringkjøbing Landbobank shares by the general managementReference is made to note 33 on page 75 for information on holdings of Ringkjøbing Landbobank shares by members of the general management.
G E N E R A L M A N A G E M E N T

PA G E 1 0 6 R I N G K J Ø B I N G L A N D B O B A N K A / S
C O M P A N Y I N F O R M A T I O N
Ringkjøbing Landbobank AktieselskabTorvet 1 DK-6950 Ringkøbing Denmark Founded: 1886 Phone: +45 9732 1166 Telefax: +45 7624 4913 E-mail: [email protected] Website: www.landbobanken.com CVR-no.: 37536814 Sort code: 7670 SWIFT / BIC: RINGDK22 LEI-code: 2138002M5U5K4OUMVV62
Share capitalRingkjøbing Landbobank’s share capital is DKK 22,850,000, divided into 4,570,000 nom. DKK 5 shares.
OwnershipOn 31 December 2016, Ringkjøbing Landbobank had registered shares of DKK 22,328,765, equivalent to 97.72% of the total share capital.
The number of registered shareholders on 31 December 2016 totalled 17,217.
Major shareholdersTwo shareholders have advised their holding of at least 5% of Ringkjøbing Landbobank’s share capital:
• Parvus Asset Management Europe Limited, London, Great Britain owned 10.16% of the bank’s share capital on 31 December 2016.
• ATP, Hillerød, Denmark owned 5.01% of the bank’s share capital on 31 December 2016.
Both shareholders have 2 votes each.
A N N U A L R E P O R T 2 0 1 6 PA G E 1 0 7
S T O C K E X C H A N G E R E P O R T S
F I N A N C I A L C A L E N D A R
Financial calendar 2017The financial calendar for the upcoming publications is as follows:
22 February 2017 Annual general meeting26 April 2017 Quarterly report 1st quarter 201702 August 2017 Interim report 201725 October 2017 Quarterly report 1st-3rd quarters 2017
Stock exchange reports 2016Summary of Ringkjøbing Landbobank’s reports to Nasdaq Copenhagen and others in 2016:
27 January 2016 Announcement of the annual accounts for 201527 January 2016 Annual report 201527 January 2016 Notice convening annual general meeting25 February 2016 Minutes of the annual general meeting on 24 February 2016 02 March 2016 Articles of association20 April 2016 Quarterly report 1st quarter 201626 April 2016 Implementation of capital reduction26 April 2016 Articles of association28 April 2016 Major shareholder announcement29 April 2016 Share capital and voting rights03 August 2016 Interim report 201624 August 2016 Decision by the Danish Supreme Court 26 October 2016 Quarterly report 1st-3rd quarters 2016 27 October 2016 Financial calendar 201707 December 2016 Share buy-back programme
Reports regarding insiders’ transactions are not indicated in the summary above.
All the reports from the bank to Nasdaq Copenhagen and others can be seen on the bank´s website: www.landbobanken.com.

PA G E 1 0 8 R I N G K J Ø B I N G L A N D B O B A N K A / S
T H E B A N K ’ S B R A N C H E S E T C .
Head office:Ringkøbing
Branches:Herning
Holstebro
Hvide Sande
Tarm
Viborg
Vildbjerg
Private Banking branches:Herning
Holte
Ringkøbing
Vejle
Aarhus
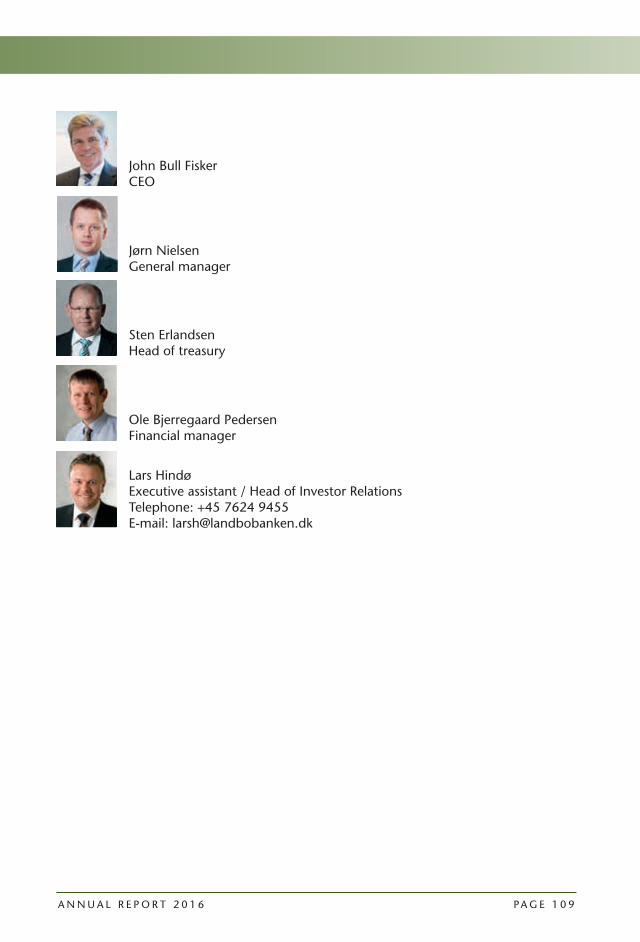
A N N U A L R E P O R T 2 0 1 6 PA G E 1 0 9
Ole Bjerregaard Pedersen Financial manager
Sten Erlandsen Head of treasury
Lars Hindø Executive assistant / Head of Investor RelationsTelephone: +45 7624 9455E-mail: [email protected]
Jørn Nielsen General manager
John Bull Fisker CEO

PA G E 1 1 0 R I N G K J Ø B I N G L A N D B O B A N K A / S


A N N U A L R E P O R T 2 0 1 6
RIN
GK
JØB
ING
LA
ND
BO
BA
NK
Rasm
usse
ns B
ogtr
ykke
ri, R
ingk
øbin
g
AN
NU
AL
RE
PO
RT
20
16
Ringkjøbing Landbobank A/S Torvet 1 DK-6950 RingkøbingDenmark
Telephone +45 9732 1166
Telefax +45 7624 4913
Web www.landbobanken.com
CVR-no. 37 53 68 14
SWIFT RINGDK22

![dk;kZy; ifj;kstuk funs'kd]vkRek] leLrhiqj dk;ZØe dk …atmasamastipur.com/wp-content/uploads/2018/07/List-of...Ø0la0 fdlku dk uke firk@ifr dk uke iw.kZ irk dksfV lEidZ la0 1 Vidhakant](https://img.pdfslide.tips/doc/110x75/5e624c3529c68b1f746facfd/dkkzy-ifjkstuk-funskdvkrek-lelrhiqj-dkze-dk-0la0-fdlku-dk-uke-firkifr.jpg)


![dk;yk [kku Hkfo’; fuf/k vk;qDr dk dk;kZy; · dk;yk [kku Hkfo’; fuf/k vk;qDr dk dk;kZy; OFFICE OF THE COAL MINES PROVIDENT FUND COMMISSIONER ifyl ykbu] ghjkij] /kuckn& 826014 ¼>kj[kM½]](https://img.pdfslide.tips/doc/110x75/5f604872192275435f622d8a/dkyk-kku-hkfoa-fufk-vkqdr-dk-dkkzy-dkyk-kku-hkfoa-fufk-vkqdr-dk.jpg)