Embed Size (px)
Citation preview
お問合せ先
茨城大学学術企画部学術情報課(図書館) 情報支援係
http://www.lib.ibaraki.ac.jp/toiawase/toiawase.html
ROSEリポジトリいばらき (茨城大学学術情報リポジトリ)
Title Neutron and X-ray Diffraction Study on DisorderedArrangements in Crystals and Glasses
Author(s) Makhsun
Citation
Issue Date 2015-03-24
URL http://hdl.handle.net/10109/12658
Rights
このリポジトリに収録されているコンテンツの著作権は、それぞれの著作権者に帰属します。引用、転載、複製等される場合は、著作権法を遵守してください。
博士学位論文
NEUTRON AND X-RAY DIFFRACTION STUDY
ON DISORDERED ARRANGEMENTS
IN CRYSTALS AND GLASSES
(中性子およびX線回折による結晶とガラス中における乱れの研究)
平成 27年 3月
茨城大学大学院理工学研究科
MAKHSUN
NEUTRON AND X-RAY DIFFRACTION STUDY
ON DISORDERED ARRANGEMENTS
IN CRYSTALS AND GLASSES
DOCTOR (SCIENCE)
MAKHSUN
GRADUATE SCHOOL OF SCIENCE AND ENGINEERING
IBARAKI UNIVERSITY, JAPAN
MARCH, 2015
Abstract
Solid ionic conductor has become a great concern for researcher in the field of
materials physics in recent years. The solid ionic conductors have important role in
development of electronic components. High ionic conduction in solid materials
becomes a dream to realize all-solid-state ionic devices. The ionic crystals usually
have low conductivity at room temperature. The high ionic conductivity in ionic
crystals will be obtained at high temperature near their melting point. The
transportation of the ionic charges relates to the atomic vibration and ionic bonding in
the molecules of the solids. In crystals, the ionic charge transport is resulted from the
existence of defect which is caused by static and (or) thermal disorders. The disorder
arrangement that is caused by thermal disorder and (or) static disorder in the structure
of ionic materials known as the most possible reason to the high ionic conductivity.
The studies on the structure, disorder and thermal vibration become very important to
know the mechanism of charge movement in solids. A new technique of analysis
namely diffuse scattering intensity analysis as well as Rietveld analysis were used to
study the structure and disorder in solid materials. On the other hand the synthesis and
characterization of the super ionic conductors based on glass were presented to study
the crystal structures, thermal properties and conductivities. The challenge to find the
new materials with high ionic conductivity given by the recent technology and the
study of ionic conduction process motivate to carry out this research topic. This new
technique of X-ray and neutron diffuse scattering intensity was applied in analysis of
Ag2O, Cu2O and Al. It is capable to find the correlation effects among thermal
displacements, short range order parameters and interatomic force constants.
Neutron and X-ray diffraction intensities usually consist of Bragg peaks and
background intensities. The background intensities are resulted from coherent and
incoherent scattering. The oscillatory background scattering known as diffuse
scattering intensities are affected by the thermal vibration of atoms in crystal and any
imperfections of crystal structure arrangement from perfectly ordered structure. The
measurement of the diffuse scattering intensity is important to realize the static and
dynamic disorder in crystals. Investigations in lattice constants and crystal structure of
Ag2O and Cu2O have been carried out at two different temperatures with conventional
double-axis diffractometer setup and triple-axis mode with analyzer crystal adjusted
to the incident wavelength. Ag2O and Cu2O have same crystal structure with space
group of 3 and show negative thermal expansion but different lattice constant.
The diffuse scattering intensity of Ag2O at low temperature has noticeable oscillation
in contrast to Cu2O. This indicates that correlation effects and thermal parameters of
Ag2O are larger than those of Cu2O. Those results are also shown in MEM
(Maximum Entropy Method) analysis. The spread of nuclear density distributions of
Ag and O atoms in Ag2O is very large even at low temperature. The measurement in
elastic mode of Ag2O shows small diffuse contribution at low temperature but no
visible diffuse components at high temperature. It probably relates to static disorder in
the system or phonon softening and increasing of soft phonons density at low
temperature. Investigation in lattice constant and crystal structure of Al has been
conducted at temperature 290 K by neutron diffraction measurement of HRPD beam
line installed at JRR-3. The crystal structure of Al belongs to fcc structure with the
space group 3 . The correlation effects among first, second and third nearest
neighboring atoms in Al were obtained from diffuse scattering analysis. The values of
correlation effects at temperature 290 K are almost same as those in ionic crystals and
semiconductors near room temperature. Those values decrease rapidly with the
increase of interatomic distance. The force constants among first, second and third
nearest neighboring atoms are calculated using a new equation transform from
correlation effects among thermal displacements of atoms to force constants. In
Extended X-ray Absorption Fine Structure (EXAFS) analysis the force constant
among first nearest neighboring atoms can be obtained but it has serious problem for
the second and third nearest neighboring. The force constants and the crystal structure
of Al are used to estimate the phonon dispersion relations, phonon density of state and
specific heat by computer simulation. The calculated results of phonon dispersion
relations and specific heat by computer simulation are compared to those by inelastic
neutron scattering and specific heat measurement of Al. The results could
qualitatively explain the observed result by inelastic neutron scattering and specific
heat measurement.
Characterization and synthesis of (AgI)0.33(LiI)0.33(LiPO3)0.34 and
(AgI)0.44(LiI)0.22(AgPO3)0.34 are based to the preliminary study on the
(AgI)x(LiI)y(LiPO3)1-x-y and (AgI)x(LiI)y(AgPO3)1-x-y with x = 0.22, 0.33, 0.44 and y =
0.44, 0.33, 0.22. The results showed that both compositions have better conductivities.
Syntheses of (AgI)0.33(LiI)0.33(LiPO3)0.34 and (AgI)0.44(LiI)0.22(AgPO3)0.34 have been
carried out by melt quenching method. The characterization of both compounds is
conducted to analyze the crystal structures, thermal properties and conductivities. The
both compounds have almost same characteristics each other. The crystal structure of
both shows the mixture of amorphous background and small of crystalline form with
several Bragg peaks correspond to AgI. These indicate that a number of AgI are not
dissolved in those mixtures. Those results are also confirmed by the thermal
properties measurement. An endothermic peak appears at temperature of b to a AgI
phase transition. The conductivities of both compounds are relatively high even at
room temperature and higher than those of the most well known of AgI-LiPO3 and
LiI-LiPO3. The activation energies of both compounds are slightly different but
almost same to the activation energy of AgI. Conclusively it is indicated that the
conduction mechanisms are mainly to silver ions.
Contents
Chapter I Introduction 1
1.1 Motivations ............................................................................................... 2
1.2 Impetus ...................................................................................................... 2
1.3 Objectives ................................................................................................. 3
Chapter II Literature Review 6
2.1 Crystal Defects and Irregularities ............................................................. 7
2.2 Defect Concentration ................................................................................ 9
2.3 Super Ionic Conductor .............................................................................. 11
2.4 Structure Analyses .................................................................................... 17
2.5 Intensity Variation in Powder Data ........................................................... 21
2.6 Rietveld Analysis ...................................................................................... 27
2.7 Electrical Properties .................................................................................. 28
Chapter III Theory of Diffuse Scattering Intensity 31
3.1 Diffuse Scattering ..................................................................................... 32
3.2 Diffuse Scattering from Disorder Crystal ................................................. 34
3.3 Diffuse Scattering from Order Crystal ...................................................... 37
Chapter IV Experimental Method 39
4.1 Neutron Diffraction Measurements .......................................................... 40
4.2 Synthesis of Samples .............................................................................. 41
4.3 Measurements ........................................................................................... 44
Chapter V Neutron Diffraction Study of Static and Dynamic Disorder 46
5.1 Crystalline of Ag2O and Cu2O .................................................................. 47
5.2 Neutron Diffuse Scattering of Cu2O ......................................................... 48
5.3 Interatomic Force Constants of Cu2O ....................................................... 49
5.4 Crystal Structure and Thermal Parameters of Ag2O ................................. 58
5.5 Neutron Diffuse Scattering of Ag2O ......................................................... 61
5.6 Estimation of Force Constants of Al ......................................................... 63
Chapter VI Effect of Doping Mixtures AgI and LiI in Superionic
Conductors Base on LiPO3 and AgPO3 Glasses 72
6.1 Introduction ...................................................................................... 73
6.2 Synthesis and Properties of (AgI)0.33(LiI)0.33(LiPO3)0.34 ...................... 73
6.3 Synthesis and Properties of (AgI)0.44 (LiI)0.22 (AgPO3)0.34 ................... 76
Chapter VII Conclusions 80
Acknowledgements 83
References 84

Chapter I
Introduction
2
1.1 Motivations
A new technique of analysis in diffuse scattering intensity has been introduced.
This technique is useful to analysis the correlation effects among thermal
displacements, short range order parameters, interatomic force constants, sound waves
in crystals, etc. The diffraction intensities from a crystal consist of Bragg lines and
diffuse scattering component. Bragg lines are normally used in the analysis of crystal
structure by Rietveld analysis while this new technique takes a portion in analysis of
the other. At ambient temperature, the diffraction intensities are influenced by thermal
vibration and static disorder in the crystal structure. The diffraction experiments at
two different temperatures, at ambient temperature and low temperature, may be used
to analysis the important natures of a crystal. On the other hand by the experiments
using a triple-axis spectrometer inelastic (DE » 0) mode with the analyzer crystal
adjusted to reflect elastically scattered neutrons from the sample, the inelastic
scattering related to thermal vibrations can be filtered out. These techniques will be
used to analysis of Ag2O, Cu2O and Al. The other motivation in this research is to
find new solid materials with high ionic conductivity. Solid ionic conductors have
important role in development of electronic component. New solid electrolytes have
been introduced with synthesizing of AgI and LiI in the glass of LiPO3 and AgPO3.
However, attempting to understand the uniqueness of these new materials and
characterizing their properties are pertinent issues that need to be addressed before
widespread applications emerge.
1.2 Impetus
The discovery of electricity and electrical properties of materials has
supported an advanced electronic technology. Electrical conduction has been one of
the most important properties of materials. High ionic conduction in solids instead of
electrolytes becomes a dream to realize all-solid-state ionic devices. All-solid-state
batteries, solid fuel cells, all-solid capacitors are strongly required as advance energy
sources because of their high safety and high reliability. Super-ionic glass is one of
the solid electrolytes as the most important component in all-solid-state ionic devices
which has large advantages.
3
Such the Ag2O, Cu2O, AgI or LiI is one of the components in super-ionic glass,
they have been the subject of intensive research because of their unique mechanical,
electrical and chemical properties. In particular, their electrical and chemical
properties make them one of the most promising solid electrolyte materials, and this
point has attracted ideas and research related with solid electrolytes. Efforts for
finding high ionic conduction in solids have their roots in characterization and study
the properties of those ionic crystals. Ag2O and Cu2O have same crystal structure but
many differences in natures, while AgI and LiI have different mechanical conduction
in electrolytes. AgI in glass relatively has higher conductivity but lower activation
energy while LiI has higher activation energy but lower conductivity. On the other
hand, the new theory on analysis of diffuse scattering has established to study the
short range order parameters, interatomic force constants, sound waves in crystals,
crystal defects, etc. Diffuse scattering measurements have been used to investigate the
correlation effects among the first-, second-, and third-nearest-neighboring atoms on
semiconductors, ionic crystals, and solid electrolytes which cannot be done in
extended X-ray absorption fine structure (EXAFS). By EXAFS analysis, the
interatomic force constant between first nearest neighbors can be obtained but it has
serious problems for the second- and next-nearest-neighboring atoms.
Mixing AgI and LiI in the glass sytem of (AgI)x(LiI)y(LiPO3)1-x-y and
(AgI)x(LiI)y(AgPO3)1-x-y have realized the solid electrolyte with better conductivity.
The conductivity of (AgI)0.33(LiI)0.33(LiPO3)0.34 and (AgI)0.44(LiI)0.22(AgPO3)0.34 are
better than others in composition of x = 0.22, 0.33, 0.44 and y = 0.44, 0.33, 0.22 of
that stoichiometry. In order to realize these end goals, the studies are divided in two
parts. First is analysis of diffuse scattering intensities of Ag2O, Cu2O and Al. Second
is synthesis of (AgI)0.33(LiI)0.33(LiPO3)0.34 and (AgI)0.44(LiI)0.22(AgPO3)0.34 as well as
characterization of their properties of thermal, crystal structure and conductivity.
1.3 Objectives
The primary objectives of this research are to investigate the correlation
effects among thermal displacements of atoms in a crystal using a new technique
namely analysis of diffuse scattering intensity and to investigate the characteristic of
new solid ionic glass conductors. Neutron diffraction measurement data of Ag2O,
4
Cu2O and Al are used in the investigation using this new technique while new solid
ionic glass conductors of (AgI)0.33(LiI)0.33(LiPO3)0.34 and (AgI)0.44(LiI)0.22(AgPO3)0.34
are used in the characterization. More specific objectives in this research can be
summarized as follows:
· Investigate the lattice constants and crystal structures of Ag2O, Cu2O and Al in
two different temperatures. Calculations of lattice constants and other
parameters were done to neutron diffraction measurements using Rietveld
analysis method.
· Application mathematical model of diffuse scattering intensities on neutron
diffraction measurements of Ag2O, Cu2O and Al. Neutron diffraction
intensities consist of Bragg lines and diffuse scattering component. Bragg
lines are normally used in the analysis of crystal structure. In this research a
mathematical model of diffuse scattering intensities is also used in the analysis
of inter atomic force constants and other parameters.
· Correlate the thermal conditions to the lattice constants, atomic vibrations,
crystal defects and inter atomic distances of Ag2O and Cu2O. By neutron
diffraction measurements at two different temperatures, parameters that
influence the occurrences of diffuse scattering intensities changing by
temperatures depend to the compounds.
· Investigate the nuclear density distributions of Ag2O and Cu2O at two
different temperatures.
· Compare the thermal dependent properties of Ag2O and Cu2O.
· Discuss the algorithm for transforming the correlation effects among thermal
displacements of atoms to force constants and apply it to the result of neutron
diffuse scattering analysis of Al. The force constants of Al are used to estimate
the phonon dispersion relations, phonon density of states, and specific heat by
computer simulation.
· Syntheses the (AgI)0.33(LiI)0.33(LiPO3)0.34 and (AgI)0.44(LiI)0.22(AgPO3)0.34. In
our preliminary work, we vary the composition of AgI and LiI in LiPO3 and
AgPO3 glass to produce the mixtures of (AgI)x(LiI)y(LiPO3)1-x-y and
5
(AgI)x(LiI)y(AgPO3)1-x-y with x = 0.22, 0.33, 0.44 and y = 0.44, 0.33, 0.22.
The result shows those compositions have better ionic conductivities.
· Investigate the properties of (AgI)0.33(LiI)0.33(LiPO3)0.34 and (AgI)0.44(LiI)0.22
(AgPO3)0.34 using XRD, DSC and LCR meter to show up the crystal structure,
thermal properties and conductivity, respectively.
Result of application mathematical model of diffuse scattering intensities on
neutron diffraction measurements of Cu2O has been published in the Journal of Atom
Indonesia. Numerical works of syntheses and characterizations of the system
(AgI)x(LiI)y(LiPO3)1-x-y and (AgI)x(LiI)y(AgPO3)1-x-y have been published in the
Jurnal Sain Materi Indonesia (Indonesian version) and proceeding of International
Conference on Materials Science and Technology 2010. Result of characterizations of
(AgI)0.33(LiI)0.33(LiPO3)0.34 has been published in the International Journal of
Innovation in Science and Mathematics and that of (AgI)0.44(LiI)0.22(AgPO3)0.34 has
been accepted for publication in the Jurnal Sain Materi Indonesia. Result of applying
of transformation of the correlation effects among thermal displacements of atoms to
force constants in Al has been published in the Journal of The Physical Society of
Japan. Result of Correlate thermal conditions to the lattice constants, atomic
vibrations, crystal defects and interatomic distances of Ag2O and Cu2O will be
submitted to other Journal.

Chapter II
Literature Review
7
2.1 Crystal Defects and Irregularities
Crystalline is a solid where the constituent atoms are packed in regular and
repetitive pattern structures as well as extend in three dimensions. In contrast,
amorphous is a type of solid material, such as glass, that lacks such a long-range
repeating structure. The repeating units of a crystalline structure, which are made up
any three-dimensional shapes, are called as crystal lattice. Many of these crystal
lattices are grouped together in a repeating, orderly structure to make up the overall
structure. In fact, the arrangement of constituent atoms in a large solid crystalline is
not perfect, there are any defects in every a large solid crystalline. Therefore, defects
are defined as any deviation or imperfection of crystal structure arrangement from a
perfectly ordered structure. Defect can arise due to the presence of impurity or
absorbance of heat from surroundings. To understand the crystal defects in an ionic
solid material easily, the Kröger-Vink notation is expressed. Kröger-Vink notations
explain the nature, location and the effective charge of a defect relatively to a neutral
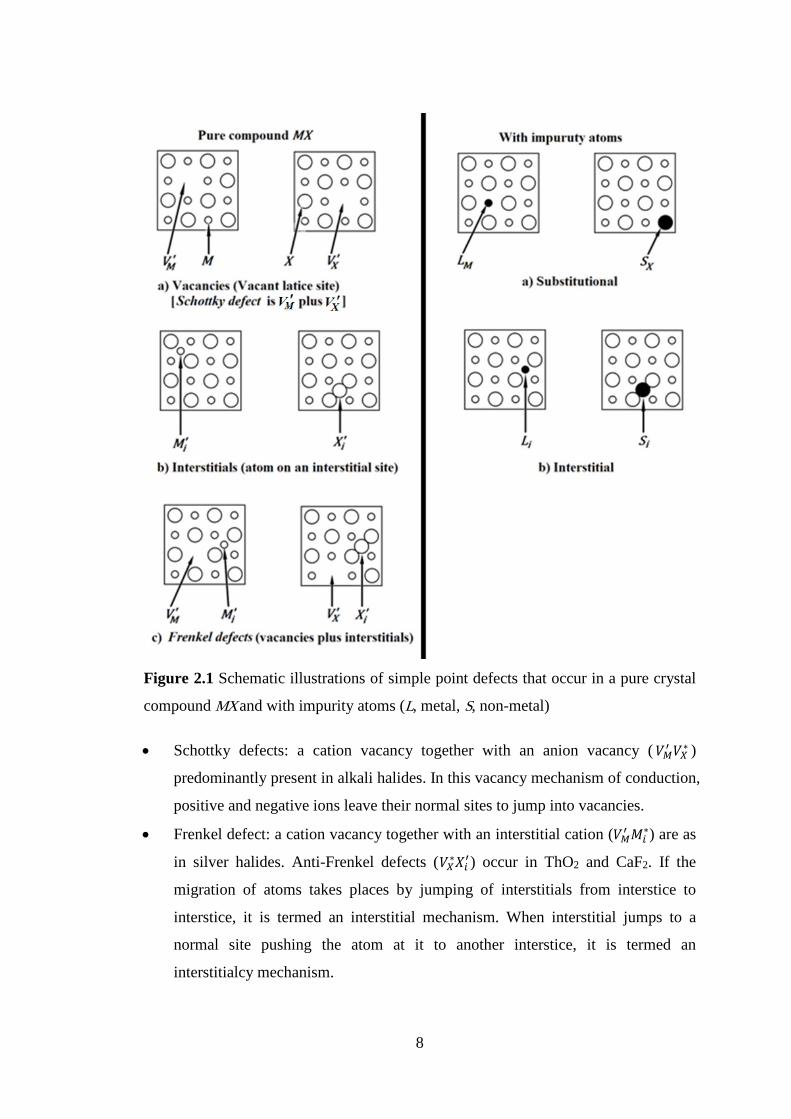
lattice which is not affected. Various types of possible ionic crystal defects (MX, M orX is monovalent) that may occur are as follows: (Fig. 2.1) [1].
· Vacancy: a missing M+ ion in pure binary compound from its normal site is
depicted as VM. Likewise a vacant anion site is represented by ∗ (Mo stands for a
vacancy, the subscript for the missing species and superscript for the charge,
prime for effective negative charge and dot for effective positive charge).
· Interstitials: an ion M+ or M’ occurs in an interstitial site denoted as ∗ or ′. The
term vacancy (or interstitial) defect may be understood to occur if in a volume
element of the lattice, a particle is missing (or contains an excess particle) with
respect to the ideal lattice, independent of whether at the point or in its immediate
vicinity, particles deviate from their normal position or not. In other words any
such defect is believed to cause a certain distortion of the lattice in the immediate
neighborhood.
· Misplaced atoms: an atom M occupying a normal X site or vice versa, MX or XM.
8
Figure 2.1 Schematic illustrations of simple point defects that occur in a pure crystal
compound MX and with impurity atoms (L, metal, S, non-metal)
· Schottky defects: a cation vacancy together with an anion vacancy ( ∗ )
predominantly present in alkali halides. In this vacancy mechanism of conduction,
positive and negative ions leave their normal sites to jump into vacancies.
· Frenkel defect: a cation vacancy together with an interstitial cation ( ∗) are as
in silver halides. Anti-Frenkel defects ( ∗ ) occur in ThO2 and CaF2. If the
migration of atoms takes places by jumping of interstitials from interstice to
interstice, it is termed an interstitial mechanism. When interstitial jumps to a
normal site pushing the atom at it to another interstice, it is termed an
interstitialcy mechanism.
9
· Impurities: aliovalent impurities substitute for a normal or interstitial site.
Impurity cations of higher (than host cation) valence generate impurity cation +
interstitial anion ( ∗ ) or impurity cation + cation vacancy ( ∗ ) defects. With
a lower valence impurity, it is possible to get an impurity cation + anion vacancy
or impurity cation + cation interstitial defect.
2.2 Defect Concentration
The presence of defects and/or disorders in the crystal structure is believed as
a medium for ionic conduction and diffusion. The defects concentrations
corresponding to the defect formation in term of the thermodynamic parameters are
expressed below:
a) Pure Crystal
Consider the Schottky defect where the mole fractions of positive and negative
ion vacancies are x1 and x2 and their numbers are n+ and n– respectively.
= = exp − (2.1)= = exp (− )= exp exp (− ) (2.2)
where Gs, Ss and Hs are Gibbs energy, entropy and enthalpy, respectively, of the
formation of a Schottky pair. N is the number of cation or anion sites. For a pure
crystal, the charge neutrality condition is written as;
= =The Frenkel defects can likewise be expressed as;
= ( ) / exp (− ) (2.3)
where N’ is the number of interstitial sites and GF the Gibbs energy for formation of
Frenkel defects.
10
b) Doped Crystal
Consider an ionic crystal that was doped by an aliovalent impurity. When a
crystal is doped, a number of additional cation vacancies are produced to compensate
the charge difference. The charge neutrality equation would then be;
= + (2.4)
where c1 is the mole fraction of the divalent impurity.
From equation (2.1), (2.2) and (2.4) can be obtain;
= {[1 + ( ) ] / + 1} (2.5a)= {[1 + ( ) ] / − 1} (2.5b)
For a large dopant concentration, i.e., c >> x0, the above equations reduce to x1 = c and = . For small concentrations, on the other hand, the concentrations reduce to the
pure crystal values as expected. i.e., x1 = x2 = x0.For a divalent anion impurity with a concentration c2, the charge neutrality condition
becomes;
+ = (2.6)
and the values of x1 and x2 would be;
= {[1 + ( ) ] / − 1} (2.7a)
= {[1 + ( ) ] / + 1} (2.7b)
The extra charge on the divalent cation impurity may also induce an
association of the oppositely charged cation vacancies. Since these complexes will not
contribute to the conductivity, it is essential to know and correct for the number of
these associated impurity-vacancy pairs.
11
2.3 Super Ionic Conductor
A super ionic conductor or a fast ion conductor is a solid material that has high
electrical conductivity resulting from the rapid movement of ions in the crystal lattice
[1]. Solid electrolyte is known as a super ionic conductor.
Generally ionic crystalline materials such as NaCl, AgI, LiI, CuI etc. have a
very low conductivity at room temperature. The conductivity will experience a slight
increase with increasing temperature, and when the temperature reaches their phase
transition temperatures, the conductivity increases sharply. The high conductivity of
ionic crystalline materials is only achieved over conditions exceeding the phase
transition temperature. But by certain technique and treatment, some compounds may
have a high conductivity even at temperatures below the phase transition temperatures.
In contrast to the metallic conductor materials such as copper, gold, silver etc.,
where the electric conduction is electrons, the high conductivity in super ionic
conductor mainly is ions. Therefore, the material is called as super ionic conductor.
Ideal super ionic conductor is a material that has a very high ionic conductivity, but
very low electronic conductivity.
It is known that the solid material has a very strong bond between atoms in its
molecule. It does not allow for ions to move but how can the ions in the solid super
ionic conductor move easily. The reason believed by researchers is due to the
presence of disorder or defects in the crystal structure of the super ionic conductor
material. Irregularities of atom positions and defects in the crystal structures result
vacant positions in certain places within the crystal. The vacant position is a medium
to move for the other atoms around it and it will make a new vacant position.
Therefore, the ions in the solid material can move.
According to the order conductivity, ionic solids are classified as normal ionic
conductors (NICs) and super ionic conductors (SICs). NICs have ionic conductivity
order of 10-14 to 10-6 Scm-1 at ambient temperature. The conductivity of NICs has
strongly temperature dependent. It also may be appreciated by the electronic
conductivity. The high ionic conductivity in NICs is reached just below the melting
point temperature. The activation process involves both energy, due to defect
formation (Hf) and ionic migration (hm) [2-3]. The conductivity of NICs is expressed
as;
12
= exp exp ( ) (2.8)
where, s is conductivity,= (pre-exponential factor)
T absolute temperature
Hf ion defect formation
hm ion migration
k Boltzman constant
e charge
0 jump frequency
Superionic conductors have ionic conductivity over than order of 10-6 Scm-1 at
room temperature [4-8]. In contrast to the normal ionic conductors, the electronic
conductivity in superionic conductors is very low. The ionic conductivity of
superionic conductors almost not changes by increasing temperature. The high
conductivity is reached even below the melting point temperature. The conductivity of
SICs is expressed as;
= exp ( ) (2.9)
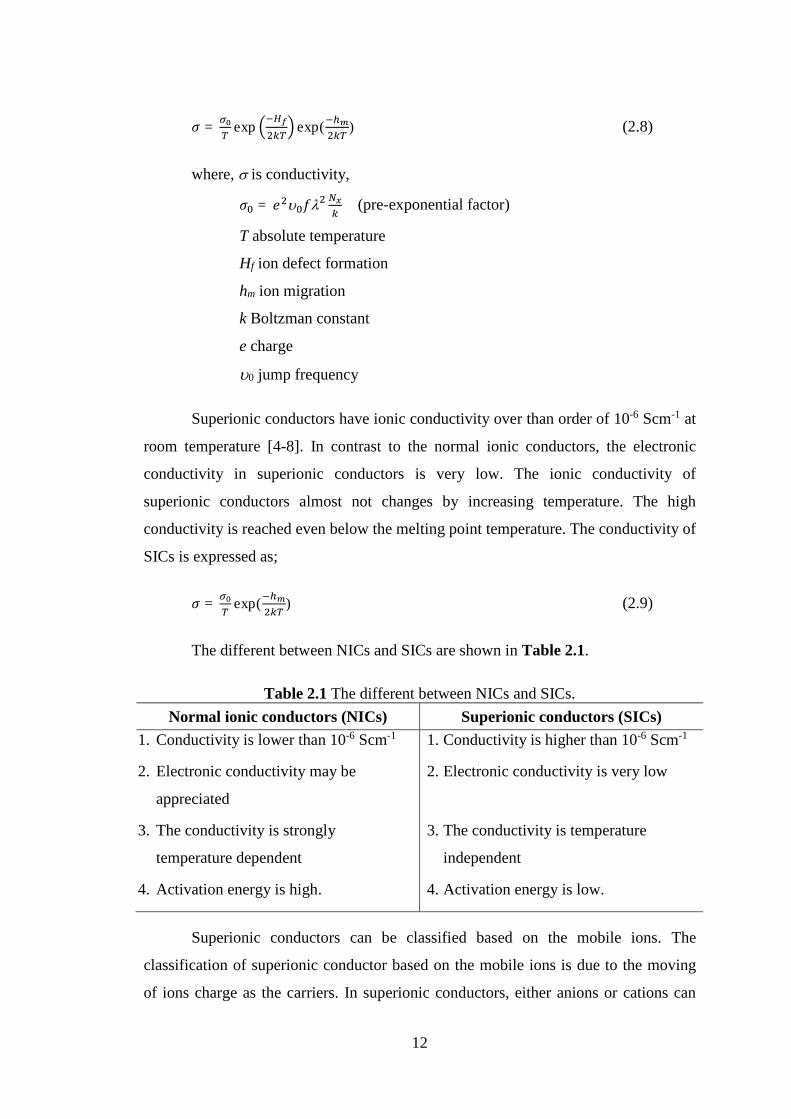
The different between NICs and SICs are shown in Table 2.1.
Table 2.1 The different between NICs and SICs.Normal ionic conductors (NICs) Superionic conductors (SICs)
1. Conductivity is lower than 10-6 Scm-1
2. Electronic conductivity may be
appreciated
3. The conductivity is strongly
temperature dependent
4. Activation energy is high.
1. Conductivity is higher than 10-6 Scm-1
2. Electronic conductivity is very low
3. The conductivity is temperature
independent
4. Activation energy is low.
Superionic conductors can be classified based on the mobile ions. The
classification of superionic conductor based on the mobile ions is due to the moving
of ions charge as the carriers. In superionic conductors, either anions or cations can
13
move. So, those are classified as anionic conductor and cationic conductor. The
negative ions as the charge carriers make the ionic conductors classified as an anionic
conductor. On the other hand the ionic conductors which have positive ions as the
charge carriers classified as cationic conductors.
Anionic conductors usually do not exhibit good ionic conductivity at ambient
temperature. There are two types of anionic conductors, oxide ion conductors and
fluoride ion conductors. The conduction mechanism in oxide ion conductors relates to
the motion of the oxygen ions. Most of the oxide ion conductors exhibit high
conductivity only at temperature over than 1000oC. The conductivity of the oxide ion
conductors also depends strongly on the doping impurities which control the number
defects and mobility of the oxygen ions. Generally, the fluoride type has better
conductivity than oxide type. The formers of it are univalent compounds. The
examples of the first type are Bi2Zn0.1V0.9O5.35, Bi2O3WO3, ZrO2Y2O3, etc., and the
last types are CaF2, SrF2, KbiF4, LaF3, ZrBaCCsF, etc. [3, 9].
Cationic conductors, generally, have better ionic conductivity than anionic
conductors at ambient temperature. The electrical conductivity of cationic conductors
is due to the presence of positive ions as charge carriers. Cationic conductors are the
most important ionic conductor in solid electrolyte. The high conductivity is due to
the large ionization potentials of the alkali metals and the small of the size and mass
of their ions. Their size and mass make them suitable for fast ionic conduction in solid
ionic conductors. The examples of cationic conductors are Li+, Na+, Cu+, Ag+, etc [10-
12]. Some types of cationic conductors are;
· Lithium ion conductors: LiI, Li3N, LiAlSiO4, Li5GaO4, Li4AlO4, Li6ZnO4,
Lix(LiPO3)1-x [13-19]
· Sodium ion conductors: Na2Ni2TeO6, Na2Mg2TeO6
· Copper ion conductors: a-CuI, Cu2CdI4, Cu2HgI4, Cu2Se, Rb4Cu16I7Cl13 and
KCu4I5 [20]
· Silver ion conductors: Ag6I4WO4, RbAg4I5, NH4Ag4I5, Ag7I4PO4, Ag6I4CrO4,
Ag6I4MoO4, etc. [21-22]
· Beta alumina conductors: in formula of n A2O3B2O with A3+ = Al3+, Ca3+, Fe3+,
ect. and B+ = Na+, K+, Rb+, Ag+, Ti+, H3O+, etc. [23]
14
· Protonic conductors: H8UO2(IO6)2×4H2O, polymides, polysulfinimide, etc. [24-27]
Superionic conductors are also classified based on the microstructure/phase of
solids. They are classified into single crystalline/polycrystalline, amorphous/glass,
composites and polymer.
a) Single crystalline/polycrystalline
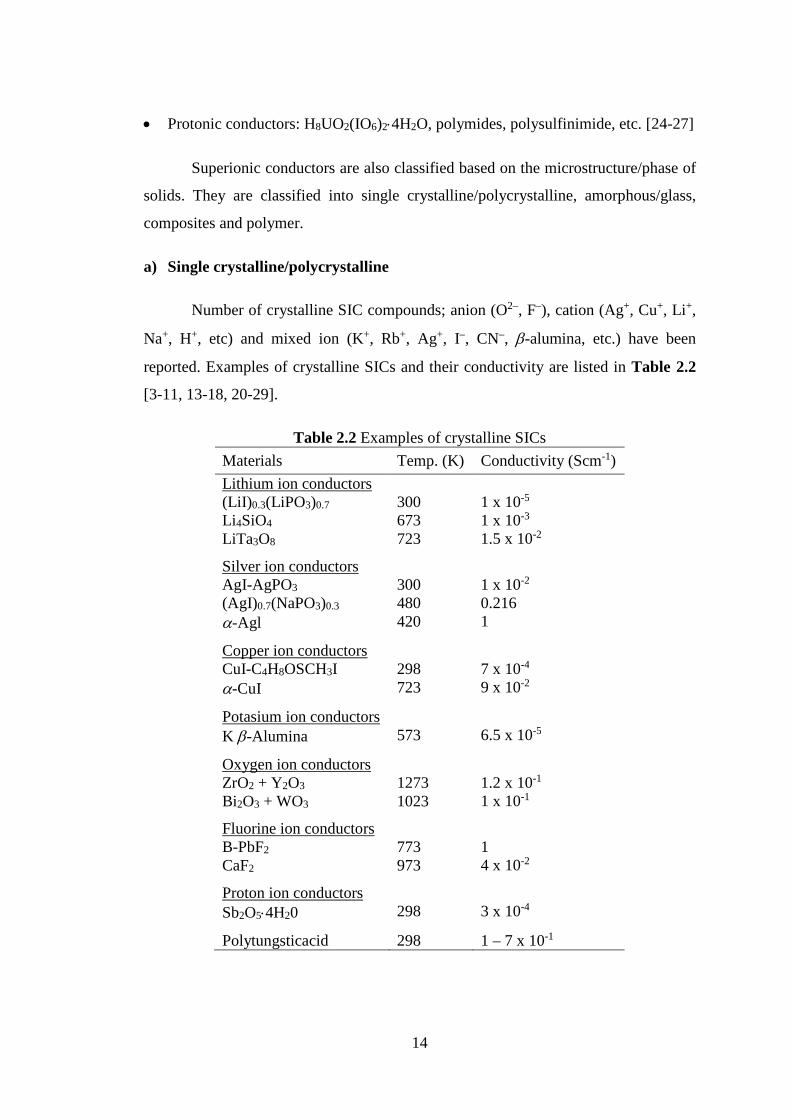
Number of crystalline SIC compounds; anion (O2–, F–), cation (Ag+, Cu+, Li+,
Na+, H+, etc) and mixed ion (K+, Rb+, Ag+, I–, CN–, b-alumina, etc.) have been
reported. Examples of crystalline SICs and their conductivity are listed in Table 2.2
[3-11, 13-18, 20-29].
Table 2.2 Examples of crystalline SICsMaterials Temp. (K) Conductivity (Scm-1)Lithium ion conductors(LiI)0.3(LiPO3)0.7Li4SiO4LiTa3O8
300673723
1 x 10⁻⁵
1 x 10⁻³
1.5 x 10⁻²
Silver ion conductors AgI-AgPO3(AgI)0.7(NaPO3)0.3
a-Agl
300480420
1 x 10⁻²
0.2161
Copper ion conductorsCuI-C4H8OSCH3Ia-CuI
298723
7 x 10⁻⁴
9 x 10⁻²
Potasium ion conductors K b-Alumina 573 6.5 x 10⁻⁵
Oxygen ion conductorsZrO2 + Y2O3Bi2O3 + WO3
12731023
1.2 x 10⁻¹
1 x 10⁻¹
Fluorine ion conductorsB-PbF2CaF2
773973
14 x 10-2
Proton ion conductorsSb2O5×4H20 298 3 x 10⁻⁴
Polytungsticacid 298 1 – 7 x 10⁻¹
15
b) Amorphous/Glass
Glassy SICs have several advantages compared with single crystalline/
polycrystalline or ceramic SICs such as high ionic conductivity; no grain boundary;
wide composition and easy in preparation. A wide composition of glass formers have
been used to form different types of local structures. Presence of two glass formers
may also enhance the conductivity. Generally, the conductivity increases with the
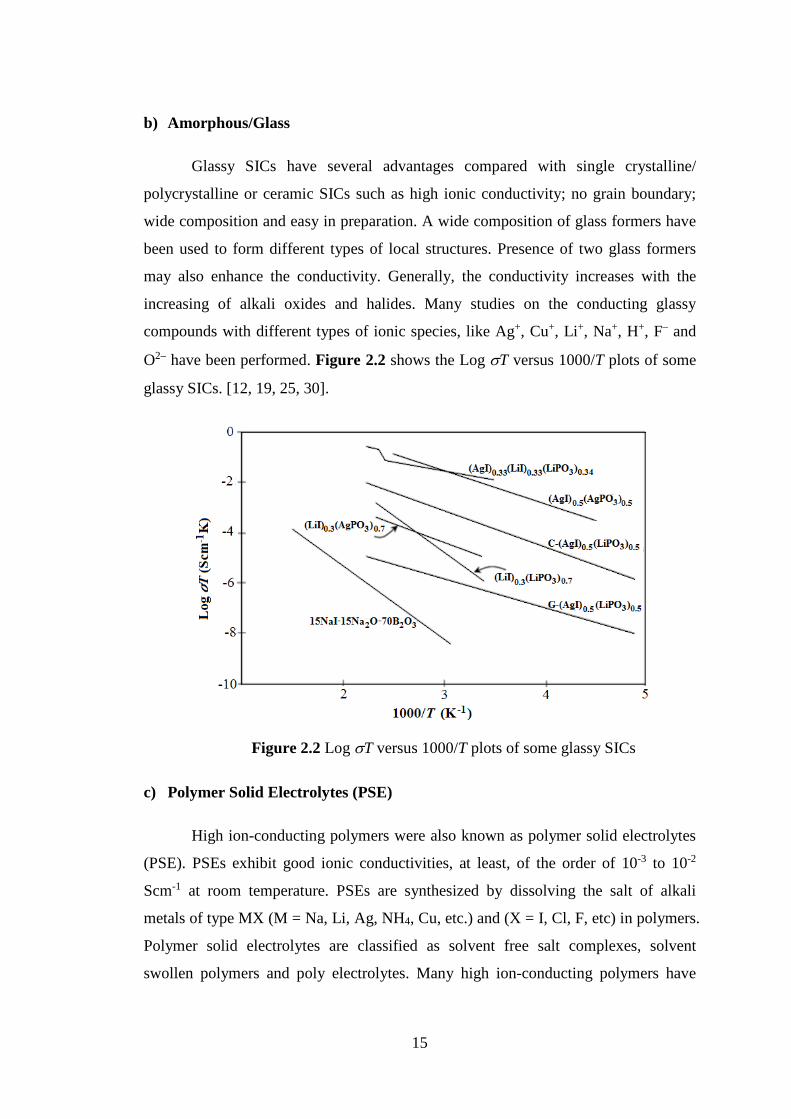
increasing of alkali oxides and halides. Many studies on the conducting glassy
compounds with different types of ionic species, like Ag+, Cu+, Li+, Na+, H+, F– and
O2– have been performed. Figure 2.2 shows the Log sT versus 1000/T plots of some
glassy SICs. [12, 19, 25, 30].
Figure 2.2 Log sT versus 1000/T plots of some glassy SICs
c) Polymer Solid Electrolytes (PSE)
High ion-conducting polymers were also known as polymer solid electrolytes
(PSE). PSEs exhibit good ionic conductivities, at least, of the order of 10-3 to 10-2
Scm-1 at room temperature. PSEs are synthesized by dissolving the salt of alkali
metals of type MX (M = Na, Li, Ag, NH4, Cu, etc.) and (X = I, Cl, F, etc) in polymers.
Polymer solid electrolytes are classified as solvent free salt complexes, solvent
swollen polymers and poly electrolytes. Many high ion-conducting polymers have
16
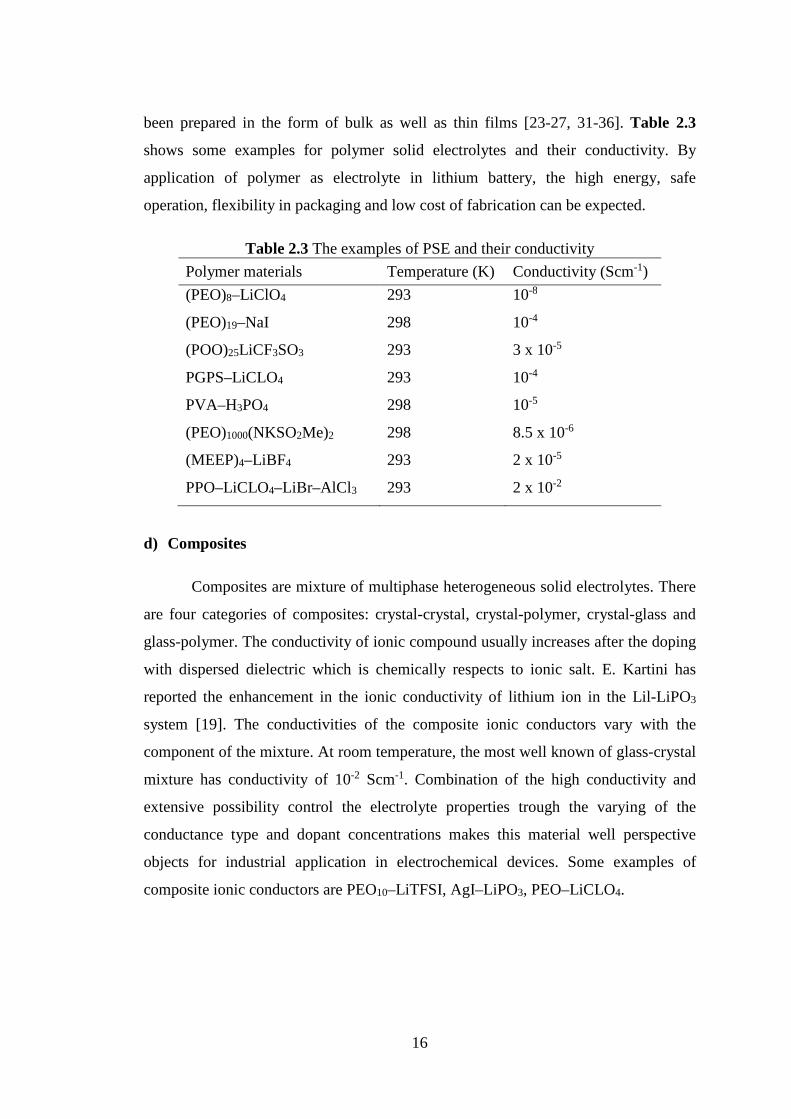
been prepared in the form of bulk as well as thin films [23-27, 31-36]. Table 2.3
shows some examples for polymer solid electrolytes and their conductivity. By
application of polymer as electrolyte in lithium battery, the high energy, safe
operation, flexibility in packaging and low cost of fabrication can be expected.
Table 2.3 The examples of PSE and their conductivityPolymer materials Temperature (K) Conductivity (Scm-1)(PEO)8–LiClO4
(PEO)19–NaI
(POO)25LiCF3SO3
PGPS–LiCLO4
PVA–H3PO4
(PEO)1000(NKSO2Me)2
(MEEP)4–LiBF4
PPO–LiCLO4–LiBr–AlCl3
293
298
293
293
298
298
293
293
10-8
10-4
3 x 10⁻⁵
10-4
10-5
8.5 x 10⁻⁶
2 x 10⁻⁵
2 x 10⁻²
d) Composites
Composites are mixture of multiphase heterogeneous solid electrolytes. There
are four categories of composites: crystal-crystal, crystal-polymer, crystal-glass and
glass-polymer. The conductivity of ionic compound usually increases after the doping
with dispersed dielectric which is chemically respects to ionic salt. E. Kartini has
reported the enhancement in the ionic conductivity of lithium ion in the Lil-LiPO3
system [19]. The conductivities of the composite ionic conductors vary with the
component of the mixture. At room temperature, the most well known of glass-crystal
mixture has conductivity of 10-2 Scm-1. Combination of the high conductivity and
extensive possibility control the electrolyte properties trough the varying of the
conductance type and dopant concentrations makes this material well perspective
objects for industrial application in electrochemical devices. Some examples of
composite ionic conductors are PEO10–LiTFSI, AgI–LiPO3, PEO–LiCLO4.
17
2.4 Structure Analyses
Neutron and X-ray diffraction are most powerful experimental techniques for
the structure analysis in materials. Diffraction intensities consist of Bragg lines and
diffuse scattering component. Bragg lines are normally used in the analysis of crystal
structure. Recently it was noticed that the diffuse scattering intensity has useful
physical properties which includes information about short range order parameters,
interatomic force constants, sound waves in crystals, etc.
2.4.1 Neutron Scattering
Neutron that is produced in a nuclear reactor usually has low energy. Base on
the length of the neutron radiation waves, low energy neutron can be classified as cold
neutron (3 – 30 Å), thermal neutron (4 – 1 Å) and hot neutron (1 – 0.4 Å). Neutron is
a particle that has no electric charge. This nature makes a neutron scattered by nuclei
when it hits an atom. The different interaction is occurred when X-ray mash an atom.
X-ray will be diffracted by electron cloud. There are four main types of neutron
scattering; simple scattering, elastic scattering, quasi-elastic/inelastic scattering and
spin-echo inelastic scattering. Each type is used to analysis the properties of the
materials as the requirements. At a research reactor, other components are needed
including diffractometer and a monochromator as well as filters to select the desired
neutron wavelength. The types of diffractometer include; conventional/double axis
diffractometer, triple axis diffractometer, small angle neutron scattering, and
reflectometer. In this thesis the first and second type are used to investigate the crystal
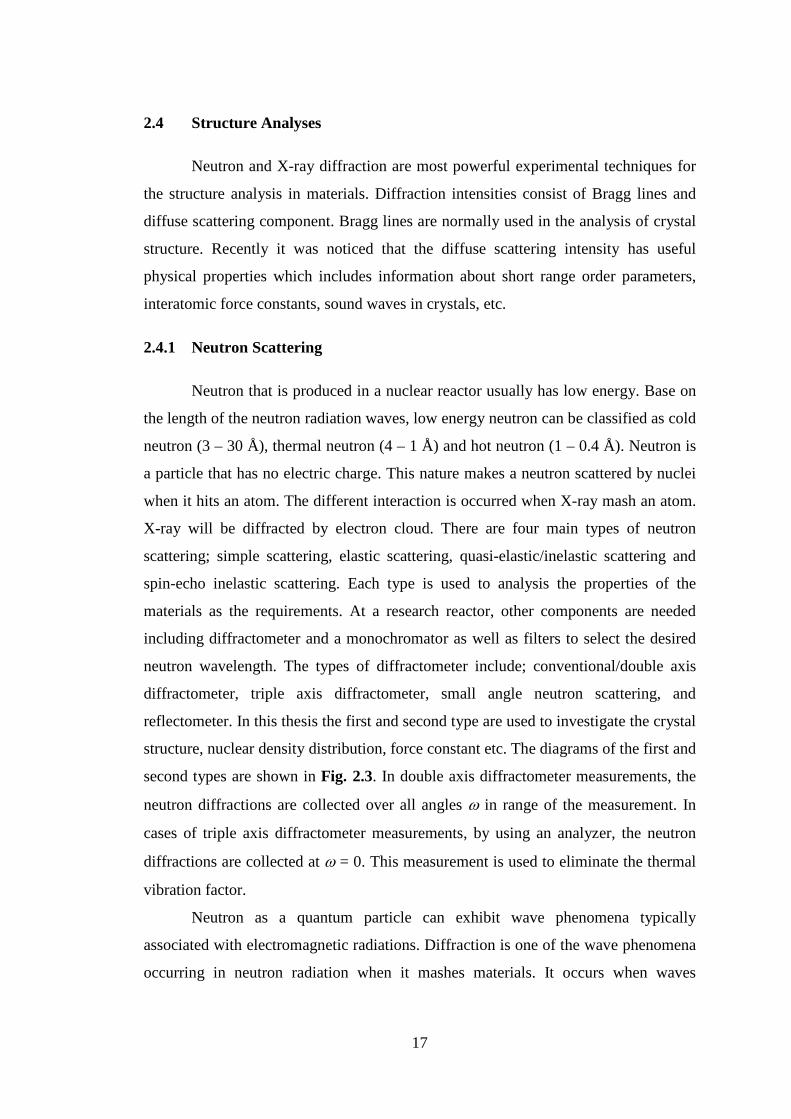
structure, nuclear density distribution, force constant etc. The diagrams of the first and
second types are shown in Fig. 2.3. In double axis diffractometer measurements, the
neutron diffractions are collected over all angles w in range of the measurement. In
cases of triple axis diffractometer measurements, by using an analyzer, the neutron
diffractions are collected at w = 0. This measurement is used to eliminate the thermal
vibration factor.
Neutron as a quantum particle can exhibit wave phenomena typically
associated with electromagnetic radiations. Diffraction is one of the wave phenomena
occurring in neutron radiation when it mashes materials. It occurs when waves
18
encounter obstacles whose size is comparable with the wavelength. If the wavelength
of the neutron radiation lies in near one angstrom where the lattice constant of
crystalline is in the order of this value, the nucleus of atoms can serve as scattering
obstacles.
Figure 2.3 Diagram of double and triple axis diffractometer
Although the neutron diffraction experiments are very expensive but neutron
diffraction analysis has some advantages compared with X-ray diffraction technique.
The advantages of neutron diffraction technique are:
· Neutron scattering lengths vary with atomic number and are independent of
momentum transfer Q.
· Neutrons interact through nuclear interactions, while X-rays interact with the
electron cloud of atoms.
· In neutron scattering, nuclei are point particles whereas in X-ray scattering,
atoms that have sizes comparable to the wavelength are the probing radiation.
· In the wide diffraction angle range, X-ray scattering contains scattering from
the electron cloud, whereas neutron scattering does not have.
· Neutrons have the right momentum transfer and right energy transfer for
investigations of both structures and dynamics in condensed matter.
· A wide range of wavelengths can be achieved by the use of cold sources.
Probed size range covers from the near Angstrom sizes to the near micron
sizes.
· Since neutron detection is through nuclear reactions, the detection signal-to-
noise ratio is high.
19
2.4.2 X-ray Diffraction
Wilhelm Rӧntgen, in year 1895, found that a radiation which has large
permeability was created when the rapid electrons mashing a material. The radiation
is named as X-ray due to the unknown of its properties. X-ray is an electromagnetic
wave with wavelength range between 10-2 - 102 Å. X-rays are produced when an
excited electron goes back to its original position. The returning of the electrons from
the higher orbital to the lower orbital energy level emits a characteristic energy.
In X-ray machine, an electron source emits electrons which are accelerated by
a voltage of about 30 kV to pound a metal target, generally Cu. The collisions result
the Cu electrons in the K shell excited. Immediately the electrons in the outermost
orbital fill the vacancy. The difference in the energy levels between the outer orbital
with the inner orbital electrons emits energy in the form of X-rays. For Cu, electron
transition from the orbital 2p to 1s is called as Ka with wavelength 1.5418 Å and
from the orbital 3p to 1s called as Kb [38].
X-ray diffraction measurement is also used to identify the structure of a crystal
in addition to neutron diffraction. Usually, neutron and X-ray diffraction intensities by
a crystal consist of Bragg lines and diffuse scattering components. The crystal
structure is normally analyzed from Bragg lines while the diffuse scattering is used to
analysis the other physical properties which includes information about correlation
effect among thermal displacements, force constants, phonon dispersion relations etc.
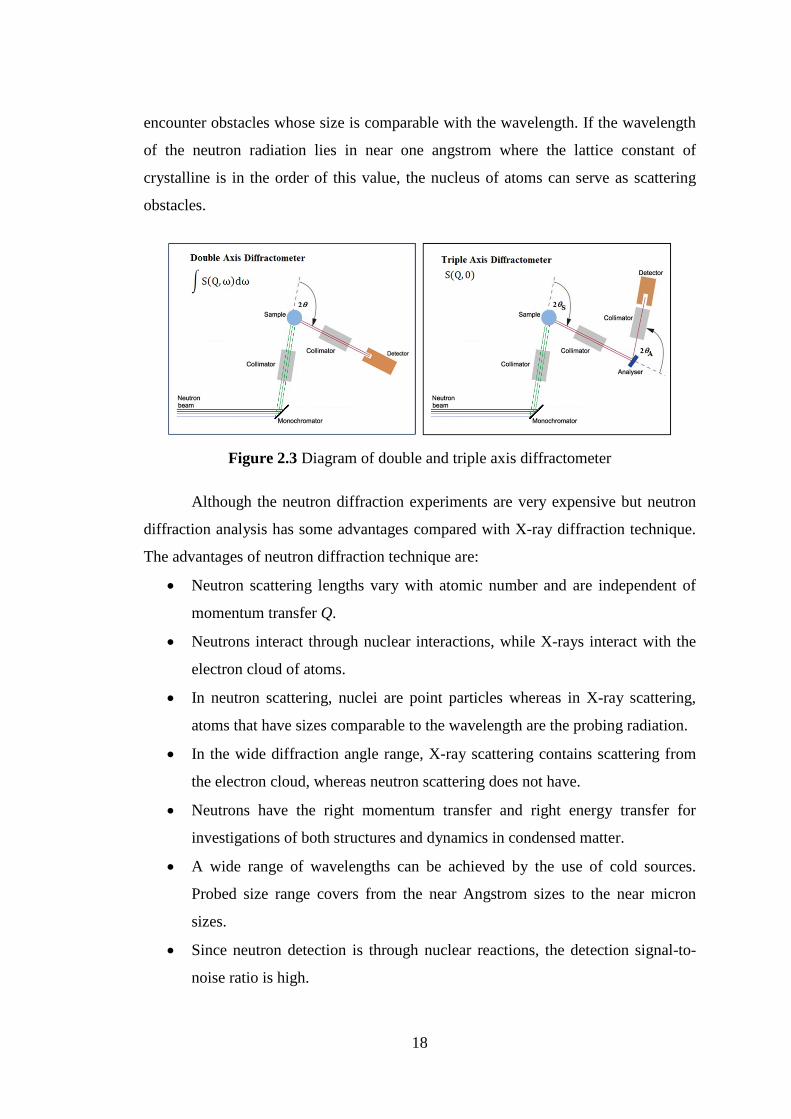
Figure 2.4 Schematic of X-ray diffractometer
20
The schematic of the XRD instrument can be seen in Fig. 2.4. Monochromatic
X-ray beam that was dropped on a crystal will scatter in all directions, but due to the
regularity of the atoms structure in the crystal, the scattering waves in a particular
direction will interfere constructively and destructively. In crystals, the atoms can be
viewed as a flat plane (Bragg planes) with each atom having a certain distance. A
necessary condition so that the radiation scattered by the atoms forming a constructive
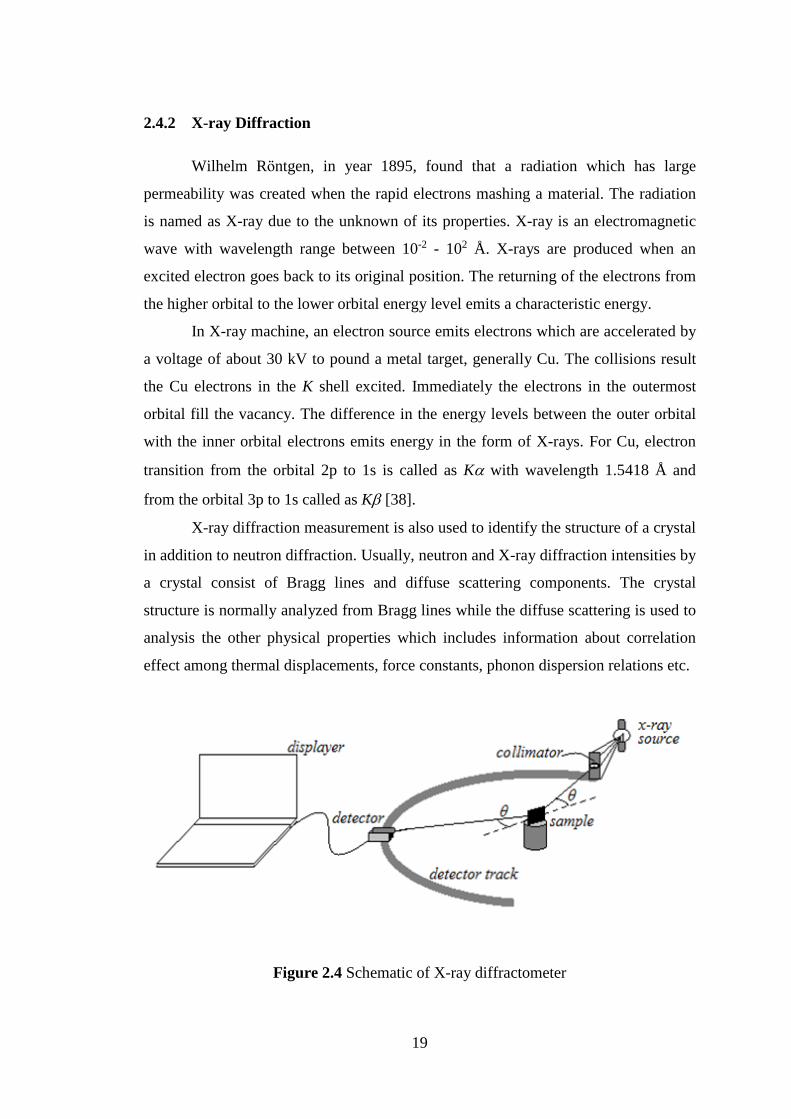
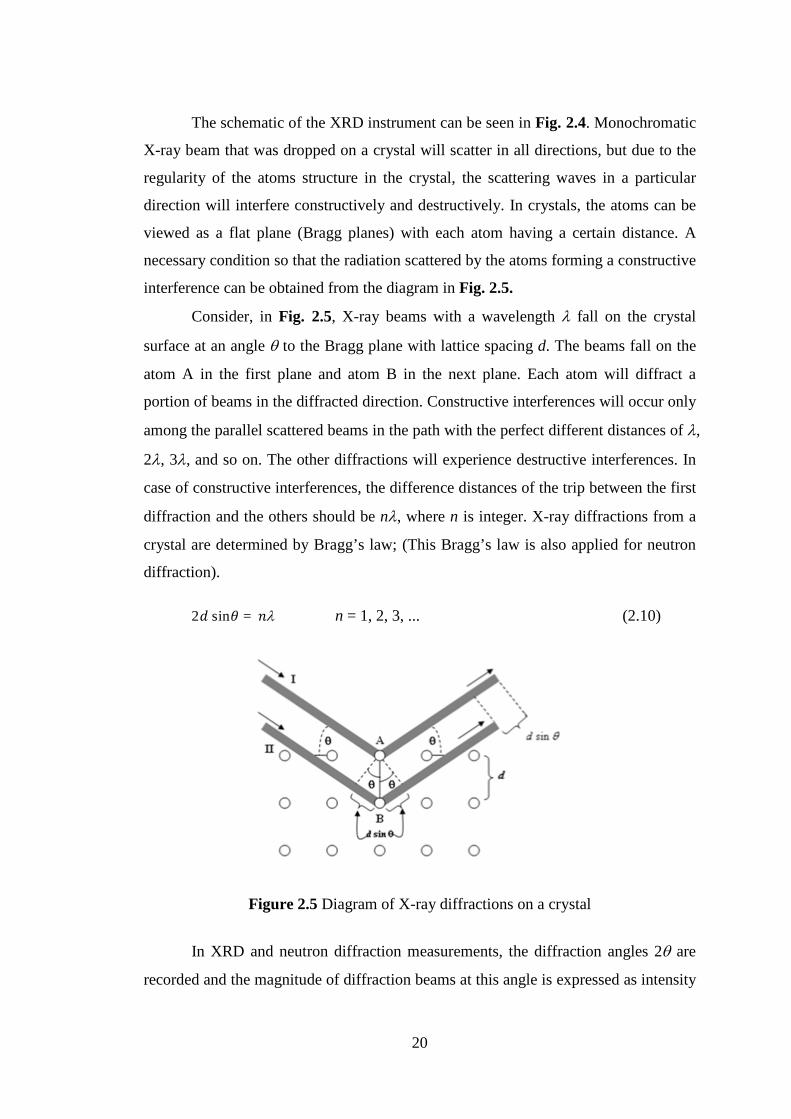
interference can be obtained from the diagram in Fig. 2.5.
Consider, in Fig. 2.5, X-ray beams with a wavelength fall on the crystal
surface at an angle q to the Bragg plane with lattice spacing d. The beams fall on the
atom A in the first plane and atom B in the next plane. Each atom will diffract a
portion of beams in the diffracted direction. Constructive interferences will occur only
among the parallel scattered beams in the path with the perfect different distances of ,
2, 3, and so on. The other diffractions will experience destructive interferences. In
case of constructive interferences, the difference distances of the trip between the first
diffraction and the others should be n, where n is integer. X-ray diffractions from a
crystal are determined by Bragg’s law; (This Bragg’s law is also applied for neutron
diffraction).
2 sin = n = 1, 2, 3, ... (2.10)
Figure 2.5 Diagram of X-ray diffractions on a crystal
In XRD and neutron diffraction measurements, the diffraction angles 2q are
recorded and the magnitude of diffraction beams at this angle is expressed as intensity
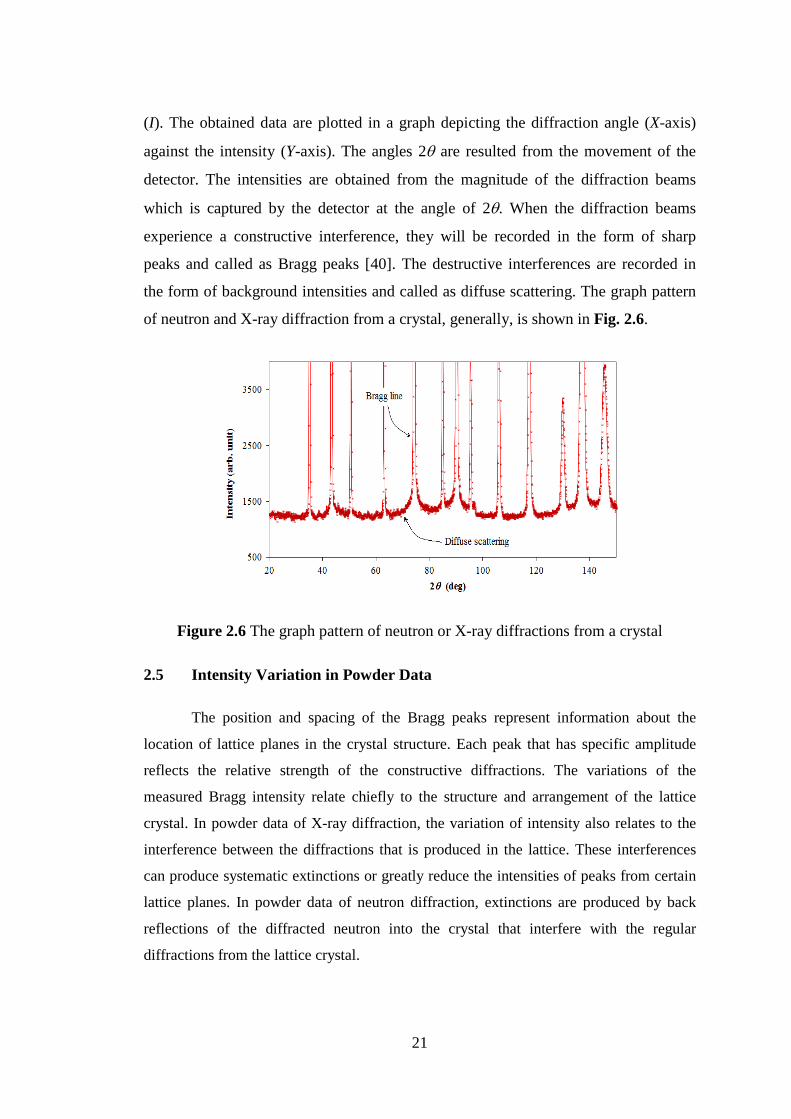
21
(I). The obtained data are plotted in a graph depicting the diffraction angle (X-axis)
against the intensity (Y-axis). The angles 2q are resulted from the movement of the
detector. The intensities are obtained from the magnitude of the diffraction beams
which is captured by the detector at the angle of 2q. When the diffraction beams
experience a constructive interference, they will be recorded in the form of sharp
peaks and called as Bragg peaks [40]. The destructive interferences are recorded in
the form of background intensities and called as diffuse scattering. The graph pattern
of neutron and X-ray diffraction from a crystal, generally, is shown in Fig. 2.6.
Figure 2.6 The graph pattern of neutron or X-ray diffractions from a crystal
2.5 Intensity Variation in Powder Data
The position and spacing of the Bragg peaks represent information about the
location of lattice planes in the crystal structure. Each peak that has specific amplitude
reflects the relative strength of the constructive diffractions. The variations of the
measured Bragg intensity relate chiefly to the structure and arrangement of the lattice
crystal. In powder data of X-ray diffraction, the variation of intensity also relates to the
interference between the diffractions that is produced in the lattice. These interferences
can produce systematic extinctions or greatly reduce the intensities of peaks from certain
lattice planes. In powder data of neutron diffraction, extinctions are produced by back
reflections of the diffracted neutron into the crystal that interfere with the regular
diffractions from the lattice crystal.
22
2.5.1 Scattering by an Atom
When a neutron hits an atom, it interacts with nuclei. The scattering of neutron
by nuclei is a quantum mechanical process. The general expression of the neutron
diffraction intensity is written as;= ∑ {exp ( ( − ) ∙ } = + (2.11)
where
= ∑ ⟨ ⟩ (2.12)= ∑ ⟨ ⟩⟨ ⟩ ∑ ∑ ′( )( ) {exp[ ( − ) ∙ ]} (2.13)
The prime added to the summation symbol means to omit the summation in case of = ′. N0 is the number of unit cells in a unit volume, ui corresponds to the number
of i atoms per unit cell, b scattering length, k in-coming wave vector, k’ out-going
wave vector, the number of sites belonging to the n’ th neighbor. In eq. 2.13 the
exponential term can be expressed in Dirac delta as;exp[ ( − ) ∙ ] = ∫ exp[ ( − ) ∙ ] ( − ) (2.14)
Substitution of eq. 2.14 to 2.13 will be resulted;= ∫ exp[ ( − ) ∙ ]∑ ⟨ ⟩⟨ ⟩ ∑ ∑ ′( )( ) { ( − )}(2.15)
In case of isotropic, the distribution function is defined as;
g ( ) = ( ) (2.16)
where
( ) = ∫ ∑ ∑ ( )( ) (2.17)
Substitute eq. 2.16 and 2.17 to 2.15 obtained;
23
= ∑ ⟨ ⟩⟨ ⟩ [(2 ) ( − )+∫ exp{ ( − ) ∙ } g ( ) − 1 ] (2.18)
The term of d(k – k’) is the case when the diffraction does not occurred. It make the
first term in square bracket to be omitted. By using Faber-Ziman partial structure
factor [39];
( ) − 1 = ∫ 4 g ( ) − 1 ( ) (2.19)
the equation of incoherent intensity can be obtained. This equation is a Fourier
transformation relation that relates the partial structure factor with the partial pair
distribution function. = ∑ ⟨ ⟩⟨ ⟩ [ ( ) − 1] (2.20)
where the total structural factor is defined as;( ) = ∑ ⟨ ⟩⟨ ⟩ [ ( ) − 1] (2.21)
and the total pair distribution function;( ) = ∑ ⟨ ⟩⟨ ⟩ [g ( ) − 1] (2.22)
From the eq. 2.19, 2.21 and 2.22, the Fourier transformation and its inverse
transformation relations can be obtained;
( ) = ∫ 4 ( ) ( ) (2.23)
( ) = ( ) ∫ 4 ( ) ( ) (2.24)
In XRD, X-rays interact with atoms through electromagnetic interactions with
the electron cloud of atoms. An electron will oscillate in phase with an X-ray beam
according to the Thomson scattering equation;
= ( ) (2.25)
24
where I0 is the intensity of the incident beam, e the charge on the electron, me the
mass of the electron, c the speed of light, and r the distance from the scattering
electron to the detector. From the second term, it is clear that the scattered energy
from a single electron is quite low. In the third term the cosine function is called the
polarization factor because it indicates that the incoming non-polarized X-ray is
polarized by the scattering process, resulting in a directional variation in the scattered
intensity.
Scattering by an atom is essentially the sum of the scattering of the electron
cloud around the nucleus. Each scattering from each electron follows the Thompson
equation. Because of the distance between electrons scattering within the atom and
the fact that the X-ray wavelength is of the same order as the atomic dimensions, there
will be path differences between the scattered waves. These differences will always
be less than one wavelength, so the interference will always be partially destructive.
This phenomenon is called the atomic scattering factor (f0), f0 is generally expressed
as a function of sinθ and λ. This function is normalized in units of the amount of
scattering occurring from a single electron in the Thompson equation. At zero degrees,
f0 will be equal to the number of electrons surrounding the atom. At higher scattering
angles, the factor will be less.
The actual shape of the f0 function is calculated by integrating scattering over
the electron distribution around an atom. Quantitatively, the calculation of the
correction to f0 involves a real (Δf’) and imaginary (Δf”) term. The effective scattering
will be;
| | = ( + ∆ ) + (∆ ) (2.26)
The thermal vibration amplitude of the atom also will have an effect on x-ray
scattering. The effective scattering is described by the following relationship;
= exp −
(2.27)
where B is the Debye-Waller temperature factor and defined as B=8p2<Δr2>, <Δr2> is
the mean-square amplitude of vibration of an atom, and is directly related to the
25
thermal energy (kT) available with other terms related to atomic mass and the strength
of interatomic bonds.
2.5.2 Structure Factor
The unit cells of most crystalline substances contain a several different
elements whose atoms are arranged in a complex motif defined by a variety of point
group symmetry elements and replicated by translational elements into a three
dimensional lattice array. The structure that may be thought of as repeating planar
arrays of atoms and the geometry of peaks is related fundamentally to positions of
those atoms. On the other hand, intensity is definitely related to the composition
because the intensity of scattering is related to atomic scattering. The structure factor
is a means of grouping the atoms in the unit cell into planar elements, developing the
diffraction intensities from each of those elements and integrating the results into the
total diffraction intensity from each dhkl plane in the structure.
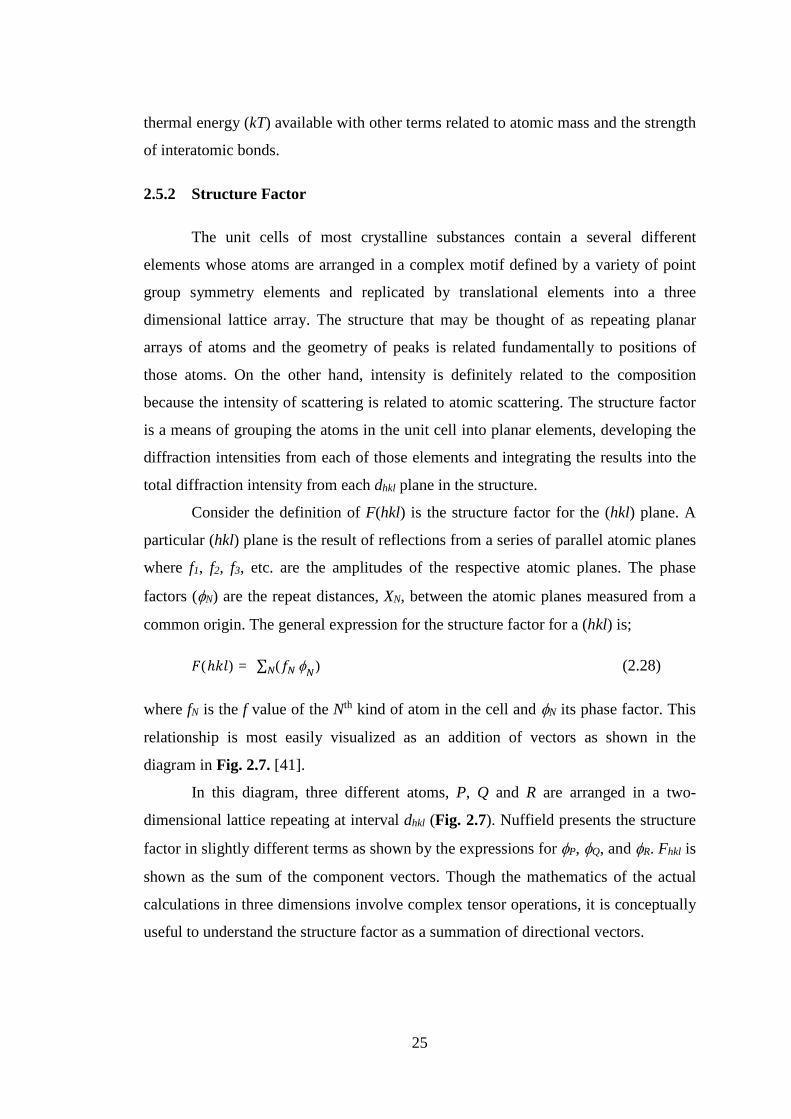
Consider the definition of F(hkl) is the structure factor for the (hkl) plane. A
particular (hkl) plane is the result of reflections from a series of parallel atomic planes
where f1, f2, f3, etc. are the amplitudes of the respective atomic planes. The phase
factors (fN) are the repeat distances, XN, between the atomic planes measured from a
common origin. The general expression for the structure factor for a (hkl) is;
(ℎ ) = ∑ ( f ) (2.28)
where fN is the f value of the Nth kind of atom in the cell and fN its phase factor. This
relationship is most easily visualized as an addition of vectors as shown in the
diagram in Fig. 2.7. [41].
In this diagram, three different atoms, P, Q and R are arranged in a two-
dimensional lattice repeating at interval dhkl (Fig. 2.7). Nuffield presents the structure
factor in slightly different terms as shown by the expressions for fP, fQ, and fR. Fhkl is
shown as the sum of the component vectors. Though the mathematics of the actual
calculations in three dimensions involve complex tensor operations, it is conceptually
useful to understand the structure factor as a summation of directional vectors.
26
Figure 2.7 Vector representations of waves with different amplitudes and phase
2.5.3 Extinction
In certain lattice types, the arrangement and spacing of lattice planes produce
diffractions from certain classes of planes in the structure. The diffractions that are
exactly 180° out of phase will not produce visible diffractions. This phenomenon is
called as extinction. For example, in case of body centered cubic (bcc) structure, atom
located at x, y and z will have an identical atom located at x+½, y+½ and z+½. The
structure factor Fhkl of bcc is represented by the following equation;
= ∑ exp 2 ℎ + +/+ ∑ exp 2 (ℎ + + + + +/ (2.29)
It is noted that if h + k + l is even (= 2m), where m is integer, the second term will
contain 2mπ. It will have no effect on the value of this term and the equation will
reduce to;
= 2 ∑ exp 2 ℎ + +/ (2.30)
27
However, if h + k + l is odd (= 2m + 1) the second term will contain 2π(m + 1/2). This
causes the second term to be negative, and it will result the Fhkl = 0 that means there is
no diffracted intensity. This condition is called a systematic extinction. Extinctions
can also be caused by atomic scattering vectors that happen to cancel each other out
and are not related to systematic lattice parameters, these are called accidental
extinction.
2.6 Rietveld Analysis
The Rietveld analysis method is a technique for refining structure and lattice
parameters directly from whole X-ray or neutron powder diffraction patterns. This
method is very useful if single crystals cannot be grown at all and it also greatly ease
the work of researchers because it does not need to grow a single crystal. The Rietveld
analysis is used only for the known crystal structure. While for the unknown crystal
structure, this method was used as the last process of ab initio structure analysis after
the whole diffraction data is prepared by a program for automatic solution of crystal
structures by direct methods optimized for powder data.
The parameters in Rietveld analysis for powder diffraction are much more
vary than those for single crystal according of less structural information contained in
their data. Peak-shift, background, profile-shape, preferred-orientation, and lattice
parameters must be refined in addition to scale factors and structure parameters in
Rietveld analysis. The number of refinable parameters increases considerably when
dealing with samples consisting of two or more phases. However, Rietveld method is
capable for analyzing data with vary parameters, conversely the additional parameters
give us more information than only the crystal structure.
The principle of the Rietveld analysis is refined the diffraction pattern of
angle-dispersive powder-diffraction data. A set of variable parameters that represent
powder-diffraction patterns is refined by fitting the calculated powder pattern to the
observed one by a nonlinear least-squares method. The observed scattered intensity
from diffractometer at particular step i, yio, is modeled by a calculated intensity yic.
This calculation intensity is expressed as:
= +∑ | | ( ) (∆ ) (2.31)
28
where yib is the background function, Sk the scale factor, Fk the structure factor, mk the
multiplicity, Pk the correction factor for preferred orientation and Lk the Lorentz
polarization factor.
2.7 Electrical Properties
Electrical conductivity is a measure of the ability of a material to carry a
current. The conductivity obtained from the measurement is total conductivity by all
possible charge carriers. There are three possible charge carriers in the solids:
electrons, holes and ions. The total conductivity is sum of these three components.
Current flow in ionic conductors differs from that in metal conductors in that
electrons cannot flow freely, but must be carried by ions. All ions present in the
material contribute to the current flowing through the sensor therefore they contribute
to the conductivity measurement. Electrical conductivity is a very useful property
since values are affected by such things as a substances chemical composition and the
stress state of crystalline structures.
Ionic conduction in solids is a very interesting and challenging problem in
condensed matter science. Solids come in a variety of structures and forms: single
crystalline, polycrystalline, glassy and polymeric. Even within a given solid,
temperature and excitation frequencies can trigger a whole range of ion dynamic
phenomena, furthermore, the frequency dependent conductivity of several these
complex systems exhibits universal behavior. Ionic conductivity, si, arises when an
electric field, E, is applied to an ionic solid. A current density, J, developed in the
material is given by;
= (2.32)
where si is related to mobile ion density N, the mobile ion charge Ze and the velocity
of the mobile ion per unit electric field or ion mobility m.
= ( ) (2.33)
Ion mobility changes with temperature as;
= exp(− ) (2.34)
29
Thus;
= exp(− ) (2.35)
Where;
= (2.36)
Ea is the electrostatic energy barrier that the ion has to overcome in order to hop from
one site to another in the crystal/material.
2.7.1 Ionic Conductivity Measurement
The method of electrical conductivity measurement conventionally used in the
cement field involves the use of current contacts. In order to obtain only the ionic
conductivity component for mixing conductor materials, a measurement technique
based on the polarization effect is used [42-43]. In this technique, two different
electrodes: silver as cathode and graphite as anode are used. By this technique, the ion
movements are blocked and the observed conductivity only from electrons and holes
components.
The measurement of ionic conductivity in solid materials commonly uses the
alternating current. The application of direct current produces concentration gradients
in the mobile species as ionic migration proceeds. In ac circuits, the ratio of impressed
voltage to resulting current yields the vector impedance, Z from which sample
conductivity must be extracted. The ionic conductivity measurement of
polycrystalline samples usually provides the ambiguous vector impedance data. The
polycrystalline exhibit higher concentration of lattice defects as well as concentration
gradients that not only contribute to bulk conductivity, but also provide alternative
ionic conduction channels along the grain boundaries. However for analytical
purposes, polycrystalline samples are usually measured due to the difficulties in the
preparation of large single crystals.
The other problem of ac conductivity measurement is the fact that capacitance
effects are introduced at the interface of grain boundaries and at the interface of the
solid electrolyte with its measuring electrodes. For many cation conductors, a
30
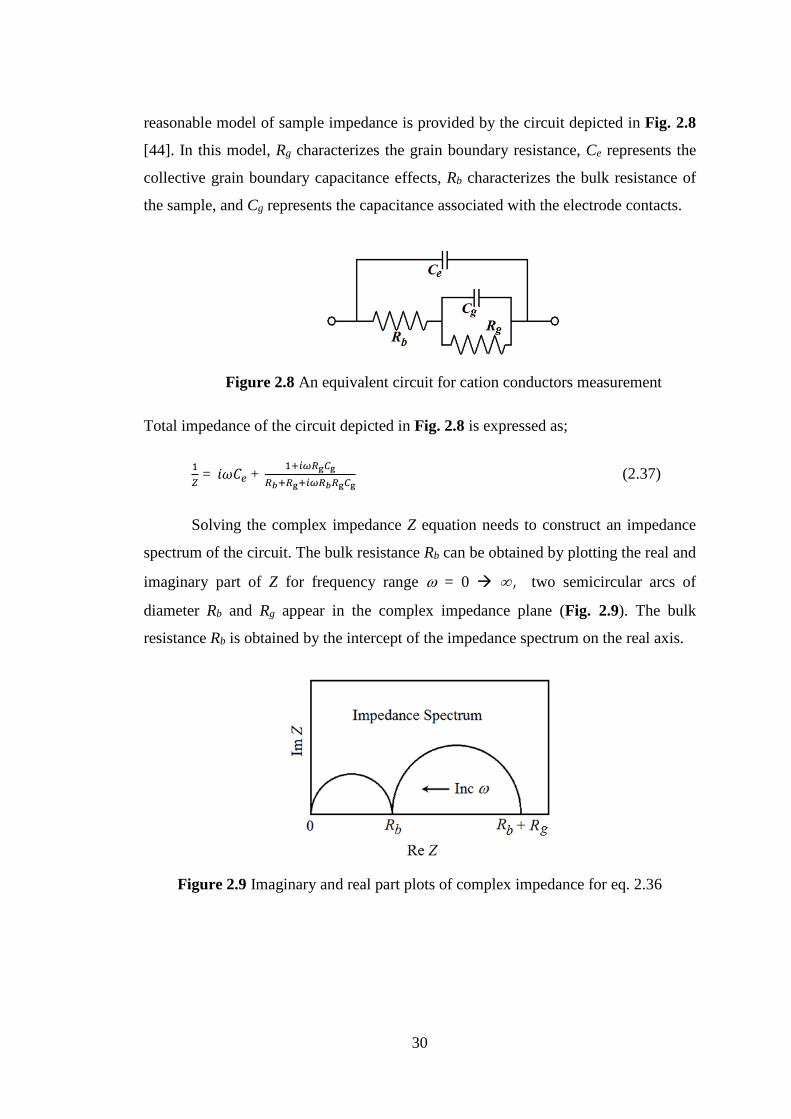
reasonable model of sample impedance is provided by the circuit depicted in Fig. 2.8
[44]. In this model, Rg characterizes the grain boundary resistance, Ce represents the
collective grain boundary capacitance effects, Rb characterizes the bulk resistance of
the sample, and Cg represents the capacitance associated with the electrode contacts.
Figure 2.8 An equivalent circuit for cation conductors measurement
Total impedance of the circuit depicted in Fig. 2.8 is expressed as;
= + (2.37)
Solving the complex impedance Z equation needs to construct an impedance
spectrum of the circuit. The bulk resistance Rb can be obtained by plotting the real and
imaginary part of Z for frequency range w = 0 ¥, two semicircular arcs of
diameter Rb and Rg appear in the complex impedance plane (Fig. 2.9). The bulk
resistance Rb is obtained by the intercept of the impedance spectrum on the real axis.
Figure 2.9 Imaginary and real part plots of complex impedance for eq. 2.36
Capter III
Theory of Diffuse Scattering Intensity
32
3.1 Diffuse Scattering
When an electromagnetic wave mashes a material, it will be diffracted to all
directions by the atoms in that material. In crystal, the atoms are stacked in regular
and periodically array structure in three dimensional pattern. They make the
diffraction waves to experience the constructive and destructive interferences. The
constructive interferences are known as Bragg peaks and the others are called as
background intensities. The background intensities are resulted from two factors;
coherent scattering which is known as diffuse scattering and incoherent modified
scattering. The background intensities, Ib, can be expressed as;
= + (3.1)
where Id is diffuse scattering intensity and Iincoh incoherent scattering intensity.
Analysis of diffuse scattering intensity becomes very interesting to study the
properties of the materials. Diffuse scattering contains information about a short range
order in disordered arrangement and thermal vibration of atoms in crystals [45-46].
The usable of the diffuse scattering analysis has been applied to the neutron
diffraction and X-ray diffraction experiment [47-52].
The measurement of the diffuse scattering intensity is important to realize the
static and dynamic disorder in crystals. Intensity of diffuse scattering is affected by
the thermal vibration of atoms in crystal and any deviation or imperfection of crystal
structure arrangement from a perfectly ordered structure. The crystal defects due to
the vacancies of the atoms from their regular position are known as static disorder. In
the other hand, the disorder which is caused by the thermal vibrations in the crystal is
named as thermal or dynamic disorder. The frequency of the thermal vibration is
several orders of magnitude slower than the interaction collision between photon and
crystal lattice. As the result, in diffraction experiments the incident beam sees atoms
statistically displaced from their averaged positions. The diffuse scattering associated
with the thermal vibration is known as thermal diffuse scattering (TDS) and the
diffuse scattering associated with the crystal defect is known as short range order
(SRO) diffuse scattering.
33
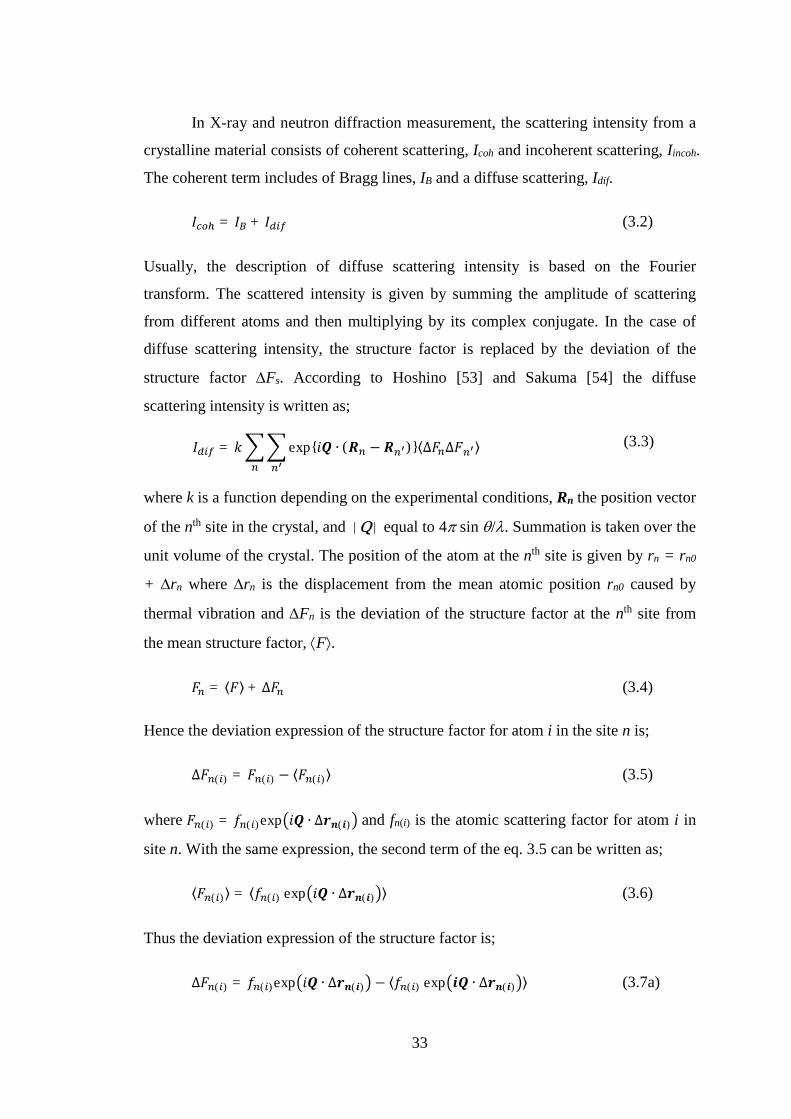
In X-ray and neutron diffraction measurement, the scattering intensity from a
crystalline material consists of coherent scattering, Icoh and incoherent scattering, Iincoh.
The coherent term includes of Bragg lines, IB and a diffuse scattering, Idif.
= + (3.2)
Usually, the description of diffuse scattering intensity is based on the Fourier
transform. The scattered intensity is given by summing the amplitude of scattering
from different atoms and then multiplying by its complex conjugate. In the case of
diffuse scattering intensity, the structure factor is replaced by the deviation of the
structure factor DFs. According to Hoshino [53] and Sakuma [54] the diffuse
scattering intensity is written as;
= exp{ ∙ ( − )}⟨∆ ∆ ⟩ (3.3)
where k is a function depending on the experimental conditions, Rn the position vector
of the nth site in the crystal, and |Q| equal to 4p sin q/. Summation is taken over the
unit volume of the crystal. The position of the atom at the nth site is given by rn = rn0
+ Drn where Drn is the displacement from the mean atomic position rn0 caused by
thermal vibration and DFn is the deviation of the structure factor at the nth site from
the mean structure factor, áFñ.
= ⟨ ⟩ + ∆ (3.4)
Hence the deviation expression of the structure factor for atom i in the site n is;
∆ ( ) = ( ) − ⟨ ( )⟩ (3.5)
where ( ) = ( )exp ∙ ∆ ( ) and fn(i) is the atomic scattering factor for atom i in
site n. With the same expression, the second term of the eq. 3.5 can be written as;
⟨ ( )⟩ = ⟨ ( ) exp ∙ ∆ ( ) ⟩ (3.6)
Thus the deviation expression of the structure factor is;
∆ ( ) = ( )exp ∙ ∆ ( ) − ⟨ ( ) exp ∙ ∆ ( ) ⟩ (3.7a)
34
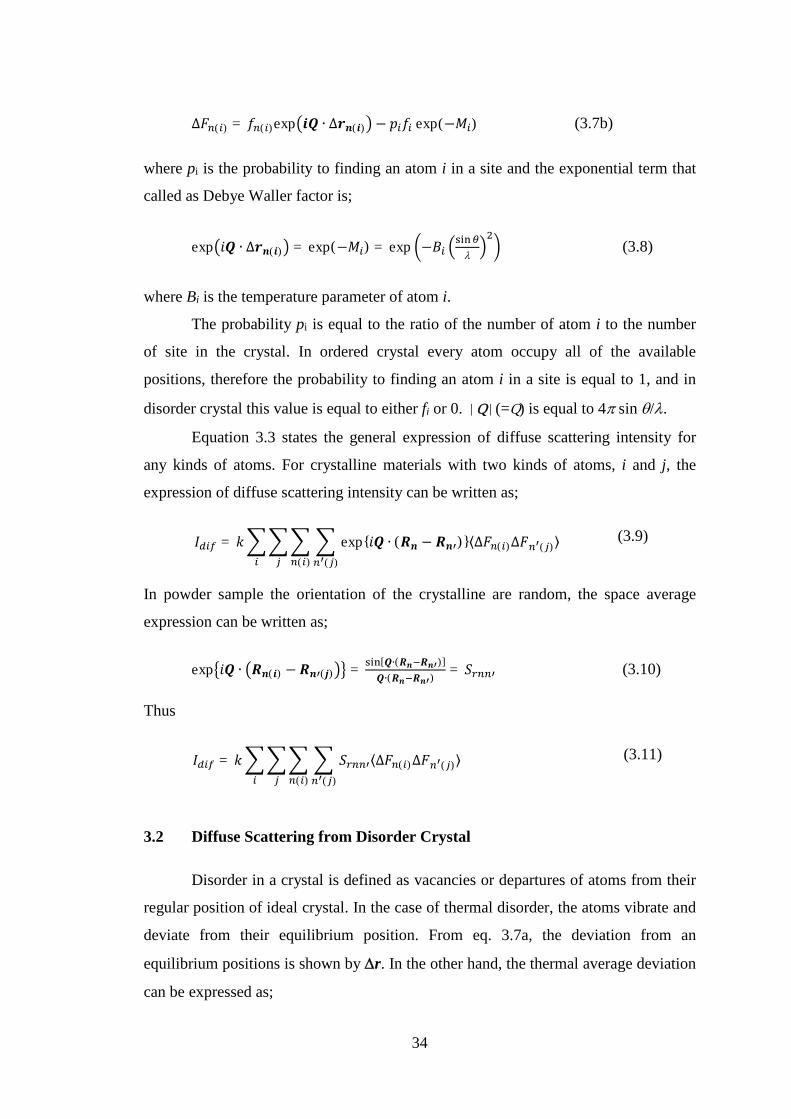
∆ ( ) = ( )exp ∙ ∆ ( ) − exp (− ) (3.7b)
where pi is the probability to finding an atom i in a site and the exponential term that
called as Debye Waller factor is;
exp ∙ ∆ ( ) = exp(− ) = exp −
(3.8)
where Bi is the temperature parameter of atom i.
The probability pi is equal to the ratio of the number of atom i to the number
of site in the crystal. In ordered crystal every atom occupy all of the available
positions, therefore the probability to finding an atom i in a site is equal to 1, and in
disorder crystal this value is equal to either fi or 0. |Q|(=Q) is equal to 4p sin q/.
Equation 3.3 states the general expression of diffuse scattering intensity for
any kinds of atoms. For crystalline materials with two kinds of atoms, i and j, the
expression of diffuse scattering intensity can be written as;
= exp{ ∙ ( − )}⟨∆ ( )∆ ( )⟩( )( ) (3.9)
In powder sample the orientation of the crystalline are random, the space average
expression can be written as;
exp ∙ ( ) − ( ) = [ ∙( )]∙( ) = (3.10)
Thus
= ⟨∆ ( )∆ ( )⟩( )( ) (3.11)
3.2 Diffuse Scattering from Disorder Crystal
Disorder in a crystal is defined as vacancies or departures of atoms from their
regular position of ideal crystal. In the case of thermal disorder, the atoms vibrate and
deviate from their equilibrium position. From eq. 3.7a, the deviation from an
equilibrium positions is shown by Dr. In the other hand, the thermal average deviation
can be expressed as;
35
⟨exp − ∙ (∆ − ∆ ) ⟩≅ exp − ∙ ⟨ ∆ − ∆ ⟩ − ⟨ ∆ − ∆ ⟩ − ⟨ ∆ − ∆ ⟩= exp − ⟨∆ ⟩ + ⟨∆ ⟩ 1 − ⟨∆ ∙∆ ⟩⟨∆ ⟩ ⟨∆ ⟩= exp − + 1 − ( ) ( ) (3.12)
where exp(–Mn) is Debye-Waller factor and the correlations among thermal
displacement of atoms i and j can be written as [54];
( ) ( ) = ⟨∆ ( )∙∆ ( )⟩⟨∆ ( ) ⟩ ⟨∆ ( ) ⟩ (3.13)
( ) ( ) = 0 ; no correlation
( ) ( ) = ; perfect correlation
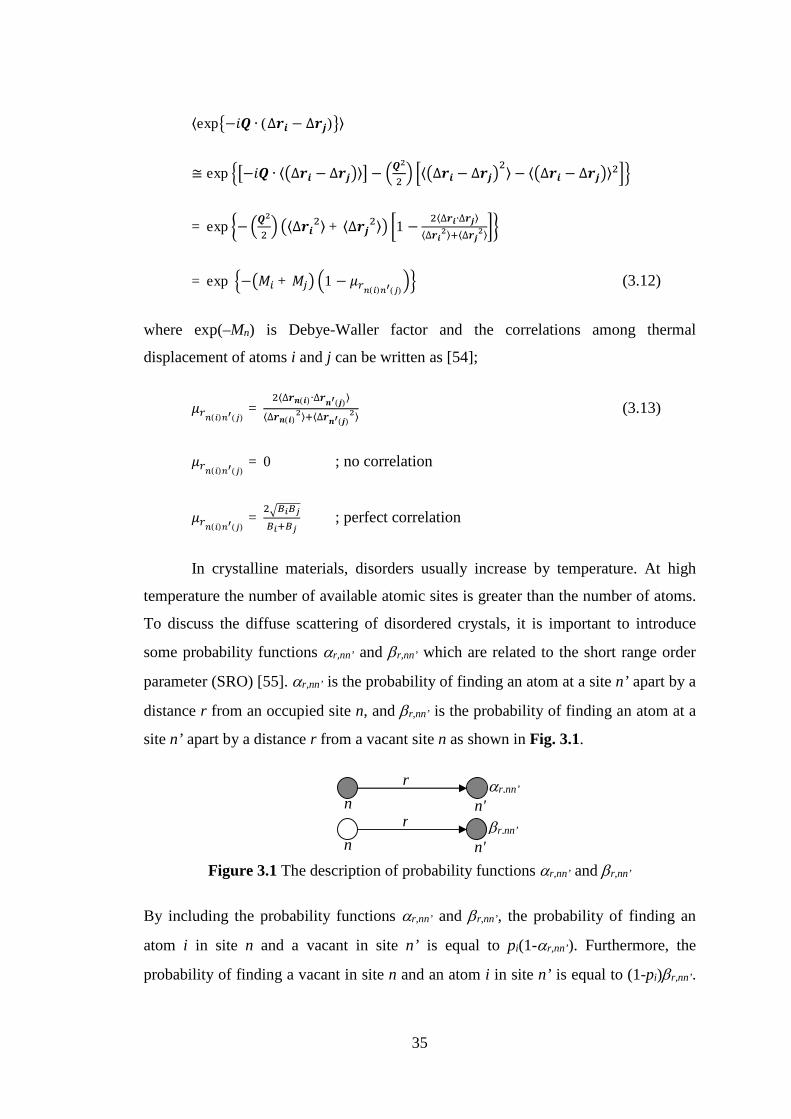
In crystalline materials, disorders usually increase by temperature. At high
temperature the number of available atomic sites is greater than the number of atoms.
To discuss the diffuse scattering of disordered crystals, it is important to introduce
some probability functions ar,nn’ and br,nn’ which are related to the short range order
parameter (SRO) [55]. ar,nn’ is the probability of finding an atom at a site n’ apart by a
distance r from an occupied site n, and br,nn’ is the probability of finding an atom at a
site n’ apart by a distance r from a vacant site n as shown in Fig. 3.1.
Figure 3.1 The description of probability functions ar,nn’ and br,nn’
By including the probability functions ar,nn’ and br,nn’, the probability of finding an
atom i in site n and a vacant in site n’ is equal to pi(1-ar,nn’). Furthermore, the
probability of finding a vacant in site n and an atom i in site n’ is equal to (1-pi)br,nn’.
ar,nn’r
n'nbr,nn’
rn'n
36
Since these two express the same condition, the relation between ar,nn’ and br,nn’ can
be written as;
1 − , = (1 − ) , (3.14)
Thus
, − , = , or , − , = , (3.15)
The factor , − , is analogous function to the distribution function of the
short range order in alloys [53]. All configuration possibility of structure factor
deviation on filled and vacant site of n and n’ are shown in Table 3.1.
Table 3.1 All configuration possibility of structure factor deviation on filled and
vacant site of n and n’
site n site n’ Probability DFn(i) DFn’(j)
atom i atom j piar,nn’( )exp ∙ ∆ ( )− exp (− ) ( )exp ∙ ∆ ( )− exp (− )
atom i vacant pi(1-ar,nn’) ( )exp ∙ ∆ ( )− exp (− ) − exp (− )vacant atom j (1-pi)br,nn’ − exp (− ) ( )exp ∙ ∆ ( )− exp (− )vacant vacant (1-pi)(1-br,nn’) − exp (− ) − exp (− )
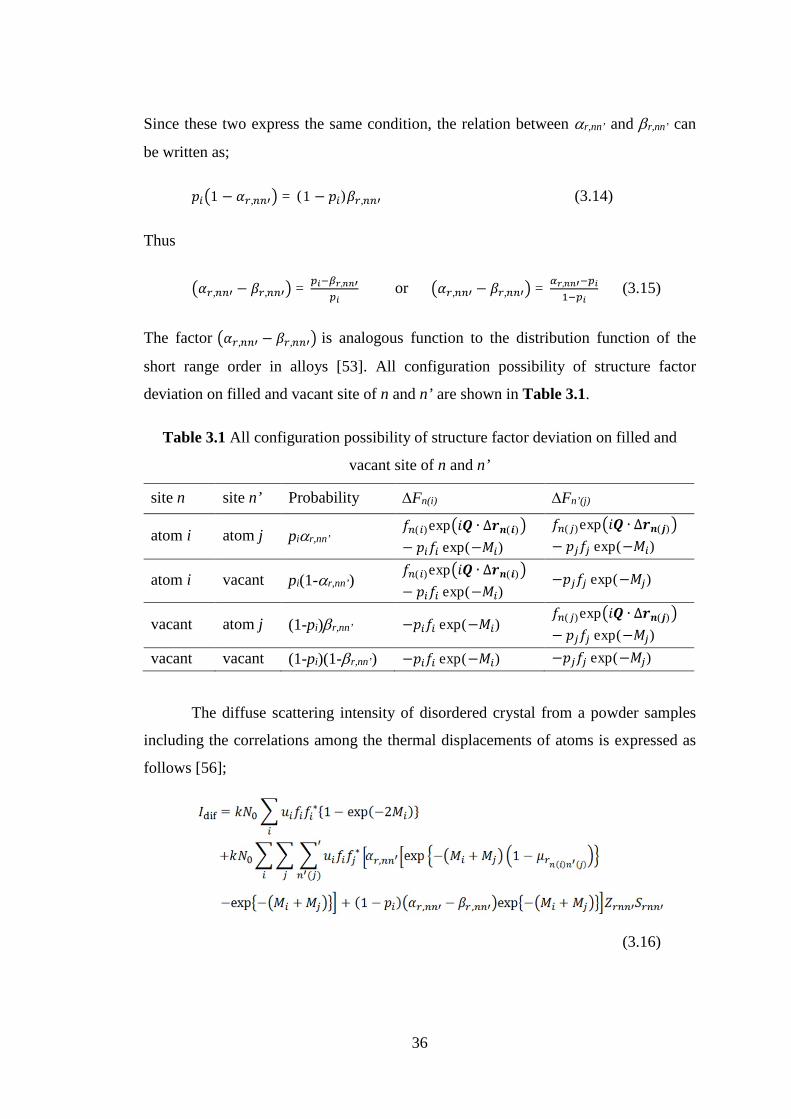
The diffuse scattering intensity of disordered crystal from a powder samples
including the correlations among the thermal displacements of atoms is expressed as
follows [56];
(3.16)
37
k is a constant, N0 the number of unit cells in a unit volume, ui corresponds to the
number of i atoms per unit cell, fi the neutron scattering length or X-ray scattering
amplitude, ( ) ( ) the number of sites belonging to the n’ th j neighbor around a nth
i type site, and Sr equal to sin(Qr)/Qr. The prime added to the summation symbol
means to omit the term of ( ) ( ) = 0.
3.3 Diffuse Scattering from Order Crystal
A crystal typically is ordered at low temperature. In ordered crystal, all
positions in regular structure of atoms are occupied by an atom. Most of the
oscillatory diffuse scattering intensity from X-ray and neutron diffraction on ordered
crystal corresponds to thermal scattering. Correlation effects among thermal
displacements of neighboring atoms are found to be large. From this result, one can
expect oscillatory diffuse scattering to occur even from ordered crystals due to
correlation effects. There would be a similar contribution to the scattering intensity
for non-crystalline materials.
The Rietveld refinement method is applicable for refining structure parameters
and lattice parameters directly from whole powder diffraction pattern. It is regarded as
a fundamental technique for characterizing polycrystalline materials. The Rietveld
method modifies the profile shape function of Bragg intensities to obtain better fitted
shape between observed and calculated patterns. Compare to the refinement method
for Bragg intensities, studies of background diffuse scattering intensities are not
nearly as sophisticated. A function of background diffuse scattering intensities is
approximated by finite sums of Legendre polynomials holds to relatively good
approximation. New background functions in Rietveld refinements, including
correlation between the thermal displacements of atoms, have been introduced
explaining the oscillation of diffuse scattering.
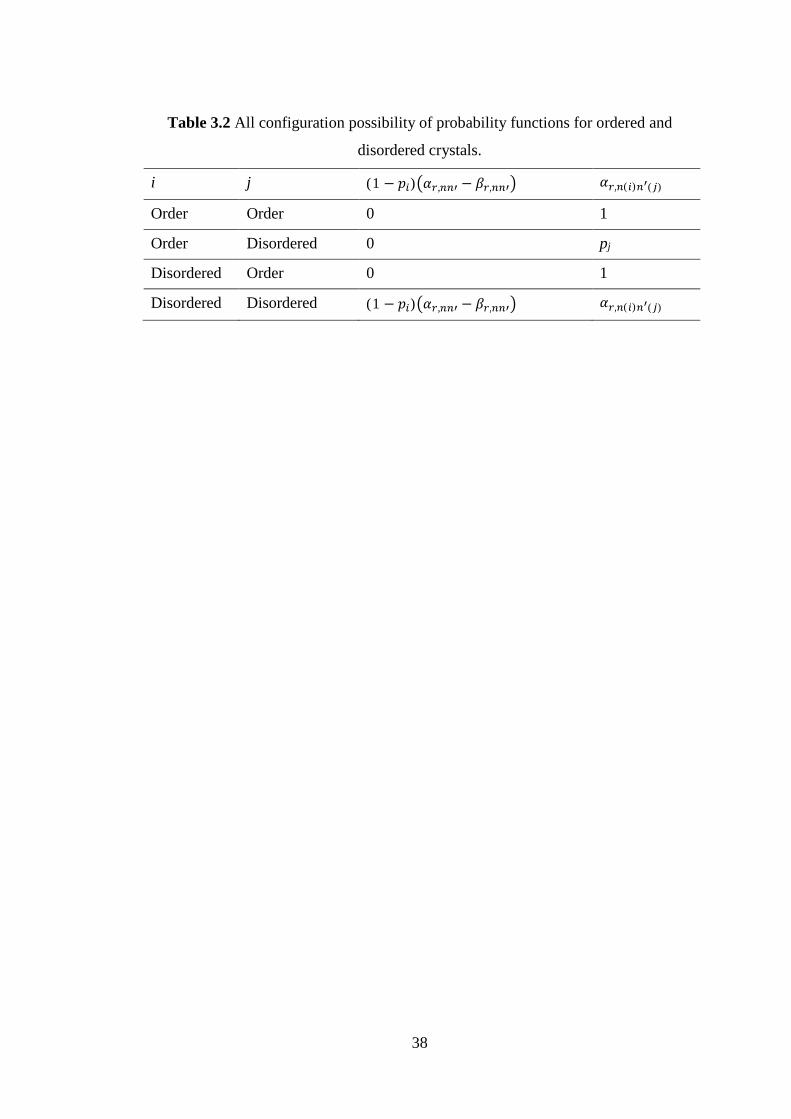
The equation 3.16 states the profile shape function of a background in
Rietveld analysis. This expression can be applied for ordered and disordered
arrangements of atoms. All configuration possibility of probability functions for
ordered and disordered crystals are shown in Table 3.2 [56].
38
Table 3.2 All configuration possibility of probability functions for ordered and
disordered crystals.
i j (1 − ) , − , , ( ) ( )Order Order 0 1
Order Disordered 0 pj
Disordered Order 0 1
Disordered Disordered (1 − ) , − , , ( ) ( )

Chapter IV
Experimental Method
40
This chapter explains the detail of the experiments method. The experiments
separate into two different partial methods. The first includes neutron diffraction
measurement and Rietveld as well as diffuse scattering analysis, while the other
includes synthesis of solid superionic conductors, crystal structure, temperature
properties and conductivity measurements.
4.1 Neutron Diffraction Measurements
Measurements of neutron diffractions have been carried out for Cu2O and
Ag2O. The experiment was done by using HRPD (High Resolution Powder
Diffractometer) installed at JRR-3 in Japan Atomic Energy Agency for sample of
Cu2O and neutron spectrometer Taipan installed at OPAL research reactor in
Australian Nuclear Science and Technology Organization for samples of Ag2O and
Cu2O
In JRR-3, neutron diffraction measurements were performed at 10 and 295 K
from powder sample of Cu2O (99%, Kojundo Chemical). The powder sample in a
vanadium container with 10 mm in diameter was measured at the incident neutron
wavelength of 1.823 Å. Neutron diffraction data were collected for 1 day at 0.05°
intervals over the 2θ range of 20 to 150°. Whereas in Australian Nuclear Science and
Technology Organization, neutron diffraction and elastic scattering measurements of
powder samples of Ag2O and Cu2O (99 %, Kojundo Chemical) were performed with
neutron spectrometer Taipan. The data from samples loaded in cylindrical vanadium
containers were collected using a PG (002) monochromator at incident wavelength λ
= 2.334 Å. A liquid helium cryostat was used for the measurements at 16 and 300 K.
Diffraction patterns were collected at 0.25° intervals over the 2θ range from 30 to
120° in conventional double-axis diffractometer setup and in triple-axis mode with
analyzer crystal adjusted to the incident wavelength. The energy resolution of the
spectrometer was about 1 meV. The high order reflections from monochromator were
suppressed by HOPG (highly ordered pyrolytic graphite) filter installed upstream of
the sample. The diffraction pattern were corrected for the background and normalized
to the incident neutron flux.
41
4.2 Synthesis of Samples
The activities of the research have been carried out in both of Japan and
Indonesia. In Japan the activities were done at the laboratory of Institute of Applied
Beam Science, Ibaraki University. In Indonesia those were done at Center for
Technology of Nuclear Industrial Materials of National Nuclear Energy Agency. The
activities include the synthesizing of glass materials of AgPO3 and LiPO3 as well as
the superionic conductors of (AgI)0.44(LiI)0.22(AgPO3)0.34 and (AgI)0.33(LiI)0.33
(LiPO3)0.34. The reason that the synthesizing is done only for the materials mentioned
above, because in the former activities, we have studied the mixture of AgI, LiI and
AgPO3 in system of (AgI)x(LiI)y(AgPO3)1-x-y and the mixture of AgI, LiI and LiPO3 in
system of (AgI)x(LiI)y(LiPO3)1-x-y. From those we found that the two of the materials
mentioned above have better conductivities.
4.2.1 Synthesis of Glass Materials
The glasses of AgPO3 and LiPO3 were synthesized from powders of AgNO3
and Li2CO3 respectively that, separately, were mixed with powder of NH4H2PO4 by
melt quenching methods. Each mixture was heated gradually until the temperature
slightly above the melting point of AgNO3 or Li2CO3. The molten then was quenched
rapidly into liquid nitrogen. The highest of the heating temperatures is 600oC for
AgPO3 and 850oC for LiPO3. Detail of preparation has been described by elsewhere
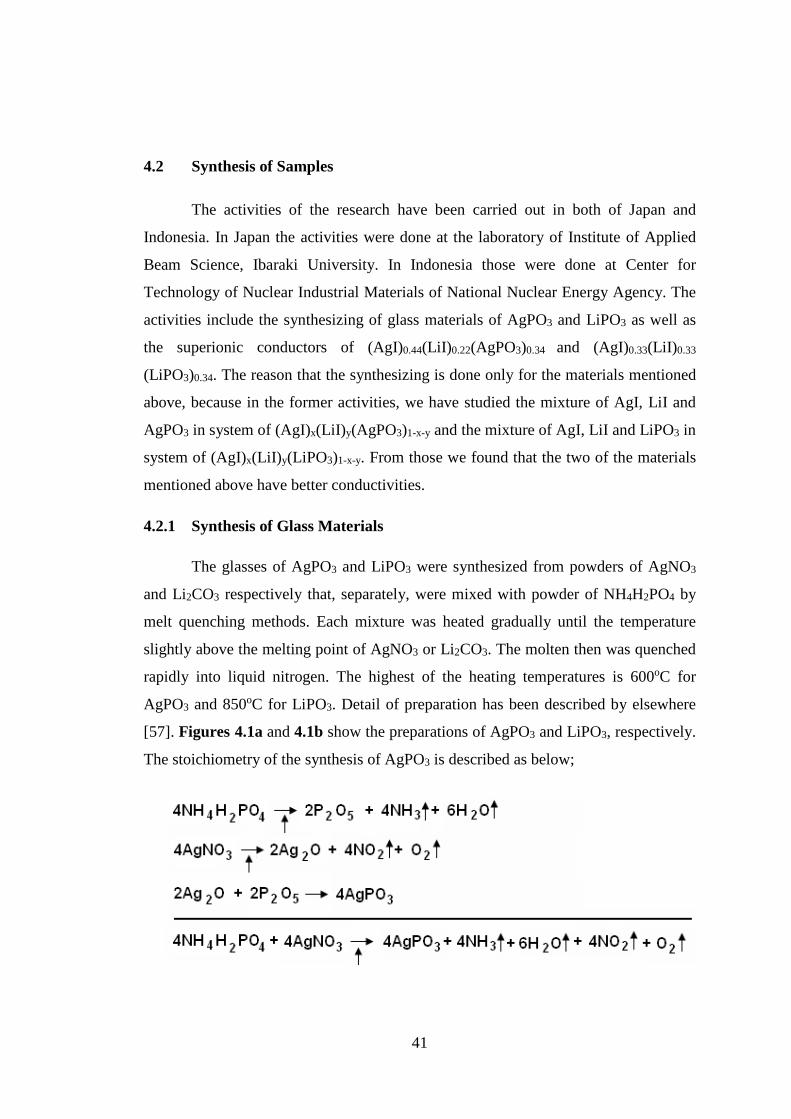
[57]. Figures 4.1a and 4.1b show the preparations of AgPO3 and LiPO3, respectively.
The stoichiometry of the synthesis of AgPO3 is described as below;
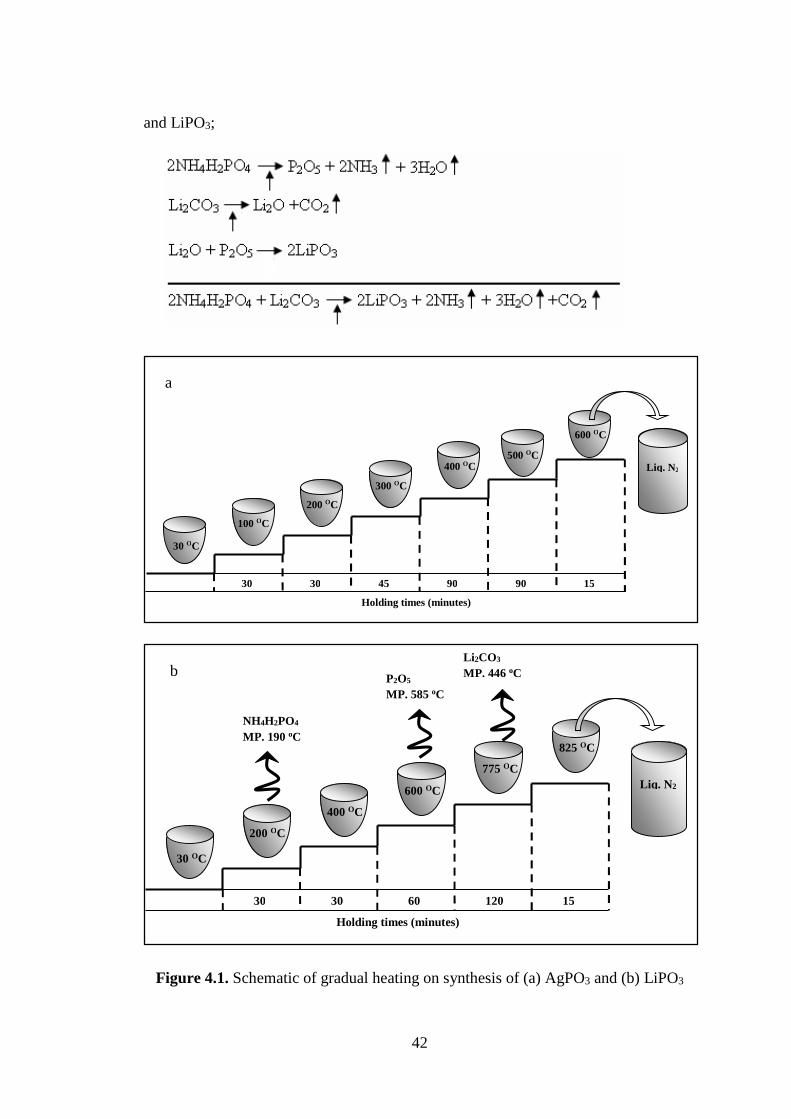
42
and LiPO3;
Figure 4.1. Schematic of gradual heating on synthesis of (a) AgPO3 and (b) LiPO3
30 OC
200 OC
400 OC
600 OC
775 OC
825 OC
Liq. N2
30 30 60 120 15
NH4H2PO4
MP. 190 oC
P2O5
MP. 585 oC
Li2CO3
MP. 446 oC
Holding times (minutes)
b
Holding times (minutes)
30 OC
100 OC
200 OC
300 OC
400 OC
600 OC
Liq. N2
30 30 45 90 90
500 OC
15
a
43
4.2.2 Synthesis of Superionic Conductor Materials
(AgI)0.44(LiI)0.22(AgPO3)0.34 and (AgI)0.33(LiI)0.33(LiPO3)0.34 were synthesized
by melt quenching method with an appropriate amounts of AgPO3 and LiPO3
respectively that, separately, were mixed with an appropriate amounts of AgI (99%
SOEKAWA) and LiI (99,9 % ALDRICH). Each mixture then was treated as the two
former samples explained above. The highest of the heating temperatures is 900oC for
both. In the case of (AgI)0.44(LiI)0.22(AgPO3)0.34, the obtained sample was milled by
high speed milling machine for 20 hours in speed of 270 rpm.
The weight calculations of the materials for synthesis 10 g of
(AgI)0.44(LiI)0.22(AgPO3)0.34 and (AgI)0.33(LiI)0.33(LiPO3)0.34 are described below;
(44%)(AgI) + (22%)(LiI) + (34%)( AgPO3) (AgI)0.44(LiI)0.22(AgPO3)0.34
Molecules weight;
AgI = 234.7725 g/mol
LiI = 133.8455 g/mol
AgPO3 = 186.8403 g/mol
LiPO3 = 85.9133 g/mol
(AgI)0.44(LiI)0.22(AgPO3)0.34 = 196.2716 g/mol
(AgI)0.33(LiI)0.33(LiPO3)0.34 = 150.8544 g/mol
10 g (AgI)0.44(LiI)0.22(AgPO3)0.34 = 10/MW = 0.0510 mol
AgPO3 34% x 0.0510 = 0.0173 mol = 0.0173 x 186.8404 = 3.2323 g
LiI 22% x 0.0510 = 0.0112 mol = 0.0112 x 133.8455 = 1.4991 g
AgI 44% x 0.0510 = 0.0224 mol = 0.0224 x 234.7725 = 5.2589 g
and
(33%)(AgI) + (33%)(LiI) + (34%)( LiPO3) (AgI)0.33(LiI)0.33(LiPO3)0.34
10 g (AgI)0.33 (LiI)0.33 (LiPO3)0.34 = 10/MW = 0.0663 mol
LiPO3 34% x 0.0663 = 0.0225 mol = 0.0225 x 85.9133 = 1.9930 g
LiI 33% x 0.0663 = 0.0219 mol = 0.0219 x 133.8455 = 2.9312 g
AgI 33% x 0.0663 = 0.0219 mol = 0.0219 x 234.7725 = 5.1415 g
44
4.3 Measurements
The measurements are used to characterize the properties of the superionic
conductor materials. The characteristics of the samples which were studied include;
X-ray diffraction (XRD), differential scanning calorimetry (DSC) and conductivity
measurements. XRD and DSC measurements are methods to analyze the crystal
structure and thermal properties of the materials respectively.
4.3.1 XRD Measurements
X-ray diffraction is one of the most powerful experimental techniques for the
structure analysis in materials. In this research, we used X-ray diffractometer type
RINT2000 of RIGAKU Corporation installed at Institute of Applied Beam Science,
Ibaraki University, Japan. The XRD measurements were performed at ambient
temperature for samples of AgI, LiI, AgPO3, LiPO3 as well as (AgI)0.44(LiI)0.22
(AgPO3)0.34 and (AgI)0.33(LiI)0.33(LiPO3)0.34. The powder samples were prepared in a
copper sample holder with 1 mm thickness and measured using an incident X-ray
wavelength of 1.54 Å which was generated from Cu-Ka. X-ray diffraction data were
collected for 10 hours at 0.02o intervals over the 2θ range of 10 to 90°.
4.3.2 DSC Measurements
Thermal properties of the samples can be studied by the thermodynamic
process occurred in the materials. The exothermic and endothermic may occur when
the materials experience a phase transition, crystal structure changing, melting or
other chemistry reactions. DSC instrument measures the calorie changing by the
increasing temperature. A sample and a standard are heated gradually with a certain
temperature flow-rates in separate chamber. In the same time, the present
temperatures are measured and compared each other. The exothermic process can be
identified when the sample temperature is higher than its standard and the opposite
accident is for endothermic process.
The DSC measurements were performed at temperatures range between
ambient to 250oC on temperature flow-rates of 10oC/minute for samples of AgI, LiI,
AgPO3, LiPO3 as well as (AgI)0.44(LiI)0.22(AgPO3)0.34 and (AgI)0.33(LiI)0.33(LiPO3)0.34
45
using DSC instrument type DSC-60 of SHIMADZU. A 100 mg powder sample in
alumina container was measured by comparing to a 100 mg powder standard of
alumina. The data of calorie versus gradually temperature changing were recorded
and plotted on x-y graph in a PC.
4.3.3 Conductivity Measurements
The sample was prepared from powder material with pressing between
conductive silver electrodes at 70 MPa for about 30 minutes into cylindrical pellets of
1.3 cm in diameter. The conductivity measurements were performed by impedance
spectroscopy type HIOKI 3532-80 using two electrodes configuration
Ag½sample½Ag. The entire cell was clamped with non-conductive plate and inserted
into a special vacuum vessel. The temperature control of the cell was carried out by
Ohkura EC5000 thermo-controller using a non-conductive wounded heater wire and a
T-type thermocouple attached close to the cell. The conductivity data then were
collected for frequency range of 20 to 500 kHz over temperature range of ambient to
250oC.
Chapter V
Neutron Diffraction Study of Static and Dynamic Disorder
47
5.1 Crystalline of Ag2O and Cu2O
The Ag2O and Cu2O have same crystal structure known as a cuprite type,
where each metallic atom has two oxygen neighbors and oxygen atom surrounded by
four metallic atoms. At ambient temperature the lattice constant of Cu2O and Ag2O
are 4.2705 Å and 4.7183 Å, respectively, in same crystal structure with space group of 3 . In the diffuse scattering calculation, the differences in lattice constant may
shift the peaks position. In the neutron diffraction experiments at low temperature, a
noticeable oscillatory diffuse scattering has been observed for Ag2O in contrast to
Cu2O and many other crystals. This indicates that correlation effects and thermal
parameters of Ag2O are larger than those in other ionic crystal, metals and
semiconductors which do not show diffuse scattering intensity at low temperature.
There might be two contributions to diffuse scattering at low temperature. One is from
the thermal vibrations of atoms and the other contribution comes from the static
displacements of atoms from the regular atomic positions. These two contributions
could be separated by scattering measurements using triple-axis spectrometer in
diffractometer two-crystal configuration and in three–axis elastic scattering mode
with analyzer crystal [58]. In that experiment the inelastic scattering related to thermal
vibrations are filtered out.
Silver oxide starts to decompose at 473 K while Cu2O melts at 1509 K [59]
indicating the difference in interatomic bonding. Both compounds show a negative
thermal expansion (NTE) in a wide range of temperatures. The origin of NTE is
thought to be related to a strong anisotropy in thermal vibrations coming from low-
frequency transverse acoustic modes [60-61]. On the other hand the influence of
geometric distortions and static and dynamic displacive disorder can play a noticeable
role in NTE [61-62]. Both static and dynamic disorders give rise to diffuse scattering
which could manifest itself by broad features around the Bragg reflections or
oscillating diffuse background [58].
Ag2O is one of the components in AgI-Ag2O-V2O5 super-ionic glass [63] and
Cu2O may be one of the components in AgI-Cu2O-V2O5 super-ionic glass, although it
has not been synthesized yet.
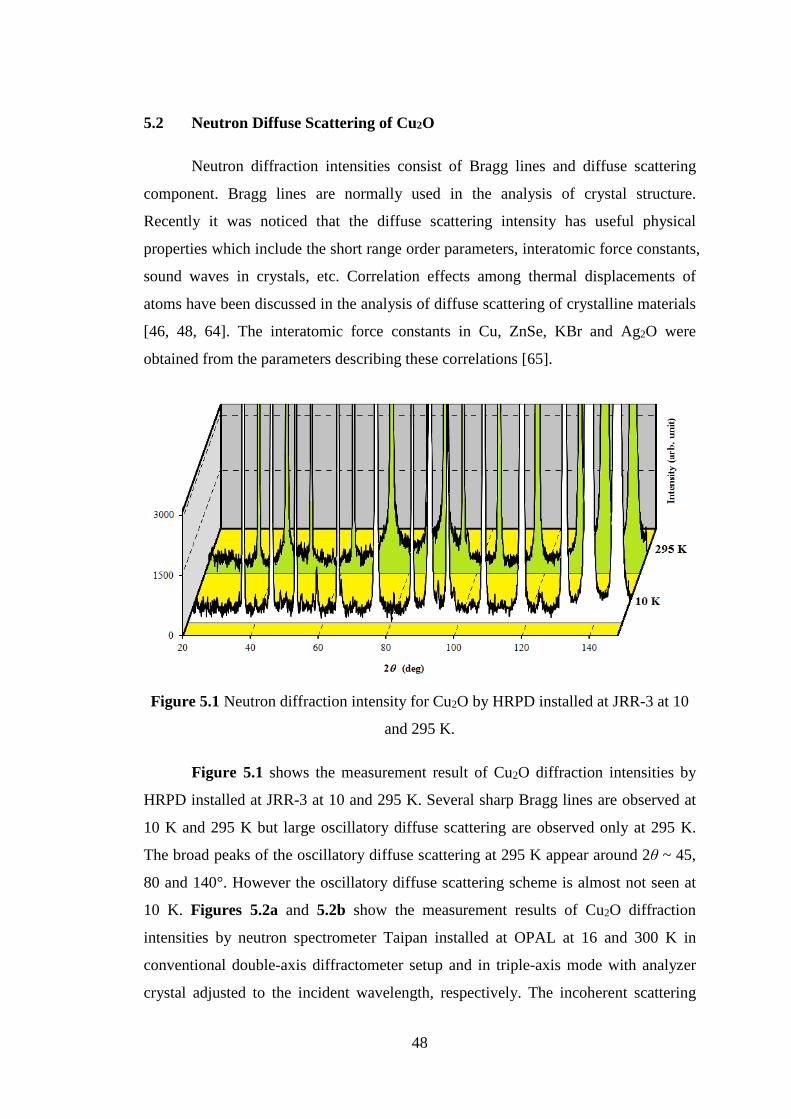
48
5.2 Neutron Diffuse Scattering of Cu2O
Neutron diffraction intensities consist of Bragg lines and diffuse scattering
component. Bragg lines are normally used in the analysis of crystal structure.
Recently it was noticed that the diffuse scattering intensity has useful physical
properties which include the short range order parameters, interatomic force constants,
sound waves in crystals, etc. Correlation effects among thermal displacements of
atoms have been discussed in the analysis of diffuse scattering of crystalline materials
[46, 48, 64]. The interatomic force constants in Cu, ZnSe, KBr and Ag2O were
obtained from the parameters describing these correlations [65].
Figure 5.1 Neutron diffraction intensity for Cu2O by HRPD installed at JRR-3 at 10
and 295 K.
Figure 5.1 shows the measurement result of Cu2O diffraction intensities by
HRPD installed at JRR-3 at 10 and 295 K. Several sharp Bragg lines are observed at
10 K and 295 K but large oscillatory diffuse scattering are observed only at 295 K.
The broad peaks of the oscillatory diffuse scattering at 295 K appear around 2θ ~ 45,
80 and 140°. However the oscillatory diffuse scattering scheme is almost not seen at
10 K. Figures 5.2a and 5.2b show the measurement results of Cu2O diffraction
intensities by neutron spectrometer Taipan installed at OPAL at 16 and 300 K in
conventional double-axis diffractometer setup and in triple-axis mode with analyzer
crystal adjusted to the incident wavelength, respectively. The incoherent scattering
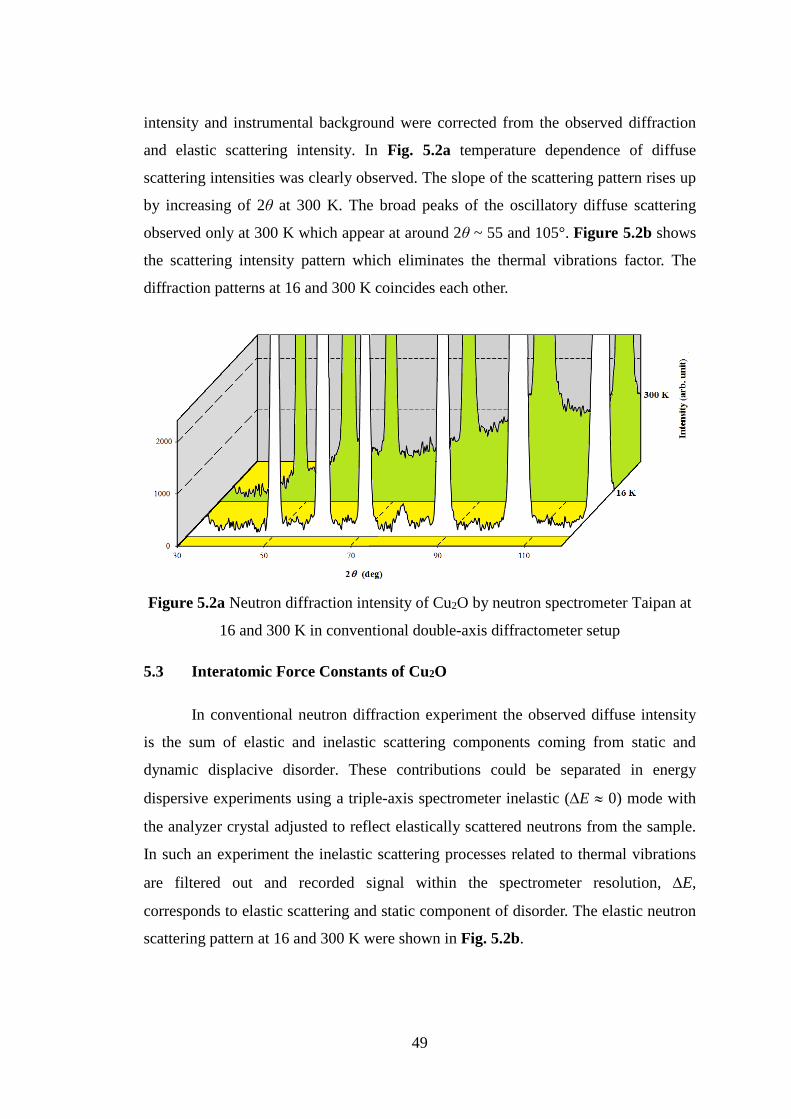
49
intensity and instrumental background were corrected from the observed diffraction
and elastic scattering intensity. In Fig. 5.2a temperature dependence of diffuse
scattering intensities was clearly observed. The slope of the scattering pattern rises up
by increasing of 2θ at 300 K. The broad peaks of the oscillatory diffuse scattering
observed only at 300 K which appear at around 2θ ~ 55 and 105°. Figure 5.2b shows
the scattering intensity pattern which eliminates the thermal vibrations factor. The
diffraction patterns at 16 and 300 K coincides each other.
Figure 5.2a Neutron diffraction intensity of Cu2O by neutron spectrometer Taipan at
16 and 300 K in conventional double-axis diffractometer setup
5.3 Interatomic Force Constants of Cu2O
In conventional neutron diffraction experiment the observed diffuse intensity
is the sum of elastic and inelastic scattering components coming from static and
dynamic displacive disorder. These contributions could be separated in energy
dispersive experiments using a triple-axis spectrometer inelastic (DE » 0) mode with
the analyzer crystal adjusted to reflect elastically scattered neutrons from the sample.
In such an experiment the inelastic scattering processes related to thermal vibrations
are filtered out and recorded signal within the spectrometer resolution, DE,
corresponds to elastic scattering and static component of disorder. The elastic neutron
scattering pattern at 16 and 300 K were shown in Fig. 5.2b.
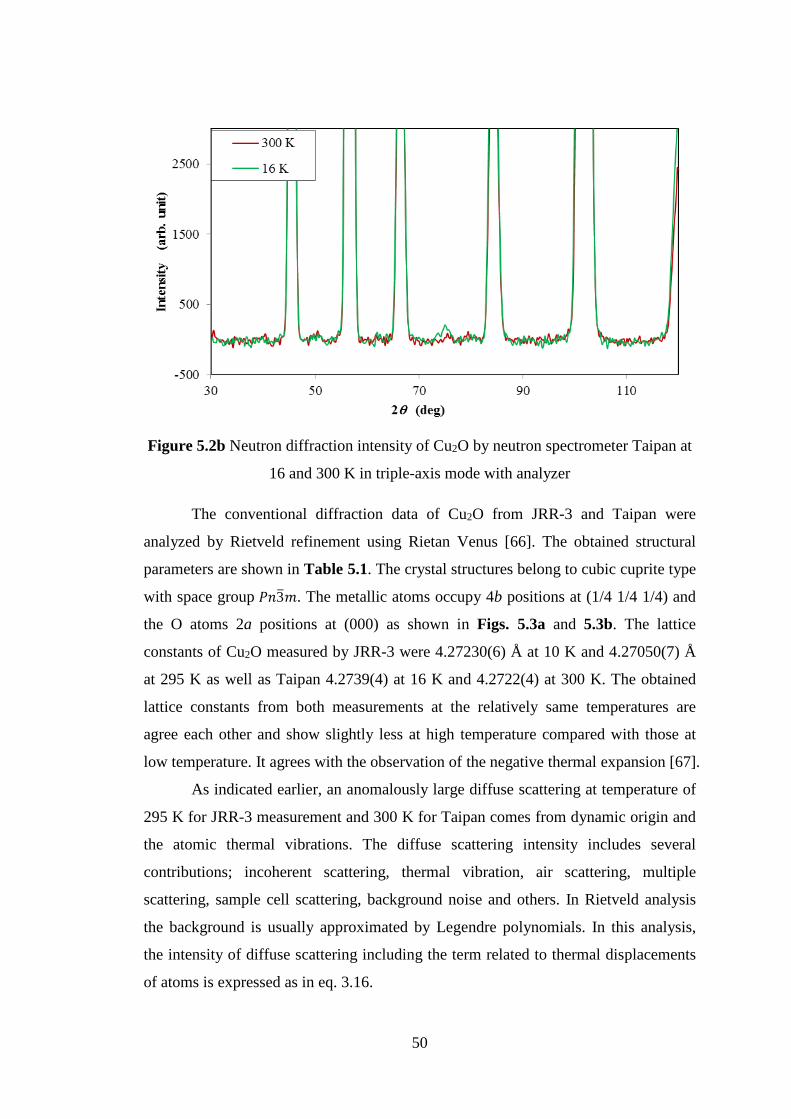
50
Figure 5.2b Neutron diffraction intensity of Cu2O by neutron spectrometer Taipan at
16 and 300 K in triple-axis mode with analyzer
The conventional diffraction data of Cu2O from JRR-3 and Taipan were
analyzed by Rietveld refinement using Rietan Venus [66]. The obtained structural
parameters are shown in Table 5.1. The crystal structures belong to cubic cuprite type
with space group 3 . The metallic atoms occupy 4b positions at (1/4 1/4 1/4) and
the O atoms 2a positions at (000) as shown in Figs. 5.3a and 5.3b. The lattice
constants of Cu2O measured by JRR-3 were 4.27230(6) Å at 10 K and 4.27050(7) Å
at 295 K as well as Taipan 4.2739(4) at 16 K and 4.2722(4) at 300 K. The obtained
lattice constants from both measurements at the relatively same temperatures are
agree each other and show slightly less at high temperature compared with those at
low temperature. It agrees with the observation of the negative thermal expansion [67].
As indicated earlier, an anomalously large diffuse scattering at temperature of
295 K for JRR-3 measurement and 300 K for Taipan comes from dynamic origin and
the atomic thermal vibrations. The diffuse scattering intensity includes several
contributions; incoherent scattering, thermal vibration, air scattering, multiple
scattering, sample cell scattering, background noise and others. In Rietveld analysis
the background is usually approximated by Legendre polynomials. In this analysis,
the intensity of diffuse scattering including the term related to thermal displacements
of atoms is expressed as in eq. 3.16.
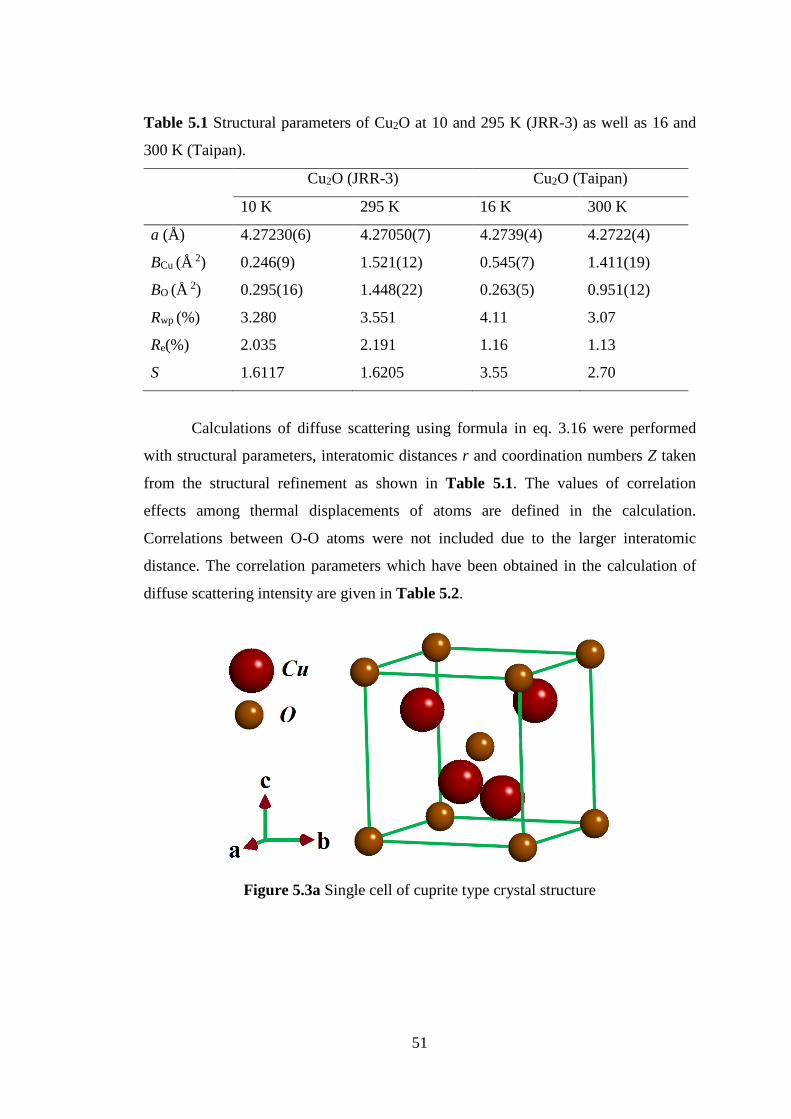
51
Table 5.1 Structural parameters of Cu2O at 10 and 295 K (JRR-3) as well as 16 and
300 K (Taipan).
Cu2O (JRR-3) Cu2O (Taipan)
10 K 295 K 16 K 300 K
a (Å) 4.27230(6) 4.27050(7) 4.2739(4) 4.2722(4)
BCu (Å 2) 0.246(9) 1.521(12) 0.545(7) 1.411(19)
BO (Å 2) 0.295(16) 1.448(22) 0.263(5) 0.951(12)
Rwp (%) 3.280 3.551 4.11 3.07
Re(%) 2.035 2.191 1.16 1.13
S 1.6117 1.6205 3.55 2.70
Calculations of diffuse scattering using formula in eq. 3.16 were performed
with structural parameters, interatomic distances r and coordination numbers Z taken
from the structural refinement as shown in Table 5.1. The values of correlation
effects among thermal displacements of atoms are defined in the calculation.
Correlations between O-O atoms were not included due to the larger interatomic
distance. The correlation parameters which have been obtained in the calculation of
diffuse scattering intensity are given in Table 5.2.
Figure 5.3a Single cell of cuprite type crystal structure
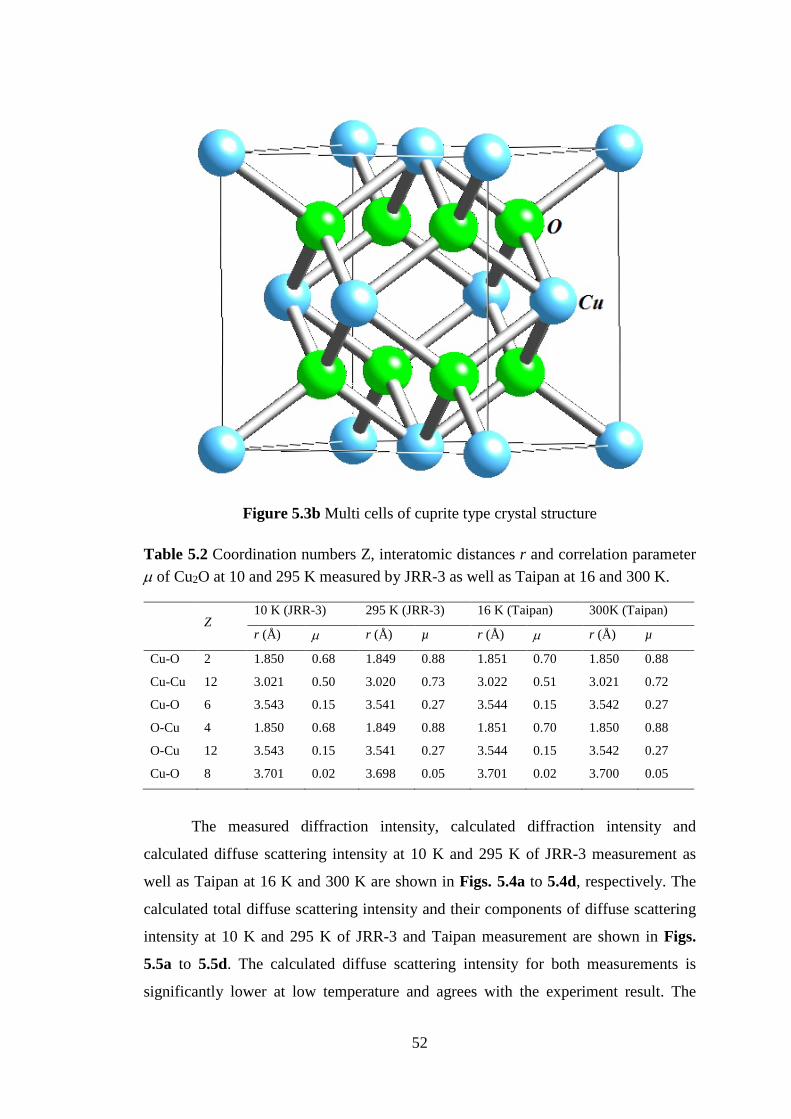
52
Figure 5.3b Multi cells of cuprite type crystal structure
Table 5.2 Coordination numbers Z, interatomic distances r and correlation parameter m of Cu2O at 10 and 295 K measured by JRR-3 as well as Taipan at 16 and 300 K.
Z10 K (JRR-3) 295 K (JRR-3) 16 K (Taipan) 300K (Taipan)
r (Å) m r (Å) µ r (Å) m r (Å) µ
Cu-O 2 1.850 0.68 1.849 0.88 1.851 0.70 1.850 0.88
Cu-Cu 12 3.021 0.50 3.020 0.73 3.022 0.51 3.021 0.72
Cu-O 6 3.543 0.15 3.541 0.27 3.544 0.15 3.542 0.27
O-Cu 4 1.850 0.68 1.849 0.88 1.851 0.70 1.850 0.88
O-Cu 12 3.543 0.15 3.541 0.27 3.544 0.15 3.542 0.27
Cu-O 8 3.701 0.02 3.698 0.05 3.701 0.02 3.700 0.05
The measured diffraction intensity, calculated diffraction intensity and
calculated diffuse scattering intensity at 10 K and 295 K of JRR-3 measurement as
well as Taipan at 16 K and 300 K are shown in Figs. 5.4a to 5.4d, respectively. The
calculated total diffuse scattering intensity and their components of diffuse scattering
intensity at 10 K and 295 K of JRR-3 and Taipan measurement are shown in Figs.
5.5a to 5.5d. The calculated diffuse scattering intensity for both measurements is
significantly lower at low temperature and agrees with the experiment result. The
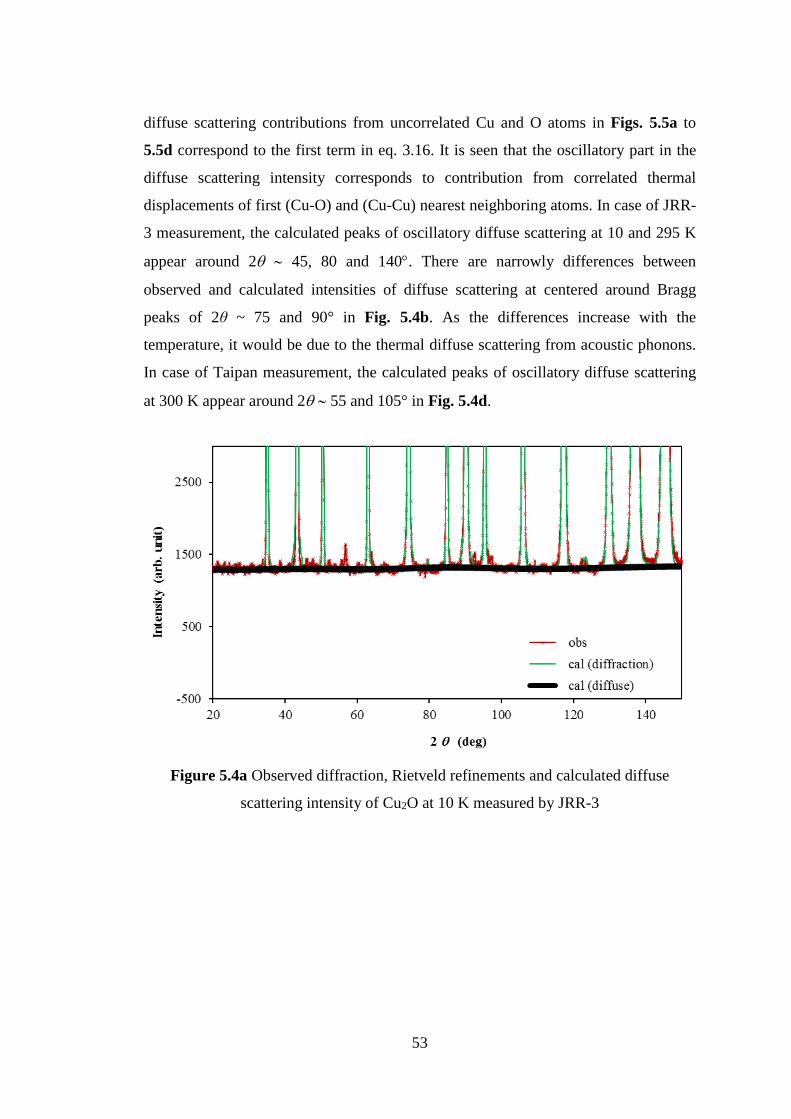
53
diffuse scattering contributions from uncorrelated Cu and O atoms in Figs. 5.5a to
5.5d correspond to the first term in eq. 3.16. It is seen that the oscillatory part in the
diffuse scattering intensity corresponds to contribution from correlated thermal
displacements of first (Cu-O) and (Cu-Cu) nearest neighboring atoms. In case of JRR-
3 measurement, the calculated peaks of oscillatory diffuse scattering at 10 and 295 K
appear around 2q ~ 45, 80 and 140°. There are narrowly differences between
observed and calculated intensities of diffuse scattering at centered around Bragg
peaks of 2θ ~ 75 and 90° in Fig. 5.4b. As the differences increase with the
temperature, it would be due to the thermal diffuse scattering from acoustic phonons.
In case of Taipan measurement, the calculated peaks of oscillatory diffuse scattering
at 300 K appear around 2q ~ 55 and 105° in Fig. 5.4d.
Figure 5.4a Observed diffraction, Rietveld refinements and calculated diffuse
scattering intensity of Cu2O at 10 K measured by JRR-3
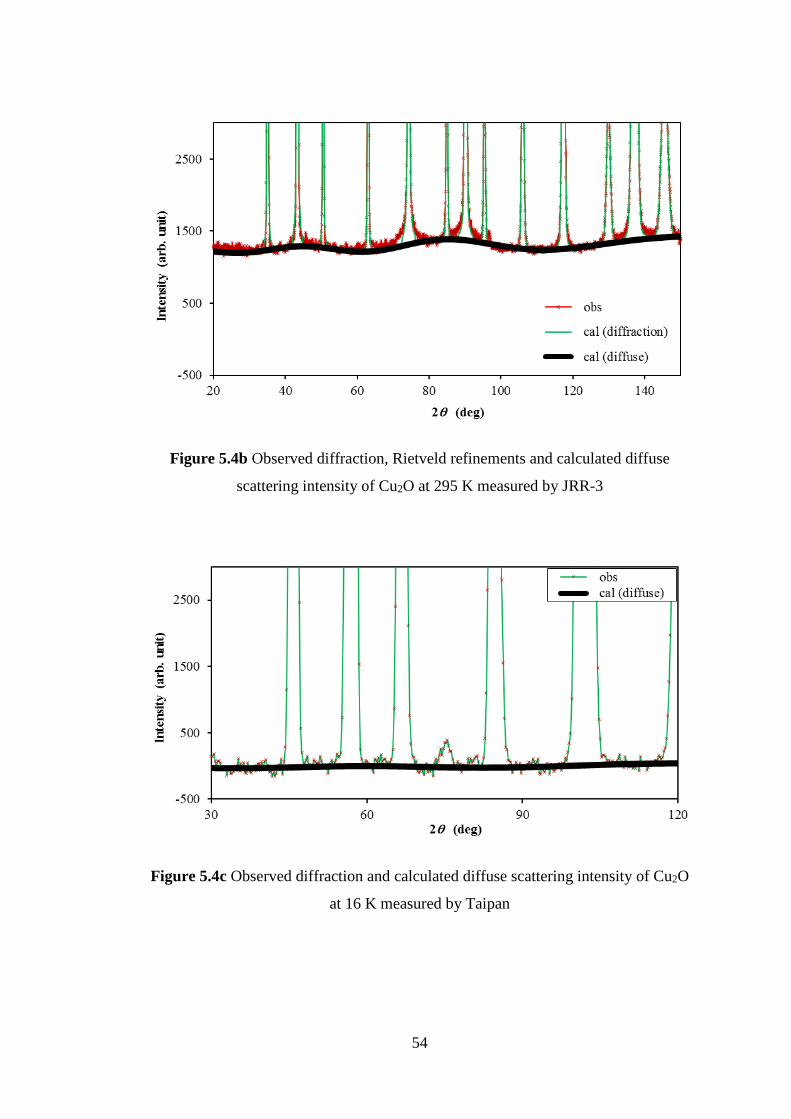
54
Figure 5.4b Observed diffraction, Rietveld refinements and calculated diffuse
scattering intensity of Cu2O at 295 K measured by JRR-3
Figure 5.4c Observed diffraction and calculated diffuse scattering intensity of Cu2O
at 16 K measured by Taipan
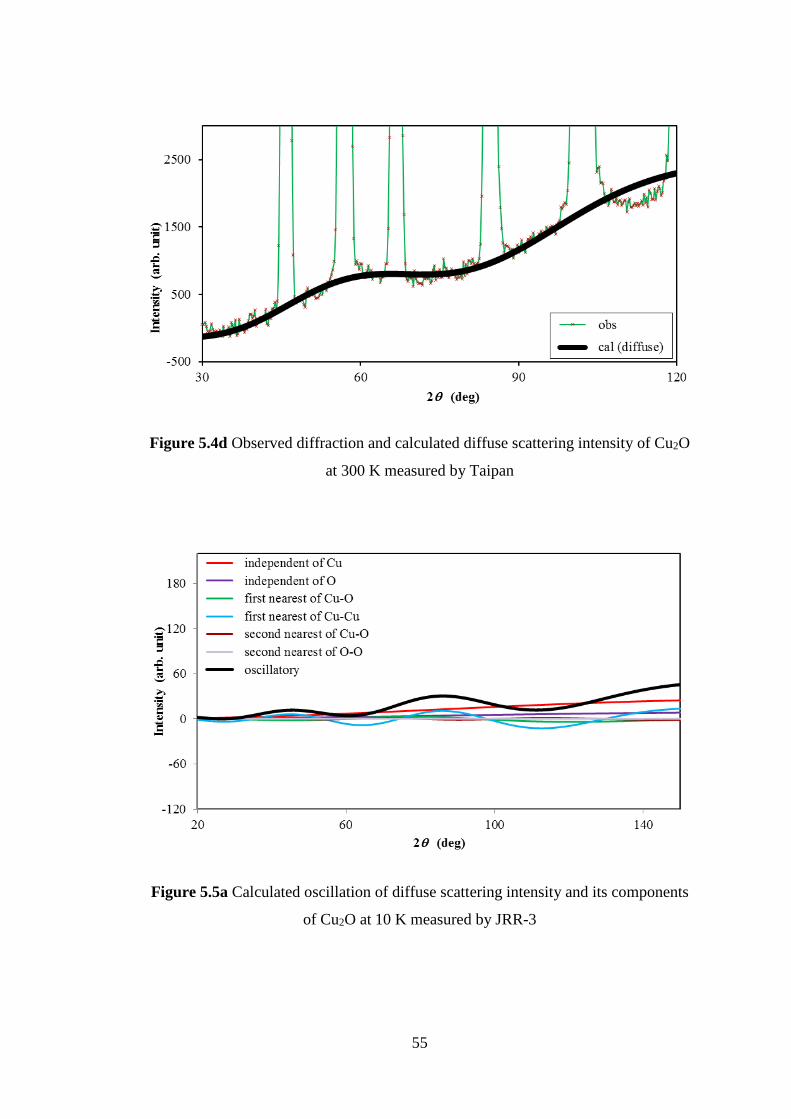
55
Figure 5.4d Observed diffraction and calculated diffuse scattering intensity of Cu2O
at 300 K measured by Taipan
Figure 5.5a Calculated oscillation of diffuse scattering intensity and its components
of Cu2O at 10 K measured by JRR-3
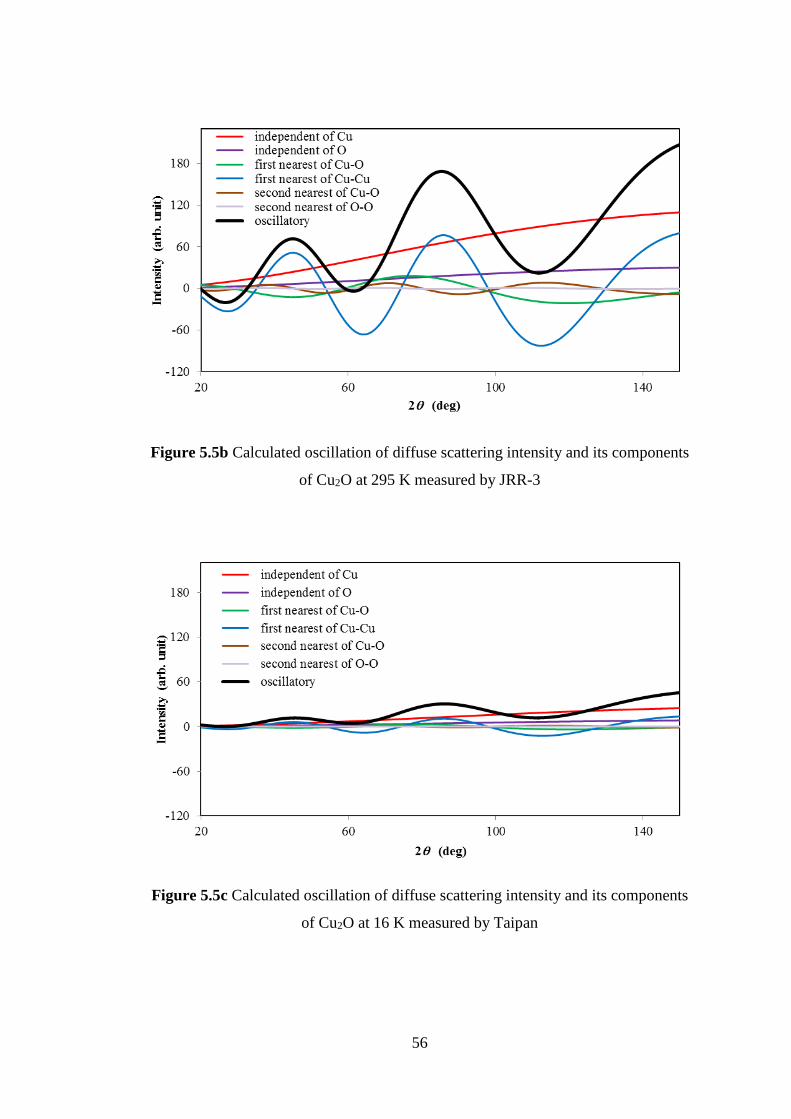
56
Figure 5.5b Calculated oscillation of diffuse scattering intensity and its components
of Cu2O at 295 K measured by JRR-3
Figure 5.5c Calculated oscillation of diffuse scattering intensity and its components
of Cu2O at 16 K measured by Taipan
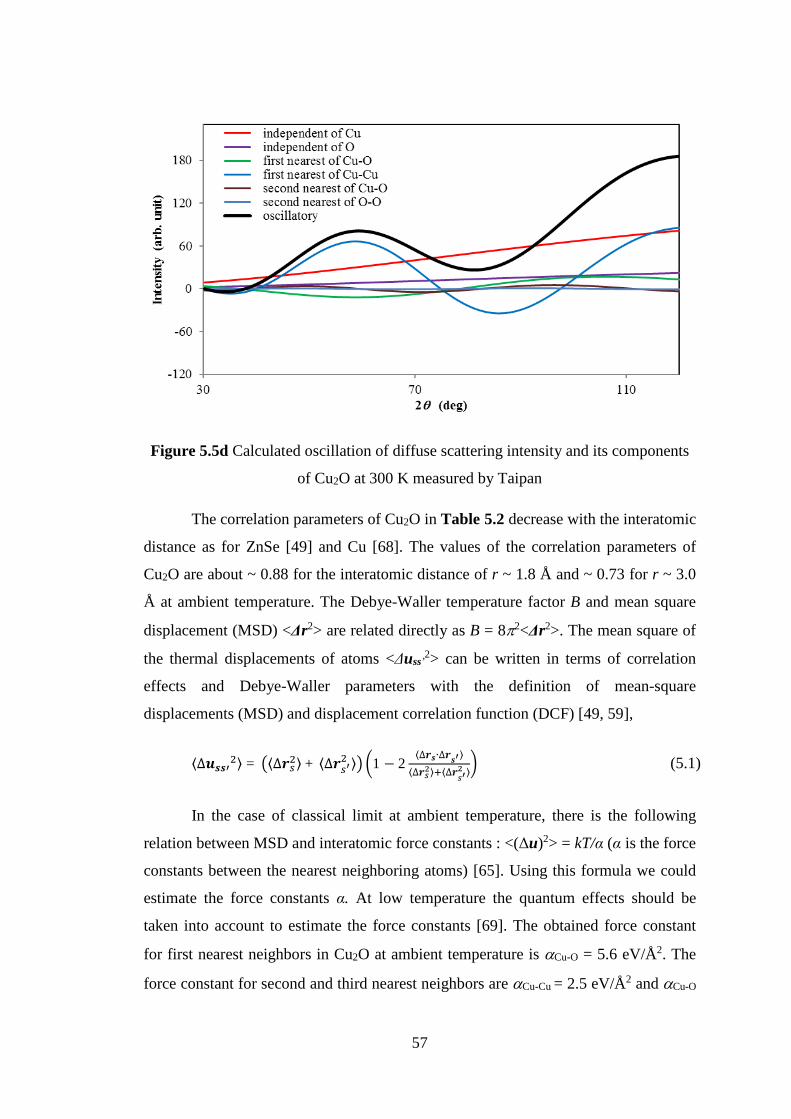
57
Figure 5.5d Calculated oscillation of diffuse scattering intensity and its components
of Cu2O at 300 K measured by Taipan
The correlation parameters of Cu2O in Table 5.2 decrease with the interatomic
distance as for ZnSe [49] and Cu [68]. The values of the correlation parameters of
Cu2O are about ~ 0.88 for the interatomic distance of r ~ 1.8 Å and ~ 0.73 for r ~ 3.0
Å at ambient temperature. The Debye-Waller temperature factor B and mean square
displacement (MSD) <Δr2> are related directly as B = 8p2<Δr2>. The mean square of
the thermal displacements of atoms <Δuss’2> can be written in terms of correlation
effects and Debye-Waller parameters with the definition of mean-square
displacements (MSD) and displacement correlation function (DCF) [49, 59],
⟨∆ ⟩ = ⟨∆ ⟩ + ⟨∆ ⟩ 1 − 2 ⟨∆ ∙∆ ⟩⟨∆ ⟩ ⟨∆ ⟩ (5.1)
In the case of classical limit at ambient temperature, there is the following
relation between MSD and interatomic force constants : <(Δu)2> = kT/α (α is the force
constants between the nearest neighboring atoms) [65]. Using this formula we could
estimate the force constants α. At low temperature the quantum effects should be
taken into account to estimate the force constants [69]. The obtained force constant
for first nearest neighbors in Cu2O at ambient temperature is aCu-O = 5.6 eV/Å2. The
force constant for second and third nearest neighbors are aCu-Cu = 2.5 eV/Å2 and aCu-O
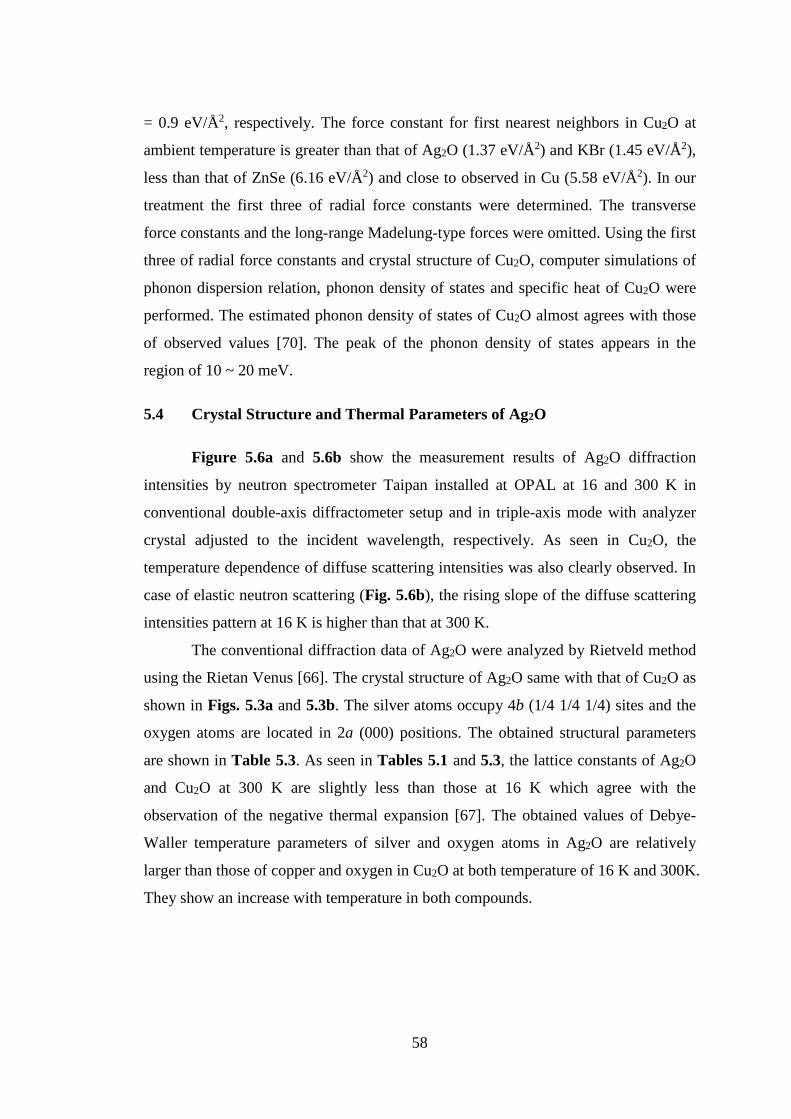
58
= 0.9 eV/Å2, respectively. The force constant for first nearest neighbors in Cu2O at
ambient temperature is greater than that of Ag2O (1.37 eV/Å2) and KBr (1.45 eV/Å2),
less than that of ZnSe (6.16 eV/Å2) and close to observed in Cu (5.58 eV/Å2). In our
treatment the first three of radial force constants were determined. The transverse
force constants and the long-range Madelung-type forces were omitted. Using the first
three of radial force constants and crystal structure of Cu2O, computer simulations of
phonon dispersion relation, phonon density of states and specific heat of Cu2O were
performed. The estimated phonon density of states of Cu2O almost agrees with those
of observed values [70]. The peak of the phonon density of states appears in the
region of 10 ~ 20 meV.
5.4 Crystal Structure and Thermal Parameters of Ag2O
Figure 5.6a and 5.6b show the measurement results of Ag2O diffraction
intensities by neutron spectrometer Taipan installed at OPAL at 16 and 300 K in
conventional double-axis diffractometer setup and in triple-axis mode with analyzer
crystal adjusted to the incident wavelength, respectively. As seen in Cu2O, the
temperature dependence of diffuse scattering intensities was also clearly observed. In
case of elastic neutron scattering (Fig. 5.6b), the rising slope of the diffuse scattering
intensities pattern at 16 K is higher than that at 300 K.
The conventional diffraction data of Ag2O were analyzed by Rietveld method
using the Rietan Venus [66]. The crystal structure of Ag2O same with that of Cu2O as
shown in Figs. 5.3a and 5.3b. The silver atoms occupy 4b (1/4 1/4 1/4) sites and the
oxygen atoms are located in 2a (000) positions. The obtained structural parameters
are shown in Table 5.3. As seen in Tables 5.1 and 5.3, the lattice constants of Ag2O
and Cu2O at 300 K are slightly less than those at 16 K which agree with the
observation of the negative thermal expansion [67]. The obtained values of Debye-
Waller temperature parameters of silver and oxygen atoms in Ag2O are relatively
larger than those of copper and oxygen in Cu2O at both temperature of 16 K and 300K.
They show an increase with temperature in both compounds.
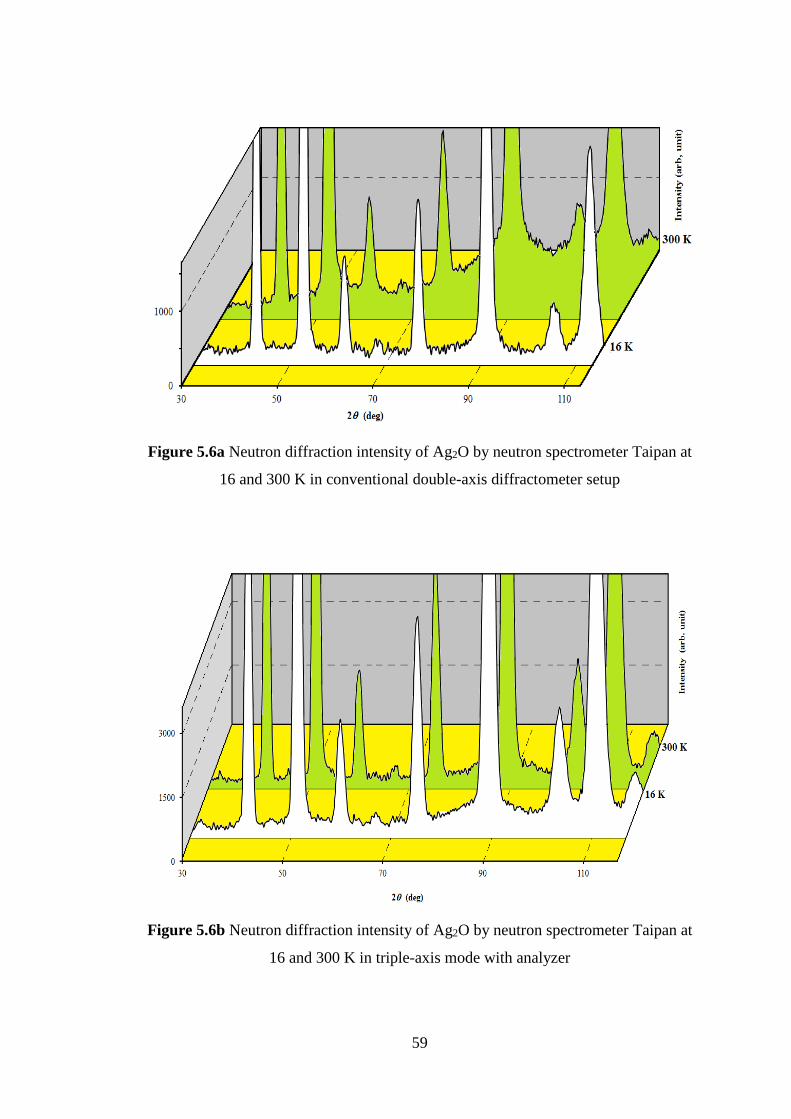
59
Figure 5.6a Neutron diffraction intensity of Ag2O by neutron spectrometer Taipan at
16 and 300 K in conventional double-axis diffractometer setup
Figure 5.6b Neutron diffraction intensity of Ag2O by neutron spectrometer Taipan at
16 and 300 K in triple-axis mode with analyzer
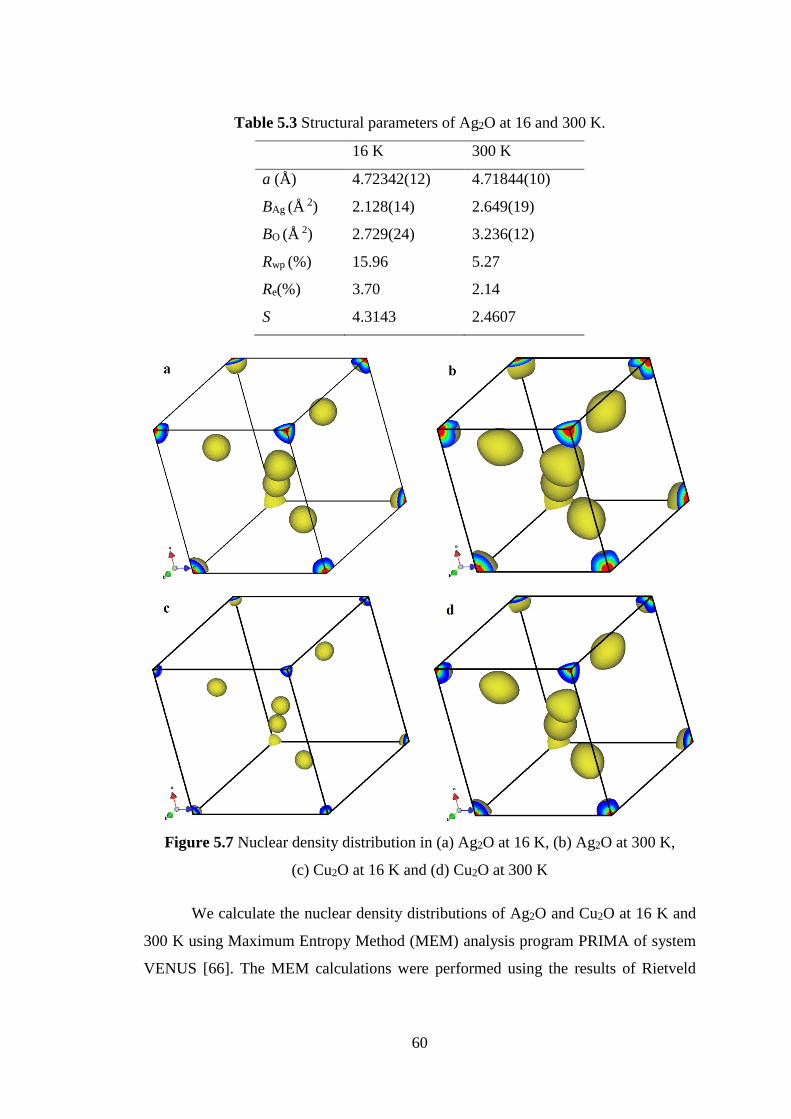
60
Table 5.3 Structural parameters of Ag2O at 16 and 300 K.
16 K 300 K
a (Å) 4.72342(12) 4.71844(10)
BAg (Å 2) 2.128(14) 2.649(19)
BO (Å 2) 2.729(24) 3.236(12)
Rwp (%) 15.96 5.27
Re(%) 3.70 2.14
S 4.3143 2.4607
Figure 5.7 Nuclear density distribution in (a) Ag2O at 16 K, (b) Ag2O at 300 K,
(c) Cu2O at 16 K and (d) Cu2O at 300 K
We calculate the nuclear density distributions of Ag2O and Cu2O at 16 K and
300 K using Maximum Entropy Method (MEM) analysis program PRIMA of system
VENUS [66]. The MEM calculations were performed using the results of Rietveld
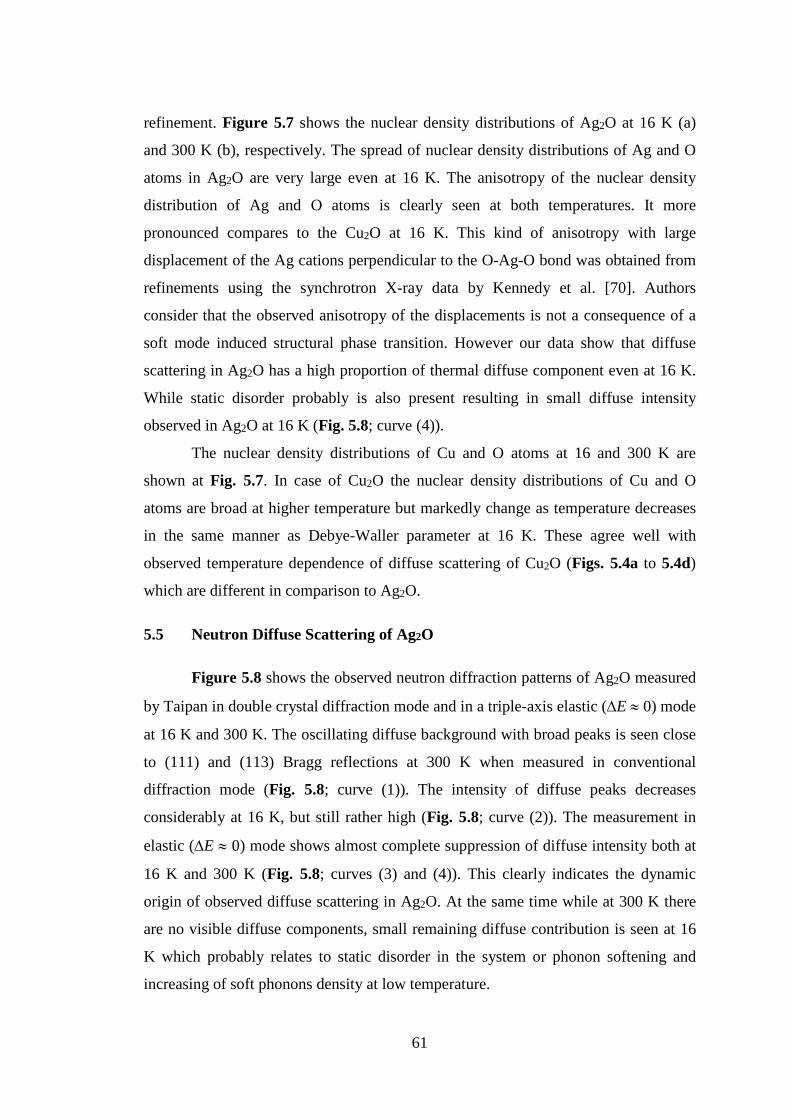
61
refinement. Figure 5.7 shows the nuclear density distributions of Ag2O at 16 K (a)
and 300 K (b), respectively. The spread of nuclear density distributions of Ag and O
atoms in Ag2O are very large even at 16 K. The anisotropy of the nuclear density
distribution of Ag and O atoms is clearly seen at both temperatures. It more
pronounced compares to the Cu2O at 16 K. This kind of anisotropy with large
displacement of the Ag cations perpendicular to the O-Ag-O bond was obtained from
refinements using the synchrotron X-ray data by Kennedy et al. [70]. Authors
consider that the observed anisotropy of the displacements is not a consequence of a
soft mode induced structural phase transition. However our data show that diffuse
scattering in Ag2O has a high proportion of thermal diffuse component even at 16 K.
While static disorder probably is also present resulting in small diffuse intensity
observed in Ag2O at 16 K (Fig. 5.8; curve (4)).
The nuclear density distributions of Cu and O atoms at 16 and 300 K are
shown at Fig. 5.7. In case of Cu2O the nuclear density distributions of Cu and O
atoms are broad at higher temperature but markedly change as temperature decreases
in the same manner as Debye-Waller parameter at 16 K. These agree well with
observed temperature dependence of diffuse scattering of Cu2O (Figs. 5.4a to 5.4d)
which are different in comparison to Ag2O.
5.5 Neutron Diffuse Scattering of Ag2O
Figure 5.8 shows the observed neutron diffraction patterns of Ag2O measured
by Taipan in double crystal diffraction mode and in a triple-axis elastic (DE » 0) mode
at 16 K and 300 K. The oscillating diffuse background with broad peaks is seen close
to (111) and (113) Bragg reflections at 300 K when measured in conventional
diffraction mode (Fig. 5.8; curve (1)). The intensity of diffuse peaks decreases
considerably at 16 K, but still rather high (Fig. 5.8; curve (2)). The measurement in
elastic (DE » 0) mode shows almost complete suppression of diffuse intensity both at
16 K and 300 K (Fig. 5.8; curves (3) and (4)). This clearly indicates the dynamic
origin of observed diffuse scattering in Ag2O. At the same time while at 300 K there
are no visible diffuse components, small remaining diffuse contribution is seen at 16
K which probably relates to static disorder in the system or phonon softening and
increasing of soft phonons density at low temperature.
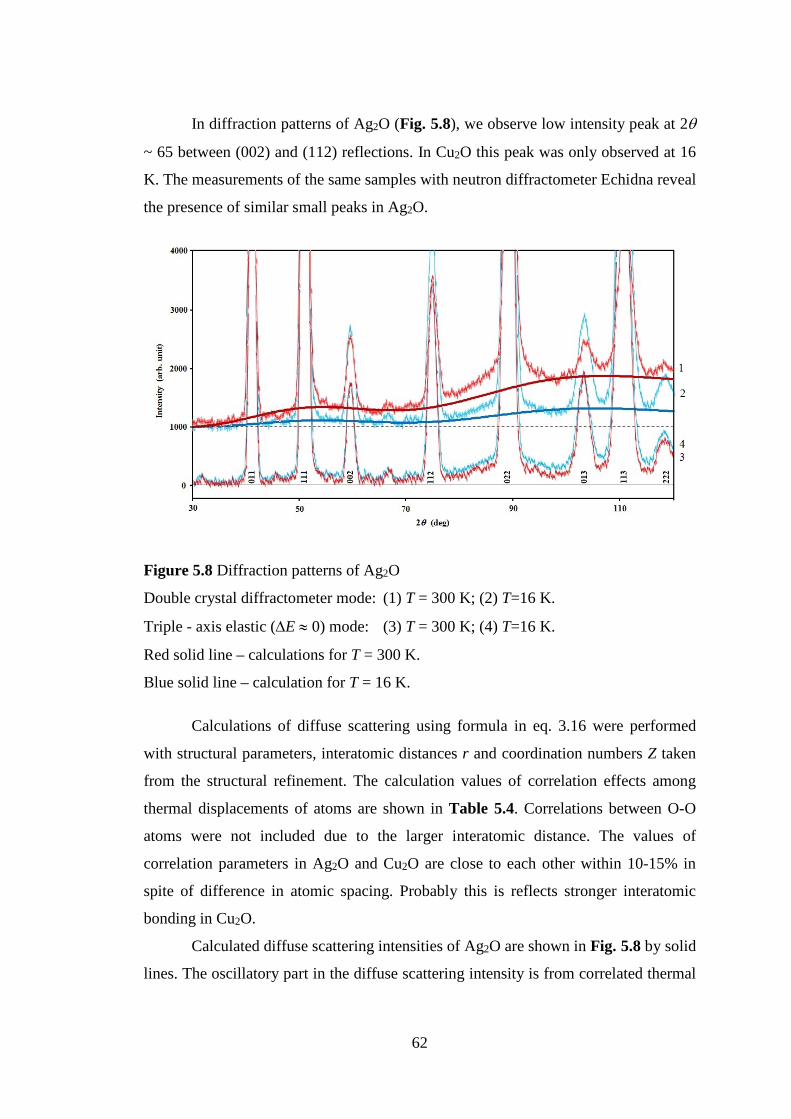
62
In diffraction patterns of Ag2O (Fig. 5.8), we observe low intensity peak at 2q
~ 65 between (002) and (112) reflections. In Cu2O this peak was only observed at 16
K. The measurements of the same samples with neutron diffractometer Echidna reveal
the presence of similar small peaks in Ag2O.
Figure 5.8 Diffraction patterns of Ag2O
Double crystal diffractometer mode: (1) T = 300 K; (2) T=16 K.
Triple - axis elastic (DE » 0) mode: (3) T = 300 K; (4) T=16 K.
Red solid line – calculations for T = 300 K.
Blue solid line – calculation for T = 16 K.
Calculations of diffuse scattering using formula in eq. 3.16 were performed
with structural parameters, interatomic distances r and coordination numbers Z taken
from the structural refinement. The calculation values of correlation effects among
thermal displacements of atoms are shown in Table 5.4. Correlations between O-O
atoms were not included due to the larger interatomic distance. The values of
correlation parameters in Ag2O and Cu2O are close to each other within 10-15% in
spite of difference in atomic spacing. Probably this is reflects stronger interatomic
bonding in Cu2O.
Calculated diffuse scattering intensities of Ag2O are shown in Fig. 5.8 by solid
lines. The oscillatory part in the diffuse scattering intensity is from correlated thermal
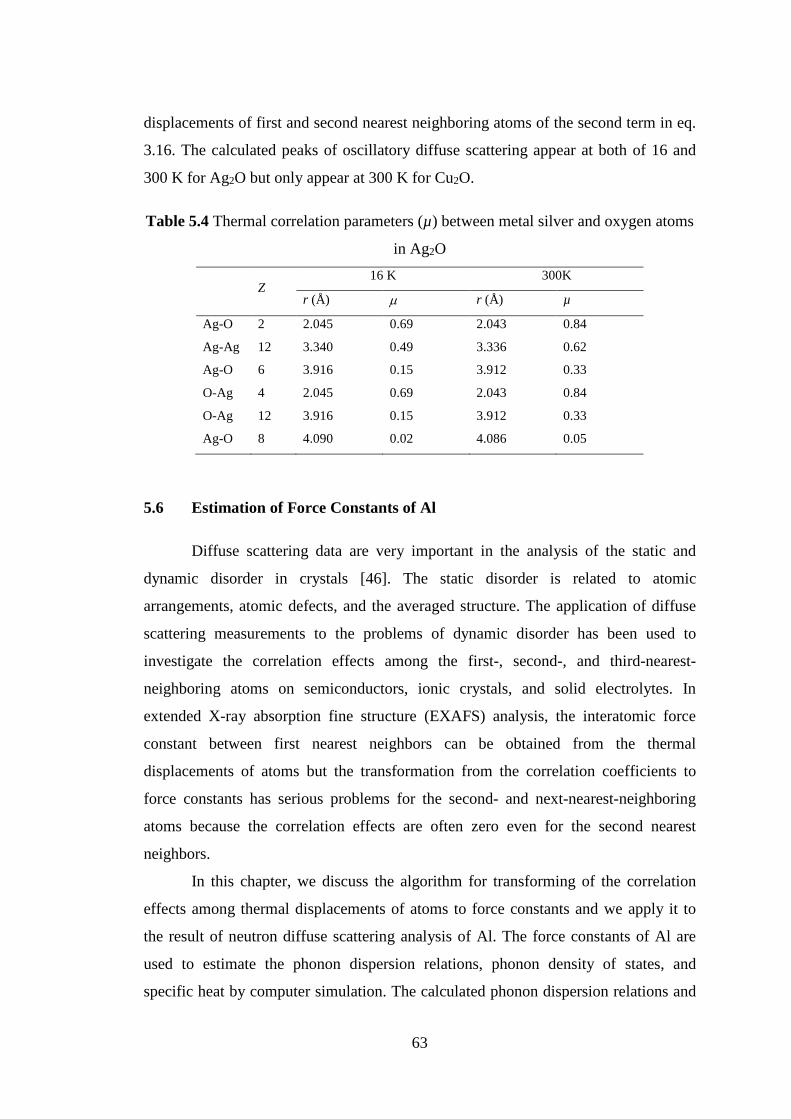
63
displacements of first and second nearest neighboring atoms of the second term in eq.
3.16. The calculated peaks of oscillatory diffuse scattering appear at both of 16 and
300 K for Ag2O but only appear at 300 K for Cu2O.
Table 5.4 Thermal correlation parameters (µ) between metal silver and oxygen atoms
in Ag2O
Z16 K 300K
r (Å) m r (Å) µ
Ag-O 2 2.045 0.69 2.043 0.84
Ag-Ag 12 3.340 0.49 3.336 0.62
Ag-O 6 3.916 0.15 3.912 0.33
O-Ag 4 2.045 0.69 2.043 0.84
O-Ag 12 3.916 0.15 3.912 0.33
Ag-O 8 4.090 0.02 4.086 0.05
5.6 Estimation of Force Constants of Al
Diffuse scattering data are very important in the analysis of the static and
dynamic disorder in crystals [46]. The static disorder is related to atomic
arrangements, atomic defects, and the averaged structure. The application of diffuse
scattering measurements to the problems of dynamic disorder has been used to
investigate the correlation effects among the first-, second-, and third-nearest-
neighboring atoms on semiconductors, ionic crystals, and solid electrolytes. In
extended X-ray absorption fine structure (EXAFS) analysis, the interatomic force
constant between first nearest neighbors can be obtained from the thermal
displacements of atoms but the transformation from the correlation coefficients to
force constants has serious problems for the second- and next-nearest-neighboring
atoms because the correlation effects are often zero even for the second nearest
neighbors.
In this chapter, we discuss the algorithm for transforming of the correlation
effects among thermal displacements of atoms to force constants and we apply it to
the result of neutron diffuse scattering analysis of Al. The force constants of Al are
used to estimate the phonon dispersion relations, phonon density of states, and
specific heat by computer simulation. The calculated phonon dispersion relations and
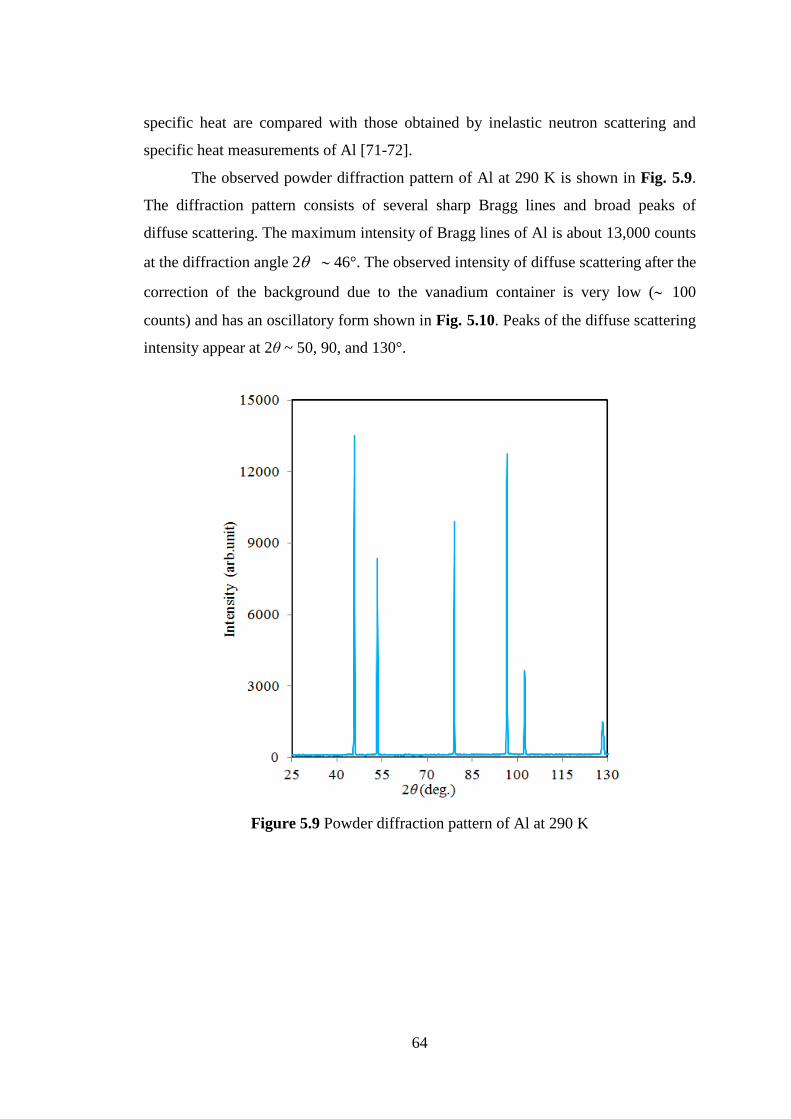
64
specific heat are compared with those obtained by inelastic neutron scattering and
specific heat measurements of Al [71-72].
The observed powder diffraction pattern of Al at 290 K is shown in Fig. 5.9.
The diffraction pattern consists of several sharp Bragg lines and broad peaks of
diffuse scattering. The maximum intensity of Bragg lines of Al is about 13,000 counts
at the diffraction angle 2q ~ 46°. The observed intensity of diffuse scattering after the
correction of the background due to the vanadium container is very low (~ 100
counts) and has an oscillatory form shown in Fig. 5.10. Peaks of the diffuse scattering
intensity appear at 2θ ~ 50, 90, and 130°.
Figure 5.9 Powder diffraction pattern of Al at 290 K
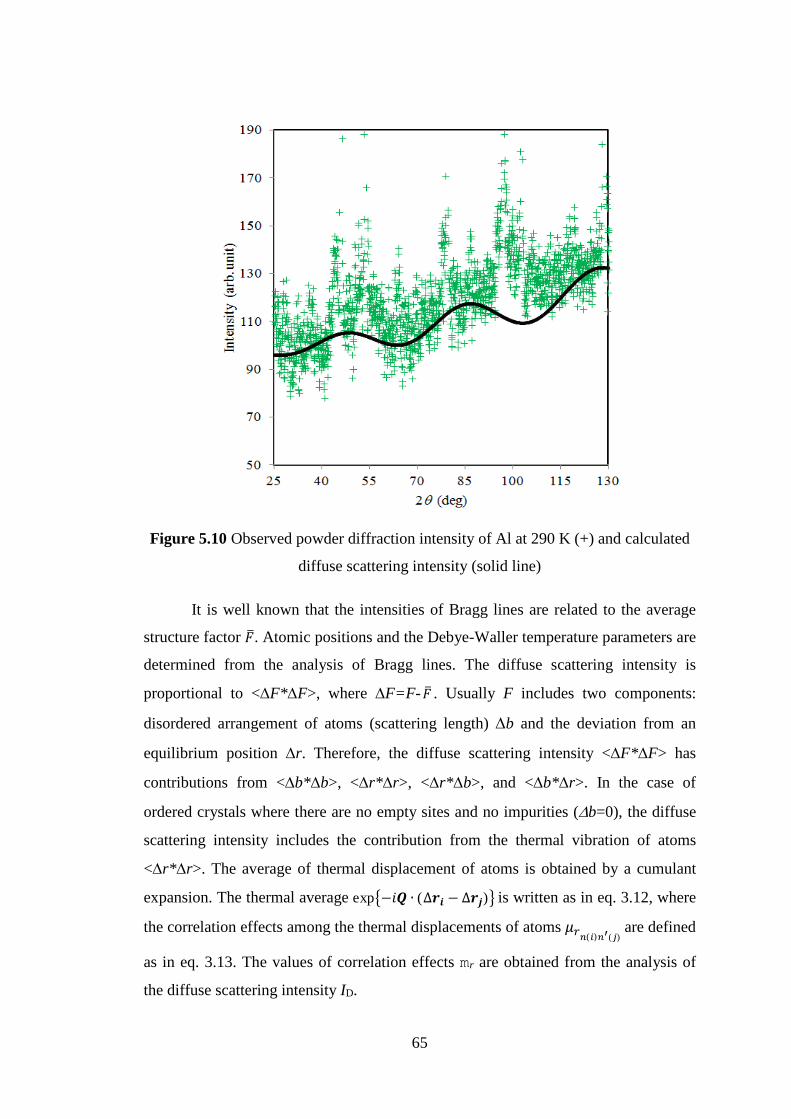
65
Figure 5.10 Observed powder diffraction intensity of Al at 290 K (+) and calculated
diffuse scattering intensity (solid line)
It is well known that the intensities of Bragg lines are related to the average
structure factor . Atomic positions and the Debye-Waller temperature parameters are
determined from the analysis of Bragg lines. The diffuse scattering intensity is
proportional to <DF*DF>, where DF=F- . Usually F includes two components:
disordered arrangement of atoms (scattering length) Db and the deviation from an
equilibrium position Dr. Therefore, the diffuse scattering intensity <DF*DF> has
contributions from <Db*Db>, <Dr*Dr>, <Dr*Db>, and <Db*Dr>. In the case of
ordered crystals where there are no empty sites and no impurities (Db=0), the diffuse
scattering intensity includes the contribution from the thermal vibration of atoms
<Dr*Dr>. The average of thermal displacement of atoms is obtained by a cumulant
expansion. The thermal average exp − ∙ (∆ − ∆ ) is written as in eq. 3.12, where
the correlation effects among the thermal displacements of atoms ( ) ( ) are defined
as in eq. 3.13. The values of correlation effects mr are obtained from the analysis of
the diffuse scattering intensity ID.
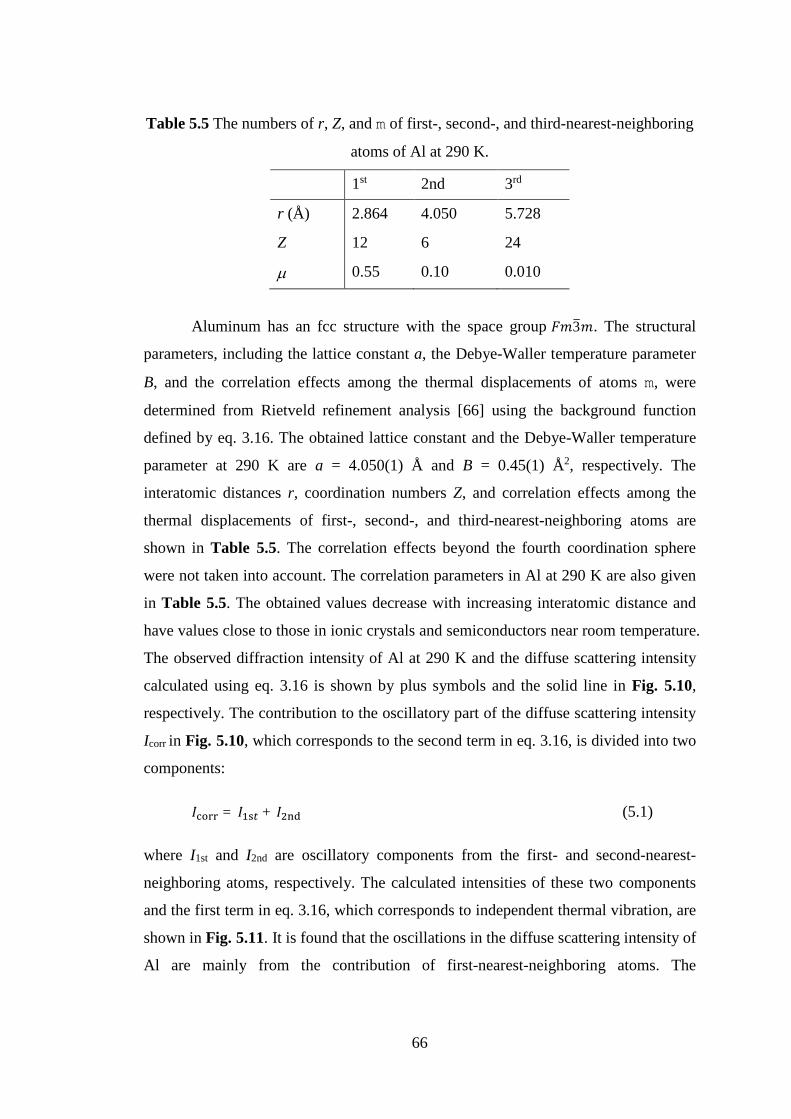
66
Table 5.5 The numbers of r, Z, and m of first-, second-, and third-nearest-neighboring
atoms of Al at 290 K.
1st 2nd 3rd
r (Å) 2.864 4.050 5.728
Z 12 6 24
m 0.55 0.10 0.010
Aluminum has an fcc structure with the space group 3 . The structural
parameters, including the lattice constant a, the Debye-Waller temperature parameter
B, and the correlation effects among the thermal displacements of atoms m, were
determined from Rietveld refinement analysis [66] using the background function
defined by eq. 3.16. The obtained lattice constant and the Debye-Waller temperature
parameter at 290 K are a = 4.050(1) Å and B = 0.45(1) Å2, respectively. The
interatomic distances r, coordination numbers Z, and correlation effects among the
thermal displacements of first-, second-, and third-nearest-neighboring atoms are
shown in Table 5.5. The correlation effects beyond the fourth coordination sphere
were not taken into account. The correlation parameters in Al at 290 K are also given
in Table 5.5. The obtained values decrease with increasing interatomic distance and
have values close to those in ionic crystals and semiconductors near room temperature.
The observed diffraction intensity of Al at 290 K and the diffuse scattering intensity
calculated using eq. 3.16 is shown by plus symbols and the solid line in Fig. 5.10,
respectively. The contribution to the oscillatory part of the diffuse scattering intensity
Icorr in Fig. 5.10, which corresponds to the second term in eq. 3.16, is divided into two
components:
= + (5.1)
where I1st and I2nd are oscillatory components from the first- and second-nearest-
neighboring atoms, respectively. The calculated intensities of these two components
and the first term in eq. 3.16, which corresponds to independent thermal vibration, are
shown in Fig. 5.11. It is found that the oscillations in the diffuse scattering intensity of
Al are mainly from the contribution of first-nearest-neighboring atoms. The
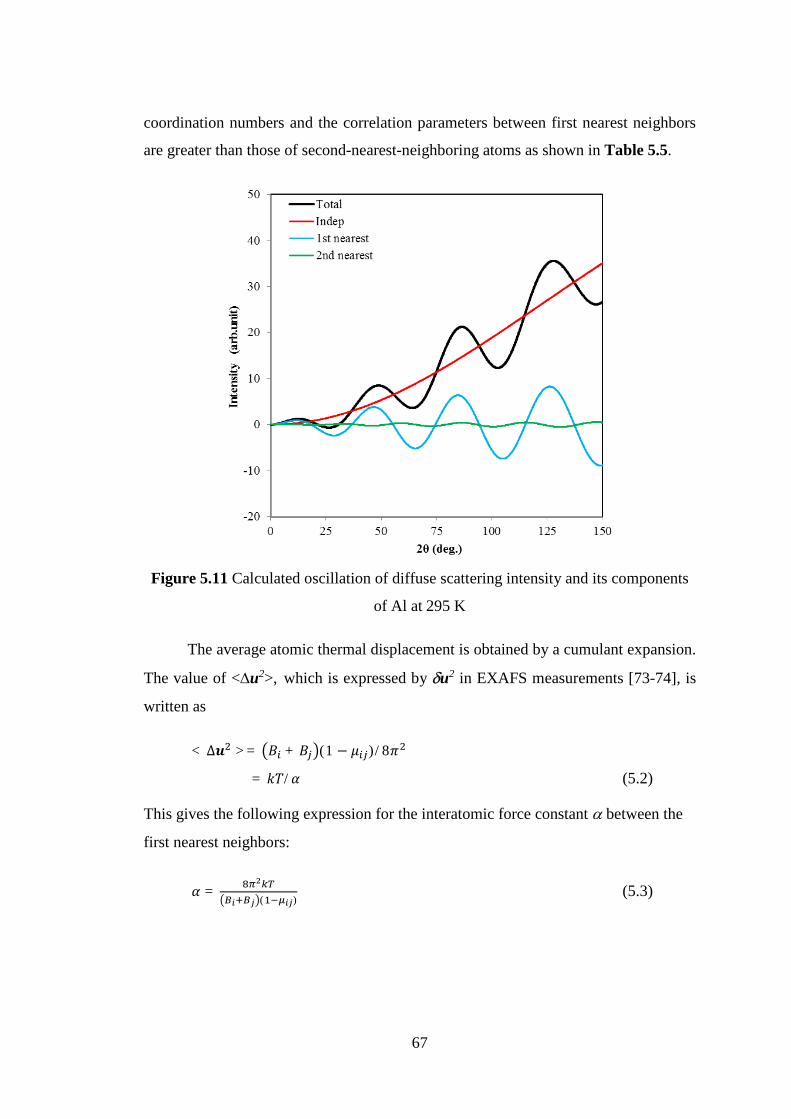
67
coordination numbers and the correlation parameters between first nearest neighbors
are greater than those of second-nearest-neighboring atoms as shown in Table 5.5.
Figure 5.11 Calculated oscillation of diffuse scattering intensity and its components
of Al at 295 K
The average atomic thermal displacement is obtained by a cumulant expansion.
The value of <Du2>, which is expressed by du2 in EXAFS measurements [73-74], is
written as
< ∆ >= + (1 − )/8= / (5.2)
This gives the following expression for the interatomic force constant a between the
first nearest neighbors:
= ( ) (5.3)
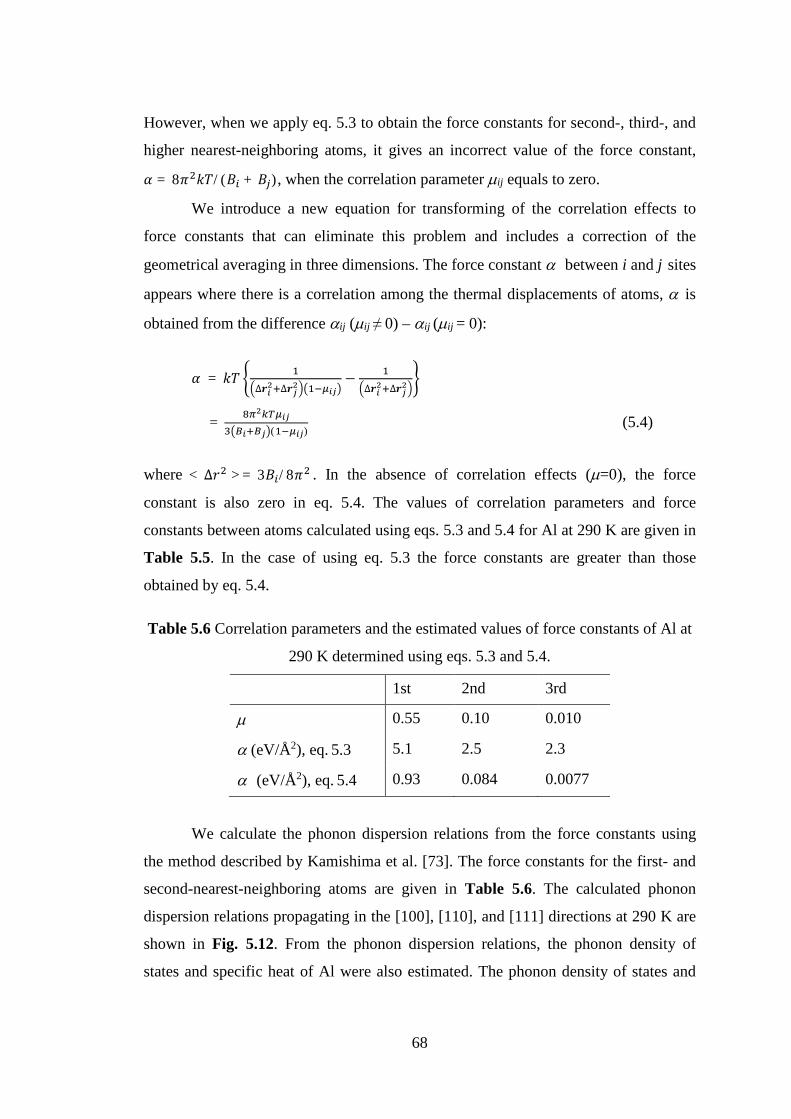
68
However, when we apply eq. 5.3 to obtain the force constants for second-, third-, and
higher nearest-neighboring atoms, it gives an incorrect value of the force constant, = 8 /( + ), when the correlation parameter mij equals to zero.
We introduce a new equation for transforming of the correlation effects to
force constants that can eliminate this problem and includes a correction of the
geometrical averaging in three dimensions. The force constant a between i and j sites
appears where there is a correlation among the thermal displacements of atoms, a is
obtained from the difference aij (mij ≠ 0) – aij (mij = 0):
= ∆ ∆ − ∆ ∆= ( ) (5.4)
where < ∆ >= 3 /8 . In the absence of correlation effects (m=0), the force
constant is also zero in eq. 5.4. The values of correlation parameters and force
constants between atoms calculated using eqs. 5.3 and 5.4 for Al at 290 K are given in
Table 5.5. In the case of using eq. 5.3 the force constants are greater than those
obtained by eq. 5.4.
Table 5.6 Correlation parameters and the estimated values of force constants of Al at
290 K determined using eqs. 5.3 and 5.4.
1st 2nd 3rd
m 0.55 0.10 0.010
a (eV/Å2), eq. 5.3 5.1 2.5 2.3
a (eV/Å2), eq. 5.4 0.93 0.084 0.0077
We calculate the phonon dispersion relations from the force constants using
the method described by Kamishima et al. [73]. The force constants for the first- and
second-nearest-neighboring atoms are given in Table 5.6. The calculated phonon
dispersion relations propagating in the [100], [110], and [111] directions at 290 K are
shown in Fig. 5.12. From the phonon dispersion relations, the phonon density of
states and specific heat of Al were also estimated. The phonon density of states and
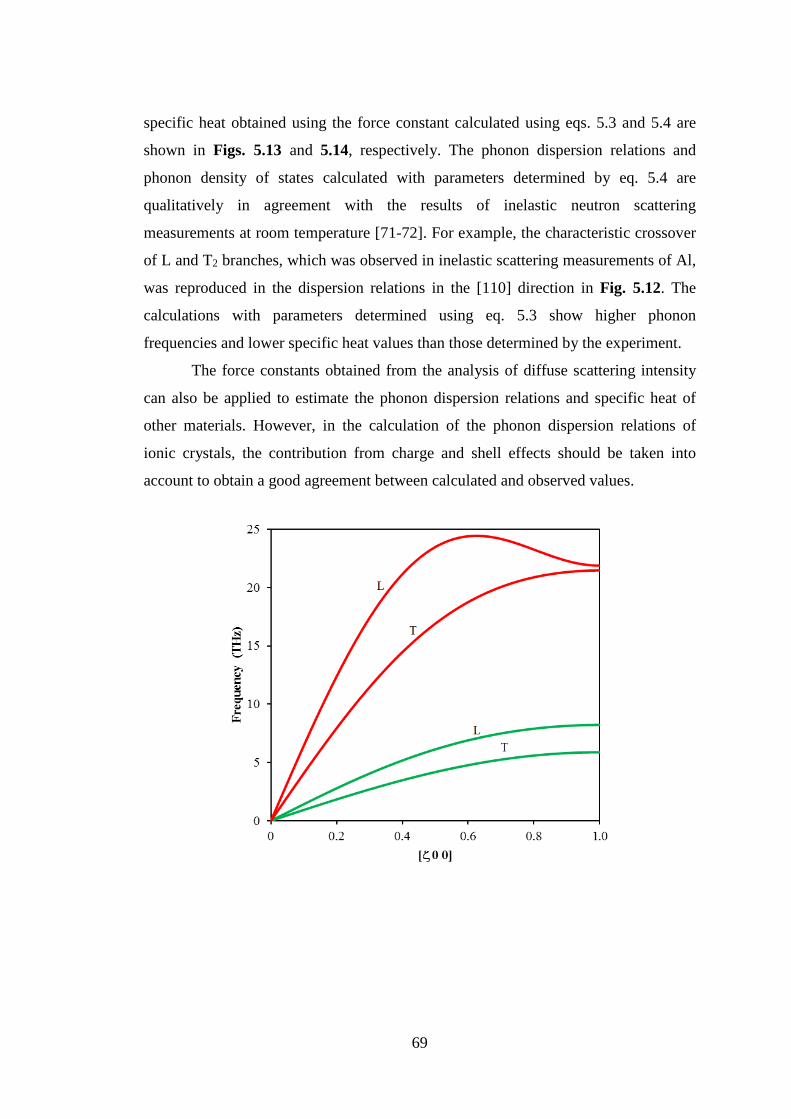
69
specific heat obtained using the force constant calculated using eqs. 5.3 and 5.4 are
shown in Figs. 5.13 and 5.14, respectively. The phonon dispersion relations and
phonon density of states calculated with parameters determined by eq. 5.4 are
qualitatively in agreement with the results of inelastic neutron scattering
measurements at room temperature [71-72]. For example, the characteristic crossover
of L and T2 branches, which was observed in inelastic scattering measurements of Al,
was reproduced in the dispersion relations in the [110] direction in Fig. 5.12. The
calculations with parameters determined using eq. 5.3 show higher phonon
frequencies and lower specific heat values than those determined by the experiment.
The force constants obtained from the analysis of diffuse scattering intensity
can also be applied to estimate the phonon dispersion relations and specific heat of
other materials. However, in the calculation of the phonon dispersion relations of
ionic crystals, the contribution from charge and shell effects should be taken into
account to obtain a good agreement between calculated and observed values.
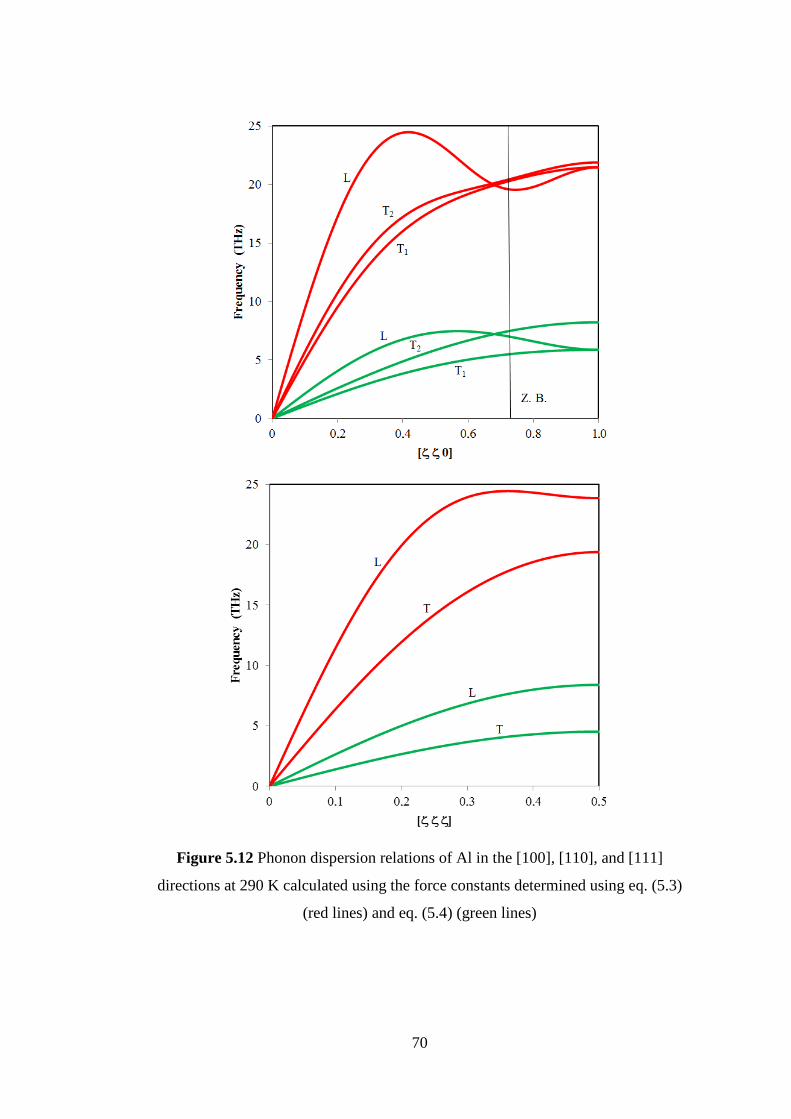
70
Figure 5.12 Phonon dispersion relations of Al in the [100], [110], and [111]
directions at 290 K calculated using the force constants determined using eq. (5.3)
(red lines) and eq. (5.4) (green lines)
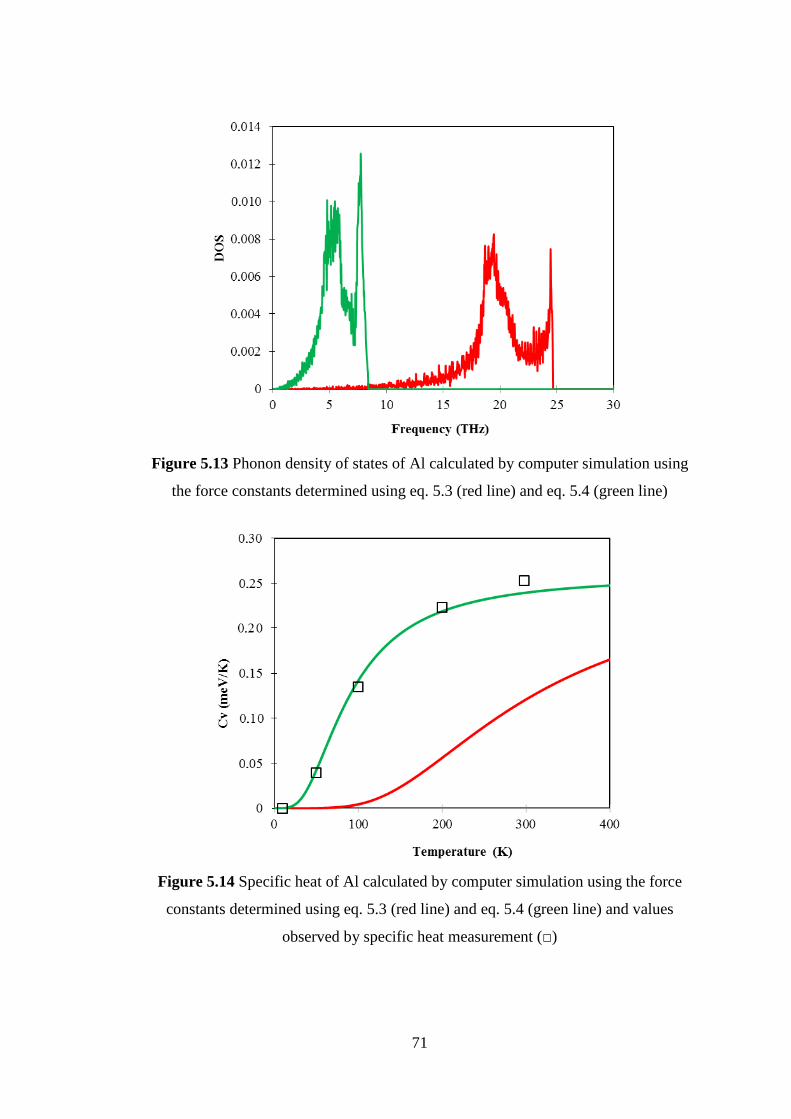
71
Figure 5.13 Phonon density of states of Al calculated by computer simulation using
the force constants determined using eq. 5.3 (red line) and eq. 5.4 (green line)
Figure 5.14 Specific heat of Al calculated by computer simulation using the force
constants determined using eq. 5.3 (red line) and eq. 5.4 (green line) and values
observed by specific heat measurement (□)
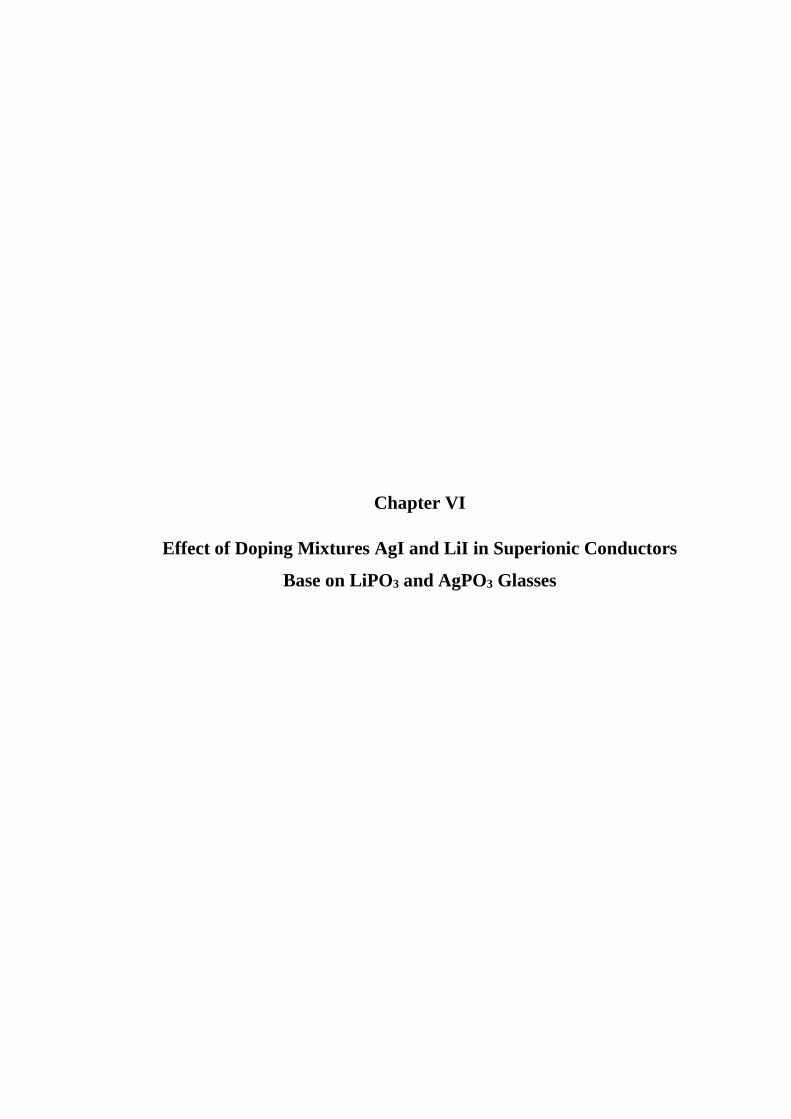
Chapter VI
Effect of Doping Mixtures AgI and LiI in Superionic Conductors
Base on LiPO3 and AgPO3 Glasses
73
6.1 Introduction
Superionic conductor is one of the advanced materials that play an important
role in electronic components. Unlike electronic conductors, the charge carriers in
superionic conductors are ions. The ionic conductor may be used in sensors, fuel cell
or batteries. Lithium-ion batteries are one of the most popular types of rechargeable
battery for portable electronics with the best energy densities, no memory effect, and
a slow loss of energy when not in use. A battery consists of an electrochemically
reactive pair separated by an ion-transporting medium or electrolyte. In most common
batteries the electrolyte is a liquid. However the availability of solids that are capable
of being fabricated into electronically elements with fairly high ionic conductivity has
stimulated the development of solid electrolyte batteries. Glassy electrolyte based on
LiPO3 and AgPO3 has shown better properties, which shows no grain boundary, low
melting point and easy in preparation [30].
The ionic conductivities of LiPO3 and AgPO3 are ~ 10-8 S/cm while the
conductivities of LiI and AgI are ~ 10-7 and ~ 10-6 S/cm at room temperature,
respectively. In LiI-LiPO3 the conductivity increases to ~ 10-6 S/cm with increasing
LiI up to 30% and then decreases with LiI more than 30% [30]. The ionic
conductivity of the most well known AgI-LiPO3 and LiI-LiPO3 system are ~ 10-3 and
~ 10-7 S/cm, respectively [30, 75]. In our preliminary work, we vary the composition
of AgI and LiI in LiPO3 and AgPO3 glass to produce the mixtures of
(AgI)x(LiI)y(LiPO3)1-x-y and (AgI)x(LiI)y(AgPO3)1-x-y. The results show that (AgI)0.33
(LiI)0.33(LiPO3)0.34 and (AgI)0.44(LiI)0.22(AgPO3)0.34 have better ionic conductivities. In
order to understand the property of (AgI)0.33(LiI)0.33(LiPO3)0.34 and (AgI)0.44(LiI)0.22
(AgPO3)0.34, this work will study the crystal structure, thermal behavior and
conductivity property as well as compared with those of corresponding glass AgI-
LiPO3 and LiI-LiPO3 system.
6.2 Synthesis and Properties of (AgI)0.33(LiI)0.33(LiPO3)0.34
(AgI)0.33(LiI)0.33(LiPO3)0.34 was synthesized by melt quenching method and
analyzed by using XRD, DSC, and LCR-meter as described in chapter IV. Figure 6.1
shows the X-ray diffraction patterns of LiPO3, LiI, AgI and
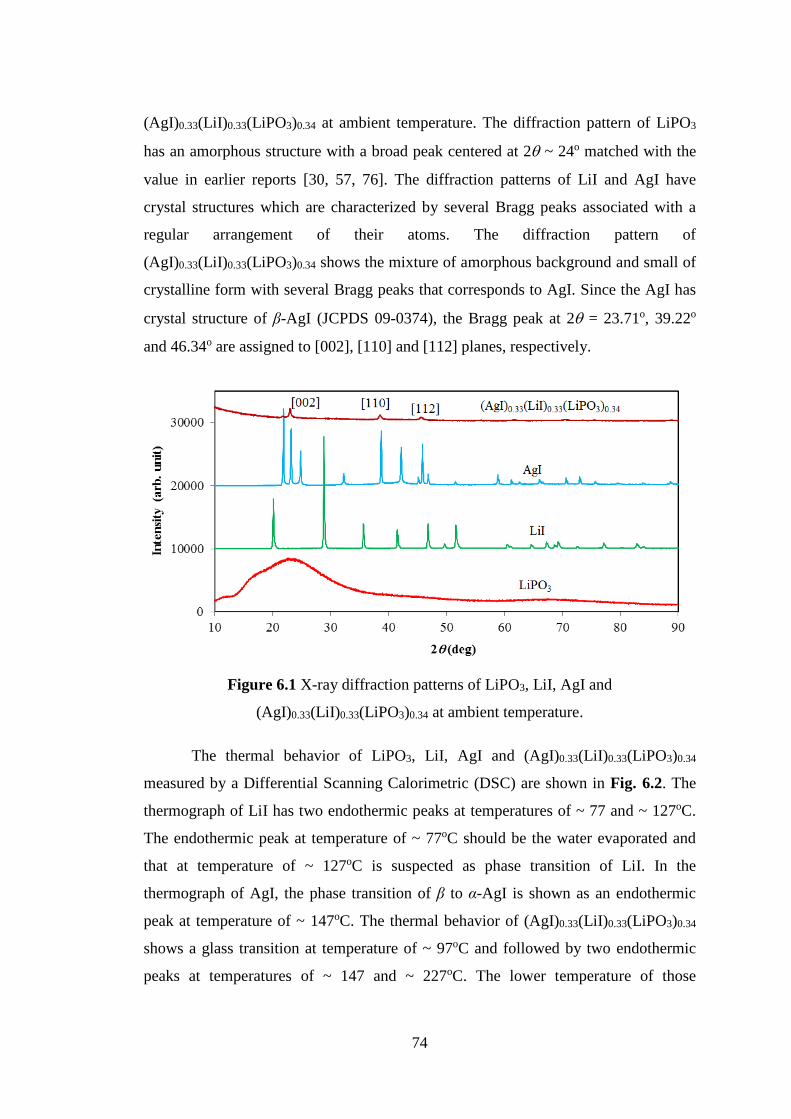
74
(AgI)0.33(LiI)0.33(LiPO3)0.34 at ambient temperature. The diffraction pattern of LiPO3
has an amorphous structure with a broad peak centered at 2q ~ 24o matched with the
value in earlier reports [30, 57, 76]. The diffraction patterns of LiI and AgI have
crystal structures which are characterized by several Bragg peaks associated with a
regular arrangement of their atoms. The diffraction pattern of
(AgI)0.33(LiI)0.33(LiPO3)0.34 shows the mixture of amorphous background and small of
crystalline form with several Bragg peaks that corresponds to AgI. Since the AgI has
crystal structure of β-AgI (JCPDS 09-0374), the Bragg peak at 2q = 23.71o, 39.22o
and 46.34o are assigned to [002], [110] and [112] planes, respectively.
Figure 6.1 X-ray diffraction patterns of LiPO3, LiI, AgI and
(AgI)0.33(LiI)0.33(LiPO3)0.34 at ambient temperature.
The thermal behavior of LiPO3, LiI, AgI and (AgI)0.33(LiI)0.33(LiPO3)0.34
measured by a Differential Scanning Calorimetric (DSC) are shown in Fig. 6.2. The
thermograph of LiI has two endothermic peaks at temperatures of ~ 77 and ~ 127oC.
The endothermic peak at temperature of ~ 77oC should be the water evaporated and
that at temperature of ~ 127oC is suspected as phase transition of LiI. In the
thermograph of AgI, the phase transition of β to α-AgI is shown as an endothermic
peak at temperature of ~ 147oC. The thermal behavior of (AgI)0.33(LiI)0.33(LiPO3)0.34
shows a glass transition at temperature of ~ 97oC and followed by two endothermic
peaks at temperatures of ~ 147 and ~ 227oC. The lower temperature of those
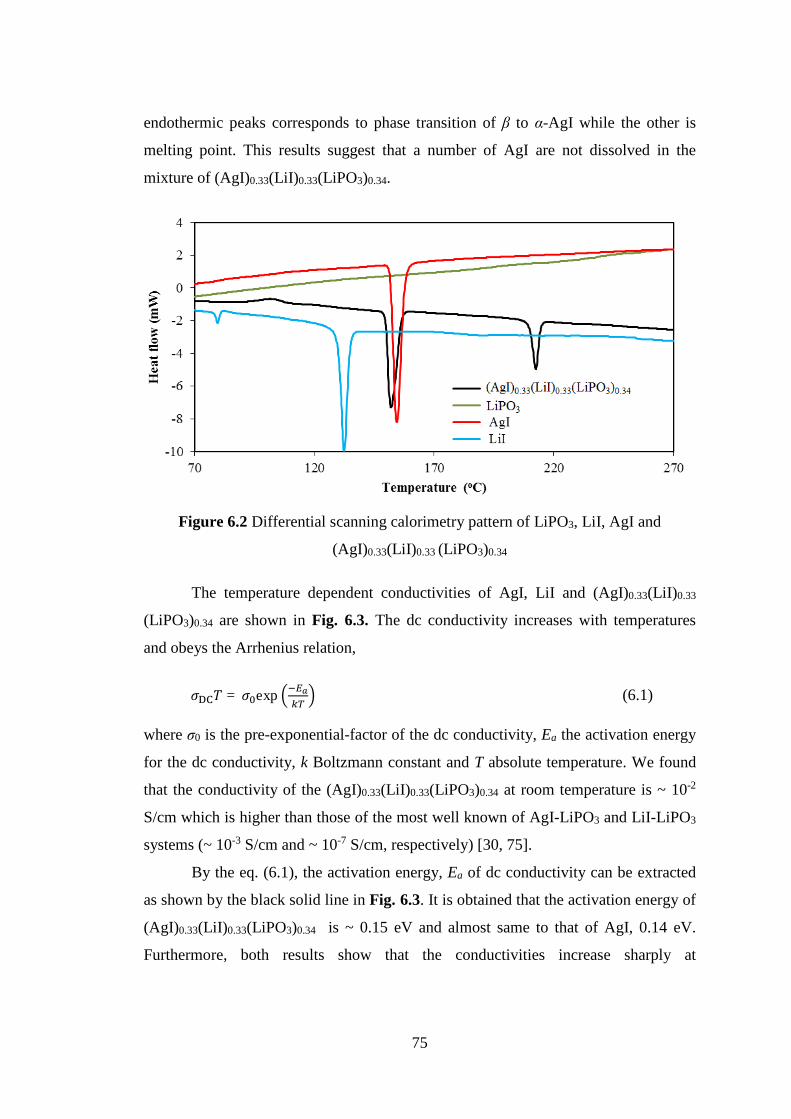
75
endothermic peaks corresponds to phase transition of β to α-AgI while the other is
melting point. This results suggest that a number of AgI are not dissolved in the
mixture of (AgI)0.33(LiI)0.33(LiPO3)0.34.
Figure 6.2 Differential scanning calorimetry pattern of LiPO3, LiI, AgI and
(AgI)0.33(LiI)0.33 (LiPO3)0.34
The temperature dependent conductivities of AgI, LiI and (AgI)0.33(LiI)0.33
(LiPO3)0.34 are shown in Fig. 6.3. The dc conductivity increases with temperatures
and obeys the Arrhenius relation,
= exp (6.1)
where σ0 is the pre-exponential-factor of the dc conductivity, Ea the activation energy
for the dc conductivity, k Boltzmann constant and T absolute temperature. We found
that the conductivity of the (AgI)0.33(LiI)0.33(LiPO3)0.34 at room temperature is ~ 10-2
S/cm which is higher than those of the most well known of AgI-LiPO3 and LiI-LiPO3
systems (~ 10-3 S/cm and ~ 10-7 S/cm, respectively) [30, 75].
By the eq. (6.1), the activation energy, Ea of dc conductivity can be extracted
as shown by the black solid line in Fig. 6.3. It is obtained that the activation energy of
(AgI)0.33(LiI)0.33(LiPO3)0.34 is ~ 0.15 eV and almost same to that of AgI, 0.14 eV.
Furthermore, both results show that the conductivities increase sharply at
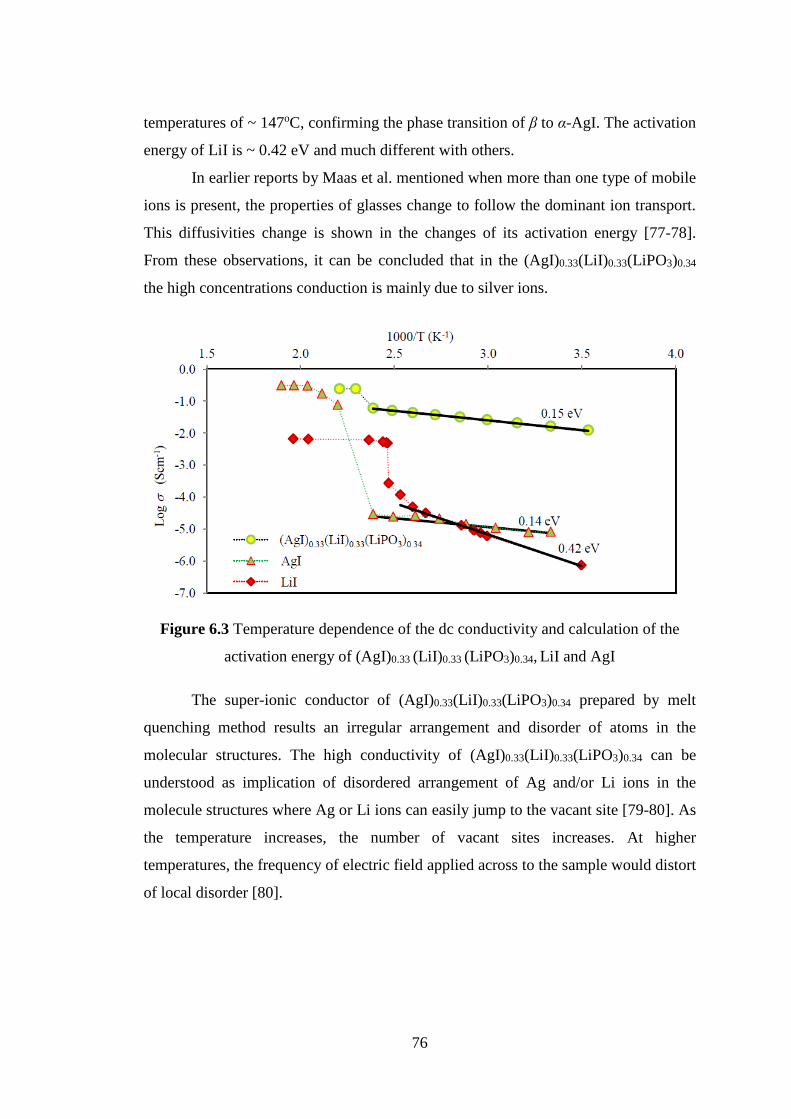
76
temperatures of ~ 147oC, confirming the phase transition of β to α-AgI. The activation
energy of LiI is ~ 0.42 eV and much different with others.
In earlier reports by Maas et al. mentioned when more than one type of mobile
ions is present, the properties of glasses change to follow the dominant ion transport.
This diffusivities change is shown in the changes of its activation energy [77-78].
From these observations, it can be concluded that in the (AgI)0.33(LiI)0.33(LiPO3)0.34
the high concentrations conduction is mainly due to silver ions.
Figure 6.3 Temperature dependence of the dc conductivity and calculation of the
activation energy of (AgI)0.33 (LiI)0.33 (LiPO3)0.34, LiI and AgI
The super-ionic conductor of (AgI)0.33(LiI)0.33(LiPO3)0.34 prepared by melt
quenching method results an irregular arrangement and disorder of atoms in the
molecular structures. The high conductivity of (AgI)0.33(LiI)0.33(LiPO3)0.34 can be
understood as implication of disordered arrangement of Ag and/or Li ions in the
molecule structures where Ag or Li ions can easily jump to the vacant site [79-80]. As
the temperature increases, the number of vacant sites increases. At higher
temperatures, the frequency of electric field applied across to the sample would distort
of local disorder [80].
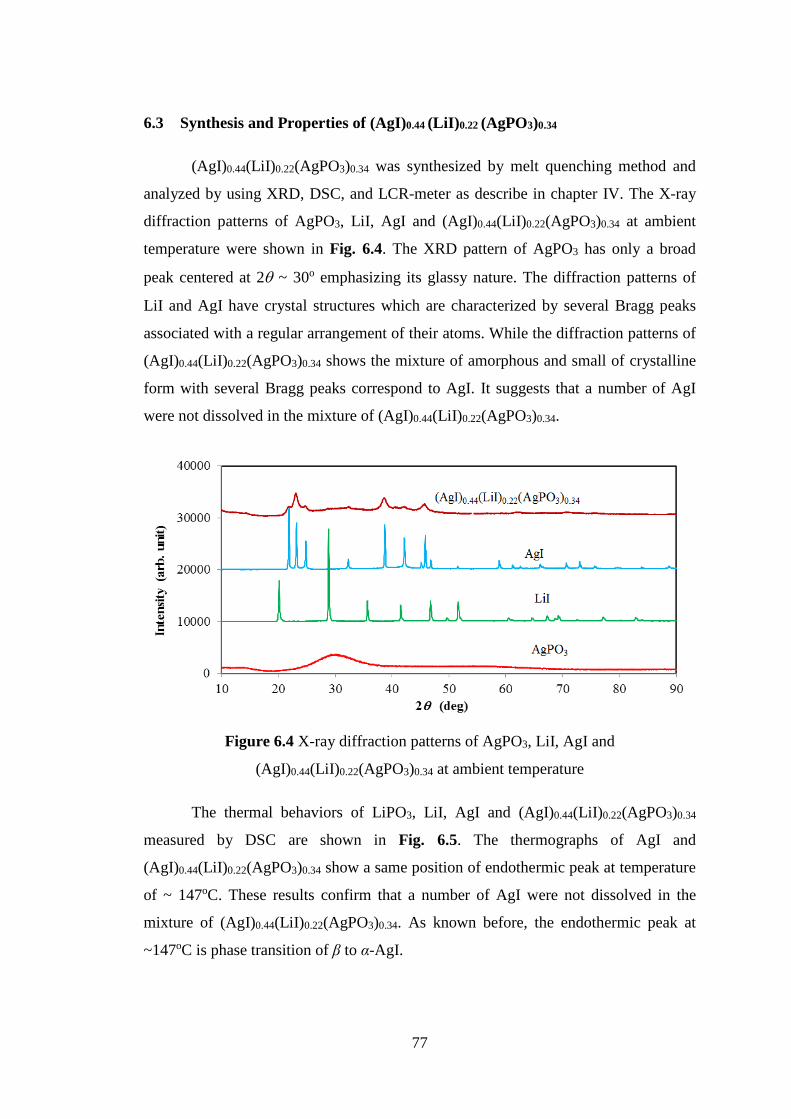
77
6.3 Synthesis and Properties of (AgI)0.44 (LiI)0.22 (AgPO3)0.34
(AgI)0.44(LiI)0.22(AgPO3)0.34 was synthesized by melt quenching method and
analyzed by using XRD, DSC, and LCR-meter as describe in chapter IV. The X-ray
diffraction patterns of AgPO3, LiI, AgI and (AgI)0.44(LiI)0.22(AgPO3)0.34 at ambient
temperature were shown in Fig. 6.4. The XRD pattern of AgPO3 has only a broad
peak centered at 2q ~ 30o emphasizing its glassy nature. The diffraction patterns of
LiI and AgI have crystal structures which are characterized by several Bragg peaks
associated with a regular arrangement of their atoms. While the diffraction patterns of
(AgI)0.44(LiI)0.22(AgPO3)0.34 shows the mixture of amorphous and small of crystalline
form with several Bragg peaks correspond to AgI. It suggests that a number of AgI
were not dissolved in the mixture of (AgI)0.44(LiI)0.22(AgPO3)0.34.
Figure 6.4 X-ray diffraction patterns of AgPO3, LiI, AgI and
(AgI)0.44(LiI)0.22(AgPO3)0.34 at ambient temperature
The thermal behaviors of LiPO3, LiI, AgI and (AgI)0.44(LiI)0.22(AgPO3)0.34
measured by DSC are shown in Fig. 6.5. The thermographs of AgI and
(AgI)0.44(LiI)0.22(AgPO3)0.34 show a same position of endothermic peak at temperature
of ~ 147oC. These results confirm that a number of AgI were not dissolved in the
mixture of (AgI)0.44(LiI)0.22(AgPO3)0.34. As known before, the endothermic peak at
~147oC is phase transition of β to α-AgI.
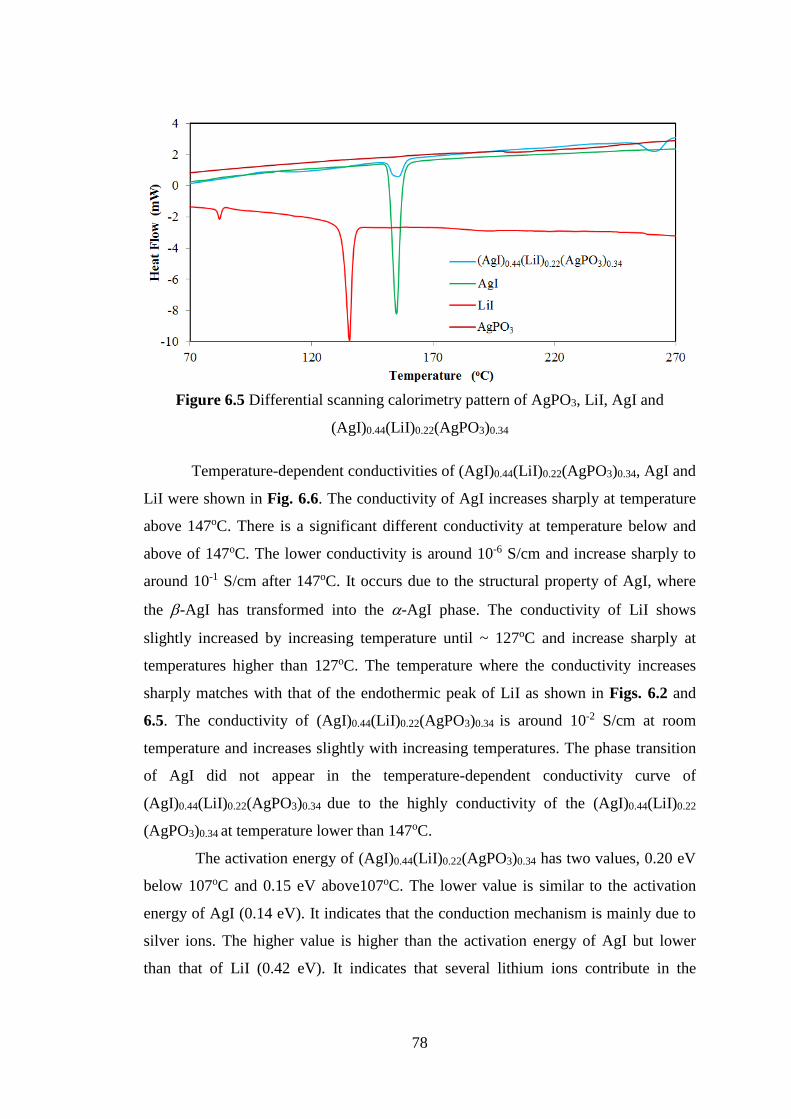
78
Figure 6.5 Differential scanning calorimetry pattern of AgPO3, LiI, AgI and
(AgI)0.44(LiI)0.22(AgPO3)0.34
Temperature-dependent conductivities of (AgI)0.44(LiI)0.22(AgPO3)0.34, AgI and
LiI were shown in Fig. 6.6. The conductivity of AgI increases sharply at temperature
above 147oC. There is a significant different conductivity at temperature below and
above of 147oC. The lower conductivity is around 10-6 S/cm and increase sharply to
around 10-1 S/cm after 147oC. It occurs due to the structural property of AgI, where
the b-AgI has transformed into the a-AgI phase. The conductivity of LiI shows
slightly increased by increasing temperature until ~ 127oC and increase sharply at
temperatures higher than 127oC. The temperature where the conductivity increases
sharply matches with that of the endothermic peak of LiI as shown in Figs. 6.2 and
6.5. The conductivity of (AgI)0.44(LiI)0.22(AgPO3)0.34 is around 10-2 S/cm at room
temperature and increases slightly with increasing temperatures. The phase transition
of AgI did not appear in the temperature-dependent conductivity curve of
(AgI)0.44(LiI)0.22(AgPO3)0.34 due to the highly conductivity of the (AgI)0.44(LiI)0.22
(AgPO3)0.34 at temperature lower than 147oC.
The activation energy of (AgI)0.44(LiI)0.22(AgPO3)0.34 has two values, 0.20 eV
below 107oC and 0.15 eV above107oC. The lower value is similar to the activation
energy of AgI (0.14 eV). It indicates that the conduction mechanism is mainly due to
silver ions. The higher value is higher than the activation energy of AgI but lower
than that of LiI (0.42 eV). It indicates that several lithium ions contribute in the
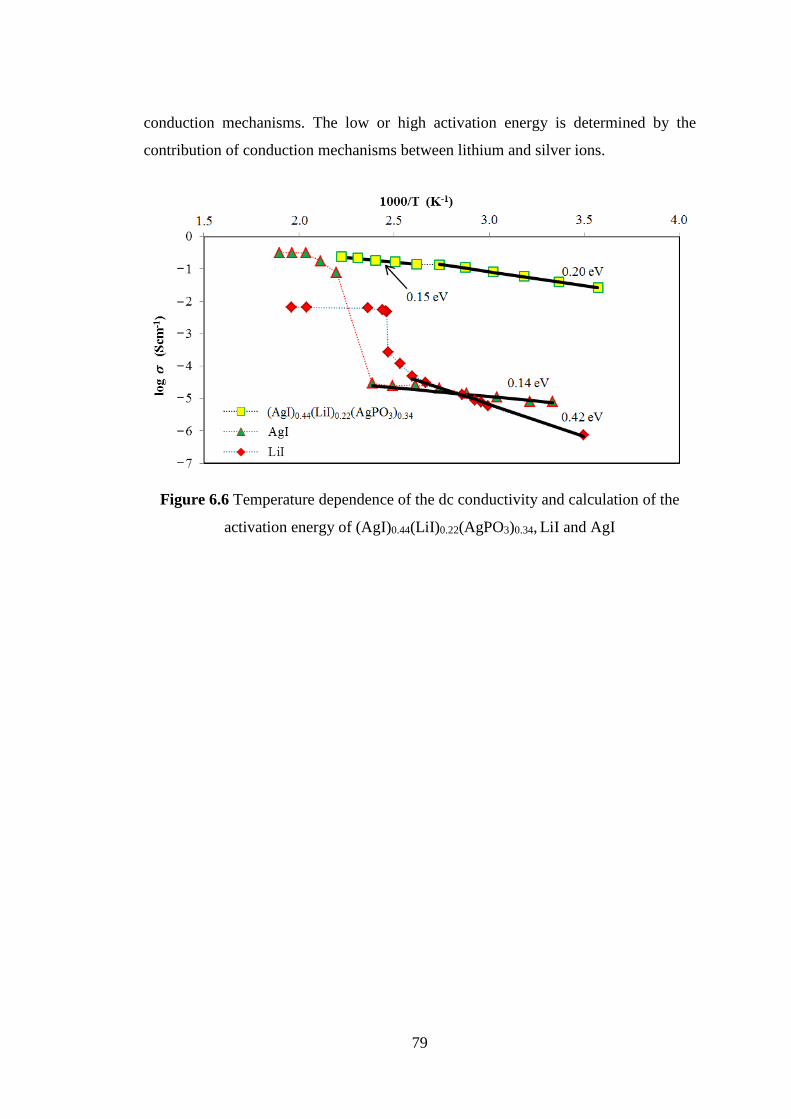
79
conduction mechanisms. The low or high activation energy is determined by the
contribution of conduction mechanisms between lithium and silver ions.
Figure 6.6 Temperature dependence of the dc conductivity and calculation of the
activation energy of (AgI)0.44(LiI)0.22(AgPO3)0.34, LiI and AgI

Chapter VII
Conclusions
81
The study in this thesis mainly separates into two partial discussions. The first
part discusses the structure and diffuse scattering of crystals and the second discusses
the syntheses and characterizations of super ionic conductor base on glass materials.
For the first part, the discussions were focused on the analysis of background
scattering and Bragg lines obtained from neutron diffraction measurements. The
analyses on the background scattering use the algorithm for transforming of the
correlation effects among thermal displacements of atoms to force constants and
computer simulation. This analysis could explain the diffuse scattering profiles of
ordered and disordered crystalline materials.
The investigations on the ionic crystals of Ag2O and Cu2O are performed to
analyze the influence of thermal treatment to the lattice constant and crystal defect.
The profile of Bragg lines which were obtained from neutron diffraction
measurements at two different temperatures has been used to analyze the changing of
the lattice constant. Both compounds show a negative thermal expansion (NTE) in a
wide range of temperatures. The lattice constant of Ag2O at 300 K is about 4.71844 Å
and increases to 4.72342 Å at 16 K. The lattice constant of Cu2O at 300 K is about
4.2722 Å and increases to 4.2739 Å at 16 K. The static and dynamic disorder in Ag2O
and Cu2O were investigated by neutron diffraction using triple-axis spectrometer in
elastic (DE » 0) mode and in conventional double-axis diffraction setup. From
comparison of diffuse scattering intensity measured in 2-axis and 3-axis modes, we
found that the main contribution of the Ag2O and Cu2O diffuse scattering intensity at
300 K comes from the atomic thermal vibrations. At low temperature, Cu2O does not
show observable diffuse component while in Ag2O a small diffuse intensity is seen. It
probably relates to static disorder in the lattice or very soft phonons with energies
below ~ 1 meV in Ag2O at low temperature.
Rietveld refinement of diffraction data reveals that Debye-Waller factors have
noticeable difference between room temperature and 16 K. At the same time the
thermal parameters of silver and oxygen atoms in Ag2O are still large at 16 K and
substantially larger than those in Cu2O at both temperatures. Calculations of diffuse
scattering taking into account correlations of thermal atomic displacements show that
the moderate decrease of diffuse intensity in Ag2O and strong suppression of it in
82
Cu2O with temperature are mainly related to different temperature behavior of Debye-
Waller factors.
The investigations on structure and diffuse scattering intensities of Al are
performed to analyze the lattice constant and the correlations of atomic thermal
displacements. The crystal structure of aluminum is fcc in the space group with
lattice constant about 4.050 Å at 290K. Interatomic force constant between first
nearest neighbors can be obtained from the thermal displacements of atoms in the
EXAFS analysis but it can not be applied to the second and next nearest neighboring
atoms. Using diffuse scattering analysis and development of newly transformation
relationship, the correlations of atomic thermal displacements and interatomic force
constant between first, second and next nearest neighboring atoms can be obtained.
The interatomic force constant between first, second and third nearest neighboring
atoms calculated by this newly transformation relationship are 0.93, 0.084 and 0.0077
eV/Å2, respectively. The results were used to calculate the phonon dispersion relations,
phonon density of states and specific heat of Al. The calculated phonon dispersion
curves and specific heat agree well with the experimental results.
The synthesizes and characterizations on the (AgI)0.33(LiI)0.33(LiPO3)0.34 and
(AgI)0.44(LiI)0.22(AgPO3)0.34 result new ionic conductor materials base on glass with
fairly high conductivities. The conductivities of both are around 10-2 S/cm at room
temperature which higher than those of the most well known of AgI-LiPO3 and LiI-
LiPO3 systems. In the synthesizing process using melt quenching method, a number
of AgI are not dissolve. It results the behavior of the temperature dependence
conductivities similar to the AgI. The conductivities of (AgI)0.33(LiI)0.33(LiPO3)0.34
increase by increasing temperature until ~ 420 K with activation energy around 0.14
eV and increase sharply at temperature of phase transition of AgI. In case of
(AgI)0.44(LiI)0.22(AgPO3)0.34, the obtained activation energies are around 0.15 and 0.20
eV. The difference in the activation energy of those mixtures indicates the different
conduction mechanism.
mFm3
83
Acknowledgements
I owe particular thanks to my academic supervisor Professor Takashi Sakuma
for accepted me to join in his research group, Institute of Applied Beam Science,
Ibaraki University, and help me with his advices and guidance during my research. He
shared his experiences in experimental techniques and research and introduced me to
his interesting mathematical algorithm model in analysis of diffuse scattering intensity.
He helps me not only in academic field but also in many aspects of my daily life in
Japan. I learn many things from him. I always owe a debt of thanks to him. I am
particularly indebted to my home supervisor Professor Evvy Kartini for accepting me
to do experiments in her laboratory, Center for Science and Technology of Advance
Materials, National Nuclear Energy Agency of Indonesia, from whom I had been
inspiring and helping me in undertaking this research. She always advices and helps
me during this my doctoral program. I am very grateful to DR. Sergey A. Danilkin,
the collaborator of Professor Sakuma from Australian Nuclear Science and
Technology Organization (ANSTO), for deeply discussion and advices in analysis of
neutron diffraction. I am really grateful to Professor Haruyuki Takahashi for his
sharing in his knowledge of the conductivities of solid ionic materials. I am really
thankful to Japan Society for the Promotion of Science (JSPS) for their JSPS
RONPAKU (Dissertation PhD) Program that has supported the financial during my
study. I also would like to express my gratitude to Head of Division of Dosimetry DR.
Johny R. Dumais, Head of Division of Terestrial Radioecology DR. Dadong Iskandar,
Head of Center for Technology of Radiation Safety and Metrology DR. Susilo
Widodo and his successor Drs. Trijoko Susilo, M.Sc. and Head of National Nuclear
Energy Agency of Indonesia Professor Djarot Sulistio Wisnubroto for giving
administrative permission to study in Japan. I am very thankful to DR. Tamotsu Wada,
Mr. Ryutaro Sakai, Mr. Yoshinori Hayashi, Ms. Minako Watanabe, Mr. Yuji Hiyama
and Mr. Takuya Hashimoto for their sharing, discussion and helps in any experiments
during this work. My truly thanks are for my Indonesian friends in Ibaraki University
and Japanese friends in our laboratory group for their kindly friendship. Last but not
least, I debt special thank to my parents, beloved wife, and children as well as
brothers and sisters for their continuous moral supports and prays. Their hopes and
conviction always give me zest and strength for finishing this study.

84
References
[1] M.Z.A. Munshi, Hand Book of Solid State Batteries and Capacitors, World
Scientific, Singapore, 1995.
[2] R. Haldik (ed.) Physic of Solid Electrolyte, Vol.1, Academic Press Inc. NY,
1985.
[3] D. Leroy and D. Ravaine, Acad. Sci., Paris, 286C, 1978.
[4] S. Chandra, Super ionic Solids: Principles and applications, North-Holand
Publishing Company, Amsterdam, 1981.
[5] A. Bunde, K. Funke and M.D. Ingram, Solid State lonics 105 (1998) 1-13.
[6] K. Funke and R.D. Banhatti, Solid State lonics 169 (2004) 1-8.
[7] B.V.R. Chowdari and P.P. Kumari, Solid State lonics 113-115 (1998) 665-675.
[8] F.A. Fusco and H.L. Tuller in: A.L. Lasker and S. Chandra (eds.), Superionic
Solids and Solid Electrolytes-Recent Trends, Academic Press, New York,
1989, pp. 43-110.
[9] G.V. Chandrasekar and M.W. Shafer, Ext. Abs. Electrochem. Soc., Seattle
Wash. (1978) 260-301.
[10] T. Takahashi and A. Kozawa (eds.), Applications of solid electrolytes, JEC
Press, Cleveland, 1980.
[11] T. Minami, J. Non-Cryst. Solids 73 (1985) 273-284.
[12] T. Makhsun, T. Sakuma and E. Kartini, IJISM 2 (2014) 204-206.
[13] C.R. Schlaikjer and C.C. Liang, in: W van Gool (eds.), Fast Ion Transport in
Solids, North Holand Publishing Co., Amsterdam, 1973, pp. 685-694.
[14] N. Machida, H. Yamamoto, S. Asano and T. Shigematsu, Solid State lonics
176 (2005) 473-479.
[15] M. Tatsumisago, S. Hama, A. Hayashi, H. Morimoto and T. Minami, Solid
State Ionics 154-155 (2002) 635-640.
[16] F. Mizuno, S. Hama. A. Hayashi. K. Tadanaga, T. Minami and M.
Tatsumisago, Chem. Lett. 31 (2002) 1244-1245.
[17] A. Hayashi, R. Komiya, M. Tatsumisago and T. Minami, Solid State Ionics
152-153 (2002) 285-290.
[18] S. Kohjiya, T. Kitade, Y. Ikeda, A. Hayashi. A. Matsuda, M. Tatsumisago and
T. Minami, Solid State Ionics 154-155(2002) 1-6.
85
[19] E. Kartini, T.Y.S.P. Putra, I. Kuntoro, T. Sakuma, K. Basar, O. Kamishima
and J. Kawamura, J. Phys. Soc. Jpn 79 (2010) 54-58.
[20] J.C Philips, J. Electrochem. Soc. 123 (1976) 934-940.
[21] J. N. Bradley and P.D. Greene, Trans. Faraday. Soc. 62 (1966) 2069-2075.
[22] B.B. Owens and G.R. Argue, Science 157 (1967) 308-310.
[23] D. Tran Qui, J.J. Capponi, M. Gondrand, M. Saib, J.C. Joubert and R.D.
Shannon, Solid State Ionics 3-4 (1981) 219-222.
[24] A.V. Belushkin, D.P. Koslenko, R.L. McGreevy, B.N. Savenko and P.
Zetterström, Physica B 269 (1999) 297-303.
[25] A. Matsuda, T. Kanzaki, K. Tadanaga, M. Tatsumisago and T. Minami, Solid
State Ionics 154-155 (2002) 687-692.
[26] K. Tadanaga, H. Yoshida, A. Matsuda, T. Minami, and M. Tatsumisago,
Electrochemistry 70 (2002) 998-1000.
[27] H. Feki, H. Khemakhem and Y. Abid, J. Phys.: Condens. Matter 13 (2001)
8509-8512.
[28] T. Takahashi, in: M.Z.A. Munshi (eds.), Handbook of Solid State Batteries
and Capacitors, World Scientific, Singapore, 1995, pp. 79-109.
[29] S. Long, D.R.M. Farlane and M. Forsyth, Solid State lonics 161 (2003) 105-
112.
[30] E. Kartini, T. Sakuma, K. Basar and M. Ihsan, Solid State Ionics 179
(2008) 706–711.
[31] W. Gorecki, R. Andreani, C. Bertheir, M. Armand, M. Mali, J. Ross and D.
Brinkmann, Solid State Ionics 18-19 (1986) 295-299.
[32] P.R. Sorensen and T. Jacobsen, Pol. Bull. 9 (1983) 47-51.
[33] M.C. Wintersgill, J.J. Fontanella, J.P. Calame, M.K. Smith, T.B. Jones, S.G.
Greenbaum, K.J. Adamić, A.N. Shetty and C.G. Andeen, Solid State Ionics
18-19 (1986) 326-331.
[34] X.G. Sun, W. Xu, S.S. Zhang and C.A. Angell, J. Phys.: Condens. Matter 13
(2001) 8235-8243.
[35] H. Mallick and A. Sarkar, Bull. Mater. Sci. 23 (2000) 319-324.
[36] T. Sasaki, A. Matsuda, T. Minami and M. Tatsumisago, J. Ceram. Soc., Jpn
110 (2002) 1005-1009.
[37] C.G. Shull, Rev. Mod. Phys. 67 (1995) 753–757.
86
[38] A.R. West, Basic Solid State Chemistry, Chickester, New York, 1999.
[39] T.E. Faber and J.M. Ziman, Phil. Mag. 11 (1965) 153-173.
[40] B.D. Cullity, Elements of X-Ray Diffraction, Addisson-Westley Pub. Co.,
Massachusetts, 1978.
[41] E.W. Nuffield, X-Ray Diffraction Method, Willey, New York , 1966.
[42] C. Wagner, J. Electrochem. Soc. 60 (1956) 4-10.
[43] B. Ilschner, J. Chem. Phys. 28 (1958) 1109-1115.
[44] R.B. Beeken and T. Sakuma, in: T. George (Eds.), Modern Topics in
Chemical Physics, Research Signpost, Trivandrum, 2002, pp. 353-372.
[45] T. Sakuma and J.O. Thomas, J. Phys. Soc. Jpn 62 (1993) 3127-3134.
[46] T. Sakuma, T. Aoyama, H. Takahashi, Y. Shimojo and Y. Morii, Physica B
213-214 (1995) 399-401.
[47] T. Sakuma, Y. Nakamura, M. Hirota, A. Murakami and Y. Ishii, Solid State
Ionics 127 (2000) 295-300.
[48] T. Sakuma, T. Shimoyama, K. Bashar, Xianglian, H. Takahashi, M. Arai and
Y. Ishii, Solid State Ionics 176 (2005) 2689-2693.
[49] K. Basar, S. Siagian, Xianglian, T. Sakuma, H. Takahashi and N. Igawa, Nucl.
Instrum. Methods Phys. Res. Sect. A 600 (2009) 237-239.
[50] Xianglian, K. Basar, H. Honda, T. Hojo, T. Sakuma and H. Takahashi,
Proceeding of the 10th Forum on Superionic Conductor Physics (2006) 55-58.
[51] T. Wada, T. Sakuma, R. Sakai, H. Uehara, Xianglian, H. Takahashi, O.
Kamishima, N. Igawa and S. A. Danilkin, Solid State Ionics 225 (2012) 18-21.
[52] Makhsun, T. Sakuma, E. Kartini, R. Sakai, H. Takahashi, N. Igawa and S.A.
Danilkin, Atom Indonesia 39 (2013) 8-12.
[53] S. Hoshino, J. Phys. Soc. Jpn 12 (1957) 315-326.
[54] T. Sakuma, J. Phys. Soc. Jpn 61 (1992) 4041-4048.
[55] F.C. Nix and W. Shockly, Rev. Mod. Phys. 10 (1938) 1-72.
[56] T. Sakuma, K. Basar, T. Shimoyama, D. Hosaka, Xianglian and M. Arai, Phys.
Solid State Ionics (2006) 323-346.
[57] E. Kartini, S.J. Kennedy, K. Itoh, T. Kamiyama, M.F. Collins and S. Suminta,
Solid State Ionics 167 (2004) 65-71.
[58] T. Sakuma, Bull. Electrochem. 11 (1995) 57-80.
[59] T. Suzuki, J. Phys. Soc. Jpn 15 (1960) 2018-2024.
87
[60] L.H.N. Rimmer, M.T. Dove, B. Winkler, D.J. Wilson, K. Refson and A.L.
Goodwin, cond-mat. mtrl-sci, arXiv:1402.1026v1 (2014).
[61] G. Artioli, M. Dapiaggi, P. Fornasini, A. Sanson, F. Rocca and M. Merli, J.
Phys. Chem. Solids 67 (2006) 1918-1922.
[62] M. Dapiaggi, H.J. Kim, E.S. Božin, S.J.L. Billinge and G. Artioli, J. Phys.
Chem. Solids 69 (2008) 2182-2186.
[63] H. Takahashi, N. Rikitake, T. Sakuma and Y. Ishii, Solid State Ionics 168
(2004) 93-98.
[64] M. Arai, T. Shimoyama, T. Sakuma, H. Takahashi and Y. Ishii, Solid State
Ionics 176 (2005) 2477-2480.
[65] T. Sakuma, Xianglian, N. Shimizu, S.R. Mohapatra, N. Isozaki, H. Uehara, H.
Takahashi, K. Basar, N. Igawa and O. Kamishima, Solid State Ionics 192
(2011) 54-57.
[66] F. Izumi and T. Ikeda, Mater. Sci. Forum 321-324 (2000) 198-203.
[67] A. Sanson, F. Rocca, G. Dalba, P. Fornasini, R. Grisenti, M. Dapiaggi and G.
Artioli, Phys. Rev. B 73, 214305 (2006) 1-13.
[68] T. Sakuma, S.R. Mohapatra, H. Uehara, R. Sakai, Xianglian, H. Takahashi, N.
Igawa and K. Basar, Atom Indonesia 36 (2010) 121-125.
[69] A.I. Frenkel and J.J. Rehr, Phys. Rev. B 48 (1993) 585-588.
[70] B.J. Kennedy, Y. Kubota and K. Kato, Solid State Commun. 136 (2005) 177-
180.
[71] C.B. Walker, Phys. Rev. 103 (1956) 547-557.
[72] G. Gilat and R. M. Nicklow, Phys. Rev. 143 (1966) 487-494.
[73] O. Kamishima, T. Ishii, H. Maeda, and S. Kashino, Jpn. J. Appl. Phys. 36
(1997) 247-253.
[74] A. Yoshiasa, K. Koto, H. Maeda, and T. Ishii, Jpn. J. Appl. Phys. 36 (1997)
781-784.
[75] J.P. Malugani, A. Wasniewski, M. Doreau and A. Al Rikabi, Mat. Res. Bull.
13 (1978) 427-433.
[76] C.R. Mariapan and G. Govindaraj, Physica B 353 (2004) 65-74.
[77] P. Maas, J. Non-Cryst. Solids 255 (1999) 35-46.
[78] P.D. Singh, K. Shahi and K.K. Kar, Solid State Ionics 231 (2013) 102-108.
[79] T. Ishii and O. Kamishima, J. Phys. Soc. Jpn 68 (1999) 3580-3584.

88
[80] C.S. Sunandana and P.S. Kumar, Bull. Mater. Sci. 27 (2004) 1-5.