Embed Size (px)
Citation preview

urostat
BULLETIN GY PRICES
A survey of import and consumer prices for oil, gas and electricity
in the Community up to January 1988
S PRIX DE L'ÉNERGIE Un aperçu des prix à l'importation et à la consommation
des produits pétroliers, du charbon, du gaz et de l'électricité à l'intérieur de la Communauté
mis à jour jusqu'au mois de janvier 1988

eurostat
OFICINA ESTADÍSTICA DE LAS COMUNIDADES EUROPEAS DE EUROPÆISKE FÆLLESSKABERS STATISTISKE KONTOR STATISTISCHES AMT DER EUROPÄISCHEN GEMEINSCHAFTEN ΣΤΑΤΙΣΤΙΚΗ ΥΠΗΡΕΣΙΑ ΤΩΝ ΕΥΡΩΠΑΪΚΩΝ ΚΟΙΝΟΤΗΤΩΝ STATISTICAL OFFICE OF THE EUROPEAN COMMUNITIES OFFICE STATISTIQUE DES COMMUNAUTÉS EUROPÉENNES ISTITUTO STATISTICO DELLE COMUNITÀ EUROPEE BUREAU VOOR DE STATISTIEK DER EUROPESE GEMEENSCHAPPEN SERVIÇO DE ESTATÍSTICA DAS COMUNIDADES EUROPEIAS
L-2920 Luxembourg - Tél. 43011 - Télex : Comeur Lu 3423 B-1049 Bruxelles, bâtiment Berlaymont, rue de la Loi 200 (bureau de liaison) - Tél. 2351111
BULLETIN OF ENERGY PRICES A survey of import and consumer prices for oil, gas and electricity in the Community up to January 1988
Manuscript completed in November 1988
BULLETIN DES PRIX DE L'ENERGIE Un aperçu des prix à l'importation et à la consommation des produits pétroliers, du charbon, du gaz et de l'électricité à l'intérieur de la Communauté mis à jour jusqu'au mois de janvier 1988
Manuscrit terminé en novembre 1988


TABLE OF CONTENTS / TABLE DES MATIERES
Page
1.INTRODUCTION 5
2. STATISTICAL TABLES / TABLEAUX STATISTIQUES
I.
Tab. 1 Average cif value of Community supply of crude oil 11 Valeur caf moyenne de l'approvisionnement en pétrole brut de la Communauté
Tab. 2 Average cif value of Community imports of power station coal 12 Valeur caf moyenne du charbon importé pour centrales électriques de la Communauté
Tab. 3 Average cif value of Community imports of coking coal 13 Valeur caf moyenne du charbon à coke importé dans la Communauté
II.
Tab. 4-19 Final consumer prices of energy in January 1988 in national currencies, ECU and PPS 14 Prix à la consommation finale de l'énergie en Janvier 1988 en monnaies nationales, ECU et SPA
III.
Tab. 20-47 Final consumer prices of energy in national currencies 1980-1988 22 Prix à la consommation finale d'énergie en monnaies nationales 1980-1988
IV.
Tab. 48-51 Comparison between supplied energy prices -Industrial and household sector 50 Comparaison entre les prix de l'énergie finale -Secteurs industriel et domestique

Tab. 52-59 Comparison between useful energy prices -
Industrial and household sector
Comparaison entre les prix de l'énergie utile
secteurs industriel et domestique
54
Tab. 60 Incidence of taxation
Incidence de la fiscalité
6Γ
3. ANNEXES
Annex I
Annexe I
Notes on sources and methods
Note concernant les sources et la méthodologie
Annex II : Conversion tables
Annexe II: Tables de conversion
61
05
69
ABBREVIATIONS AND SYMBOLS USED / ABREVIATIONS ET SIGNES EMPLOYES
ECU EUROPEAN CURRENCY UNIT - UNITE MONETAIRE EUROPEENNE
GCV GROSS CALORIFIC VALUE
GJ GIGAJOULE (106 KILOJOULE)
GWh GIGAWATT HOUR (106 kWh) - GIGAWATT HEURE (10
6 kWh)
HSC HIGH SULPHUR CONTENT
HTS HAUTE TENEUR EN SOUFRE
NCV NET CALORIFIC VALUE
PCI POUVOIR CALORIFIQUE INFERIEUR
PCS POUVOIR CALORIFIQUE SUPERIEUR
PPS PURCHASING POWER STANDARD
SPA STANDARD DE POUVOIR D'ACHAT
TCE TON OF COAL EQUIVALENT
TEC TONNE EQUIVALENT CHARBON
TVA TAXE A LA VALEUR AJOUTEE
VAT VALUE ADDED TAX
TOE TON OF OIL EQUIVALENT
TEP TONNE EQUIVALENT PETROLE

1. INTRODUCTION
The Statistical Office of the European Communities collects and publishes a wide range of information on energy prices in the Member States. The aim of this bulletin is to summarize as succinctly as possible the recent price information for all the principal energy sources. It is therefore deliberately confined to trends up to the date at which information for all these energy sources is available. More recent prices for particular sources can be found in the specialist press and notably in the Commission's weekly Oil Price Bulletin.
We have tried to select from the vast store of information available data concering the most significant types of consumer for each energy sector. We have not, however, been able, in such a condensed publication, to give a full picture of the whole complex of structure and tariffs, the extent of their regional variations within individual countries or the price differentials created by the quantities contracted, and other contractual conditions. Great care must be exercised in interpreting these data, particularly that on energy used by industry. The prices given for industrial sectors usually concern small to medium-sized industrial users and are not necessarily representative of the prices paid by highly energy-intensive industries. This bulletin should hence be treated as a guide rather that a means of establishing a strict comparison of prices between Member States.
The Bulletin of Energy Prices is published twice a year indicating two series of consumer prices for January and July, except natural gas where only January prices are available.
L'Office Statistique des Communautés Européennes recueille et publie de nombreuses informations sur les prix de l'énergie dans les Etats membres. Le but de ce bulletin est de rassembler de la manière la plus synthétique possible des informations récentes de prix couvrant l'ensemble des principales sources d'énergie. Il se limite par conséquent à l'évolution observée jusqu'au moment où les informations pour toutes ces sources sont disponibles. Pour certaines sources d'énergie, le lecteur intéressé trouvera des données de prix plus actuelles dans les publications spécialisées, et en particulier, dans le "bulletin Pétrolier", hebdomadaire de la Commission.
Nous avons tenté de sélectionner, parmi les multiples données disponibles, les informations, concernant les consommateurs, les plus significatives de chaque secteur énergétique. Il n'est toutefois pas possible dans un document aussi concentré de refléter totalement la grande complexité des sturetures des prix et des tarifs, l'étendue de leurs variations régionales à l'intérieur d'un même pays où les différences des prix liées aux quantités contractées et autres conditions contractuelles. L'interprétation de ces données, notamment de celles qui concernent l'énergie utilisée à des fins industrielles, exige une grande prudence. Les prix indiqués pour les secteurs industriels concernent en général des utilisations de petite et moyenne taille et ne sont pas nécessairement représentatifs de prix payés par l'industrie à forte intensité en énergie. Pour toutes ces raisons, ce bulletin constitue plutôt un guide qu'un instrument permettant une comparaison stricte entre les différents Etats membres.
Le Bulletin des Prix de l'Energie est publié semestriellement et comprend deux séries de prix à la consommation pour les mois de janvier et juillet, à l'exception du gaz naturel pour lequel les prix du mois de janvier sont uniquement disponibles.

PRIX A L'IMPORTATION IMPORT PRICES - CIF (Moyennes trimestrielles US$/GJ
- CAF - Communauté - Community - Quarterly averages)
1978 1979 1980 1981 1982 1983 1984 1985 1986 1987 1988
Ρ —. o
-¡ I
D
c D
A
-ι O
o Ζ.
Λ
I
0 -
ECU/G, J
I
Graph. 2
Che Povi
^
I
I I
r^ >ude < >il
rbon pour centrales electric
.·········· ,. ...
> · . . . . · · · · " · · ,
j | u e s
*·-> ' ■ - - - · ,
■ · - · · . . . .
1978 1979 1980 1981 1982 1983 1984 1985 1986 1987 1988

90
80
PRIX A L'IMPORTATION IMPORT PRICES - CIF (Moyennes trimestrielles ■ us S/W - us $ A»
- CAF — Communauté Community
Quarterly averages)
EZI Graph. 3
Charbon a coke Coking cod
50
40
30
Charbon pour centrales électriques Power station coal
I I I
1980 1978 1982 1984 1986 1988
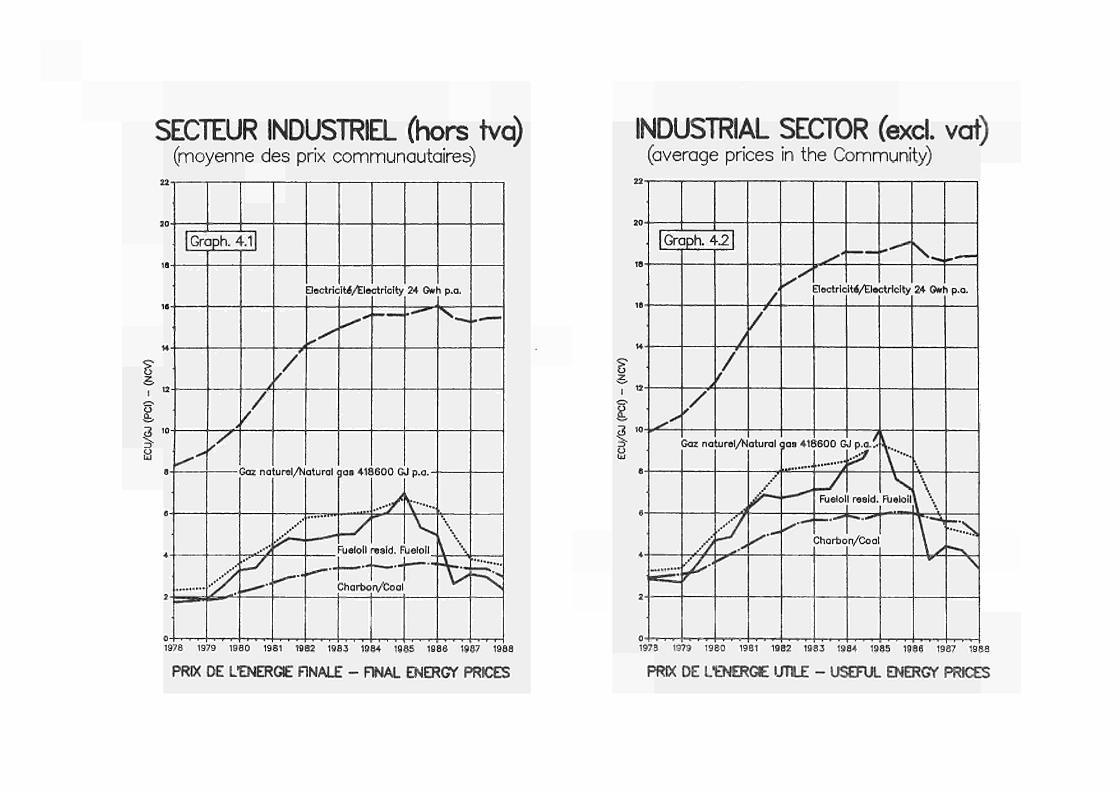
SECTEUR INDUSTRIEL Chors tva) (moyenne des prix communautaires)
1978 1979 1980 1981 1982 1983 1984 1985 1986 1987 1988
PRIX DE UENERGE FINALE - FINAL ENERGY PRICES
INDUSTRIAL SECTOR (excl. vat) (average prices in the Community)
0 {"1 ' T T T ι ι Ι ι ι ι | r ι f |™ ι ι ι I -r ι r 4 '* '»' *"\ ' ' ι 'r^' '' < I l'i"*·' 1978 1979 1980 1981 1982 1983 1984 1985 1986 1987 1988
PRIX DE UENERGE UTILE - USEFUL ENERGY PRICES

SECTEUR DOMESTIQUE (taxes inci) (moyenne des prix communautaires)
2
O
a.
o UJ
Groph. 5.1
/ V
y'
Electricité/tlectricity 13000 Kwh p.a.
Goz natural/Natural gae '125.6 GJp.a
0 +"ï—■ | ■ ■ I 1 I I I | I I I | I I I | I | I ¡ | I 1 | I I I ¡ I j I | I I -t—
1978 1979 1980 '981 1982 1983 1964 <985 1986 19S7 19S3
PRIX DE L'ENERGIE HNALE - FiNAL hERGY PRICE »sis
HOUSEHOLD SECTOR (taxes ind) (average prices in the Community)
1978 1979 1980 1 '81 1082 1883 1384 1985 1S86 1987 1988
PRIX DE LOÆRGC UTILE - USEFUL ENERGY PRICES

EVOLUTION DES TENDANCES DES PRIX REHS DE LENEROE
1980=100
1978 1979 1980 1981 1982 1983 1984 1985 1986 1987 1988
SECTEUR NDUSTREL - INDUSTRIAL SECTOR ELECTRICrTE/ELECTRICITY 24 GWH P.A.
- GAZ NATUREL/NATURAL GAS 418600 GJ P.A.
FUELOIL RESIDUEiyRESIDUAL FUELOIL
CHARBOfVCOAL
TRENDS OF REAL PRICES OF ENERGY 1980=100
180
ιβο
1978 1979 1980 1981 1982 1983 1984 1985 1986 1987 1988
SECTEUR DOMESTIQUE - HOUSEHOLD SECTOR ELECTRICrTE/ELECTRICrrY 13000 KWH ΡΛ.
GAZ NATUREL/NATURAL GAS 125.6 GJ P.A.
GASOIL DE CHAUFFAGE/HEAT1NG GASOIL
CHARBOH/COAL

TAB. 1 VALEUR C.A.F. MOYENNE DE L'APPROVISIONNEMENT EN PETROLE BRUT DE LA COMMUNAUTE AVERAGE CI.Γ. VALUE OF COMMUNITY SUPPLIES OF CRUDE OIL'
ANNEE/TRIM YEAR/QUART
1978 1979 1980 1981 1982 1983 1984 1985 1986 1987
1980 1980 1980 1980 1981 1981 1981 1981 1982 1982 1982 1982 1983 1983 1983 1983 1984 1984 1984 1984 1985 1985 1985 1985 1986 1986 1986 1986 1987 1987 1987 1987
1 · 2 3 4 1 2 3 4 1 2 3 4 1 2 3 4 1 2 3 4 1 2 3 4 1 2 3 4 1 2 3 4
S/BBL
13.80 19.43 32.80 36.52 33.85 30.05 29.00 27.59 14.42 17.87
30.56 32.45 33.85 34.92 37.44 37.39 35.65 35.62 35.10 32.97 33.57 33.69 31.81 29.34 29.61 29.56 29.39 29.60 28.63 28.30 27.86 27.57 26.74 28.00 20.56 12.74 11.33 13.40 17.12 17.98 18.60 17.78
INDICE [NDEX 78=100 100 140 237 264 245 217 210 199 104 129
221 235 245 253 271 270 258 258 254 238 243 244 230 212 214 214 212 214 207 205 201 199 193 202 148 92 82 97 124 130 134 128
S/TEP S/TOE
101.78 143.39 242.29 269.77 249.81 222.22 214.89 204.72 107.14 132.24
225.72 240.56 249.94 257.20 276.98 275.90 262.58 263.52 259.91 243.82 245.78 249.52 235.97 216.05 219.23 218.67 218.21 219.16 211.83 209.96 206.88 205.13 198.70 206.80 152.67 94.70 83.88 99.99 126.69 133.05 137.64 131.57
INDICE ECU/GJ INDEX
78=100 1.91 2.50 4.16 5.77 6.09 5.96 6.51 6.41 2.60 2.74
3.82 4.13 4.20 4.58 5.37 5.91 6.07 5.78 5.99 5.81 6.18 6.38 5.95 5.66 6.09 6.19 6.27 6.35 6.58 6.85 7.22 6.75 6.05 5.79 3.95 2.36 1.98 2.30 2.69 2.76 2.91 2.59
100 131 218 302 319 312 341 336 136 143
200 216 220 240 281 309 318 303 314 304 323 334 311 297 319 324 328 332 345 359 378 353 317 303 207 124 104 120 141 145 153 136

TAB. 2 VALEUR C.A.F. MOYENNE DU CHARBON IMPORTE (*) POUR CENTRALES ELECTRIQUES DE LA COMMUNAUTE
AVERAGE C.I.F. VALUE OF COMMUNITY IMPORTS (*) OF POWER STATION COAL
ANNEE/ TRIM
YEAR/ QUART
1978 1979 1980 1981 1982 1983 1984 1985 1986 1987
1980 1980 1980 1980
1981 1981 1981 1981
1982 1982 1982 1982
1983 1983 1983 1983
1984 1984 1984 1984
1985 1985 1985 1985
1986 1986 1986 1986
1987 1987 1987 1987
1 2 3 4
1 2 3 4
1 2 3 4
1 2 3 4
1 2 3 4
1 2 3 4
1 2 3 4
1 2 3 4
USA
57.8 53.9 52.2
59.9 59.5 55.8 56.7
53.1 54.2 53.6 55.0
50.9 53.1 52.6 51.7
AFR.SUD STH. APR
46.7 41.9 37.7
46.4 47.2 45.4 47.8
44.1 42.9 40.9 39.9
39.9 36.1 36.5 37.7
AUSTRAL POLOGNE AUSTRAL POLAND
$/TEC
COLOMB. AUTRES OTHERS
S/TCE
51.5 47.9 42.0
ι
50.6 50.7 52.8
: 51.6
55.1 50.8 47.7 43.4
42.0 43.5 40.5 42.3
53.4 55.9 45.9
'
i
51.6 52.6 52.8 56.1
56.2 : 55.8
I 46.4 i 46.0 ¡ 44.6
46.9
46.6 38.5
¡
:
\ 46.8
45,6
41.1
35.6
:
52.7 47.3 40.7
53.2 52.9 50.7 55.6
51.2 49.6 52.7 49.0
43.1 40.4 38.8 38.8
TOTAL TOTAL
S/TEC
PAYS TIERS THIRL COUNTRIES
INDICE S/TCE INDEX
38.9 43.8 58.0 71.1 69.3 57.6 51.0 51.6 48.2 43.1
53.7 55.9 59.4 63.1
68.9 72.9 70.4 72.0
70.6 71.4 69.7 66.3
61.4 57.8 55.1 56.2
52.0 51.1 51.0 49.8
51.0 52.3 50.6 52.5
50.2 49.4 47.8 45.8
43.2 44.0 42.5 42.6
78=100
100 113 149 183 178 148 131 133 124 111
138 144 153 162
177 187 181 185
181 184 179 170
158 149 142 144
134 131 131 128
131 134 130 135
129 127 123 118
111 113 109 110
ECU/GJ
1.04 1.09 1.42 2.17 2.41 2.21 2.21 2.31 1.67 1.27
1.30 1.37 1.42 1.60
1.91 2.23 2.33 2.26
2.33 2.43 2.50 2.4£
2.21 2.16 2.18 2.27
2.13 2.11 2.26 2.32
2.54 2.46 2.20 2.10
1.86 1.76 1.61 1.51
1.31 1.31 1.29 1.20
INDICE INDEX 78-Λ00
100 104 136 208 231 212 212 222 160 122
125 131 136 153
183 214 224 217
224 233 240 232
212 207 209 218
204 202 217 223
244 236 211 201
178 169 154 145
125 125 124 115
(*) La ventilation par provenance n'est disponible qu'à partir de 1985 Breakdown by origin only available since 1985

TAB. 3 VALEUR C . A . F . MOYENNE DU CHARBON A COKE IMPORTE DANS LA COMMUNAUTE
AVERAGE C I . F . VALUE OF COMMUNITY IMPORTS OF COKING COAL
ANNEE/TRIM YEAR/QUART
1978 1979 1980 1981 1982 1983 1984 1985 1986
1980 1980 1980 1980
1981 1981 1981 1981
1982 1982 1982 1982
1983 1983 1983 1983
1984 1984 1984 1984
1985 1985 1985 1985
1986 1986 1986 1986
1987 1987 1987 1987
1988
1 2 3 4
1 2 3 4
1 2 3 4
1 2 3 4
1 2 3 4
1 2 3 4
1 2 3 4
1 2 3 4
1
PRIX INDICATIF INDICATIVE PRICE
$/T INDICE STANDARD INDEX
78=100 (A) (B) (BT
61.9 100 65.3 105 69.2 112 81.7 132 81.4 132 69.6 112 65.0 105 62.4 101 58.5 95
68.5 111 69.0 111 69.2 112 69.9 113
75.7 122 80.1 129 84.4 136 86.6 140
82.5 133 82.2 133 81.2 131 79.7 129
76.3 123 69.0 111 67.1 108 66.0 107
66.2 107 65.0 105 64.5 104 64.3 104
62.8 101 62.7 101 62.2 100 61.9 100
61.9 100 58.2 94 57.1 92 56.9 92
53.3 56.7 92 50.1 53.2 86 49.8 52.9 85 50.3 53.4 86
51.3 54.5 88
$/TEC S/TCE
(A) (B)
58.4 61.5 65.1 76.9 76.6 65.5 61.2 58.8 55.1
64.5 65.0 65.2 65.9
71.3 75.4 79.4 81.5
77.6 77.4 76.5 75.1
71.8 64.9 63.1 62.1
62.3 61.2 60.7 60.6
59.1 59.0 58.2 58.3
58.3 54.8 53.8 53.5
53.3 53.4 50.0 50.1 49.6 49.8 50.2 50.3
51.2 51.3
PRIX INDICATIF INDICATIVE PRICE
ECU/T INDICE STANDARD INDEX
78=100 (Α) (Β) M
48.6 100 47.6 98 49.7 102 73.2 151 83.1 171 78.2 161 82.4 170 81.8 168 59.4 122
48.5 100 49.6 102 48.6 100 52.1 107
61.4 126 71.8 148 81.7 168 79.5 164
79.6 164 82.0 169 85.4 176 85.4 176
80.5 166 75.7 156 78.0 160 78.2 161
79.6 164 78.8 162 83.9 173 87.8 181
91.7 189 86.4 178 79.3 163 72.6 149
67.1 138 60.7 125 56.4 116 54.8 113
47.4 50.4 104 43.6 46.3 95 44.1 46.9 96 41.4 44.0 91
41.6 44.2 91
(A) Nouvelle base de q u a l i t é , (B) ancienne base de qua l i té (voir notes méthodologiques en Annexe 1)
(A) New qual i ty base, (B) old qual i ty base (see notes on methodology m Annex 1)

TAB. 4 FUEL-OIL RESIDUEL (HTS) RESIDUAL FUEL OIL (HSC)
PRIX PAR TONNE PRICES PER TONNE
JANVIER 1988
JANUARY
| DEUTSCHLAND (DM)
I FRANCE (FF)
I ITALIA (LIRE)
1 NEDERLAND (FL)
1 BELGIQUE (FB)
1 LUXEMBOURG (FL)
1 UNITED KINGDOM (6)
1 IRELAND (IR¿)
1 DANMARK (DK) (Χ)
I HELLAS (DRS)
1 ESPANA (PES)
1 PORTUGAL (ESC)
MONNAIES NATIONALES
HORS TAXES
HORS TVA
TAXES COMPRISES
NATIONAL CURRENCIES
TAX
EXC
176.00
492.00
107600.
232.00
3238.00
3856.00
62.00
86.71
760.00
10547.00
9904.00
22222.00
VAT EXC
191.00
621.00
117600.
268.20
3238.00
3956.00
69.82
94.67
760.00
24138.00
14286.00
23355.00
WITH TAXES
217.74
736.51
128184.00
321.84
3788.00
4193.00
69.82
104.14
3342.80
25586.00
16000.00
25003.00
HORS TAXES
TAX EXC
85.02
70.59
70.84
100.00
74.97
89.28
89.86
111.17
95.84
64.07
70.62
131.60
HORS TAXES TVA COMPRISES
ECU
VAT EXC
92.27
89.10
77.42
115.60
74.97
91.60
101.19
121.37
95.84
146.63
101.87
138.31
WITH TAXES
105.19
105.67
84.39
138.72
87.71
97.08
101.19
133.51
421.54
155.42
114.09
148.07
HORS TAXES
TAX EXC
89.34
83.25
93.73
124.73
91.47
114.76
131.91
145.00
91.68
117.19
114.50
321.59
SPA
HORS TAXES TVA COMPRISES I
PPS
VAT EXC
96.95
105.08
102.44
144.19
91.47
117.74
148.55
158.31
91.68
268.20
165.16
337.99
WITH TAXES
110.53 I
124.62 |
111.66 |
173.03 |
107.01 |
124.79 I
148.55 |
174.15 I
403.23 |
284.29 I
184.97 |
361.84 I
(X) LE PRIX HORS TVA HE COMPREND PAS LA TAXE SPECIALE DEDUCTIBLE DE".
THE PRICE EXCL. VAT DOES HOT INCLUDE THE DEDUCTIBLE SPECIFIC TAX OF:
1980 DKR/TONNE 1980 ,,
TAB. 5
JANVIER
JANUARY
GASOIL CHAUFFAGE HEATING GASOIL
PRIX PAR 1000 LITRES PRICES PER 1000 LITRES
1988
! MONNAIES NATIONALES
! HORS HORS TAXES TAXES TVA COMPRISES
NATIONAL CURRENCIES
TAX VAT WITH EXC EXC TAXES
HORS TAXES
TAX EXC
HORS TVA
ECU
VAT EXC
TAXES COMPRISES
WITH TAXES
HORS TAXES
TAX EXC
SPA
HORS TVA
PPS
VAT EXC
! 1
TAXES I
COMPRISES I
WITH TAXES |
DEUTSCHLAND (DM)
FRANCE tFF)
ITALIA (LIRE)
NEDERLAHD (FL)
BELGIQUE (FB)
LUXEMBOURG (FL)
UNITED KINGDOM (¿)
IRELAND (IR/)
DAHMARK (DK)
HELLAS (DRS)
ESPANA (PES)
271
1205
215600
334
5974
7030
111
152
1364
19975
22620
.00
.00
.00
.00
.00
.90
.98
.50
.00
.00
287.80
1588.00
530847.
458.00
5974.00
7030.00
122.90
190.27
3189.00
27574.00
30357.00
328.09
1883.00
626400.00
550.00
6990.00
7450.00
122.90
209.30
3890.00
37500.00
34000.00
130.92
172.88
141.94
143.97
138.32
162.77
162.17
196.13
172.07
121.34
161.29
139.03
227.83
349.48
197.41
138.32
162.77
178.12
243.94
402.14
167.50
216.46
158.50
270.16
412.38
237.07
161.84
172.49
178.12
268.33
490.54
227.80
242.44
137.56
203.89
187.80
179.57
168.76
209.23
238.09
255.82
164.60
221.94
261.50
146.09
268.70
462.41
246.24
168.76
209.23
261.49
318.18
384.68
306.38
350.95
166.54
318.61
545.64
295.70
197.46
221.73
261.49
350.00
469.24
416.67
393.06

TAB. 6 GASOIL ROUTIER AUTOMOTIVE DIESEL
PRIX PAR 1000 LITRES PRICES PER 1000 LITRES
JANVIER JANUARY
1988 MONNAIES NATIONALES
HORS TAXES
HORS TVA
TAXES COMPRISES
NATIONAL CURRENCIES TAX EXC
VAT EXC
WITH TAXES
HORS TAXES
TAX EXC
HORS TVA ECU
VAT EXC
TAXES COMPRISES
WITH TAXES
HORS TAXES
TAX EXC
SPA HORS TVA PPS
VAT EXC
TAXES COMPRISES
WITH TAXES
DEUTSCHLAND (DM) FRANCE (FF) ITALIA (LIRE) NEDERLAND (FL) BELGIQUE (FB) LUXEMBOURG (FL) UNITED KINGDOM (JÍ) IRELAND (IR*) DANMARK (DK) HELLAS (DRS) ESPAHA (PES) PORTUGAL (ESC)
442 1200
268650 400
7878 7660 131 186
1725 19975 26764 34776
00 772.11 00 2689.71
583898. 00 687.50 00 13128.00 00 11964.00 20 295.13
402.27 3557.38
27574.00 51875.00
17 94 00 00 00 68519.00
880.20 3190.00
689000.00 825.00
16410.00 13400.00
339.40 502.84
4340.00 37500.00 58000.00 74000.00
213.53 172.17 176.86 172.41 182.40 177.36 190.14 238.68 217.65 121.34 190.84 205.95
373.00 385.90 384.41 296.34 303.96 277.01 427.72 515.73 448.60 167.50 369.90 405.77
425.22 457.68 453.59 355.60 379.95 310.26 491.88 644.67 547.29 227.80 413.58 438.23
224.37 203.05 234.02 215.05 222.54 227.98 279.15 311.32 208.20 221.94 309.41 503.27
391.93 455.11 508.62 369.62 370.85 356.07 627.94 672.69 429.12 306.38 599.71 991.59
446 539 600 443 463 398 722 840 523 416 670 1070
80 76 17 55 56 81 13 87 .52 .67 .52 .91
TAB. 7 ESSENCE SUPER PREMIUM GASOLINE
PRIX PAR 1000 LITRES PRICES PER 1000 LITRES
JANVIER 1988
JANUARY
MONNAIES NATIONALES HORS HORS TAXES TAXES TVA COMPRISES
NATIONAL CURRENCIES TAX VAT WITH EXC EXC TAXES
HORS TAXES
TAX EXC
HORS TVA
ECU VAT EXC
TAXES COMPRISES
WITH TAXES
HORS TAXES
TAX EXC
SPA HORS TVA
PPS VAT EXC
TAXES COMPRISES
WITH TAXES
DEUTSCHLAND (DM) FRANCE (FF) ITALIA (LIRE) NEDERLAND (FL)
1 BELGIQUE (FB) I LUXEMBOURG (FL) 1 UNITED KINGDOM lil
1 IRELAND (IRA*) 1 DANMARK (DK) 1 HELLAS (DRS) | ESPANA (PES) 1 PORTUGAL (ESC)
316.00 1050.00
845.79 3937.61
964.20 4670.00
276740. 1144068. 1350000.00 404.00
7848.00 8160.00 126.10 164.54 1416.47
20908.00 26222.00 36956.00
1250.00 19048.00 18125.00
319.91 445.24 5221.31
56618.00 69643.00 110185.00
1500.00 23810.00 20300.00
367.90 556.55
6370.00 77000.00 78000.00 119000.00
152.66 150.65 182.19 174.14 181.71 188.93 182.75 210.95 178.62 127.01 186.98 218.86
408.59 564.94 753.17 538.79 441.03 419.66 463.64 570.82 658.42 343.93 496.60 652.52
465.80 670.01 888.74 646.55 551.29 470.02 533.19 713.53 803.28 467.74 556.19 704.73
160.41 177.66 241.06 217.20 221.69 242.86 268.30 275.15 170.86 232.31 303.14 534.82
429.34 u,— .26 995.57 672.04 538.08 539.43 680.66 744.55 629.83 629.09 805.12 1594.57
489.44 790.19 1175.96 806.45 672.60 604.17 782.77 930.69 768.40 855.56 901.73
1722.14
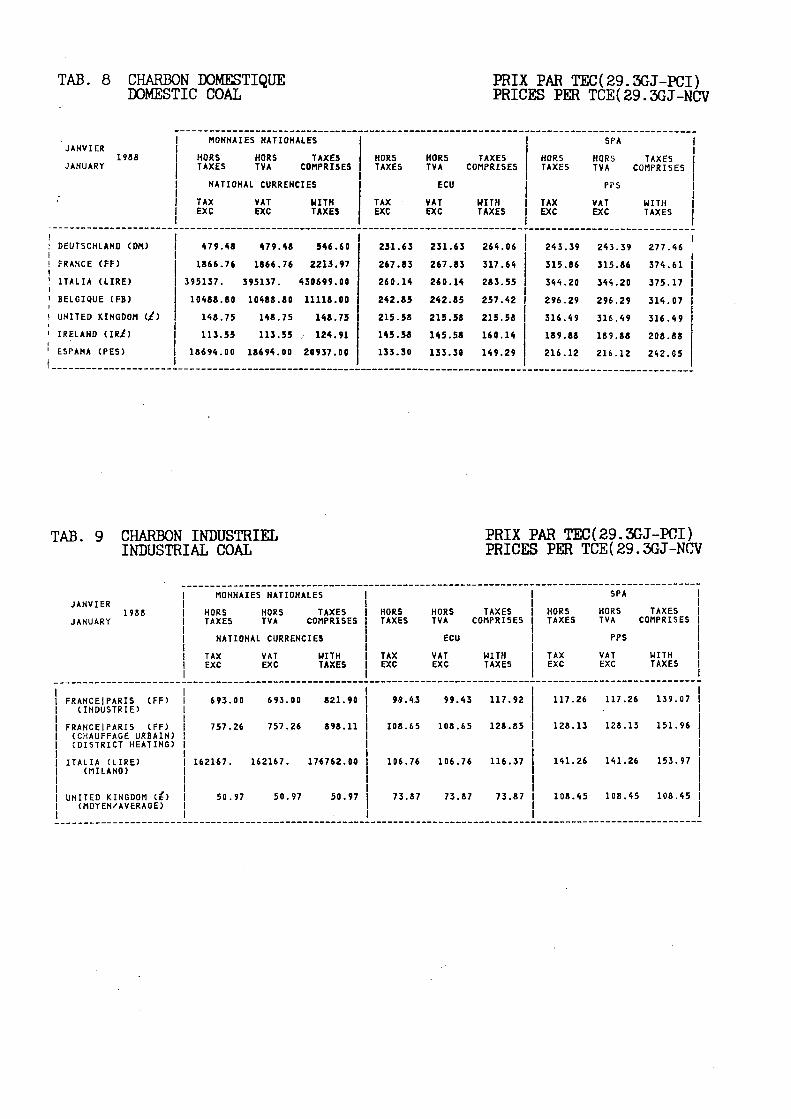
TAB. 8 CHARBON DOMESTIQUE DOMESTIC COAL
PRIX PAR TEC(29.3GJ-PCI) PRICES PER TCE(29.3GJ-NCV
JANVIER 1988
JANUARY
MONNAIES NATIONALES HORS HORS TAXES TAXES TVA COMPRISES
NATIONAL CURRENCIES TAX VAT WITH EXC EXC TAXES
HORS TAXES
TAX EXC
HORS TVA
ECU VAT EXC
TAXES COMPRISES
WITH TAXES
HORS TAXES
TAX EXC
SPA HORS TVA
PPS VAT EXC
TAXES COMPRISES
WITH TAXES
1 1 DEUTSCHLAHD (DM) ! FRANCE (FF) ' ITALIA (LIRE) I BELGIQUE (FB) ! UNITED KIHGDOM i l i
< IRELAND (IRjf) 1 ESPANA (PES) t
479.48 1866.76
395137. 10488.80
148.75 113.55
18694.00
479.48 1866.76
395137. 10488.80
148.75 113.55
18694.0 0
546.60 2213.97
430699.00 11118.00
148.75 . 124.91 20937.00
231.63 267.83 260.14 242.85 215.58 145.58 133.30
231.63 267.83 260.14 242.85 215.58 145.58 133.30
264.06 317.64 283.55 257.42 215.58 160.14 149.29
243.39 315.86 344.20 296.29 316.49 189.88 216.12
243.39 315.86 344.20 296.29 316.49 189.88 216.12
I 277.46 374.61 375.17 314.07 316.49 208.88 242.05
TAB. 9 CHARBON INDUSTRIEL INDUSTRIAL COAL
PRIX PAR TEC(29.3GJ-PCI) PRICES PER TCE(29.3GJ-NCV
JANVIER 1988
JANUARY
I FRANCEIPARIS (FF) (INDUSTRIE)
I FRANCEIPARIS (FF) | (CHAUFFAGE URBAIN)
(DISTRICT HEATING) 1 ITALIA (LIRE)
(MILANO)
1 UNITED KINGDOM (£) (MOYEN/AVERAGE)
MONNAIES NATIONALES HORS HORS TAXES TAXES TVA COMPRISES
NATIONAL CURRENCIES TAX VAT WITH EXC EXC TAXES
693.00 693.00 821.90
757.26 757.26 898.11
162167. 162167. 176762.00
50.97 50.97 50.97
HORS TAXES
TAX EXC
99.43
108.65
106.76
73.87
HORS TAXES TVA COMPRISES ECU
VAT EXC
99.43
108.65
106.76
73.87
WITH TAXES
117.92
128.85
116.37
73.87
HORS TAXES
TAX EXC
117.26
128.13
141.26
108.45
SPA HORS TAXES TVA COMPRISES I PPS
VAT EXC
117.26
128.13
141.26
108.45
WITH TAXES
139.07
151.96
153.97
108.45

TAB. 10 ELECTRICITE DOMESTIQUE-1700 KWH PAR AN DOMESTIC ELECTRICITY-1700 KWH PER YEAR
PRIX PAR KWH PRICES PER KWH
JANVIER JANUARY
1988 MONNAIES NATIONALES
HORS TAXES
HORS TVA
TAXES COMPRISES
NATIONAL CURRENCIES TAX EXC
VAT EXC
WITH TAXES
HORS TAXES
TAX EXC
HORS TV*
ECU VAT EXC
TAXES COMPRISES
WITH TAXES
HORS TAXES
TAX EXC
SPA HORS TVA
PPS VAT EXC
TAXES COMPRISES
HITH TAXES
DEUTSCHLAND (PF) (HAMBURG)
FRANCE (CENT.) (PARIS)
ITALIA (LIRE) (SETTEHTR.+CENTR.)
NEDERLAHD (CENT.) (ROTTERDAM)
BELGIQUE (FB) LUXEMBOURG (FL) U.K. (PENCE) (LONDON)
IRELAND (PEHCE) (DUBLIN)
DANMARK (ORE) (MOYENNE/AVERAGE)
HELLAS (DRS) ESPANA (PES) PORTUGAL (ESC)
28.54
72.42
112.02
22.86
5.90 5.29 7.33
8.74
59.16
12.06 15.53 16.13
0.00
78.87
120.18
22.86
5.90 5.29 7.33
8.74
91.66
12.06 15.53 16.13
35.17
93.54
131.00
27.43
6.90 5.61 7.33
8.74
111.83
13.99 17.39 16.13
0.1379
0.1039
0.0737
0.0985
0.1366 0.1225 0.1062
0.1121
0.0746
0.0733 0.1107 0.0955
0.0000
0.1132
O.0791
0.0985
0.1366 0.1225 0.1062
0.1121
0.1156
0.0733 0.1107 C.0955
I 0.1699 I
0.1342
0.0862
0.1182
0.1598 0.1279 0.1062
0.1121
0.1410
0.0850 9.1240 0.0955
0.1449
0.1225
0.0976
0.1229
0.1667 0.1574 0.1560
0.1462
0.0714
0.1340 0.1795 0.2334
0.0000
0.1335
0.1047
0.1229
0.1667 0.1574 0.1560
0.1462
0.1106
0.1340 0.1795 0.2334
0.1785
0.1583
0.1141
0.1475
0.1949 0.1670 0.1560
0.1462
0.1349
0.1554 0.2010 0.2334.
TAB. 11 ELECTRICITE DOMESTIQUE-3500 KWH PAR AN (*) DOMESTIC ELECTRICITY-3500 KWH PER YEAR (»)
PRIX PAR KWH PRICES PER KWH
JANVIER 1988
JANUARY
MONNAIES NATIONALES HORS HORS TAXES TAXES TVA COMPRISES
NATIONAL CURRENCIES TAX VAT WITH EXC EXC TAXES
HORS •TAXES
TAX EXC
HORS TVA
ECU VAT EXC
TAXES COMPRISES
WITH TAXES
HORS TAXES
TAX EXC
SPA HORS TVA
PPS VAT EXC
TAXES COMPRISES
WITH TAXES
DEUTSCHLAND CPF) (HAMBURG)
FRANCE (CENT.) (PARIS)
ITALIA (LIRE) (SETTEHTR.+CEHTR.)
NEDERLAND (CENT.) (ROTTERDAM)
1 BELGIQUE (FB) ¡ LUXEMBOURG (FL) 1 U.K. (PENCE)
(LONDON) 1 IRELAND (PENCE)
(DUBLIN) 1 DANMARK (ORE)
(MOYENNE/AVERAOE) 1 HELLAS (DRS) 1 ESPAHA (PES) 1 PORTUGAL (ESC)
24.49
61.13
179.59
19.18
4.47 3.93 5.46
6.45
46.78
10.46 12.06 16.00
0.00
66.58
195.69
19.18
4.47 3.93 5.46
6.45
79.28
10.46 12.06 16.00
30.18
78.96
213.30
23.02
5.23 4.16 5.46
6.45
96.72
12.13 13.50 17.28
0.1183
0.0877
0.1182
0.0827
0.1035 0.0910 0.0791
0.0827
0.0590
0.0635 0.0860 0.0948
o.sooo 0.0955
0.1288
0.0827
0.1035 0.0910 0.0791
0.0827
0.1000
0.0635 0.0860 6.0948
0.1458
0.1133
0.1404
0.0992
0.1211 0.0963 0.0791
0.0827
0.1220
0.0737 0.0963 0.1023
0.1243
0.1034
0.1564
0.1031
0.1263 0.1170 0.1162
0.1079
0.0564
0.1162 0.1394 0.2315
0.0000
0.1127
0.1705
0.1031
0.1263 0.1170 0.1162
0.1079
0.0956
0.1162 0.1394 0.2315
0.1532
0.1336
0.1858
0.1238
0.1477 0.1238 0.1162
0.1079
0.1167
0.1348 0.1561 0.2501
(X) DONT 1300 KWH DE NUIT SAUF ITALIE ET DANEMARK OF WHICH 1300 KWH AT NIGHT EXCEPT ITALY AND DENMARK

TAB. 12 ELECTRICITE DOMESTIQUE-13000 KWH PAR AN (*) DOMESTIC ELECTRICITY-13000 KWH PER YEAR (*)
PRIX PAR KWH PRICES PER KWH
JANVIER
JANUARY 1988
MONNAIES NATIONALES
HORS TAXES
HORS TVA
TAXES COMPRISES
NATIONAL CURRENCIES
TAX
EXC
VAT EXC
WITH TAXES
HORS TAXES
TAX EXC
HORS TAXES TVA COMPRISES
ECU
VAT EXC
WITH TAXES
HORS TAXES
TAX
EXC
SPA
HORS TVA
PPS
VAT
EXC
TAXES COMPRISES |
WITH TAXES
1 1 DEUTSCHLAND (PF)
(HAMBURG)
1 FRANCE (CENT. (PARIS)
1 NEDERLAND (CENT.) (ROTTERDAM)
| BELGIQUE (FB)
I LUXEMBOURG (FL)
1 U.K. (PENCE) (LONDON)
I IRELAND (PENCE) (DUBLIN)
1 DAHMARK (ORE)
(MOYENNE/AVERAGE)
1 HELLAS (DRS)
| ESPANA (PES)
1 PORTUGAL (ESC)
12.95
45.99
13.43
2.74
2.70
3.24
4.41
33.60
8.11
».67
12.62
14.00
50.08
13.43
2.74
2.70
3.24
4.41
63.67
8.11
8.67
12.62
15.06
59.40
16.12
3.21
2.86
3.24
4.41
77.68
9.41
9.71
13.62
0.0626
0.0660
0.0579
0.0634
0.0625
0.0470
0.0565
0.0424
0.0493
0.0618
0.0747
0.0676
. 0.0719
0.0579
0.0634
0.0625
0.0470
0.0565
0.0803
0.0493
0.0618
0.0747
0.0771
0.0852
0.0695
0.0743
0.0662
0.0470
0.0565
0.0980
0.0572
0.0692
0.0807
0.0657
0.0778
0.0722
0.0774
0.0804
0.0689
0.0737
0.0405
0.0901
0.1002
0.1826
0.0711
0.0847
0.0722
0.0774
0.0804
0.0689
0.0737
0.0768
0.0901
0.1002
0.1826
1 0.0810 |
1 0.1005 ·
¡ 0.0867 I
0.0907
0.0851
0.0689
0.0737
0.0937
0.1046
0.1123
0.1971
(x) DONT 9500 KWH DE NUIT SAUF DANEMARK
OF WHICH 9500 KWH AT NIGHT EXCEPT DANMARK
TAB. 13 ELECTRICITE INDUSTRIELLE-1.25 GWH PAR AN (*) PRIX PAR KWH
INDUSTRIAL ELECTRICITY-1.25 GWH PER YEAR (*) PRICES PER KWH
JANVIER
JANUARY 1988
MONNAIES NATIONALES
HORS TAXES
HORS TVA
TAXES
COMPRISES
NATIONAL CURRENCIES
TAX EXC
VAT EXC
WITH TAXES
HORS TAXES
TAX EXC
HORS TVA
ECU
VAT
EXC
TAXES
COMPRISES
WITH TAXES
HORS TAXES
TAX EXC
SPA
HORS TVA
PPS
VAT EXC
TAXES COMPRISES
WITH TAXES
DEUTSCHLAHD CPF) (HOCHINDUSTR. REGION)
FRANCE (CENT.)
ITALIA (LIRE) (SETTENTR.+CENTR.)
NEDERLAND (CENT.) (ROTTERDAM)
BELGIQUE (FB)
LUXEMBOURG (FL)
U.K. (PENCE) (YORKSHIRE)
IRELAND (PENCE) (DUBLIN)
DANMARK (ORE) (XX) (MOYENNE/AVERAGE)
HELLAS (DRS)
ESPANA (PES)
PORTUGAL (ESC)
20.86
47.93
110.47
17.27
3.36
3.56
4.58
6.44
34.29
11.10
11.16
13.12
22.51
47.93
126.57
17.27
3.3β
3.56
4.58
6.44
34.29
11.10
11.16
13.12
25.66
56.84
149.35
20.72
3.93
3.78
4.58
6.44
81.48
12.88
12.58
14.17
0.1008
0.0688
0.0727
0.0744
0.0778
0.0824
0.0664
0.0826
0.0432
0.0674
0.0796
0.0777
0.1087
0.0688
0.0833
0.0744
0.0778
0.0824
0.0664
0.0826
0.0432
0.0674
0.0796
0.0777
0.1240
0.0815
0.0983
0.0893
0.0910
0.0875
0.0664
0.0826
0.1027
0.0782
O.0897
0.0839
0.1059
0.0811
0.0962
0.0928
0.0949
0.1060
0.0974
0.1077
0.0414
0.1233
0.1290
0.1899
0.1143
0.0811
0.1103
0.0928
0.0949
0.1060
0.0974
0.1077
0.0414
0.1233
0.1290
0.1899
0.1303
0.0962
0.1301
0.1114
0.1110
0.1125
0.0974
0.1077
0.0983
0.1431
0.1454
0.2051
(M) 500 KW 2500 H (*x) LE PRIX HORS TVA HE COMPREND PAS LA TAXE SPECIALE DEDUCTIBLE DE=32.5 ORE/KWH
THE PRICE EXCL. VAT DOES HOT INCLUDE THE DEDUCTIBLE SPECIFIC TAX OF'32.5 ORE/KWH

TAB. 14 ELECTRICITE INDUSTRIELLE-10 GWH PAR AN INDUSTRIAL ELECTRICITY-10 GWH PER YEAR
PRIX PAR KWH PRICES PER KWH
JANVIER 1988
JANUARY
1 DEUTSCHLAND (PF) 1 (HOCHINDUSTR.
REGIUH)
1 FRANCE (CENT.)
1 ITALIA (LIRE)
(SETTENTR.+CENTR. )
1 NEDERLAND (CENT.) 1 (ROTTERDAM)
1 BELGIQUE (FB)
1 LUXEMBOURG (FL)
1 U.K. (PENCE)
1 (YORKSHIRE)
] IRELAND (PENCE) (DUBLIN)
1 DANMARK (ORE) (XX) (MOYEHNE/AVERAGE)
1 HELLAS (DRS)
1 ESPANA (PES)
1 PORTUGAL (ESC)
(X) 2500 KW 4000 H (XX) LE PRIX HORS TVA h
MONNAIES NATIONALES
HORS HORS TAXES TAXES TVA COMPRISES
NATIONAL CURRENCIES
TAX EXC
17.13
38.62
100.13
13.71
2.75
2.66
4.06
4.92
30.03
10.34
9.33
11.89
IE COMPREND
VAT EXC
18.48
38.62
100.89
13.71
2.75
2.66
4.06
4.92
30.03
10.34
9.33
11.89
PAS LA TAX
WITH TAXES
21.07
45.80
119.05
16.45
3.22
2.82
4.06
4.92
76.29
11.99
10.45
12.84
E SPECIALE
HORS TAXES
TAX EXC
0.0828
0.0554
0.0659
0.0591
0.0637
0.0616
0.0588
0.0631
0.0379
0.0628
0.0665
0.0704
DEDUCTIBLE
HORS TAXES TVA COMPRISES
ECU
VAT EXC
0.0893
0.0554
0.0664
0.0591
0.0637
0.0616
0.0588
0.0631
0.0379
0.0628
0.0665
0.0704
DE'32.5
WITH TAXES
O.1018
0.0657
O.0784
0.0709
0.0746
0.0653
0.0588
0.0631
0.0962
0.0728
0.0745
0.0760
ORE/KWH
HORS TAXES
TAX
EXC
0.0870
0.0653
0.0872
0.0737
0.0777
0.0792
0.0864
0.0823
0.0362
0.1149
0.1079
0.1721
SPA !
HORS TAXES | TVA COMPRISES |
PPS
VAT EXC
0.0938
0.0653
0.0879
0.0737
0.0777
0.0792
0.0864
0.0823
0.0362
0.1149
0.1079
0.1721
WITH TAXES
0.1070
0.0775
0.1037
0.0884
0.0910
0.0839
0.0864
O.0S23
0.0920
0.1332
0.1208
0.1858
THE PRICE EXCL. VAT DOES HOT INCLUDE THE DEDUCTIBLE SPECIFIC TAX 0F:32.5 ORE/KWH
TAB. 15 ELECTRICITE INDUSTRIELLE-24 GWH PAR AN (*) INDUSTRIAL ELECTRICITY-24 GWH PER YEAR (*)
PRIX PAR KWH PRICES PER KWH
JANVIER
JANUARY 198S
MONNAIES NATIONALES
HORS TAXES
HORS TVA
TAXES
COMPRISES
NATIONAL CURRENCIES
TAX EXC
VAT
EXC
WITH TAXES
HORS TAXES
TAX EXC
HORS TVA
ECU
VAT EXC
TAXES
COMPRISES
WITH TAXES
HORS TAXES
TAX EXC
SPA
HORS TAXES TVA COMPRISES
PPS
VAT
EXC
WITH TAXES
DEUTSCHLAND (PF) (HOCHINDUSTR. REGIOH)
FRANCE (CENT.
ITALIA (LIRE) (SETTENTR.+CENTR.)
NEDERLAND (CENT.) (ROTTERDAM)
BELGIQUE (FB)
LUXEMBOURG (FL)
U.K. (PENCE) (YORKSHIRE)
IRELAND (PENCE) (DUBLIN)
DANMARK (XX) (MOYENNE/AVERAGE)
HELLAS (DRS)
ESPANA (PES)
PORTUGAL (ESC)
13.34
32.50
75.14
11.74
14.39
32.50
75.84
11.74
I 16.40 0.0644 0.0695 0.0792
38.55
89.49
14.09
2.38
2.21
3.69
4.24
26.48
8.76
8.51
10.99
2.38
2.21
3.69
4.24
26.48
8.76
8.51
10.99
2.78
2.34
3.69
4.24
71.96
10.16
9.53
11.87
0.0551
0.0512
0.0535
0.0544
0.0334
0.0532
0.0607
0.0651
0.0466 0.0466 0.0553
0.0495 0.0499 0.0589
0.0506 0.0506 O.0607
0.0551 0.0644
0.0512 0.0542
0.0535 0.0535
0.0544 0.0544
0.0334 0.0907
0.0532 0.0617
0.0607 0.0680
0.0651 0.0703
0.0677 0.0730 0.0832
0.0550
0.0655
0.0631
0
0
0
0
0
0
0
0
.0672
.0658
.0785
0709
0319
0973
0984
1590
0.0550 0.0652
0.0661 0.0780
0.0631 0.0758
0.0672 0.0785
0.0658 0*. 0 6 56
0.0785 0.0785
0.0709 0.0709
0.0319 0.0868
0.0973 0.1129
0.0984 0.1102
0.1590 0.1718
x) 4000 KW 6000 Η XX) LE PRIX HORS TVA NE
THE PRICE EXCL. VAT COMPREND PAS LA TAXE SPECIALE DEDUCTIBLE DE· 32 5 ORF/KWH DOES NOT INCLUDE THE DEDUCTIBLE SPECIFIC TAX OF= 32.Ì 0 R E
^W H

TAB. 16 GAZ DOMESTIQUE - 16.74 GJ PAR AN DOMESTIC GAS - 16.74 GJ PER YEAR
PRIX PAR GJ (PCS) PRICES PER GJ (GCV)
1988 JANUARY
1 DEUTSCHLAND (DM) (») CDUESSELDORF)
1 FRANCE (FF) (Χ) (REGION PARIS.)
1 ITALIA (LIRE) (x) (ROMA)
| NEDERLAND (FL) (x) (ROTTERDAM)
1 BELGIQUE (FB) (X) (BRUXELLES)
I LUXEMBOURG (FL) (x)
1 U.K. t/) (X) 1 (LONDON)
1 IRELAND (IRf) (x) (DUBLIN)
1 DANMARK (DK) (+) 1 (KOBENHAVN)
1 E5PANA (PES) (x+) 1 (BARCELONA)
I PORTUGAL (ESC) (+) 1 (LISBOA)
MONNAIES NATIONALES
HORS TAXES
HORS TVA
TAXES COMPRISES
NATIONAL CURRENCIES
TAX EXC
21.03
70.20
14707.00
13.98
442.20
367.46
5.42
11.98
126.34
1445.00
1290.30
VA:
EXC
21.03
70.20
15495.00
13.99
442.00
367.46
5.42
11.98
126.34
1467.00
1290.30
WITH TAXES
23.97
83.26
16890.00
16.79
517.10
389.51
5.42
13.18
154.13
1643.00
1393.52
HORS TAXES
TAX EXC
10.16
10.07
9.68
6.03
10.24
8.51
7.86
15.36
15.93
10.30
7.64
HORS TAXES TVA COMPRISES
ECU
VAT EXC
10.16
10.07
10.20
6.03
10.23
8.51
7.86
15.36
15.93
10.46
7.64
WITH TAXES
11.58
11.95
11.12
7.24
11.97
9.02
7.86
16.90
19.44
11.72
8.25
HORS TAXES
TAX EXC
10.68
11.88
12.81
7.52
12.49
10.94
11.53
20.03
15.24
16.71
18.67
SPA
HORS TAXES TVA COMPRISES 1
PPS
VAT EXC
10.68
11.88
13.50
7.52
12.49
10.94
11.53
20.03
15.24
16.96
18.67
WITH TAXES
12.17 1
14.09 |
14,71 |
9.03 |
14.61 |
11.59 |
11.53 |
22.04 |
18.59 1
18.99 |
20.17 |
(X) GAZ HATUREL/NATURAL GAS ( + ) GAZ D USINES/GASW0RK5 GAS
TAB. 17 GAZ DOMESTIQUE - 125.6 GJ PAR AN DOMESTIC GAS - 125.6 GJ PER YEAR
PRIX PAR GJ (PCS) PRICES PER GJ (GCV)
JANVIER
JANUARY 1988
MONNAIES NATIONALES
HORS TAXES
HORS TVA
TAXES COMPRISES
NATIONAL CURRENCIES
TAX EXC
VAT EXC
WITH TAXES
HORS TAXES
TAX EXC
HORS TVA
ECU
VAT EXC
TAXES COMPRISES
WITH TAXES
HORS TAXES
TAX
EXC
SPA
HORS TVA
PPS
VAT EXC
TAXES COMPRISES
WITH TAXES
DEUTSCHLAND (DM) (x) (DUESSELDORF)
FRANCE (FF) (X) (REGION PARIS.)
ITALIA (LIRE) (X) (ROMA)
NEDERLAND (FL) (Χ) (ROTTERDAM)
BELGIQUE (FB) (X) (BRUXELLES)
LUXEMBOURG (FL) (x)
U.K.(^) (X) (LONDON)
IRELAND (IR¿) (x) (DUBLIN)
DANMARK (DK) (+) (KOBEHHAVN)
ESPANA (PES) (x+) (BARCELONA)
PORTUGAL (ESC) (x) (LISBOA)
11.69
42.73
11.69
42.73
13.33
50.68
11381.00 12169.00 13264.00
11.03 11.04 13.25
250.00 250.00 292.50
165.57
3.70
165.57
3.70
175.50
3.70
5.68 5.68 6.25
87.29 87.29 106.49
1059.00 1075.00 1204.00
1290.30 1290.30 1393.52
5.65
6.13
7.49
4.75
5.79
3.83
5.36
7.28
11.01
7.55
7.64
5.65
6.13
8.01
4.76
5.79
3.83
5.36
7.28
11.01
7.67
7.64
6.44
7.27
8.73
5.71
6.77
4.06
5.36
8.01
13.43
8.59
8.25
5.93
7.23
9.91
5.93
7.06
4.93
7.87
9.50
10.53
12.24
18.67
5.93
7.23
10.60
5.94
7.06
4.93
7.87
9.50
10.53
12.43
18.67
6.77
8.58
11.55
7.12
8.26
5.22
7.87
10.45
12.85
13.92
20.17
(X) GAZ HATUREL/NATURAL GAS (♦) GAZ D USINES/GASWORKS GAS

TAB. 18 GAZ INDUSTRIEL (*) · 41860 GJ PAR AN INDUSTRIAL GAS (*) 41860 GJ PER YEAR
PRIX PAR GJ (PCS) PRICES PER GJ (GCV)
1 JANVIER
1988 JANUARY 1
1 1 1 1 1 1
I 1 1 DEUTSCHLAND (DM) (X)l 1 (DUES5ELD0RF) | FRANCE (FF) (x) | (REGION PARIS.) | 1 ITALIA (LIRE) (x)
(TORINO) | NEDERLAND (FL) (x) I I (ROTTERDAM) | BELGIQUE (FB) 1 LUXEMBOURG (FL) 1 U. K. (/) (X) I (LONDON) 1 1 ESPANA (PES) (x+) I (BARCELONA) 1 1
MONNAIES NATIONALES HORS HORS TAXES TAXES TVA COMPRISES
NATIONAL CURRENCIES TAX EXC
8.78
23.10
4134.00
7.40
166.20 145.82
3.10
374.00
VAT EXC
8.78
23.99
4134.00
7.41
166.20 145.82
3.10
380.00
WITH TAXES
10.01
28.45
4508.00
8.89
194.40 154.57
3.10
426.00
HORS TAXES
TAX EXC
4.24
3.31
2.72
3.19
3.85 3.38 4.49
2.67
HORS TAXES TVA COMPRISES ECU
VAT EXC
4.24
3.44
2.72
3.19
3.85 3.38 4.49
2.71
WITH TAXES
4.84
4.08
2.97
3.83
4.50 3.58 4.49
3.04
HORS TAXES
TAX EXC
4.46
3.91
3.60
3.98
4.69 4.34 6.60
4.32
SPA HORS TAXES TVA COMPRISES PPS
VAT EXC
4.46
4.06
3.60
3.98
4.69 4.34 6.60
4.39
WITH TAXES
1 5.08
4.81
3.93
4.78
5.49 4.60 6.60
4.92
(X) GAZ NATUREL/NATURAL GAS (+) GAZ D USIHES/GASWORKS GAS
TAB. 19 GAZ INDUSTRIEL (*) - 418600 GJ PAR AN INDUSTRIAL GAS (*) - 418600 GJ PER YEAR
PRIX PAR GJ (PCS) PRICES PER GJ (GCV)
JANVIER JANUARY
1988 MONNAIES NATIONALES
HORS TAXES
HORS TVA
TAXES COMPRISES
NATIONAL CURRENCIES TAX EXC
VAT EXC
WITH TAXES
HORS TAXES
TAX EXC
HORS TVA ECU
VAT EXC
TAXES COMPRISES
WITH TAXES
HORS TAXES
TAX EXC
SPA HORS TVA PPS
VAT EXC
TAXES COMPRISES
WITH TAXES
DEUTSCHLAND (DM) (x) (DUESSELDORF)
FRANCE (FF) (X) (REGION PARIS.)
ITALIA (LIRE) (TORINO)
NEDERLAND (FL) (ROTTERDAM)
BELGIQUE (FB) ESPANA (PES) (BARCELONA)
(Χ)
8.20 8.20 9.35
19.96 21.45 25.44
3712.00 3712.00 4046.00
6.30 6.31 7.57
138.50 138.50 162.00 352.00 357.00 400.00
3.96
2.86
2.44
2.72
3.21 2.51
3.96
3.08
2.44
2.72
3.21 2.55
4.52
3.65
2.66
3.26
3.75 2.85
4.16
3.38
3.23
3.39
3.91 4.07
4.16
3.63
3.23
3.39
3.91 4.13
4.75
4.30
3.52
4.07
4.58 4.62
(Χ) GAZ NATUREL/NATURAL GAS (+) GAZ D USIHES/GASWORKS GAS

TAB. 20 FUEL-OIL RESIDUEL (HTS)
RESIDUAL FUEL OIL (HSC)
PRIX PAR TONNE HORS TAXES PRICES PER TONNE WITHOUT TAXES
DEUTSCHLAND 1980 (DM)
ITALIA (Lires)
BELGIQUE (FB)
U.K. (£)
DANMARK (DK)
ESPANA (Pes)
1981 1982 1983 1984 1985 1986 1987 1988 1980 1981 1982 1983 1984 1985 1986 1987 1988 1980 1981 1982 1983 1984 1985 1986 1987 1988 1980 1981 1982 1983 1984 1985 1986 1987 1988 1980 1981 1982 1983 1984 1985 1986 1987 1988 1980 1981 1982 1983 1984 1985 1986 1987 1988
Janvier January
325.33 441.86 455.02 426.14 508.00 624.00 403.00 278.00 176.00 153674 198252 229248 253296 305399 359925 251247 139885 107600
4701.00 7624.00 6933.00 8461.00 10351.00 11961.00 7528.00 4945.00 3238.00 81.04 92.51 113.07 121.70 138.71 182.24 118.10 88.84 62.00 990.00 1503.00 1563.00 1710.00 1960.00 2170.00 1515.00 975.00 760.00
29510.00 14175.00 9904.00
Juillet July
322.21 474.39 434.25 423.80 527.30 444.70 155.00 212.00
156401 237670 240830 260325 326910 279706 91645 151000
4842.00 7110.00 8397.00 8783.00 10636.00 8815.00 3117.00 5197.00
87.02 109.51 108.98 118.87 147.37 133.76 47.91 87.85
1070.00 1728.00 1668.00 1685.00 1945.00 1655.00 620.00 965.00
13949.00 14180.00
TRANCE 1980 (FF) 1981
1982 1983 1984 1985 1986 1987 1988
NEDERLAND 1980 (Fl) 1981
1982 1983 1984 1985 1986 1987 1988
LUXEMBOURG 1980 (FL) 1981
1982 1983 1984 1985 1986 1987 1988
IRELAND 1980 (£) 1981
1982 1983 1984 1985 1986 1987 1988
HELLAS 1980 (Drs) 1981
1982 1983 1984 1985 1986 1987 1988
PORTUGAL 1980 (Eso) 1981
1982 1983 1984 1985 1986 1987 1988
Janvier January
807.00 1014.00 1113.00 1296.00 1618.00 1819.00 1128.00 786.00 492.00 313.22 493.12 501.27 506.00 613.00 723.00 462.00 305.00 232.00 4421.00 8144.00 7208.00 8468.00 10380.00 12233.00 8184.00 3910.00 3856.00 100.14 122.22 150.29 167.25 175.51 215.98 165.50 98.38 86.71
3835.00 8049.00 10832.00 12973.00 12973.00 19492.00 21306.00 11562.00 10547.00
30715.00 16792.00 22222.00
Juillet July
742.20 1084.00 1220.00 1336.00 1620.00 1307.00 534.00 776.00
370.77 556.52 529.19 526.00 621.00 520.00 177.00 279.00
5378.00 7396.00 8235.00 9275.00 10986.00 9255.00 3011.00 4929.00
98.23 150.28 140.76 154.56 185.94 174.46 78.65 108.16
7883.00 10002.00 10905.00 12973.00 15492.00 19492.00 8844.00 14783.00
14252.00 21899.00
Afin de tenir compte des facteurs saisonniers, deux sérios distinctes indiquent les prix valables pour Les mois de janvier et juillet In order to take into account seasonal factors, two soperato series indicate January and July prices respectively

TAB. 21 FUEL-OIL RESIDUEL (HTS)
RESIDUAL FUEL OIL (HSC) PRIX PAR TONNE HORS TVA PRICES PER TONNE WITHOUT VAT
DEirreCHLAltD 1980 (DM)
ITALIA (Lires)
BELGIQUE (FB)
U.K. (£)
1931 1982 1983 1984 1985 1986 1987 1988 1980 1981 1982 1983 1984 1985 1986 1987 1988 1980 1931 1982 1983 1984 1985 1986 1987 1988 1980 1981 1982 1983 1984 1985 1986 1987 1988
DANMARK (») 1980 (DK)
ESPANA (Pes)
1981 1982 1983 1934 1935 1986 1987 1988 1980 1981 1982 1933 1934 1985 1986 1987 1988
Janvier January
340.35 456.86 470.02 441.14 523.00 639.00 418.00 293.00 191.00 154674 199252 230248 254296 3C6399 360925 261247 149835 117600 4801.00 7624.00 6933.00 8461.00
10351.00 11961.00 7528.00 4945.00 3238.00 87.87 100.52 121.08 129.71 146.64 190.17 125.90 96.66 69.82 990.00 1503.00 1563.00 1710.00 1960.00 2170.00 1515.00 975.00 760.00
30714.00 14286.00 14286.00
Juillet July
337.21 489.39 449.25 438.80 542.30 459.70 170.00 227.00
157401 233670 241830 261325 327910 289706 101645 161000
4942.00 7110.00 8397.00 8783.00 10636.00 3815.00 3117.00 5197.00
95.03 117.52 116.91 126.80 155.30 141.58 55.73 95.67
1070.00 1728.00 1668.00 1685.00 1945.00 1655.00 620.00 965.00
24554.00 14286.00
TRANCE (FF)
NEDERLAND (Fl)
LUXEMBOURG (FL)
IRELAND (£)
HELLAS (Drs)
PORTUGAL (Esc)
1980 1981 1982 1983 1984 1985 1986 1987 1938 1980 1981 1982 1983 1984 1935 1986 1987 1988 1980 1981 1932 1933 1984 1935 1986 1967 1988 1980 1981 1982 1983 1984 1985 1986 1987 1988 1980 1981 1932 1983 1984 1985 1986 1937 1938 1980 1931 1982 1983 1984 1985 1986 1937 1983
Janvier January
807.00 1015.00 1160.00 1344.00 1675.00 1833.00 1425.00 971.30 621.00 328.31 508.20 511.59 517.11 624.20 734.23 473.23 341.20 268.20 4521.00 8244.00 7308.00 3568.00 10480.0Ö 12333.00 8284.00 4010.00 3956.00 104.72 138.14 160.49 177.39 185.65 226.12 173.30 106.18 94.67
4000.00 8370.00 11220.00 14434.00 14434.00 23000.00 29100.00 24139.00 24133.00
31500.00 20370.00 23355.00
Juillet July
743.00 1035.00 1267.00 1389.00 1679.00 1472.00 831.00 9S1.00
385.85 571.60 540.30 537.20 632.20 531.20 188.20 315.20
5478.00 7496.00 8335.00 9375.00 11086.00 9355.00 3111.09 5029.00
114.15 166.20 150.90 164.70 196.03 184.60 86.40 115.96
3200.00 10370.00 11310.00 14484.00 19000.00 23000.00 25587.00 24139.00
24074.00 20370.00
(«) Le prix hors TVA ne comprond pas la taxe spéciale déductible de: The price excluding VAT does not Include the deductible specific tax of:
SiO TJKR/tonne 1980/1 340 410 410 410 410 540 1980
1981/1 1962/1 1983/1 1984/1 1985/1 1986/1 1740 1987/1 2080 198B/1
340 OCR/tonne 1980/7 410 .. 1981/7 41« 410 410 410
1982/7 1383/7 1934/7 1985/7 1986/7 1937/7
Afin de tenir oompte des facteurs saisonniers, deux serles distinctes Indiquent les prix valables pour les mois de janvier et Juillet In order to take into account seasonal factors, two separate series indicate January and July prices respectively

TAB. 22 GASOIL CHAUFFAGE
HEATING GASOIL
PRIX PAR 1000 LITRES HORS TAXES PRICES PER 1000 LITRES WITHOUT TAXES
DEUTSCHLANI (DM)
ITALIA (Lires)
BELGIQUE (FB)
U.K. (£)
DANMARK (DK)
ESPANA (Pes)
) 1980 1981 1982 1983 1984 1985 1986 1987 1988 1980 1981 1982 1983 1984 1985 1936 1987 1988 1980 1981 1982 1983 1984 1985 1986 1987 1988 1980 1981 1982 1983 1984 1985 1986 1987 1988 1980 1981 1982 1983 1984 1985 1986 1987 1988 1980 1981 1982 1933 1984 1985 1936 1987 1988
Janvier January
548.10 580.60 706.90 651.90 661.55 742.00 546.00 367.00 271.00 223932 275656 364228 419607 397940 421181 406603 221377 215600
8290.00 9810.00 11700.00 12282.00 13504.00 13717.00 11248.00 6974.00 5974.00 123.50 150.30 189.10 217.50 195.40 218.50 188.40 136.00 111.90 1529.50 1816.20 2394.10 2631.80 2517.05 2590.80 2397.10 1502.46 1364.50
36901.00 20962.00 22620.00
Juillet July
532.20 623.90 641.40 592.40 624.00 620.00 240.00 326.00
251667 317629 378089 367824 408009 412815 191153 221400
8630.00 9923.00 12308.00 11923.00 12564.00 12974.00 5427.00 6363.00
145.30 164.30 189.20 193.00 193.60 198.30 101.60 120.60
1708.20 2271.15 2377.70 2295.74 2443.28 2476.00 1181.30 1412.30
16287.00 22328.00
FRANCE 1980 (FF) 1981
1982 1983 1934 1985 1986 1987 1988
NEDERLAND 1980 (Fl) 1981
1982 1983 1984 1985 1986 1987 1988
LUXEMBOURG 1980 (FL) 1981
1982 1983 1984 1985 1986 1987 1988
IRELAND 1980 (£) 1981
1982 1983 1984 1935 1935 1987 1988
HELLAS 1980 (Drs) 1981
1982 1983 1984 1985 1986 1987 1988
PORTUGAL 1980 (Eso) 1981
1982 1983 1984 1985 1986 1987 1988
Janvier January
1055.70 1398.50 1728.00 2111.90 2053.90 2239.80 1850.00 1386.00 1205.00 528.22 629.80 759.80 728.00 769.70 805.00 675.00 418.00 334.00 7282.00 9795.00 12200.00 13760.00 13519.00 13910.00 13160.00 6740.00 7030.00 130.39 166.20 208.10 240.15 226.37 249.10 236.00 146.29 152.98 9400.00 15380.00 17138.00 19697.00 19697.00 23693.30 32950.00 18143.00 19975.00
Juillet July
1235.10 1628.10 1898.30 1937.40 2089.10 2144.80 1024.00 1218.00
591.80 715.30 736.10 690.00 719.00 727.00 317.00 383.00
9220.00 10680.00 12780.00 12680.00 13420.00 14150.00 6390.00 7450.00
151.45 201.49 205.60 223.55 225.17 249.85 140.64 154.94
15100.00 16162.00 17318.00 19697.00 20193.00 23693.00 16299.00 20497.00
Afin de tenir compte des facteurs saisonniers, deux séries distinctes indiquent les prix valables pour les mois de janvier et juillet In order to take into account seasonal factors, two separate series indicate January and July prices respectively

TAB. 23 GASOIL CHAUFFAGE
HEATING GASOIL
PRIX PAR 1000 LITRES TAXES COMPRISES PRICES PER 1000 LITRES TAXES INCLUDED
DEUTSCHIANI (DM)
ITALIA (Lires)
BELGIQUE (FB)
U.K. (£)
DANMARK (DK)
ESPANA (Pes)
1980 1981 1982 1983 1984 1985 1986 1987 1988 1980 1981 1982 1983 1984 1985 1986 1987 1988 1980 1981 1982 1983 1984 1985 1986 1987 1988 1980 1981 1982 1983 1984 1985 1986 1987 1988 1980 1981 1982 1983 1984 1985 1986 1987 1988 1980 1981 1982 1983 1984 1985 1986 1987 1988
Janvier January
638.34 675.06 817.55 755.41 773.10 865.00 641.40 437.30 328.09 283840 335750 437607 547397 581429 634286 632082 564933 626400 9264.00 11380.00 13689.00 14369.94 15800.00 16050.00 13160.00 8160.00 6990.00 131.10 158.00 196.80 225.20 203.10 226.20 196.10 147.00 122.90
2200.00 2655.00 3360.00 3650.00 3510.00 3600.00 3510.00 4090.00 3890.00
48000.00 34000.00 34000.00
Juillet July
620.37 723.77 743.54 694.26 730.00 726.20 292.50 390.00
318225 3B4018 469647 534300 593008 624415 508005 570900
9620.00 11610.00 14400.00 13950.00 14700.00 15180.00 6350.00 8030.00
153.00 172.00 196.90 200.70 201.30 206.00 112.60 131.60
2450.00 3210.00 3340.00 3240.00 3420.00 3460.00 3320.00 3980.00
42000.00 34000.00
FRANCE 1980 (FF) 1981
1982 1983 1984 1985 1936 1987 1988
NEDERLAND 1980 (Fl) 1981
1982 1983 1984 1985 1936 1987 1988
LUXEMBOURG 1980 (FL) 1981
1982 1983 1984 1985 1986 1987 1988
IRELAND 1930 (£) 1981
1982 1983 1934 1985 1936 1987 1988
HELLAS 1980 (Drs) 1981
1982 1983 1984 1985 1986 1987 1988
PORTUGAL 1980 (Eso) 1981
1982 1983 1984 1985 1986 1987 1988
Janvier January
1412.00 1816.00 2204.00 2677.99 2639.00 2995.00 2620.00 2098.10 1883.00 663.07 782.93 936.33 899.63 957.00 999.00 844.00 651.50 550.00 8042.00 10680.00 12810.00 14448.00 14330.00 14740.00 13950.00 7144.00 7450.00 134.79 181.50 223.40 255.45 256.06 279.90 278.80 180.17 209.30
11000.00 17300.00 19300.00 24000.00 24000.00 31500.00 41000.00 37500.00 37500.00
Juillet July
1623.00 2086.00 2424.66 2558.00 2730.00 2963.00 1658.00 1899.00
738.09 883.82 909.19 855.00 897.00 906.20 418.30 610.00
10080.00 11613.00 13420.00 13440.00 14230.00 15000.00 6770.00 7900.00
166.75 216.79 220.90 253.10 254.30 294.08 173.95 211.47
17000.00 18300.00 19700.00 24000.00 28000.00 31500.00 37500.00 37500.00
Afin de tenir compte des facteurs saisonniers, deux séries distinctes indiquent les prix valables pour les mois de janvier et juillet In order to take into account seasonal factors, two separate series indicate January and July prices respectively

TAB. 24 GASOIL ROUTIER
AUTOMOTIVE DIESEL
PRIX PAR 1000 LITRES HORS TAXES PRICES PER 1000 LITRES WITHOUT TAXES
IffiÜTSCHLAND 1980 (DM)
ITALIA (Lires)
BELGIQUE (FB)
U.K. (£)
DANMARK (DK)
ESPANA (Pos)
1981 1982 1983 1984 1985 1986 1987 1988 1980 1981 1982 1983 1984 1985 1986 1987 1988 1980 1981 1982 1983 1984 1985 1986 1987 1988 1980 1981 1982 1983 1984 1985 1986 1987 1988 1980 1981 1982 1983 1984 1985 1986 1987 1988 1980 1981 1982 1983 1984 1985 1986 1987 1988
Janvier January
534.68 636.36 725.08 725.08 701.59 730.00 654.00 417.00 442.00 229334 233050 380220 447090 429741 454840 478570 253640 268650 9370.00 10960.00 12742.00 13638.00 14286.00 15342.00 13014.00 8790.00 7878.00 149.60 167.00 184.30 194.80 181.62 208.20 206.60 140.40 131.20 1695.84 2368.80 2599.02 2844.92 2541.64 2320.30 2626.60 1767.75 1725.94
41908.00 25398.00 26764.00
Juillet July
613.44 711.10 724.99 645.81 680.00 682.00 366.00 343.00
261910 331530 397520 397560 427130 479410 296230 272360
9730.00 11494.00 13430.00 13262.00 13710.00 14270.00 7166.00 8686.00
163.70 169.50 176.70 185.60 185.20 213.10 132.20 136.50
1896.72 2492.46 2582.62 2549.84 2672.79 2690.00 1427.20 1674.50
20427.00 26575.00
FRANCE 1980 (FF) 1981
1982 1983 1984 1985 1986 1987 1988
NEDERLAND 1980 (Fl) 1981
1982 1983 1984 1985 1986 1987 1988
LUXEMBOURG 1980 (TL) 1981
1982 1983 1984 1985 1986 1987 1988
IRELAND 1980 (£) 1981
1982 1983 1984 1985 1986 1987 1936
HELLAS 1980 (Drs) 1981
1982 1983 1984 1985 1986 1987 1988
PORTUGAL 1980 (Eso) 1981
1982 1983 1984 1985 1986 1987 1988
Janvier January
1124.00 1472.10 1809.70 2198.50 2157.10 2348.70 2030.00 1290.00 1200.00 563.60 690.26 822.06 787.00 840.13 861.00 734.00 483.00 400.00 8430.00 11040.00 12830.00 14300.00 14092.00 14480.00 13740.00 7400.00 7660.00 150.45 190.88 237.89 270.62 278.06 293.30 273.70 179.56 186.17 9400.00 15380.00 17138.00 19697.00 19697.00 23693.30 32950.30 18143.00 19975.00
42851.00 27642.00 34776.00
Juillet July
1302.50 1701.70 1972.60 2027.80 2195.20 2250.00 1450.00 1270.00
655.97 776.70 797.01 754.00 777.00 789.00 382.00 448.00
10460.00 11330.00 13420.00 13220.00 13980.00 14720.00 6980.00 8110.00
176.32 240.45 229.95 257.38 277.82 282.46 182.60 197.93
15100.00 16162.00 17318.00 19697.00 20193.00 23693.30 16299.00 20497.00
26690.00 29066.00
Afin de tenir compte des facteurr. saisonniers, deux séries distinctes indiquent les prix valables pour les mois de janvier et juillet In order to take into account seasonal factors, two separate series indicate January and July prices respectively

TAB. 25 GASOIL ROUTIER
AUTOMOTIVE DIESEL
PRIX PAR 1000 LITRES TAXES COMPRISES PRICES PER 1000 LITRES TAXES INCLUDED
DEUTSCHLAND (DM)
ITALIA (Lires)
BELGIQUE (FB)
U.K. (£)
DANMARK (DK)
ESPANA (Pes)
1980 1981 1982 1983 1984 1985 1986 1987 1988 1980 1981 1982 1983 1984 1985 1986 1987 1988 1980 1981 1982 1983 1984 1985 1986 1987 1988 1980 1981 1982 1983 1984 1985 1986 1987 1938 1980 1981 1982 1983 1984 1985 1986 1987 1988 1980 1981 1982 1983 1984 1985 1986 1987 1988
Janvier January
1075.40 1190.30 1318.80 1318.30 1303.70 1336.30 1249.80 979.30 880.20 290000 350000 456000 579002 618000 674000 717000 603000 689000
14120.00 18010.00 21240.00 22360.00 24420.00 25740.00 22830.00 17550.00 16410.00 277.90 307.10 348.90 376.40 367.80 405.90 411.80 350.00 339.40 2400.00 2890.00 3610.00 3910.00 3540.00 3880.00 3790.00 4413.65 4340.00
62000.00 58000.00 58000.00
Juillet July
1164.40 1303.00 1318.70 1240.10 1279.00 1281.00 921.40 894.30
330000 400000 492000 569000 615000 703000 632000 631000
14530.00 19680.00 22100.00 23140.00 23700.00 24400.00 15520.00 17420.00
303.20 331.90 355.50 372.40 379.50 419.30 340.50 345.50
2680.00 3480.00 3590.00 3550.00 3700.00 3720.00 3620.00 4300.00
60000.00 53000.00
FRANCE 1980 (FF) 1981
1982 1983 1984 1985 1986 1987 1988
NEDERLAND 1930 (Fl) 1981
1982 1983 1984 1985 1986 1987 1988
LUXEMBOURG 1980 (FL) 1981
1982 1983 1984 1985 1986 1987 1983
IRELAND 1980 (£) 1981
1982 1933 1984 1985 1986 1987 1988
HELLAS 1980 (Drs) 1981
1982 1933 1984 1985 1986 1987 1988
PORTUGAL 1980 (Esc) 1981
1982 1983 1984 1985 1986 1987 1988
Janvier January
2220.00 2630.00 3150.00 3670.00 3800.00 4260.00 3970.00 3278.50 3190.00 885.00 1040.00 1196.00 1166.19 1238.00 1259.00 1108.00 924.80 825.00
11000.00 13690.00 17180.00 18810.00 20600.00 21100.00 20200.00 13104.00 13400.00
208.39 296.76 407.78 501.40 540.54 572.40 587.30 488.08 502.84
11000.00 17300.00 19300.00 24000.00 24000.00 31500.00 41000.00 37500.00 37500.00
70000.00 66000.00 74000.00
Juillet July
2430.00 2900.00 3370.00 3660.00 3960.00 4230.00 3400.00 3250.00
994.00 1142.00 1178.00 1128.00 1163.00 1174.00 690.00 883.00
13100.00 14000.00 17840.00 19620.00 20474.00 21300.00 12634.00 13900.00
280.74 384.17 427.10 515.10 553.40 581.00 491.88 517.54
17000.00 18300.00 19700.00 24000.00 28000.00 31500.00 37500.00 37500.00
66000.00 70000.00
Afin do tonir compte des facteurs saisonniers, doux séries distinctes indiquent les prix valables pour les mois de janvier et juillet In order to take into account seasonal factors, two separate series indicate January and July prices respectively
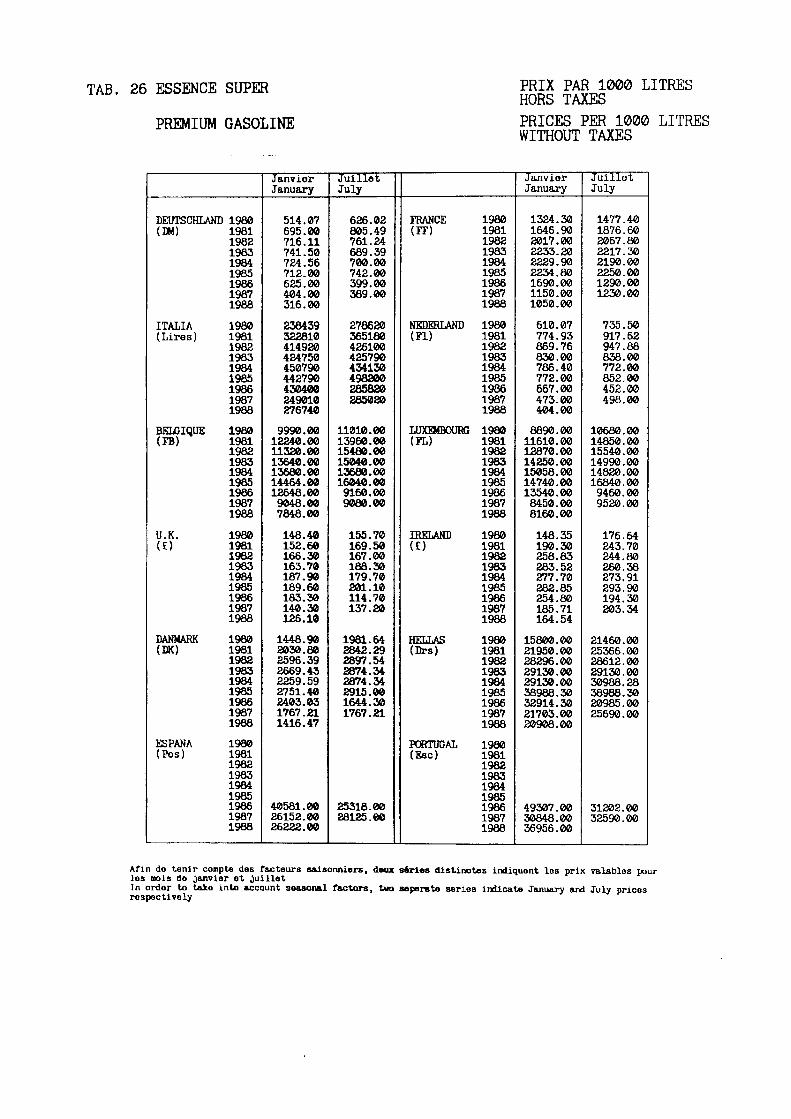
TAB. 26 ESSENCE SUPER
PREMIUM GASOLINE
PRIX PAR 1000 LITRES HORS TAXES PRICES PER 1000 LITRES WITHOUT TAXES
DEUTSCHLANI (DM)
ITALIA (Lires)
BELGIQUE (FB)
U.K. (£)
DANMARK (DK)
ESPANA (Pes)
1980 1981 1982 1983 1984 1985 1986 1987 1988 1930 1931 1982 1933 1984 1985 1986 1987 1983 1980 1981 1982 1983 1984 1985 1986 1987 1988 1980 1981 1982 1983 1984 1985 1986 1987 1988 1980 1981 1982 1983 1984 1985 1986 1987 1988 1980 1981 1982 1933 1984 1935 1986 1987 1988
Janvier January
514.07 695.00 716.11 741.50 724.56 712.00 625.00 404.00 316.00 238439 322810 414920 424750 450790 442790 430400 249010 276740 9990.00 12240.00 11320.00 13640.00 13680.00 14464.00 12648.00 9048.00 7848.00 148.40 152.60 166.30 163.70 187.90 189.60 183.30 140.30 126.10 1448.90 2030.80 2596.39 2669.43 2259.59 2751.40 2403.03 1767.21 1416.47
40581.00 26152.00 26222.00
Juillet July
626.02 805.49 761.24 689.39 700.00 742.00 399.00 389.00
273620 365130 426100 425790 434130 498200 285820 285020
11010.00 13960.00 15480.00 15040.00 13680.00 16040.00 9160.00 9060.00
155.70 169.50 167.00 188.30 179.70 201.10 114.70 137.20
1981.64 2842.29 2897.54 2874.34 2874.34 2915.00 1644.30 1767.21
25318.00 28125.00
FRANCE 1980 (FF) 1981
1982 1983 1934 1985 1986 1987 1988
NEDERLAND 1980 (Fl) 1981
1982 1983 1984 1985 1986 1987 1988
LUXEMBOURG 1980 (FL) 1981
1982 1983 1984 1935 1985 1987 1988
IRELAND 1980 (£) 1981
1982 1983 1984 1985 1986 1987 1988
HELLAS 1980 (Drs) 1981
1982 1933 1984 1985 1986 1987 1988
PORTUGAL 1980 (Eso) 1981
1982 1983 1984 1985 1986 1987 1988
Janvier January
1324.30 1646.90 2017.00 2233.20 2229.90 2234.80 1690.00 1150.00 1050.00 610.07 774.93 869.76 830.00 786.40 772.00 667.00 473.00 404.00 8890.00 11610.00 12870.00 14250.00 15058.00 14740.00 13540.00 8450.00 8160.00 148.35 190.30 258.83 283.52 277.70 282.85 254.80 185.71 164.54
15800.00 21950.00 28296.00 29130.00 29130.00 38988.30 32914.30 21703.00 20908.00
49307.00 30848.00 36956.00
Juillet July
1477.40 1876.60 2067.80 2217.30 2190.00 2250.00 1290.00 1230.00
735.50 917.62 947.88 838.00 772.00 852.00 452.00 498.00
10680.00 14850.00 15540.00 14990.00 14820.00 16840.00 9460.00 9520.00
176.64 243.70 244.80 260.38 273.91 293.90 194.30 203.34
21460.00 25366.00 28612.00 29130.00 30988.28 38988.30 20985.00 25690.00
31202.00 32590.00
Afin do tonir compte des facteurs saisonniers, deux séries distinctes indiquent les prix valables pour les mois do janvier et ju i l l e t In order to take into account seasonal factors, taro separate series indicate January and July prices respectively

TAB. 27 ESSENCE SUPER
PREMIUM GASOLINE
PRIX PAR 1000 LITRES TAXES COMPRISES PRICES PER 1000 LITRES TAXES INCLUDED
DEUTSCHIANI (DM)
ITALIA (Lires)
BELGIQUE (FB)
U.K. (£)
DANMARK (DK)
ESPANA (Pes)
1930 1981 1982 1983 1984 1985 1986 1987 1988 1980 1981 1982 1983 1984 1985 1986 1987 1988 1980 1981 1982 1983 1984 1985 1986 1987 1988 1980 1981 1982 1983 1984 1985 1986 1987 1988 1980 1981 1982 1983 1984 1985 1986 1987 1988 1980 1981 1982 1933 1984 1985 1986 1987 1988
Janvier January
1078.00 1283.20 1385.50 1414.20 1407.40 1393.10 1316.30 1064.30 964.20 655000 850000 995000 1165000 1300000 1300000 1360000 1230000 1350000
21400.00 25800.00 25900.00 29800.00 31100.00 32080.00 29810.00 25310.00 23810.00 263.80 290.50 350.20 366.97 403.53 415.40 417.10 384.20 367.90 3930.00 4820.00 5510.00 6020.00 5520.00 6120.00 6000.00 6670.00 6370.00
87000.00 78000.00 78000.00
Juillet July
1204.60 1486.50 1436.50 1367.30 1379.40 1449.70 1058.90 1048.10
750000 900000 1020000 1165000 1280000 1345000 1280000 1280000
24080.00 29200.00 32100.00 32800.00 31100.00 34050.00 25450.00 25350.00
294.00 353.90 370.70 404.00 404.00 437.50 354.80 380.70
4760.00 5810.00 6280.00 6270.00 6270.00 6320.00 6520.00 6670.00
82000.00 78000.00
FRANCE 1980 (FF) 1981
1982 1983 1984 1985 1986 1987 1988
NEDERLAND 1980 (Fl) 1981
1982 1983 1984 1935 1986 1987 1988
LUXEMBOURG 1980 (FL) 1981
1982 1983 1984 1985 1986 1987 1988
IRELAND 1980 (E) 1981
1982 1983 1984 1985 1986 1987 1988
HELLAS 1980 (Drs) 1981
1982 1983 1984 1985 1986 1987 1988
PORTUGAL 1980 (Esc) 1981
1982 1983 1984 1985 1986 1987 1988
Janvier January
3270.00 3650.00 4320.00 4650.00 4985.00 5590.00 5110.00 4734.70 4670.00 1348.00 1560.00 1708.00 1676.90 1800.00 1780.00 1654.00 1580.00 1500.00 16640.00 19500.00 23500.00 24981.00 26900.00 26500.00 25200.00 19500.00 20300.00 268.24 385.27 496.83 589.90 620.90 640.40 636.90 574.30 556.55
30000.00 36500.00 43000.00 50000.00 50000.00 65000.00 80000.00 77000.00 77000.00
15000.00 12000.00 19000.00
Juillet July
3450.00 3920.00 4420.00 4870.00 5240.00 5780.00 4850.00 4880.00
1496.00 1764.00 1816.00 1843.00 1783.00 1375.00 1410.00 1610.00
18520.00 22900.00 26400.00 26820.00 26633.00 28900.00 20700.00 20700.00
343.24 449.90 511.30 599.60 629.40 676.00 584.90 605.05
36000.00 40000.00 43800.00 50000.00 57000.00 65000.00 77000.00 77000.00
12000.00 15000.00
Afin de tenir compte des facteurs saisonniers, deux séries distinctes indiquent les prix valables pour les mois de janvier et juillet In order to take into account seasonal factors, two soperate series indicate January and July prices respectively

TAB. 28 CHARBON DOMESTIQUE
DOMESTIC COAL
PRIX PAR TEC(29.3GJ-PCI) HORS TAXES PRICES PER TCE(29.3GJ-NCV WITHOUT TAXES
DEUTSCHLAND 1980 (DM)
ITALIA (Lires)
BELGIQUE (FB)
U.K. (£)
DANMARK (DK)
ESPANA (Pes)
1981 1982 1983 1984 1985 1986 1987 1988 1980 1981 1982 1983 1984 1985 1986 1987 1988 1980 1981 1982 1983 1984 1985 1986 1987 1988 1980 1981 1982 1983 1984 1985 1986 1987 1988 1980 1981 1982 1933 1934 1985 1986 1987 1988
1980 1981 1982 1983 1984 1985 1986 1987 1988
Janvier January
338.42 378.85 401.41 401.41 397.89 445.65 461.91 498.66 479.48 198654 229888 234005 317964 339331 358134 396935 453060 395137
6299.00 7412.00 8174.70 9669.00 9727.60 10167.10 10510.00 10760.00 10488.80
69.44 94.05 106.95 115.74 125.69 125.99 143.07 145.29 148.75
18694.00
Juillet July
401.41 450.05 445.91 482.67 482.67
317964 339470 393798' 408962 395137
9669.00 9727.60 10160.00 10679.00 10871.00
107.82 125.70 129.08 135.34 137.48
19051.00
FRANCE (FF)
NEDERLAND (Fl)
LUXEMBOURG (FL)
IRELAND (£)
HELLAS (Drs)
PORTUGAL (Esc)
1980 1981 1982 1983 1984 1985 1986 1987 1988 1980 1981 1932 1983 1984 1985 1986 1987 1983 1980 1981 1982 1933 1934 1985 1986 1987 1988 1980 1981 1982 1983 1984 1985 1986 1987 1988 1980 1931 1982 1983 1984 1985 1986 1987 1988 1980 1981 1982 1983 1984 1985 1986 1987 1988
Janvier January
960.75 1099.92 1306.78 1481.70 1648.71 1731.04 1829.39 1884.28 1866.76 387.35 424.85 463.23 464.99 484.62 581.02 602.29 602.29
62.96 86.14 103.14 103.43 106.35 125.40 125.75 117.49 113.55
Juillet July
1495.77 1649.59 1731.07 1845.41 1820.25
467.04 554.94 581.12 602.29 603.69
100.50 108.12 129.31 117.49 113.55
Afin do tenir compte des facteurs saisonniers, deux séries distinctes indiquent les prix valables pour les mois de janvier et juillet In order to tako into account seasonal factors, two separate series indicate January and July prices respectively

TAB. 29 CHARBON DOMESTIQUE
DOMESTIC COAL
PRIX PAR TEC(29.3GJ-PCI) TAXES COMPRISES PRICES PER TCE(29.3GJ-NCV TAXES INCLUDED
DEUTSCKLANTJ (DM)
ITALIA (Lires)
BELGIQUE (FB)
U.K. (£)
DANMARK (DK)
ESPANA (Pes)
1980 1981 1982 1983 1984 1985 1986 1987 1988 1980 1981 1982 1983 1984 1985 1986 1987 1988 1980 1981 1982 1983 1984 1985 1986 1987 1988 1980 1981 1982 1983 1984 1985 1986 1987 1988 1980 1981 1982 1983 1984 1985 1986 1987 1988 1980 1981 1982 1983 1984 1985 1986 1987 1938
Janvier January
382.37 428.07 453.56 453.56 453.56 508.06 526.55 568.47 546.60 226460 264374 326578 375187 400472 390364 432664 493835 430699 6680.40 7852.40 8672.80 10255.00 10313.60 10782.40 11141.00 11406.00 11118.00
69.44 94.05 106.95 115.74 125.69 125.99 143.07 145.29 148.75
20937.00
Juillet July
457.61 513.04 508.34 550.24 550.24
375187 400560 429240 445769 430700
10255.00 10313.60 10770.00 11320.00 11523.00
107.82 125.70 129.08 135.34 137.48
21337.00
FRANCE (FF)
NEDERLAND (Fl)
LUXEMBOURG (FL)
IRELAND (£)
HELLAS (Drs)
PORTUGAL (Eso)
1980 1981 1982 1983 1984 1985 1986 1987 1988 1980 1981 1982 1933 1934 1985 1986 1987 1988 1980 1981 1982 1983 1984 1985 1986 1987 1988 1980 1981 1982 1983 1984 1985 1986 1987 1988 1980 1981 1982 1983 1984 1985 1936 1987 1988 1980 1981 1982 1983 1984 1985 1986 1987 1988
Janvier January
1129.81 1293.60 1536.79 1757.41 1955.48 2053.05 2169.65 2234.76 2213.97 457.08 501.32 546.74 548.79 576.62 691.48 716.71 722.75
62.96 86.14 103.14 103.43 111.63 131.56 138.32 129.24 124.91
Juillet July
1773.82 1956.36 2053.05 2188.66 2158.82
551.13 660.42 691.53 716.73 724.43
105.48 113.39 142.24 129.24 124.91
Afin do tonir compta des facteurs saisonniers, los mois do janvier et juillet In order to take into account seasonal factors respectively
deux séries distinctes indiquent les prix valables pour two superato series indicate January and July prices

TAB. 30 CHARBON INDUSTRIEL
INDUSTRIAL COAL
PRIX PAR TEC(29.3GJ-PCI) HORS TAXES
PRICES PER TCE(29.3GJ-NCV WITHOUT TAXES
DEUTSCHLAND 1980 DUESSELDORF 1981 (DM)
FRANCE
PARIS INDUSTRIE (FF)
ITALIA MILANO (Lires)
BELGIQUE LIEGE (FB)
U.K.
MOYENNE
(£)
DANMARK
(DK)
ESPANA
(Pes)
1982 1983 1984 1935 1986 1987 1988
1980
1981 1982 1983 1984
1985 1986
1987 1988
1980 1981 1982 1983 1984 1985 1986 1987 1988
1980 1981 1982 1983 1984 1985 1986 1987 1988
1980
1981 1982 1983 1984 1985
1986 1987 1988
1980 1981 1982 1983 1984 1985 1986
1987 1988
1980 1981 1982 1983 1984 1985 1986 1987 1933
Janvier January
185.90 213.10 241.40 254.50 261.60 260.70 251.60 244.35
375.09 445.66
515.99 619.90 644.85 695.87 695.87 693.00 693.00
76170 102540
150390 164060 157230 169940 189470 176777 162167
3130.00 3545.00
4077.00 4358.00 4402.00 4806.00 4683.00 4668.00
33.36 40.38 46.35 54.20 56.64 55.97 58.16 53.85 50.97
Juillet July
205.03 229.27 245.43 253.51 261.59 260.67 244.50 244.35
445.30
515.10 569.70 618.80 660.20 694.70
693.00 693.00
94740
129900 150400 157240
157240 189470 189470 176581
3282.00 3794.00
4283.00
4359.00 4620.00
4806.00 4688.00
4668.00
33.35 43.34 52.40 53.95 53.29 55.95 54.84 52.52
DEUTSCHLAND 1980 HAMBURG (DM)
FRANCE PARIS
(») (FF)
NEDERLAND (Fl)
LUXEMBOURG (FL)
IRELAND
(£)
HELLAS (Drs)
PORTUGAL (Esc)
1981 1982 1983 1934
1985 1986 1987 1988
1980 1981 1982 1983 1984
1985 1986 1987
1988
1980 1981 1982 1933 1984 1985
1986 1987 1988
1980 1981 1982
1983 1984 1985 1986
1987 1988
1980 1981 1982 1983 1984 1985 1986 1987
1988
1980 1981 1982 1983 1984 1985 1986
1987 1988
1980 1981 1982 1983 1984 1985 1936 1987 1988
Janvier January
214.10 243.40 273.70 251.50 260.60 263.70 253.60
154.91
388.61 470.41 545.08 674.87 688.62 747.72 747.72 757.30 757.26
Juillet July
233.31 261.59
278.76 247.45 261.59 263.70 244.50
214.94
470.80
515.90 609.00 675.40 708.10
748.30 757.30 757.26
(«) Chauffage urbain / District heating
Afin de tenir compte des facteurs saisonniers, deux séries distinctes indiquent 1β3 prix valables pour
les mois de janvier et juillet
In order to take into account seasonal factors, two separate serias indicate January and July prices
respectively

TAB 31 CHARBON INDUSTRIEL
INDUSTRIAL COAL
PRIX PAR TEC(29.3GJ-PCI) HORS TVA PRICES PER TCE(29.3GJ-NCV WITHOUT VAT
DÏOTSCHLAND 1980 DUESSELDORF (DM)
FRANCE PARIS INDUSTRIE (FF)
ITALIA MILANO (Lires)
BELGIQUE LIEGE (FB)
U.K. MOYENNE (£)
DANMARK (DK)
ESPANA (Pos)
1981 1982 1983 1984 1985 1986 1987 1988 1980 1981 1982 1983 1984 1985 1986 1987 1988 1980 1981 1982 1983 1984 1985 1986 1987 1938 1980 1981 1982 1983 1984 1985 1986 1987 1988 1980 1981 1982 1983 1984 1985 1986 1987 1988 1980 1981 1982 1983 1984 1985 1986 1987 1988 1980 1981 1982 1983 1984 1985 1986 1987 1938
Janvier January
185.90 213.10 241.40 254.50 261.60 260.70 251.60 244.35
375.09 445.66 515.99 619.90 644.85 695.87 695.87 693.00 693.00 76170 102540 150390 164060 157230 169940 189470 176777 162167 3130.00 3545.00 4077.00 4358.00 4402.00 4806.00 4688.00 4668.00
33.36 40.38 46.35 54.20 56.64 55.97 58.16 53.85 50.97
Juillet July
205.03 229.27 245.43 253.51 261.59 260.67 244.50 244.35
445.30 515.10 569.70 618.80 660.20 694.70 693.00 693.00
94740 129900 150400 157240 157240 189470 189470 176581
3282.00 3794.00 4283.00 4359.00 4620.00 4806.00 4688.00 4668.00
33.35 43.34 52.40 53.95 53.29 55.95 54.84 52.52
DEUTSCHLAND 1980 HAMBURG (DM)
FRANCE PARIS («) (FF)
NEDERLAND (Fl)
LUXEMBOURG (FL)
IRELAND (£)
HELLAS (Drs)
PORTUGAL (Esc)
1981 1982 1983 1984 1985 1986 1987 1988 1980 1981 1982 1983 1984 1985 1986 1987 1988 1980 1981 1982 1983 1984 1985 1986 1987 1938 1980 1981 1982 1983 1984 1985 1986 1987 1983 1980 1981 1982 1983 1984 1985 1986 1987 1988 1980 1981 1982 1983 1984 1985 1986 1987 1988
1980 1981 1982 1983 1984 1985 1986 1987 1988
Janvier January
214.10 243.40 273.70 251.50 260.60 263.70 253.60 154.91
388.61 470.41 545.08 674.87 688.62 747.72 747.72 757.30 757.26
Juillet July -
233.31 261.59 278.76 247.45 261.59 263.70 244.50 214.94
470.80 515.90 609.00 675.40 708.10 748.30 757.30 757.26
»
-
(·) Chauffage urbain / District heating Afin do tenir compte des facteurs saisonniers, deux séries distinctes indiquent les prix valables pour les mois de janvier et juillet In order to take into account seasonal factors, two separate series indicate January and July prices respectively

TAB. 32 ELECTRICITE DOMESTIQUE-1700 KWH PAR AN
DOMESTIC ELECTRICITY-1700 KWH PER YEAR
PRIX PAR KWH HORS TAXES PRICES PER KWH WITHOUT TAXES
DEUTSCHLANI HAMBURG (Pf)
ITALIA SETTENTR.+ CENTRALE (Lires)
BELGIQUE (FB)
U.K. LONDON (Pence)
DANMARK MOYENNE (Ore)
ESPANA (Pes)
1980 1981 1982 1983 1984 1985 1986 1987 1988 1980 1981 1982 1983 1984 1985 1986 1987 1988 1980 1981 1982 1983 1984 1985 1986 1987 1988 1980 1981 1982 1933 1984 1985 1986 1987 1988 1980 1981 1982 1983 1984 1985 1986 1987 1938 1980 1981 1982 1983 1984 1985 1986 1987 1988
Janvier January
19.74 23.76 25.16 25.16 26.79 28.54 28.54 28.54 28.54 47.39 60.43 75.63 96.67 119.29 119.89 125.39 111.02 112.02 3.93 4.36 4.78 5.52 5.76 6.02 6.10 5.80 5.90 4.54 6.01 6.67 7.22 7.22 7.34 7.49 7.33 7.33 40.53 54.16 63.70 64.29 60.07 63.14 61.80 52.71 59.16
14.01 14.66 15.53
Juillet July
28.54
114.62 117.99
5.94 5.73
7.62 7.33
61.70 52.49
14.66 15.53
FRANCE PARIS (Cent)
NEDERLAND ROTTERDAM (Cent)
LUXEMBOURG (FL)
IRELAND DUBLIN (Pence)
HELLAS (Drs)
PORTUGAL (Esc)
1980 1981 1982 1983 1984 1985 1986 1987 1988 1980 1981 1982 1983 1984 1985 1986 1987 1988 1980 1981 1982 1983 1984 1935 1986 1987 1988 1980 1981 1982 1983 1984 1985 1986 1987 1988 1980 1981 1982 1983 1984 1985 1986 1987 1988 1980 1981 1982 1983 1984 1985 1986 1987 1988
Janvier January
46.93 49.17 56.10 63.05 69.92 72.60 73.95 73.21 72.42 20.92 23.22 26.98 28.10 27.50 28.20 27.01 22.53 22.86 2.34 3.10 3.68 4.35 5.04 5.14 5.17 5.23 5.29 4.07 5.76 7.26 7.63 8.39 8.98 9.44 8.74 8.74 2.52 4.46 5.28 5.61 6.31 7.27 9.85 10.67 12.06
13.50 14.72 16.13
Juillet July
73.21
24.31 23.08
5.27 5.34
9.44 8.74
9.85 12.06
13.50 14.93
Afin de tenir compte des facteurs saisonniers, deux séries distinctes indiquent les prix valables pour les mois do janvier et juillet In order to take into account seasonal factors, two seperate series indicate January and July prices respectively

TAB. 33 ELECTRICITE DOMESTIQUE-1700 KWH PAR AN PRIX PAR KWH TAXES COMPRISES
DOMESTIC ELECTRICITY-1700 KWH PER YEAR
DEUTSCHLAND HAMBURG (Pf)
ITALIA SETTENTR.+ CENTRALE (Lires)
BELGIQUE (FB)
U.K. LONDON (Pence)
DANMARK MOYENNE (Ore)
ESPANA (Pes)
1980 1981 1982 1983 1984 1985 1986 1987 1988 1980 1981 1982 1983 1984 1985 1986 1987 1988
1980 1981 1982 1983 1984 1985 1986 1987 1988
1980 1981 1982 1983 1984 1985 1936 1987 1988 1980 1981 1982 1983 1984 1985 1986 1987 1988
1980 1981 1982 1983 1984 1985 1986 1987 1988
Janvier January
23.44 28.22 29.77 29.51 31.37 33.80 33.71 34.13 35.17 51.40 66.45 82.87
105.59 135.62 138.04 144.54 128.88 131.00
4.56 5.06 5.59 6.46 6.74 7.04 7.14 6.79 6.90
4.54 6.01 6.67 7.22 7.22 7.34 7.49 7.33 7.33
58.35 81.32 92.96 97.34 92.19 95.94 98.60
103.96 111.83
15.69 16.42 17.39
Ju i l l e t July
34.13 35.20
132.80 136.48
6.95 6.70
7.62 7.33
111.20 103.69
16.42 17.39
FRANCE PARIS (Cent)
NEDERLAND ROTTERDAM (Cent)
LUXEMBOURG (FL)
IRELAND DUBLIN (Pence)
HELLAS (Drs)
PORTUGAL (Esc)
1980 1981 1982 1983 1984 1985 1986 1987 1988 1980 1981 1982 1983 1984 1985 1986 1987 1988
1980 1981 1982 1983 1984 1985 1986 1987 1988
1980 1981 1982 1983 1984 1985 1986 1987 1988 1980 1981 1982 1983 1984 1985 1986 1987 1988
1980 1981 1982 1983 1984 1985 1986 1987 1988
PRICES PER KWH TAXES INCLUDED
Janvier January
60.13 63.02 71.89 81.44 90.31 93.77 95.51 92.24 93.54 24.68 27.40 31.84 33.16 32.73 33.56 32.14 27.04 27.43
2.93 3.26 3.86 4.57 5.35 5.45 5.48 5.54 5.61
4.07 5.76 7.26 7.63 8.39 8.98 9.44 8.74 8.74 2.72 4.82 5.70 6.17 6.95 8.00
10.96 12.59 13.99
14.58 15.90 16.13
Ju i l l e t July
94.55 91.39
28.92 27.70
5.59 5.66
9.44 8.74
10.96 14.23
14.58 16.12
Afin do tenir compte des facteurs saisonniers, deux séries distinctes indiquent les prix valables pour les mois de janvier et juillet In order to take into account seasonal factors, two separate series indicate January and July prices respectively

TAB. 34 ELECTRICITE DOMESTIQUE-3500 KWH PAR AJN (*) PRIX PAR KWH HORS TAXES
DOMESTIC ELECTRICITY-3500 KWH PER YEAR (*) PRICES PER KWH WITHOUT TAXES
DEUTSCHIANI HAMBURG (Pf)
ITALIA SETTENTR.+ CENTRALE (Lires)
BELGIQUE (FB)
U.K. LONDON (Pence)
DANMARK MOYENNE (Ore)
ESPANA (Pes)
1980 1981 1982 1983 1984 1985 1986 1987 1988 1980 1981 1982 1983 1984 1985 1986 1987 1988 1980 1981 1982 1983 1984 1985 1986 1987 1988 1980 1981 1982 1983 1984 1985 1986 1987 1988 1980 1981 1982 1983 1984 1985 1986 1987 1988 1980 1981 1982 1983 1984 1985 1986 1987 1988
Janvier January
17.00 20.54 21.71 21.71 23.00 24.49 24.49 24.49 24.49 87.01 104.60 120.71 148.57 202.34 213.19 220.04 182.14 179.59 3.03 3.41 3.77 4.36 4.50 4.73 4.68 4.41 4.47 3.49 4.55 5.03 5.44 5.44 5.53 5.64 5.46 5.46 34.12 46.59 55.17 54.57 48.50 50.13 48.10 40.59 46.78
10.79 11.34 12.06
Juillet July
24.49
182.74 190.78
4.53 4.32
5.66 5.46
48.00 40.22
11.34 12.06
FRANCE PARIS (Cent)
NEDERLAND ROTTERDAM (Cent)
LUXEMBOURG (FL)
IRELAND DUBLIN (Pence)
HELLAS ΑΊΉΙΝΑΙ (Drs)
PORTUGAL (Esc)
1980 1981 1982 1983 1984 1985 1986 1987 1988 1980 1981 1982 1983 1984 1985 1986 1987 1988 1980 1981 1982 1983 1984 1985 1986 1987 1988 1980 1981 1982 1983 1984 1985 1986 1987 1988 1980 1981 1982 1983 1984 1985 1986 1987 1988 1980 1981 1982 1983 1984 1985 1986 1987 1988
Janvier January
36.34 38.15 44.17 50.14 56.66 59.82 61.86 61.25 61.13 17.69 20.16 24.06 25.07 24.40 25.11 23.91 19.14 19.18 2.49 2.68 3.14 3.40 3.92 3.99 3.84 3.88 3.93 3.23 4.69 5.91 5.95 6.47 6.91 7.18 6.45 6.45 2.14 3.82 4.41 4.68 5.26 6.25 8.58 9.29 10.46
13.40 14.61 16.00
Juillet July
61.24
21.21 19.69
3.91 3.95
7.00 6.45
8.58 10.46
13.39 14.81
(·) Dont 1300 Kwh de nuit - sauf Italie et Danemark of which 1300 Kwh at night - except Italy and Danmark
Afin do tenir compte des facteurs saisonniers, deux séries distinctes indiquent les prix valables pour les mois de janvier et juillet In order to take into account seasonal factors, two soperate 3ories indicato January and July prices respectively

TAB. 35 ELECTRICITE DOMESTIQUE-3500 KWH PAR AN (*)
DOMESTIC ELECTRICITY-3500 KWH PER YEAR (»)
PRIX PAR KWH TAXES COMPRISES PRICES PER KWH TAXES INCLUDED
DEUTSCHLANI HAMBURG (Pf)
ITALIA SETTENTR.+ CENTRALE (Lires)
BELGIQUE (FB)
U.K. LONDON (Pence)
DANMARK MOYENNE (Ore)
ESPANA (Pes)
1980 1981 1982 1983 1984 1985 1986 1987 1988 1980 1981 1982 1983 1984 1985 1986 1987 1938 1980 1981 1982 1983 1984 1985 1986 1987 1988 1980 1981 1982 1983 1984 1985 1986 1987 1988 1980 1981 1982 1983 1984 1985 1986 1987 1988 1980 1981 1982 1983 1984 1985 1986 1987 1988
Janvier January
20.18 24.40 25.68 25.46 27.24 29.00 28.92 29.29 30.18 93.40 114.16 131.55 161.64 231.60 246.66 255.21 213.90 213.30 3.51 3.96 4.41 5.10 5.27 5.53 5.48 5.16 5.23 3.49 4.55 5.03 5.44 5.44 5.53 5.64 5.46 5.46 50.64 72.08 82.55 85.48 78.08 80.07 81.80 89.17 96.72
12.09 12.70 13.50
Juillet July
29.29 30.21
214.55 219.68
5.30 5.05
5.66 5.46
94.50 88.72
12.70 13.50
FRANCE PARIS (Cent)
NEDERLAND rølTKKDAM (Cent)
LUXEMBOURG (FL)
IRELAND DUBLIN (Pence)
HELLAS ATHINAI (Drs)
PORTUGAL (Esc)
1980 1981 1982 1983 1984 1985 1986 1987 1988 1980 1981 1982 1983 1984 1985 1986 1987 1988 1980 1981 1982 1983 1984 1985 1986 1987 1988 1980 1981 1982 1983 1984 1985 1986 1987 1988 1980 1981 1982 1983 1984 1985 1986 1987 1988 1980 1981 1982 1983 1984 1985 1986 1987 1988
Janvier January
46.58 48.89 56.60 64.76 73.18 77.26 79.90 77.17 78.96 20.88 23.79 28.39 29.58 29.05 29.83 28.45 22.97 23.02 2.61 2.81 3.30 3.57 4.15 4.23 4.07 4.11 4.16 3.23 4.69 5.91 5.95 6.47 6.91 7.18 6.45 6.45 2.31 4.13 4.76 5.15 5.79 6.88 9.55 10.96 12.13
14.47 15.78 17.28
Juillet July
79.10 77.15
25.24 23.63
4.15 4.19
7.00 6.45
9.55 12.34
14.46 16.00
(«) Dont 1300 Kwh de nuit - sauf Italie et Danemark of which 1300 Kwh at night - except Italy and Danmark
Afin do tenir compte des facteurs saisonniers, deux séries distinotoa indiquent les prix valables pour les mois de janvier et Juillet In order to take into account seasonal factors, two separate series indicate January and July prices respectively

TAB. 36 ELECTRICITE DOMESTIQUE-13000 KWH PAR AN (*) PRIX PAR KWH HORS TAXES
DOMESTIC ELECTRICITY-13000 KWH PER YEAR (*) PRICES PER KWH WITHOUT TAXES
BTOTSCHLAND 1980 HAMBURG (Pf)
ITALIA (Lires)
BELGIQUE (FB)
U.K. LONDON (Pence)
DANMARK MOYENNE (Ore)
ESPANA (Pes)
1981 1982 1983 1984 1985 1986 1987 1988 1980 1981 1982 1983 1984 1985 1986 1987 1988 1980 1981 1982 1983 1984 1985 1986 1987 1988 1980 1981 1982 1983 1984 1985 1986 1987 1988 1980 1981 1982 1983 1984 1985 1986 1987 1988 1980 1981 1982 1983 1984 1985 1986 1987 1988
Janvier January
8.60 9.62 11.79 12.23 12.57 12.95 12.95 12.95 12.95
2.03 2.37 2.65 3.08 3.12 3.17 2.99 2.73 2.74 2.10 2.77 3.03 3.24 3.24 3.31 3.40 3.24 3.24 29.69 41.37 49.28 47.87 40.51 41.15 38.60 29.82 33.60
7.89 8.33 8.67
Juillet July
12.95
2.33 2.61
3.33 3.24
38.50 25.67
8.33 8.67
FRANCE PARIS (Cent)
NEDERLAND ROTTERDAM (Cent)
LUXEMBOURG (FL)
IRELAND DUBLIN (Pence)
HELLAS (Drs)
PORTUGAL (Esc)
1980 1981 1982 1933 1934 1985 1986 1987 1988 1980 1981 1982 1983 1934 1985 1986 1987 1988 I960 1981 1982 1983 1984 1985 1986 1987 1988 1980 1981 1982 1983 1984 1985 1986 1987 1988 1980 1981 1982 1983 1984 1985 1986 1987 1988 1980 1981 1982 1983 1984 1985 1986 1987 1988
Janvier January
26.78 28.17 32.78 37.29 42.36 44.81 46.55 46.08 45.99 13.59 15.93 19.69 20.62 19.86 20.56 19.36 14.16 13.43 1.41 1.54 2.01 2.31 2.68 2.73 2.63 2.67 2.70 2.57 3.76 4.73 4.45 4.77 5.07 5.18 4.41 4.41 1.59 2.94 3.30 3.50 3.93 4.91 6.68 7.23 8.11
10.80 11.78 12.62
Juillet July
46.08
16.67 14.71
2.69 2.73
4.82 4.41
6.68 8.11
10.80 11.92
(») Dont 9500 Kwh de nuit sauf Danemark of which 9500 Kwh at night except Danmark
Afin de tenir compte des facteurs saisonniers, deux séries distinctes indiquent les prix valables pour les mois de janvier et juillet In order to take into account seasonal factors, two separate series indicate January and July prices respectively

TAB 37 ELECTRICITE DOMESTIQUE-13000 KWH PAR AN (*) PRIX PAR KWH TAXES COMPRISES
DOMESTIC ELECTRICITY-13000 KWH PER YEAR (*) PRICES PER KWH TAXES INCLUDED
DEUTSCHIANI HAMBURG (Pf)
ITALIA (Lires)
BELGIQUE (FB)
U.K. IONDON (Pence)
DANMARK MOYENNE (Ore)
KSPANA (Pes)
1980 1981 1982 1983 1984 1985 1986 1987 1988 1980 1981 1982 1983 1984 1985 1986 1987 1988 1980 1981 1982 1983 1984 1985 1986 1987 1988 1980 1981 1982 1983 1984 1985 1986 1987 1988 1980 1981 1982 1983 1984 1985 1986 1987 1988 1980 1981 1982 1983 1984 1985 1935 1987 1988
Janvier January
10.21 11.42 13.95 14.34 14.88 15.34 15.29 15.49 15.96
2.35 2.75 3.10 3.60 3.65 3.71 3.50 3.19 3.21 2.10 2.77 3.03 3.24 3.24 3.31 3.40 3.24 3.24 45.32 65.72 75.37 77.31 68.33 69.11 70.30 73.07 77.68
8.84 9.34 9.71
Juillet July
15.49 15.97
3.31 3.05
3.33 3.24
82.90 70.97
9.34 9.71
FRANCE PARIS (Cent)
NEDERLAND ROTTERDAM (Cent)
LUXEMBOURG (FL)
IRELAND DUBLIN (Pence)
HELLAS (Drs)
PORTUGAL (Esc)
1980 1981 1982 1983 1984 1985 1986 1987 1988 1980 1981 1982 1983 1984 1985 1986 1987 1988 1980 1981 1982 1983 1984 1985 1986 1987 1988 1980 1981 1982 1983 1984 1985 1986 1987 1988 1980 1981 1982 1983 1984 1985 1986 1987 1988 1980 1981 1982 1983 1984 1985 1986 1987 1988
Janvier January
34.32 36.10 42.01 48.16 54.71 57.87 60.12 58.06 59.40 16.03 18.80 23.23 24.33 23.64 24.47 23.04 16.99 16.12 1.49 1.62 2.11 2.42 2.84 2.90 2.79 2.83 2.86 2.57 3.76 4.73 4.45 4.77 5.07 5.18 4.41 4.41 1.72 3.18 3.56 3.85 4.32 5.40 7.44 8.53 9.41
11.66 12.72 13.62
Juillet July
59.52 58.03
19.83 17.65
2.85 2.89
4.82 4.41
7.44 9.57
11.66 12.87
(«) Dont 9500 Kwh de nuit sauf Danemark of which 9500 Kwh at night except Danmark
Afin do tenir compte dos facteurs saisonniers, doux séries distinctes indiquent les prix valables pour les mois de janvier et juillet In order to tako into account seasonal factors, two separate 3eries indicate January and July prices respectively

TAB. 38 ELECTRICITE INDUSTRIELLE-1.25 GWH PAR AN (*) PRIX PAR KWH HORS TAXES
INDUSTRIAL ELECTRICITY-1.25 GWH PER YEAR (*) PRICES PER KWH WITHOUT TAXES
DEUTSCHLAND 1980 HOCHINDUSTF REGION (Pf)
ITALIA SETTENTR.+ CENTRALE (Lires)
BELGIQUE (FB)
U.K. YORKSHIRE (Pence)
DANMARK MOYENNE (Ore)
ESPANA (Pes)
1.1981 1982 1983 1984 1985 1986 1987 1988 1980 1981 1982 1983 1984 1985 1986 1987 1988 1980 1981 1982 1983 1984 1985 1986 1987 1988 1980 1981 1982 1983 1984 1985 1986 1987 1988 1980 1981 1982 1983 1984 1985 1986 1987 1988 1980 1981 1982 1983 1984 1985 1986 1987 1988
Janvier January
13.95 15.50 17.59 17.59 18.62 18.87 20.27 20.86 20.86 56.80 70.91 86.26 106.57 116.69 144.17 151.02 113.02 110.47 2.43 2.73 2.94 3.43 3.55 3.65 3.61 3.34 3.36 2.86 3.48 4.03 4.34 4.23 4.34 4.50 4.53 4.58 25.89 37.17 42.81 41.07 34.98 37.60 36.40 28.11 34.29
9.76 10.91 11.16
Juillet July
20.27
113.62 120.32
3.45 3.21
4.51 4.55
36.10 27.76
10.91 11.37
FRANCE (Cent)
NEDERLAND ROTTERDAM (Cent)
LUXEMBOURG (FL)
IRELAND DUBLIN (Pence)
HELLAS (Drs)
PORTUGAL (Esc)
1980 1981 1982 1983 1984 1985 1986 1987 1988 1980 1981 1982 1983 1984 1985 1986 1987 1988 1980 1981 1982 1983 1984 1985 1986 1987 1988 1980 1981 1982 1983 1984 1985 1986 1987 1988 1980 1981 1982 1983 1984 1985 1986 1987 1988 1980 1981 1982 1983 1984 1985 1986 1987 1988
Janvier January
27.88 29.67 34.32 39.25 44.11 47.08 48.06 47.57 47.93 16.72 19.31 23.40 22.95 22.80 23.61 21.97 17.05 17.27 1.89 2.13 2.52 2.87 3.40 3.46 3.43 3.50 3.56 3.31 4.94 6.27 6.44 6.69 6.93 6.93 6.44 6.44 2.26 3.63 3.66 5.22 5.88 7.20 9.65 11.10 11.10
11.60 12.65 13.12
Juillet July
47.58 47.56
19.25 17.59
3.55 3.60
6.75 6.44
9.65 11.10
11.60 12.53
(») 500 Kw - 2500 h Afin de tenir compte des facteurs saisonniers, deux séries distinctes indiquent les prix valables pour les mois do janvier et juillet In order to take into account seasonal factors, two separate series indicate January and July prices respectively

TAB 37 ELECTRICITE DOMESTIQUE-13000 KWH PAR AN (*) PRIX PAR KWH TAXES COMPRISES
DOMESTIC ELECTRICITY-13000 KWH PER YEAR (*) PRICES PER KWH TAXES INCLUDED
DEUTSCHIANI HAMBURG
(Pf)
ITALIA (Lires)
BELGIQUE (FB)
U.K. I.ONDON (Pence)
DANMARK
MOYENNE (Ore)
ESPANA (Pos)
1980 1981 1982 1983 1984 1985 1986 1987 1988
1980 1981 1982 1983 1984
1985 1986 1987 1988
1980 1981 1982 1983 1984 1985 1986 1987
1988
1980 1981 1982
1983 1984 1985 1986 1987 1988
1980
1981 1982 1983 1984 1985 1986 1987 1988
1980 1981 1982 1983 1984 1985
1986 1987 1988
Janvier January
10.21 11.42 13.95 14.34 14.88 15.34 15.29 15.49 15.96
2.35 2.75 3.10 3.60 3.65 3.71 3.50
3.19 3.21
2.10 2.77 3.03 3.24 3.24 3.31 3.40 3.24 3.24
45.32
65.72 75.37
77.31 68.33 69.11
70.30 73.07 77.68
8.84 9.34 9.71
■
Juillet July
15.49 15.97
3.31 3.05
3.33
3.24
82.90 70.97
9.34 9.71
FRANCE PARIS (Cent)
NEDERLAND ROTTERDAM
(Cent)
LUXEMBOURG
(FL)
IRELAND DUBLIN (Pence)
HELLAS (Drs)
PORTUGAL (Esc)
1980 1981 1982 1983 1984 1985 1986 1987 1988
1980
1981 1982 1983 1984
1985
1986 1987 1988
1980 1981 1982 1983 1984 1985 1986 1987 1988
1980 1981 1982 1983 1984 1985 1986 1987 1988
1980
1981 1982 1983 1984 1985 1986
1987 1988
1980 1981 1982 1983 1984 1985 1986 1987 1988
Janvier January
34.32 36.10
42.01 48.16 54.71 57.87 60.12 58.06 59.40
16.03 18.80 23.23 24.33 23.64 24.47
23.04
16.99 16.12
1.49 1.62 2.11 2.42 2.84 2.90
2.79 2.83
2.86
2.57 3.76 4.73 4.45 4.77 5.07 5.18 4.41 4.41
1.72
3.18 3.56 3.85 4.32
5.40 7.44 8.53 9.41
11.66 12.72
13.62
Juillet July
59.52 58.03
19.83
17.65
2.85
2.89
4.82
4.41
7.44 9.57
11.66 12.87
(«) Dont 9500 Kwh de nuit sauf Danemark
of which 9500 Kwh at night except Danmark
Afin do tenir compte dos facteurs saisonniers, deux séries distinctes indiquent les prix valables pour
les mois de janvier et juillet
In order to take into account seasonal factors, two seperate 3eries indicate January and July prices
respectively

TAB. 38 ELECTRICITE INDUSTRIELLE-1.25 GWH PAR AN (*) PRIX PAR KWH HORS TAXES
INDUSTRIAL ELECTRICITY-1.25 GWH PER YEAR (*) PRICES PER KWH WITHOUT TAXES
DEUTSCHIANI HOCHINDUSTF REGION (Pf)
ITALIA SETTENTR.+ CENTRALE (Lires)
BELGIQUE (FB)
U.K. YORKSHIRE (Pence)
DANMARK MOYENNE (Ore)
ESPANA (Pes)
1980 .1981 1982 1983 1984 1985 1986 1987 1988 1980 1981 1982 1983 1984 1985 1986 1987 1988 1980 1981 1982 1983 1984 1985 1986 1987 1988 1980 1981 1982 1983 1984 1985 1986 1987 1988 1980 1981 1982 1983 1984 1985 1986 1987 1988 1980 1981 1982 1983 1984 1985 1986 1987 1988
Janvier January
13.95 15.50 17.59 17.59 18.62 18.87 20.27 20.86 20.86 56.80 70.91 86.26 106.57 116.69 144.17 151.02 113.02 110.47 2.43 2.73 2.94 3.43 3.55 3.65 3.61 3.34 3.36 2.86 3.48 4.03 4.34 4.23 4.34 4.50 4.53 4.58 25.89 37.17 42.81 41.07 34.98 37.60 36.40 28.11 34.29
9.76 10.91 11.16
Juillet July
20.27
113.62 120.32
3.45 3.21
4.51 4.55
36.10 27.76
10.91 11.37
FRANCE (Cent)
NEDERLAND ROTTERDAM (Cent)
LUXEMBOURG (FL)
IRELAND DUBLIN (Pence)
HELLAS (Drs)
PORTUGAL (Esc)
1980 1981 1982 1983 1984 1985 1986 1987 1988 1980 1981 1982 1983 1984 1985 1986 1987 1988 1980 1981 1932 1983 1984 1985 1986 1987 1988 1980 1981 1982 1983 1984 1985 1986 1987 1988 1980 1981 1982 1983 1984 1985 1986 1987 1988 1980 1981 1982 1983 1984 1985 1986 1987 1988
Janvier January
27.88 29.67 34.32 39.25 44.11 47.08 48.06 47.57 47.93 16.72 19.31 23.40 22.95 22.80 23.61 21.97 17.05 17.27 1.89 2.13 2.52 2.B7 3.40 3.46 3.43 3.50 3.56 3.31 4.94 6.27 6.44 6.69 6.93 6.93 6.44 6.44 2.26 3.63 3.66 5.22 5.88 7.20 9.65 11.10 11.10
11.60 12.65 13.12
Juillet July
47.58 47.56
19.25 17.59
3.55 3.60
6.75 6.44
9.65 11.10
11.60 12.53
(·) 500 Kw - 2500 h Afin de tenir compte des racteure saisonniers, deux séries distinctes indiquent les prix valables pour los mois de janvior et juillet In order to take into account seasonal factors, two separate eeries Indicate January and July prices respectively

TAB. 39 ELECTRICITE INDUSTRIELLE-1.25 GWH PAR AN (*) PRIX PAR KWH HORS TVA
INDUSTRIAL ELECTRICITY-1.25 GWH PER YEAR (*) PRICES PER KWH WITHOUT VAT
DEUTSCHLAND HOCHINDUSTR REGION (Pf)
ITALIA SETTENTR.+ CENTRALE (L ire s )
BELGIQUE (FB)
U.K. YORKSHIRE (Pence)
1980 .1981 1982 1983 1984 1985 1986 1987 1988
1980 1981 1982 1983 1984 1985 1986 1987 1988
1980 1981 1982 1983 1984 1985 1986 1987 1988
1980 1981 1982 1983 1984 1985 1986 1987 1988
DANMARK ( « 0 1 9 8 0 MOYENNE (Ore)
ESPANA (Pos)
1981 1982 1983 1984 1985 1986 1987 1988
1980 1981 1982 1983 1984 1985 1986 1987 1988
Janvier January
14 .69 1 6 . 3 2 1 8 . 4 3 18 .29 19 .36 1 9 . 6 2 2 1 . 0 2 21 .90 2 2 . 5 1
57 .20 72 .01 8 7 . 3 6
107.67 126 .79 155.27 163 .12 125 .12 126.57
2 . 4 3 2 . 7 3 2 .94 3 . 4 3 3 .55 3 .65 3 . 6 1 3 .34 3 .36
2 .86 3 . 4 8 4 . 0 3 4 .34 4 . 2 3 4 .34 4 .50 4 . 5 3 4 .58
25 .89 37 .17 4 2 . 8 1 41 .07 3 4 . 9 8 37 .60 36 .40 28 .11 34 .29
9 .76 10 .91 11 .16
J u i l l e t July
21 .30 2 2 . 6 1
125 .72 132 .42
3 .45 3 . 2 1
4 . 5 1 4 .55
36 .10 27 .76
1 0 . 9 1 11 .37
FRANCE (Cent)
NEDERLAND ROTTERDAM (Cent)
LUXEMBOURG (FL)
IRELAND DUBLIN (Pence)
HELLAS (Drs)
PORTUGAL (Esc)
1980 1981 1982 1983 1934 1935 1986 1987 1988
1980 1981 1982 1983 1984 1985 1986 1987 1988
1980 1981 1982 1983 1984 1985 1986 1987 1988
1980 1981 1982 1983 1984 1985 1986 1987 1988
1980 1981 1982 1983 1984 1985 1986 1987 1988
1980 1981 1982 1983 1984 1985 1986 1987 1988
Janvier January
2 7 . 8 8 29.67 34 .32 39 .25 4 4 . 1 1 4 7 . 0 8 48 .06 47.57 4 7 . 9 3
16 .72 19 .31 23 .40 22 .95 22 .80 23 .61 21.97 17 .05 17.27
1.89 2 . 1 3 2 .52 2 .87 3 .40 3 .46 3 . 4 3 3 .50 3 .56
3 . 3 1 4 .94 6 .27 6 .44 6 .69 6 . 9 3 6 . 9 3 6 .44 6 .44
2 .26 3 . 6 3 3 .66 5 .22 5 .88 7 .20 9 .65
11 .10 11 .10
11 .60 12 .65 13 .12
J u i l l e t July
4 7 . 5 8 47 .56
19.25 17 .59
3 .55 3 .60
6 .75 6 .44
9 .65 11 .10
11 .60 1 2 . 5 3
) 500 Kw - 2500 h >) Le prix hors TVA ne comprend pas la taxe spéciale
déductible de: The price excluding VAT does not include the deductible specific tax of:
Afin de tenir compte des facteurs saisonniers, deux séries distinctes indiquent les prix valables pour lee mois de janvier et juillet In order to take into account seasonal factors, two separate series indicate January and July prices respectively
8 Qre/Kwh 12.5 12.5 15.5 15.5 15.5 19 32.5 32.5
1980/1 12.5 1981/1 12.5 1982/1 14.3 1983/1 15.5 1984/1 15.5 1985/1 15.5 1986/1 29.5 1987/1 32.5 1988/1
Ore/Kwh 1980/7 1981/7 1982/7 1983/7 1984/7 1985/7 1986/7 1987/7

TAB. 40 ELECTRICITE INDUSTRIELLE-10 GWH PAR AN (*)
INDUSTRIAL ELECTRICITY-10 GWH PER YEAR (*)
PRIX PAR KWH HORS TAXES PRICES PER KWH WITHOUT TAXES
DEUTSCHLAND 1980 H0CHINDUSTR.1981 REGION (Pf)
ITALIA SETTENTR.4 CENTRALE (Lires)
BELGIQUE (FB)
U.K. YORKSHIRE (Pence)
DANMARK MOYENNE (Ore)
ESPANA (Pes)
1982 1983 1984 1985 1986 1987 1988 1980 1981 1982 1983 1984 1985 1986 1987 1988 1980 1981 1982 1983 1984 1985 1986 1987 1988 1980 1981 1982 1983 1984 1985 1986 1987 1988 1980 1981 1982 1983 1984 1985 1986 1987 1988 1980 1981 1982 1983 1984 1985 1986 1987 1988
Janvier January
11.10 12.43 14.24 14.24 15.10 15.30 16.55 17.13 17.13 50.64 63.72 78.83 100.42 109.57 124.10 129.54 102.75 100.13 1.96 2.26 2.45 2.89 2.96 3.06 3.02 2.74 2.75 2.56 3.11 3.61 3.86 3.76 3.87 4.01 4.01 4.06 24.44 35.30 40.53 38.94 32.57 36.40 31.30 24.49 30.03
8.06 8.99 9.33
Juillet July
16.55
100.09 105.57
2.86 2.60
3.99 4.03
30.50 24.29
8.99 9.33
FRANCE (Cent)
NEDERLAND ROTTERDAM (Cent)
LUXEMBOURG (FL)
IRELAND DUBLIN (Pence)
HELLAS (Drs)
PORTUGAL (Esc)
1980 1981 1982 1983 1984 1985 1986 1987 1988 1930 1981 1982 1983 1984 1985 1986 1987 1988 1980 1981 1982 1983 1984 1985 1986 1987 1988 1980 1981 1982 1983 1984 1985 1986 1987 1938 1980 1981 1982 1983 1984 1985 1986 1987 1988 1980 1981 1982 1983 1984 1985 1986 1987 1988
Janvier January
23.74 25.35 29.03 32.71 36.51 38.60 39.46 39.13 38.62 14.52 16.12 20.60 19.43 19.32 20.25 18.64 13.51 13.71 1.44 1.62 1.96 2.25 2.71 2.75 2.54 2.60 2.66 2.86 4.24 5.43 5.50 5.78 5.93 5.93 4.92 4.92 1.86 3.11 3.08 4.43 4.98 6.70 9.00 10.34 10.34
10.55 11.50 11.89
Juillet July
39.07 38.62
15.96 14.04
2.65 2.70
5.46 4.92
9.00 10.34
10.55 11.39
(·) 2508 Kw - 4000 h Afin de tenir compte des facteurs saisonniers, deux séries distinctes indiquent les prix valables pour les mois de janvier et juillet In order to take into account seasonal factors, two separate series indicate January and July prices respectively

TAB. 41 ELECTRICITE INDUSTRIELLE-10 GWH PAR AN (») PRIX PAR KWH HORS TVA
INDUSTRIAL ELECTRICITY-lø GWH PER YEAR (*) PRICES PER KWH WITHOUT VAT
DEUTSCHLAND 1980 H0CHINDUSTR.1981 REGION 1982 (Pf) 1983
1984 1985 1986 1987 1988
ITALIA 1980 SETTENTR.+ 1981 CENTRALE 1982 (L ires ) 1983
1984 1985 1986 1987 1988
BELGIQUE 1980 (FB) 1981
1982 1983 1984 1985 1986 1987 1988
U.K. 1980 YORKSHIRE 1981 (Pence) 1982
1983 1984 1985 1986 1987 1988
DANMARK ( « 0 1 9 8 0 MOYENNE 1981 (Ore) 1982
1983 1984 1985 1986 1987 1988
ESPANA 1980 (Pes) 1981
1982 1983 1984 1985 1986 1987 1988
2500 Kw - 4000 h ) Le prix hors TVA ne
déductible de: The price excluding specific tax of:
Janvier January
11 .69 13 .09 14 .92 14 .81 1 5 . 7 1 1 5 . 9 1 17 .16 17 .99 18 .48
50 .96 64 .48 79 .59
101 .18 110 .33 124.86 130.30 103 .01 100 .89
1 .96 2 .26 2 .45 2 .89 2 .96 3 .06 3 . 0 2 2 .74 2 .75
2 .56 3 . 1 1 3 . 6 1 3 .86 3 .76 3 .87 4 . 0 1 4 .01 4 .06
24 .44 35 .30 4 0 . 5 3 38 .94 32 .57 36 .40 31 .30 24 .49 3 0 . 0 3
8 .06 8 .99 9 . 3 3
comprend pas
VAT does not
J u i l l e t Ju ly
17 .39 18 .57
100.85 106 .33
2 . 8 6 2 .6 0
3 . 9 9 4 . 0 3
30 .50 24 .29
8 . 9 9 9 . 3 3
la taxe spéci
include the d
FRANCE (Cent)
NEDERLAND ROTTERDAM (Cent)
LUXEMBOURG (FL)
IRELAND DUBLIN (Pence)
HELLAS (Drs)
PORTUGAL (Esc)
i l e 8 12.5
Bductible 12.5 15.5 15.5 15.5 19 32.5 32.5
1980 1981 1932 1983 1984 1985 1936 1987 1988
1930 1981 1982 1983 1984 1985 1986 1987 1988
1980 1981 1982 1983 1984 1985 1986 1987 1988
1930 1981 1982 1983 1984 1985 1986 1987 1983
1980 1981 1982 1983 1984 1985 1986 1987 1988
1980 1981 1982 1983 1984 1985 1986 1987 1988
Ore/Kwh
Janvier January
23 .74 25 .35 2 9 . 0 3 32 .71 3 6 . 5 1 38 .60 39 .46 3 9 . 1 3 38 .62
14 .52 16 .12 20 .60 1 9 . 4 3 1 9 . 3 2 20 .25 18 .64 13 .51 13 .71
1 .44 1 .62 1.96 2 .25 2 . 7 1 2 .75 2 .54 2 .60 2 .66
2 .86 4 .24 5 . 4 3 5 .50 5 .78 5 . 9 3 5 . 9 3 4 . 9 2 4 . 9 2
1 .86 3 .11 3 . 0 8 4 . 4 3 4 .98 6 .70 9 .00
10 .34 10 .34
10 .55 11 .50 11 .89
J u i l l e t July
39.07 38 .62
15 .96 14 .04
2 .65 2 .70
5 .46 4 . 9 2
9 .00 10 .34
10 .55 11 .39
1980/1 12.5 Ore/Kwh 1981/1 12.5 1982/1 14.3 1983/1 15.5 1984/1 15.5 1985/i 15.5 1986/1 29.5 1987/1 32.5 1988/1
1980/7 1981/7 1982/7 1983/7 1984/7 1985/7 1986/7 1987/7
Afin de tenir compte des facteurs saisonniers, deux séries distinctes indiquent les prix valables pour les mois de janvier et juillet In order to take into account seasonal factors, two separate series indicate January and July prices respectively
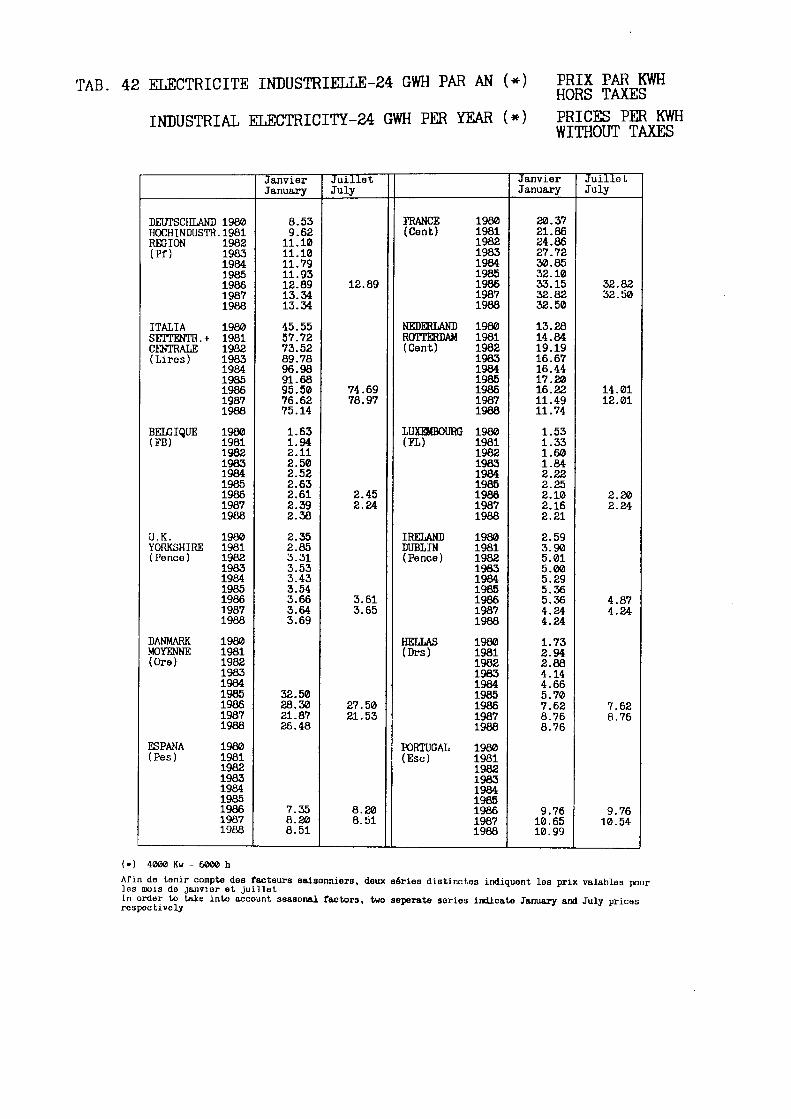
TAB. 42 ELECTRICITE INDUSTRIELLE-24 GWH PAR AN (») PRIX JARKWH HORS lAXEb
INDUSTRIAL ELECTRICITY-24 GWH PER YEAR ( · ) PRICESί PER KWH W1THOUI lAXEo
DEUTSCHIANI HOCHINDUSTF REGION (Pf)
ITALIA SETTENTn.t CENTRALE (Lires)
BELGIQUE (FB)
U.K. YORKSHIRE (Pence)
DANMARK MOYENNE (Ore)
ESPANA (Pes)
1980 .1981 1982 1983 1984 1985 1986 1987 1988 1980 1981 1982 1983 1984 1985 1986 1987 1988 1980 1981 1982 1983 1984 1985 1986 1987 1988 1980 1981 1982 1983 1984 1985 1986 1987 1988 1980 1981 1982 1983 1984 1985 1986 1987 1988 1980 1981 1982 1983 1984 1985 1986 1987 1988
Janvier January
8.53 9.62 11.10 11.10 11.79 11.93 12.89 13.34 13.34 45.55 57.72 73.52 89.78 96.98 91.68 95.50 76.62 75.14 1.63 1.94 2.11 2.50 2.52 2.63 2.61 2.39 2.38 2.35 2.85 3.31 3.53 3.43 3.54 3.66 3.64 3.69
32.50 28.30 21.87 26.48
7.35 8.20 8.51
Juillet July
12.89
74.69 78.97
2.45 2.24
3.61 3.65
27.50 21.53
8.20 8.51
FRANCE (Cent)
NEDERLAND ROTTERDAM (Cent)
LUXEMBOURG (FL)
IRELAND DUBLIN (Pence)
HELLAS (Drs)
PORTUGAL (Esc)
1980 1981 1982 1983 1984 1985 1986 1987 1988 1980 1981 1982 1983 1984 1985 1986 1987 1988 1980 1981 1982 1983 1984 1985 1986 1987 1988 1980 1981 1982 1983 1984 1935 1986 1987 1988 1980 1981 1982 1933 1984 1985 1986 1987 1988 1980 1981 1982 1983 1984 1985 1986 1987 1988
Janvier January
20.37 21.86 24.86 27.72 30.85 32.10 33.15 32.82 32.50 13.28 14.84 19.19 16.67 16.44 17.20 16.22 11.49 11.74 1.53 1.33 1.60 1.84 2.22 2.25 2.10 2.16 2.21 2.59 3.90 5.01 5.00 5.29 5.36 5.36 4.24 4.24 1.73 2.94 2.88 4.14 4.66 5.70 7.62 8.76 8.76
9.76 10.65 10.99
Juillet July
32.82 32.50
14.01 12.01
2.20 2.24
4.87 4.24
7.62 8.76
9.76 10.54
(») 40Ö0 Kw - 6000 h Afin de tenir compte des facteurs saisonniers, deux séries distinctes indiquent les prix valables pour las mois do janvier et juillet In order to take into account seasonal factors, respectively
two seperate eeries indicate January and July prices

TAB. 43 ELECTRICITE INDUSTRIELLEM GWH PAR AN (*) PRIX PAR KWH HORS TVA
INDUSTRIAL ELECTRICITY-24 GWH PER YEAR (*) PRICES PER KWH WITHOUT VAT
DEUTSCHLAND HOCHINDUSTR REGION (Pf)
ITALIA SETTENTR.+ CENTRALE ( L i r e s )
BELGIQUE (FB)
U.K. YORKSHIRE (Pence)
DANMARK (»« MOYENNE (Ore)
ESPANA (Pos)
1980 .1981 1982 1983 1984 1985 1986 1987 1988
1980 1981 1982 1983 1984 1985 1986 1987 1988
1980 1981 1982 1983 1984 1985 1986 1987 1988
1980 1981 1982 1983 1984 1985 1986 1987 1988
)198ø 1981 1982 1983 1984 1985 1986 1987 1988
1980 1981 1982 1983 1984 1985 1986 1987 1988
Janvier January
8.98 10.13 11.63 11.54 12.26 12.41 13.37 14.01 14.39
45.86 58.03 74.23 90.48 97.68 92.38 96.20 77.32 75.84
1.63 1.94 2.11 2.50 2.52 2.63 2.61 2.39 2.38
2.35 2.85 3.31 3.53 3.43 3.54 3.66 3.64 3.69
32.50 28.30 21.87 26.48
7.35 8.20 8.51
Ju i l l e t July
13.55 14.46
75.39 79.67
2.45 2.24
3.61 3.65
27.50 21.53
8.20 8.51
FRANCE (Cent)
NEDERLAND ROTTERDAM (Cent)
LUXEMBOURG (FL)
IRELAND DUBLIN (Pence)
HELLAS (Drs)
PORTUGAL (Esc)
1980 1981 1982 1983 1984 1985 1986 1987 1988
1980 1981 1982 1983 1984 1985 1986 1987 1988
1980 1981 1982 1983 1984 1985 1986 1987 1988
1980 1981 1982 1983 1984 1985 1986 1987 1988
1980 1981 1982 1983 1984 1985 1986 1987 1988
1980 1981 1982 1983 1934 1935 1986 1987 1988
Janvier January
20.37 21.86 24.86 27.72 30.85 32.10 33.15 32.82 32.50
13.28 14.84 19.19 16.67 16.44 17.20 16.22 11.49 11.74
1.53 1.33 1.60 1.84 2.22 2.25 2.10 2.16 2.21
2.59 3.90 5.01 5.00 5.29 5.36 5.36 4.24 4.24
1.73 2.94 2.88 4.14 4.66 5.70 7.62 8.76 8.76
9.76 10.65 10.99
Ju i l l e t July
32.82 32.50
14.01 12.01
2.20 2.24
4.87 4.24
7.62 8.76
9.76 10.54
4000 Kw - 6000 h la prix hors TVA no comprend pas la taxe spécialo déductible de: The price excluding VAT does not include the deductible specific tax of:
Afin do tenir compte des facteurs saisonniers, deux séries distinctes indiquent les prix va Labios pour les mois de janvier et juillet In order to take into account seasonal factors, two separate 3eries indicate January and July prices rospecLively
8 Ore/Kwh 1980/1 12.5 Ore/Kwh 1980/7 12.5 12.5 15.5 15.5 15.5 19 32.5 32.5
1981/1 12.5 1982/1 14.3 1983/1 15.5 1984/1 15.5 1985/1 15.5 1986/1 29.5 , 1987/1 32.5 1988/1
1981/7 1982/7 1983/7 1984/7 1985/7 1986/7 1987/7
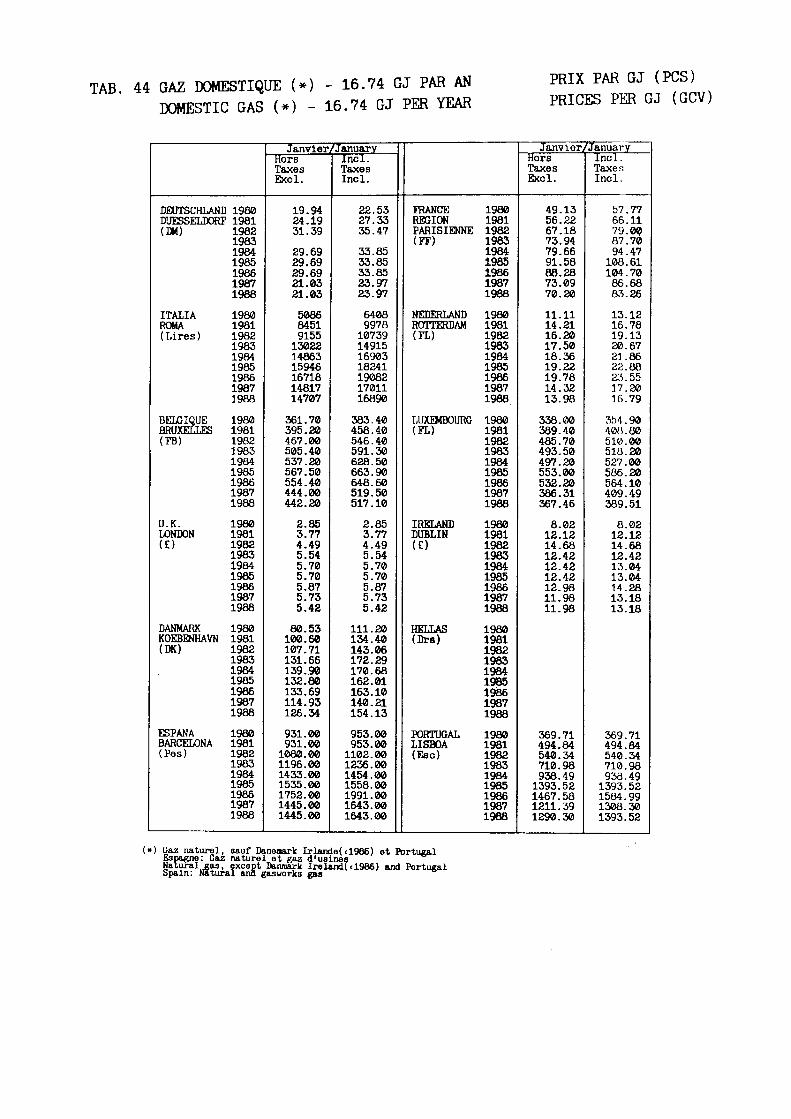
TAB. 44 GAZ DOMESTIQUE (*) - 16.74 GJ PAR AN DOMESTIC GAS (*) - 16.74 GJ PER YEAR
PRIX PAR GJ (PCS) PRICES PER GJ (GCV)
DEUTSCHLAND 1980 DUESSELDORF 1981 (DM)
ITALIA ROMA (Lires)
BELGIQUE BRUXELLES (FB)
U.K. LONDON (e)
DANMARK KOEBENHAVN (DK)
ESPANA BARCELONA (Pes)
1982 1983 1984 1985 1986 1987 1988 1980 1981 1982 1983 1984 1985 1986 1987 1988 1980 1981 1982 1983 1984 1985 1986 1987 1988 1980 1981 1982 1983 1984 1985 1986 1987 1988 1980 1981 1982 1983 1984 1985 1986 1987 1988 1980 1981 1982 1983 1984 1985 1986 1987 1988
Janvier/January Hors Taxes Excl.
19.94 24.19 31.39 29.69 29.69 29.69 21.03 21.03 5086 8451 9155 13022 14363 15946 16718 14817 14707 361.70 395.20 467.00 505.40 537.20 567.50 554.40 444.00 442.20 2.85 3.77 4.49 5.54 5.70 5.70 5.87 5.73 5.42
80.53 100.60 107.71 131.66 139.90 132.80 133.69 114.93 126.34 931.00 931.00 1080.00 1196.00 1433.00 1535.00 1752.00 1445.00 1445.00
Incl. Taxes Incl.
22.53 27.33 35.47 33.85 33.85 33.85 23.97 23.97 6408 9978 10739 14915 16903 18241 19082 17011 16890 383.40 458.40 546.40 591.30 628.50 663.90 648.60 519.50 517.10 2.85 3.77 4.49 5.54 5.70 5.70 5.87 5.73 5.42
111.20 134.40 143.06 172.29 170.68 162.01 163.10 140.21 154.13 953.00 953.00 1102.00 1236.00 1454.00 1558.00 1991.00 1643.00 1643.00
FRANCE REGION PARISIENNE (FF)
NEDERLAND ROTTERDAM (FL)
LUXEMBOURG (FL)
IRELAND DUBLIN (E)
HELLAS (Drs)
PORTUGAL LISBOA (Esc)
1980 1981 1982 1983 1984 1985 1986 1987 1988 1980 1981 1982 1983 1984 1985 1986 1987 1988 1980 1981 1982 1983 1984 1985 1986 1987 1988 1980 1981 1982 1983 1984 1985 1986 1937 1983 1980 1981 1982 1983 1984 1985 1986 1987 1988 1980 1981 1982 1983 1984 1985 1986 1987 1988
Janv i er/January Hors Taxes Excl.
49.13 56.22 67.18 73.94 79.66 91.58 88.28 73.09 70.20 11.11 14.21 16.20 17.50 18.36 19.22 19.78 14.32 13.98 338.00 389.40 485.70 493.50 497.20 553.00 532.20 386.31 367.46 8.02 12.12 14.68 12.42 12.42 12.42 12.98 11.98 11.98
369.71 494.84 540.34 710.98 938.49 1393.52 1467.58 1211.39 1290.30
Inci. Taxes Incl.
57.77 66.11 79.00 87.70 94.47 108.61 104.70 86.68 83.26 13.12 16.78 19.13 20.67 21 .86 22.88 23.55 17.20 16.79 354.90 408.80 510.00 510.20 527.00 586.20 564.10 409.49 389.51 8.02 12.12 14.68 12.42 13.04 13.04 14.28 13.18 13.18
369.71 494.84 540.34 710.98 938.49 1393.52 1584.99 1308.30 1393.52
(») Gaz naturel, sauf Danemark Irlande(<1986) et Portugal Espagne: Gaz naturel et gaz d'usines Natural «as, except Danmark Ireland!<1986) and Portugal Spain: Natural and gasworks gas

TAB. 43 ELECTRICITE INDUSTRIELLEM GWH ?Arì AN (*) PRIX PAR KWH HORS TVA
INDUSTRIAL ELECTRICITY-24 GWH PER YEAR (*) PRICES PER KWH WITHOUT VAT
DEUTSCHTANE HOCHINDUSTR REGION (Pf)
ITALIA SETTENTR.+ CENTRALE (Lires)
BELGIQUE (FB)
U.K. YORKSHIRE (Pence)
DANMARK (*-MOYENNE (Ore)
ESPANA (Pes)
1980 .1981 1982 1983 1984 1985 1986 1987 1988
1980 1981 1982 1983 1984 1985 1986 1987 1988
1980 1981 1982 1983 1984 1985 1986 1987 1988
1980 1981 1982 1983 1984 1985 1986 1987 1988
)1980 1981 1982 1983 1984 1985 1986 1987 1988
1980 1981 1982 1983 1984 1985 1936 1987 1988
Janvier January
8.98 10.13 11.63 11.54 12.26 12.41 13.37 14.01 14.39
45.86 58.03 74.23 90.48 97.68 92.38 96.20 77.32 75.84
1.63 1.94 2.11 2.50 2.52 2.63 2.61 2.39 2.38
2.35 2.85 3.31 3.53 3.43 3.54 3.66 3.64 3.69
32.50 28.30 21.87 26.48
7.35 8.20 8.51
Juillet July
13.55 14.46
75.39 79.67
2.45 2.24
3.61 3.65
27.50 21.53
8.20 8.51
FRANCE (Cent)
NEDERLAND ROTTERDAM (Cent)
LUXEMBOURG (FL)
IRELAND DUBLIN ( Pence )
HELLAS (Drs)
PORTUGAL (Esc)
1980 1981 1982 1983 1984 1985 1986 1987 1988
1980 1981 1982 1983 1984 1985 1986 1987 1988
1980 1981 1982 1983 1984 1985 1986 1987 1988
1980 1981 1982 1983 1984 1985 1986 1987 1988
1980 1981 1982 1983 1984 1985 1986 1987 1988
1980 1981 1982 1983 1984 1985 1986 1987 1988
Janvier January
20.37 21.86 24.86 27.72 30.85 32.10 33.15 32.82 32.50
13.28 14.84 19.19 16.67 16.44 17.20 16.22 11.49 11.74
1.53 1.33 1.60 1.84 2.22 2.25 2.10 2.16 2.21
2.59 3.90 5.01 5.00 5.29 5.36 5.36 4.24 4.24
1.73 2.94 2.88 4.14 4.66 5.70 7.62 8.76 8.76
9.76 10.65 10.99
Juillet July
32.82 32.50
14.01 12.01
2.20 2.24
4.87 4.24
7.62 8.76
9.76 10.54
( · ) 4000 Kw - 6000 h (*«) lo prix hors TVA no comprend pas la taxe spéciale
déductible do: The price excluding VAT does not include the deductible specific tax of:
8 12.5 12.5 15.5 15.5 15.5 19 32.5 32.5
Ore/Kwh 1980/1 12.5 1981/1 12.5 1982/1 14.3 1983/1 15.5 1984/1 15.5 1985/1 15.5 1986/1 29.5 1987/1 32.5 1988/1
Ore/Kwh 1980/7 1981/7 1982/7 1983/7 1984/7 1985/7 1986/7 1987/7
Al'in do tenir compte des facteurs saisonniers, deux séries distinctes indiquent les prix valables pour ios mois de janvier et juillet In order to take into account seasonal factors, two seperate series indicate January and July prices rcspecLively

TAB. 44 GAZ DOMESTIQUE (*) - 16.74 GJ PAR AN DOMESTIC GAS (*) - 16.74 GJ PER YEAR
PRIX PAR GJ (PCS) PRICES PER GJ (GCV)
DEUTSCHLAND 1980 DUESSELDORF 1981 (DM)
ITALIA ROMA (Lires)
BELGIQUE BRUXELLES (FB)
U.K. LONDON (e)
DANMARK KOEBENHAVN (DK)
ESPANA BARCELONA (Pes)
1982 1983 1984 1985 1986 1987 1988 1980 1981 1982 1983 1984 1985 1986 1987 1988 1980 1981 1982 1983 1984 1985 1986 1987 1988 1980 1981 1982 1983 1984 1985 1986 1987 1988 1980 1981 1982 1983 1984 1985 1986 1987 1988 1980 1981 1982 1983 1984 1985 1986 1987 1988
Janvier/January Hors Taxes Excl.
19.94 24.19 31.39 29.69 29.69 29.69 21.03 21.03 5086 8451 9155 13022 14863 15946 16718 14817 14707
361.70 395.20 467.00 505.40 537.20 567.50 554.40 444.00 442.20 2.85 3.77 4.49 5.54 5.70 5.70 5.87 5.73 5.42
80.53 100.60 107.71 131.66 139.90 132.80 133.69 114.93 126.34 931.00 931.00 1080.00 1196.00 1433.00 1535.00 1752.00 1445.00 1445.00
Incl. Taxes Incl.
22.53 27.33 35.47 33.85 33.85 33.85 23.97 23.97 6408 9978 10739 14915 16903 18241 19082 17011 16890 383.40 458.40 546.40 591.30 628.50 663.90 648.60 519.50 517.10 2.85 3.77 4.49 5.54 5.70 5.70 5.87 5.73 5.42
111.20 134.40 143.06 172.29 170.68 162.01 163.10 140.21 154.13 953.00 953.00 1102.00 1236.00 1454.00 1558.00 1991.00 1643.00 1643.00
FRANCE REGION PARISIENNE (FF)
NEDERLAND ROTTERDAM (FL)
LUXEMBOURG (FL)
IRELAND DUBLIN (e)
HELLAS (Drs)
PORTUGAL LISBOA (Eso)
1980 1981 1982 1933 1934 1985 1986 1987 1988 1930 1981 1982 1983 1984 1985 1986 1987 1988 1980 1981 1982 1983 1984 1985 1986 1987 1988 1980 1981 1982 1933 1984 1985 1986 1987 1988 1980 1981 1982 1983 1984 1985 1986 1987 1988 1980 1981 1982 1983 1934 1985 1986 1987 1988
Janvier, Hors Taxes Exol.
49.13 56.22 67.18 73.94 79.66 91.58 88.28 73.09 70.20 11.11 14.21 16.20 17.50 18.36 19.22 19.78 14.32 13.98 338.00 389.40 485.70 493.50 497.20 553.00 532.20 386.31 367.46 8.02 12.12 14.68 12.42 12.42 12.42 12.98 11.98 11.98
369.71 494.84 540.34 710.98 938.49 1393.52 1467.58 1211.39 1290.30
^January Incl. Taxes Incl.
57.77 66.11 79.00 87.70 94.47 108.61 104.70 86.68 83.26 13.12 16.78 19.13 20.67 21 .86 22.88 23.55 17.20 16.79 354.90 40B.80 510.00 518.20 527.00 586.20 564.10 409.49 389.51 8.02 12.12 14.68 12.42 13.04 13.04 14.28 13.18 13.18
369.71 494.84 540.34 710.98 938.49 1393.52 1584.99 1308.30 1393.52
(») Gaz naturel , sauf Danemark Irlande(<1986) e t Portugal Espagne: Gaz naturel et gaz d'usines Naturai «as, except Danmark Ireland(<1986) and Portugal Spain: Natural and gasworks gas
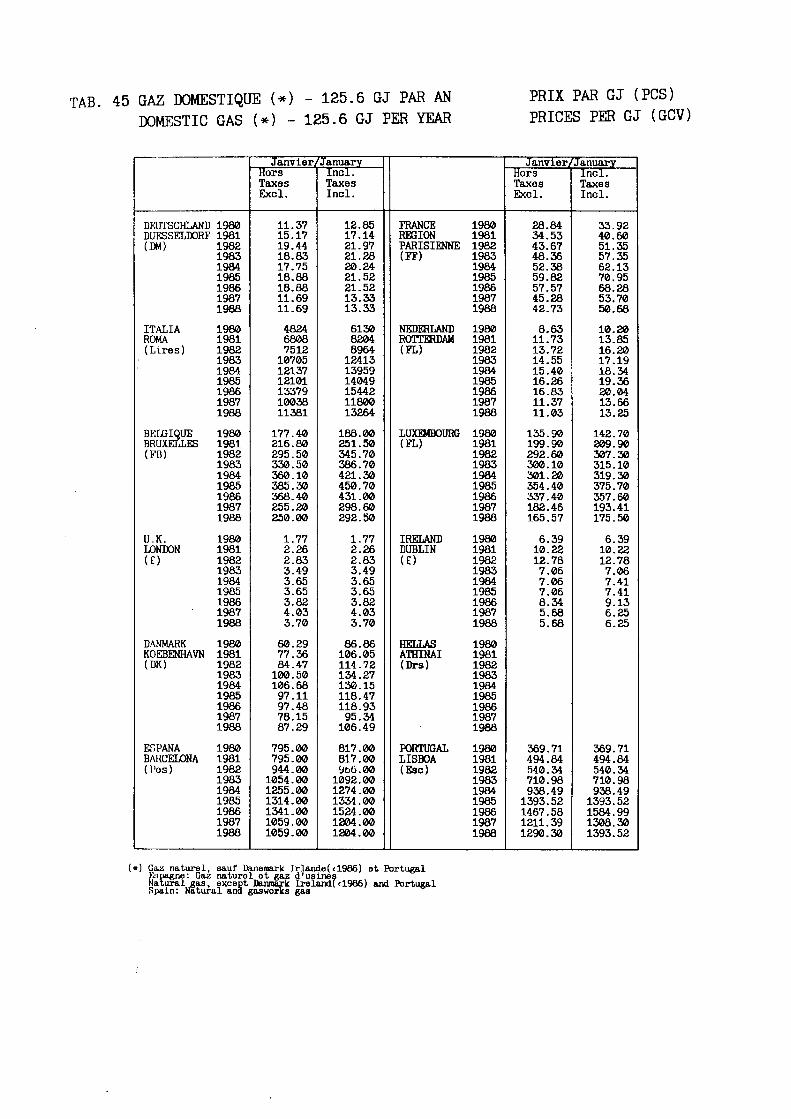
TAB. 45 GAZ DOMESTIQUE {' DOMESTIC GAS (*)
- 125.6 GJ PAR AN 125.6 GJ PER YEAR
PRIX PAR GJ (PCS) PRICES PER GJ (GCV)
DEUTSCHLAND DUESSELDORF (DM)
ITALIA ROMA (Lires)
BELGIQUE BRiixïrfj.T*; (PB)
U.K. LONDON (e)
DANMARK KOEBENHAVN (DK)
ESPANA BARCELONA (Pos)
1980 1981 1982 1983 1984 1985 1986 1987 1988 1980 1981 1982 1983 1984 1985 1986 1987 1988 1980 1981 1982 1983 1984 1985 1986 1987 1988 1980 1981 1982 1983 1984 1985 1986 1987 1988 1980 1981 1982 1983 1984 1985 1986 1987 1988 1980 1981 1982 1983 1984 1985 1986 1987 1988
Janvier/January Hors Taxes Excl.
11.37 15.17 19.44 18.83 17.75 18.33 18.88 11.69 11.69 4824 6808 7512 10705 12137 12101 13379 10038 11381 177.40 216.80 295.50 330.50 360.10 385.30 368.40 255.20 250.00 1.77 2.26 2.83 3.49 3.65 3.65 3.82 4.03 3.70 60.29 77.36 84.47 100.50 106.68 97.11 97.48 78.15 87.29 795.00 795.00 944.00 1054.00 1255.00 1314.00 1341.00 1059.00 1059.00
Incl. Taxes Incl.
12.85 17.14 21.97 21.28 20.24 21.52 21.52 13.33 13.33 6130 8204 8964 12413 13959 14049 15442 11800 13264 188.00 251.50 345.70 386.70 421.30 450.70 431.00 298.60 292.50 1.77 2.26 2.83 3.49 3.65 3.65 3.82 4.03 3.70 86.86 106.05 114.72 134.27 130.15 118.47 118.93 95.34 106.49 817.00 817.00 906.00 1092.00 1274.00 1334.00 1524.00 1204.00 1204.00
FRANCE REGION PARISIENNE (FF)
NEDERLAND ROTTERDAM (FL)
LUXEMBOURG (FL)
IRELAND DUBLIN (e)
HELLAS ATHINAI (Drs)
PORTUGAL LISBOA (Esc)
1980 1981 1982 1933 1984 1985 1986 1987 1988 1980 1981 1982 1983 1984 1985 1986 1987 1988 1980 1981 1982 1983 1934 1985 1986 1987 1988 1980 1981 1982 1983 1984 1985 1936 1987 1988 1980 1981 1982 1983 1984 1985 1986 1987 198B 1980 1981 1982 1983 1984 1985 1986 1987 1988
Janvier/January Hors Taxes Excl.
28.34 34.53 43.67 48.36 52.38 59.82 57.57 45.28 42.73 8.63 11.73 13.72 14.55 15.40 16.26 16.83 11.37 11.03 135.90 199.90 292.60 300.10 301.20 354.40 337.40 182.46 165.57 6.39 10.22 12.78 7.06 7.06 7.06 8.34 5.68 5.68
369.71 494.84 540.34 710.98 938.49 1393.52 1467.58 1211.39 1290.30
Incl. Taxes Incl.
33.92 40.60 51.35 57.35 62.13 70.95 68.28 53.70 50.68 10.20 13.85 16.20 17.19 18.34 19.36 20.04 13.66 13.25 142.70 209.90 307.30 315.10 319.30 375.70 357.60 193.41 175.50 6.39 10.22 12.78 7.06 7.41 7.41 9.13 6.25 6.25
369.71 494.84 540.34 710.98 938.49 1393.52 1584.99 1308.30 1393.52
(·) Gaz naturel, sauf Danemark IrLandet<1986) et Portugal Espagne: Gaz naturel et gaz d'usines Natural aas, except Danmark Ireland(<1986) and Portugal Spain: Natural and gasworks gas

TAB. 46 GAZ INDUSTRIEL (*) - 41860 GJ PAR AN INDUSTRIAL GAS (*) - 41860 GJ PER YEAR
PRIX PAR GJ (PCS) PRICES PER GJ (GCV)
DELTISCHLANI 1980 DUESSELDORF 1961 (DM)
ITALIA TORINO ( Lires)
BELGIQUE (FB)
U.K. (£)
DANMARK (DK)
ESPANA BARCELONA (Pes)
1982 1963 1984 1985 1986 1987 1988 1980 1981 1982 1983 1984 1985 1986 1967 1988 1960 1981 1982 1963 1984 1965 1986 1987 1986 1960 1981 1982 1983 1984 1965 1986 1987 1988 I960 1981 1982 1983 1984 1985 1986 1987 1988 1980 1981 1982 1983 1984 1965 1986 1987 1988
Janvier/January Hors Taxes Excl.
9.70 11.88 16.51 15.55 15.55 15.55 9.77 8.78 3364 5156 6559 7249 8169 10083 7956 4160 4134
132.60 163.90 236.70 259.10 284.60 306.20 286.70 173.50 166.20 2.83 2.66 2.78 2.89 2.91 3.06 3.26 3.10
291.00 316.00 563.00 563.00 670.00 741.00 814.00 374.00 374.00
Hors TVA/VAT Excl.
9.70 11.88 16.51 15.55 15.55 15.55 9.77 6.76 3384 5156 6559 7249 8169 10083 7956 4160 4134
132.60 163.90 236.70 259.10 284.60 308.20 266.70 173.50 166.20 2.83 2.68 2.78 2.89 2.91 3.08 3.26 3.10
313.00 338.00 565.00 593.00 680.00 752.00 626.00 380.00 380.00
FRANCE REGION PARISIENNE (FF)
NEDERLAND ROTTERDAM (FL)
LUXEMBOURG (FL)
IRELAND (E)
HELLAS (Drs)
PORTUGAL (Eso)
1980 1981 1982 1983 1984 1985 1986 1967 1988 1980 1981 1982 1983 1984 1985 1986 1987 1986 1960 1981 1982 1963 1984 1985 1986 1987 1988 1960 1981 1982 1983 1984 1985 1986 1987 1988 1980 1961 1962 1963 1984 1965 1986 1987 1968 1980 1961 1982 1983 1984 1985 1986 1987 1988
Janvier/Januarv Hors Taxes Excl.
19.13 22.98 30.14 32.95 35.24 42.22 37.37 23.10 23.10 7.59 9.77 13.14 12.80 13.62 14.92 12.27 6.54 7.40 94.10 156.70 245.50 252.40 255.80 306.00 289.20 145.82 145.82
Hors TVA/VAT Excl.
19.13 22.98 30.14 32.95 35.24 42.22 38.91 24.05 23.99 7.59 9.77 13.14 12.80 13.62 14.92 12.28 6.55 7.41 94.10 156.70 245.50 252.40 255.80 308.00 289.20 145.82 145.82
(«) Gaz naturel / Natural gas Espagne: Gaz naturel et gaz d'usines Spain: Natural and gasworks gas

TAB. 47 GAZ INDUSTRIEL (*) - 418600 GJ PAR AN INDUSTRIAL GAS (*) - 418600 GJ PER YEAR
PRIX PAR GJ (PCS) PRICES PER GJ (GCV)
DEUTSCHLAND DUESSELDORF (DM)
ITALIA TORINO (Lires)
BELGIQUE (FB)
U.K. (£)
DANMARK KOEBENHAVN (DK)
ESHANA BARCELONA (Pos)
1980 1981 1982 1983 1984 1985 1986 1987 1988 1980 1981 1982 1983 1984 1985 1986 1987 1988 1980 1981 1982 1983 1984 1985 1986 1987 1988 1980 1981 1982 1983 1984 1985 1986 1987 1988 1980 1981 1982 1983 1984 1985 1986 1987 1988 1980 1981 1982 1983 1984 1985 1986 1987 1988
Janvier/January Hors Taxes Excl.
9.23 11.42 15.84 15.37 14.91 14.91 14.91 9.91 8.20 3312 4947 6292 6943 7592 9370 7343 3741 3712
110.00 140.70 212.10 233.60 258.50 281.20 258.70 146.10 138.50 2.45 2.68 2.78 2.87 2.87 3.08 3.26
264.00 289.00 517.00 517.00 610.00 662.00 732.00 352.00 352.00
Hors TVA/VAT Excl.
9.23 11.42 15.84 15.37 14.91 14.91 14.91 9.91 8.20 3312 4947 6292 6943 7592 9370 7343 3741 3712
110.00 140.70 212.10 233.60 258.50 281.20 258.70 146.10 138.50 2.45 2.68 2.78 2.87 2.87 3.08 3.26
286.00 311.00 539.00 547.00 619.00 672.00 743.00 357.00 357.00
FRANCE REGION PARISIENNE (FF)
NEDERLAND ROTTERDAM (FL)
LUXEMBOURG (FL)
IRELAND DUBLIN (e)
HELLAS ATHINAI (Drs)
PORTUGAL (Esc)
1980 1981 1982 1983 1984 1985 1986 1987 1988 1980 1981 1982 1983 1984 1985 1986 1987 1988 1980 1981 1982 1983 1984 1985 1986 1987 1938 1980 1981 1982 1983 1984 1985 1986 1987 1988 1980 1981 1982 1983 1984 1985 1986 1987 1988 1980 1981 1982 1983 1984 1985 1986 1987 1988
Janvier/January Hors Taxes Excl.
16.91 20.47 27.17 29.70 31.88 36.50 34.15 19.96 19.96 7.32 9.37 12.44 11.93 12.74 14.10 10.99 5.26 6.30
Hors TVA/VAT Excl.
16.91 20.47 27.17 29.70 31.88 38.50 36.73 21.56 21.45 7.32 9.37 12.44 11.93 12.74 14.10 11.00 5.27 6.31
(») Gaz naturel / Natural gas R;pagne: Gaz naturel e t gaz d'usines Spain: Natural and gasworks gas

TAB. 48 COMPARAISON ENTRE LES PRIX DE L'ENERGIE FINALE - ECU PAR GJ (PCI)
COMPARISON BETWEEN SUPPLIED ENERGY PRICES - ECU PER GJ (NCV)
SECTEUR INDUSTRIEL
INDUSTRIAL SECTOR
JANVIER
JANUARY
PRIX HORS TVA ET TAXES DEDUCTIBIJB
PRICES EXCLUDING VAT AND DEDUCTIBLE TAX
(«·»)
run 1 1980 1981 1982 1983 1984 1985 1986 1987 1966
GAZ Ni 1980 1961 1982 1983 1984 1985 1986 1987 1988
ELECT! 1980 1981 1982 1983 1984 1985 1986 1987
1988
CHARB 1980 1 1981 1982 1983 1984 1985 1986 1987 1988
DE
tESIDUEL 3.42 4.43 4.82 4.80 5.79 7.20 4.79 3.52 2.31
TUREL / 4.11 4.91 7.21 7.42 7.32 7.45 7.59 5.29 4.40
LICITE / 10.02 10.91 13.24 13.94 15.07 15.53 17.04 18.71 19.31
ÍN / COA 2.55 2.82 3.38 3.78 3.95 4.01 3.94 4.01
FR
(HIS) / 3.46 4.26 4.67 5.16 6.07 6.91 5.32 3.53 2.23
NATURAL
3.22 3.81 4.86 5.06 5.13 6.28 6.09 3.48 3.42
ELECTRII 9.71
10.19 11.12 11.83 12.42 13.09 13.74 13.25 12.95
2.20 2.55 2.84 3.25 3.19 3.49 3.54 3.44 3.39
IT
RESIDUA]
3.33 4.06 4.40 4.81 5.59 6.60 4.36 2.59 1.94
GAS ( · · 3.17 4.48 5.34 5.83 6.15 7.60 5.47 2.87 2.71
!ΓΓΪ (24 10.97 13.15 15.75 19.03 19.79 18.76 17.94 14.85 13.87
2.24 2.86 3.92 4.24 3.91 4.24 4.34 4.17 3.64
NL BE
, FUEL (HSC) 2.98 4.54 4.77 5.11 6.14 7.31 4.81 3.65 2.89
(418600 2.95 3.71 5.15 5.23 5.57 6.24 4.96 2.50 3.02
Gffir.A 13.41 14.72 19.89 18.30 17.98 19.94 18.32 13.64 14.06
2.97 4.59 4.17 4.70 5.62 6.72 4.22 2.86 1.87
GJ P.A. 3.02 3.76 5.66 5.76 6.23 7.01 6.43 3.75 3.56
) 11.20 12.99 14.09 15.41 15.19 16.41 16.24 15.36 15.31
2.64 2.92 3.34 3.30 3.26 3.68 3.58 3.69
LI
2.80 4.97 4.39 4.75 5.69 6.93 4.64 2.32 2.29
10.52 8.87
10.67 11.35 13.36 14.03 13.09 13.88 14.21
UK
3.43 4.74 5.31 5.32 6.43 7.67 5.08 3.36 2.53
4.25 5.61 5.41 5.22 5.59 5.51 5.84
10.20 14.94 16.13 16.08 16.72 15.86 16.40 14.04 14.86
1.78 2.60 2.78 3.03 3.39 3.08 3.20 2.55 2.52
IR
3.91 5.01 5.81 6.43 6.36 7.96 6.10 3.49 3.03
10.74 15.70 20.17 20.13 20.13 20.97 20.97 15.50 15.10
DK
3.19 4.73 4.89 5.28 5.99 6.82 4.76 3.10 2.40
;
11.36 9.88 7.73 9.28
HE
1.82 3.42 4.51 5.28 4.43 6.32 5.54 4.06 3.67
8.70 13.33 12.84 16.78 15.83 17.39 16.13 16.38 14.78
ES
5.62 2.53 2.55
3.33 3.33 5.70 4.98 5.35 6.07 6.04 2.81 2.83
14.96 16.14 16.86
PO
5.60 3.26 3.46
19.27 18.92 18.08
MOYENNE AVERAGE
(·)
3.28 4.34 4.71 5.00 5.82 6.99 4.97 3.11 2.38
3.62 4.54 5.81 5.95 6.12 6.72 6.24 3.83 3.54
10.29 12.35 14.16 14.96 15.63 15.60 16.05 15.25 15.47
2.18 2.68 3.07 3.41 3.55 3.57 3.61 3.38 2.99
(») Moyenne pondérée sur la base de la consonaation des différents pays en 1986 Weighted by the 1986 structure of consumption in the different countries
(**) Espagne: gaz naturel et gaz d'usine Spain: natural gas and gasworks gas
(«*■) Prix relevés aux places indiqués aux tableaux 9 à 19 Prices recorded in the towns indicated in tables 9 to 19

TAB. 49 COMPARAISON ENTRE LES PRIX DE L'ENERGIE FINALE - ECU PAR GJ (PCI)
COMPARISON BETWEEN SUPPLIED ENERGY PRICES - ECU PER GJ (NCV)
SECTEUR INDUSTRIEL
INDUSTRIAL SECTOR
JUILLET
JULY
PRIX HORS TVA ET TAXES DEDUCTIBLES
PRICES EXCLUDING VAT AND DEDUCTIBLE TAX
(«*»)
FUEL 1 1980 1981 1982 1983 1984 1985 1986 1987 1988
GAZ N, 1980 1981 1982 1983 1984 1985 1986 1987 1988
DE
¡ESIDUKL
3.35 4.86 4.76 4.83 5.79 5.11 1.98 2.73
mJREL /
ELECTRICΓΤΕ / 1980 1981 1982 1983 1984 1985 1986 1987 1988
CIIARB 1980 1981 1982 1983 1984 1985 1986 1987 1988
17.51 IS. 31
IN / COA 2.78 3.11 3.55 3.81 3.82 3.95 3.88 4.01
FR
(HTS) / 3.18 4.53 4.82 5.08 6.12 5.37 3.03 3.48
NATURAL
ELECTRK
13.31 13.06
1
2.60 2.93 2.96 3.09 3.28 3.46 3.45 3.42
IT
RESIDUA
3.28 4.75 4.57 4.85 5.97 5.05 1.72 2.68
GAS ( «
: m (24
14.19 14.73
2.70 3.53 3.88 3.99 3.91 4.51 4.38 4.01
NL BE
FUEL (RSC) 3.51 5.09 5.18 5.29 6.27 5.25 1.94 3.37
(418600
GWH P . A
16.08 14.26
3.07 4.30 4.66 4.82 5.87 4.87 1.77 3.02
GJ P.A.
)
15.50 14.45
2.78 3.14 3.24 3.27 3.48 3.62 3.64 3.70
11
3.40 4.54 4.63 5.15 6.11 5.17 1.77 2.92
13.91 14.45
UK
3.90 5.34 5.31 5.47 6.58 6.21 2.18 3.42
15.67 14.48
1.87 2.69 3.25 3.17 3.08 3.35 2.93 2.56
IR
4.26 6.02 5.47 5.72 6.72 6.41 3.04 3.76
19.05 15.30
DK
3.43 5.46 5.10 5.16 5.94 5.13 1.94 3.06
9.58 7.59
HE
3.72 4.23 4.54 5.28 5.81 5.75 4.65 3.86
15.40 15.55
ES
4.47 2.50
16.60 16.58
PO
4.11 3.14
18.53 18.03
MOYENNE AVERAGE
(-)
3.41 4.82 4.82 5.03 6.05 5.34 2.64 2.97
15.44 15.44
2.43 2.95 3.31 3.41 3.43 3.66 3.48 3.37
(») Moyenne pondérée sur la base de la consoianation des différents pays en 1986 Weighted by the 1986 structure of consumption in the different countries Espagne: gaz naturel et gaz d'usine Spain: natural gas and gasworks gas
(«»«) Prix relevés aux places indiqués aux tableaux 9 à 19 Prices recorded in the towns indicated in tables 9 to 19
(»)

TAB. 50 COMPARAISON ENTRE LES PRIX DE L'ENERGIE FINALE - ECU PAR GJ (PCI)
COMPARISON BETWEEN SUPPLIED ENERGY PRICES - ECU PER GJ (NCV)
SECTEUR DOMESTIQUE
HOUSEHOLD SECTOR
JANVIER
JANUARY
PRIX TOUTES TAXES COMPRISES
TAX PAID PRICES
(***)
GASOI 1988 1981 1982 1983 1984 1985 1986 1987 1933
GAZ N, 1980 1981 1982 1983 1984 1985 1986 1987 1988
DE
. CHAUFF/
7.05 7.19 9.21 9.03 9.40
10.71 ö.09 5.78 4.36
iTUREL / 5.73 7.37 9.99
10.27 9.94
10.76 10.96
7.11 7.15
ELECTRICITE / 1980 1981 1982 1933 1984 1985 1986 1987 1988
CHARB 1980 1981 1982 1983 1984
1985 1986 1987 1935
11.39 12.30 15.88 17.32 18.29 19.19 19.48 20.69 21.42
W / COA 5.24 5.66 6.34 6.73 6.85 7.81 8.24 9.33 9.01
FR
iGE / HE/ 6.66 8 .38 9.76
11.31 10.51 12.09 10.75 8 .38 7.43
NATURAL
6.46 7.56 9.18 9.78 9.99
11.56 11.31 8.66 8.07
ELECTRIC
16.35 16.83 18.79 20.55 22.02 23.60 24.93 23.44 23.67
6.61 7.41 8.45 9.21 9.67
10.29 11.05 11.09 10.84
IT
TING GAÍ 6.72 7.53 9.19
11.39 11.66 12.75 11.66 10.74 11.34
GAS (** 5.86 7 .43 7.60
10.43 11.30 11.40 11.50 9.06 9.69
!ITY (13(
6.66 7.36 8 .52 9.69 9.97 9.74 9.91
11.65 9.68
NL
OIL 6.63 7.69 9.60 9.77
10.36 10.94
9.43 7.65 6.52
(125.6 4 .12 5.49 6.71 7.54 3 .01 8.56 9.04 6.48 6.34
» o KWH : 16.19 18.65 24.08 26.71 25.85 27.08 26.02 20.17 19.30
5.67 6.11 6.96 7.40 7.75 9.40 9.94
10.54
BE
6.30 7.54 9.04 8.77 9 .43 9.91 8.10 5.19 4.45
GJ P.A. 5.16 6 .73 9.22 9.53
10.15 11.24 10.71
7.67 7.52
'.A.) 16.15 18.41 20.69 22.20 22.01 23.14 21.77 20.50 20.65
5.64 6.46 7.11 7.77 7.64 8.27 8 .52 9.00 8.79
LX
5.47 7.08 8.46 8.82 8.55 9.10 6.59 4.54 4.74
3.92 5.62 8.20 7.76 7.69 9.37 8.89 4.97 4.51
10.20 10.85 14.05 14.93 17.12 18.06 17.36 18.18 18.39
UK
5.63 8.19 9.49
10.15 9.79
10.03 8.70 5.61 4.90
3.07 4.73 5.51 6.35 7.11 6.54 6.84 6.21 5.95
9.11 14.52 14.77 14.75 15.79 14.83 15.23 12.50 13.04
3.70 6.06 6.40 6.48 7.53 6.94 7.88 6.89 7.36
IR
5.53 7.23 Β.90
10.18 9.64
10.84 10.79
6.52 7.38
10.59 16.44 20.56 11.36 11.27 11.58 14.27
9 .13 8.89
10.66 15.14 19.04 17.91 18.15 19.84 20.27 16.12 15.71
3 .21 4.26 5.10 5 .12 5 .22 6.32 5.65 5.80 5.47
DK
7.78 9.19
11.56 12.40 11.80 12.45 12.12 14.30 13.46
12.41 14.83 15.94 18.42 17.66 16.54 16.58 13.46 14.91
16.20 22.99 26.20 26.55 23.20 24.15 24.53 25.82 27.21
HE
5.49 7.76 8 .53 9.63 8.07 9.51 8.59 6.94 6.26
8.67 14.42 15.09 15.58 14.67 16.4B 15.75 15.95 15.88
ES
9.67 6.62 6.66
9.50 8.75
10.22 9.94
11.01 12.04 12.39
9.47 9.53
17.99 18.38 19.23
5.10
PO
5.71 7.95 8.46 8.79 9.53
12.00 12.50
9.29 9.16
23.01 22.59 22.41
MOYENNE AVERAGE
6 . 7 6 7 . 6 6
9.40 ' 10.04 10.05 11.24
9.39 7.29 6.43
4.76 6.28 7.59 8 .53 8.96 9.29 9.47 7.26 7.16
12.71 14.89 17.39 18.60 19.38 20.13 20.23 19.46 ι : 91
4.39 6.09 6 .63 6.88 7.57 7.55 8.30 7.83 7.33
(*) Moyenne pondérée sur l a base de la consonnation des différents pays en 1986 Weighted by the 1986 structure of consumption in the different countries
(**) IR Γ<1986), DK PO gaz d 'usine, ES gaz naturel & d'usine IR (<1986) DK PO gasworks gas, ES natural and gasworks gas
(*·*) Prix relevés aux places indiqués aux tableaux 9 à 19 Prices recorded in the towns indicated in tables 9 to 19

TAB. 51 COMPARAISON ENTRE LES PRIX DE L'ENERGIE FINALE - ECU PAR GJ (PCI) COMPARISON BETWEEN SUPPLIED ENERGY PRICES - ECU PER GJ (NCV)
SECTEUR DOMESTIQUE
HOUSEHOLD SECTOR
JUILLET
JULY
PRIX TOUTES TAXES COMPRISES
TAX PAID PRICES
(«**)
GASOi: 1980 1981 1982 1983 1984 1985 1986 1987 1988
GAZ M 1980 1981 1982 1983 1984 1985 1986 1987 1988
DE
, CHAUFF, 6.77 7.90 8.65 8.41 8.58 8.87 3.74 5.15
iTUREL /
ELECTRICITE / 1980 1981 1982 1983 1984 1985 1986 1987 1988
20.01 21.33
CHARBON / COA] 1980 1981 1982 1983 1984 1985 1986 1987 1988
6.88 7.48 7.71 8.73 9.03
FR
iGE / HE 7.64 9.57
10.14 10.28 10.94 11.89 6.65 7.55
NATURAL
ELECTRK
24.14 23.33
8.85 9.73
10.23 10.90 10.66
IT
tfING GA! 7.30 8.41 9.75
10.92 11.87 11.98 9.46
10.44
GAS (»»
¡m (13
NL
MIL 7.38 8.65 9.58 9.25 9.78 9.85 4.75 7.17
(125.6
100 KWH ]
22.76 20.95
9.51 9.95
10.22 10.31 9.78
7.41 8.94 9.33
10.11 10.57
BE
6.57 7.73 8.79 8.42 8.91 9.22 3.97 5.13
GJ P.A.
'.A.)
20.93 19.68
7.69 7.77 8.12 8.80 9.14
LX
6.88 7.73 8.19 8.11 8.63 9.11 4.24 5.04
18.03 18.65
OK
6.90 8.60 9.84 9.51 9.38 9.94 4.84 5.17
14.45 12.86
6.34 7.27 7.73 7.22 6.70
IR
6.84 8.64 8.80 9.66 9.59
11.23 6.74 7.55
18.86 15.91
5.00 5.30 6.74 6.21 5.54
DK
6.65 11.16 11.22 10.90 11.49 11.79 11.45 13.88
28.89 25.02
HB
8.49 8.21 8.70 9.63 9.41 8.66 7.50 0.53
15.03 16.99
ES
8.41 6.55
18.90 lß.91
5.11
PO
22.13 í¿.82
MOYENNE AVERAGE
M
7.13 8.49 9.31 9.35 9.75
10.16 5.73 6.76
20.00 19.77
6.75 7.52 8.02 7.94 7.52
(·) Moyenne pondérée sur la base de la consonnation des différents pays en 1986 Weighted by the 1986 structure of consumption in the different countries
(««) IR U1986), DK PO gaz d'usine, ES gaz naturel & d'usine IR (<1986) DK PO gasworks gas, ES natural and gasworks gas
'»»·;. Prix relevés aux places indiqués aux tableaux 9 à 19 Prices recorded in the towns indicated in tables 9 to 19

ΓΑΒ. 52 COMPARAISON ENTRE LES PRIX DE L'ENERGIE UTILE - ECU PAR GJ (PCI)
COMPARISON BETWEEN USEFUL ENERGY PRICES - ECU PER GJ (NCV)
SECTEUR INDUSTRIEL
INDUSTRIAL SECTOR
JANVIER
JANUARY
PRIX HORS TVA ET TAXES DEDUCTIBLES
PRICES EXCLUDING VAT AND DEDUCTIBLE TAX
(»*»)
FUEL 1 1980 1981 1982 1983 1984 1985 1986 1987 1983
GAZ Ν/ 1980 1981 1982 1983 1984 1985 1986 1987 1988
ELECT! 1980 1981 1982 1983 1984 1985 1986 1987 1988
CBARBI 1980 1981 1982 1983 1984 1985 1986 1987 1988
DE
[ESIDUEL 4.88 6.32 6.88 6.85 8.27
10.28 6.85 5.03 3.30
TDREL / 5.71 6.82
10.01 10.30 10.17 10.35 10.54 7.35 6.11
LICITE / 11.93 12.98 15.76 16.59 17.94 18.49 20.28 22.27 22.99
)N / COA 4.25 4.70 5.63 6.29 6.58 6.68 6.57 6.68
FR
(HTS) / 4.94 6.08 6.67 7.37 8.67 9.88 7.60 5.04 3.18
NATURAL
4.47 5.29 6.75 7.03 7.12 8.72 8.45 4.83 4.74
)11ECTRI( 1 1 . 5 5
12.13 13.24 14.08 14.79 15.59 16.36 15.78 15.42
3.66 4.25 4.73 5.42 5.32 5.81 5.91 5.73 5.66
IT
RESIDUA]
4.76 5.81 6.28 6.88 7.98 9.42 6.26 3.70 2.77
GAS ( « 4.40 6.22 7.41 8.10 8.54
10.56 7.60 3.99 3.77
!ITY (24 13.06 15.65 18.75 22.65 23.56 22.33 21.35 17.68 16.51
3.73 4.76 6.54 7.06 6.52 7.07 7.23 6.95 6.07
NX BE
, FUEL (BSC) 4.26 6.48 6.82 7.30 8.78
10.45 6.87 5.21 4.13
(418600 4.10 5.16 7.16 7.27 7.73 8.66 6.89 3.47 4.19
GWH P.A 15.97
17.53 23.68 21.79 21.40 22.66 21.80 16.24 16.73
4.24 6.56 5.95 6.71 8.02 9.60 6.02 4.09 2.68
GJ P.A. 4.19 5.23 7.86 7.99 8.65 9.74 8.93 5.21 4.94
) 13.33 15.46 16.77 18.35 18.09 19.54 19.33 18.28 18.22
4.40 4.86 5.57 5.50 5.44 6.14 5.97 6.14
LX
3.99 7.10 6.27 6.79 8.12 9.89 6.63 3.31 3.27
12.52 10.56 12.71 13.52 15.91 16.70 15.58 16.52 16.92
UK
4.90 6.77 7.59 7.60 9.19
10.95 7.25 4.80 3.61
5.90 7.80 7.52 7.25 7.76 7.66 8.11
12.14 17.78 19.20 19.14 19.90 18.88 19.52 16.72 17.68
2.97 4.33 4.63 5.05 5.65 5.13 5.34 4.25 4.20
IR
5.58 7.15 8.31 9.18 9.08
11.37 8.72 4.99 4.33
12.78 18.69 24.01 23.96 23.96 24.96 24.% 18.45 17.98
DK
4.55 6.76 6.99 7.55 8.56 9.75 6.80 4.43 3.42
13.52 11.76
9.20 11.04
HE
2.59 4.88 6.44 7.55 6.33 9.02 7.92 5.80 5.24
10.36 15.87 15.28 19.97 18.84 20.70 19.21 19.50 17.60
ES
8.03 3.61 3.64
4.62 4.63 7.92 6.92 7.43 8.43 8.39 3.90 3.92
17.80 19.21 20.07
PO
7.99 4.65 4.94
22.94 22.52 21.52
MOYENNE AVERAGE
(·)
4.69 6.21 6.73 7.14 8.32 9.99 7.11 4.44 3.39
5.02 6.31 8.07 8.26 8.50 9.33 8.67 5.32 4.92
12.25 14.70 16.86 17.81 18.60 18.57 19.11 18.16 18.42
3.64 4.47 5.12 5.69 5.91 5.96 6.02 5.64 4.98
(«) Moyenne pondérée sur la base de la consommation des différents pays en 1986 Weighted by the 1986 structure of consumption in the different countries
( » ) Espagne: gaz naturel et gaz d'usine Spain: natural gas and gasworks gas
(«•J Prix relevés aux places indiqués aux tableaux 9 à 19 Prices recorded in the towns indicated in tables 9 to 19

TAB. 53 COMPARAISON ENTRE LES PRIX DE L'ENERGIE UTILE - ECU PAR GJ (PCI)
COMPARISON BETWEEN USEFUL ENERGY PRICES - ECU PER GJ (NCV)
SECTEUR INDUSTRIEI,
INDUSTRIAL SECTOR
JUILLET
JULY
PRIX HORS TVA ET TAXES DEDUCTIBLES
PRICES EXCLUDING VAT AND DEDUCTIBLE TAX
(«**)
FUEL I 1980 1981 1982 1983 1984 1985 1986 1987 1988
GAZ N; 1980 1981 1982 1983 1984 1985 1986 1987 1988
DE
[ESIDUEL 4.78 6.94 6.80 6.90 8.28 7.30 2.82 3.90
iTIIREL /
HJJCTRICITE /
1980 1981 1902 1983 1984 1985 1986 1987 1988
CHARBt 1980 1981 1982
1983 1984 1985 1986 1987 1988
20.84 22.99
W / COA] 4.63 5.18 5.92 6.35 6.36 6.59 6.47 6.68
FR
(HTS) / 4.54 6.47 6.89 7.25 8.74 7.67 4.33 4.97
NATURAL
ELECTRK
15.84 15.55
4.34 4.89 4.93 5.15 5.47 5.77 5.75 5.70
IT
RESIDUA 4.69 6.79 6.53 6.93 8.53 7.22 2.46 3.83
GAS («■
:ITY (24
16.89 17.53
4.50 5.89 6.46 6.64 6.51 7.52 7.30 6.68
NL BE
, FUEL (HSC) 5.01 7.26 7.39 7.55 8.96 7.50 2.78 4.81
4.38 6.15 6.66 6.89 8.38 6.95 2.53 4.31
(418600 GJ P.A.
GWH P.A
19.14 16.97
)
18.45 17.21
4.64 5.23 5.41 5.44 5.80 6.04 6.07 6.17
Li
4.86 6.48 6.61 7.35 8.73 7.38 2.53 4.17
16.56 17.21
UK
5.56 7.63 7.59 7.81 9.40 8.87 3.11 4.88
18.65 17.24
3.11 4.48 5.42 5.29 5.14 5.58 4.88 4.27
IR
6.09 8.60 7.81 8.17 9.59 9.16 4.35 5.38
22.68 18.21
DK
4.91 7.80 7.28 7.37 8.49 7.32 2.78 4.37
11.41 9.04
HE
5.32 6.05 6.49 7.55 8.30 8.22 6.65 5.51
18.33 18.52
ES
6.39 3.58
19.76 19.73
PO
5.88 4.48
22.05 21.47
MOYENNE AVERAGE
(·)
4.87 6.89 6.88 7.18 8.64 7.63 3.78 4.25
18.38 18.39
4.05 4.92 5.52 5.68 5.72 6.09 5.80 5.62
(») Moyenne pondérée sur la base de la consommation des différents pays en 1986 Weighted by the 1986 structure of consumption in the different countries
(**) Espagne: gaz naturel et gaz d'usine Spain: natural gas and gasworks gas
(»«*) Prix relevés aux places indiqués aux tableaux 9 à 19 Prices recorded in the towns indicated in tables 9 to 19

TAB. 54 COMPARAISON ENTRE LES PRIX DE L'ENERGIE UTILE - ECU PAR GJ (PCI) COMPARISON BETWEEN USEFUL ENERGY PRICES - ECU PER GJ (NCV)
SECTEUR DOMESTIQUE HOUSEHOLD SECTOR
JANVIER JANUARY
PRIX TOUTES TAXES COMPRISES TAX PAID PRICES
( H
GASOI] 1980 1981 1982 1983 1984 1985 1986 1987 1988
GAZ Ni 1980 1981 1982 1983 1984 1985 1986 1987 1988
ELECTÍ 1980 1981 1982 1983 1984 1985 1986 1987 1988
CHARB! 1980 1981 1982 1983 1984 1985 1986 1987 1968
DE
, CHAUFFi 10.07 10.28 13.16 12.90 13.43 15.30 11.55 8.26 6.22
FR
GE / HE/ 9.51
11.97 13.94 16.15 15.02 17.27 15.36 11.98 10.61
iTUREL / NATURAL 7.85
10.10 13.69 14.07 13.62 14.74 15.01 9.74 9.79
LICITE / 11.99 12.94 16.72 18.23 19.25 20.20 20.51 21.78 22.54
)N / COA 8.73 9.44
10.57 11.22 11.42 13.02 13.74 15.55 15.02
8.85 10.36 12.57 13.40 13.69 15.84 15.50 11.87 11.06
ELECTRK 17.21 17.71 19.78 21.63 23.18 24.85 26.24 24.68 24.92
' 11.02 12.35 14.08 15.36 16.12 17.15 18.42 18.48 18.07
IT
iTING GA! 9.60
10.76 13.13 16.27 16.65 18.21 16.66 15.34 16.19
GAS (»» 8.03
10.18 10.41 14.29 15.48 15.62 15.76 12.41 13.28
IITY (IS
11.09 12.27 14.19 16.16 16.61 16.23 16.52 19.42 16.13
NL
¡OIL 9.47
10.98 13.72 13.96 14.80 15.63 13.47 10.93 9.31
(125.6 5.64 7.52 9.19
10.33 10.98 11.73 12.39 8.88 8.68
»0 KWH ] 17.04 19.63 25.34 28.12 27.21 28.51 27.39 21.23 20.32
9.45 10.18 11.60 12.34 12.91 15.67 16.57 17.57
BE
9.00 10.77 12.92 12.53 13.47 14.16 11.57 7.41 6.36
GJ P.A. 7.07 9.22
12.63 13.05 13.91 15.39 14.68 10.50 10.30
>.A.) 17.00 19.38 21.78 23.37 23.17 24.36 22.92 21.58 21.73
9.40 10.77 11.86 12.95 12.73 13.78 14.19 15.01 14.64
LX
7.81 10.11 12.09 12.59 12.21 13.00 12.27 6.49 6.77
5.37 7.69
11.23 10.64 10.54 12.83 12.18 6.80 6.18
10.74 11.42 14.79 15.71 18.02 19.01 18.28 19.14 19.36
UK
8.05 11.71 13.56 14.50 13.99 14.33 12.42 8.02 6.99
4.21 6.48 7.55 8.70 9.74 8.95 9.37 8.51 8.15
9.59 15.28 15.54 15.53 16.62 15.61 16.03 13.16 13.73
6.17 10.09 10.67 10.79 12.54 11.56 13.13 11.48 12.26
IR
7.90 10.33 12.71 14.54 13.78 15.48 15.42 9.31
10.54
14.50 22.52 28.16 15.56 15.43 15.87 19.55 12.51 12.18
11.22 15.93 20.04 18.86 19.11 20.88 21.33 16.97 16.53
5.35 7.10 8.50 8.53 8.70
10.54 11.08 9.67 9.11
BK
11.12 13.13 16.51 17.72 16.85 17.78 17.32 20.43 19.26
17.00 20.31 21.83 25.24 24.19 22.66 22.72 18.44 20.42
17.05 24.20 27.50 27.94 24.42 25.42 25.82 27.18 28.64
HE
7.84 11.09 12.18 13.75 11.52 13.59 12.27 9.91 8.95
9.12 15.18 16.72 16.40 15.45 17.34 16.50 16.79 16.71
ES
13.81 9.46 9.52
13.02 11.99 14.00 13.62 15.08 16.50 16.97 12.97 13.05
18.93 19.35 20.25
8.49
PO
7.82 10.89 11.59 12.04 13.06 17.54 17.12 12.72 12.55
24.22 23.78 23.58
MOYENNE AVERAGE
(-)
9.66 10.94 13.43 14.34 14.35 16.05 13.42 10.42
9.19
6.52 8.60
10.40 11.68 12.27 12.73 12.97 9.95 9.81
13.38 15.67 18.31 19.58 20.40 21.19 21.29 20.48 20.95
7.32 10.15 11.05 11.46 12.62 12.58 13.83 13.05 13.14
(·) Moyenne pondérée sur la base de la consoneation des différents pays en 1986 Weighted by the 1986 structure of consumption in the different countries ··) IR f<1986), DK PO gaz d'usine, ES gaz naturel & d'usine IR (<1986) DK PO gasworks gas, ES natural and gasworks gas ·««) Prix relevés aux places indiqués aux tableaux 9 à 19 Prices recorded in the towns indicated in tables 9 to 19

TAB. 55 COMPARAISON ENTRE LES PRIX DE L'ENERGIE UTILE - ECU PAR GJ (PCI) COMPARISON BETWEEN USEFUL ENERGY PRICES - ECU PER GJ (NCV)
SECTEUR DOMESTIQUE JUILLET
HOUSEHOLD SECTOR JULY
(***)
GASOI] 1980 1981 1982 1983 1984 1985 1986 1987 1988
GAZ N/ 1980 1901 1982 1983 1984 1985 1986 1987 1900
DE
, CHAUFF/ 9.67
11.28 12.37 12.01 12.25 12.68 5.34 7.36
LTUREL /
ELECTRICITE / 1980 1981 1982 1983 1984 1985 1986 1987 1988
CHAR» 1980 1981 1982 1983 1984 1985 1986 1987 1988
21.07 22.45
W / COA
11.47 12.47 12.85 14.56 15.05
FR
iGE / m 10.91 13.68 14.49 14.69 15.63 16.99 9.51
10.79
NATURAL
ELECTRI(
25.41 24.56
14.75 16.22 17.05 18.17 17.77
IT
TING GAÍ 10.43 12.02 13.93 15.60 16.95 17.11 13.52 14.92
GAS (*»
im (ia
NL
¡on 10.54 12.35 13.68 13.22 13.98 14.07 6.79
10.24
(125.6
100 KWH ]
23.96 22.05
15.85 16.59 17.04 17.18 16.30
12.34 14.91 15.55 16.85 17.61
BE
9.38 11.04 12.55 12.03 12.73 13.17 5.68 7.32
GJ P.A.
L.A.)
22.04 20.72
12.81 12.94 13.53 14.66 15.23
LX
9.83 11.04 11.70 11.59 12.33 13.01 6.05 7.21
18.97 19.63
UK
9.85 12.28 14.06 13.59 13.40 14.19
6.91 7.38
15.21 13.53
10.57 12.12 12.88 12.03 11.17
PRIX TOUTES TAXES COMPRISES
TAX PAID PRICES
IR
9.77 12.34 12.57 13.80 13.71 16.04
9.62 10.78
19.85 16.75
8.33 8.84
11.24 10.35 9.23
DK
12.35 15.94 16.03 15.57 16.42 16.84 16.36 19.83
30.41 26.33
HE
12.12 11.73 12.43 13.75 13.45 12.37 10.71 9.41
15.82 17.89
ES
12.02 9.36
19.90 19.91
8.51
PO
23.30 23.18
MOYENNE AVERAGE
(»)
10.19 12.13 13.30 13.36 13.93 14.52 8.18 9.66
21.06 20.81
11.26 12.53 13.37 13.23 12.54
(*) Moyenne pondérée sur la base de la consommation des différents pays en 1986 Weighted by the 1986 structure of consumption in the different countries (**) IR f<1986), DK PO gaz d'usine, ES gaz naturel & d'usine IR (<1986) DK PO gasworks gas, ES natural and gasworks gas (*««) Prix relevés aux places indiqués aux tableaux 9 à 19 Prices recorded in the towns indicated in tables 9 to 19
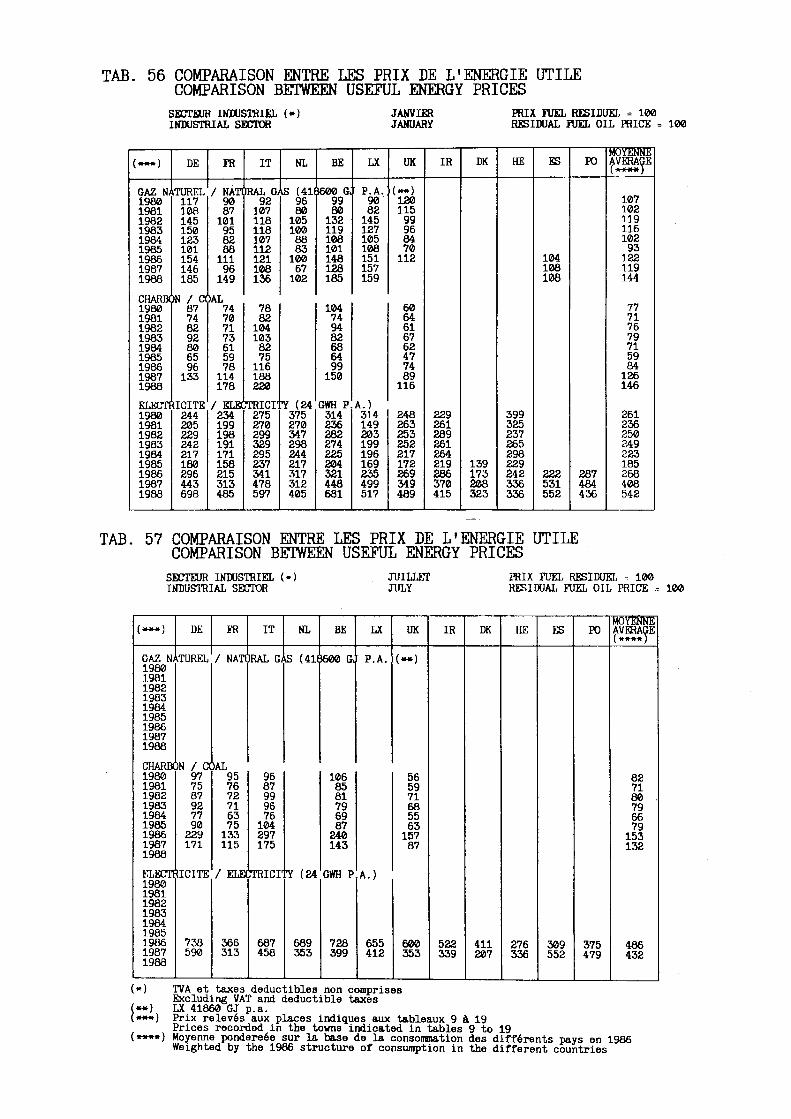
TAB. 56 COMPARAISON ENTRE LES PRIX DE L'ENERGIE UTILE COMPARISON BETWEEN USEFUL ENERGY PRICES SECTEUR INDUSTRIEL (*) INDUSTRIAL SECTOR
JANVIER JANUARY
PRIX FUEL RESIDUEL = 100 RESIDUAL FUEL OIL PRICE = 100
(«~M-tt)
GAZ N/ 1980 1981 1982 1983 1984 1985 1986 1987 1988 CHARJX 1980 1981 1982 1983 1984 1985 1986 1987 1938
DE
TUREL 117 108 145 150 123 101 154 146 185
IN / a 87 74 82 92 80 65 96 133
ELECTRICITE 1980 1981 1982 1983 1984 1985 1986 1987 1933
244 205 229 242 217 180 296 443 698
FR IT NL BE LX
/ NATURAL GAS (416600 GJ P.A. 90 87 101 95 32 88 111 96 149
)AL 74 70 71 73 61 59 78 114 178
/ ELE* 234 199 198 191 171 158 215 313 435
92 107 118 118 107 112 121 108 136
78 82 104 103 32 75 116 188 220
TRICI' 275 270 299 329 295 237 341 478 597
96 80 105 100 33 S3 100 67 102
Ύ (24 375 270 347 298 244 217 317 312 405
99 80 132 119 108 101 148 128 185
104 74 94 82 68 64 99 150
GWH Ρ 314 236 282 274 225 204 321 448 681
90 82 145 127 105 108 151 157 159
Α.) 314 149 203 199 196 169 235 499 517
UK
( — ) 120 115 99 96 34 70 112
60 64 61 67 62 47 74 89 116
248 263 253 252 217 172 269 349 489
IR
229 261 289 261 264 219 235 370 415
DK
139 173 208 323
HE
399 325 237 265 298 229 242 336 336
ES
104 108 108
ZZZ 531 552
PO
287 484 436
MOYENNE AVERAGE [ iHHHl 1
107 102 119 116 102 93 122 119 144
77 71 76 79 71 59 84 126 146
261 236 250 249 223 185 268 408 542
TAB. 57 COMPARAISON ENTRE LES PRIX DE L'ENERGIE UTILE COMPARISON BETWEEN USEFUL ENERGY PRICES SECTEUR INDUSTRIEL ( ·) JUILLEI PRIX FUEL RESIDUEL = 100 INDUSTRIAL SECTOR JULY RESIDUAL FUEL OIL PRICE --
(***)
GAZ Ν/ 1980 1981 1982 1983 1984 1985 1986 1987 1988 CHARBÍ
1980 1981 1982 1933 1984 1985 1986 1987 1988
DE
TUREL
JN / α
97 75 87 92 77 90 229 171
ELECTRICITE 1980 1981 1982 1983 1984 1985 1986 1987 1988
738 590
FR
/ NATI
IT
IRAL G*
NL
kS (411
»AL 95 76 72 71 63 75 133 115
/ ELEI
366 313
96 87 99 96 76 104 297 175
TRICI'
687 458
Ύ (24
689 353
BE
S600 G.
106 85 81 79 69 87 240 143
GWH Ρ
728 399
LX
Γ P.A.
Α.)
655 412
UK
(«*)
56 59 71 68 55 63 157 87
600 353
IR
522 339
DK
411 207
HE
276 336
ES
309 552
PO
375 479
MOYENNE AVERAGE ( -κ-***)
82 71 80 . 79 66 79 153 132
486 432
løø
(») TVA et taxes deductibles non comprises Excluding VAT and deductible taxes LX 41860 GJ p.a. Prix relevés aux places indiques aux tableaux 9 à 19 Prices recorded in the towns indicated in tables 9 to 19 ) Moyenne pondereée sur la base de la consommation des différents pays en 1986 Weighted by the 1986 structure of consumption in the different countries

TAB. 58 COMPARAISON ENTRE LES PRIX DE L'ENERGIE UTILE COMPARISON BETWEEN USEFUL ENERGY PRICES SECTEUR DOMESTIQUE (») HOUSEHOLD SECTOR
JANVIER JANUARY
PRIX GASOIL CHAUFFAGE HEATING GASOIL PRICE =
= loo 100
( *** ) DE
GAZ NATUREL 1980 1981 1982 1983 1984 1985 1935 1987 1988
78 98 104 109 101 96 130 118 157
CHARBON / ά 1980 1981 1982 1983 1984 1905 1986 1987 1988
87 92 80 87 85 85 119 188 241
ELECTRICITE 1980 1981 1982 1983 1984 198b 1986 1987 1988
119 126 127 141 143 132 177 264 362
FR IT NL ■ - — . . . . - -
BE
/ NATURAL GAS (125.6 GJ 93 87 90 83 91 92 101 99 104
)AL
116 103 101 95 107 99 120 154 170
/ ELK
181 148 142 134 154 144 171 206 235
84 95 79 88 93 86 95 81 82
60 68 67 74 74 75 92 81 93
116 114 108 99 100 89 99 127 100
TRICr
100 93 85 88 87 100 123 161
Ύ (13< 180 179 185 201 184 182 203 194 218
79 86 98 104 103 109 127 142 162
104 100 92 103 95 97 123 202 230
100 KW! 189 180 169 187 172 172 198 291 342
LX
P.A.) 69 76 93 84 86 99 99 105 91
I P.A. 137 113 122 125 148 146 149 295 286
UK
52 55 56 60 70 62 75 106 117
77 86 79 74 90 81 106 143 175
119 131 115 107 ■ 119 109 129 164 196
IR
184 218 222 107 112 103 127 134 116
68 69 67 59 63 68 72 104 86
142 154 158 130 139 135 138 182 157
DK
153 155 132 142 144 127 131 90 106
153 184 167 158 145 143 149 133 149
HE
116 137 137 119 134 128 135 169 187
ES
123 137 137
89
137 205 213
PO MOYENNE AVERAGE
67 78 77 81 85 79 96 95 106
75 92 82 79 87 78 102 125 142
138 143 136 136 142 131 158 195 227
TAB. 59 COMPARAISON ENTRE LES PRIX DE L'ENERGIE UTILE COMPARISON BETWEEN USEFUL ENERGY PRICES
SECTEUR DOMESTIQUE (*) HOUSEHOLD SECTOR
JUILLET JULY
PRIX GASOIL CHAUFFAGE = 100
HEATING GASOIL PRICE = 100
MÔYEWNEI
AVERAGE ( ***) DE FR IT NL BE LX UK IR DK HE ES PO
GAZ NATUREL 1980 1981 1982 1983 1984 1985 1986 1987 1988
CHARBON / COAL 1980 1981 1982 1983 1984 1985 1986 1987 1988
/ NATURAL GAS (125.6 GJ P.A.)
95 102 101 272 204
100 104 100 191 165
ELECTRICITE / 1980 1981 1982 1983 1984 198b 1986 394 1987 305 1988
102 98 100 127 109
267 228
93 107 111 243 172
106
102 103 258 208
ELECTRICITY (13000 KWH P.A
353 215
388 283
313 272
78 90 91 174 151
220 183
60 64 70 108 86
206
155
91
185 133
148 190
166 213
64 89 92 161 129
256 214
(*) Prix toutes taxes comprises Tax paid prices
(**) LX 41860 GJ p.a. (***) Prix relevés aux places indiques aux tableaux 9 à 19
Prices recorded in the towns indicated in tables 9 to 19 (*»**) Moyenne pondereée sur la base de la consommation des différents pays en 1986
Weighted by the 1986 structure of consumption in the different countries

TAB 60 INCIDENCE DE LA FISCALITE EN POURCENTAGE DU PRIX TOUTES TAXES COMPRISES (*)
INCIDENCE OF TAXATION AS PERCENTAGE OF PRICE INCLUDING VAT (*)
FUEL-OIL RESIDUEL (HTS) RESIDUAL FUEL OIL (HSC)
CHARBON INDUSTRIEL INDUSTRIAL COAL
ELECTRICITE INDUSTRIELLE INDUSTRIAL ELECTRICITY. (1.25 Gwh p.a.)
ELECTRICITE INDUSTRIELLE INDUSTRIAL ELECTRICITY (10 Gwh p.a.. )
ELECTRICITE INDUSTRIELLE INDUSTRIAL ELECTRICITY (24 Gwh p.a.)
GAZ INDUSTRIEL INDUSTRIAL GAS (41860 GJ p.a.)
GAZ INDUSTRIEL INDUSTRIAL GAS (418600 GJ p.a.)
GASOIL ROUTIER AOTOMOTIvï DIESEL
ESSENCE SUPER PREMIUM GASOLINE
GASOIL CHAUFFAGE HEATING GASOIL
CHARDON DOMESTIQUE DOMESTIC COAL
ELECTRICITE DOMESTIQUE DOMESTIC ELECTRICrr? (1700 Kwh p.a.)
ELECTRICITE DOMESTIQUE DOMESTIC ELECTRICITY (3500 Kwh p.a.)
ELECTRICITE DOMESTIQUE DOMESTIC ELECTRICITY (13000 Kwh p.a.)
GAZ DOMESTIQUE DOMESTIC GAS (16.74 GJ p.a.)
GAZ DOMESTIQUE DOMESTIC GAS (125.6 GJ p.a.)
1980 1 1987 1 1987 7 1988 1
1980 1 1987 1 1987 7 1988 1
1980 1 1987 1 1987 7 1988 1
1980 1 1987 1 1987 7 1988 1
1980 1 1987 1 1987 7 1988 1
1980 1 1987 1 1987 7 1988 1
1980 1 1987 1 1987 7 1988 1
1980 1 1967 1 1987 7 1988 1
1980 1 1987 1 1987 7 1988 1
1980 1 1987 1 1987 7 1988 1
1980 1 1987 1 1987 7 1988 1
1980 1 1987 1 1987 7 1988 1
1980 1 1987 1 1987 7 1988 1
1980 1 1987 1 1987 7 1988 1
1980 1 1987 1 1987 7 1988 1
1980 1 1987 1 1987 7 1988 1
DE
4.4 5.1 6.6 7.9
.0
.0
.0
5.0 4.7
7.3
5.0 4.8
7.3
5.0 4.8
7.3
.0
.0
.0
.0
.0
.0
50.3 57.4 61.6 49.8
52.3 62.1 62.9 67.2
14.1 16.1 16.4 17.4
11.5 12.3 12.3 12.3
15.8 16.4
18.9
15.8 16.4
18.9
15.8
16.4
18.9
11.5 12.3
12.3
11.5 12.3
12.3
FR
.0 19.1 19.3 20.8
.0
.0
.0
.0
.0
.Θ
.0
.0
.0
.0
.0
.0
.0
.0
.0
.0
.0 4.0
3.7
.0 7.4
6.9
49.4 60.7 60.9 62.4
59.5 76.0 74.8 77.5
25.2 33.9 38.9 36.0
15.0 15.7 15.7 15.7
22.0 20.6
22.6
22.0 20.6
22.6
22.0 20.6
22.6
15.0 15.7
15.7
15.0 15.7
15.7
IT
.6 6.7 6.2 8.5
.0
.0
.0
.0
.7 9.7 9.1 12.7
.6
.3
.7
.8
.7
.9
.9
.9
.0
.0
.0
.0
.0
.0
20.9 57.9 56.8 61.0
63.6 80.5 77.7 79.5
21.1 60.8 61.2 65.6
12.3 8.3 8.3 8.3
7.8 13.9 13.5 14.5
6.8 14.8 13.2 15.8
20.6 12.9
12.9
21.3 14.9
14.2
NL
4.6 10.6 11.5 13.5
.0
.0
.0
.0
.0
.0
.0
.0
.0
.0
.0
.0
.0
.2
.1
.0
.2
.2
36.3 47.8 49.3 51.5
54.7 70.1 69.1 73.1
20.3 35.8 37.2 39.3
15.3 16.7 16.7
15.2 16.7 16.7 16.7
15.3 16.7 16.7 16.7
15.2 16.7 16.7 16.7
15.3 16.7
16.7
15.4 16.8
16.8
HE
2.1 .0 .0 .0
.0
.0
.0
.0
.0
.0
.0
.0
.0
.0
.0
.0
.0
.0
.0
.0
.0
.0
.0
.0
.0 33.6 49.9 50.1 52.0
53.3 64.3 64.2 67.0
10.5 14.5 14.5 14.5
5.7 5.7 5.7 5.7
13.8 14.6 14.5 14.5
13.7 14.5 14.5 14.5
13.6 14.4 14.4 14.6
5.7 14.5
14.5
5.6 14.5
14.5
LX
2.2 2.5 2.0 2.5
.0
.0
.0
.0
.0
.0
.0
.0
.0
.0
.0
.0
.0
.0
.0
22.9 43.5 41.7 42.8
46.6 56.7 54.0 59.8
9.5 5.7 5.7 5.6
4.8 5.6 5.7 5.7
4.6 5.6 5.7 5.5
4.8 5.7 5.5 5.6
4.8 5.7
5.7
4.8 5.7
5.7
UK
7.8 8.1 8.2 11.2
.0
.0
.0
.0
.0
.0
.0
.0
.0
.0
.0
.0
.0
.0
.0
.0
.0
.0
.0
46.2 59.9 60.5 61.3
43.7 63.5 64.0 65.7
5.8 7.5 8.4 9.0
.0
.0
.0
.0
.0
.0
.0
.0
.0
.0
.0
.0
.0
.0
.0
.0
.0
.0
.0
.0
.0
.0
IR
4.4 7.3 6.7 8.4
.0
.0
.0
.0
.0
.0
.0
.0
.0
.0
.0
.0
27.8 63.2 61.8 63.0
44.7 67.7 66.4 70.4
3.3 18.8 26.7 26.9
.0 9.1 9.1 9.1
.0
.0
.0
.0
.0
.0
.0
.0
.0
.0
.0
.O
.0 9.1
9.1
.0 9.1
9.1
DK
.0
.0
.0
.0
.0
.0
.0
.0
.0
.0
.0
.0
.0
.0
.0
29.3 59.9 61.1 60.2
63.1 73.5 73.5 77.8
30.5 63.3 64.5 64.9
30.5 49.3 49.4 47.1
32.6 54.5 54.7 51.6
34.5 59.2 63.8 56.7
27.6 18.0
18.0
30.6 18.0
18.0
HE
4.1 52.1 38.8 56.3
.0
.0
.0
.0
.0
.0
.0
.0
.0
.0
.0
.0
14.5 51.6 45.3 46.7
47.3 71.8 66.6 72.8
14.5 51.6 45.3 46.7
7.4 15.3 15.2 13.8
7.4 15.2 15.2 13.8
7.4 15.2 15.3 13.8
FJS
.6
.7 30.7
.0
.0
.0
.0
.0
.0
.0
.0
.0
7.0 1.6
1.6
7.7 1.4
1.4
56.2 54.2 53.9
66.5 63.9 66.4
38.3 34.3 33.5
10.7 10.7
10.7 10.7 10.7
10.7 10.7 10.7
10.8 10.7 10.7
2.3 12.1
12.1
2.7 12.0
12.0
ΙΌ Ί
17.6 7.5 4.9
.0 .0
.0
.0
.0 .0
.0
.0
.0
58.1 58.5 53.0
72.5 71.7 68.9
7.4 7.4 .0
7.4 7.4 7.4
7.4 7.4 7.3 .0
7.4 7.4 .0
7.4 7.4
(*) Secteur industriel: TVA et taxes déductibles non comprises Industrial sector: excluding VAT and deductible taxes
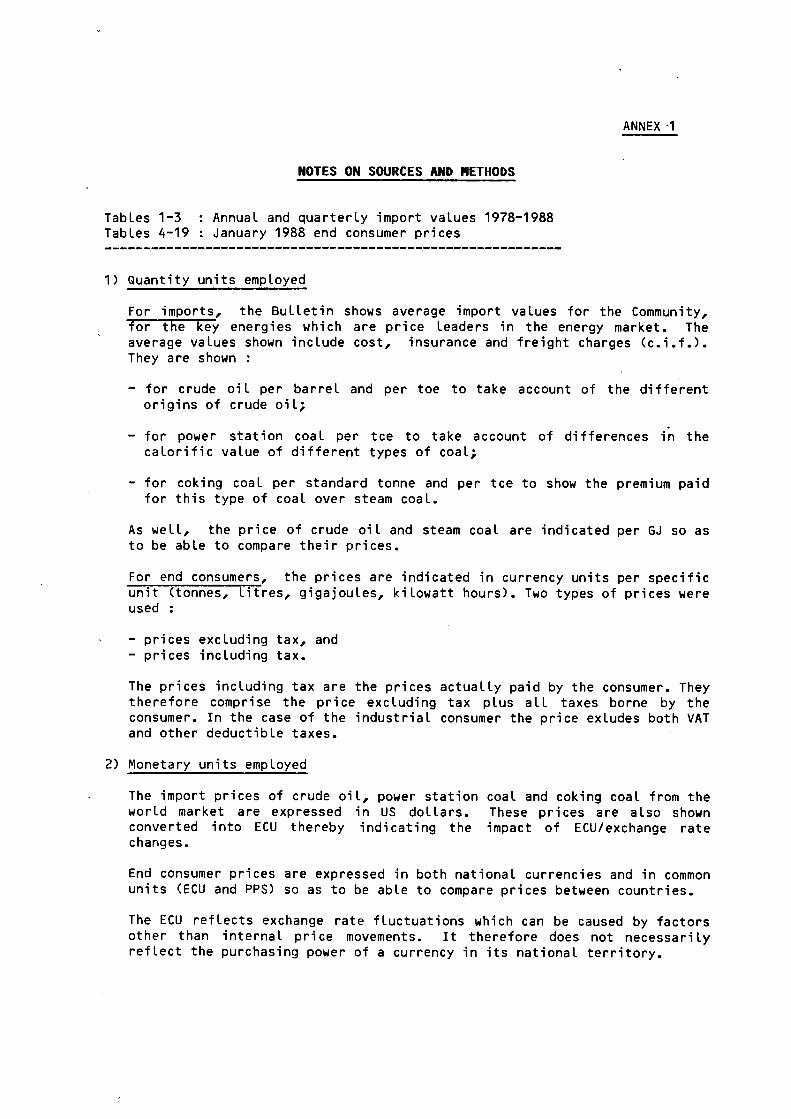
ANNEX -1
NOTES ON SOURCES AND METHODS
Tables 1-3 : Annual, and quarterly import values 1978-1988 Tables 4-19 : January 1988 end consumer prices
1) Quantity units employed
For imports, the Bulletin shows average import values for the Community, for tïïë icëy energies which are price leaders in the energy market. The average values shown include cost, insurance and freight charges (c.i.f.). They are shown :
- for crude oil per barrel and per toe to take account of the different origins of crude oil;
- for power station coal per tee to take account of differences in the calorific value of different types of coal;
- for coking coal per standard tonne and per tee to show the premium paid for this type of coal over steam coal.
As well, the price of crude oil and steam coal are indicated per GJ so as to be able to compare their prices.
For end consumers, the prices are indicated in currency units per specific unit (tonnes, litres, gigajoules, kilowatt hours). Two types of prices were used :
- prices excluding tax, and - prices including tax.
The prices including tax are the prices actually paid by the consumer. They therefore comprise the price excluding tax plus all taxes borne by the consumer. In the case of the industrial consumer the price exludes both VAT and other deductible taxes.
2) Monetary units employed
The import prices of crude oil, power station coal and coking coal from the world market are expressed in US dollars. These prices are also shown converted into ECU thereby indicating the impact of ECU/exchange rate changes.
End consumer prices are expressed in both national currencies and in common units (ECU and PPS) so as to be able to compare prices between countries.
The ECU reflects exchange rate fluctuations which can be caused by factors other than internal price movements. It therefore does not necessarily reflect the purchasing power of a currency in its national territory.

The PPS is calculated in such a way that the purchasing power parity between the PPS and each national currency expresses the number of national currency units required to purchase in each Member State of the Community the same volume of goods and services obtained with one PPS in the Community.
This is a measurement unit which takes into account the purchasing power relationships between the respective currencies of the countries to be compared.
3) Sources
A. Crude oil (Table 1) Average c.i.f. imported crude oil prices are obtained from Council directive nr. 756/491/CEE (4 May 1976) which concerns price transparency. These prices are derived from oil company submissions to Member States, which are then aggregated by Member States and sent to the Commission. These figures cover at least 85% of the cruide oil imported and include the price of the indigenous crude oil production. They are calculated by weighting the average quality price of each type of crude oil by the quantities of each type of crude oil imported.
B. Imported coal for power stations (Table 2) Each quarter, the Member States of the European Community send the Commission the c.i.f. price of these imports from third countries broken down by origin and by length of contract (one year or more/spot). This information system is based on decision 77/707/ECSC mad? by representatives of Member States in the Council and subsequently modified by their decision 85/161/ECSC. This Bulletin shows the average spot and long-term contract prices. Prices are shown in tee so as to be able to compare the price of imported coals of different origin and different calorific values. Since 1985 these prices have been given to the Commission broken down by country of origin. The Commission is allowed to publish an average weighted import price for a given third party country, provided that at least four Community countries imported coal from this source.
C. Imported coking coal from third countries (Table 3) Under the Community rules for state aids to the coal industry (Decisions 2064/86/ECSC and 2645/86/ECSC), the Commission periodically receives necessary information from Community undertakings on the purchases of coking coal and coke from third countries for the Community's steel industry. From this information the Commission then calculates an average c.i.f. ARA value of imported coking coal and coke which is published as an "indicative price" to align Community coal prices. This indicative price is calculated using a standard grade of coking coal with the following characteristics :
ash moisture sulphur volati le matter screen size
until 31.12.86 6 % (dry) 5 % 1 % (dry) 24 7. (dry) 0 - 30 mm
from 1.1.87 7,5 % (dry) 8 % 0,8 % (dry) 26 % (dry) 0 - 30 mm

The indicative price per tonne is shown in columns 1 and 2, table 3; columns 4 and 5 show the price per tee of the same standard tonne so as to be able to compare the price with steam coal. The price shown is that at the beginning of each quarter.
D. Petroleum products (Tables 4 to 7) Ruling prices notified by Member States to the Commission each month pursuant to Directive 76/491/EEC of 4 May 1976. The prices given are those recorded at 15 January for :
Gasoline and automotive diesel oil = pump prices
Heating gas oil = prices for deliveries of between 2000 and 5000 litres
Resiudal fuel oil = prices for monthly deliveries of less than 2000 tonnes or annual deliveries of less than 24.000 tonnes
E. Coal (Tables 8 and 9) - Domestic sector : average retail prices for small quantities notified
to the Commission by various sources including producers and dealers.
- Industrial sector : these prices are derived from a regular survey undertaken by the Statistical Office of the European Communities (S0EC) among consumers in the different Community countries. These prices are delivered prices for bulk delivery of treated coal in full loads.
For both sectors prices are given per tee and so can be compared.
F. Electricity (Tables 10 to 15) These prices are taken from a regular survey carried out by the International Union of Producers and Distributors of Electrical Energy (UNÍPEDE).
A detailed description of the methods used in this survey is given in the EUROSTAT publication "Electricity Prices".
For the countries which do not have national tariffs we have chosen the towns or regions which are most representative in the survey.
G. Gas (Tables 16 to 19) These prices are taken from regular S0EC survey of the gas utilities in the Community countries. The methodology is described in the EUROSTAT publication "Gas Prices".

The standard consumer categories used in this bulletin correspond to the following categories in the EUROSTAT publication :
Domestic gas - D2 and D3.
Industrial gas - I, . and I^_^
For national prices a representative town or region has been used.
Tables 20-47 : Series of end consumer prices
In order to take into account seasonal factors, two separate series indicate January and July prices respectively.
Tables 48-51 : Comparison of supplied energy prices
These tables show the prices of energy sources which can be regarded as competing in their sector of utilization. Prices are expressed in ECU per GJ (NCV).
Tables 52-59 : Comparison of useful energy prices
These tables are based on the prices shown in Tables 48 to 51. They express, in a first group (tables 52 to 55), prices in ECU/GJ of useful energy. A second group (tables 56 to 59) compares over time the prices of petroleum products and those of other energy sources for the same consumer categories.
The efficiency coefficients used for conversion into useful energy have been taken from the EUROSTAT publication : "Useful Energy Balance Sheets".
Table 60 : Incidence of taxation
This table shows the amount of tax expressed in the form of a percentage of the price paid by consumers, VAT and other deductible taxes have not been taken into account in the case of industrial consumers.
Graphs 4 to 6
Graphs 4 to 5 show average January and/or July ECU prices each year weighted by the 1986 structure of consumption in the different countries. The averages obtained are only a very rough but significant approximation of representative Community prices, partly because of the small number of countries in some cases and partly because of the representativeness of the price for the country.
Graph 6 shows in index form (1980) the trend of real Community prices i.e. at 1980 prices and exchange rates deflated by the index of consumer prices. The weighted average Community price was obtained in the same way as in Graphs 4 and 5.

ANNEXE 1
NOTES CONCERNANT LES SOURCES ET LA METHODOLOGIE
Tableaux 1 - 3 : Valeurs annuelles et trimestrielles à l'importation 1978-1988
Tableaux 4 - 19 : Prix à la consommation finale en janvier 1988
1) Unités de mesure quantitative
Au niveau de l'importation, le Bulletin présente les valeurs moyennes pour la Communauté de certaines énergies de base qui ont une fonction de prix directeur pour les différentes sections du marché énergétique. Les valeurs comprennent les coûts, assurances et frets (c.a.f.). Les unités dans lesquelles elles sont exprimées sont :
- le baril et la tep pour le pétrole brut, afin de tenir compte des différentes origines;
- la tec pour le charbon pour centrales, afin de tenir compte des différences en pouvoir calorifique;
- la tonne standard et la tec pour le charbon à coke, afin de faire apparaître la prime payée pour cette qualité par rapport au charbon vapeur.
En outre, les prix du pétrole brut et du charbon vapeur sont indiquées en Gigajoules pour des raisons de comparaison.
Au niveau de la consommation finale, les tableaux présentent les prix en unités monétaires par unités spécifiques (tonnes, litres, gigajoules, kilowatt-heures). Deux niveaux de prix ont été retenus :
- prix hors taxes - prix taxes comprises.
Le prix taxes comprises est le prix réellement payé par le consommateur. Il correspond, donc, au prix hors taxes plus l'ensemble des taxes qui restent à la charge du consommateur. Dans le cas du consommateur industriel ce prix ne comprend ni la TVA ni aucune autre taxe déductible.
2) Unités monétaires
Les prix pour l'importation en provenance des marchés mondiaux (pétrole brut, charbon pour centrales et charbon à coke) sont exprimés en dollars US. Ils sont aussi convertis en ECUS, afin de montrer l'impact des variations des cours de change.
Les prix â la consommation finale sont exprimés en monnaie nationale et ont été convertis dans les unités communes (ECU et SPA) dans le but de permettre une comparaison entre pays.
L'ECU reflète les fluctuations des taux de change qui peuvent aussi se produire sous l'effet de facteurs indépendants des mouvements de prix intérieurs. IL ne reflète donc pas nécessairement le pouvoir d'achat d'une monnaie sur le territoire national.

Le SPA est calculé de façon à ce que la parité du pouvoir d'achat entre le SPA et chaque monnaie exprime le nombre d'unités de monnaie nationale nécessaire pour acheter dans chaque pays de la Communauté le même volume de biens et de services qu'on obtient avec un SPA dans la Communauté.
Il s'agit donc d'une unité de mesure des valeurs qui tient compte des rapports de pouvoir d'achat de la monnaie des pays à comparer.
3) Sources
A. Pétrole brut (Tableau 1) Les prix CÃF moyens sont obtenus en application de la directive du Conseil nr 76/491/CEE du 4 mai 1976 sur la transparence des prix. Ils résultent de déclarations de sociétés pétrolières que les gouvernements communiquent à la Commission sous forme agrégée. Ces données portent sur 85 % au moins des quantités de pétrole brut importé et incluent la production locale de pétrole brut; elles correspondent au coût moyen trimestriel de chaque qualité de pétrole brut pondéré par les quantités de l'approvisionnement en brut.
B. Charbon importé pour centrales électriques (Tableau 2) Les Etats membres communiquent chaque trimestre à la Commission les prix cif de ces importations en provenance des pays tiers ventilées par origine et par durée du contrat (un an et plus/spot). Ce système d'information a été élaboré sur base de la décision 77/707/CECA des Représentants des Etats membres réunis au Conseil et modifiée par leur décision 85/161/CECA. Le présent Bulletin reprend la moyenne des prix pour importations spot et à long terme. Les prix sont indiqués par tec afin de permettre une comparaison malgré les variations du pouvoir calorifique du charbon suivant leur origine. Depuis 1985 les prix sont communiqués par pays d'origine. La Commission peut publier un prix moyen pondéré pour l'ensemble des fournitures en provenance d'un pays tiers déterminé, sous réserve qu'elles soient reçues dans quatre pays ou plus de la Communauté.
C. Charbon à coke importé des pays tiers (Tableau 3) Dans te cadre dû régime communautaire des interventions des Etats membres en faveur de l'industrie houillière (décisions 2064/86/CECA et 1465/86/CECA), la Commission reçoit périodiquement des entreprises de la Communauté les informations essentielles concernant les achats de charbon à coke ou cokes en provenance des pays tiers et destinés à la sidérurgie de la Communauté. Elle calcule sur cette base une valeur moyenne cif ARA qui est publiée comme "prix indicatif" pour les alignements de prix du charbon communautaire. Ce prix se réfère à un charbon à coke présentant les caractéristiques suivantes :
jusqu'au 31.12.86 à partir du 1.1.87 cendres 6 % (sur sec) 7,5 % (sur sec) eau 5 % 8 % soufre 1 % (sur sec) 0,8 % (sur sec) matières volatiles 24 % (sur sec) 26 % (sur sec) granulometrie 0-30 mm 0-30 mm

Le "prix indicatif" par tonne standard est indiqué dans les colonnes 1 et 2 du tableau 3; les colonnes 4 et 5 indiquent un prix dérivé par tec afin de permettre une comparaison avec le charbon valeur. Dans les deux cas il s'agit du prix valable au début de chaque trimestre.
D. Produits pétroliers (Tableaux 4-7) Prix pratiqués tels qu'ils sont notifiés par les Etats membres chaque mois à la Commission conformément à la Directive 76/491/CEE du 4 mai 1976. Les prix indiqués sont les prix relevés au 15 janvier pour les consommations suivantes :
Essence et gasoil routier = prix à la pompe
Gasoil chauffage = prix pour livraisons de 2000 à 5000 litres
Fuel oil résiduel = prix pour livraisons inférieurs à 2000 tonnes par mois ou 24000 tonnes par an.
E. Charbon (Tableaux 8 et 9) - Secteur domestique : prix moyens au détail pour des petites
quantités, notifiés à la Commission par différents milieux, tels que producteurs et marchands;
- Secteur industriel : les prix proviennent d'une enquête régulière menée par l'Office Statistique des Communautés Européennes (OSCE) parmi les consommateurs et négociants dans différents pays de la Communauté. Il s'agit de prix franco consommateur pour des livraisons de charbons préparés en vrac par véhicule complet.
Pour les deux secteurs les prix sont indiqués par tee et sont ainsi comparables.
F. Electricité (Tableaux 10-15) Les prix proviennent d'une enquête régulière menée par l'Union internationale des Producteurs et Distributeurs d'Energie Electrique (UNÍPEDE).
Une description détaillée de la méthodologie utilisée pour cette enquête figure dans la publication EUROSTAT "Prix de l'énergie électrique".
Pour Les pays dans lesquels il n'existe pas de tarifs au niveau national, on a choisi, parmi les villes ou Les régions qui apparaissent dans l'enquête, celles qui semblent être les plus significatives.
G. Gaz (Tableaux 16-19) Les prix proviennent de l'enquête régulière menée par l'OSCE parmi les sociétés de distribution de gaz dans les différents pays de la Communauté. La méthodologie est décrite dans la publication EUROSTAT "Prix du Gaz".

Les consommateurs-type retenus pour ce Bulletin correspondent aux catégories suivantes de la publication EUROSTAT :
Gaz domestique : D2 et D3,
Gaz industriel : I, ,. et I, ,.
En ce qui concerne les prix dans les différents pays, la méthode du choix d'une ville ou d'une région représentative a été retenue.
Tableaux 20-47 : Séries de prix à la consommation finale
Les tableaux présentent deux séries distinctes pour les mois de janvier et de juillet, afin de tenir compte des facteurs saisonniers.
Tableaux 48-51 : Comparaison entre prix de l'énergie finale
Dans ces tableaux on a réuni les prix des énergies qui peuvent être considérées concurrentes dans leur secteur d'utilisation. Les prix sont exprimés en ECUS par Gigajoule (PCI).
Tableaux 52-59 : Comparaison entre les prix des énergies utiles
Ces tableaux sont établis sur la base des prix des tableaux 48-51. Ils expriment dans un premier groupe (Tabi. 52-55), les prix en ECU/GJ utile. Un deuxième groupe (Tabi. 56-59) indique l'évolution dans le temps des rapports entre les prix des produits pétroliers et ceux des autres énergies pour les mêmes catégories de consommateurs.
Pour la conversion en énergie utile les coefficients de rendement retenus sont extraits de la publication EUROSTAT : "Bilans de l'Energie Utile".
Tableau 60: Incidence de la fiscalité
Dans ce tableau le montant des taxes a été reporté, sous forme de pourcentage du prix payé par les consommateurs.
Dans le cas des consommateurs industriels, la TVA et d'autres taxes déductibles n'ont pas été considérées.
Graphiques 4 à 6
Pour la construction des graphiques 4 et 5, on a calculé la moyenne pondérée, sur la base de la consommation des différents pays en 1986, des prix exprimés en Ecus au mois de janvier de chacune des années considérées. Les moyennes ainsi obtenues ne constituent qu'une approximation très grossière quoique significative des prix représentatifs pour la Communauté, en raison du nombre de pays, parfois limité, et de la représentativité du prix au niveau national.
Le graphique 6 représente l'évolution, sous forme d'indices, base 1980 de la moyenne communautaire des prix réels, c'est à dire aux prix et taux de change de 1980 et deflate à l'aide des indices des prix à la consommation. La moyenne a été obtenue en utilisant la même méthode de calcul pour les graphiques 4 et 5.

TABLES DE CONVERSION - CONVERSION TABLES A) 1 SPA / 1 PPS =
1980 1981 1982 1983 1984 1985 1966 1987 1988
DM 2.66 2.49 2.36 2.24 2.15 2.07 2.02 1.99 1.97
FF 5.87 5.90 5.97 6.03 6.08 6.07 6.02 5.97 5.91
LIT 857 916 964 1024 1059 1087 1113 1128 U4B
HFL 2.70 2.57 2.47 2.32 2.21 2.12 2.03 1.92 1.86
BFR 42.4 40.1 38.9 38.0 37.4 37.2 36.6 35.9 36.4
LFR 39.3 37.8 37.8 37.2 36.9 36.0 35.0 34.0 33,6
UKL 0.511 0.513 0.500 0.485 0.474 0.474 0.465 0.466 0.470
IRL 0.537 0.568 0.593 0.603 0.610 0.603 0.604 0.602 0.598
DKR 8.41 8.35 8.37 8.30 8.23 8.17 B. 13 8.25 8.29
DRA 38.30 41.40 46.90 51.50 58.10 64.50 72.80 81.00 90.00
PES 69.70 70.40 72.60 74.60 77.60 77.60 83.60 85.40 86.50
ESC 31.20 32.50 36.20 41.60 48.20 55.30 60.90 66.10 69.10
B) 1 ECU = (valeur à la fin du nais précédant / value at end of month before) JANVIER JANUARY 1980 1981 1982 1983 1984 1985 1986 1987 1988
JUILLET JULY 1980 1981 1982 1983 1984 1985 1986 1987
DM 2.49 2.58 2.44 2.30 2.26 2.22 2.18 2.08 2.07
2.52 2.52 2.36 2.27 2.34 2.25 2.15 2.08
FF 5.83 5.96 6.21 6.51 6.90 6.81 6.70 6.88 6.97
5.84 5.99 6.57 6.84 6.86 6.85 6.85 6.91
LIT 1161.3 1225.8 1308.9 1320.9 1371.2 1367.8 1489.9 1446.2 1519.0
1198.1 1255.1 1323.6 1346.5 1373.6 1433.2 1475.9 1502.8
HFL 2.75 2.80 2.68 2.53 2.54 2.51 2.46 2.34 2.32
2.75 2.81 2.61 2.54 2.52 2.53 2.42 2.34
BFR LIK 40.43 41.49 41.61 45.05 46.07 44.52 44.65 43.23 43.19
40.27 41.29 45.05 45.54 45.33 45.27 43.92 43.05
UKL 0.64 0.53 0.57 0.61 0.57 0.62 0.62 0.72 0.69
0.61 0.55 0.55 0.58 0.59 0.57 0.64 0.70
IRL 0.67 0.69 0.69 0.69 0.73 0.71 0.71 0.76 0.78
0.67 0.69 0.69 0.72 0.73 0.72 0.71 0.77
DKR 7.77 7.94 7.99 8.09 8.18 7.95 7.96 7.86 7.93
7.79 7.91 8.18 8.17 8.18 8.07 7.97 7.88
DRA 55.07 61.26 62.23 68.54 81.78 91.04 131.20 148.53 164.62
55.07 61.26 62.23 68.54 81.78 99.97 137.48 156.44
PES 95.43 103.59 104.89 121.92 128.49 122.96 136.52 141.15 140.24
128.51 137.25 142.60
ESC 71.90 69.09 70.88 89.79 109.28 120.81 140.74 156.38 168.86
128.98 146.34 162.36
C) 1 ECU = US S
1978 1979 1980 1981 1982 1983 1984 1985 1986 1987 1988
MOYENNE ANNEE AVERAGE YEAR 1.27410 1.37065 1.39233 1.11645 0.97971 0.89022 0.78903 0.76309 0.98417 1.15387
MOYENNE TRIMESTRE I
1.23740 1.35409 1.41112 1.23287 1.03632 0.94794 0.83167 0.68447 0.92288 1.12455 1.23326
II 1.23556 1.33224 1.39108 1.11509 1.00185 0.91120 0.82477 0.72602 0.95878 1.14978
/ AVERAGE QUARTER III
1.28156 1.38916 1.42323 1.03293 0.95064 0.86068 0.76863 0.78473 1.01273 1.12844
IV 1.34184 1.40501 1.34205 1.08925 0.93359 0.84387 0.73206 0.85291 1.03816 1.21370
FIN TRIMESTRE / BID QUARTER I
1.25929 1.35172 1.30290 1.20966 0.99518 0.92379 0.85983 0.72711 0.93674 1.14804 1.25173
II 1.24412 1.36447 1.43010 1.05450 0.95982 0.89177 0.80389 0.73495 0.97822 1.13278
III 1.31593 1.42770 1.39994 1.06680 0.93059 0.85938 0.73893 0.82622 1.02959 1.12965
IV 1.37688 1.43830 1.30963 1.08517 0.96767 0.82737 0.70895 0.88793 1.07038 1.30335
D) INDICES DES PRIX A LA CONSOMMATION (MOYENNE 1960=100) / CONSUMER PRICE INDEX (AVERAGE 1980=100) JANVIER JANUARY 1980 1981 1982 1983 1984 1985 1986 1987 1988
JUILLET JULY 1980 1981 1982 1983 1984 1985 1986 1987
DE 97.3 103.1 109.8 114.4 117.5 120.0 121.6 120.6 121.5
100.4 106.8 112.6 115.8 118.4 121.1 120.5 121.3
FR 94.2 106.3 121.0 132.6 144.5 153.9 160.4 165.2 169.1
100.4 113.8 127.4 139.4 149.8 158.9 162.1 167.6
IT 92.4 109.1 128.3 149.1 167.4 182.9 197.9 206.3 216.9
100.1 118.1 137.0 157.6 174.4 190.8 201.8 210.9
NL 96.4 103.3 110.2 114.3 117.8 120.6 122.4 121.3 122.1
100.3 107.0 113.2 116.0 119.3 122.2 121.7 122.1
BE 97.4 104.2 112.8 122.2 130.6 137.2 142.0 143.3 144.6
100.1 108.0 117.6 126.4 134.5 141.3 142.1 145.1
LX 97.1 104.2 113.2 124.8 134.0 139.1 144.2 142.6 143.5
100.2 108.7 119.0 128.6 136.8 143.2 142.3 142.1
UK 93.0 105.2 117.8 123.6 129.9 136.4 144.0 149.6 154.5
101.6 112.7 122.5 127.6 133.3 142.5 145.9 152.3
IR 92.6 112.0 133.2 149.8 165.1 175.3 183.3 189.6 193.3
102.4 123.0 143.9 158.3 170.9 180.2 185.8 191.8
DK 94.8 104.9 117.8 128.6 135.6 143.5 147.5 154.6 161.3
101.2 113.0 123.5 131.3 139.9 146.4 151.7 157.9
HE 91.3 114.6 138.7 165.3 198.6 236.4 295.6 341.5 390.3
100.3 123.8 152.1 180.2 214.9 250.9 312.6 365.5
ES 94.7 108.4 124.0 140.9 157.9 172.6 188.4 199.9 208.9
178.0 194.7 204.3
PO 94.5 109.3 135.2 164.1 214.5 267.2 305.1 335.1 363.6
284.2 316.2 345.4
E) POUVOIR CALORIFIQUE INFERIEUR (PCI) / NET CALORIFIC VALUE (NCV) Petrole brut Fuel oli residuel Gasoil
Electricité Charbon
1 TEP 1 TONNE 1 TONNE
1000 LIT 1 GJ PCS 100 KWh 1 TEC
41.86 GJ 40 GJ 42.3 GJ 36.378 GJ 0.9 GJ 0.36 GJ 29.3 GJ
Crude oil Residual fuel Gasoil Gas Electricity Coal
F) TAUX DE RENDEMENT / RATES OF EFFICIENCY Fuel oil résiduel et gasoil 70 o/o Charbon 60 o/o Electricité Secteur domestique - 1700 Kwh/an 72 o/o
- 3500 Kwh/an 72 o/o - 13000 Kwh/an 95 o/o
Secteur industriel 72 o/o Gaz (secteur domestique) 73 o/o Gaz (secteur industriel) 72 o/o
Residual fuel and gasoil Coal Electricity Household sector - 1700 Kwh/year
- 3500 Kwh/year - 13000 Kwh/year
Industrial sector Gas (household sector) Gas (industrial sector)


European Communities - Commission Communautés européennes - Commission
Bulletin of energy prices Bulletin des prix de l'energie


<?Se¿ tfonzPc