Embed Size (px)
Citation preview

ANUL LIV 2009
S T U D I A UNIVERSITATIS BABEŞ-BOLYAI
CHEMIA
SPECIAL ISSUE 2
Desktop Editing Office: 51ST B.P. Hasdeu Street, Cluj-Napoca, Romania, Phone + 40 264-405352
CUPRINS – CONTENT – SOMMAIRE – INHALT
S. KUNSÁGI-MÁTÉ, A. KUMAR, P. SHARMA, L. KOLLÁR, M.P. NIKFARDJAM, Environment Controlled Formation Kinetics of Complexes of Malvidin-3-O-glucoside with Polyphenols ................................................................. 5
I. MIKLÓSSY, L. SZILÁGYI, B. ÁBRAHÁM, S. SZILVESZTER, S. LÁNYI, Obtention of the Ancestral Proteinase Stemzyme-IDP-β by Heterologous Expression................................................................................................ 11
Á. KAPÁS, B. ÁBRAHÁM, C.D. ANDRÁS, S. LÁNYI, T. G. DOBRE, Obtaining and Identification of Bioactive Compounds from Ligularia sibirica (L.) Cass ......................................................................................................... 21
BOTH E., KIBÉDI SZABÓ CS. Z., GYÖRGY É., TAMÁS É., MIKLÓSSY I., ÁBRAHÁM B., LÁNYI S., Verification of Probiotic Bacterial Properties: Tolerance to Digestive Juices and Adhesion to Epithelial Cells of Lactobacillus acidophilus La-5 and Lactobacillus casei 01..................... 27
PÁLFI M., KOVÁCS E., MIKLÓSSY I., SZILÁGYI L., ÁBRAHÁM B., LÁNYI S., Engineered Green Fluorescent Protein as a Potential Metal Sensor ....... 35
É. TAMÁS, G. MARA, É. LASLO, É. GYÖRGY, B. ÁBRAHÁM, S. LÁNYI, Analysis of Biofilm Production, Swarming and Swimming Motility of Pseudomonas Strains .............................................................................. 45

É. LASLO, É. GYÖRGY, G. MARA, É. TAMÁS, I. MÁTHÉ, B. ÁBRAHÁM, S. LÁNYI, Applied Microbial Technology: Solubilization of Inorganic Phosphate and Producing Siderophore by Isolated Nitrogen Fixing Bacteria .................................................................................................... 53
É. HARAI MOLNOS, S. SZILVESZTER, B. ÁBRAHÁM, I. NAGY, S. LÁNYI, O. MUNTEAN, Biohydrogen Production with Photosynthetic Bacteria..... 61
Z. BOROS, M. SZIGETI, A. TOMIN, P. KOVÁCS, L. ÜRGE, F. DARVAS, L. POPPE, Asymmetric Biotransformations in Continuous Flow Reactors... 69
A. TOMIN, D. WEISER, Z. BATA, L. CORICI, F. PÉTER, L. POPPE, Entrapment of Lipases in Novel Sol-Gel Systems.................................... 77
KOVÁCS E., PÁLFI M., MIKLÓSSY I., SZILÁGYI L., ÁBRAHÁM B., LÁNYI S., Construction of an Expression Vector for the GITRL Protein .............. 83
B. TŐKÉS, Z. JUVANCZ, R. IVÁNYI, SZ. VANCEA, G. DONÁTH-NAGY, V. SCHURIG, A.-G. CÂRJE, Temperature Dependence of Enantiomer Separation Parameters by Gas-Chromatografic and Supercritical Fluid Chromatographic Methods ....................................................................... 93
B. TŐKÉS, Z. JUVANCZ, R. IVÁNYI, G. DONÁTH-NAGY, SZ. VANCEA, V. SCHURIG, A.-G. CÂRJE, Chemical Structure Dependence of Separation Methods’ Parameters ..............................................................................103
SZILVESZTER S., RÁDULY B., MIKLÓSSY I., ÁBRAHÁM B., LÁNYI S., D.R. NICOLAE, Enzymatic Activity Studies of Biological Wastewater Treatment ................................................................................................113
Á. SZABÓ, B. IVÁN, Polyisobutylene-poly(poly(ethylene oxide) (meth)acrylate) Block Copolymers and Conetworks.........................................................123
RÁDULY B., CROGNALE S., SZILVESZTER S., MÉSZÁROS S., Modelling the Biochemical Processes of the Activated Sludge Wastewater Treatment .... 135
H. LI, J.C. NIE, S. KUNSÁGI-MÁTÉ, Raman Study of Interfacial Interactions in Carbon Nanotubes(CNTs)-CeO2-Al2O3 Integrated System .................147
C. MAJDIK, H. O. TFEIL, A. MĂICĂNEANU, C. INDOLEAN, S. BURCĂ, S. TONK, M. STANCA, Fixed Bed Studies for Cd(II) Removal from Model Solutions Using Immobilized Bentonite/Yeast Mixtures...........................153
M. PAVAI, D. MANCIULEA, F. KORMOS, I. TARSICHE, Coated-Wire Type Ion Sensitive Electrodes Based on Nanostructured ATO Thin Film ........163
A. M. MARCOVICI, M.-I. TOŞA, L. VLASE, S.E. LEUCUŢA, F. D. IRIMIE, Quantification of Ibuprofen and Pseudoephedrine in Human Plasma by LC/MS/MS for Pharmacokinetic Studies .................................................171

Studia Universitatis Babes-Bolyai Chemia has been selected for coverage in Thomson Reuters products and custom information services. Beginning with V. 53 (1) 2008, this publication is indexed and abstracted in the following: • Science Citation Index Expanded (also known as SciSearch®) • Chemistry Citation Index® • Journal Citation Reports/Science Edition


STUDIA UNIVERSITATIS BABEŞ-BOLYAI, CHEMIA, LIV, Sp.Iss. 2, 2009
ENVIRONMENT CONTROLLED FORMATION KINETICS OF COMPLEXES OF MALVIDIN-3-O-GLUCOSIDE
WITH POLYPHENOLS
SÁNDOR KUNSÁGI-MÁTÉa, ASHOK KUMARb, PRATIBHA SHARMAb, LÁSZLÓ KOLLÁRc, MARTIN POUR NIKFARDJAMd
ABSTRACT. The kinetics of formation of malvidin-caffeic acid and malvidin-catechin complexes was studied by time-dependent recording of the photo-luminescence (PL) signal of malvidin. The molecular environment was changed according to the fermentation process in red wines: water – ethanol mixtures with up to 14 %vol of ethanol was applied as binary solvent. Two reaction channels were examined according to the order of complex formation. In the first case, the aqueous solutions of malvidin and polyphenols were mixed, then the ethanol content was elevated according to the actual grade of fermentation. In the second case, the stock solutions are prepared as binary solvent mixtures. Our results show a faster formation of the complexes in the former case. Kinetic parameters show that the activation energy of the first reaction channel is lower and the frequency factor is higher, supporting a higher reaction rate. These observations are applicable to a wide range of chemistry where the molecular environment is composed of binary solutions. In particular, it has significant consequences for winemaking procedures, where one method of color improvement is based on the association of the species examined in this work.
Keywords: malvidin; polyphenol; copigmentation; photoluminescence INTRODUCTION
Our recent work showed that below and above 8%vol. ethanol content of wines the π-π stacks of malvidin-polyphenol complexes are quite different [1]. A monomolecular solvation shell exists below 8%vol. When the ethanol content jumps above this margin, the solvation shell changes into a bimolecular environment (water-ethanol), which results in much more stable complexes. Using these results we were able to suggest a modified winemaking technology: whole grape bunches are pressed and the obtained white juice fermented. a University of Pécs, Department of General and Physical Chemistry, Ifjúság u. 6, 7624 Pécs,
Hungary, Tel: +36-72-503600 (-4208), Email: [email protected] b School of Chemical Sciences, Devi Ahilya University, Takshashila Campus, Indore 452 001, India c Department of Inorganic Chemistry, University of Pécs, Ifjúság 6, Pécs, H-7624, Hungary d State Research Institute for Viticulture and Pomiculture, Traubenplatz 5, 74189 Weinsberg, Germany

S. KUNSÁGI-MÁTÉ, A. KUMAR, P. SHARMA, L. KOLLÁR, M. P. NIKFARDJAM
6
The skins are stored under reductive conditions in the freezer until the alcohol content exceeds the above mentioned critical concentration of 8%vol. Then the skins are thawed and put back into the juice, afterwards the wine is fermented to dryness. However, our analyses show that, although the stability of the color is much higher compared to the control samples, the evolution of the wine's color is much slower by applying the new winemaking procedure.
To understand the possible background of this phenomenon we examine the kinetics of the formation of malvidin-polyphenol complexes as a function of the alcoholic content of the samples. Malvidin-3-glucoside as anthocyanin and caffeic acid and catechin, respectively, as polyphenols were chosen for these studies. According to our previous results [1-5] different reaction pathways were followed by appropriate preparation of the samples as described below. RESULTS AND DISCUSSION
The formation kinetics of the complexes of malvidin and polyphenols were examined by measuring the photoluminescence (PL) intensity of malvidin at 395 nm. Sample preparation was performed under the protocol described in the b) and c) subsections listed in the experimental part. The main difference between the b) and c) series is as follows: in the b) series of the samples one part of the complexes is formed in pure aqueous environment and then this solvation shell is changed to water-ethanol clusters by adding ethanol to the solutions. In the series c) the complex formation already occurs in the solutions, which contain 12%vol. ethanol right from the beginning. Therefore, complexes can only be formed via association of malvidin and the corresponding polyphenol, whose binary solvent shell has already been built-up.
Figures 1 shows the change of the PL signal plotted against time during formation of malvidin - caffeic acid complexes. Similar time-dependence of PL change was observed in the case of formation of malvidin-catechin complexes. It can be clearly seen that in both cases of the copigmentation process, the complex formation in water was found to be faster by an order of magnitude compared to that in water-ethanol mixtures. This result is surprising at first sight, since water-ethanol mixtures are known to have a lower permittivity (~69.8 (12%vol. ethanol)) than the pure aqueous solutions (~78.5). Since the π-π interactions, which stabilize the malvidin-polyphenol complexes, were found to be stronger in a low permittivity solvent, the forces inducing the formation of such complexes have to be also increased resulting in a faster rate of complex formation. The dielectric properties of the bulk solutions are the same in these two cases and so, the stability of the complexes is the same after the thermodynamic equilibrium is reached.

ENVIRONMENT CONTROLLED FORMATION KINETICS OF COMPLEXES OF MALVIDIN-3-O-GLUCOSIDE…
7
Figure 1. Change of the PL signal plotted against time during formation of malvidin - caffeic acid (left) or malvidin – catechin (right) complexes Table 1. Arrhenius parameters of the complex formation reactions
of compound 1 with compound 2a or 2b
Reaction ΔE (kJ/mol) A (s-1)
1 (water) + 2a (water) + 12%vol. ethanol -16.46 13.69
1 (water) + 2b (water) + 12%vol. ethanol -17.46 12.88
1 (12%vol. ethanol) + 2a (12%vol. ethanol) -21.43 13.46
1 (12%vol. ethanol) + 2b (12%vol. ethanol) -22.17 12.25
However, to give a proper description of this unexpected property
we have to consider that the solvation shell of the interacting species has to be broken (or has to be removed, at least in part) prior to complex formation. Therefore, the difference observed in the formation kinetics is mainly due to the energy barrier of the complex formation (refer table 1).

S. KUNSÁGI-MÁTÉ, A. KUMAR, P. SHARMA, L. KOLLÁR, M. P. NIKFARDJAM
8
Note that the reactants are the same in both cases and the shape of the PL spectra is always identical. This property supports the idea that no significant conformational changes of the interacting molecules occurs under the effect of the change in the molecular environment. The decreased formation rate of the complexes in the water-ethanol mixtures highlights that the desolvation in alcoholic solutions needs more activation energy, i.e. the solvation shell in the water-alcohol mixture is more stable compared to the solvation shell in the pure aqueous solutions.
CONCLUSIONS Formation kinetics of malvidin polyphenol copigmentation complexes
through two reaction channels were studied in water ethanol mixtures by time-dependent recording of photoluminescence (PL) signal of malvidin. In the case of the first channel, the malvidin polyphenol complexes are formed in water first and then their solvation shells are altered according to the changed composition of the bulk solutions after diluting the aqueous solution with ethanol. Through the second channel, the stock solutions are prepared as binary solvent mixture, therefore, the bicomponent solvation shells of the interacted species are formed prior molecular association. Our results show a faster formation of the complexes in the former case. Evaluation of the Arrhenius parameters of the reaction shows that the activation energy of the first reaction channel is lower and the frequency factor is higher, supporting faster reaction rate. These observations are applicable in wide scale of chemistry where the molecular environment is composed by binary solutions. The weak interactions between the aromatic molecules can be highly affected by the molecular environment, especially in condensed phase and in multicomponent solutions [6,7]. Therefore big effort has been taken to understand the properties of complex solutions using the particular physico-chemical properties of the pure components [8,9]. These works focus on two characteristics of the solvent molecules: either by the associative [10] or non-associative [11] behavior or by their similar [12] or quite different [13] permittivity characters. The results presented here highlight the importance the structure of the solvation shell and the necessity of its description at molecular level.
EXPERIMENTAL SECTION Material. Anthocyanin: 1 malvidin-3-O-glucoside: MW=494.87 g/mol.
Colorless polyphenol: 2a: caffeic acid, MW=180.16 g/mol and 2b: catechin, MW=290.28 g/mol (ref. figure 2).
Polyphenol standards were purchased from Extrasynthese (Genay, France) and used as received. Ethanol (spectroscopic grade, anhydrous, Panreac, Spain) was used without further purification.

ENVIRONMENT CONTROLLED FORMATION KINETICS OF COMPLEXES OF MALVIDIN-3-O-GLUCOSIDE…
9
Sample preparation. Three series of samples were prepared as follows: a) The interaction between malvidin and the copigment was investigated
by means of the Job's method. Detailed information about this method is described elsewhere. Briefly, stock solutions of 1, 2a and 2b of 0.002 M were prepared in buffer (sodium acetate [0.06 M] and phosphoric acid [0.02M]). The pH was adjusted to 3.2 by addition of 0.1M HCl. To determine the stoichiometry of the complexes and the thermodynamic parameters of the complex formation, stock solutions of malvidin-3-glucoside (1) and stock solutions of the polyphenols (2a or 2b) were mixed at eleven different molar ratios. Concentration range is chosen according to the typical concentration of malvidin in grapes, which is around 10-3 M … 10-4 M. The concentration of the colorless copigments (2a, 2b) is varied in the same concentration. Note that these copigment concentrations are higher by an order of magnitude than that of the natural polyphenol content of grapes and wines (which falls in the interval of 10-4 M…10-5 M). However, the Job's method requires relatively high concentrations of both substances. The ethanol content of the samples was varied in the range of 0…20%vol. in steps of 1%vol. Although wine alcohol content normally ranges between 10 and 14%vol., we chose this large range for two reasons: i) to investigate the reactions during fermentation (i.e., increasing alcohol content from 0 to 14%vol.) and ii) to include the situation of products with higher alcohol content than wine, such as fruit liquors, in which color stabilization might be of similar interest.
Figure 2. Chemical structures of malvidin-3-O-glucoside and
the colorless polyphenols caffeic acid and catechin b) 4x10⁻³ M malvidin and 2x10⁻⁴ M polyphenol stock solutions were
prepared in aqueous buffer as described above. Then these solutions were mixed in 1:1 ratio in stirred cuvette located in the sample holder of the fluorometer. Using this procedure, the concentrations were 2x10⁻³ M malvidin and 10-3 M polyphenol. After one minute stirring, the PL signal did not change indicating that the chemical equilibrium was formed. Hereupon the samples were diluted with 24%vol. ethanol reaching final concentrations of 10-3 M malvidin 1, 5x10⁻⁴ M polyphenol 2a or 2b and 12%vol. ethanol. The time dependence of the PL signal at 395nm was then recorded.

S. KUNSÁGI-MÁTÉ, A. KUMAR, P. SHARMA, L. KOLLÁR, M. P. NIKFARDJAM
10
c) 2x10⁻³ M malvidin and 10-3 M polyphenol stock solutions were prepared in alcoholic aqueous phosphate buffer as described above, so each solution contained 12%vol. ethanol. These solutions were then mixed in a stirred cuvette located in the fluorometer's sample holder and the PL signal was recorded.
Apparatus. The steady-state PL spectra were recorded on a Fluorolog t3 spectrofluorometer (Jobin-Yvon/SPEX, Longjumeau, France). For data collection a photon counting method with 0.2 s integration time was used. Excitation and emission bandwidths were set to 1 nm. Front face detection was used to eliminate the inner filter effect. DataMax 2.20 software was applied for the data evaluation.
Excitation wavelength was 350 nm and the emission spectra recorded within the 380 nm … 600 nm range. The measurements were carried out at five different temperatures (15, 20, 25, 30 and 35°C), each in five replicates. Following the Job's procedure, the stability constants and also the thermodynamic parameters were determined. ACKNOWLEDGMENTS
This work was partially supported by the Deutscher Akademischer Austauschdienst (DAAD) and Magyar Ösztöndíj Bizottság (MÖB/830/08).
REFERENCES
1. S. Kunsági-Máté, A. Kumar, P. Sharma, L. Kollár, M. P. Nikfardjam, Journal of Physical Chemistry B, 2009, 113, 7468.
2. S. Kunsági-Máté, E. Stampel, L. Kollár, M. P. Nikfardjam, Food Research International, 2008, 41, 693.
3. S. Kunsági-Máté, E. Ortmann, L. Kollár, K. Szabó, M. P. Nikfardjam, Journal of Molecular Structure, 2008, 891, 471.
4. S. Kunsági-Máté, E. Ortmann, L. Kollár, K. Szabó, M. P. Nikfardjam, Spectrochimica Acta Part A: Molecular and Biomolecular Spectroscopy, 2008, 70, 860.
5. S. Kunsági-Máté, E. Ortmann , L. Kollár, M. P. Nikfardjam, Journal of Physical Chemistry B, 2007, 111, 11750.
6. D. Chakrabarty, A. Chakraborty, D. Seth, N. Sarkar, J. Phys. Chem. A, 2005, 109, 1764. 7. A. Ben-Naim, Solvation Thermodynamics; Plenum: New York, 1987. 8. A. Ben-Naim, Molecular Theory of Solutions; Oxford University, Press: Oxford,
U.K., 2006. 9. A. Ben-Naim, J. Phys. Chem. B, 2007, 111, 2896. 10. H. Shirota, E.W. Castner, Chem. Phys., 2000, 112, 2367. 11. B. M. Luther, J.R. Kimmel, N.E. Levinger, J. Chem. Phys., 2002, 116, 3370. 12. W. Jarzeba, G.W. Walker, A.E. Johnson, P.F. Barbara, Chem. Phys., 1991, 152, 57. 13. F. Cichos, A. Willert, U. Rempel, C. von Borczyskowski, J. Phys.Chem. A, 1997,
101, 8179.
STUDIA UNIVERSITATIS BABEŞ-BOLYAI, CHEMIA, LIV, Sp.Iss. 2, 2009
OBTENTION OF THE ANCESTRAL PROTEINASE STEMZYME-IDP-β BY HETEROLOGOUS EXPRESSION
ILDIKÓ MIKLÓSSYa, LÁSZLÓ SZILÁGYIa,b, BEÁTA ÁBRAHÁMa, SZABOLCS SZILVESZTERc, SZABOLCS LÁNYIa
ABSTRACT. Considering the ancestral proteinase stemzyme-IDP-β as a proper starter-molecule to redesign functional properties among serin-proteinases, we constructed several expression vectors and studied the expression of this hypotethical enzyme in different cellular systems. Expression studies were performed in E. coli cultures, as well as in cultures of the methylotrophic yeast Pichia pastoris.
Keywords: IDP serine-proteinases, heterologous expression, expression
vector, Pichia pastoris
INTRODUCTION Proteinases can be classified into five different catalytic types in which
serine, threonine, cysteine, aspartic or metallo groups play primary role in the cleavage of the peptide bond. Enzymes whose catalytic process involves a nucleophilic attack to the peptide bound by the hydroxyl group of a serine residue are termed serine proteinases. There are more than 40 families of serine proteinases, which can be distinguished on the basis of amino acid sequences. The largest family is family S1 regarding both the number of know protein sequences and the variety in the chemical character of the cleavage sequence. This family is often called as trypsin superfamily according to its best-characterized member the digestive protease trypsin. In this superfamily there are enzymes that cut the polypeptide chain after positively charged residues (trypsin, thrombin, plasmin), after negatively charged residues (granzyme B), after large and small hydrophobic residues (chymotrypsin and pancreatic elastase, respectively) [1].
a Sapientia University, Faculty of Sciences, Libertăţii Square, Nr. 1, RO-530100, Miercurea
Ciuc, Romania, Facultatea de Babeş-Bolyai, Facultatea de Chimie şi Inginerie Chimică, Str. Kogălniceanu, Nr. 1, RO-400084, Cluj-Napoca, Romania, [email protected]
b “Eotvos Lorand”University, Department of Biochemistry, Pazmany Street, Nr. 17/c, 1117, Budapest, Hungary, [email protected]
c “Politehnica” University of Bucharest, Faculty of Applied Chemistry and Materials Science, Splaiul Independenţei 313, RO-060042, Bucharest, Romania, [email protected]

I. MIKLÓSSY, L. SZILÁGYI, B. ÁBRAHÁM, S. SZILVESZTER, S. LÁNYI
12
Wouters and colleagues reported the construction of a synthetic protein predicted theoretically to be the ancestor of the present-day immune defense proteases (IDP) [2]. By parsimony analysis of a multiple alignment of 56 IDP sequences a synthetic gene was constructed to express the recombinant protein that they called stemzyme-IDP-β.
According to this study, this ancestral enzyme displayed an unexceptional tolerance to mutations at the binding site, with different mutations resulting in activities similar to some of the synthetic enzyme's descendents; the ancestral enzyme also showing a remarkably plastic S1 substrate binding site, which can be explained by the fact that the common ancestor of serine proteinases having widely different substrate specificity must tolerate various changes in the substrate binding region during evolution.
This interesting property of the ancestral enzyme makes it a favourable target for rational design to create novel enzyme specificities. Although homology modelling is feasible since several high resolution X-ray structures are available for closely related serine proteinases it is of outmost significance to crystallize and determine the 3D structure stemzyme IDP-. For this purpose we synthesized its gene and worked out efficient heterologous expression systems using E. coli (this work) and Pichia pastoris (manuscript in preparation). RESULTS AND DISCUSSION Design of the coding sequence for stemzyme-IDP-β
Since stemzyme-IDP-β is a hypothetical protein, which cannot be cloned from natural sources, its entire coding region has to be designed and optimized in terms of codon usage and control regions. The coding sequence was thus obtained based on the published amino-acid sequence and optimized for codon usage considering the expression hosts to be expressed by.
Serine proteinases are synthesized in their native form as inactive zymogens, as they contain an N-terminal propetide sequence; activation of the zymogen occurs through a specific proteolytic cleavage, which liberates the alpha amino group of Ile16. The signal sequence and propeptide region of the serine proteinases is located generally in a separate first exon in their genes, which is variable among the members of this family; the reconstituted sequence of the ancestral proteinase does not contain this region, its sequence begins with the mentioned Ile [2]. Consequently, expression of a proteolytic enzyme, of whose propetide sequence is not known, raises some questions, which can be solved by the fact that the propetide regions of some proteases can be interchanged without loss of function [3]. Addition of the propetide sequence of well-studied serine-proteases (like trypsin) is one possibility which we considered feasible when designing the coding sequence for the ancestral proteinase.

OBTENTION OF THE ANCESTRAL PROTEINASE STEMZYME-IDP-β BY HETEROLOGOUS EXPRESSION
13
Construction of the pET17-stem vectors
Fragments amplified by the pET-stemF-pET-stemR1 and pET-stemF-pET-stemR2 oligo pair were purified by agarose gel electrophoresis and cleaved with Hind III and Xho I. The modifications at the terminals of stemzyme IDP-β coding sequence made it possible to insert it into pET17c vector cleaved with the same enzymes. This vector was originally developed to express human trypsinogens [4]. By this way two vectors were obtained, pET17c-stemR1 and pET17c-R2. Both express the protease in form of inactive zymogen, requiring activation by enteropeptidase. In addition, pET17c-stemR2 results in an enzyme with C-terminal myc-tag and his-tag fusion. Positive clones were identified by restriction digestion (Figure 1, Part A) and sequencing. Maps of both plasmids are shown in Figure 1, Part B.
Figure 1. Illustration of the pET17c-stemR1 and pET17c-R2 expression vectors. Part A. Gel electrophoresis image of the recombinant constructs and verification by restriction digestion. Lane 1: 1kb DNA ladder, lane 2: pET17c-stemR1 plasmid; lane 3: pET17c-stemR1 plasmid digested with XhoI and HindIII; lane 4: pET17c-stemR2 plasmid; lane 5: pET17c-stemR2 plasmid digested with XhoI and HindIII; lane 6: 1 kb DNA ladder; Part B. Map of pET17c-stemzyme expression vectors. The drawing summarizing the features of the vector was composed by VNTI program.
Analysis of the expression of recombinant proteins
Expression vectors were introduced into E. coli BL21 (DE3) pLysS by chemical transformation or by electroporation. Transformed cells were plated on LB agar plates containing 50 ug/ml ampicillin supplemented with 1% glucose. Starter cultures from single colonies were grown overnight at 37ºC, at

I. MIKLÓSSY, L. SZILÁGYI, B. ÁBRAHÁM, S. SZILVESZTER, S. LÁNYI
14
250 rpm shaking in LB-amp+1% glucose. Expression cultures in 200-500 ml 2YT supplemented with 50 μg/ml ampicillin were inoculated with 10 % (v/v) starter cultures. Expression was induced by adding IPTG to the cultures in late-logarithmic growth phase (OD600 of 0.8-1.2) to a final concentration of 0.5 mM. Induced cultures were further grown in the same conditions for 3-4 hours. Before induction and at different times during induction 2 ml samples were withdrawn and analyzed for protein expression as recommended by Novagen (pET System Manual, 11.ed. p.34.). Figure 2. shows the time course of the expression.
Figure 2. Time course of the expression.
Part A. Expression of stemzyme R1 - Comassie-stained proteins from the production culture lane 1: protein molecular weight marker, Fermentas; lanes 2, 3: proteins from the
expression culture before induction; lane 4: cellular proteins after 1 hour of expression; lanes 5, 6, 7: cellular proteins after 2, 3 and 4 hours of expression; lane 8: protein molecular weight marker, Fermentas
Part B. Expression of stemzyme R2 lane 1: protein molecular weight marker, Fermentas; lanes 2, 3: proteins from the
expression culture before induction; lane 4: cellular proteins after 1 hour of expression; lanes 5, 6, 7: cellular proteins after 2, 3 and 4 hours of expression; lane 8: soluble proteins; lane 9: insoluble proteins, lane 10: protein molecular weight marker, Fermentas
On the basis of these gels the size of the protein produced by pET-stem R1 was 25 kDa and by pET-stemR2 was 29 kDa. These values agree well with the calculated molecular weights of 26,300 and 29,350, respectively. According to the apparent Mr data the two forms of the protein were designated as stemzyme-26 and stemzyme-29.

OBTENTION OF THE ANCESTRAL PROTEINASE STEMZYME-IDP-β BY HETEROLOGOUS EXPRESSION
15
The recombinant proteins are insoluble
After the derepression period cells were harvested by centrifugation for 15’ at 6000xg, 4°C and the cell pellet was stored at -80°C until purification. Harvested cell pellets were resuspended in 1xPBS in a ratio of 4 ml of PBS/100 ml of production culture, supplemented with protease inhibitor PMSF 1 mM (Sigma) and 1% TritonX-100 (Sigma). For disruption of cell walls and obtention of raw cell extract, ultrasound treatment was used (sonicator Dr. Hierschler) 5 cycles of 10s at 70% amplitude, with 10s pause between the cycles. Separation of cell debris and insoluble proteins was carried out by centrifugation for 25’ at 4°C and 10000xg.
Purification of the His-tagged soluble proteins was performed by affinity binding, as described; however, a significant amount of the target protein was found to aggregate in inclusion bodies. The insoluble protein was solubilized by the reducing agent guanidine hydrochloride and refolded by cisteine treatment; protein bands corresponding to each step were separated by SDS-PAGE and bound to anti-His6x antibody as visualized in Figure nr. 3.
Figure 3. Illustration of stemyzme-R2 expressed in BL21(DE3)pLysS. Part A. Comassie-stained proteins from the production culture. Lane 1: protein molecular weight marker, Fermentas; lane 2: proteins from the expression
culture before induction; lane 3: cellular proteins after 3 hours of expression; lanes 4, 5, 6: soluble proteins in the raw cell extract obtained in 3 steps of sonication and washing; lane 7: insoluble proteins
Part B. Western Blot of the obtained stemzyme presenting the purification procedure. Lane 1: total insoluble proteins in GuHCl; lane 2: unbound proteins from the first
purification step performed on 1 ml of Porfinity Ni-charged resin for 500 ml of production culture; lane 3: protein fraction collected after washing; lane 4: elution with 250 mM imidazole; lane 6: elution fraction obtained after a second step of purification.

I. MIKLÓSSY, L. SZILÁGYI, B. ÁBRAHÁM, S. SZILVESZTER, S. LÁNYI
16
Kinetic measurements
A preliminary determination of the activity of the obtained enzyme was carried out in order to compare the kinetic parameters to the ones presented by Wouters and collab. in 2003. Absorption spectrum of the purified stemzyme preparate was determined in order to appreciate the obtained enzyme quantity, the molar extinction coefficient for calculations being determined by the ProtParam Tool based on the amino acid sequence.
Figure 4. Graphical representation of the absorption spectrum of the obtained stemzyme.
For kinetic measurements, a 0.1 mg/ml stemzyme concentration was used, after activation with enteropeptidase (0.1 mg/ml). Series of measurements from the activation reaction were conducted after 0, 20, 60 and 240 minutes of activation. Using the fluorescent substrate Suc Ala Ala Pro Tyr AMC (Bachem), added in a concentration of 1 mM, absorption was read for 4 minutes at 340 nm wavelength (CaryWinUV, Varian). From the above-presented data calculating with a reaction rate of 1 mAbs min-1, a kcat value of 73 mol s-1 was determined, considered as an acceptable kinetic parameter.
Data series of 4 measurements are presented, taken in the time points of 0, 20, 60 and 240 minutes of activation with enterokinase. Equations of the trendlines and R2 values are represented on the chart.

OBTENTION OF THE ANCESTRAL PROTEINASE STEMZYME-IDP-β BY HETEROLOGOUS EXPRESSION
17
Figure 5. Graphical representation of the activity assay of the obtained stemzyme.
CONCLUSIONS Expression in a prokaryotic system using E.coli BL21(DE3)pLysS as
a host strain for the recombinant plasmids pET17-stemR1 and pET17-stemR2 proved to be successful. Based on the results presented, expression of the active stemyzme was achieved using this procedure.
Transformation efficiencies proved to be higher when using electro-poration as method for introduction of the plasmid into the host cell. In order to prevent plasmid loss, production cultures of the transformed colonies were prepared shortly after transformation. Optimization of the expression procedures has yet to be performed, taking into consideration higher concentrations of the inducer agent IPTG (up to 1-5 mM concentrations), as well as growth temperature. Using lower temperatures for growth of the production cultures (25, 30°C) could result in the same expression levels, but formation of insoluble proteins aggregated in inclusion bodies may be decreased to some extent.
As showed in the results chapter, purification of the obtained recombinant protein was completed successfully, although several purification steps had to be performed. This fact may be caused by the insufficient binding capacity of the Ni-chelating matrix used. Extensive work has yet to be done considering solubilization and renaturation of the obtained insoluble protein. Considering determination of the kinetic parameters of the obtained enzyme, the preliminary results presented in this study are a good starting point in determination of substrate specificity of the stemzyme. For future experiments, considering determination of 3D structure of the ancestral proteinase by X-ray diffraction, a highly purified form of the enzyme should be obtained, towards which the work presented in this study offers useful information.

I. MIKLÓSSY, L. SZILÁGYI, B. ÁBRAHÁM, S. SZILVESZTER, S. LÁNYI
18
The presented results underline that, after a well elaborated design procedure of the coding sequence and careful choosing of the expression system, hypothetical proteins, with deduced sequences can be obtained even in prokaryotic systems. Moreover, using E. coli as an expression host assures the ease of manipulation and reduced costs with respect to other expression systems, providing also high efficiencies in protein production.
EXPERIMENTAL SECTION Bacterial strains and plasmids
BL21(DE3) pLysS (genotype: F–, ompT, hsdSB (rB–, mB–), dcm, gal, λ(DE3), pLysS, Cmr) strain was purchased from Stratagene. Strain Top10F F’(genotype: {lacIq Tn10 (TetR)} mcrA Δ(mrr-hsdRMS-mcrBC) Φ80lacZΔM15 ΔlacX74 recA1araD139 Δ(ara-leu)7697 galU galK rpsL endA1 nupG’) was from Invitrogen; pET17c plasmid vector was purchased from Novagen.
Vector construction
The deduced coding sequence for stemzyme-IDP-β was chemically synthesized by Eurofins MWG Shyntesis GmbH (Germany), and inserted by Topo-cloning into a pCR2.1 plasmid, its sequence being verified by the manufacturer. The synthesized sequence was aimed to be introduced into pPICZα vector for expression in the methylotroph yeast Pichia pastoris. The synthesized coding sequence included a carboxy terminal myc tag followed by a hexahistidine tag to facilitate the identification and purification of the recombinant protein
To create a bacterial expression vector, oligonucleotides were designed to generate a Hind III restriction site at the 5` end and an Xho I site at the 3` end of the stemzyme-IDP-β coding sequence. With the 5` oligo (pET-stemF) we also attached the trypsinogen propeptide containing an enteropeptidase cleavage sequence to the amino terminus of stemzyme IDP-β. For the modification of the 3` end two oligos were synthesized. pET-stemR1 added a stop codon to the end of the coding sequence of the protease thereby eliminating both the myc and the his tags, while pET-stemR2 retained both tags.
The sequences of the oligonucleotides were as follows (recognition sequences underlined):
pET-stemF: 5′CCCAAGCTTTTCCCGTGGACGATGATGACAAGATCATCGGTGGAACGGAGGCC-3′; pET-stemR1: 5′-CGGCTCGAGTCATAGATTGGCCTTCAAGATCTTC-3′ pET-stemR2: GGTCTCGAGGAACAGTCATGTCTA (Eurofins MWG
Shyntesis GmbH, Germany). The oligos were designed by Oligo Explorer 1.2 (www.genelink.com) The calculated melting point for the matching sequences in pET-stemF, pET-stemR1 and pET-stemR2 is 65.2 °C, 61.8°C and 65.2°C, respectively.

OBTENTION OF THE ANCESTRAL PROTEINASE STEMZYME-IDP-β BY HETEROLOGOUS EXPRESSION
19
PCR amplification The PCR protocol for 30 cycles was as follows: 95°C for 5 min,
94°C for 45 s, 58°C for 45 s, 72°C for 1 min, and a final 5 min at 72°C. DNA manipulation, restriction digestion and ligation reactions were
performed by standard techniques [5]. HindIII and XhoI were purchased from Fermentas, T4 DNA ligase was from Invitrogen. Expression
For transformation of the pET17-stem vector in the chosen host strains, both CaCl2 transformation and electroporation (Xcell GenePulser, BioRad) were used. Both chemically transformed and electroporated cell suspensions (including control probes without plasmid DNA) were plated on LB agar containing 50 μg/ml ampicilin and incubated overnight at 37°C in order to select transformed colonies.
Propagation of the transformants was carried out by inoculation of LB broth supplemented with 50 μg/ml ampicillin with an isolated colony. Induction of transcription of the gene of interest was realized by IPTG (isopropyl-β-thio-galactopyranoside, Sigma) in a concentration of 0.5 mM and the culture was further incubated for 3 h in the same conditions. Purification
Denatured proteins forming inclusion bodies were solubilized by 6 M guanidine hydrochloride (Fluka) treatment, refolding was achieved using 1.5 mM cisteine solution in 0.1 M Tris pH 8.8 (Fluka).
Affinity purification of the His-tagged enzyme was carried out by adsorption on a Ni-charged polymer matrix (Porfinity IMAC Ni-charged Resin, BioRad). (Soluble proteins resulted from 1000 ml of production culture were adsorbed on 1 ml of Ni-NTA Sepharose resin, in 20 mM PBS (20 mM imidazole and 0.5 M NaCl), elution was carried out by 250 mM imidazole.)
PAGE
Specific binding of the proteins transferred to the nitrocellulose membrane was carried out based on the 6xHis fusion tag, by a mouse Anti-His primary monoclonal antibody (Invitrogen) and the WesternBreeze Chromogenic Kit (Invitrogen). ACKNOWLEDGMENTS
The present work was supported by the National Authority for Management of Programmes (CNMP), project number 61027.

I. MIKLÓSSY, L. SZILÁGYI, B. ÁBRAHÁM, S. SZILVESZTER, S. LÁNYI
20
REFERENCES
1. A. Caputo, J. C. Harish, M. N. James, J. C. Powers, R. C. Bleackley, Proteins, 1999, 35, 415.
2. M. A. Wouters, K. Liu, P. Riek, A. Husain, Mol. Cell, 2003, 12, 343. 3. I. Venekei, L. Szilágyi, L. Gráf, W. J. Rutter, FEBS Lett., 1996, 383, 143. 4. L. Szilágyi, E. Kénesi, G. Katona, G. Kaslik, G. Juhász, L. Gráf, J. Biol. Chem.,
2001, 276, 24574. 5. J. Sambrook, “Molecular Cloning: A Laboratory Manual (2nd ed.)”, Cold Spring
Harbour Laboratory Press, New York, 1989.

STUDIA UNIVERSITATIS BABEŞ-BOLYAI, CHEMIA, LIV, Sp.Iss. 2, 2009 OBTAINING AND IDENTIFICATION OF BIOACTIVE COMPOUNDS
FROM Ligularia sibirica (L.) CASS
ÁRPÁD KAPÁSa,b, BEÁTA ÁBRAHÁMb, CSABA D. ANDRÁSb, SZABOLCS LÁNYIb, TĂNASE GH. DOBREa
ABSTRACT. Secondary metabolites were obtained from Chinese medicinal plant, Ligularia sibirica by using coupled hydrodistillation-extraction method. The essential oil was extracted by microwave assisted hydrodistillation, analysis of these volatile compounds was made with GC-MS. The ethanolic extract was re-extracted with chloroform; the identification of the pyrrolizidine alkaloids were made with thin layer chromatography. The main identified volatile compounds were sabinene, limonene, and terpinolene, and the alkaloids in the extract were most probably, tussilagine and iso-tussilagine.
Keywords: Ligularia sibirica, microwave assisted hydrodistillation, essential
oils, pyrrolizidine alkaloids INTRODUCTION
Some of the species from vegetal kingdom can be important sources of bioactive secondary metabolites for pharmaceutical industry, however studying chemical composition of different, practically unknown plant species, can result solutions for developing new medicines and new therapies.
Twenty to forty Ligularia species (Compositae) have been used in traditional Chinese medicine due to their positive impact on health [1]. The most frequently identified bioactive compounds of these plants are eremophilane-type sesquiterpenes (ETS) and pyrrolizidine alkaloids (PA). Many isolated ETS have cytotoxic [2-4], antibacterial, antitumor [5] and anti-HIV [6] effect.
Four ETS and two PAs have been isolated from L. sibirica. Ligularol (1) and ligularine A (2) were extracted with supercritical carbon dioxide [7]. Ligularenolide and ligularone (3 and 4) were not tested from bioactivity viewpoint until now. In addition tussilagine and iso-tussilagine (5 and 6) PAs are possessing antimicrobial and immune system stimulation effect and are used for anti HIV-1 [8], HSV-1 and HSV-2 treatments [5, 9]. Tussilagine and iso-tussilagine were isolated from L. sibirica by Wiedenfeld et al. [10]. a Universitatea Politehnica din Bucureşti, Facultatea Ştiinţa şi Ingineria Materialelor, Str. Polizu,
Nr. 1-7, RO-010737, Bucureşti, Romania, [email protected] b Universitatea Sapientia, Cluj-Napoca, Facultatea Miercurea Ciuc, Departamentul Ştiinţe Tehnice,
Pţa. Libertăţii, Nr. 1, RO-530104, Miercurea Ciuc, Romania, [email protected]

Á. KAPÁS, B. ÁBRAHÁM, C.D. ANDRÁS, S. LÁNYI, T. G. DOBRE
22
OH
OH
O
O
OH
OH
OO
N
O
OHOMe
N
O
OH
OMeO
H
O
1 2
3 4 5 6
Figure 1. Identified compounds from L. sibirica Chemical compositions of volatile oils obtained from this plant are
unknown. Commonly used extraction methods to obtaining volatile oils are
hydrodistillation, supercritical carbon dioxide extraction, solvent extraction and simultaneous distillation-extraction method. All the methods have advantages and also disadvantages from energetical, analytical and ecological viewpoint.
Microwave assisted hydrodistillation (MWHD) became a widely used method for essential oils extraction from plants, due to its advantage of homogenous heating which results a more effective obtaining of heat sensible compounds [11,12]. During the MWHD process a pressure difference occurs between the inner and outer side of the plant cells, therefore the compounds are more easily released to the surrounding solution by breaking the external cell wall and resulting a higher mass transport of compounds [13].
Volatile oils have been reported as having good influence on human health due to their bioactive proprieties (for example: antitumor, cytotoxic, anti proliferative, anti-inflammatorily effect). The influence of oils on health depends on the bioactivity of different components and on the type of interactions between the compounds [17-31].
PAs obtaining method described in literature is based on extraction with ethanol or methanol followed by acid-soluble and acid-insoluble partition, which is based on PAs-salts high solubility in acid solutions. The final extraction with chloroform is based on neutralization at pH values from 9 to 10 [14,15]. Separation and purification of PAs can be proceeded by using silica gel column chromatography and/or thin layer chromatography (TLC) with eluent mixture of chloroform (in some case dichlormethane), methanol and ammonium hydroxide [14-16].
The aims of this paper are: I) extraction of essential oils from L. sibirica with microwave assisted hydrodistillation, II) use of chromatographic analysis to choose an adequate oil separation method and III) extraction of PAs from leaves with coupled extraction method to reduce compounds diversity in extracts.

OBTAINING AND IDENTIFICATION OF BIOACTIVE COMPOUNDS FROM Ligularia sibirica (L.) CASS
23
RESULTS AND DISCUSSION Gas chromatography analysis
Gas chromatography analysis resulted identification of forty two compounds, most of them being identified previously from another plant species and several being rare substances. The main compounds with good identification quality were sabinene (15.05%), limonene (10.95%), terpinolene (13.68%), γ-terpinene (5.56%), β-cariophylene (5.30%), α-pinene (2.85%), d-germacrene (1.44%), α-humulene (0.94%), α-phellandrene (0.84%), β-elemene (0.49%), β-cubanene (0.42%), δ-cadinene (0.39%) and α-copaene (0.18%). Notable quantity of indefinite identified compounds were o-toluamide (3.93%), 3-caren (0.55%), z,e-α-fernasene (0.58%), 1,z-5,e-7-dodecatriene (0.52%) theaspirane A (0.47). Other components were present in trace quantities and low identification quality.
TLC analysis results
TLC separation method resulted eight uncolored spots at visible light (fig. 2). The spots could be distinguished better at 254 nm than at 315 nm wavelength UV light. Spots 5 and 8 showed better spectrophotometric absorption at 220 nm wavelength, this value being known as maximal absorption value of pyrrolizidine alkaloids N-oxide form.
Figure 2. TLC plate photograph

Á. KAPÁS, B. ÁBRAHÁM, C.D. ANDRÁS, S. LÁNYI, T. G. DOBRE
24
CONCLUSIONS Volatile oils from leaves of Ligularia sibirica were successful extracted
with microwave assisted hydrodistillation method. The extract analysis with gas chromatography and mass spectrometry resulted identification of 42 components. Coupled extraction and TLC showed adequacy for obtaining PAs components. EXPERIMENTAL SECTION
Materials and apparatus
The plant (L. sibirica) was collected in September of 2009 and stored in a cool and dry location. TLC G254 plates, dichloromethane, absolute methanol, 25% ammonium hydroxide solution, sulfuric acid were produced by Merck (Darmstadt, Germany).
The used microwave assisted hydrodistillation apparatus is a combination of a modified microwave oven with a Clevenger extension (fig. 3) and with a coupled rotation head.
Figure 3. Microwave assisted hydrodistillation apparatus: 1-microwave oven, 2-balloon, 3-plant material, 4-rotation head and 5-Clevenger extension.
Microwave assisted hydrodistillation method
350 g of fresh and cracked leaves of L. sibirica and 500 ml distillated water were placed in the apparatus balloon. The electric power was set to 800 W. After 12 minutes of heating time the first drop appeared in the collector tube of Clevenger extension, following by 30 minutes of hydrodistillation procedure, which resulted 0.855 ml of essential oil.

OBTAINING AND IDENTIFICATION OF BIOACTIVE COMPOUNDS FROM Ligularia sibirica (L.) CASS
25
Extraction procedure
After MWHD procedure the residue of plant material was dried in microwave oven under reduced pressure and extracted three times with 1.5 l of 80 %v/v ethanol at temperatures of 25, 40 and 70 °C. The resulted extracts were evaporated in vacuum at 40 °C by giving approximate 55 g of material which was dissolved in 300 ml 1 N sulfuric acid solution. The alkaloids-containing fraction was extracted five times with 50 of dichloromethane in all cases (extracts I to VI in fig. 2).
Gas chromatography with mass spectrometry detection
GC analyses were performed by HP 5890 II apparatus with HP 5971 A EI-MS detector, PONA 30 m × 0.25 mm × 0.25 μm column. The oil was diluted in hexane (1:100) and 1 μl from this was injected for separation. The carrier gas was hydrogen at 5 psi inlet pressure. Injector and detector temperatures were set to 250 °C and 280 °C respectively. The column temperature was programmed from 40 to 260 °C at 4 °C/min temperature gradient.
Thin layer chromatography (TLC)
TLC G254 10 cm × 20 cm plates and dichloromethane/methanol/25% ammonium hydroxide solution (85:28:3 v/v) as eluent were used for the separation of alkaloid fraction. One ml from each dichloromethane extract was evaporated in vacuum, dissolved in 5 μl dichlormethane and introduced in the plates. The chromatographic time was 60 minutes.
Visualization and spectrophotometric detection (SD)
After separation was finished, the plate was dried at room temperature and the spots were visualized at 254 and 315 nm wavelength. The developed spots were dissolved in methanol and subjected of spectrophotometric detection in scan mode at 200 to 350 nm wavelength.
Varian Cary 50 UV-Vis spectrophotometer was used for detection.
REFERENCES
1. P. L. Li, C. M. Wang, Z. X. Zhang, Z. J. Jia, Tetrahedron 2007, 63, 12665. 2. H. Baba, Y. Yaoita, M. Kikuchi, Journal of Natural Medicines, 2007, 61, 472. 3. H. Baba, Y. Yaoita, M. Kikuchi, Helvetica Chimica Acta, 2007, 90, 1028. 4. K. Gao, W. Shu, W. Jian Jia, Z. Jian Jia, Phytochemistry, 2007, 47, 269. 5. J. Q. Liu, M. Zhang, C. F. Zhang, H. Y. Qi, A. Bashall, S. W. A. Bligh, Z. T. Wang,
Phytochemistry, 2008, 69, 2231. 6. S. B. Singh, D. Zink, J. Polishook, D. Valentino, A. Shafiee, K. Silverman, P. Felock,
A. Teran, D. Vilella, D. J. Hazuda, R. B. Lingham, Tetrahedron Letters, 1999, 40, 8775.

Á. KAPÁS, B. ÁBRAHÁM, C.D. ANDRÁS, S. LÁNYI, T. G. DOBRE
26
7. C. Bicchi, F. R. A. Rubioloc, Journal of Natural Products, 1991, 54, 941. 8. O. Rangel, J. Angel, US Patent, 7604823, 2006. 9. S. Meryl, US Patent, 6355684, 2002. 10. H. Wiedenfeld, S. Narantuya, M. Duma, A. Monhbaatar, Scientia Pharmaceutica,
2003, 71, 129. 11. M. Kosar, T. Özek, M. Kürkçüoglu, K. H. C. Baser, Journal of Essential Oil Research,
2007, 19, 426. 12. M. Lucchesi, F. Chemat, J. Smajda, Journal of Chromatography A, 2004, 1043, 323. 13. S. Ž. Milojević, T. D. Stojanović, R. Palić, M. L. Lazić, V. B. Veljković, Biochemical
Engineering Journal vol. 39, no.3, May 2008, 39, 547. 14. J. Q. Xu, Y. S. Li, Y. M. Li, S. H. Jiang, C. H. Tan, D.Y. Zhu, Planta Medica, 2006,
72, 563. 15. J. Q. Liu, M. Zhang, C. F. Zhang, H. Y Qi, A. Bashall, S.W. A. Bligh, Z. T. Wang,
Phytochemistry, 2008, 69, 2231. 16. C. M. Passreiter, Biochemical Systematics and Ecology, 1998, 26, 839. 17. A. L. Medina-Holguín, F. O. Holguín, S. Micheletto, S. Goehle, J. A. Simon, M. A.
O’Connell, Phytochemistry 2008, 69, 919. 18. M. A. Apel, V. L. Sardá Ribeiro, S. A. L. Bordignon, A. T. Henriques, G. Poser,
Parasitology Research, 2009, 105, 863. 19. S. R. Fuselli, S. B. G. Rosa, M. J. Eguaras, R. Fritz, World Journal of Microbiology
and Biotechnology, 2008, 24, 2067. 20. L. Alejandro, L. Susana, Z. Eduardo, M. Héctor, Entomologia Experimentalis et
Applicata, 2008, 129, 107. 21. F. Menichini, R. Tundis, M. R. Loizzo, M. Bonesi, M. Marrelli, G. A. Statti, F.
Menichini, F. Conforti, Fitoterapia, 2009, 80, 297. 22. S. Pepeljnjak, I. Kosalec, Z. Kalođera, N. Blažević, Acta Pharmaceutica, 2005,
55, 417. 23. N. Lukwa, P. Mølgaard, P. Furu, C. Bøgh, Tropical Biomedicine, 2009, 26, 85. 24. K. Boehme, J. A. Noletto, W. A. Haber, W. N. Setzer, Natural Product Research,
2008, 10, 31. 25. W. A. Haber, B. R. Agius, S. L. Stokes, W. N. Setzer, Records of Natural Products,
2008, 2, 1. 26. P. Angelini, R. Pagiotti, B. Granetti, World Journal of Microbiology and Biotechnology,
2008, 24, 197. 27. A. Garozzo, R. Timpanaro, B. Bisignano, P. M. Furneri, G. Bisignano, A. Castro,
Letters in Applied Microbiology, 2009, 49, 806. 28. J. L. Wang, Y. Li, C. L. Lei, Natural Product Research, 2009, 23, 1080. 29. A. L. Medina-Holguín, F. O. Holguín, S. Micheletto, S. Goehle, J. A. Simon, M. A.
O’Connell, Phytochemistry, 2008, 69, 919. 30. S. Sibanda, G. Chigwada, M. Poole, E. T. Gwebu, J. A. Noletto, J. M. Schmidt,
A. I. Reac, W. N. Setzer, Journal of Ethnopharmacology, 2004, 292, 107. 31. I. Orhan, E. Küpeli, M. Aslan, M. Kartal, E. Yesilada, Journal of Ethnopharmacology,
2006, 105, 235. 32. J. Gonçalves, S.C. Rosa, A. Neves, F. Judas, L. Salgueiro, C. Cavaleiro, M.C.
Lopes, A.F. Mendes, Osteoarthritis and Cartilage, 2008, 16, S232.

STUDIA UNIVERSITATIS BABEŞ-BOLYAI, CHEMIA, LIV, Sp.Iss. 2, 2009
VERIFICATION OF PROBIOTIC BACTERIAL PROPERTIES: TOLERANCE TO DIGESTIVE JUICES AND ADHESION TO
EPITHELIAL CELLS OF Lactobacillus acidophilus La-5 AND Lactobacillus casei 01
BOTH EMESEa, KIBÉDI SZABÓ CSABA ZOLTÁNa, GYÖRGY ÉVAb, TAMÁS ÉVAa, MIKLÓSSY ILDIKÓb, ÁBRAHÁM BEÁTAb,
LÁNYI SZABOLCSb
ABSTRACT. Tolerance to gastric acidity, bile salts and adhesion of probiotic bacteria to intestinal epithelial cells is regarded as a prerequisite to exert beneficial health effects, with this object were examined frecvent utilized probiotic strains. Resistance to gastric acidity and intestinal conditions of Lactobacillus casei 01, Lactobacillus acidophilus La-5 and adhesion of strains to epithelial cells were investigated in vitro. L. acidophilus La-5 presents increased tolerance to gastric acidity and intestinal bile salt concentration than L. casei 01. Both strains show good adhesion ability to epithelial cells in vitro.
Keywords: probiotics, tolerance, epithelial cells, adhesion
INTRODUCTION Probiotics are defined as viable microorganisms, which, in sufficient
numbers, alter the microflora of a host body compartment and thereby exert beneficial health effect (Shida-Nanno, 2008). The use of probiotics to enhance intestinal health has been proposed for many years. As recently revisited by the Joint Food and Agriculture Organization/World Health Organization: probiotic strains are defined as live micro-organisms that, when consumed in an adequate amount as part of food, confer a health benefit on the host. Probiotic strains are considered non-pathogenic and safe (Servin, 2003).
Recent research has demonstrated that probiotics can prevent pathogen colonization of the gut and reduce the incidence or relieve the symptoms of various diseases caused by dysregulated immune responses. Probiotics seem to function by influencing both intestinal epithelial cells and immune cells of the gut, but the details of these effects are still being unraveled. The selection of the most suitable ones is crucial for their use in the prevention or treatment of specific diseases (Shida-Nanno, 2008). a ”Politehnica” University of Bucharest, Faculty of Applied Chemistry and Material Science,
Bucharest, Roumania, [email protected] b Sapientia University, Cluj Napoca, Faculty of Sciences, Piaţa Libertăţii nr.1, RO - Miercurea
Ciuc, Roumania, [email protected]

BOTH E., KIBÉDI SZABÓ CS. Z., GYÖRGY É., TAMÁS É., MIKLÓSSY I., ÁBRAHÁM B., LÁNYI S.
28
Lactic acid bacteria are regarded as a major group of probiotic bacteria. Lactic acid bacteria are usually described as Gram-positive microorganisms, devoid of cytochromes and preferring anaerobic conditions but are aerotolerant, fastidious, acid-tolerant, and strictly fermentative, producing lactic acid as a main product. The most important genera are: Lactobacillus, Lactococcus, Enterocococcus, Streptococcus, Pediococcus, Leuconostoc, and Bifidobacterium (Vasiljevic-Shah, 2008). In order to exert their functional properties, probiotics need to be delivered to the desired sites in an active and viable form. The viability and activity of probiotics in the products have been frequently cited as a prerequisite for achieving numerous beneficial health benefits (Aswathy, 2008).
One of the most important criteria for the potential of putative probiotic strain is to overcome the gastric environment, the presence of bile salts and to resist, through adhesion, the flux of the intestinal content (Vasiljevic-Shah, 2008). Strains belonging to species normally inhabiting the human gut have been shown to be better when assayed for their in vitro resistance to low pH or to simulated gastric juice (Morelli, 2007).
Our aim is to study the essential probiotic properties of two lactic acid bacterial strains, Lactobacillus acidophilus La-5 and Lactobacillus casei 01. These strains are nowadays frequently utilized in probiotic products and their surviving rate in digestive track is important to colonize the intestine and to exert their beneficial properties on the host. These properties are: tolerance to gastric and intestinal environment and adhesion capacity to epithelial cells in vitro.
RESULTS AND DISCUSSIONS Tolerance to simulated gastric and intestinal juice
On the basis of the obtained results in determination of tolerance to simulated gastric juice, which contains hydrochloric acid and pepsin, it can be observed that in case of both studied probiotic strains at pH=2 after an incubation period of 30 minutes there were no viable cells (Figure 1., Figure 2.). In acidic conditions at pH=3 in presence of hydrochloric acid and pepsin in case of Lactobacillus acidophilus La-5, after 30 minutes of incubation increased the number of viable cells, after that the number of cells remained constant. If the period of exposure is more than 60 minutes, the number of viable cells decreased (Figure 1.). In conditions of pH=4 the number of viable Lactobacillus acidophilus La-5 cells decreased in time in simulated gastric juice (Figure 1.). The number of viable cells of Lactobacillus casei 01 in acidic conditions at pH=3 decreased in time and decreased drastic at pH=4 (Figure 2.).

VERIFICATION OF PROBIOTIC BACTERIAL PROPERTIES: TOLERANCE TO DIGESTIVE JUICES…
29
0
10000
20000
30000
40000
50000
60000
70000
80000
0 30 60 90
Time(min)
CFU
/ml pH=2
pH=3pH=4
Figure 1. Variation of colony-forming unit (CFU)/ml at different pH values of
Lactobacillus acidophilus La-5 incubated in simulated gastric juice.
0
5000
10000
15000
20000
25000
30000
35000
0 30 60 90
Time(min)
CFU/
ml pH=2
pH=3pH=4
Figure 2. Variation of CFU/ml at different pH values of Lactobacillus casei 01
incubated in simulated gastric juice.
Results show that viability of Lactobacillus casei 01 strain in simulated intestinal juice - with different concentrations of bile salts (0,3%, 0,5%, 1%) and pancreatin - is very low, after a period of 30 minutes of incubation, there are no colony forming units. Lactobacillus acidophilus La-5 is not so sensible, there is a decrease in the number of viable cells after different periods of incubation, but exists the possibility of surviving at low bile salt concentrations (Figure 3.).

BOTH E., KIBÉDI SZABÓ CS. Z., GYÖRGY É., TAMÁS É., MIKLÓSSY I., ÁBRAHÁM B., LÁNYI S.
30
0
5000
10000
15000
20000
25000
30000
35000
40000
45000
0 30 90 180
Time(min)
CFU
/ml 0.3% bile salt
0.5% bile salt1.0% bile salt
Figure 3. Variation of CFU/ml at different bile salt concentrations of
Lactobacillus acidophilus La-5 incubated in simulated intestinal juice.
Adhesion capacity Adhesion ability was determined in 20 random microscopic fields
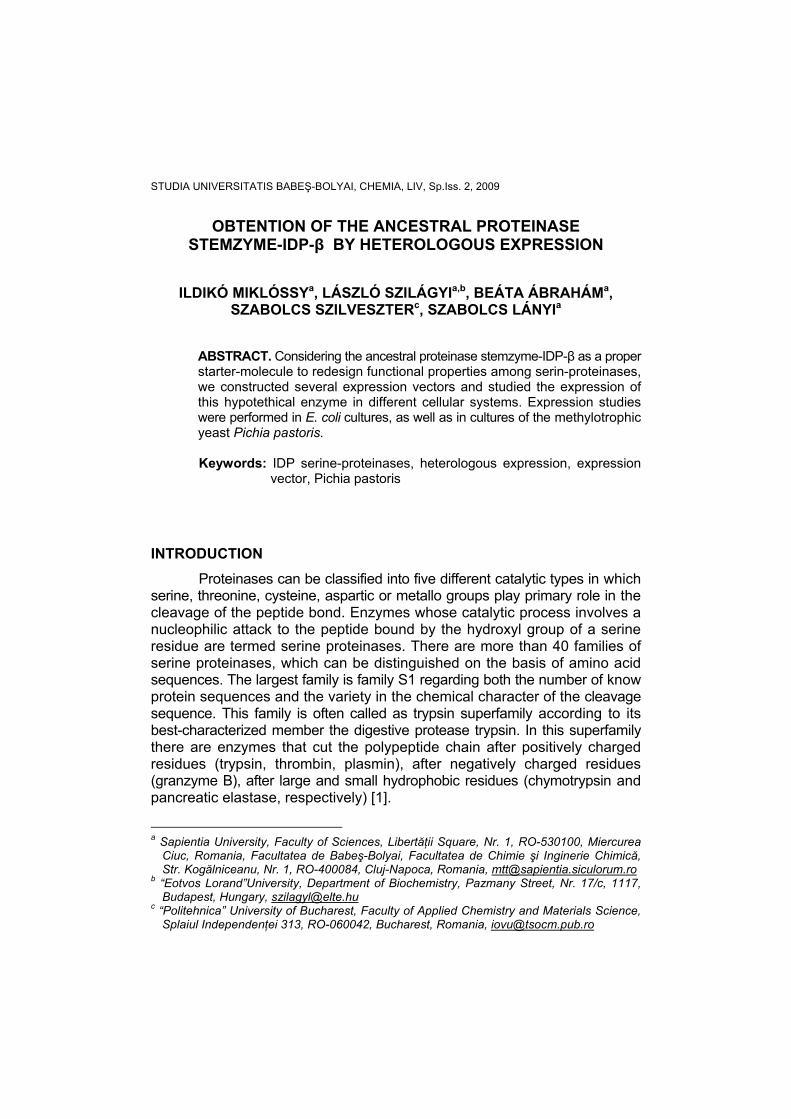
after Gram-staining, results show that adherence of examined probiotic strains is good to IEC-6 epithelial cells in in vitro conditions. Adhesion ability results are expressed in next form: number of adhered bacterial cells/100 epithelial cell. In case of L. acidophilus La-5 this number is: 265 bacterial cells/100 epithelial cells, adhesion capacity of L. casei 01 is 250 bacterial cells/100 epithelial cells. Results confirm that strain Lactobacillus acidophilus La-5 has better adhesion capacity to the epithelial cells compared with Lactobacillus casei 01, but both probiotic strains show good adhesion capacity compared with results obtained in another studies. Figure 4. and 5. show the microscopical view of L. acidophilus La-5 and L. casei 01 adhesion to epithelial cells after Gram staining.
Figure 4. Adhesion of Lactobacillus acidophilus La-5 to IEC-6 cells.
VERIFICATION OF PROBIOTIC BACTERIAL PROPERTIES: TOLERANCE TO DIGESTIVE JUICES…
31
Figure 5. Adhesion of Lactobacillus casei 01 to IEC-6 cells.
CONCLUSIONS
The acidity of gastric juice influences the viability of probiotic strains, which manifests in different modes in case of different bacterial stains.
Bacterial strain Lactobacillus casei 0.1 is more sensible than Lactobacillus acidophilus La-5 at acidic environment.
Lactobacillus casei 01 is very sensitive at bile salts presence. Bacterial strains from this study are more resistant in gastric juice
than in intestinal juice. Under in vitro conditions, both bacterial strains show good adhesion
ability to epithelial cells. EXPERIMENTAL SECTION
Tolerance determination of probiotic bacteria to simulated gastric juice
Bacterial cultures obtained on MRS agar media (de Man, 1960) after an incubation time of 48 hours at 37oC are suspended in sterile 0.5 w/v% sodium chloride solution (105CFU= colony forming units/ml). Gastric juice is prepared by suspending pepsin (3 g/l) and regulating the pH at 2.0, 3.0 and 4.0 values with cc. hydrochloric acid or with sterile solution of 0.1 M sodium hydroxide, using a pH-metre.
One aliquot (0.2 ml) from each suspension of bacterial cells is transferred in a 2 ml sterile Eppendorf tube and mixed with 0.3 ml 0.5 w/v% sterile sodium chloride solution and 1.0 ml simulated gastric juice (pH 2.0, pH 3.0 and pH 4.0). This mixture is vortexed for maxim 10 s and incubated at 37oC.

BOTH E., KIBÉDI SZABÓ CS. Z., GYÖRGY É., TAMÁS É., MIKLÓSSY I., ÁBRAHÁM B., LÁNYI S.
32
Viability of strains is analysed by determination of CFU/ml after different periods of incubation (0 min, 30 min, 60 min and 90 min in the simulated gastric juice) by inoculation on MRS agar solid media, after an incubation time of 48 hours at 37oC.
Tolerance determination of probiotic bacteria to simulated intestinal juice
Bacterial cultures obtained on MRS agar media after an incubation time of 48 hours at 37oC are suspended in sterile 0.5 w/v% sodium chloride solution (105CFU= colony forming units/ml). Intestinal juice is prepared by resolving in sterile sodium chloride solution (0.5 w/v%) bile salts in different concentrations (0.3%, 0.5%, 1.0%) and pancreatin (1 g/l), pH is regulated to 8.0.
One aliquot (0.2 ml) from each suspension of bacterial cells is transferred in a 2 ml sterile Eppendorf tube and mixed with 0.3 ml 0.5 w/v% sterile sodium chloride solution and 1.0 ml simulated intestinal juice (0.3%, 0.5%, 1.0% bile salt). This mixture is vortexed for maxim 10 s and incubated at 37oC.
Viability of strains is analysed by determination of CFU/ml after different periods of incubation (0 min, 30 min, 90 min and 180 min in the simulated intestinal juice) by inoculation on MRS agar solid media, after an incubation time of 48 hours at 37oC.
In vitro adhesion study
IEC-6 cells were grown in Minimal Essential Medium (MEM) Earle’s Base, supplemented with 5% (v/v) foetal bovine serum (FBS), 0.1 IU/ml insulin and 1% gentamicin. Incubation was at 37oC in the presence of 5% CO2. The media was changed every second day. Adhesion assays were performed with cells at late post-confluence (15 days in culture). IEC-6 cells were seeded at 105 cells per well in 12-well microtitre plates to obtain confluence. Incubation was at 37oC in the presence of 5%CO2. Before the adherence assay, IEC-6 cells were washed twice with sterile phosphate-buffered saline (PBS, 6.0 mM Na2HPO4, 1.5 mM KH2PO4, 0.14 M NaCl, 3.0 mM KCl, pH=7.3). Cultures of bacterial strains were harvested (10,000Xg, 10 min, 4oC), the cells washed twice with sterile PBS, and diluted in MEM (without FBS and gentamicin) to OD600=0.5, i.e. approximately 106 CFU/ml. Wells with IEC-6 cells were inoculated with 105 viable cells of each bacterial cell suspension and incubated at 37oC for 2 h. Non-adhering bacterial cells were then withdrawn from the wells and the IEC-6 cells washed twice with 1 ml sterile PBS, followed by 1 ml 0.5% (v/v) Triton X-100. Fixed with 90% methanol and Gram stained. The bacterial adhesion was examined microscopically. The number of bacteria adhered to IEC-6 cells was counted in 20 random microscopic fields.

VERIFICATION OF PROBIOTIC BACTERIAL PROPERTIES: TOLERANCE TO DIGESTIVE JUICES…
33
REFERENCES
1. K. Shida, M. Nanno, Trends in Immunology, 2008, 29, 565. 2. A. L. Servin, M.-H. Coconnier, Best Practice & Research Clinical Gastroenterology,
2003, 17 (5), 741. 3. K. Szekér, J. Beczner, A. Halász, Á. Mayer, J.M. Rezessy-Szabó, P. Gálfi, Acta
Alimentaria, 2005, 34 (1), 91. 4. K. Szekér, E. Németh, Sz. Kun, J. Beczner, P. Gálfi, Acta Alimentaria, 2007, 36
(3), 365. 5. L. Morelli, International Dairy Journal, 2007, 17, 1278. 6. R. G. Aswathy, B. Ismail, R. P. John, K. M. Nampoothiri, Appl Biochem Biotechnol,
2008, 151, 244. 7. T. Vasiljevic, N.P. Shah, International Dairy Journal, 2008, 18, 714. 8. U. Schillinger, C. Guigas, W. H. Holzapfel, International Dairy Journal, 2005,
15, 1289. 9. X. Pan, F. Chen, T. Wu, H. Tang, Z. Zhao, Food Control, 2009, 20, 598.
10. J.C. de Man, M. Rogosa, M.E. Sharpe, J. Appl. Bacteriol., 1960, 23, 130.


STUDIA UNIVERSITATIS BABEŞ-BOLYAI, CHEMIA, LIV, Sp.Iss. 2, 2009
ENGINEERED GREEN FLUORESCENT PROTEIN AS A POTENTIAL METAL SENSOR
PÁLFI MÁRIAa, KOVÁCS ERIKAa, MIKLÓSSY ILDIKÓb, SZILÁGYI LÁSZLÓb, c, ÁBRAHÁM BEÁTAb, LÁNYI SZABOLCSb
ABSTRACT. The designed biosensor is based on a mutant form of green fluorescent protein (GFP). It is known that metal ions in close proximity to a cromophore group reduce the protein’ s fluorescence intensity by fluorescence quenching. Using site directed mutagenesis, we formed a metal binding site near the protein’s chromophore group. Thus, the mutant protein presents a new functional property, which allows its utilization in detection of metal ions. Keywords: green fluorescent protein, metal binding, site-specific mutation,
chromophore group, biosensor INTRODUCTION
Green fluorescent protein (GFP) is a bioluminescent protein, that was isolated from the jellyfish Aequorea victoria. It is an exceptionally versatile and useful tool in cell biology and biotechnology [1].
The color originates from a fluorescent entity, a chromophore group, that is generated in the protein's interior by interaction of three consecutive amino-acid residues (Ser65,Tyr66, Gly67), that are part of the protein's polypeptide chain [2]. The chromophore is generated only under conditions permissive of protein folding [3].
Site-directed mutagenesis investigations have revealed that fluorescence is very dependent on the three-dimensional structure of amino acid residues that enclose the chromophore group [4]. Denaturation of the protein results in the loss of fluorescence and mutations in residues immediately adjacent to the chromophore can significantly alter the fluorescent properties of the protein [5]. Moreover, the amino acid substitutions in regions of the polypeptide far removed from the chromophore can also affect the spectral characteristics of the protein [4]. a Universitatea Politehnica Bucureşti, Facultatea de chimie aplicată şi ştiinţa materialelor, Splaiul
Independenţei, Nr. 313, RO-060042 Bucureşti, Romania, [email protected] b Universitatea Sapientia Cluj Napoca, Facultatea de ştiinţe tehnice şi sociale, Catedra de ştiinţe tehnice şi ale naturii, Piaţa libertăţii, Nr. 1., RO-5301104 Miercurea Ciuc, Romania, [email protected]
c Eötvös Lóránd University, Department of Biochemistry, Pázmány Péter street 1/C,1117, Budapest, Hungary, [email protected]

PÁLFI M., KOVÁCS E., MIKLÓSSY I., SZILÁGYI L., ÁBRAHÁM B., LÁNYI S.
36
EGFP (Enhanced Green Fluorescent Protein) has two mutations (F64L, S65T) in the chromophore region and have a single excitation peak at 488 nm and fluoresces with greater intensity than wild type protein [6]. GFP are used as reporters of gene expression, tracers of cell lineage, and as fusion tags to monitor protein localization within living cells [7].
The structure of GFP was redesigned by using the genetic engineering tools, in such way that was created a metal binding site in the proximity of chromophore group [8, 9, 10]. As the presence of metal ions in close proximity to a chromophore can result in fluorescence quenching, this newly introduced functional property allows the protein to be used as a metal sensor in environmental systems [8]. These mutants represent a new class of protein-based metal sensors, thats can report metal ion concentrations without the use of any exogenous modification reagents.
It is a common practice in protein engineering to supplement recombinant proteins with hexa-histidine tags to facilitate their purification. It was shown that the presence of such a tag by itself increases the sensitivity of GFP fluorescence for quenching by copper ions [11].
In earlier studies we examined the sensitivity of His-tagged EGFP for some metal ions. As a result of these studies we obtained that copper and ferrous ions in millimolar ranges reduced the fluorescent intensity of this protein. However for biosensor application of this protein further improvement of metal ion sensitivity and selectivity is. needed.
Starting from idea that the presence of metal ions in close proximity to the chromophore can result in fluorescence quenching, it is possible to create a prototype suitable for biosensor applications by engineering of a specific metal binding site in GFP structure that couples metal binding to modified fluorescent signals.
We investigated the structure of this protein for searching the target amino acid positions for substitution with histidines. These positions have to comply for two requirements: do not affect the formation of native conformation of this protein, and have to be in close proximity to chromophore group.
Therefore we designed and constructed a metal binding mutant of EGFP. We investigated the stability of mutant protein, and the sensitivity of protein fluorescence for quenching by some bivalent metal ions. RESULTS AND DISCUSSION Design of metal binding site on the surface of EGFP
The structure of GFP is known, so we can design directed modifications in the structure of GFP that confer a metal binding capacity to the GFP. The target site of modification is mostly on 7–10 β -sheets of the GFP β- barrel.

ENGINEERED GREEN FLUORESCENT PROTEIN AS A POTENTIAL METAL SENSOR
37
In this region of GFP can observe an irregularly large space between β -strands [10]. Therefore, this region is a potential target site for rational design of a metal binding site. As binding of analytes to this engineered binding site may alter the fluorescent properties of the GFP chromophore [11]. Taken these facts into consideration we choose two positions as targets for substitution with histidines, the serine in position 202 and the glutamine in position 204. These amino acids are close proximity to chromophore group. For the designed mutant protein was constructed a structure model using the PyMOL molecular modelling package. Figure 1 show the structure model of the native EGFP and the mutant EGFP.
Figure 1. The 3 D structure of EGFP. A- native form, B- mutant form. The chromophore group of the protein are colored green, A - in gray are represented the target site for the mutation (202 serine and the 204 glutamine), B- in gray are represented
the introduced hisitidines in positions 202 and 204 Expression and purification of the mutant protein
The mutant EGFP contains a His tag at the N terminal end of the polypeptid chain, that help in the purification. The mutant protein was purified by adsorption on a Ni-charged polymer matrix. The molecular weight of the mutant EGFP is 28 kDa. Figure 2 shows the result of the protein expression and purification, verified by SDS polyacrylamide gelelectroforesis. The mutant protein was produced in relativly large quantities and by affinity chromatography purification we obtained the mutant protein in high purity.

PÁLFI M., KOVÁCS E., MIKLÓSSY I., SZILÁGYI L., ÁBRAHÁM B., LÁNYI S.
38
Figure 2. The verification of the mutant protein expression and purification.
MWM- molecular weight marker, 1, 2- proteins in the cell lysate, 1.1, 1.2. – purified EGFP mutant
Analysis of mutated EGFP denaturation in guanidine solution
GFP gives strong fluorescence only when the chromophore is kept inside the protein barrel. Since the fluorescence of GFP is linked to its properly folded structure, it is therefore possible to use the fluorescence of GFP as an indication of its properly folded structure [12].
In this work, we have used the fluorescence spectroscopy to study the denaturation of mutated EGFP by guanidine hydrochloride. Guanidine hydrochloride (GuHCl) is chaotropic agent, which disrupts the arrangement of water molecules around the hydrophillic regions of proteins to cause the proteins to denature. It apparently disrupts hydrogen bonds, which hold the protein in its unique structure. However, there also is evidence suggesting that GuHCl may disrupt hydrophobic interactions by promoting the solubility of hydrophobic residues in aqueous solutions.
Temporal change of the relative fluorescence intensity at different GuHCl concentrations is shown in Figure 3.
Figure 3. Temporal change of the fluorescence intensity
at different guanidine hydrochloride concentrations
ENGINEERED GREEN FLUORESCENT PROTEIN AS A POTENTIAL METAL SENSOR
39
It was observed that the fluorescence intensity decreases during denaturation. As the GFP molecule unfolds, the chromophore converts into a non-fluorescent state. Water molecules penetrate into the protein’s interior and protonate the chromophore. The protonated chromophore does not give fluorescence.
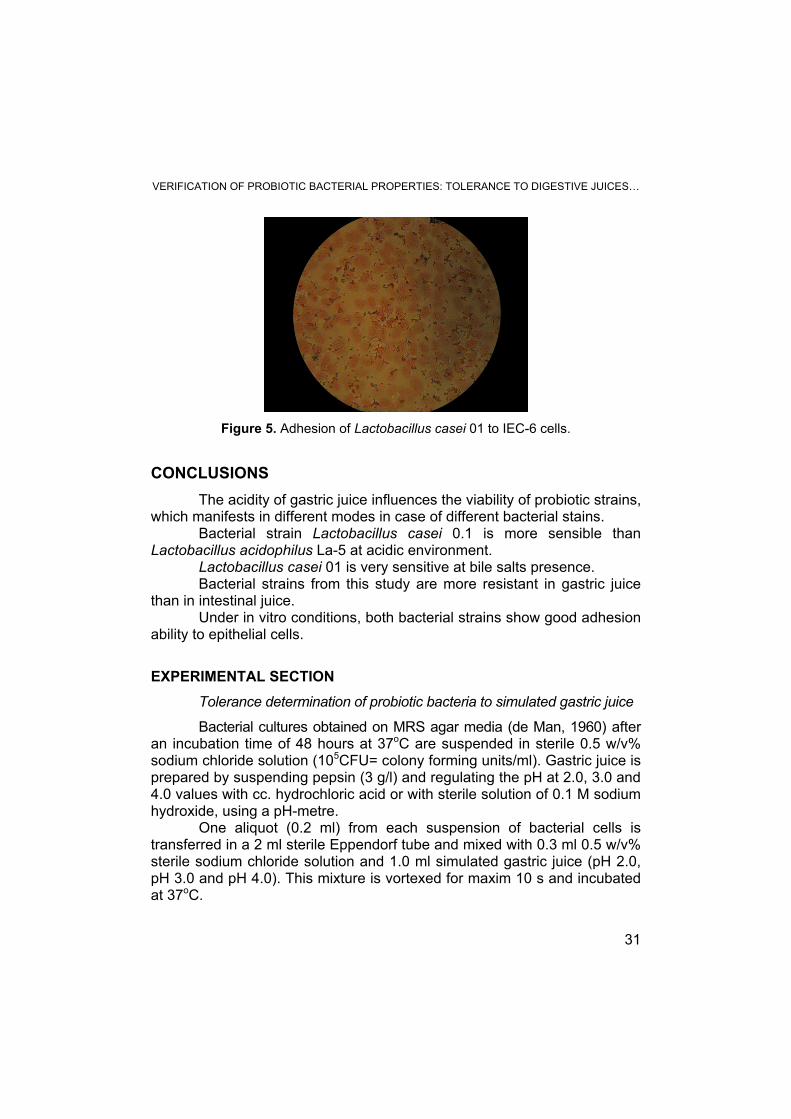
Protein denaturation was also observed in different concentration of guanidine hydrochloride, after incubation at room temperature for 20 hours. The results of denaturation are shown in Figure 4.
Figure 4. Fluorescence of EGFP after 20 hours incubation in guanidine hydrochloride solutions
The equilibrium fluorescence data for the GuHCl induced unfolding of EGFP can be approached with a curve describing two-state equilibrium. The midpoint of transition is at 2,41 M GuHCl. Effect of bivalent metal ions on fluorescence of EGFP
The intensity of fluorescence can be decreased by a wide variety of processes. Such decreases in intensity are called quenching. Quenching can occur by different mechanisms. Collisional quenching (dynamic) occurs when the excited-state fluorophore is deactivated upon contact with some other molecule in solution, which is called the quencher. In this case the fluorophore is returned to the ground state during a diffusive encounter with the quencher [13].

PÁLFI M., KOVÁCS E., MIKLÓSSY I., SZILÁGYI L., ÁBRAHÁM B., LÁNYI S.
40
We investigated the effect of various concentrations (0.5 μM to 500 μM) of divalent cations (Fe2+, Zn2+, Ni2+, Cu2+) on the fluorescent emission of the mutated EGFP.
Figure 5. Relative fluorescence of mutated EGFP in the presence of different metal ions
As represented in Figure 5, copper ions exerted the strongest
suppressing effect on the fluorescent intensity of mutant EGFP compared to another metal ions. The remaining fluorescence of approximately 60% was found in the 0,1 mM CuSO4 solutions. Meanwhile, 93% of fluorescent intensity remained in 0,1 mM FeSO4 solutions and in 0,1 mM NiSO4 solution the remaining fluorescence was 84%. Surprisingly in the ZnSO4 solution the fluorescence intensity of mutant protein increased by 15%. We investigated the effect of different concentration of copper ions on fluorescence emission of mutant and native EGFP. It was observed that the fluorescence intensity of mutated EGFP decreased proportionally with the increasing of copper ion quantity in solutions, as show Figure 6. As this figure show the mutant protein’s fluorescence intensity decreased more significantly than the fluorescence of native protein.
Figure 6. Relative fluorescence of native and mutant EGFP in different copper ion solution

ENGINEERED GREEN FLUORESCENT PROTEIN AS A POTENTIAL METAL SENSOR
41
In the case of mutant EGFP the fluorescence quenching occurred by copper ions is proportionate to copper ion concentration, in the range of 50 μM - 400 μM copper ion concentration.
CONCLUSIONS During the GFP denaturation by guanidine hydrochloride, the protein
unfolds and the chromophore group become into the surface of the protein, where is protonated by the water molecules. The protonated form is non-fluorescent. The guanidine hydrochlorid induced unfolding process enter into an equilibrium state after 20 hours incubation. It is evolved an equilibrium between the native and the denaturated form of protein.
Metal quenching process is highly concentration and distance dependent. To design a sensitive fluorescent protein-based biosensor for metal ions the structural orientation of metal binding site and its distance towards the GFP fluorophore have to be taken into consideration The location and distance of the imidazole ring need to be very close to the GFP fluorophore (>5 A°) in order to effectively quench the fluorescence [10].
Cu2+ ion is known as dynamic quencher interacting with excited states of chromophore. Copper ions penetrate inside the barrel and quench fluorescence through direct interactions with the chromophore [10]. Both the mutant EGFP and native EGFP show the highest sensitivity for copper ions. In the case of native EGFP we got a linear correlation between fluorescence quenching and copper ion concentration in the range of 50 μM - 1000 μM. At 1000 μM the quenching was more than 15%. The mutant protein is quenched at a much lower metal concentration than the native protein. This indicates that metal ions binds to the created metal binding site and this site is close enough to quench the fluorescence of EGFP.
The mutant EGFP is more sensitive to copper ions, than the native form. So we can conclude that due to the directed mutagenesis the sensitivity of EGFP for copper ions was increased significantly.
Further studies are needed to assay different metal ions, and to increase the affinity of the metal binding site.
EXPERIMENTAL SECTION Site-directed mutagenesis
A histidine substituted EGFP mutant (S202H/S204H) was constructed using QuikChange® Site-Directed Mutagenesis Kit (Stratagene). Specific mutations were introduced into the pET- EGFP plasmid, by substitution of two triplets in EGFP coding sequence with triplets that encode histidines. This plasmid (pET-EGFP) was a generous gift of L. Radnai (Dept. of Biochemistry, Eötvös Loránd University, Budapest, Hungary).

PÁLFI M., KOVÁCS E., MIKLÓSSY I., SZILÁGYI L., ÁBRAHÁM B., LÁNYI S.
42
The mutagenic primers coding for the desired mutations were as follows: S202H, Q204H-forward primer- CTACCTGCACACCCACTCCGC CCTGAGC, S202H, Q204H-reverse primer- GCTCAGGGCGGAGTG GGTGTGCAGGTAG. PCR mutagenesis was carried out according to the manufacturer’s recommenda-tions (Stratagene). Incorporation of the oligonucleotide primers generated a mutated plasmid containing staggered nicks. The PCR products were digested by DpnI to eliminate the template plasmid, which did not contain the desired mutations and was transformed into supercompetent XL1 Blue cells.
Expression of the mutant protein The mutant plasmid was isolated from transformed XL1 Blue cells,
harbouring the mutated plasmid. The resulting pET-EGFPmut plasmid was cloned into E. coli cells. Expression of the mutant proteins was carried out in E. coli strain BL21 Star (DE3). The results of the expression were analyzed by SDS-PAGE. The obtained recombinant protein was purified by immobilized metal (Ni2+) affinity chromatography. The protein, containing an N-terminal 6xHistidine tag, was purified by adsorption on a Ni-charged polymer matrix (Porfinity IMAC Ni-charged Resin, BioRad). Purified protein was dialyzed against 20 mM sodium phosphate buffer, with pH 7.
Structural stability analysis of mutated EGFP In these experiments we used different concentration of guanidine
hydrochloride solutions (0,5-5 M). The protein quantity in the denaturing solutions was 10 micromols. After 20 hour incubation at room temperature (298 K), the fluorescence intensity of denatured mutant EGFP was measured by a FluoStar OPTIMA fluorimeter, the excitation wavelength was 485 nm and emission wavelength was 520 nm. For the fluorescence measurments we used U-bottomed 96 well Greiner microtiter plates. The denaturing solution contained the corresponding guanidine hydrochloride dissolved in 20 mM sodium phosphate buffer (pH 7). The final volume of samples in the microplate wells was 100 microliters. All measurments were executed at 298 K.
Effect of bivalent metal ions on fluorescence of EGFP
Fluorescence measurements were carried out using a FluoStar OPTIMA fluorimeter at 298 K. Excitation and emission wavelengths were assayed at 485 and 520 nm, respectively. Samples containing the protein (mutant EGFP) in low μM range in 20 mM Na2HPO4, pH 7, were mixed with CuSO4, ZnSO4, NiSO4
and FeSO4 dissolved in ultrapure water to yield the final concentrations in the range of 10–500 μM. The final volume of samples in the microplate was 100 microliters.
ACKNOWLEDGEMENTS
This study was supported by the department of Tehnical Sciences, University of Sapientia.

ENGINEERED GREEN FLUORESCENT PROTEIN AS A POTENTIAL METAL SENSOR
43
REFERENCES
1. D. W. Piston, G. H. Patterson, N. S. Claxton, M. W. Davidson, Nikon MicroscopyU,
2008. 2. M. Ormo, A. B. Cubitt, K. Kallio, L. A. Gross, R. Y. Tsien, S. J. Remington, Science,
1996, 273, 1392. 3. R. M. Wachter, Photochemistry and Photobiology, 2006, 82, 339. 4. M. Chalfie, S. R. Kain, “Green fluorescent protein. Properties, applications and
protocols”, Second edition, John Wiley & sons, Inc. New Jersey, 2006, chapter 5. 5. K. M. Alkaabi, A. Yafea, S. S. Ashraf, Applied Biochemistry and Biotechnology,
2005, 126,149. 6. B.P. Cormack, R. Valdivia, S. Falkow, Gene, 1996, 173, 33. 7. R. Y. Tsien, Annual review in biochemistry, 1998, 67, 509. 8. T. A. Richmond, T. T. Takahashi, R. Shimkhada, J. Bernsdorf, Biochemical and
Biophysical Research Communications, 2000, 268, 462. 9. D. P. Barondeau, C. J. Kassmann, J. A. Tainer, E. D. Getzoff, Journal of the American
Chemical Society, 2002, 124, 3522. 10. N. Tansila, K. Becker, C. N. A. Isarankura, V. Prachayasittikul, L. Bülow,
Biotechnological Letters, 2008, 30, 1391. 11. N. Tansila, T. Tantimongcolwat, C.I.N. Ayudhya, C. Nantasenamat, V. Prachayasittikul,
International journal of biological sciences, 2007, 3, 463. 12. K. Jung, J. Park, P. J. Maeng, H. Kim, Bulletin of the Korean Chemical Society,
2005, 26, 413. 13. J. R. Lakowicz, “Principles of fluorescence spectroscopy”, Third Edition, USA,
2006, chapter 1.

STUDIA UNIVERSITATIS BABEŞ-BOLYAI, CHEMIA, LIV, Sp.Iss. 2, 2009
ANALYSIS OF BIOFILM PRODUCTION, SWARMING AND SWIMMING MOTILITY OF PSEUDOMONAS STRAINS
ÉVA TAMÁSa, GYÖNGYVÉR MARAb, ÉVA LASLOa, ÉVA GYÖRGYb, BEÁTA ÁBRAHÁMb and SZABOLCS LÁNYIb
ABSTRACT. The main aim of our study is the development of bacterial biopreparates based on organic nitrogen and phosphorus mobilizing microorganisms, in order to replace the mineral fertilizers. The Pseudomonas strains isolated from Borsáros Raised Bog natural reserve were analyzed for the biofilm production ability through crystal violet staining, and for bacterial motility on low agar plates. The studied characteristics are beneficial in the rhizosphere colonization and give a higher survival rate of the selected bacteria in a harsh environment. Our results show that the majority of the selected Pseudomonas strains have a good colonization and survival potential in the rhizosphere environment. Keywords: biofilm production, exopolysaccharide matrix, bacterial motility,
Pseudomonas strains
INTRODUCTION In order to develop high efficiency bacterial biopreparates, the
appreciation of colonization and survival potential of the selected bacterial strains is indispensable. Colonization of the root system is a required ability of the soil bacteria with potential applications in agriculture as biocontrol, biofertiliser or phytostimulator biopreparate. In the present study we analyzed the bacterial motility that have role in the colonization of the rhizosphere, and also the biofilm forming capacity. The exopolysaccharide matrix of the biofilm serves as a shield in the protection of the bacteria from the environmental stress. There are several types of bacterial motility like sliding, gliding, twitching, darting, swimming and swarming [1]. The most studied motility types are the swimming and swarming motility, already studied in Proteus sp., Vibrio sp.,
a Politehnica” University of Bucharest, Faculty of Applied Chemistry and Material Science,
Spl. Independenţei, 313, Sector 6, Cod 77206, Bucharest, Romania, Tel: 40 21 402 91 00, Fax: 40 21 318 10 05, e-mail: [email protected]
b „Sapientia” University, Cluj-Napoca, Faculty of Sciences, Miercurea-Ciuc, Bioengineering Department, Piaţa Libertăţii, 1, Cod 530104, Miercurea-Ciuc, Romania, Tel.: +40 266 317 121, Fax: +40 266 372 099, e-mail: [email protected]

É. TAMÁS, G. MARA, É. LASLO, É. GYÖRGY, B. ÁBRAHÁM, S. LÁNYI
46
Serratia sp., Chromobacterium sp., Clostridium sp., Bacillus sp. and Thiovolum sp. strains. Motility types basically depend on the medium composition (gel strength) [1, 2, 16]. In order to swarm, cells first differentiate into swarmer cells characterized by an increase in flagellum number and the elongation of cells, and then move as multicellular groups across solid surfaces [3, 4]. This is in contrast with swimming motility that represents individual cell motility in an aqueous environment. In addition to the morphological changes, the swarmer cells produce extracellular materials, such as surfactants and exopolysaccharides to increase surface wetness and thus facilitate movement [2, 5, 6]. The concentration of agar is the factor that determine whether the cells swim or swarm or form regular colonies. On media containing low agar concentration (0.4%), the bacterial cells exhibit swimming motility, while on media solidified with 0.4–1.2% agar, the organisms swarm on the top of agar surface [1]. The increase of the agar concentration of the culture media result the inhibition of migration of microorganisms and consequently normal-sized colonies are formed.
Microorganisms can attach to surfaces due to a transition from a planktonic life form to a sessile life form, developing biofilm. The biofilm is the totality of surface-associated microbial cells enclosed in an extracellular polymeric substance (EPS) matrix [7]. The analysis of the biofilm production can be realized by spectrofluorometric assay, with fluorescent wheat germ agglutinin (WGA), crystal violet or malachite green coloration [8, 9, 10, 11].
Many Pseudomonas sp. strains are known as plant growth promoting bacteria due to the phosphate solubilization ability, siderophore or biocontrol agent production, as example P. fluorescens, P. putida, P. aeruginosa, P. mendocina [14, 15, and 18].
The main aim of the present study was to determine the biofilm production and motility of bacterial isolates in order to select potential strains for biopreparate production. The studied strains were isolated from Borsáros Raised bog, situated in the Ciuc basin, approximately 7 km to south from Miercurea Ciuc, in Harghita County, Romania. This is a nutrient poor acidophilic habitat, with Sphagnum sp. mosses that were reported to be associated with Pseudomonas sp. in Baltic Sea Coast [20].
The isolated bacteria were cultured on specific King’s B media and classified as Pseudomonas sp. strains due to the phenotypic, cultural and taxonomically important biochemical properties (gelatine-, glucose-, lactose degradation, nitrate reduction, oxidase test etc.).
RESULTS AND DISCUSSION The swimming and swarming mobility of 37 Pseudomonas strains
was analyzed. The swimming ability was determined on Luria Bertani broth with 0,3% agar concentration, respectively the swarming ability was determined on Luria Bertani broth with 0,5% agar concentration [12].
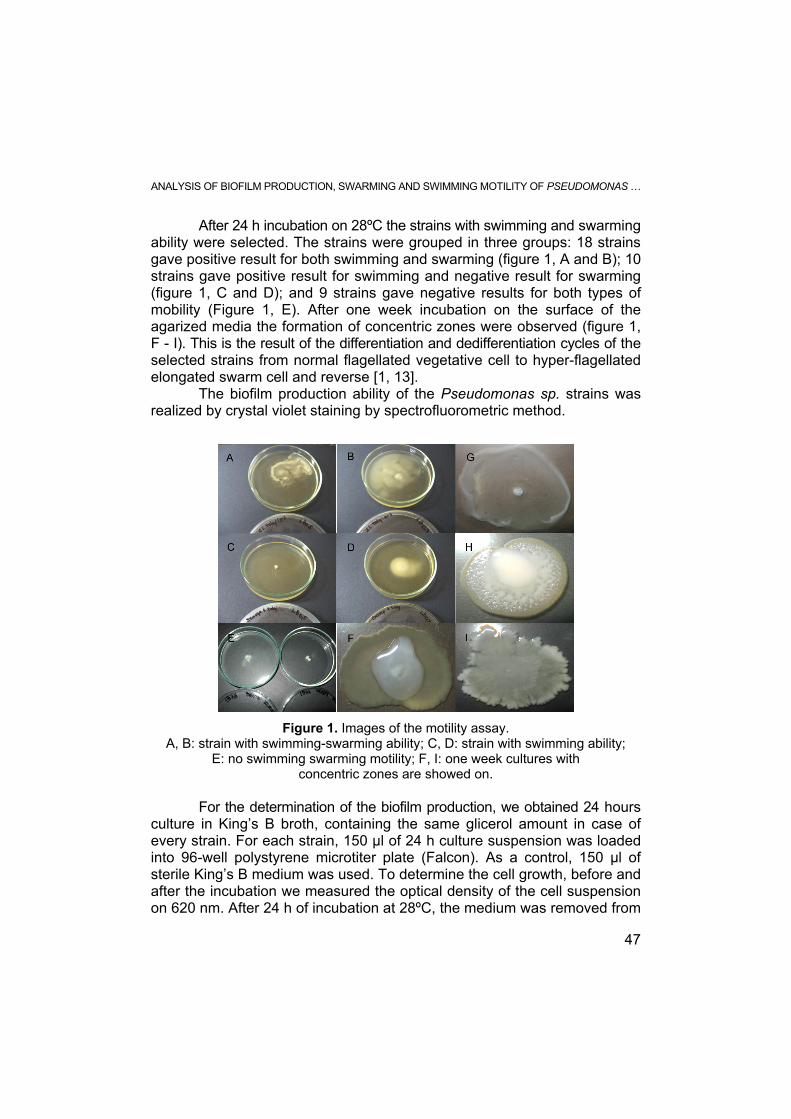
ANALYSIS OF BIOFILM PRODUCTION, SWARMING AND SWIMMING MOTILITY OF PSEUDOMONAS …
47
After 24 h incubation on 28ºC the strains with swimming and swarming ability were selected. The strains were grouped in three groups: 18 strains gave positive result for both swimming and swarming (figure 1, A and B); 10 strains gave positive result for swimming and negative result for swarming (figure 1, C and D); and 9 strains gave negative results for both types of mobility (Figure 1, E). After one week incubation on the surface of the agarized media the formation of concentric zones were observed (figure 1, F - I). This is the result of the differentiation and dedifferentiation cycles of the selected strains from normal flagellated vegetative cell to hyper-flagellated elongated swarm cell and reverse [1, 13].
The biofilm production ability of the Pseudomonas sp. strains was realized by crystal violet staining by spectrofluorometric method.
Figure 1. Images of the motility assay.
A, B: strain with swimming-swarming ability; C, D: strain with swimming ability; E: no swimming swarming motility; F, I: one week cultures with
concentric zones are showed on.
For the determination of the biofilm production, we obtained 24 hours culture in King’s B broth, containing the same glicerol amount in case of every strain. For each strain, 150 µl of 24 h culture suspension was loaded into 96-well polystyrene microtiter plate (Falcon). As a control, 150 µl of sterile King’s B medium was used. To determine the cell growth, before and after the incubation we measured the optical density of the cell suspension on 620 nm. After 24 h of incubation at 28ºC, the medium was removed from

É. TAMÁS, G. MARA, É. LASLO, É. GYÖRGY, B. ÁBRAHÁM, S. LÁNYI
48
the plate and the wells were washed twice with 300 µl sterile demineralised water to remove the non- and low-adherent bacteria. An amount of 200 µl per well of 1% (v/v) crystal violet solution in water were added for 45 min to stain the biofilm. The stain was removed and the wells were washed three times with 300 µl sterile demineralised water to remove the excess stain. The stained biofilm is shown on Figure 2, A-C. The dye bounded to the exopolysaccharide matrix was dissolved in 250 µl of absolute ethanol (figure 2, D). A volume of 200µl of the stained ethanol was transferred to a new microtiter plate. The optical density (OD) of each well was measured at 492 nm using a microtiter plate reader (Fluorostar Optima, BMG Labtech), to determine the quantity of the bounded dye.
Figure 2. Biofilm stained with crystal violet, A-C: the stained biofilm on the surface
of the microtiter plate; D: the bounded crystal violet dissolved in ethanol.
The biofilm production ability of the Pseudomonas sp. strains is presented in figure 3. The grey column represents the optical density of the crystal violet bounded to the exopolysaccharide matrix, and the black column represents the ratio of the optical densities: OD492/OD620. This ratio represents the real value of the biofilm production, scaled with the optical density of bacterial cells. A number of 11 strains (S.2T, S.1.2.G, 1.2.T.10-1, 1.2.T.10-2, 1.2.T.10-3, 1.3.T.10-1, 1.3.T.10-2, 1.3.T.10-3, 1.4.T.10-3, 2.2.T.10-3, 2.5.T.10-2) were selected having good biofilm forming capacity.
The results obtained from the analysis of the motility and biofilm production was evaluated using principal component analysis (PCA), represented on figure 4. The essence of the principal component analysis is to reduce the dimensionality of a data set consisting of a large number of

ANALYSIS OF BIOFILM PRODUCTION, SWARMING AND SWIMMING MOTILITY OF PSEUDOMONAS …
49
interrelated variables, while retaining as much as possible of the variation present in the data set, by transforming to a new set of variables, the principal components (PCs), which are uncorrelated.
The biofilm production of the Pseudomonas strains
0
1
2
3
4
5
6
7
8
S.1.T
S.2.T
S.1.1.G
S.1.2.G S.2.
G
2.G.10
-1
1.1.T.
10-2
1.1.T.
10-3
1.2.T.
10-1
1.2.T.
10-2
1.2.T.
10-3
1.3.T.
10-1
1.3.T.
10-2
1.3.T.
10-3
1.4.T.
10-3
2..T.1
0-2
2.1.T.
10-1
2.1.T.
10-2
2.1.T.
10-3
2.2.T.
10-1
2.2.T.
10-2
2.2.T.
10-3
2.3.T.
10-2
2.3.T.
10-3
2.5.T.
10-2
NT1 NT3 NT4
SGY14 ST7 ST9
PGY2M2
PGY2M3
PGY2M4
PT1.10
-5KT1
2
T1P1.1
0-4
Strains
The
valu
es o
f abs
orba
nce
OD492 / OD620OD chrystal violet
Figure 3. The biofilm production of the Pseudomonas strains.
Figure 4. Principal component analysis of the studied characters.
Our strains were grouped in five groups, listed in table 1.
I. group

É. TAMÁS, G. MARA, É. LASLO, É. GYÖRGY, B. ÁBRAHÁM, S. LÁNYI
50
Table 1. Groups of the strains obtained after the PCA analysis. (+) - positive result, (–) - negative result.
Nr. Groups Strains
I. + swarm, + swim, good biofilm producer
6 strains: S.1.2.G, 1.2.T.10-1, 1.2.T.10-3, 1.3.T.10-2, 1.3.T.10-3, 1.4.T.10-3
II. + swarm, + swim, weak biofilm producer
12 strains: S2T, 2.G.10-1, 1.1.T.10-2, 1.1.T.10-3, 2.T.10-1, 2.1.T.10-1, 2.1.T.10-2, 2.1.T.10-3, 2.3.T.10-3, NT1, SGY14, T1P1.10-4
III. - swarm, + swim, good biofilm producer
4 strains: 1.2.T.10-2, 1.3.T.10-1, 2.2.T.10-3, 2.5.T.10-2
IV. - swarm, + swim, weak biofilm producer
6 strains: S1T, S.1.1.G, S.2.G, 2.2.T.10-1, 2.2.T.10-2, ST9
V. - swarm, - swim, weak biofilm producer
9 strains: 2.3.T.10-2, NT3, NT4, ST7, PGY2M2, PGY2M3, PGY2M4, PT1. 10-5, KT12
CONCLUSIONS
In this work we have established culture techniques for studying the surface behaviour of thirty seven Pseudomonas sp. strain. We grouped these strains by their motility, and we obtained eighteen strains, that were capable both to swim and swarm. The importance of flagelar motility in colonization of the plant roots by bacteria was clearly demonstrated in different Pseudomonas sp. strains [17, 19]. Chin-A-Woeng et al. [19] demonstrated that the tomato root colonization by the wild type of Pseudomonas chlororaphis was greater than that by the non-motile mutants in a competitive situation.
Organisms within biofilms can withstand nutrient deprivation, pH changes, oxygen radicals,disinfectants, antibiotics and also phagocitosis better than the planktonic organisms [21]. The biofilm production ability of the Pseudomonas sp. strains was analysed, and eleven strains proved to be good biofilm producers.
Based on the principal component analysis we obtained six strains able to swim and swarm, and with biofilm producing ability. These strains proved a good colonizing and surviving potential in laboratory conditions. These results support the need for further investigation of the colonizing and surviving ability of selected strains.
EXPERIMENTAL SECTION Bacterial strains and growth media
37 Pseudomonas strains were isolated from Borsáros Raised Bog natural reserve. Soil samples were taken from a depth of 10-15 cm and have been preserved in sterile plastic bags. Samples were processed on the sampling day, by using a soil dilution technique (serial dilutions). From each

ANALYSIS OF BIOFILM PRODUCTION, SWARMING AND SWIMMING MOTILITY OF PSEUDOMONAS …
51
dilution 1 ml sample was used for the inoculation of Pseudomonas specific King’s B culture media. The selective King’s B agar media contained 20g/L Proteose peptone, 10 ml/L glycerol, 1,5 g/L K2HPO4, 1,5 g/L MgSO4.7H2O and 20 g/L agar. The inoculated plates were incubated at 28°C for 24 hours. The Luria Bertani (LB) agar used for motility assay contained 10 g/L tryptone, 5 g/L yeast extract, 10 g/L NaCl and respectively 0,3% or 0,5% agar.
Motility assay
For the analysis of swarming and swimming motility we used spot inoculation method, the selected strains were inoculated on the centre of the LB media containing 0,5% (swarming) or 0,3% (swimming) agar. The plates were incubated at 28ºC. After 24 h the swarming and swimming ability of strains was determined. The assays were performed in duplicate. Biofilm evaluation with crystal violet staining
For each strain, 150 µl of 24 h culture suspension in King’s B broth was loaded into 96-well polystyrene microtiter plate (Falcon). As a control, 150 µl of sterile King’s B broth was used. Before and after the incubation we measured the optical density of the cell suspension on 620 nm. After 24 h of incubation at 28ºC, the medium was removed and the wells were washed twice with 300 µl sterile demineralized water. An amount of 200 µl per well of a 1% (v/v) crystal violet solution in water were added for 45 min. After the staining the wells were washed tree times with 300 µl sterile demineralized water to remove excess stain. The dye bounded by the adherent cells was dissolved with 250 µl of absolute ethanol. Two hundred µl of the solubilised solution were transferred to a new microtiter plate. The OD (optical density) of each well was measured at 492 nm using a microtiter plate reader (Fluorostar Optima, BMG Labtech). The assay was performed in eight repeats for each strain.
REFERENCES 1. M. Sharma, S. K. Anand, Current Science, 2002, 83, 707. 2. F. Garcia-Pichel, Journal of Bacteriology, 1989, 171, 3560. 3. G. M. Fraser, C. Hughes, Current Opinion in Microbiology, 1999, 2, 630. 4. N. Verstraeten, K. Braeken, B. Debkumari, M. Fauvart, J. Fransaer, J. Vermant,
J. Michiels, Trends in Microbiology, 2008, 16, 496. 5. T. Inoue, R. Shingaki, S. Hirose, K. Waki, H. Mori, Kazuhiro Fukui, Journal of
Bacteriology, 2007, 189, 950.

É. TAMÁS, G. MARA, É. LASLO, É. GYÖRGY, B. ÁBRAHÁM, S. LÁNYI
52
6. S. Süle, L. Cursino, D. Zheng, H. C. Hoch, T. J. Burr, Letters in Applied Microbiology, 2009, 49, 596.
7. R. M. Donlan, Emerging Infectious Diseases, 2002, 8, 881. 8. E. Burton, N. Yakandawala, K. LoVetri, M. S. Madhyastha, J. Ind. Microbiol.
Biotechnol, 2007, 34, 1. 9. S. Favre-Bonté, T. Köhler, C. Van Delden, Journal of Antimicrobial Chemotherapy,
2003, 52, 598. 10. N. C. Caiazza, J. H. Merritt, K. M. Brothers, G. A. O’Toole, Journal of Bacteriology,
2007, 189, 3603. 11. E. Dordet-Frisoni, B. Gaillard-Martinie, R. Talon, S. Leroy, Research in Microbiology,
2008, 159, 263. 12. G. M. Young, M. J. Smith, S. A. Minnich, V. L. Miller, Journal of Bacteriology, 1999,
181, 2823. 13. O. A. Soutourina, P. N. Bertin, FEMS Microbiology Reviews, 2003, 27, 505. 14. H. Rodríquez, R. Fraga, Biotechnology Advances, 1999, 17, 319. 15. M. A. Molina, Reviews in Environmental Science and Bio/Tehnology, 2003, 2, 99. 16. W. D. Jamieson, M. J. Pehl, G. A. Gregory, P. M. Orwin, BMC Microbiology,
2009, 9, 124. 17. J. Czaban, A. Gajda, B. Wróblewska, Polish J. of Environ. Stud., 2007, 16(2), 301. 18. D. Egamberdieva, Z. Kucharova, Biol. Fertil. Soils, 2009, 45, 563. 19. T.F.C. Chin-A-Woeng, G.V. Bloemberg, I.H.M. Mulders, L.C. Dekkers, B.J.J.
Lugtenberg, Molecular Plant-Microbe Interactions, 2000, 13(12), 1340. 20. K. Opelt, G. Berg, Appl. Environ. Microbiol., 2004, 70, 6569. 21. K. Jefferson, FEMS Microbiology Letters, 2004, 236, 163.

STUDIA UNIVERSITATIS BABEŞ-BOLYAI, CHEMIA, LIV, Sp.Iss. 2, 2009
APPLIED MICROBIAL TECHNOLOGY: SOLUBILIZATION OF INORGANIC PHOSPHATE AND PRODUCING SIDEROPHORE
BY ISOLATED NITROGEN FIXING BACTERIA
ÉVA LASLOa, ÉVA GYÖRGYb, GYÖNGYVÉR MARAb, ÉVA TAMÁSa, ISTVÁN MÁTHÉb, BEÁTA ÁBRAHÁMb, SZABOLCS LÁNYIb
ABSTRACT. The benefic microbes play an important role in the transformation, mobilization and solubilization of the nutrient content of the soils. Their nitrogen fixing ability to in symbiosis with legume has a central role in the nitrogen-cycle of most natural ecosystems. A total of 30 bacteria were isolated from different leguminous plants nodules and rhizospheric soils. The morphological and biochemical characterization of these isolates was made and they was screened for their plant-growth promoting factors: tricalcium phosphate mobilization capability and siderophore productivity by agar plate method. Some A of these bacteria were classified genotypicaly.
Keywords: leguminous plant, inorganic phosphate, siderophore production.
INTRODUCTION Rhizosphere bacteria that colonize plant roots may enhance the plant growth, the development and crop yield by different ways e.g. by enhancing the bioavailability of soil phosphates for plant roots. They increase phosphorus mobilization in soil and produce ferric ion specific chelating agents, which capture ferric oxides by converting them into water soluble forms available for absorption for the roots [1]. Phosphorus is an important element for plant growth because it stimulates growth of young plants, promotes a vigorous start and hastens maturity. Consequently, plant growth is diminished, maturity is delayed and yield reduced when an inadequate supply of phosphorus is present [2, 11]. Approximately 70-80% of phosphorus found in cultivated soils is inorganic. The solubilising ability of a microorganism is related to its organic acid production that binds cations such Al3+, Ca2+, and Fe3+ from mineral phosphates and releases soluble phosphorus, enhancing plant nutrition [6].
a Universitatea POLITEHNICA, Bucureşti, Facultatea de Chimie Aplicată şi Ştiinţa Materialelor;
Spl. Independenţei nr. 313, Sector 6, RO-060042 Bucureşti [email protected] b Universitatea SAPIENTIA Cluj-Napoca, Facultatea de Ştiinţe Sociale şi Tehnice, Piaţa Libertăţii
nr. 1, RO-530104 Miercurea-Ciuc

É. LASLO, É. GYÖRGY, G. MARA, É. TAMÁS, I. MÁTHÉ, B. ÁBRAHÁM, S. LÁNYI
54
In neutral or alkaline soils, the production of acids decreases the pH of the rhizosphere, favourising thus the solubility of calcium phosphates and apatites. The production of organic acid leads to acidification of microbial cells and their surroundings, consequently enhance the release of phosphate ions from the by H+ substitution for Ca2+ [7]. Insoluble sources of inorganic phosphorus in liquid broth are solubilised by bacteria either by lowering the pH or by enhancing the cation chelation by phosphates. Chelation involves the formation of two or more coordinative bonds between phosphate containing molecules and metal ions, results a ring structured complexes. Chelation by an organic acid ligand occurs via oxygen contained in hydroxyl and carboxyl groups [5]. The proton release is thought to be associated with cation assimilation, such as ammonium ion (NH4
+). H+ excretion accompanying NH4+ assimilation
is responsible for P-solubilization. A major mechanism for mineral phosphate solubilization in Gram-negative bacteria is the direct oxidation of glucose to gluconic acid. Gluconic acid biosynthesis is carried out by the glucose dehydrogenase enzyme and the co-factor, pyrroloquinoline quinine [9]. Iron is a limiting bioactive metaliv element in soil and is essential for plant growth. Rhizobacteria have to develop some strategies to acquire iron [4]. To sequester and solubilize ferric iron, many microorganisms synthesize and utilize siderophores that are relatively low molecular weight, ferric-ion specific chelating agents [8]. In case when microorganisms grow under iron-deficient conditions, they synthesize and excrete siderophores to sequester and solubilize iron from the environment [12]. Chemically, most siderophores belongs to hydroxamates or catechols [3]. Generally, the aim of our study is the development of plant-growth promoting inoculants. In the present article we discuss the cell morphology, biochemical characteristics and molecular categorization of the isolated nodule- and rhizobacteria, as well as we present data on the inorganic phosphate solubilization and siderophore production. RESULTS AND DISCUSSION
In this assay 30 isolates from different leguminous plants and their rhizosphere from Ciuc Mountains were characterized through morphological analysis, biochemical tests, molecular restriction fragment polymorphism, and were screened in vitro for their beneficial traits like siderophore production, and inorganic phosphate solubilization.
All of the isolated bacteria were found to be Gram-negative and three of the isolates were spore formulating.
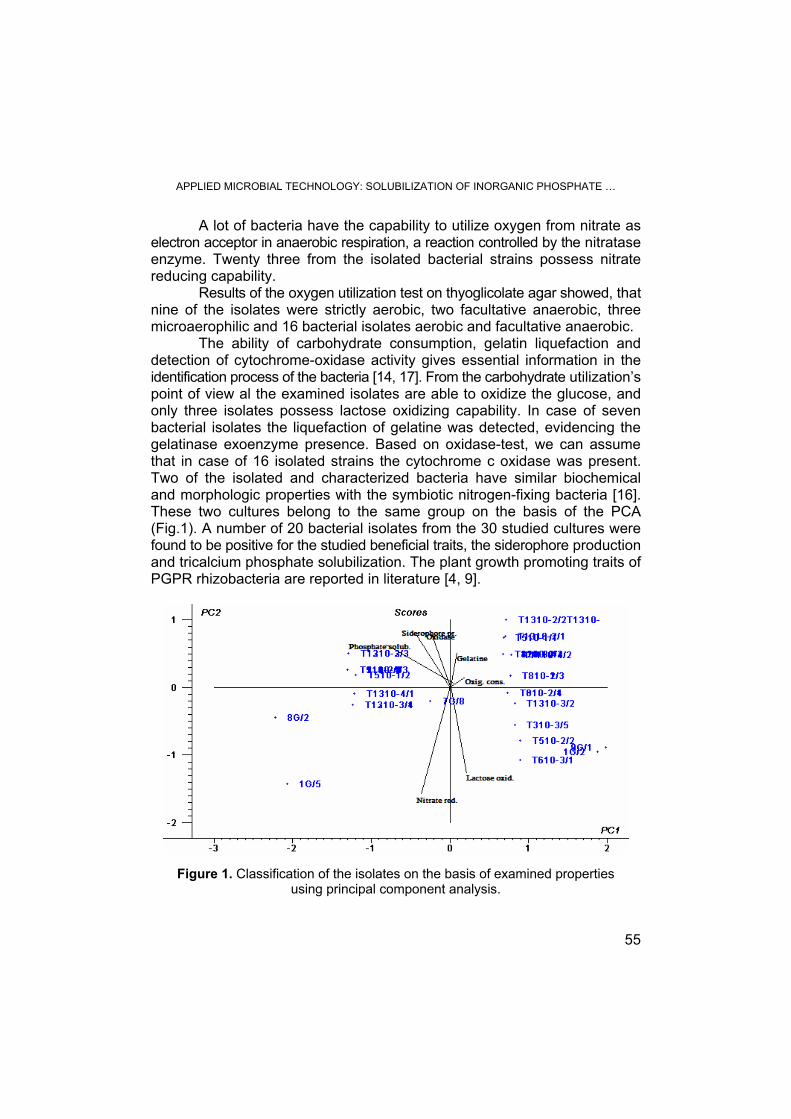
APPLIED MICROBIAL TECHNOLOGY: SOLUBILIZATION OF INORGANIC PHOSPHATE …
55
A lot of bacteria have the capability to utilize oxygen from nitrate as electron acceptor in anaerobic respiration, a reaction controlled by the nitratase enzyme. Twenty three from the isolated bacterial strains possess nitrate reducing capability.
Results of the oxygen utilization test on thyoglicolate agar showed, that nine of the isolates were strictly aerobic, two facultative anaerobic, three microaerophilic and 16 bacterial isolates aerobic and facultative anaerobic.
The ability of carbohydrate consumption, gelatin liquefaction and detection of cytochrome-oxidase activity gives essential information in the identification process of the bacteria [14, 17]. From the carbohydrate utilization’s point of view al the examined isolates are able to oxidize the glucose, and only three isolates possess lactose oxidizing capability. In case of seven bacterial isolates the liquefaction of gelatine was detected, evidencing the gelatinase exoenzyme presence. Based on oxidase-test, we can assume that in case of 16 isolated strains the cytochrome c oxidase was present. Two of the isolated and characterized bacteria have similar biochemical and morphologic properties with the symbiotic nitrogen-fixing bacteria [16]. These two cultures belong to the same group on the basis of the PCA (Fig.1). A number of 20 bacterial isolates from the 30 studied cultures were found to be positive for the studied beneficial traits, the siderophore production and tricalcium phosphate solubilization. The plant growth promoting traits of PGPR rhizobacteria are reported in literature [4, 9].
Figure 1. Classification of the isolates on the basis of examined properties using principal component analysis.

É. LASLO, É. GYÖRGY, G. MARA, É. TAMÁS, I. MÁTHÉ, B. ÁBRAHÁM, S. LÁNYI
56
Four isolates originated from the nodules of Trifolium medium L., Anthyllis vulneraria L. and from rhizospheric soil of Onobrychis montana DC. showed negative results for inorganic phosphate solubilization and siderophore production. Five strains from the cultures isolated from rhizospheric soil gave positive results for only one for the assayed plant- growth promoting properties. The 16S rDNA characterization was realized for 14 strains. The restriction patterns of 11 isolates for the two restriction enzymes are shown in Fig 2. and Fig 3.
Figure 2. Restriction patterns of the 16S rDNA region of selected strains after digestion
with Hae III (1: 9G/1, 2:T410-3/4, 3:T1310-4/1, 4:8G/2, 5:T1310-2/1, 6:T610-3/1, 7:7G/8, 8:1G/5, 9: T810-2/1, 10: T1210-3/4, 11:T510-2/1)
Figure 3. Restriction patterns of the 16S rDNA region of selected strains after digestion
with Taq I (1: 9G/1, 2:T410-3/4, 3:T1310-4/1, 4:8G/2, 5:T1310-2/1, 6:T610-3/1, 7:7G/8, 8:1G/5, 9: T810-2/1, 10: T1210-3/4, 11:T510-2/1)
M 1 2 3 4 5 6 7 8 9 10 11
M 1 2 3 4 5 6 7 8 9 10 11

APPLIED MICROBIAL TECHNOLOGY: SOLUBILIZATION OF INORGANIC PHOSPHATE …
57
On the basis of the cluster analysis (Fig.4.) of bacterial strains three different groups can be distinguished. The isolates are not identical but they show genetic similarity. Isolates originated from the rhizosphere of the same plant show low genetic similarity [16].
Figure 4. Genetic divergence of the isolated bacterial strains based
on 16S ribosomal DNA digestion fragments.
To identify the distinguished strains with the RFLP analysis a further sequence analysis of the 16S rDNA would be necessarily. CONCLUSIONS
On the basis of our results 2 isolates had similar characteristics with Rhizobium sp. isolated from the rhizosphere soil of Lathyrus transsilvanicus (Spreng.) Fritsch and Cytisus hirsutus L.
Siderophore-producing and inorganic-phosphate solubilizing bacteria are good candidates for plant growth promotion, especially in neutral to alkaline soils. A number of 20 bacterial isolates from the 30 cultures were
0 1.6 3.2 4.8 6.4 8 9.6 11.2 12.8 14.4-1
-0.9
-0.8
-0.7
-0.6
-0.5
-0.4
-0.3
-0.2
-0.1
0
Sim
ilarit
y
T121
0-3/
4
8G/2
T310
-3/4
7G/8
T810
-2/1
T131
0-2/
1
T131
0-4/
1
T410
-3/4
9G/1
T510
-2/1
T131
0-3/
1
1G/5
T131
0-3/
3
T610
-3/1

É. LASLO, É. GYÖRGY, G. MARA, É. TAMÁS, I. MÁTHÉ, B. ÁBRAHÁM, S. LÁNYI
58
found to be positive for the two beneficial traits as the siderophore production and tricalcium phosphate solubilization. The results show that rhizospheric phosphate utilizing and siderophore producing bacteria could be a promising source for plant growth promoting agent in agriculture, because can improve the nutrient availability. The16S rDNA characterization showed a great genetic diversity of our isolates. These may be an important source for the development of bacterial biofertilizers and decrease the amount of chemical fertilizers. EXPERIMENTAL SECTION Isolation of rhizobacteria
Bacteria were isolated from four leguminous plant roots nodule and from seven plant rhizosphere soil from Ciuc Mountain locations. Two of the cultures originate from Anthyllis vulneraria L., one from Trifolium pannonicum L., one from Trifolium medium L. nodules and five from Cytisus hirsutus L., three from Lathyrus transsilvanicus (Spreng.) Fritsch four from Trifolium montanum L., two from Onobrychis montana DC. ssp. transilvanica, three from Medicago lupulina L., one from Trifolium repens L., and three from Vicia sepium L. rhizosphere soil.
The nodules were disinfected to destroy the microbes on the surface of it in a 6% sodium hypochlorite solution, then washed in sterilized water and smashed in a sterile mortar, homogenized with 9 ml distilled water. From the homogenized extract that contains the rhizobia an amount of 0.1 ml was spread on the surface of yeast extract mannitol agar (YEM medium). The YEM medium composition: 10.00 g/l mannitol, 0.50 g/l K2HPO4, 0.20 g/l MgSO4⋅7H2O, 0.10 g/l NaCl, 1.00 g/l yeast extract, 0.20 g/l CaCl2 ⋅2H2O, 0.01 g/l FeCl3⋅ 6H2O, 20.00 g/l agar, 25.00 μg/ml bromothymol blue. The pH of the media is between 6.7–7.0.
From the soil samples serial dilutions were prepared, and a volume of 0.1 ml was spread on YEM medium. The inoculated Petri-dishes were incubated 48 hour at the temperature of 28 °C.
The isolates were maintained on YMA agar slants, with the following composition in distilled water: 10.0 g/l mannitol, 0.5 g/l K2HPO4, 0.2 g/l MgSO4⋅7H2O, 0.4 g/l yeast extract, 15.0 g/l agar. The strain designations are composed as follows: the numbers before the liters indicating the nodules (G) or after the number the rhizosphere soil samples (T) refer to the plant species: 1-Anthyllis vulneraria L., 3-Medicago lupulina L., 4-Trifolium repens, 5-Trifolium montanum L., 6-Onobrychis montana ssp. transilvanica DC., 7-Trifolium pannonicum L., 8-Trifolium alpestre L., 9-Trifolium medium L., 11-Vicia sepium L., 12-Lathyrus transsilvanicus (Spreng.) Fritsch, 13-Cytisus hirsutus L.. The other numbers refer to the isolation characteristics of the strain [10].
APPLIED MICROBIAL TECHNOLOGY: SOLUBILIZATION OF INORGANIC PHOSPHATE …
59
Biochemical characterization of rhizobacteria
Bacterial isolates were characterized biochemically following the lactose and glucose fermentation capability, oxidase test, nitrate reduction capability and evidencing of oxygen utilization by bacterial cultures on thioglycolate agar and morphologically by Gram’s reaction and spore formulation ability [10]. Siderophore production
Siderophore production was detected by the universal method of Schwyn and Neilands (1987). This assay is based on a competition for iron between the ferric complex of an indicator dye, chromeazurol S (CAS), and a chelator, or siderophore produced by microorganisms. The iron is removed from CAS by the siderophore, which apparently has a higher affinity for iron (III). The positive reaction results in a color change of CAS reagent (usually from blue to orange) [11]. Phosphate solubilization
Evaluation of tricalcium phosphate solubilization of isolated strains was assessed using Pikovskaya’s agar containing Ca3(PO4)2. Each bacterial culture was spot inoculated in the centre of the plate. After incubation for 48 hour at the temperature of 28 °C a clear zone around the colony indicate inorganic phosphate solubilization [13]. The isolated bacteria were classified on the basis of the examined characteristics with Principal Component Analysis (PCA). PCA is a multivariate statistical method where the data are transformed to a new coordinate system to reduce the dimensionality of a data set consisting of a large number of interrelated variables, while retaining as much as possible of the variation present in the data set [15]. Genotypic classification
Each strain was inoculated on YMA broth at 28°C and 150 rpm overnight. Bacterial total DNA was extracted using PROMEGA DNA isolation Kit according to manufacturer instructions. 16S rDNA amplification was carried out through PCR amplification having the following programme: 3 min 94 °C initial denaturation followed by 25 cycles of 30 s at 94 °C initial denaturation, 25 s at 50 °C annealing, 2 minutes at 72 °C, elongation, and 7 minute at 72 °C final elongation. The used primers were the following: 27f 5’ AGAGTTTGATCMTGGCTCAG3’ and 1492 r5’TACGGYTACCTTGTTAC GACTT3’. The obtained 16S rDNA fragments were further digested with Taq I and Hae III restriction enzymes [18]. The fragments were analyzed with agarose (1.5 %) gel electrophoresis in Tris-acetate-EDTA buffer containing 3 μl of

É. LASLO, É. GYÖRGY, G. MARA, É. TAMÁS, I. MÁTHÉ, B. ÁBRAHÁM, S. LÁNYI
60
ethidium bromide. The amplification patterns were observed with BioRad UV Transilluminator and documented with GelDocXR software. ACKNOWLEDGMENTS Authors would like to thank Ministry of Education, Research and Innovation for financing the present study by the National Plan for Research, Development and Innovation through which this study could be realized.
REFERENCES
1. B. Susana, M. Rosas, J.A. Rovera, Development in Plant and Soil Sciences 2007,
102, 125. 2. J. Sawyer, J. Creswell, Phosphorus Basics, 2000, 31, 182. 3. L. Raaska, L. Viikari, T. Mattila-Sandholm, Journal of Industrial Microbiology, 1993,
11, 181. 4. M. Chaiharn, S. Chunhaleuchanon, A. Kozo, S. Lumyong, K Science and Technology
Journal, 2008, 8, 1. 5. M. A. Whitelaw, Advances in Agronomy, 2000, 69, 99. 6. E. Nahas, Development in Plant and Soil Sciences 2007, 102,111. 7. H. Rodríguez, R. Fraga, Biotechnology Advances, 1999, 17, 319. 8. J. Neilands, The Journal of Biological Chemistry, 1995, 270, 45. 9. P. Illmer, F. Schinner, Soil Biology and Biochemistry, 1995, 27, 3. 10. S. Dunca, E. Nimiţan, O. Ailisiei, M. Ştefan, "Microbiologie aplicată", Tehnopress,
Iaşi, 2007. 11. M. Chaiharn, S. Lumyong, World Journal of Microbiology and Biotechnology,
2009, 25, 305. 12. Z. A. Siddiqui, "PGPR: Biocontrol and Biofertilization", Springer, Doordrecht,
2006, chapter 2. 13. M. Sridevi, K.V. Mallaiah and N.C.S. Yadav, Journal of Plant Sciences 2007, 2,
635. 14. H. Chung, M. Park, M. Madhaiyan, S. Seshadari, J. Song, Hyunsuk C. and T. Sa,
Soil Biology and Biochemistry, 2005, 10, 1970. 15. I.T. Jolliffe, Springer Series in Statistics, 2002, 2, 1. 16. H.H. Zahran, Journal of Biotechnology, 2001, 3, 143. 17. F. Ahmad, I. Ahmad, M.S. Khan, Microbiological Research, 2008, 2, 173. 18. G. Laguerre, P. Mavingui, M. Allard, M-P. Charnay, P. Louvrier, S-I. Mazurier, L.R.
Gois, N. Amarger, Applied and Environmental Microbiology, 1996, 6, 2029.

STUDIA UNIVERSITATIS BABEŞ-BOLYAI, CHEMIA, LIV, Sp.Iss. 2, 2009
BIOHYDROGEN PRODUCTION WITH PHOTOSYNTHETIC BACTERIA
ÉVA HARAI MOLNOS a, SZABOLCS SZILVESZTER a, BEÁTA ÁBRAHÁM b,
IOSIF NAGYa, SZABOLCS LÁNYI b, OVIDIU MUNTEANa
ABSTRACT. The hydrogen obtained through biological processes, using anaerobic or photosynthetic bacteria, is called biohydrogen and is considered to be the energy of future. In the presence of light, the photosynthetic bacteria are able to use organic compounds as carbon source while liberating hydrogen. The aim of our research is to study the photoheterotroph fermentation process and to optimize the parameters to obtain higher conversion rate.
Keywords: biohydrogen, photoheterotroph fermentation, organic acid, photo-
reactor, kinetic model INTRODUCTION
Since hydrogen, respectively biohydrogen is a clean source of energy, it is considered to be the „energy of future”. It has the highest energy content per mass (122 MJ/kg) [1], its combustion produces water, which is not detrimental to the environment. It is an energy carrier (a secondary source of energy), which is used to move, store and deliver energy in an easily usable form. Therefore, future energy technology will use hydrogen with an increasing trend in steady as well as unsteady combustion processes [2]. As part of this increasing trend, new processes need to be developed for cost efficient hydrogen production.
Biological hydrogen production technologies are still under development, they provide a wide range of approaches, including direct biophotolysis, indirect biophotolysis, photofermentation, dark fermentation or a combination of these processes [2, 3, 4]. Among these bioprocesses, the photofermentation has attracted our attention, because it has relatively higher substrate-to-hydrogen yields, it is possible to use renewable sources, like biomass and/or some food industry wastewaters which contain high amount of carbohydrates and organic acids, in addition, the process can potentially be driven by solar energy with minimal non-renewable energy inputs [5].
a Universitatea „Politehnica” din Bucureşti, Facultatea de Chimie Aplicată şi ŞtiinŃa Materialelor,
Str. Polizu, Nr. 1-7, RO-011061 Bucureşti, Romania, www.chim.pub.ro b Universitatea „Sapientia”, Facultatea de ŞtiinŃe Tehnice şi Sociale, Str. LibertăŃii, Nr. 1, RO-
530104 Miercurea Ciuc, Romania, www.csik.sapientia.ro

É. HARAI MOLNOS, S. SZILVESZTER, B. ÁBRAHÁM, I. NAGY, S. LÁNYI, O. MUNTEAN
62
Photofermentation is the fermentative conversion of organic substrate to biohydrogen manifested by a diverse group of photosynthetic bacteria. They produce hydrogen under anaerobic conditions with illumination either from reduced substrates such as organic acids (purple non-sulphur bacteria) or from reduced sulphur compounds (purple sulphur bacteria) [6].
Hydrogen-intensive research work has already been carried out on the advancement of biological processes, such as the development of genetically modified microorganisms, metabolic engineering, improvement of the reactor designs, use of different solid matrices for the immobilization of whole cells, biochemical assisted bioreactor, development of two-stage processes etc., for higher H2 production rates [2, 7]. The combination of dark fermentation and photofermentation seems to be an ideal biohydrogen producing model leading to the highest theoretical and practical H2 yield [1, 8]. However, in such systems, the photofermentation constitutes limiting step for the overall hydrogen producing process, because it has poor hydrogen production rate due primarily to slow growth of photosynthetic bacteria and low light conversion efficiency of photobioreactors [1].
Accordingly, the aim of the research is to unveil the photofermentative processes, and once understood, to find possibilities to enhance the biohydrogen production. In order to achieve this goal, cheap raw materials were chosen, for instance, wastewater with high organic content (in addition, the treatment of this wastewater proved to be difficult and expensive). As a first step in this quest, literature data and kinetic equations were used to predict the result of the hypothetic process. The central question to be answered is whether it is worth to carry on with this pathway or not? In this paper an empiric model is developed which describes the undergoing processes, with the aim of selecting the optimal operation parameters, necessary to design an improved photoreactor. This model makes possible to predict the kinetic behavior of bacterial growth, product formation and substrate consumption rate in given conditions.
RESULTS AND DISCUSSION
Kinetic model development for photofermentation
Kinetic models of the processes are based on material balances, which describe the behavior of the process components. In our case, these are substrates (S), biomass (X) and products (P).
Our goal is to study the photofermentative conversion of cheap raw materials with high amounts of different organic acids, like dairy wastewater, the effluent of fermentative processes realized by thermophil microorganisms, etc. Theoretically, the stoichiometric conversion of organic acids to hydrogen by photofermentative processes takes place according to the following hypothetical reactions: [9]
BIOHYDROGEN PRODUCTION WITH PHOTOSYNTHETIC BACTERIA
63
acetate: 2 4 2 2 2 2C H O + 2H O 4H + 2CO→
lactate: 3 6 3 2 2 2C H O + 3H O 6H + 3CO→
malate: 4 6 5 2 2 2C H O + 3H O 6H + 4CO→
The model described below is based on the model proposed by Gadhamshetty et al. [5]. They developed a model which describes the dynamics of cell growth and the hydrogen evolution taking into account the dependence of growth and hydrogen formation on substrate concentration and light intensity, as well as the inhibitory effects of substrate, biomass and light intensity. In our model, the inhibitory effect of substrate to bacterial cell growth and product formation is neglected, despite the fact that inhibitory levels of substrate concentration can result in decreased hydrogen production. However, we assume that the concentration of the substrate intended to be used will not reach inhibitory levels.
Starting from that the bacteria use the substrate present in the media and converts it to products while the biomass concentration increases, the biomass growth can be described as follows. Theoretically, the cell growth rate is expressed as
dXX
dtµ= ⋅
(1)
where X is the cell dry weight concentration (g/l) and µ is the specific growth rate (h-1), which might depend on substrate concentration and other factors. Several models provide an expression for µ [5, 10], the Monod expression being the most common:
max
S
S
K S
µµ ⋅=+ (2)
where µmax is the maximum specific growth rate (h-1), S is the substrate concentration (g/l) and KS is the half saturation constant (the concentration of the rate-limiting substrate at which the specific growth rate is equal to half the maximum growth rate).
But the growth rate of photosynthetic bacteria is not only a function of substrate concentration, but it depends on the light intensity, too. At the same time, the cell growth rate may be inhibited at higher biomass concentration, due to reduction of light intensity inside the reactor, self-shading, and limiting substrate diffusion [5, 10]. So, kinetic models relating the three aspects (equation 3.) can be of value in designing the process:

É. HARAI MOLNOS, S. SZILVESZTER, B. ÁBRAHÁM, I. NAGY, S. LÁNYI, O. MUNTEAN
64
max2
max
1S XI I
S X I
K S X K I K I
µµ ⋅= ⋅ − ⋅ + + + ⋅ (3)
where: Xmax is the maximum value of the cell concentration (that level at which the cell growth will cease) (g/l), KXI is the light saturation constant of cell formation (W/m2), I is the light intensity (W/m2) and KI is the light inhibition constant of cell formation (m2/W). The kinetic expression for product formation is based on that product formation depends on both growth rate and instantaneous biomass concentration in a linear manner (equation 4):
PX PX
dP dXY X
dt dtµ= ⋅ + ⋅
(4)
where P is the product concentration (g/l), YPX is the yield coefficient of product formation due to cell growth (g/g) and µPX is the specific formation rate of the product (h-1). The substrate type and its concentration are important factors in hydrogen evolution rates, additionally, higher light intensities can reduce the hydrogen production, but these inhibitory effects are already included in the cell growth rate expression. Therefore, in equation 5. is described only the inhibitory effect of the product to product formation (unlike the basic model):
max
1PX PX
dP dX PY X
dt dt Pµ
= ⋅ + ⋅ ⋅ − (5)
where Pmax is maximum product concentration (g/l). To describe the substrate consumption during photofermentation,
we have to take into consideration that substrate is necessary for bacterial cell growth, for product formation and for bacterial maintenance. Thus, the substrate consumption kinetics can be expressed by the equation:
1 1SX
XS PS
dS dX dPX
dt Y dt Y dtµ
= − ⋅ + ⋅ + ⋅
(6)
where YXS is the yield coefficient of cells on substrate (g/g), YPS is the yield coefficient of product formation due to cell growth (g/g) and µSX is substrate consumption rate constant (h-1). In contrast to the basic model [5], the model proposed by us neither take into account the auto-inhibition by substrate.

BIOHYDROGEN PRODUCTION WITH PHOTOSYNTHETIC BACTERIA
65
The majority of the studies on biohydrogen production from organic waste have focused on the use of photosynthetic bacteria Rhodobacter sp. Therefore, batch experimental resulting kinetic parameters were selected from the literature, which are necessary to simulate the photofermentative processes with the proposed model. The selected parameters are listed in table 1.
Table1. Typical values of kinetic parameters found in the literature for Rhodobacter sp. (batch cultivation using malate as substrate)
Kinetic parameter Used for simulation
References
Maximum growth rate, µmax 0.09-0.17 h-1 0.12 [5, 11] Yield coefficient of hydrogen formation due to bacterial growth, YPX
2.45-3.2 gH2/g malate 0.024
[5, 11]
Specific formation of the product, µPX 0.009 h-1 0.009 [5] Monod saturation constant, KS 0.0912 g/l 0.0912 [5] Light saturation constant of cell formation, KXI 15-22 W/m2 22 [5] Light inhibition constant of cell formation, KI 0.0001 m2/W 0.0001 [5] Yield coefficient of cells on substrate, YXS 3.7 g/g 3.7 [11] Yield coefficient of products on substrate, YPS 0.492 g/g 0.09 [11] Substrate consumption rate constant, µSX 0.091 h-1 0.091 [11] Maximal biomass concentration, Xmax 1-1.8 g/l 1.8 [5] Maximal product concentration, Pmax 0.25-0.4 g/l 0.4 [5, 11]
The efficiency of conversion of light energy into hydrogen in the
presence of an appropriate substrate and optimum cell growth conditions is a key factor for economic photofermentative biohydrogen production [5, 12]. The efficiency (η) of the conversion of light energy to hydrogen is determined as a ratio of the total energy value of the hydrogen that has been obtained to the total energy input to the photobioreactor by light radiation (equation 7.), and can be calculated using the equation 8. [13, 14]:
Combustion enthalpy of hydrogenEfficiency (%) = 100
Absorbed light energy⋅
(7)
2 233.61
100H HV
I A t
ρη
⋅ ⋅= ⋅
⋅ ⋅ (8)
where 33.61 is the energy density of hydrogen gas (W·h/g), ρH2 is the density of the produced hydrogen gas (g/l), VH2 is the volume of produced H2 (l), I is the light intensity (W/m2), A is the irradiated area (m2) and t is the duration of hydrogen production (h).

É. HARAI MOLNOS, S. SZILVESZTER, B. ÁBRAHÁM, I. NAGY, S. LÁNYI, O. MUNTEAN
66
Model simulation results
The three differential equations of the mathematical model were solved together using MATLAB software package (version 7.7.0.) to evaluate the biomass growth, product formation and substrate consumption rates. The initial conditions were the following: product concentration P = 0 g/l, biomass concentration X = 0.15 g/l, the value of substrate concentration varied between S = 2, 6 and 10 g/l and the value of light intensity varied too between 50 – 200 W/m2. For modeling and simulation the parameters listed in table 1. were used. The values of YPS and YPX used for simulation differ significantly from the ones reported in literature, since theoretically the yield coefficient of hydrogen on malate has to be YPS = 12/134 = 0.09 g/g malate. Hence, the yield coefficient of hydrogen formation due to bacterial growth: YPX = YPS/YXS = 0.09/3.7 = 0.024 g H2/g bacterium. The representative simulation results are presented in the figures below (Figure 1 – 4.).
(A) (B) (C)
Figure 1 . The variation of biomass (X), substrate (S) and product (P) concentrations at 50 W/m2 light intensity when the initial substrate concentration
was set to (A) 2 g/l, (B) 6 g/l, (C) 10 g/l
(A) (B) (C)
Figure 2 . The variation of biomass (X), substrate (S) and product (P) concentrations at 100 W/m2 light intensity when the initial substrate concentration
was set to (A) 2 g/l, (B) 6 g/l, (C) 10 g/l

BIOHYDROGEN PRODUCTION WITH PHOTOSYNTHETIC BACTERIA
67
(A) (B) (C)
Figure 3 . The variation of biomass (X), substrate (S) and product (P) concentrations at 150 W/m2 light intensity when the initial substrate concentration
was set to (A) 2 g/l, (B) 6 g/l, (C) 10 g/l
(A) (B) (C)
Figure 4 . The variation of biomass (X), substrate (S) and product (P) concentrations at 200 W/m2 light intensity when the initial substrate concentration
was set to (A) 2 g/l, (B) 6 g/l, (C) 10 g/l Taking into consideration the applied light intensity values, it can be observed that the obtained product concentration at 50 W/m2 intensity was the lowest in all cases. Additionally, at 100, 150 and 200 W/m2 light intensities, the obtained product concentration is nearly equal, so the most economical solution is to illuminate the bacterial strains with 100 W/m2 light intensity. The same conclusion can be drawn from the comparison of substrate consumption rates: for instance, an initial concentration of 10 g/l is consumed in 60 h at a light intensity of 200 W/m2, in 55 h at 150 W/m2 and in 50 h at 100 W/m2. The highest biohydrogen concentration (0.4 g/l) was obtained at 10 g/l initial substrate concentration after 60 h fermentation. In this case the efficiency of conversion of light energy to hydrogen (calculated with equation 8.) is 0.23%. For comparison, the efficiency of conversion of light energy to hydrogen in case of 6 g/l initial substrate concentration was calculated, too. In this case, the highest biohydrogen concentration (0.2 g/l) was achieved after 40 h fermentation, so the calculated conversion efficiency is 0.17%. These conversion efficiency rates are too low for cost-efficient reactor operation. Thus, the model simulation results could provide the answer for the introductory dilemma regarding the future of this pathway.

É. HARAI MOLNOS, S. SZILVESZTER, B. ÁBRAHÁM, I. NAGY, S. LÁNYI, O. MUNTEAN
68
CONCLUSIONS
The profitability of biohydrogen production processes with photosynthetic bacteria depends on the light to H2 conversion efficiency. A possibility to increase this efficiency is, for example, to improve the photoreactor and to use cheap raw materials, such as organic compound-rich wastewater. For this, comprehensive knowledge is necessary about bacterial growth kinetics, light requirements of photosynthetic bacteria, light penetration in the photoreactor, about the processes which take place in the photoreactor.
The proposed model and the simulation results proved to be a reliable tool for process analyzing and are useful for making preliminary calculations of experimental parameters for the biohydrogen production. Also, the developed model may be used to determine optimal operation conditions and to design an improved photobioreactor.
REFERENCES
1. C.-Y. Chen, G.D. Saratale, C.-M. Lee, P.-C. Chen, J.-S. Chang, International Journal of Hydrogen Energy, 2008, 33, 6886.
2. A. Demirbas, "Biohydrogen–For Future Engine Fuel Demands", Springer Verlag, London, 2009.
3. P.C. Hallenbeck, J.R. Benemann, International Journal of Hydrogen Energy, 2002, 27, 1185.
4. L. Gabrielyan, A. Trchounian, International Journal of Hydrogen Energy, 2009, 34, 2567.
5. V. Gadhamshetty, A. Sukumaran, N. Nirmalakhandan, M.T. Myint, International Journal of Hydrogen Energy, 2008, 33, 2138.
6. J. Rupprecht, B. Hankamer, J.H. Mussgnug, G.C. Dismukes, O. Kruse, Applied Microbiology and Biotechnology, 2006, 72, 442.
7. D. Das, N. Khanna, T.N. Veziroglu, Chemical Industry & Chemical Engineering Quarterly, 2008, 14, 57.
8. A.A. Tsygankov, Russian Journal of General Chemistry, 2007, 77, 685. 9. B. Uyar, M. Schumacher, J. Gebicki, M. Modigell, Bioprocess and Biosystems
Engineering, 2009, 32, 603. 10. H. Koku, I. Eroglu, U. Gündüz, M. Yücel, L. Türker, International Journal of
Hydrogen Energy, 2003, 28, 381. 11. I. Eroglu, K. Aslan, U. Gündüz, M. Yücel, L. Turker, Journal of Biotechnology,
1999, 70, 103. 12. M.J. Barbosa, J.M.S. Rocha, J. Tramper, R.H. Wijffels, Journal of Biotechnology,
2001, 85, 25. 13. E. Nakada, Y. Asada, T. Arai, J. Miyake, Journal of Fermentation and Bioengineering,
1995, 80, 53. 14. B. Uyar, I. Eroglu, M. Yücel, U. Gündüz, L. Türker, International Journal of Hydrogen
Energy, 2007, 32, 4670.

STUDIA UNIVERSITATIS BABEŞ-BOLYAI, CHEMIA, LIV, Sp.Iss. 2, 2009
ASYMMETRIC BIOTRANSFORMATIONS IN CONTINUOUS FLOW REACTORS
ZOLTÁN BOROSa, MARIANN SZIGETIa, ANNA TOMINa, PÉTER KOVÁCSb, LÁSZLÓ ÜRGEc, FERENC DARVASc, LÁSZLÓ POPPEa*
ABSTRACT. Asymmetric acetylations of prochiral diols 3a-d with isopropenyl acetate were investigated with different commercial and self prepared lipases. Continuous flow mode reactions were performed in small stainless steel packed-bed reactors which can precisely control temperature (-10-200 °C), pressure (0-150 bar) and flow rate (0.1-3.0 mL/min). The effect of the temperature and flow-rate on the conversion and enantiomer excess of the chiral monoesters was investigated. Keywords: lipase, continuous flow reactor, asymmetric biotransformation
INTRODUCTION
Biotechnology and biocatalysis are more and more applied to produce optically active intermediates of pharmaceuticals and fine chemicals [1]. Among the available biocatalysts, several characteristics make hydrolases useful for synthetic biotransformations [2, 3, 4, 5]. Besides hydrolysis, hydrolases can also catalyze several related reactions such as condensations (reversal of hydrolysis) and alcoholysis (a cleavage using an alcohol in place of water). Lipases proved to be highly versatile biocatalyst in stereoselective biotransformations such as kinetic resolutions [6], deracemisations and dynamic kinetic resolutions [7]. Examples for using asymmetric acetylations of prochiral diols to produce pharmaceutical intermediates has already been reported [8, 9, 10]. Enzymatic enantioselective processes typically was performed in batch mode [2, 6, 11, 12]. In a few work hydrolase catalyzed enantioselective processes were carried out in continuous flow systems [13, 14]. a Budapest University of Technology and Economics, Department of Organic Chemistry and
Technology, Műegyetem rkp. 3., H-1111 Budapest, Hungary, [email protected] b Chemical Research Center of the Hungarian Academy of Sciences, Institute of Biomolecular
Chemistry, Department of Synthetic Organic Chemistry, Pusztaszeri str. 59-67., H-1025 Budapest, Hungary, [email protected]
c ThalesNano Nanotechnology Inc., Graphisoft Park, Záhony str. 7., H-1031 Budapest, Hungary, [email protected]

Z. BOROS, M. SZIGETI, A. TOMIN, P. KOVÁCS, L. ÜRGE, F. DARVAS, L. POPPE
70
RESULTS AND DISCUSSION
In a previous work, the kinetic resolution of three racemic cyclic secondary alcohols 1-phenylethanol, 1-cyclohexylethanol and 1-phenyl-propane-2-ol were examined [15]. It was found that the productivity (r) of the lipase-catalyzed reactions was better in continuous flow reactors than in batch mode systems. On the other hand, the enantiomer selectivity (E) of the reactions were similar in the two reaction modes [15]. In the continuous flow reaction the pressure had no effect on the productivity (r) and selectivity (E). The productivity (r) increased monotonously with the temperature. More interestingly, the enantiomer selectivity (E) had a local maximum and a local minimum between 0 - 60 °C [15].
In this study, we intended to study the asymmetric acetylation catalyzed by lipases in continuous flow mode. For this purpose, we synthesized an isocyclic 3a and three heterocyclic 3b-d prochiral diols (Scheme 1). The asymmetric biotransformations of these prochiral diols 3a-d were examined by various lipases in batch mode. The target diols 3a-d were prepared by a Knoevenagel-condensation followed by reduction of the forming unsaturated esters 2a-d (Scheme 1).
Scheme 1
In the first step, the Knoevenagel-condensation between diethyl
malonate and the corresponding aldehydes 1a-d in toluene at reflux temperature using Dean & Stark trap for 6 h resulted in the corresponding esters 2a-d in

ASYMMETRIC BIOTRANSFORMATIONS IN CONTINUOUS FLOW REACTORS
71
good yields (78-84 %). The next step of the synthesis was more time-consuming. The reductions using sodium tetrahydridoborate needed 3 days to produce the diols 3a-d in good yields (65-80 %).
For selecting the proper enzymes for the continuous flow mode reaction, a selection of enzymes were screened in batch mode. Among the tested commercially available enzymes, the best enantiotope selectivity (Ee>93%) and conversion (c > 80%) were achieved with Lipase PS (lipase from Burkholderia cepacia, formerly Pseudomonas cepacia) and isopropenyl acetate as acylating agent in hexane-THF solution for all diols 3a-d (Scheme 1).
The lipase catalyzed acetylation of 2-benzylpropane-1,3-diol 3a is a typical asymmetric biotransformation (Figure 1). Because the minor enantiomer (S)-4a reacts faster in the second acetylation step due to the conserved preference of the enzyme towards its free hydroxyl group, the enantiomeric excess of the monoacetate (R)-4a can be influenced by the conversion to diacetate 5a. For synthesis of the enantiomerically pure (R)-monoacetate (R)-4a without formation of diacetate 5a a highly enantioselective enzyme is required.
Figure 1. Asymmetric acetylation of the prochiral 2-benzylpropane-1,3-diol 3a Next, the effect of temperature on the conversion of the prochiral
diol 3a to monoacetate (R)-4a in asymmetric acetylation was investigated in a continuous flow reactor filled with Lipase PS (Figure 2).

Z. BOROS, M. SZIGETI, A. TOMIN, P. KOVÁCS, L. ÜRGE, F. DARVAS, L. POPPE
72
Figure 2. Continuous flow system for the asymmetric acetylation of
2-benzylpropane-1,3-diol 3a
It was found that the conversion is significantly influenced by the temperature (Figure 3). At lower temperatures (a constant flow rate of 0,1 mL/ min) less diacetate 5a was formed besides the same amount of monoacetate 4a (~98 %). This imply increased enantiotope selectivity of the biocatalyst at lower temperature.
0
1
2
3
4
5
-5 0 5 10 15 20 25Temperature
[°C]
Com
posi
tion
3a, 5
a [%
]
0102030405060708090100
3a
5a4a
Com
position 4a [%
]
Figure 3. Products of the asymmetric acetylation of 2-benzylpropane-1,3-diol 3a at
different temperatures in Lipase PS-filled continuous flow reactor
Dependence of the effect of temperature on the enantiomeric excess in the asymmetric biotransformation of 2-benzylpropane-1,3-diol 3a in continuous flow system investigated with a sol-gel immobilized OcTMOS/TMOS/ Celite Lipase AK (lipase from Pseudomonas fluorescens; prepared by our research group), which has exhibited a good but not extremely high enantioselectivity. Instead of the expected monotonous decrease of the enantioselectivity with increasing temperature, the enantiomeric excess of the monoacetate (R)-4a had a maximum at approximately 40 °C (ee = 90 % at 0,1 mL/min; ee = 91 % at 0,2 mL/min) (Figure 4).

ASYMMETRIC BIOTRANSFORMATIONS IN CONTINUOUS FLOW REACTORS
73
010
20304050
607080
90100
25 30 35 40 45 50 55 60 65Temperature
[°C]
Enan
tiom
eric
exc
ess
[%]
Ee (0.1 ml/min)
Ee (0.2 ml/min)
Figure 3. Dependence of the enantiomeric excess of the forming (R)-4a in the asymmetric acetylation of 2-benzylproprane-1,3-diol 3a on the temperature at
different flow rates in sol-gel Lipase AK-filled continuous flow reactor CONCLUSION
Our results indicated that prochiral diols 3a-d can be effectively transformed to chiral monoacetates 4a-d by various enzymes. It was also demonstrated that continuous flow mode packed-bed reactors can be effectively used for asymmetric biotransformation of prochiral diol 3a. Investigating of the effect of the temperature for the conversion and the enantiotope selectivity in the lipase PS-catalyzed process indicated that the amount of diacetate 5a decreased with the temperature while the amount of the monoacetate 4a was constant. In the sol-gel Lipase AK-catalyzed process, the enantiomeric excess of (R)-4a had a maximum at about 40 °C within the investigated temperature range (30-60 °C). EXPERIMENTAL SECTION
Methods
GC analyses were carried out on ACME 6100 or Agilent 4890D instruments equipped with FID detector and Hydrodex-β-6-TBDAc column (50 m × 0.25 mm × 0.25 μm film with acetylated β-cyclodextrin; Macherey& Nagel) or Hydrodex-β-6-TBDM column (25 m × 0.25 mm × 0.25 μm film with heptakis-(2,3-di-O-methyl-6-O-t-butyldimethylsilyl)-β-cyclodextrine; Macherey&

Z. BOROS, M. SZIGETI, A. TOMIN, P. KOVÁCS, L. ÜRGE, F. DARVAS, L. POPPE
74
Nagel) using H2 carrier gas (injector: 250 °C, detector: 250 °C, head pressure: 10 psi, 50:1 split ratio). Optical rotations were determined on a Perkin Elmer 241 polarimeter. The continuous flow bioreactions were performed by X-CubeTM laboratory flow reactor (X-CubeTM—trademark of ThalesNano, Inc.; Ser. No.: 002/2006) equipped with enzyme filled CatCartTM columns (CatCartTM—registered trademark of ThalesNano Inc.: stainless steel (INOX 316 L); inner diameter, 4 mm; total length, 70 mm; packed length, 65 mm; inner volume, 0.816 mL).
Synthesis of the unsaturated diesters 2a-d
The corresponding aldehyde 1a-d (50 mmol), diethyl malonate (50 mmol, 8.01 g), piperidine (60 mmol, 5.11 g) and acetic acid (100 mg) were dissolved in toluene (100 mL) in a flask equipped with a Dean & Stark trap. Stirring at reflux for 6 h resulted in water (~1 mL) formation. The reaction mixture was washed with 5% HCl (30 mL), saturated NaHCO3 (30 mL) solution and brine (30 mL) and dried over sodium sulfate. The solvent was distilled off from the resulting solution by rotary evaporation. The residue was separated by chromatography on silica gel to give 2a-d in good yields (78-84 %).
Synthesis of the prochiral diols 3a-d
To a solution of the unsaturated ester 2a-d (20 mmol) in ethanol (100 mL), NaBH4 (100 mmol, 3.78 g) was portionwise added. The resulting mixture was stirred at room temperature for 3 days. After slow addition of acetic acid (100 mmol, 6.0 g), the ethanol was removed from the reaction mixture under reduced pressure. The residue was dissolved in ethyl acetate, washed with 5% HCl (20 mL), saturated NaHCO3 solution (20 mL) and brine (20 mL) and dried over sodium sulfate. The solvent was distilled off from the resulting solution by rotary evaporation. The residue was separated by chromatography on silica gel to yield the diols 3a-d in good yields (65-80 %).
Enantiotope selective acetylation of diols 3a-d in shake vials
To a solution of the prochiral diol 3a-d (20 mg) in hexane-THF-isopropenyl acetate 2:1:1 mixture (2 mL), the enzyme (20 mg) was added in a sealed amber glass vial and the resulting mixture was shaken (1000 rpm) at 25°C for 24h. The reactions were analyzed by GC and optical rotation measurements.
Enantiotope selective acetylation of diol 3a in continuous mode
The solution of prochiral diol 3a (10 mg mL-1) in hexane-THF-isopropenyl acetate 2:1:1 mixture was pumped through the enzyme-filled (Lipase PS or

ASYMMETRIC BIOTRANSFORMATIONS IN CONTINUOUS FLOW REACTORS
75
sol-gel Lipase AK) columns at different temperatures and flow rates without choking. At a run under certain conditions, samples were analyzed by TLC and GC at every 10 min between the start and 60 min. ACKNOWLEDGMENTS
This research work was supported by the Hungarian National Office for Research and Technology (NKFP-07-A2 FLOWREAC) and by the Hungarian National Science Foundation (OTKA T-048854).
REFERENCES 1. A.S. Bommarius, B.R. Riebel, “Biocatalysis”, Wiley-VCH, Weinheim, 2004. 2. U.T. Bornschauer, R.J. Kazlauskas, “Hydrolases in Organic Synthesis: Regio-
and Stereoselective Biotransformations”, Wiley-VCH, Weinheim, 2006. 3. R.J. Kazlauskas, A.N.E. Weissfloch, A.T. Rappaport, L.A. Cuccia, Journal of
Organic Chemistry, 1991, 56, 2656. 4. K. Burgess, L.D. Jennings, Journal of the American Chemical Society, 1991,
113, 6129. 5. F. Theil, Catalysis Today, 1994, 22, 517. 6. A. Ghanem, H.Y. Aboul-Enein, Chirality, 2005, 17, 1. 7. N.J. Turner, Current Opinion in Chemical Biology, 2004, 8, 114. 8. L. Banfi, G. Guanti, R. Riva, Tetrahedron: Asymmetry, 1999, 10, 3571. 9. T. Monteil, D. Danví, J. C. Plaquevent, L. Duhamel, P. Duhamel, C. Gros, J. C.
Schwartz, J. M. Lecomte, Synthetic Communications, 2001, 31, 211. 10. M. Kawasaki, N. Toyooka, Y. Matsui, A. Tanaka, M. Goto, H. Kakuda, S. Kawabata,
T. Kometani, Heterocycles, 2005, 65, 761. 11. K. Faber, “Biotransformations in Organic Chemistry”, Springer, Berlin, 2004. 12. L. Poppe, L. Novák, “Selective Biocatalysis: A Synthetic Approach”, VCH,
Weinheim-New York, 1992. 13. A. Liese, K. Seelbach, C. Wandrey, “Industrial Biotransformations”, Wiley-VCH:
Weinheim-New York, 2006. 14. R.N. Patel, A. Banerjee, L.J. Szarka, Journal of the American Oil Chemists’
Society, 1996, 73, 1363. 15. C. Csajági, G. Szatzker, E.R. Tőke, L. Ürge, F. Darvas, L. Poppe, Tetrahedron:
Asymmetry 2008, 19, 237.

STUDIA UNIVERSITATIS BABEŞ-BOLYAI, CHEMIA, LIV, Sp.Iss. 2, 2009
ENTRAPMENT OF LIPASES IN NOVEL SOL-GEL SYSTEMS
ANNA TOMINa, DIÁNA WEISERa, ZSÓFIA BATAa, LIVIA CORICIb, FERENC PÉTERb, LÁSZLÓ POPPEa,*
ABSTRACT. Lipases are the most widely used enzymes in synthetic organic chemistry. The search for efficient methods for immobilization of enzymes has emerged an important field of interest in order to increase their activity, stability and to facilitate their recovery because of the industrial application of lipases. In this study, the lipase immobilization by entrapment in sol-gel matrices was investigated to study the effect of enzymes, supports and enzyme/support ratios.
Keywords: lipase, sol-gel, biocatalysis, secondary alcohol, immobilization
INTRODUCTION
Lipases are amongst the most widely used enzymes in organic chemistry [1,2]. Recently, many biological materials such as enzymes [3,4], proteins [5], microbes [6], and mammalian and plant cells [7,8,9] have been immobilized into silica matrices prepared by the sol–gel method. Because the immobilization of biomolecules into organic–inorganic hybrid silica gels prepared by this method brings about an enhancement of activity, thermal and operational stabilities. Commercial applications of these immobilized biomolecules have been widely studied [10,11,12,13,14,15,16].
We report here on the entrapment of lipases in hydrophobic sol-gel materials, which results in the formation of highly active, stable and reusable heterogeneous biocatalysts.
RESULTS AND DISCUSSION In our recent study the sol-gel encapsulation of two different lipases
from Pseudomonas fluorescence (lipase AK) and Pseudomonas cepacia (lipase PS) combined with adsorption on a solid support were investigated.
a Budapest University of Technology and Economics, Department of Organic Chemistry and
Technology, Műegyetem rkp. 3., H-1111 Budapest, Hungary, * [email protected] b University Politehnica of Timisoara, Faculty of Industrial Chemistry and Environmental Engineering,
Department of Organic Chemistry and Technologies, Str. C. Telbisz 1, 300001 Timisoara, Romania, [email protected]

A. TOMIN, D. WEISER, Z. BATA, L. CORICI, F. PÉTER, L. POPPE
78
The high specific surface of the support leads to avoiding aggregation and resulting an increased stability and better thermal properties of the obtained biocatalysts. Native lipases and lipases immobilized by simple sol-gel entrapment were used as references. Moreover, the influence of the porosity of the supports (Celite 545 or Silica gel) and the enzyme/support ratio were also studied. The corresponding enzymes were immobilized using octyltriethoxy- (OcTEOS) and tetraethoxy (TEOS) silane precursors in 1:1 molar ratio. The model reaction was the kinetic resolution of 1-phenylethanol with vinyl acetate in hexan/THF 2:1 as solvent. The immobilization efficiency was characterized by several parameters measured at 24 h reaction time such as specific biocatalyst activity (Ub), specific enzyme activity (Ue), enantiomer selectivities (E) and enantiomeric excess (ee).
rac-1 (S)-1 (R)-2
lipasevinyl acetate
OH OH O
O
+
Figure 1. Lipase-catalyzed kinetic resolution of racemic 1-phenylethanol
Comparing the results of sol-gel entrapment and combined method, it is obvious that deposition of the enzymes on Celite or on silica gel resulted in increased specific enzyme activities. Analysis of the investigated parameters like enantioselectivities, conversions, specific biocatalyst and specific biocatalyst/enzyme activities indicated that the immobilized enzymes adsorbed previously on solid support were superior compared to the native enzyme or to the sol-gel immobilized enzyme. Because the enantiomeric excess (ee) values of the forming (R)-2 were >98 in all cases, ee of the acetates were not applied in the further comparisons.
By entrapment the lipases adsorbed on a large surface in a sol-gel matrix the diffusional limitations can be decreased leading to immobilized lipases with enhanced catalytic properties. The comparison of two silica based supports indicated that with Celite 545 (low porosity) the enzyme immobilization occurred only at the external surface of the support. Using chromatographic grade silica gel (high-porosity adsorbent) support, adsorption and gelation could also occur within the pores. Therefore − indicated by the acylation reaction of the racemic secondary alcohol rac-1 − enhanced specific enzyme activities were observed for both lipases by the combined sol-gel immobilization using silica gel support (Tables 1 and 2).

ENTRAPMENT OF LIPASES IN NOVEL SOL-GEL SYSTEMS
79
Table 1. Kinetic resolution of racemic 1-phenylethanol rac-1 by acylation with vinyl acetate using free and immobilized lipase AK as catalyst
a The enantiomer selectivity (E) was calculated from c and ee [17,18]. Due to sensitivity to experimental errors, E values calculated in the 100-200 range are reported as >100, values in the 200-500 range are reported as >200 and values calculated above 500 are given as »200.
b Free lipase AK, without sol-gel entrapment after 2 h reaction time. c Sol-gel immobilized lipase AK without support (S). The amount of enzyme were identical with the
applied enzyme at 1/5 molar ratio. d Sol-gel immobilized lipase AK without support (S). The amount of enzyme were identical with the
applied enzyme at 1/10 molar ratio.
Table 2. Kinetic resolution of racemic 1-phenylethanol rac-1 by acylation with vinyl acetate using free and immobilized lipase PS as catalyst
a The enantiomer selectivity (E) was calculated from c and ee [17,18]. Due to sensitivity to experimental errors, E values calculated in the 100-200 range are reported as >100, values in the 200-500 range are reported as >200 and values calculated above 500 are given as »200.
b Free lipase PS, without sol-gel entrapment after 2 h reaction time. c Sol-gel immobilized lipase PS without support (S). The amount of enzyme were identical with the
applied enzyme at 1/5 molar ratio. d Sol-gel immobilized lipase PS without support (S). The amount of enzyme were identical with the
applied enzyme at 1/10 molar ratio.
Biocatalyst E/S ratio
c (%)
Ea Ub (µmol min-1mg-1)
Ue (µmol min-1mg-1)
Free L AKb - 49 »200 34.4 34.4 without Sc - 51 >100 2.9 5.7 Celite 1/5 33 »200 1.9 12.2 Celitepread 1/5 31 »200 1.8 12.2 Silica 1/5 40 >200 2.3 14.0 Silicapread 1/5 49 »200 2.9 19.7 without Sd - 38 »200 2.2 8.2 Celite 1/10 45 »200 2.6 34.6 Celitepread 1/10 31 »200 1.8 24.2 Silica 1/10 37 »200 2.1 29.2 Silicapread 1/10 41 >200 2.4 32.3
Biocatalyst E/S ratiob
c (%)
Ea Ub (µmol min-1mg-1)
Ue (µmol min-1mg-1)
Free L PSb - 47 »200 32.5 32.5 without Sc - 36 »200 2.1 5.4 Celite 1/5 36 »200 2.0 29.0 Celitepread 1/5 15 »200 0.9 6.6 Silica 1/5 43 »200 2.5 20.2 Silicapread 1/5 32 »200 1.8 12.1 without Sd - 36 »200 2.0 10.8 Celite 1/10 14 >200 0.8 10.2 Celitepread 1/10 13 >200 0.7 12.4 Silica 1/10 32 »200 1.8 27.8 Silicapread 1/10 23 »200 1.3 19.4

A. TOMIN, D. WEISER, Z. BATA, L. CORICI, F. PÉTER, L. POPPE
80
In the case of lipase AK, the most efficient immobilization method was the preadsorption on silica gel followed by sol-gel immobilization (Table 1). In contrast, the best immobilization results were achieved with lipase PS without preadsorption on silica gel (Table 2).
Activities of the lipase biocatalysts were investigated at two different enzyme/support ratios by the esterification reaction of 1-phenylethanol rac-1. Interestingly, the conversions (c) and specific biocatalyst activities (Ub) depended only slightly from the amount of lipase AK in sol-gel immobilization. On the other hand, the specific enzyme activities (Ue) were much higher at 1/10 lipase AK/support ratio than at the 1/5 ratio (Table 1). Using lipase PS, the best results were obtained at 1/5 lipase/support ratio with silica gel or Celite without preadsorption (Table 2).
The stability and reusability of the lipase biocatalysts were also studied via storage and repeated use. The long-term stability of entrapped lipases proved to be excellent. There were no differences in the activity of the biocatalysts stored in refrigerator or at room temperature (1 day, 1 week, 1 month tests). In the repeated use tests, the catalysts were filtered off after 22h, then washed and reused. The activities in the next reaction remained almost constant as found previously with other sol-gel immobilized enzymes [19].
Table 3. Kinetic resolution of racemic 1-phenylethanol rac-1 by acylation with vinyl acetate using commercial sol-gel lipases at 24 h
a Commercial sol-gel entrapped lipases. b The enantiomer selectivity (E) was calculated from c and ee [17,18]. Due to sensitivity to experimental errors, E values calculated in the 100-200 range are reported as >100, values in the 200-500 range are reported as >200 and values calculated above 500 are given as »200.
Finally, commercial sol-gel lipases were tested (Table 3). The results
indicated that the sol-gel lipases with support prepared by our methods (Tables 1 and 2) showed higher enantioselectivities and conversions then the commercial sol-gel lipase AK or PS preparations.
CONCLUSION
A robust sol-gel entrapment method involving addition of silica based supports resulted in immobilized lipases with excellent activity and stability. The resulting biocatalysts are easy to reuse and thus they are valuable biocatalysts in various synthetic processes. A particular advantage of deposition enzymes on supports is the large catalytic surface resulting in enhanced biocatalysts. The high-porosity silica gel support proved to be superior over the less porous Celite in the sol-gel lipase immobilization.
Commercial available biocatalysta
c (%)
Eb Ub (µmol min-1mg-1)
Sol-gel Lipase AK 27 >100 5 Sol-gel Lipase AK on pumice 7 >200 1 Sol-gel Lipase PS 35 »200 6

ENTRAPMENT OF LIPASES IN NOVEL SOL-GEL SYSTEMS
81
EXPERIMENTAL SECTION Preadsorption of lipases on solid adsorbent The lipase powder (50 mg) was suspended in TRIS-HCl buffer (0.1 M,
pH 7.5, 780 μl) at 4 °C. After 10 min, the solid support (Celite® 545 or silica gel, 500 mg) was added to the solution and the resulting suspension was stirred for further 20 min. To the support-enzyme suspension acetone (10 mL, 10 mL min-1, -18 °C) was added dropwise. The resulting precipitate was filtered off and left air dried at room temperature for 12 hours. The preadsorbed enzyme was encapsulated in sol-gel matrices according to the procedure described below.
Immobilization of lipases in sol-gel systems In a 20 mL glass vial the solution of TRIS-HCl buffer (0.1 M, pH 7.5,
390 μL), polyethylene glycol (PEG, 4% w/v, 200 μL), aqueous sodium fluoride (NaF, 1M, 100 μL) and 2-propanol (IPA, 200 μL) were shaken at room temperature for 10 minutes. Then the silane precursors [780 μmol; octyltriethoxy-silane (OcTEOS) and tetraethoxy-silane (TEOS) precursors in 1:1 molar ratio] were added and the two phase mixture was shaken for further 5 minutes until gelation. The lipase powder (22.7 mg free or 250 mg preadsorbed lipase; see Tables 1 and 2) was added to the resulting gel at violently shaking. To complete the polymerization, the mixture was stirred for 12 hours at room temperature. To get the product as white powder, the following washing procedure was applied in all cases: 2-propanol (7 ml), distilled water (5 ml), 2-propanol (5 ml) and n-hexane (5 ml). The products were dried in a vacuum exicator for 5 hours then left air dried for further 24 hours. The immobilization efficiency was evaluated by calculating the percentage of the supplied protein encapsulated in the sol-gel.
Esterification assay To a solution of racemic 1-phenylethanol (rac-1, 50 mg, mmol) in
hexane - THF 2:1 (1 mL) and vinyl acetate (100 μL) enzyme (50 mg) was added and the mixture was shaken in a sealed glass vial at 1000 rpm at room temperature. For GC analyses, samples were taken directly from the reaction mixture (sample size: 10 μL, diluted with CH2Cl2 to 100 μL) at 2,4,8 and 24 h. Data on conversion and enantiomeric excess of the products [(R)-2 and (S)-1] with various enzymes are presented in Tables 1-3.
Gas chromatographic analysis of the products The esters were analyzed by gas chromatography on Acme 6100,
equipped with flame ionization detector and Hydrodex β-6TBDM [30 m × 0.25 mm × 0.25 μm film of heptakis-(2,3-di-O-methyl-6-O-t-butyldimethyl-

A. TOMIN, D. WEISER, Z. BATA, L. CORICI, F. PÉTER, L. POPPE
82
silyl)-β-cyclodextrin] column. The oven temperature, injector and detector temperatures were 135, 250 and 250 °C, respectively. Hydrogen was used as carrier gas at constant flow (1.8 mL/min).
ACKNOWLEDGMENTS
This research work was supported by the Hungarian National Office for Research and Technology (NKFP-07-A2 FLOWREAC) and by the Hungarian National Science Foundation (OTKA T-048854).
REFERENCES 1. R.D. Schmidt, R. Verger, Angewandte Chemie, International Edition, 1998, 37, 1608. 2. K.E. Jaeger, M.T. Reetz, Trends in Biotechnology, 1998, 16, 396. 3. O. Heichal-Segal, S. Rappoport, S. Braun, Biotechnology, 1995, 13, 798. 4. M.T. Reetz, Advanced Materials, 1997, 9, 943. 5. L.M. Ellerby, C.R. Nishida, F. Nishida, S.A. Yamanaka, B. Dunn, J.S. Valentin, J.I.
Zink, Science, 1992, 255, 1113. 6. K. Kawakami, S. Furukawa, Applied Biochemistry and Biotechnology, 1997, 67, 23. 7. E.J.A. Pope, Journal of Sol–Gel Science and Technology, 1997, 8, 635. 8. K.P. Peterson, C.M. Peterson, E.J.A. Pope, Proceedings of the Society for
Experimental Biology and Medicine, 1998, 218, 365. 9. R. Campostrini, G. Carturan, Journal of Sol–Gel Science and Technology, 1996, 7, 87. 10. D. Avnir, S. Braun, O. Lev, M. Ottolenghi, Chemistry of Materials, 1994, 6, 1605. 11. I. Gill, A. Ballesteros, Trends in Biotechnology, 2000, 18, 282. 12. F. Peter, L. Poppe, C. Kiss, E. Szocs-Biro, G. Preda, K. Zarcula, A. Olteanu,
Biocatalysis and Biotransformation, 2005, 23, 251. 13. P. Vidinha, V. Augusto, M. Almeida, I. Fonseca, A. Fidalgo, L. Ilharco, J.M.S. Cabral,
S. Barreiros, Journal of Biotechnology, 2006, 121, 23. 14. S. Furukawa, T. Ono, H. Ijima, K. Kawakami, Journal of Molecular Catalysis B:
Enzymatic, 2002, 17, 23. 15. C. Zarcula, C. Kiss, L. Corici, R. Croitoru, C. Csunderlink, F. Peter, Revista de
Chimie, 2009, 60, 922. 16. M.T. Reetz, P. Tielmann, W. Wiesenhöfer, W. Könen, A. Zonta, Advanced Synthesis
and Catalysis, 2003, 345, 717. 17. C.S. Chen, Y. Fujimoto, G. Girdaukas, C.J. Sih, Journal of the American Chemical
Society, 1982, 104, 7294. 18. J.L.L. Rakels, A.J.J. Straathof, J.J. Heijnen, Enzyme and Microbial Technology,
1993, 15, 1051. 19. M.T. Reetz, A. Zonta, Angewandte Chemie, International Edition, 1995, 34, 301.

STUDIA UNIVERSITATIS BABEŞ-BOLYAI, CHEMIA, LIV, Sp.Iss. 2, 2009
CONSTRUCTION OF AN EXPRESSION VECTOR FOR THE GITRL PROTEIN
KOVÁCS ERIKAa, PÁLFI MÁRIAa, MIKLÓSSY ILDIKÓb, SZILÁGYI LÁSZLÓb,c, ÁBRAHÁM BEÁTAb, LÁNYI SZABOLCSb
ABSTRACT. The glucocorticoid-induced tumor necrosis factor (TNF) receptor (GITR) is a member of the TNF receptor superfamily. GITR is expressed in T lymphocytes and in natural killer cells (NK). The receptor it is activated by its ligand, GITRL, which is a type II transmembrane protein. Human tumor cells express substantial levels of GITRL. GITRL attachment to its receptor blocks antitumoral effects of NK cells. As human tumor cells constitutively express GITRL, the presence of it can be used as a potential tumor marker. In this study the pETM50-hGITRL expression vector was constructed for heterologous expression of the ligand in a bacterial system.
Keywords: tumor necrosis factor, GITR, GITRL, expression vector, regulatory
T cell INTRODUCTION
The members of the tumor necrosis factor (TNF)/tumour necrosis factor receptor (TNFR) superfamily regulate diverse biological functions, including cell proliferation, differentiation and survival [1].
The glucocorticoid-induced TNF-related receptor (GITR) and its natural ligand (GITRL) belong to the TNF and TNF receptor superfamilies (TNFSF and TNFRSF) [2].
The GITR is a ~26-kDa type I transmembrane protein that displays 14–28% sequence identity to other members of the TNF receptor (TNFR) family and GITRL is a ~20-kDa type II transmembrane protein [3]. GITR is activated by its ligand [4].
In mouse GITR is expressed at low levels in resting CD4+ and CD8+ T cells and is rapidly up-regulated after activation [5]. GITR is constitutively expressed on CD4+CD25+ Tregs [6] and in particular has been implicated in
a Universitatea Politehnica din Bucureşti, Facultatea de Chimie Aplicată şi Ştiinţa Materialelor, Splaiul
Independenţei, Nr. 313, RO-060042 Bucureşti, Romania, [email protected] b Universitatea Sapientia din Cluj Napoca, Facultatea de Ştiinţe Tehnice şi Sociale, Catedra de Ştiinţe Tehnice şi ale Naturii, Piaţa Libertăţii, Nt. 1, RO-530104 Miercurea-Ciuc, Romania, [email protected]
c Eötvös Loránd University, Department of Biochemistry, Pázmány Péter Street 1/C, H-1117 Budapest, Hungary, [email protected]

KOVÁCS E., PÁLFI M., MIKLÓSSY I., SZILÁGYI L., ÁBRAHÁM B., LÁNYI S.
84
inhibiting the function of CD4+CD25+ Treg cells that control immune effector cells. Treating Treg cells with GITR ligand (GITR-L) abrogates the suppressive function of Treg cells in vitro [7]. The GITR-mediated costimulation by anti-GITR mAb or GITRL may put CD4+CD25+ T cells in an active state, this may result in abrogation of the suppressive function of Treg cells [1].
In humans the Treg-mediated suppression of effector T cell function is not inhibited by GITR stimulation [8], so the GITR/GITRL signaling pathway plays different roles in mice and humans. In mice, GITR has implicated in the development of autoimmune diseases, graft versus host disease and in the immune response against infectious pathogens [9].
The hGITRL (AITRL - activation inducible tumor necrosis factor receptor ligand, TL6) gene mapped to chromosome 1q23, near the gene for the TNF homolog Fas/CD95 ligand [3]. The hGITRL gene codes for a type II transmembrane protein comprised of 177 amino acids, including a short cytoplasmic region, a hydrophobic transmembrane domain and an extracellular domain with two potential glycosylation sites in the C-terminal region [10, 11]. The putative mouse GITRL is 51% identical to AITRL [12].
In mouse tumors models GITR activation by a single dose of an anti-GITR agonist Ab (DTA-1) induces a delay in tumor progression [13], at the same time injection of adenovirus expressing recombinant GITRL (membrane-bound GITR-ligand and a truncated secreted form of GITR-L) into growing B16 melanoma tumors cells potently inhibited tumor growth [14].
The hGITR (AITR - activation inducible tumor necrosis factor receptor) is expressed on human natural killer (NK) cells, these cells substantially contribute to cancer immunosurveillance and GITR triggering may impair NK cell effector function [15, 16]. Human GITRL is constitutively expressed on tumor cells and GITRL expression by tumor cells diminishes NK cell cytotoxicity, thus the tumor cells survive [16].
As human tumor cells constitutively express GITRL, its presence can be used as a potential tumor marker. Our aim is the construction of an expression vector, which makes possible the heterologous expression of the human GITRL in a bacterial system, in order to study its biochemical properties.
RESULTS AND DISCUSSION
Isolation of the hGITRL coding sequence
The hGITRL mRNA expression was detected at highest level in small intestine, ovary, testis and kidney [3]. Human umbilical vein endothelial cells (HUVECs) constitutively express hGITRL, and its expression is up-regulated after stimulation with lipopolysaccharide. Human GITRL mRNA was also found in brain and pancreas as well [10]. In our study we cloned the coding

CONSTRUCTION OF AN EXPRESSION VECTOR FOR THE GITRL PROTEIN
85
sequence of the extracellular region of hGITRL from human brain. We isolated total RNA from anatomically dissected human brain samples [17], first strand cDNA synthesis was performed with RevertAid H Minus First Strand cDNA Synthesis Kit (Fermentas) using random hexamer primers. The first strand of cDNA was directly used as template to amplify the coding region corresponding to amino acids 44-177 by PCR as described in Experimental Section.
Our preliminary results show that hGITRL is expressed in several different regions of brain, albeit at slightly different extent. The highest expression was observed in various region of the cortex. Figure 1 shows the results of the amplification of hGITRL coding sequence from 6 different human brain samples.
Figure 1. Results of the amplification of hGITRL coding sequence from human brain samples. Lane 1. 100 bp DNA ladder, Promega, Lanes 2,3,4. frontopolar
cortex, Lanes 6,7,8. cerebellar cortex, 5. no template control Construction of hGITRL expression plasmid
When expressed in E. coli proteins with disulfide bonds should be specifically directed to the periplasm because the cytoplasm is too reducing [18]. Periplasmic disulfide formation is regulated by members of the periplasmic disulfide isomerase (Dsb) protein system (DsbA, B, C, D) [19]. For this reason we choose pETM50 expression vector. The pETM50 plasmid was a generous gift of H.B. (EMBL Laboratories, Heidelberg). The multiple cloning site of pETM50 allows fusion of GITRL to the C terminus of DsbA protein containing a leader sequence for export. Using this vector the expressed protein accumulates in the periplasm, where the DsbA protein promotes the formation of correct disulfide bonds as well as the native structure of GITRL. To facilitate the purification of the recombinant proteins the vector contains a (His)6-tag between DsbA and the fusion partner. Following purification (His)6-tag and DsbA protein can be removed by tobacco etch virus (TEV) protease, since

KOVÁCS E., PÁLFI M., MIKLÓSSY I., SZILÁGYI L., ÁBRAHÁM B., LÁNYI S.
86
there is a cleavage site for this protease preceding the multiple coding site. The expression vector pETM50 as we obtained already contained a fusion protein: receptor of advanced glycation end products (RAGE). This was replaced by GITRL utilizing the unique NcoI and BamHI sites. The scheme for the construction and the map of our expression vector pETM50-GITRL is outlined in Figure 2.
Figure 2. Construction of expression vector pETM50-GITRL
The GITRL coding gene was inserted in the pETM50 vector by T4 ligase.
Figure 3 shows the results of the ligation reaction. The ligation mixture contains the digested GITRL coding sequence and the fragment of the expression vector digested by the same restriction enzymes (NcoI and BamHI).
For propagation of the recombinant vector with the correct conformation, the ligation reaction was transformed in chemically competent Escherichia coli TOP10F’ cells and was selected on the basis of kanamycin resistance. The plate lig2 and lig3 contains the control reaction mix. Ligation mix in lig2 contained only the linearized plasmid (large fragment), lig3 only the GITRL coding sequence (small fragment).
Figure 3. Results of the ligation
Ligation mix in lig1 contained both large and small fragment while in lig2 contained only the large fragment, lig3 only the small fragment
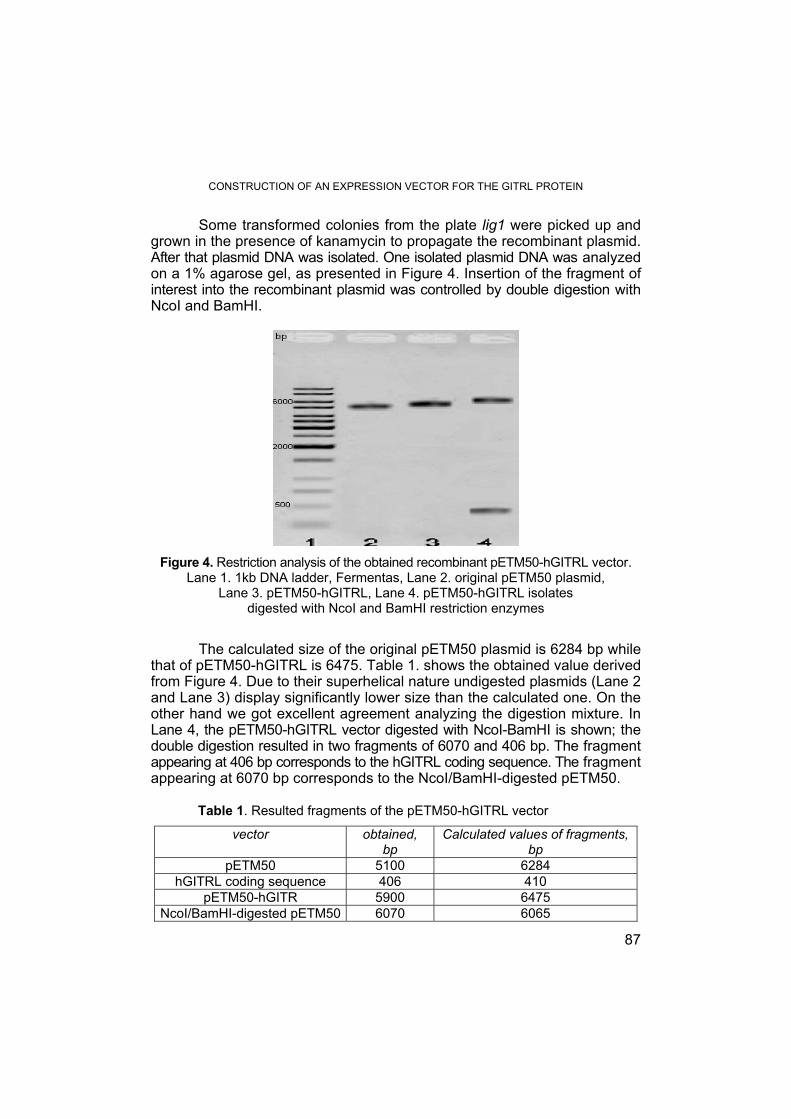
CONSTRUCTION OF AN EXPRESSION VECTOR FOR THE GITRL PROTEIN
87
Some transformed colonies from the plate lig1 were picked up and grown in the presence of kanamycin to propagate the recombinant plasmid. After that plasmid DNA was isolated. One isolated plasmid DNA was analyzed on a 1% agarose gel, as presented in Figure 4. Insertion of the fragment of interest into the recombinant plasmid was controlled by double digestion with NcoI and BamHI.
Figure 4. Restriction analysis of the obtained recombinant pETM50-hGITRL vector.
Lane 1. 1kb DNA ladder, Fermentas, Lane 2. original pETM50 plasmid, Lane 3. pETM50-hGITRL, Lane 4. pETM50-hGITRL isolates
digested with NcoI and BamHI restriction enzymes
The calculated size of the original pETM50 plasmid is 6284 bp while that of pETM50-hGITRL is 6475. Table 1. shows the obtained value derived from Figure 4. Due to their superhelical nature undigested plasmids (Lane 2 and Lane 3) display significantly lower size than the calculated one. On the other hand we got excellent agreement analyzing the digestion mixture. In Lane 4, the pETM50-hGITRL vector digested with NcoI-BamHI is shown; the double digestion resulted in two fragments of 6070 and 406 bp. The fragment appearing at 406 bp corresponds to the hGITRL coding sequence. The fragment appearing at 6070 bp corresponds to the NcoI/BamHI-digested pETM50.
Table 1. Resulted fragments of the pETM50-hGITRL vector
vector obtained, bp
Calculated values of fragments, bp
pETM50 5100 6284 hGITRL coding sequence 406 410
pETM50-hGITR 5900 6475 NcoI/BamHI-digested pETM50 6070 6065

KOVÁCS E., PÁLFI M., MIKLÓSSY I., SZILÁGYI L., ÁBRAHÁM B., LÁNYI S.
88
Besides restriction analysis the success of cloning was verified by automated dideoxy sequencing (ABI Prism) using the Big Dye Terminator 3.0 Kit utilizing the T7 termination sequence in the vector (Fig. 2). The obtained sequence was identical to the published one (NCBI Reference Sequence: NM_005092.3), except at position 372 where a T→C mutation was found. This mutation has already been described as an allelic variant. CONCLUSION
The isolation of hGITRL coding sequence from brain and construction of the recombinant pETM50-hGITRL vector was completed successfully. The restriction analysis of the isolated vector gave results that confirm the calculated lengths of the restriction fragments.
Although in previous studies different expression vectors were constructed for the GITRL protein [6, 20, 21], but employment of these plasmids for the expression of GITRL in bacterial system resulted in formation of insoluble inclusion bodies. Our construct allows periplasmic expression of hGITRL. The periplasmic secretion and the putative chaperone action of the fusion partner DsbA might promote the correct folding of hGITRL.
Our aim for the future is realization of the protein expression in E. coli BL21(DE3) Star cells and purification of the protein. During this study it is important to find the optimal conditions which provide the expression of the protein in appropriate quantity and quality. Once purified the protein, an antibody will be prepared which can be used for tumor detection.
EXPERIMENTAL SECTION Isolation of the hGITRL coding sequence
Isolation of total RNA from human brain and the synthesis of cDNA is described elsewhere [17]. The putative extracellular portion of hGITRL (amino acid positions 44-177) was amplified by the polymerase chain reaction (PCR) using the Corbett Research Thermocycler (Cornett CG1-96) system. The primers were designed with OligoExplorer 1.2 program and were obtained from Eurogentec. An NcoI site was added to the 5’ end of the forward primer and a BamHI site was added tot the 3’ end of the reverse primer. Correspondingly, the sequence of the forward primer was 5’-cggccATGGCTAAGTTTGGACCATTACC-3’, and that of the reverse primer was 5’-gcggatcCTACATGTGCTGAAGGGAATGAGG-3’.
The amplification procedure for PCR was as follows: an initial denaturation at 95oC for 2 minutes, followed by 30 cycles of amplification (95oC for 30 sec; 55oC for 45 sec; 74oC for 2 min), a final extension at 72oC

CONSTRUCTION OF AN EXPRESSION VECTOR FOR THE GITRL PROTEIN
89
for 5 min and a subsequent incubation at 4oC. The amplified product (excepted size 406 bp) for hGITRL was separated by 1% agarose gel electrophoresis in TAE buffer with ethidium bromide staining and visualization by GelDoc System from BioRad.
Construction of hGITRL expression plasmid
For cloning of hGITRL gene was used the pETM50 plasmid. The PCR product was digested by NcoI and BamHI restriction enzymes
and the digestion mixture was separated on a preparative 1% agarose gel, and the 406 bp fragment containing the coding sequence was excised and isolated by the MiniElute Gel Extraction Kit (Qiagen), according to the instructions the manufacturer. The isolated fragment was obtained in 50 µl of TE buffer.
For the preparation of the large fragment, the pETM50 plasmid was digested by 10 U NcoI and 10 U of BamHI, in 1x Red Buffer (Fermentas) in a total volume of 60 µl for 4 hours at 37oC; the large fragment was obtained as described above in 30 µl of TE buffer. The purifity of large and small fragment isolates was verified by gel electrophoresis.
The ligation reaction was set up 20 µl total volume, containing 14 µl of NcoI/BamHI-digested PCR product small fragment, 2 µl of pETM50 large fragment and 2 µl T4 ligase (Invitrogen) in 1x Ligation Buffer (Invitrogen) at 25oC for 1 hour, together with two control ligations, one without the large fragment and one without the small fragment.
The ligation and the control mixtures were transformed into 100 µl of chemically competent Escherichia coli Top10F’ cells (Invitrogen) and plated on LB medium with kanamycin. 4 transformed colonies were picked up and grown overnight (12 hours) in 5 ml LB with kanamycin, at 37oC and 250 rpm. Plasmid DNA was isolated and purified by the Plasmid Miniprep Kit (Quiagen), according to the instructions of the manufacturer.
DNA sequencing reactions were performed in 20 μl containing 4 μl Ready Reaction Premix (BigDye® Terminator v3.1), 2 μl BigDye Sequencing Buffer, 6 pmole T7 ter primer and 300 ng plasmid. Thermal cycling was performed according to the instruction of the manufacturer. Capillary electrophoresis of the samples was performed by Biomi Ltd. (Gödöllő, Hungary). ACKNOWLEDGMENTS
This study was supported by the Department of Technical Sciences, University of Sapientia and the Department of Biochemistry, Eötvös Loránd University.
KOVÁCS E., PÁLFI M., MIKLÓSSY I., SZILÁGYI L., ÁBRAHÁM B., LÁNYI S.
90
REFERENCES
1. F. Kanamaru, P. Youngnak, M. Hashiguchi, T. Nishioka, T. Takahashi, S. Sakaguchi,
I. Ishikawa, M. Azuma, The Journal of Immunology, 2004, 172, 7306. 2. R.M. Locksley, N. Killeen, M.J. Lenardo, Cell, 2001, 104, 487. 3. A.L. Gurney, S.A. Marsters, R.M. Huang, R.M. Pitti, D.T. Mark, D.T. Baldwin, A.M.
Gray, A.D. Dowd, A.D. Brush, A.D. Heldens, A.D. Schow, A.D. Goddard, W.I. Wood, K.P. Baker, P.J. Godowski, A. Ashkenazi, Current biology, 1999, 9, 215.
4. Z. Zhou, Y. Tone, X. Song, K. Furuuchi, J.D. Lear, H. Waldmann, M. Tone, M.I. Greene, R. Murali, Proceedings of the National Academy of Sciences of the United States of America, 2008, 105, 641.
5. G.L. Stephens, R.S. Mchugh, M.J. Whitters, D.A. Young, D. Luxenberg, B.M. Carreno, M. Collins, E.M. Shevach, The Journal of Immunology, 2004, 173, 5008.
6. K. Chattopadhyay, U.A. Ramagopal, A. Mukhopadhaya, V.N. Malashkevich, T.P. DiLorenzo, M. Brenowitz, S.G. Nathenson, S.C. Almo, Proceedings of the National Academy of Sciences of the United States of America, 2007, 104, 19452.
7. M. Tone, Y. Tone, E. Adams, S.F. Yates, M.R. Frewin, S.P. Cobbold, H. Waldmann, Proceedings of the National Academy of Sciences of the United States of America, 2003, 100, 15059.
8. M.K. Levings, R. Sangregorio, C. Sartirana, A.L. Moschin, M. Battaglia, P.C. Orban, M.G. Roncarolo, The Journal of Experimental Medicine, 2002, 196, 1335.
9. T. Baessler, M. Krusch, B.J. Schmiedel, M. Kloss, K.M. Baltz, A. Wacker, H.M. Schmetzer, H.R. Salih, Cancer Research, 2009, 69, 1037.
10. B. Kwon, K.-Y. Yu, J. Ni, G.-L. Yu, I.-K. Jang, Y.-J. Kim, L. Xing, D. Liu, S.-X. Wang, B.S. Kwon, The Journal of Biological Chemistry, 1999, 274, 6056.
11. B. Nardelli, L. Zaritskaya, W. McAuliffe, Y. Ni, C. Lincoln, Y.H. Cho, C.E. Birse, W. Halpern, S. Ullrich, P.A. Moore, Endocrinology, 2006, 147, 70.
12. J.D. Kim, B.K. Choi, J.S. Bae, U.H. Lee, I.S. Han, H.W. Lee, B.S. Youn, D.S. Vinay, B.S. Kwon, Genes and Immunity, 2003, 4, 564.
13. T. Ramirez-Montagut, A. Chow, D. Hirschhorn-Cymerman, T.H. Terwey, A.A. Kochman, S. Lu, R.C. Miles, S. Sakaguchi, A.N. Houghton, M.R. M. van den Brink, The Journal of Immunology, 2006, 176, 6434.
14. B. Calmels, S. Paul, N. Futin, C. Ledoux, F. Stoeckel, B. Acres, Cancer Gene Therapy, 2005, 12, 198.
15. B. Liu, Z. Li, S.P. Mahesh, S. Pantanelli, F.S. Hwang, W.O. Siu, R.B. Nussenblatt, The Journal of Biological Chemistry, 2008, 283, 8202.
16. K.M. Baltz, M. Krusch, A. Bringmann, P. Brossart, F. Mayer, M. Kloss, T. Baessler, I. Kumbier, A. Peterfi, S. Kupka, S. Kroeber, D. Menzel, M.P. Radsak, H.G. Rammensee, H.R. Salih, The Journal of the Federation of American Societies for Experimental Biology, 2007, 21, 2442.
17. J. Tóth, E. Siklódi, P. Medveczky, K. Gallatz, P. Németh, L. Szilágyi, L. Gráf, M. Palkovits, Neurochemical Research, 2007, 32, 1423.

CONSTRUCTION OF AN EXPRESSION VECTOR FOR THE GITRL PROTEIN
91
18. K. Terpe, Applied Microbiology and Biotechnology, 2006, 72, 211. 19. A. Marco, Microbial Cell Factories, 2009, 8. 20. Y. Jiao, F. Zheng, X. Li, B. Wang, S. Guo, Chinese Journal of Biotechnology, 2009,
25, 708. 21. B. Nardelli, L. Zaritskaya, W. McAuliffe, Y. Ni, C. Lincoln, Y.H. Cho, C.E. Birse,
W. Halpern, S. Ullrich, P.A. Moore, Endocrinology, 2005, 147, 70.


STUDIA UNIVERSITATIS BABEŞ-BOLYAI, CHEMIA, LIV, Sp.Iss. 2, 2009
TEMPERATURE DEPENDENCE OF ENANTIOMER SEPARATION PARAMETERS BY GAS-CHROMATOGRAFIC AND
SUPERCRITICAL FLUID CHROMATOGRAPHIC METHODS *
BÉLA TİKÉSa,**, ZOLTÁN JUVANCZ b, ROBERT IVÁNYI c, SZENDE VANCEA a, GABRIELLA DONÁTH-NAGY a,
VOLKER SCHURIG d, ANCA-GABRIELA CÂRJE a
ABSTRACT. Although the temperature is a decisive factor of the separation methods, its systematic study requires solvation of numerous problems. The present results frequently are contradictory. In this paper is discussed in detail the temperature dependence of enantiomer separation by GC and SFC methods of some chiral compounds having essentially different chemical structures, are calculated and interpreted characteristic thermodynamic parameters of the processes, especially the differences of the normal (standard) free enthalpy, enthalpy and entropy changes, ∆BA∆G, ∆BA∆H and ∆BA∆S. Keywords: separation methods, temperature effect, thermodynamic parameters
INTRODUCTION
The temperature dependence of selectivity can be studied by following idea: the partition of a given component i between two phases (1 and 2) suppose the equality of the component’s chemical potential in the two phases. It has to be mentioned that the partition phenomenon is considered being a general equilibrium, not only a particular one between two liquid phases.
µi1 = µi2
so:
( )i
01i
02i
2i
1i KRT
expCC
=
µ−µ=
* This paper was presented at the 15th International Conference on Chemistry, EMT, Tg. Mures,
November 12-15, 2009 a University of Medicine and Pharmacy, Tg. Mureş, Physical Chemistry Laboratory, Romania,
** [email protected] b Dep. of Environmental Engineering, Tech. Polytechnical Institution, Budapest, Hungary c Cyclolab Cyclodextrin R & D. Laboratory Ltd., Budapest, Hungary d University of Tübingen, Institute of Organic Chemistry, Germany

B. TİKÉS, Z. JUVANCZ, R. IVÁNYI, SZ. VANCEA, G. DONÁTH-NAGY, V. SCHURIG, A.-G. CÂRJE
94
For simplicity suppose that the ratio of activities can be expressed as the concentrations’ ratio, which is the partition coefficient of the given component. In the other hand, the selectivity factor of two components (A and B) – i.e. the degree of their separation – can be expressed as follows:
A'R
B'R
'A
'B
A
B
)t(
)t(
k
kKK
===α
where k’A and k’B, (t’R)A and (t’R)B are the corresponding capacity factors and reduced retention times. Therefore:
RS
RTH
RTG
RT)(
KK
lnln0
BA0
BA0
BA0BA
A
B ∆∆+
∆∆−=
∆∆−=
µ∆∆−==α
or: RT
H0BA
e.Const∆∆
−=α
which can be considered as a special case of the Gibbs-Helmholtz equation:
2
0
TH
TT∆−=
µ∆∂∂
In case of chiral separation the R and S indexes can be used instead of A and B. Sometimes the entropic factor may be the dominant one in the steric mechanism of the separation, so the separation will not depend much on the temperature. The temperature dependence is reflected by the enthalpic factor, which is shows the interactions between the solute and the phases. Chromatography deals at the same time with several interactions (adsorption, dissolution, thermal effects), which depend differently on the temperature. ∆G0, ∆H0 and ∆S0 represent the standard free energy, enthalpy and entropy changes of component transition between the mobile and stationary phases [1]. The relative selectivity (∆α/α) is often used as well, which is:
∆∆=
αα∆
RT2G
sh20
BA
If the selectivity factors do not differ very much from each other, the above relation can be written:
RT2G0
BA ∆∆=
αα∆
This term emphasizes again that the severability of components increases with the difference between the free energy changes. Based on this fact the temperature dependence of selectivity factor can be discussed.

TEMPERATURE DEPENDENCE OF ENANTIOMER SEPARATION PARAMETERS …
95
So, the logarithm of selectivity (lnα) should depend linearly on the inverse of temperature (1/T), in case of only one separation mechanism plays a decisive role. Considering the (lnα, 1/T) regression equations’ coefficients – besides the equilibrium constants’ ratio – the differences of standard free energy, enthalpy and entropy changes (∆BA∆G, ∆BA∆H and ∆BA∆S) of the separation mechanism (adsorption, dissolution, evaporation) can be determined in case of given enantiomers. Obviously the determinations would be more precise if – considering the Kirchoff law – the temperature dependence of enthalpy change would have been considered. In this paper the temperature dependence of chiral separation selectivity [2] in case of three compounds with totally different chemical structure was studied. The three compounds were: 1. Glutethimide (synonyms: 2-ethyl-2-phenylglutarimide, or 3-ethyl-3-phenyl-2,6-pyperidinedione, or alpha-ethyl-alpha-phenyl glutarimide) is a sedative with a barbiturate-like effect [3,4]. It has been proved that it has toxic side effects like hallucinations, muscle contractions, fever.
NH
OO
CH3
2. Methyl ester of 2-(2,4-dichloro-phenyl)propionic acid (2,4-DPM). The chloro-derivatives of phenoxy-acids, among them 2,4-DPM are well known pesticides, but also environmental pollutants with long effect [5]. They are polar compounds, with low volatility. Their strong adsorption on the stationary phases makes the gas-chromatographic separation difficult. A solution of this problem is their derivatization to methyl esters.
3. Trans-stilbene-oxyde (TSO) (Synonyms: 1,2-diphenyl-ethylene-oxyde, α,α’-diphenyl-epoxyde) is a strong-effect inductor of epoxy-hydratase enzyme, and also has proestrogene effect [6]. Its chiral enantiomers have been separated by preparative HPLC methods. It is a good model compound because of its rigid structure and affinity to π-π and p-π interactions.

B. TİKÉS, Z. JUVANCZ, R. IVÁNYI, SZ. VANCEA, G. DONÁTH-NAGY, V. SCHURIG, A.-G. CÂRJE
96
O H
PhH
Ph
RESULTS AND DISCUSSION
In the this chapter will be presented the most significant experimental data and results obtained by different separation methods for some practically important coumpounds. Their analysis were performed on the basis of the theoretical considerations discussed. The statistical evaluation of experimental data shows that the chromatographic method’s selectivity linearly decreases with the increase of temperature. The representative curves are running slightly concave which is in concordance with the exponential nature of the theoretical context. From the same law was to be expected that the (lnα, 1/T) are linear correlations. The calculated regression equation linearity really proved to be excellent, which confirms assumptions are correct.
Table 1. Temperature dependence of selectivity (linear regression)
Method GC SFC Parameters N R SD N R SD
5 - 0,993 0,0030 7 - 0,992 0,0034 α, T oC α = – (1,40 ± 0,09)10-3(OC) t +
(1,312 ± 0,017) α = – (1,15 ± 0,07)10-3 t(OC) + (1,186 ± 0,005)
5 0,996 0,0021 7 0,996 0,0024 Glutethimide
lnα, 1/T K-1 ln α = (0,272 ± 0,014) 103(1/T) - (0,542 ± 0,031)
ln α = ( 0,130 ± 0,005 ) 1031/T - ( 0,281 ± 0,015 )
5 - 0,976 0,0044 4 - 0,996 0,0007 α, T oC α = – (1,07 ± 0,14)10-3 t(OC) +
(1,210 ± 0,021) α = – (0,540 ± 0,030)10-3 t(OC) + (1,0739 ± 0,0019)
5 0,980 0,0037 4 0,997 0,0006 DPM
lnα, 1/T K-1 ln α = (0,183 ± 0,021) .103(1/T) - (0,384 ± 0,050)
ln α = (0,059 ± 0,003) 103(1/T) - (0,137 ± 0,010)
7 - 0,986 0,0043 α, T oC α = – (2,00 ± 0,08).10-3 t (OC) +
(1,213 ± 0,013)
7 0,990 0,0034 TSO MMBC 5 SE-54
lnα, 1/T K-1 ln α = (0,193 ± 0,012)103 (1/T) – (0,408 ± 0,028)
6 - 0,982 0,0039 α, T oC α = – (1,00 ± 0,09).10-3 t (ºC)
+ (1,264 ± 0,015)
6 0,994 0,0028
TSO MMBC 10 OV-1701
lnα, 1/T K-1 α = (0,228 ± 0,012)103 1/T – (0,465 ± 0,028)

TEMPERATURE DEPENDENCE OF ENANTIOMER SEPARATION PARAMETERS …
97
Table 2. Calculated thermodynamic parameters
Glutethimide DPM TSO- MMBC 5 SE-54
TSO- MMBC 10 OV-1701
GC SFC GC SFC GC GC
A = ∆BA∆S0/R 0,542 0,281 0,384 0,137 0,408 0,465 ∆BA∆S0(J/mol K) 4,506 2,33 3,20 1,139 3,39 3,86 B = ∆BA ∆H0/R 272 130 183 59 408 228 ∆BA∆H0 (kJ/mol) 2,269 1,0808 1,52 0,49 1,60 1,89
∆BA∆G0 (kJ/mol) 1,038 0,44 0,64 0,17 0,67 0,83
1. Glutethimide
1.1. Separation of glutethimide enantiomers by GC analysis
0
0.01
0.02
0.03
0.04
0.05
0.06
0.07
0.08
0.09
0.1
2.1 2.15 2.2 2.25 2.3 2.35 2.4 2.45
1/T.103 (K -1)
ln α
0
0.01
0.02
0.03
0.04
0.05
0.06
0.07
0.08
0.09
0.1
2.1 2.15 2.2 2.25 2.3 2.35 2.4 2.45
1/T.103 (K -1)
ln α
Figure 1. Temperature dependence of
selectivity (α, T 0C) by GC data
Figure 2 . Temperature dependence of selectivity (lnα, 1/T K-1) by GC data
1.2. Separation of glutethimide enantiomers by SFC analysis [3]
1.05
1.06
1.07
1.08
1.09
1.1
1.11
1.12
1.13
1.14
40 50 60 70 80 90 100 110 120
T (OC)
αα αα
0
0.02
0.04
0.06
0.08
0.1
0.12
0.14
2.20 2.25 2.30 2.35 2.40 2.45 2.50 2.55 2.60 2.65
(1/T).103 (K-1)
ln αα αα
Figure 3. Temperature dependence of
selectivity (α, T oC) by SCF data Figure 4. Temperature dependence of selectivity (lnα, 1/T K-1) by SCF data

B. TİKÉS, Z. JUVANCZ, R. IVÁNYI, SZ. VANCEA, G. DONÁTH-NAGY, V. SCHURIG, A.-G. CÂRJE
98
2. (2, 4-dichlorophenyl) propionic acid methyl ester (DPM)
2.1. Separation of DPM enantiomers by GC analysis
1.02
1.03
1.04
1.05
1.06
1.07
1.08
130 140 150 160 170 180 190
T (OC)
αα αα
1.028
1.03
1.032
1.034
1.036
1.038
1.04
1.042
1.044
1.046
1.048
1.05
45 50 55 60 65 70 75 80 85
T (OC)
αα αα
Figure 5 . Temperature dependence of selectivity (α, T oC) by GC data
Figure 6 . Temperature dependence of
selectivity (lnα, 1/T K-1) by GC data
2.2. Separation DPM enantiomers by SFC analysis
0
0.01
0.02
0.03
0.04
0.05
0.06
0.07
0.08
2.15 2.20 2.25 2.30 2.35 2.40 2.45
(1/T).103 (K-1)
ln αα αα
0
0.005
0.01
0.015
0.02
0.025
0.03
0.035
0.04
0.045
0.05
2.8 2.85 2.9 2.95 3 3.05 3.1 3.15
(1/T).103 (K-1)
ln αα αα
Figure 7. Temperature dependence of selectivity (α, T oC) by SCF data
Figure 8 . Temperature dependence of selectivity (lnα, 1/T K-1) by SCF data

TEMPERATURE DEPENDENCE OF ENANTIOMER SEPARATION PARAMETERS …
99
3. Trans-stilbene-oxide (TSO)
3.1. Separation of TSO (MMBC 5 SE-54) enantiomers by GC analysis
1
1.01
1.02
1.03
1.04
1.05
1.06
1.07
1.08
1.09
120 130 140 150 160 170 180 190 200
T (OC)
αα αα
0.76
0.78
0.8
0.82
0.84
0.86
0.88
0.9
0.92
2.1 2.2 2.3 2.4 2.5
(1/T).103 (K-1)
ln αα αα
Figure 9 . Temperature dependence of
selectivity (α, T oC) by GC data
Figure 10. Temperature dependence of selectivity (lnα, 1/T K-1) by GC data
3.2. Separation of TSO (MMBC 10 OV-1701) enantiomers by GC analysis
1.02
1.03
1.04
1.05
1.06
1.07
1.08
1.09
1.1
130 140 150 160 170 180 190 200
T (OC)
0.76
0.78
0.8
0.82
0.84
0.86
0.88
0.9
2.1 2.15 2.2 2.25 2.3 2.35 2.4 2.45
(1/T).103 (K -1)
ln αα αα
Figure 11 . Temperature dependence of
selectivity (α, T oC) by GC data Figure 12 . Temperature dependence of
selectivity (ln α, 1/T K-1) by GC data
CONCLUSIONS
We calculated the thermodynamic parameters (standard free enthalpy, enthalpy and entropy changes, ∆BA∆G, ∆BA∆H and ∆BA∆S differences) from the (lnα, 1/T) linear regression equation’s coefficients for the enantiomers of the studied chiral substances, which characterize the separation in the above specified conditions. Of course, the greater these differences (differences in selectivity or differences in resolution) the more effective is the separation of isomers. The selectivity itself is also the ratio of two similar thermodynamic parameters (ratio of distribution coefficients).
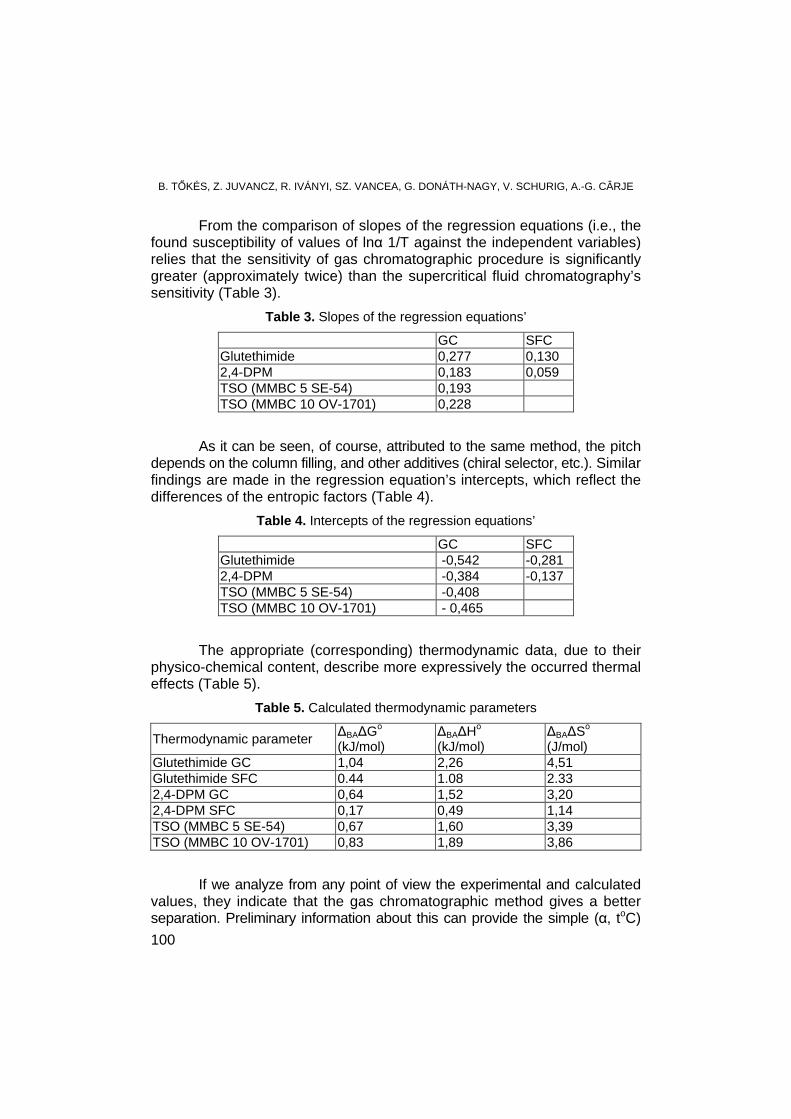
B. TİKÉS, Z. JUVANCZ, R. IVÁNYI, SZ. VANCEA, G. DONÁTH-NAGY, V. SCHURIG, A.-G. CÂRJE
100
From the comparison of slopes of the regression equations (i.e., the found susceptibility of values of lnα 1/T against the independent variables) relies that the sensitivity of gas chromatographic procedure is significantly greater (approximately twice) than the supercritical fluid chromatography’s sensitivity (Table 3).
Table 3. Slopes of the regression equations’
GC SFC Glutethimide 0,277 0,130 2,4-DPM 0,183 0,059 TSO (MMBC 5 SE-54) 0,193 TSO (MMBC 10 OV-1701) 0,228
As it can be seen, of course, attributed to the same method, the pitch depends on the column filling, and other additives (chiral selector, etc.). Similar findings are made in the regression equation’s intercepts, which reflect the differences of the entropic factors (Table 4).
Table 4. Intercepts of the regression equations’
GC SFC Glutethimide -0,542 -0,281 2,4-DPM -0,384 -0,137 TSO (MMBC 5 SE-54) -0,408 TSO (MMBC 10 OV-1701) - 0,465
The appropriate (corresponding) thermodynamic data, due to their physico-chemical content, describe more expressively the occurred thermal effects (Table 5).
Table 5. Calculated thermodynamic parameters
Thermodynamic parameter ∆BA∆Go
(kJ/mol) ∆BA∆Ho (kJ/mol)
∆BA∆So (J/mol)
Glutethimide GC 1,04 2,26 4,51 Glutethimide SFC 0.44 1.08 2.33 2,4-DPM GC 0,64 1,52 3,20 2,4-DPM SFC 0,17 0,49 1,14 TSO (MMBC 5 SE-54) 0,67 1,60 3,39 TSO (MMBC 10 OV-1701) 0,83 1,89 3,86
If we analyze from any point of view the experimental and calculated values, they indicate that the gas chromatographic method gives a better separation. Preliminary information about this can provide the simple (α, toC)

TEMPERATURE DEPENDENCE OF ENANTIOMER SEPARATION PARAMETERS …
101
curves and equations themselves to. Of course, for the method development, beyond the temperature dependence, has to be taken into account other technical specificities as well. In accordance with the foregoing theoretical facts which are supported by the experimental data, the heat effect ∆H, which means the algebraic sum or rather the average of distribution heat exchanges (in gas chromatography the dissolution and absorption heat, in supercritical fluid chromatography, because of its "hybrid" nature, the vaporization and dissolution heats), for the GC is generally higher than for the SFC separations. This means that in the first case the growth of selectivity should be larger than the latter. Since compounds with different structure were studied, it appears that this conclusion does not depend on the quality of any of the compounds tested, nor the chiral selector. Therefore, it follows that the knowledge of temperature dependence on separation helps to choose the optimum conditions for analytical methods.
Experimental section
Separation of enantiomers of studied chiral compounds was performed by gas chromatography (GC) and supercritical fluid chromatography (SFC), in the CIB-Geigy Corporation (Basel, Switzerland) laboratories. 1. Chromatographic columns used for glutethimide and 2,4-DPM determination: In GC analysis: Quartz capillary 10 m x 0,1 mm, with Chirasil-Dex
stationary phase (15% chemically bonded permethyl-β-cyclodextrin) humified at 0,15 mm thickness.
In SFC analysis: Quartz capillary 7,5 m x 0,1 mm, with Chirasil-Dex stationary phase (15% chemically bonded permethyl-β-cyclodextrin) humified at 0, 15 mm thickness [7].
2. Chromatographic columns used for trans-stilbene oxide determination: In GC analysis: Quartz capillary 10 m x 0.1 mm, 95% SE-54 + 5%
MMBC (meta-methyl-benzoyl-cellulose) humified at 0, 2 mm thickness. In SFC analysis: Quartz capillary 10 m x 0.1 mm, 90 % OV1701Vi +
10% MMBC (meta-methyl-benzoyl-cellulose) humified at 0, 2 mm thickness [8,9].
ACKNOWLEDGEMENTS
This work has been supported in part by the research projects OTKA K72861 and NKTH OTKA 68863.

B. TİKÉS, Z. JUVANCZ, R. IVÁNYI, SZ. VANCEA, G. DONÁTH-NAGY, V. SCHURIG, A.-G. CÂRJE
102
REFERENCES
1. T. Kremmer, L. Boross – Gélkromatográfia. Mőszaki Könyvkiadó, Budapest, 1974 2. Z. Juvancz, K.E. Markides. LC-GC International, 1992, 5, 44 3. A. Overbeke, H.Y. Aboul-Enein, W. Baeyens, G. Guido Weken, C. Dewaele, Analytica
Chimica Acta, 1992, 346, 183 4. C. Weinz, G. Blaschke, H-M Schiebel, J. Chromatography, B: Biomedical Sciences
and Applications, 1997, 690, 233 5. L. Ferencz – Pesticides. University Press, Tg. Mureş, 2006 6. T.K. Tachibana; A. Ichida, J Liquid Chromatography and Related Technologies, 2003:
3235 – 3248 7. Z. Juvancz, K. Grolimund, V. Schurig, J. Microcol. Separation, 1993, 5, 459 8. E. Francotte, K. Grolimund, Z. Juvancz, Chirality, 1993, 5, 232 9. Z. Juvancz, K. Grolimund, E. Francotte, Chirality, 1992, 4, 459

STUDIA UNIVERSITATIS BABEŞ-BOLYAI, CHEMIA, LIV, Sp.Iss. 2, 2009
CHEMICAL STRUCTURE DEPENDENCE OF SEPARATION METHODS’ PARAMETERS*
BÉLA TŐKÉSa,**, ZOLTÁN JUVANCZb, ROBERT IVÁNYIc, GABRIELLA DONÁTH-NAGYa, SZENDE VANCEAa,
VOLKER SCHURIGd, ANCA-GABRIELA CÂRJEa
ABSTRACT. Chromatographic research of pyrethroidic acids’ isomerism offers an excellent possibility for a profound study of the structure dependence of separation parameters. In these compounds appears cumulated (geometrical and chiral) isomerism. Quantitative relations between separation parameters, chemical structure, partition coefficients and steric energy of isomers were established. Keywords: Separation methods, pyrethroids, isomerism, structural effect
relations
INTRODUCTION In our earlier papers [1-3] we have demonstrated that the separation of steric isomers is decisively structure dependent. This dependence particularly manifests in the pyrethroid series [4] where both the geometric and chiral isomerisms are simoultaneously present:
CH3 CH3
O
OHH
H
R1
R2R3
In their structure there are two chiral centers (1, 3), and the cis(Z) and trans(E) isomerisms mean the steric arrangement of groups introduced in positions 1 and 3 correlate to the cyclopropane plane. Of course, both the * This paper was presented at the 15th International Conference on Chemistry, EMT, Tg. Mures,
November 12-15, 2009 a University of Medicine and Pharmacy, Tg. Mureş, Physical Chemistry Laboratory, Romania,
** [email protected] b Dep. of Environmental Engineering, Tech. Polytechnical Institution, Budapest, Hungary c Cyclolab Cyclodextrin R & D. Laboratory Ltd., Budapest, Hungary d University of Tübingen, Institute of Organic Chemistry, Germany
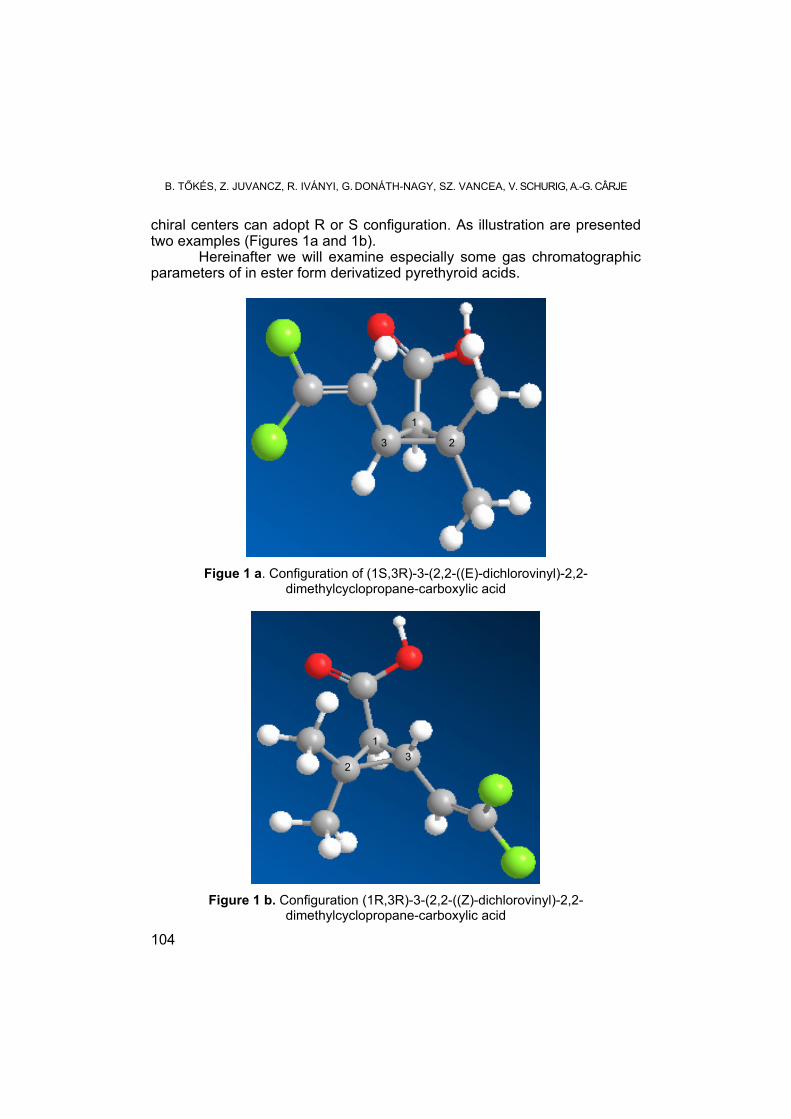
B. TŐKÉS, Z. JUVANCZ, R. IVÁNYI, G. DONÁTH-NAGY, SZ. VANCEA, V. SCHURIG, A.-G. CÂRJE
104
chiral centers can adopt R or S configuration. As illustration are presented two examples (Figures 1a and 1b).
Hereinafter we will examine especially some gas chromatographic parameters of in ester form derivatized pyrethyroid acids.
Figue 1 a. Configuration of (1S,3R)-3-(2,2-((E)-dichlorovinyl)-2,2-
dimethylcyclopropane-carboxylic acid
Figure 1 b. Configuration (1R,3R)-3-(2,2-((Z)-dichlorovinyl)-2,2-
dimethylcyclopropane-carboxylic acid
23
1
1
23

CHEMICAL STRUCTURE DEPENDENCE OF SEPARATION METHODS’ PARAMETERS
105
RESULTS AND DISCUSSION The selectivities of gas chromatografic separation of the compounds studied and introduced as guest molecules in inclusion complexes formed with Chirasil-Dex CSP as chiral selector are summed up in the Table 1 [2]. For interpretation of the structural effects this table also contains the inductive (σ*) and the steric (ES) Taft- constants of the ester forming alcohols’ alchil groups [5].
Table 1. The gas chromatographic selectivities (α) of pyrethroid acids’ esters measured in the presence of the Chirasil-Dex CSP as chiral selector
in function of the chain length (n), at 100OC
isomer R1=R2 R3 α n σ* ESO
cis Me H 1.275 0 0.490 0.25 trans Me H 1.153 0.490 0.25
cis Me Me 1.013 1 0.000 0.00 trans Me Me <1.010 0.000 0.00 cis Me Et <1.010 2 -0.100 -0.27
trans Me Et <1.010 -0.100 -0.27 cis Br Me 1.046b 0.000 0.00
trans Br Me 1.040b 0.000 0.00 cis Cal H 1.284 0 0.490 0.25
trans Cal H 1.194b 0.490 0.25 cis Cal Me 1.043 1 0.000 0.00
trans Cal Me 1.010 0.000 0.00 cis Cal Et 1.023 2 -0.100 -0.27 cis Cal Pr 1.019 3 -0.115 -0.56 cis Cal Bu 1.014 4 -0.130 -0.59 cis Cal sub 1.034 -0.125 -1.13 cis Cal pier <1.010 -0.190 -0.85 cis Cal tub <1.010 -0.300 -2.14
One but not exclusive aim of derivatization (esterification) is to facilitate the gas chromatograpic operations, namely in this way the transfere of the studied compounds in gas phase becomes easier, their volatility get better, the polarity decreases, it can extend the measuring interval, increases the thermal stability, amplifies the detector sign, furthermore at inclusion complex formation can be favourably drive the interactions with the chiral selector.

B. TŐKÉS, Z. JUVANCZ, R. IVÁNYI, G. DONÁTH-NAGY, SZ. VANCEA, V. SCHURIG, A.-G. CÂRJE
106
Comparisons referring to the structural effects in the first steps were performed with esters of cis(Z)-permethrinic acid and right-chain alcohols, including as a limiting case acid itself. Separately, we are interpreted the selectivity of the ramificated-chain alcohols’ esters, too [2]. To examine esters of the right- and the ramificated-chain alcohols offers a standing-ground the cross-checks of the Taft’s substitution constants. From this it is evident, that according to their structural peculiarity the cis(Z)- and trans(E)-series must enlist in separate groups. Studying the selectivity of cis-permethrinic acid series it is visible that with the increasing of the chain-length (n) of ester-forming alcohol the α values decease (Table 1, Figure 2). Always, the separation of the underivatized acids is the better. That is often the negative side of the derivatization, and we try to explain it. In the case of esters formed from right-chain alcohols the (α, n) values are distributed on an exponential curve written by the following equation:
y=y0+A1ex/t1 Namely:
α = 1,0175 + 0,2664 exp(- 2,326 n) N = 5 R = - 0,9996
It is visible, that the exponential character with the elimination of the underivatized acid practically breake off.
-0.5 0.0 0.5 1.0 1.5 2.0 2.5 3.0 3.5 4.0 4.50.95
1.00
1.05
1.10
1.15
1.20
1.25
1.30
1.35
Alfa
n
Alfa ExpDec1 of Alfa
Figure 2. The (α,n) curve of cis-permethrin acid’s esters: R1 = R2= Cal, R3 = H (0),
CH3 (1), C2 H5 (2), C3H7 (3), C4H9 (4)

CHEMICAL STRUCTURE DEPENDENCE OF SEPARATION METHODS’ PARAMETERS
107
Oppositely, the (lg α, lg n) correlation is significantly linear (Figure 3):
log α = - (0,0201 ± 0,0030) log n + (0,0175 ± 0,0012) N = 4 R = - 0,968
0.0 0.2 0.4 0.60.004
0.006
0.008
0.010
0.012
0.014
0.016
0.018
0.020
log
a
log n
log a Linear Fit of log a
Figure 3. The (lg α, lg n) correlation of cis-.permethrin acid’s esters
Since this equation may be written as
lg (K2/K1) = - 0,020 lg n + 0,0175 obviously we got to a special form of the linear free energy relations (Hammett, Taft, Hansch) as
lg (K2/K1) = ρσ + k, or
ln α = ln (KB/KA) = - Δ(ΔµBAo)/RT = - ΔBAΔGo/RT
= - (ΔBAΔHo/R) 1/T + ΔBAΔSo/R Formally, the lg n terms, that is the logarithms of 1, 2, 3, 4 (0,00; 0,30; 0,48 and 0,60) acceptabily correspond with Taft’s ES values (0,00; 0,27; 0,56 and 0,59).
Perceptibly, the selectivity of ramificated alcohols’ esters drop out of this normal distribution. As follows, since the structural parameters and physical data of esters are not available, we will assume that the changes in the properties of esters of basic pyrethroid (permethrin) acids are decisively produced by alcohols, and comparisons may be done between these

B. TŐKÉS, Z. JUVANCZ, R. IVÁNYI, G. DONÁTH-NAGY, SZ. VANCEA, V. SCHURIG, A.-G. CÂRJE
108
compounds and the corresponsive alchil-groups. After all, approximately monotonous change is observed if we follow the (α, σ*), respectively the (α, ES) series. The more greater the negative numerical values of these substituent constants the more the chains are apolar. Significantly linear correlation was obtained only for the (lg α, σ*) values:
lg α = lg(K 2/K1) = 0,144 σ* + 0,030 N = 8, R = 0,965
That corroborates our earlier conclusion. The free term includes the steric effects.
To configure a mohr complet image on the studied phenomenon, we will use our model [6] proposed for describing the working mechanism of chiral selectors (cyclodextrins). After this point of view the formation of inclusion complexes and their stability may be described by the help of the repartition constants of a microequlibrium between the cavity of cyclodextrin, as an apolar phase, and its exterior polar surroundings (water). That is, between lg Kst and lg KOW (log P) it requires a proportionality. The reparation constant is measured conventionally in 1-octanol/water system. At the same time, the measure of the polar-apolar character is given by the (relative) dielectric constant (ε) of the medium. Accordingly to expectation we obtained an excelent correlation between lg KOW and ε (Table 2):
lg KOW = 50,76 1/ε - 2,14 N = 12 R = 0,997
The more apolar is the dissolved compound the greater is the lg KOW since it dissolves better in the apolar phase. If the apolar phase is considered the inside of cyclodextrin (regarded approximately as homogeneous), in the case of a given homologous series with increasing chain (i.e. with the decrease of the polar character) increases the inclusion complex stability (lg Kst) and inherently the lg KOW, too. According to literature sources the dielectric constant of the cavity varies between 2 and 20. In the case of gas chromatographic measurements using a cyclic chiral selector to separate enantiomers it is necessary that these isomers be joint distinctly to the inner structure of selector. Both the very veak and the exceedingly strong bonding (complex stability) diminish the separation efficienty (selectivity). The longer the apolar chain the better the solubility of boh isomers in the apolar phase (in the cavity of the host molecule), more strongly are bound to the chiral selector, and the smaller will be the selectivity α. This interpretation agrees to the experimental data (Table 2). For comparison, will be highlighted some data alluding to the complexity of phenomena (Table 3). It is apparent that although in the selected group the t-butyl alcohol’s polarity is the smallest its miscibility is unlimited as long as the solubility of the more polar 1-butanol is relatively small [8]. The role of solvation particularities is obvious.

CHEMICAL STRUCTURE DEPENDENCE OF SEPARATION METHODS’ PARAMETERS
109
Table 2. Structure, dielectric constants and repartition coefficients of alcohols.
Name Formula n ε 1/ε lgKOW methanol H(CH2)OH 1 34.05 0.029 -0.66 ethnanol H(CH2)2OH 2 25.2 0.040 -0.16 propanol H(CH2)3OH 3 19.7 0.051 0.34
i-propanol H(CH2CHCH3)OH 3 18.3 0,055 0.36* n-butanol H(CH2)4OH 4 17.7 0.056 0.88
sec.-butyl alcohol H(CH3)2(CH2CH)OH 4 16.4 0.061 0.805* terc-butyl alcohol H(CH3)2CH2COH 4 12.3 0.081 0.806*
1-pentanol H(CH2)5OH 5 14.4 0.069 1.40 2-pentanol H(CH2)3CH3CHOH 5 14.2 0,070 1.25* 3-pentanol H(CH2)3CH3CHOH 5 14.0 0,071 1.25*
hexanol H(CH2)6OH 6 12.5 0.080 2.03 heptanol H(CH2)7OH 7 11.1 0.090 2.53 octanol H(CH2)8OH 8 9.8 0.102 3.03
decyl alcohol H(CH2)10OH 10 8.1 0.123 4.03 i-amyl alcohol H(CH3)2C(CH2)2OH 5 14.7 0.068 1.16
terc-amyl alcohol H(CH3)2(CH2)2COH 5 5.70 0,175 1.25* i-butyl alcohol H(CH2)2CH3CHOH 4 17.7 0.056 0.65
*The missing repartition coefficients were calculated by the Buchwald and Bodor’s [7] additivity method: H: 0,086; ›C‹: 0,182; -CH‹: 0,314; -CH2-: 0,446; -CH3: 0,579; -OH: -1,113.
Table 3. Physical parameters of some alcohols
Solvent Boiling point (oC)
Fusion s- point (oC)
density (g/mL)
Solubility in water (g/100g)
Relatíve polarity
t-butyl alcohol 82.2 25.5 0.786 M 0.389 2-propanol 82.4 -88.5 0.785 M 0.546 1-butanol 117.6 -89.5 0.81 7.7 0.602 1-propanol 97 -126 0.803 M 0.617 ethanol 78.5 -114.1 0.789 M 0.654 methanol 64.6 -98 0.791 M 0.762 water 100.00 0.00 0.998 M 1.000
One from the purposes of esterification is the enhancement of the
volatility, an important standing-point at gas chromatographic measurements. However the esters’ selectivity is smaller like of acids. Consequently, the possible gain realized by the polarity’s diminution is lost in separation selectivity. At the same time, the rate of evaporation [9-11] exponentially drops as a function of chain length (Figure 4):
Vp= -0.073+12.11 e- 0,026 tf
N = 17 R = - 0,984

B. TŐKÉS, Z. JUVANCZ, R. IVÁNYI, G. DONÁTH-NAGY, SZ. VANCEA, V. SCHURIG, A.-G. CÂRJE
110
Figure 4. Relation between boiling points and evaporation rates of alcohols
It is a phenomenon frequently observed [2], that at gas chromatographic separation from geometrical isomers first pass through the Z(cis) form and its resolution is greater than of the E(trans) isomer. In our sight its explanation partially may be done by the drawn image. Since cis-isomers are in general more polar as against trans forms, these latters are stronger retained by selector, furthermore that is concomitant with a weaker separation of isomers Table 4, Figure 5).
Table 4. Rs and lg KOW values of some pyrethyroid acids at pH = 6.5
using β-PMMACD as chiral selector
Nr Trivial name R1 = R2 RS lg KOW
1 c-chrysanthemic acid CH3 8.5 3.18 2 tr.-chrysanthemic acid CH3 1.5 3.18 3 c-permethrinic acid Cal 17.2 3.36 4 tr.-permethrinic acid Cal 6.6 3.36 5 c-deltamethrinic acid Br 20.0 3.54 6 tr.-deltamethrinic acid Br 11.6 3.54
40 60 80 100 120 140 160 180 200 220 240 260-0.4
-0.2
0.0
0.2
0.4
0.6
0.8
1.0
1.2
1.4
1.6
1.8
2.0
2.2
2.4
Eva
pora
tion
rate
s
Building point
Evaporation rates EXpDec1Fit of evaporation

CHEMICAL STRUCTURE DEPENDENCE OF SEPARATION METHODS’ PARAMETERS
111
0
5
10
15
20
25
3.15 3.2 3.25 3.3 3.35 3.4 3.45 3.5 3.55 3.6
log P
Rs cis
trans
Figure 5. Relation between Rs and lg KOW at some cis-trans isomers of pyrethroid acids
CONCLUSIONS The gaschromatographic separation of derivatized (esterified) pyrethroid acids’ enantiomers using Chirasil-Dex CSP as chiral selector is significantly dependent on the alcohols ‘structure. This dependence is quantitatively represented by correlation of different parameters, as well. The authors have elaborated models to explaine the experimentally observed modifications. The structure dependence of the selectivity represents a new form of the linear free energy relations. EXPERIMENTAL SECTION
The separation of enantiomers of the studied chiral compounds (esters of pyretroid acids) was performed by gaschromatographic method [11-13], in the laboratory of CIB-Geigy Corporation (Basel, Switzerland ). The conditions of the GC measurements: quartz capillary (10 m x 0.1 mm) with a Chirasil-Dex stationary phase (15 % chemically bound wetted permetril-β-cyclodextrin, in 0.15 μm thickness) The syntheses of pyrethroid esters and their parameters were described in earlier papers by one of authors [11-13].
Molecular modeling was performed with Chembio 3D from ChemBioOffice 2008 Ultra® 11.0 (Cambridgesoft, Cambridge, MA, USA) using the MM2 Molecular Mechanics algorithms running on a Windows platform. Host structures were built from the corresponding 2D drawings transferred in Chembio 3D and then fully optimized by help of the MM2 algorithm with a maximum iteration number of 1000. They were then inserted in the corresponding CD cavities and fully optimized. Data were processed using an Originlab Corp. Origin 7.0 program. ACKNOWLEDGMENTS
This work has been supported in part by the research projects OTKA K72861 and NKTH OTKA 68863.

B. TŐKÉS, Z. JUVANCZ, R. IVÁNYI, G. DONÁTH-NAGY, SZ. VANCEA, V. SCHURIG, A.-G. CÂRJE
112
REFERENCES
1. L. Ferencz, B. Tőkés, F. Kilár, „Selector effects in the case of simultaneous presence
of geometrical and optical isomerisms”, 11th International Conference of Chemistry, Cluj, nov. 11-13, 2005, Vol. Conf. 206.
2. Z. Juvancz, “Enantiomer elválasztások kapilláris kromatográfia módszerével”, Akadémiai doktori értekezés, Vízgazdálkodási Tudományos Kutató Részvénytársaság, Vízminőségvédelmi Intézet, Budapest, 2001.
3. B. Tőkés, L. Ferencz., P. Buchwald, G. Donáth-Nagy, Sz. Vancea, N. Sánta, E-L. Kis, J. Biochem. Biophys. Methods, 2008, 70, 1276.
4. L.Ferencz, “Pesticides” University Press, Tg. Mureş, 2006. 5. B.P. Nikolsky (Ed.), ”Spravochnik khimika“, Vol. III, “Khimiya”, Moskva, 1964, 956,
958. 6. B. Tőkés, G. Donáth-Nagy, Sz. Vancea, Cs. Kun, “Microequlibria at inclusion
complexes. I. Theoretical bases”, 14th International Conference on Chemistry. Hungarian Technical Scientific Society of Transsylvania, Cluj, November 13-15, 2008, 146-150.
7. P. Buchwald, J. Phys. Chem., 2003, 106: 6864. 8. L.H. Hall, L.B. Kier, J. Wallace, W.J. Murray. J Pharm Sci, 1975, 64, 1974. 9. M. Kompany-Zareh, Acta chimica slovenica, 2003, 50, 259. 10. L. Qianfeng, Ch. Xingguo, H. Zhide, Chemometrics and Intelligent Laboratory Systems,
2004, 72, 93. References and further reading may be available for this article. To view references and further reading you must purchase this article.
11. Z. Juvancz, K. Grolimund, E. Francotte, Chirality, 1992, 4, 459. 12. E. Francotte, K. Grolimund, Z. Juvancz, Chirality, 1993, 5, 232. 13. Z.Z. Juvancz, K. Grolimund, V. Schurig, J. Microcol. Separation, 1993, 5, 459.

STUDIA UNIVERSITATIS BABEŞ-BOLYAI, CHEMIA, LIV, Sp.Iss. 2, 2009
ENZYMATIC ACTIVITY STUDIES OF BIOLOGICAL WASTEWATER TREATMENT
SZILVESZTER SZABOLCSa, RÁDULY BOTONDb, MIKLÓSSY ILDIKÓb, ÁBRAHÁM BEÁTAb, LÁNYI SZABOLCSb, DAN ROBESCU NICOLAEa
ABSTRACT. Biological wastewater treatment is the most common technology for municipal wastewater purification, where different consortia of microorganisms aggregated in sludge flocks degrade organic matter in wastewater; activity and distribution of enzymes in flocks reflects microbial activities. A lab-scale sequencing batch reactor (SBR) was built and used for the treatment of synthetic wastewater to investigate the activity and distribution of hydrolytic enzymes (α-amylase, α-glycosidase and alkaline phosphatase) in sludge flocks. The enzymatic activity parameters of the enzymes were analyzed in function of chemical oxygen demand values of samples to determine the activity and distribution in the course of the whole process, aiming in the future to a better understanding of biological processes that occur during wastewater treatment.
Keywords: extracellular enzymes, enzyme activity, enzyme distribution,
sequencing batch reactor, activated sludge flocs INTRODUCTION
The activated sludge treatment is today’s most popular type of biological wastewater treatment. In its over 100 years of history, the initial aerobic oxidation process, developed for organic carbon removal, and has been completed with other biological nutrient removal processes to meet the more and more severe emission limits and to deal with the increasing magnitude and complexity of wastewater loads. The success of the activated-sludge process is dependent upon establishing a mixed community of microorganisms that will remove and consume organic waste material, that will aggregate and adhere in a process known as bioflocculation, and that will settle in such a manner as to produce a concentrated sludge for recycling. Organic matter carried by urban wastewater is a complex mixture of single carbohydrates, amino acids, alcohols and volatile fatty acids mixed with polymers and heteropolymers including proteins (1/3 of chemical oxygen demand, COD),
a "Politehnica" University of Bucharest, Faculty of Energetics, Bucharest, Romania, email:
[email protected] b Sapientia University, Cluj Napoca , Faculty of Sciences, Miercurea Ciuc, Romania

SZILVESZTER S., RÁDULY B., MIKLÓSSY I., ÁBRAHÁM B., LÁNYI S., D.R. NICOLAE
114
polysaccharides (1/5 of COD), and lipids (1/3 of COD) [1]. A large fraction of this wastewater organic matter (30–85%) consists of particles larger than 0.1 μm [2] preventing them from being directly assimilated by microorganisms. In most of the cases only monomers and oligomers (MW < 1000) are able to cross the bacterial membrane via specific active transports [3]. For example, in seawater only small peptides (MW < 600–700) are imported directly into the cell [4]. It is well known that before bacteria can assimilate high molecular weight compounds, the compounds are usually hydrolysed by extracellular enzymes. These extracellular enzymes are either bound to cell surface (ecto-enzymes) or released into the medium (exo-enzymes) in the free form [5] prior to form complexes with high molecular weight substances [6]. Enzymes like α-amylase, α-glycosidase and alkaline-phosphatase play essential role in the biological wastewater treatment processes. The amount of extracellular enzymes in the bulk solution of activated sludge is negligible, indicating that almost all extracellular enzymes are immobilized in flocks [7]. The contact probability of enzymes whit proteins and polysaccharides is determined by the distribution of enzymes in the sludge flocks [8].
Microbial cells can produce extracellular polymeric substances (EPS) which lead to floc formation by agglomeration of bacteria. In other words, these exopolymers are responsible for increased bridging flocculation that helps create good settling [9]. Enzymatic activities distributions were studied in the EPS sludge matrix by activity measurement. EPS in sludge flocs were characterised as described by Guang-Hui et al. 2007 [10], based on their properties to exhibit a dynamic double-layer structure, composed of loosely bound EPS (LB-EPS) and tightly bound EPS (TB-EPS) [10]. The LB-EPS fraction is considered to easily exchange substances with the bulk solution, having greater impact to numerous sludge processes like coagulation and dewatering [10, 11]. The goal of this paper is to investigate extracellular enzymatic activities and distribution in activated sludge samples collected during the aerobic period from a lab-scale sequencing batch reactor (SBR). To the author’s best knowledge, no work has been done to characterise enzymatic activities and distribution on a lab-scale sequencing batch reactor in three different samples taken every hour of the 3 hour aeration phase for each enzyme to characterises enzymatic activities and distribution in the course of the whole process period.
RESULTS AND DISCUSSION Samples taken from the lab-scale SBR reactor in the course of the whole process period, at the beginning, in the middle and in the end of the aerobe phase were met to investigate extracellular enzyme activity and distribution in activated sludge flocs in the entirely whole process. Figure and Tables 1, 2, 3 presents enzyme activities and distribution of each studied enzyme in every sample period and fraction of the sludge floc.

ENZYMATIC ACTIVITY STUDIES OF BIOLOGICAL WASTEWATER TREATMENT
115
Table 1. Alpha-amylase activities COD [mg/L] 120 72.8 32
Fraction EA [u/ml] Stand. Dev EA [u/ml] Stand. Dev EA [u/ml] Stand. Dev
LB‐EPS 0.49 ±0.13 1.25 ±0.15 1.26 ±0.51
TB‐EPS 0.61 ±0.17 1.25 ±0.077 0.71 ±0.26 Pellets 0.15 ±0.09 0.01 ±0.009 0.19 ±0.06 Total 1.2533857 2.508418 2.155
Efficiency % 60 75.73333 89.33333
Figure 1. Alpha amylase, alpha glucosidase distribution in sludge flocs.
Significant alpha amylase and alpha glucosidase enzyme activity was measured in the LB and TB-EPS fractions of the activated sludge flocs in every sample, therefore we can infer that these enzymes are immobilized in the EPS matrix in the free form, i.e. exo-enzymes [10]. From Figure 1 we can conclude that enzymatic activity values may vary from time to time (Table 1, 2) due to the substrate diffusion or other parameters but distribution, location of enzyme is ‘specific’, or is an ecto-enzyme (bound to the cell surface of the bacteria), exoenzyme or ‘universal’ that can be found in the whole sludge sample like alkaline phosphatase shown in Table 3, and Figure 2.

SZILVESZTER S., RÁDULY B., MIKLÓSSY I., ÁBRAHÁM B., LÁNYI S., D.R. NICOLAE
116
Table 2. Alpha-glucosidase activities COD [mg/L] 120 72.8 32
Fraction EA [u/ml] Stand. Dev EA [u/ml] Stand. Dev EA [u/ml] Stand. Dev
LB‐EPS 0.7107107 ±0.15 0.31395 ±0.091 1.077441 ±0.18 TB‐EPS 0.6515607 ±0.1 0.42952 ±0.08 1.021931 ±0.14 Pellets 0.3339703 ±0.04 0.584221 ±0.014 1.696242 ±0.1 Total 1.6962417 1.327691 3.795614
Efficiency % 60 75.73333 89.33333
Table 3. Alcaline phosphatse activities
COD [mg/L] 120 72.8 32
Fraction EA [u/ml] Stand. Dev EA [u/ml] Stand. Dev EA [u/ml] Stand. Dev
LB‐EPS 0.7107107 ±0.15 0.31395 ±0.091 1.077441 ±0.18 TB‐EPS 0.6515607 ±0.1 0.42952 ±0.08 1.021931 ±0.14 Pellets 0.3339703 ±0.04 0.584221 ±0.014 1.696242 ±0.1 Total 1.6962417 1.327691 3.795614
Efficiency % 60 75.73333 89.33333
Figure 2. Alcaline Phosphatase distribution in sludge flocs.
Alcaline phosphatase enzyme activity and distribution is significant in all the tree fractions of the sludge flocs, concluding that this enzyme can be found in whole sludge floc, as a ‘universal’ enzyme. All the tree studied enzymes can be characterized, localized, in sludge floc because during the whole treatment period of the batch system activities values fluctuated but the enzyme localization were the same. Further research is needed to investigate under different process parameters enzymatic behavior of the sludge floc, and to find a correlation between floc and enzyme characteristics.

ENZYMATIC ACTIVITY STUDIES OF BIOLOGICAL WASTEWATER TREATMENT
117
CONCLUSIONS Enzymatic activities and distribution in activated sludge flocks can
be detected and analyzed; it should also be considered physical and chemical characteristics of the flocks in enzyme activities and distribution. It is very important to understand the enzymatic distribution in the sludge flocks because enzyme activities reflect their microbial activities when degrading organic matter in wastewater [10]. This work denotes that there are different fractions of activated sludge flocks containing different types of enzymes with different activities. Hereinafter our goal is to characterize enzymes at ‘standardized’ process parameters and investigate parallel activated sludge morphology characterization to find correlation between sludge morphology and enzyme distribution. A better understanding of the distribution of enzymes in the different fractions, of the activated sludge flocks should offer a more precise understanding of biological processes, and should lead to higher removal efficiencies, better control and lower wastewater treatment costs. EXPERIMENTAL SECTION Sequencing batch reactor (SBR)
The SBR activated-sludge systems differ from continuous activated-sludge plants because they combine all of the treatment steps and processes into a single basin, or tank, whereas conventional facilities rely on multiple basins [12]. The SBR reactor used for this research is shown in Figure 1, with a total volume of 21 liter.
Table 1. Specifications of the synthetic wastewater used in the experiments, modified from Nopens I. et al. 2001 [13]
mg/l COD mg/l N mg/l P mg/l Chemical Compounds Urea 91.74 23.22 42.81 0 NH4Cl 12.75 0 3.52 0 o Na-acetate . 3H2O 131.64 79.37 0 0 Peptone 17.41 17.41 0.67 0 MgHPO4.3H2O 29.02 0 0 5.14 KH2PO4 23.4 0 0 3.14 FeSO4.7H2O 5.80 0 0 0 Food ingredients Starch 122.00 122.00 0 0 Milk powder 116.19 116.19 6.95 1.14 Yeast 52.24 52.24 6.28 0 Soy oil 29.02 29.02 0 0 Total 631.21 439.45 60.23 9.42

SZILVESZTER S., RÁDULY B., MIKLÓSSY I., ÁBRAHÁM B., LÁNYI S., D.R. NICOLAE
118
Trace Metals mg/l mg metal/l Cr(NO3)3.9 H2O 0.770 0.100 CuCl2.2 H2O 0.536 0.200 MnSO4. H2O 0.108 0.035 NiSO4.6 H2O 0.336 0.075 PbCl2 0.100 0.075 ZnCl2 0.208 0.100
The seed sludge was taken from the Miercurea Ciuc wastewater treatment plant activated sludge basin. For this work, synthetic wastewater has been used (which composition listed in Table 1). The COD/N/P ratio of the synthetic waste water was around 100:17:5, its theoretical BOD5 was 300 mg/l, assuming a COD to BOD conversion factor of 0.65. [13] The reactor full cycle operation, with fill, react, settle, draw was 3 hour and 45 minutes as presented in Figure 1 where the sampling periods are also presented in the aerob phase.
Figure 1. Lab-scale SBR reactor and the operation phases for a full cycle.
EPS extraction
Activated sludge samples were collected from the SBR lab scale reactor at steady-state, and were settled for 30 min. at 4oC temperature. The sludge sediments were then centrifuged (Beckman Oulter Allegra 64R) at 2,000 x g for 15 min, and the supernatant was decanted. As Guang-Hui et al. [10] described in their paper, the discarded fraction of the sludge flocs was taken as slime that contained few enzymes. The collected sediments were then resuspended in 0.05% w/w NaCl solution to its original volume and centrifuged again at 5000 x g for 15 min. The organic matter in the supernatant gives the LB-EPS of the sludge samples. Collected sediments were resuspended again with 0.05% NaCl solution to the original volumes

ENZYMATIC ACTIVITY STUDIES OF BIOLOGICAL WASTEWATER TREATMENT
119
for further extraction of TB-EPS. After resuspension the sludge was sonicated for 2 min and centrifuged at 20000 x g for 20 min. The extraction process is summarized in Figure 2. The pellets give the residues after centrifugation. The organic matter of the supernatant gives the TB-EPS while the enzymes in the pellet were released as Gessesse et al.[14] described in their paper. The pellets of samples were first mixed in 10 mmol l-1 Tris buffer at pH 8 in ice bath, and sonicated for a total of 30 min, after 20000 x g centrifugation for 15 min the supernatant was decanted and analysed further for enzyme activity measurement.
Figure 2. Extraction protocol used for enzyme extraction.
Enzyme Assay
Membranes of 0.45 μm cellulose membranes (Teknokroma, S. Coop. Ltda., OlimPeak Filters with M.E. Celullose Membrane) were used to remove particulates in the supernatant, LB-EPS, TB-EPS and Pellets. The activities of α-amylase were analyzed with starch-iodine method as described by Xiao Z. et al. 2006 [15], alkaline-phosphatase and α-glucosidase activities were measured as Goel R. et al [16] discussed in their paper, p-nitriphenylphosphate di sodium salt (Sigma N 4646) substrate for alkaline-phosphatase and for α-glucosidase p-nitrophenyl α-D glucopyranoside (Sigma N 1377) was used as substrate. Activated sludge enzymes were measured triplicated in microplate reader (Fluostar Optima, BMG Labtech) to check data reproducibility.

SZILVESZTER S., RÁDULY B., MIKLÓSSY I., ÁBRAHÁM B., LÁNYI S., D.R. NICOLAE
120
Enzyme activities for alkaline-phosphatase and α-glycosidase were calculated as eq.(1) where activated sludge volume where V [ml] is the volume of the cuvette, ε [1/mmol·cm] is the extinction coefficient, v [ml] the volume of the enzyme sample and l [cm] is the optical path length.
vlVAEA⋅⋅⋅⋅Δ=
ε1000min/
[U/ml] (1)
For α-amylase enzyme activity calculation we had used the formula as described in Xiao Z. et al. 2006 [15] where one unit (U) for the microplate-based starch-iodine assay is defined as the disappearance of an average of 1 mg of iodine binding starch material per min in the assay reaction. U/ml was calculated for amylase using the formula:
mlAAA
EAstarchmg
samplecontrol
04.0min30)(
./580
580580
⋅⋅−
= [U/ml] (2)
Where A580 control is the absorbance obtained from the starch without the addition of enzyme, A580 sample is the absorbance for the starch digested with enzyme, A580/mg starch is the absorbance for 1 mg starch derived from the standard curve, 30 min is the assay incubation time and 0.04 ml is the volume of the enzyme used in the assay.
Other analyses
Mixed liquor suspended solids (MLSS) of activated sludge, chemical oxygen demand (COD) and SVI of wastewater, Table 2, were analyzed according to Standard Methods [17]. The efficiency (E) of COD removal (in %) was calculated as follows: E (%) = [(C influent – C effluent) / C influent] x 100, where C influent is the concentration in the influent stream, C effluent is the concentration in the effluent stream
Table 2. Parameters of the system analyzed according to Standard Methods
Parameter Value
Chemical oxygen demand (COD) 300 [mg/l] Mixed liquor suspended solids(MLSS) 556 [mg/l] Sludge volume index (SVI) 78 [ml/g] Dissolved Oxygen (DO) 1.8 ±0.2 [mg/l]

ENZYMATIC ACTIVITY STUDIES OF BIOLOGICAL WASTEWATER TREATMENT
121
Figure 3. COD removal efficiency of the SBR.
ACKNOWLEDGMENTS This study was supported by the Department of Technical Sciences University of Sapientia.
REFERENCES 1. Raunkjær K., Hvitved-Jacobsen T., Nielsen P.H., Measurement of pools of protein,
carbohydrate and lipid in domestic wastewater. Water Res, 1994, 28(2), 251. 2. Levine A.D., Tchobanoglous G., Asano T., Characterization of the size distribution
of contaminants in wastewater: treatment and reuse implications. J Water Pollut Control Fed, 1985, 57, 805.
3. Nikaido H., Porins and specific channels of bacterial outer membranes. Mol Microbiol, 1992, 6, 435.
4. Aurore C., Arnaud C., Jean-Claude B., Availability of low and high molecular weight substrates to extracellular enzymes in whole and dispersed activated sludges. Enzyme and Microbiol Technology, 2002, 31, 179.
5. Vetter Y.A., Deming J.W., Growth rates of marines bacterial isolates on particulate organic substrates solubilized by freely released extracellular enzymes. Microb Ecol, 1999, 37(2), 86.
6. Wetzel R.G., Extracellular enzymatic interactions: storage, redistribution and interspecific communication. In: Chróst R.J., editor. Microbial enzymes in aquatic environments. New York: Springer, 1991.
7. Frølund B., Palmgren R., Keiding K., Nielsen P., Extraction of extracellular polymers from activated sludge using a cation ion exchange resin. Water Res, 1996, 30(8), 1749.

SZILVESZTER S., RÁDULY B., MIKLÓSSY I., ÁBRAHÁM B., LÁNYI S., D.R. NICOLAE
122
8. Molina-Munoz M., Poyatos J.M., Vilchez R., Hontoria E., Rodelas B., Gonzalez-Lopez J., Effect of the concentration of suspended solids on the enzymatic activities and biodiversity of a submerged membrane bioreactor for aerobic treatment of domestic wastewater. Appl Microbiol Biotechnol, 2007, 73(6), 1441.
9. Sponza D.T., Investigation of extracellular polymer substances (EPS) and physico-chemical properties of different activated sludge flocs under steady-state conditions. Enzyme and Microbial Technology, 2003, 32(3), 375.
10. Guang-Hui Yu, Pin-Jin He, Li-Ming Shao, Duu-Jong Lee, Enzyme activities in activated sludge flocs. Appl Microbiol Biotechnol, 2007, 77(3), 605.
11. Ramesh A., Lee D.J., Lai J.Y., Membrane biofouling by extracellular polymeric substances or soluble microbial products from membrane bioreactor sludge. Appl Microbiol Biotechnol, 2006, 74(3), 699.
12. Al-Rekabi W.S., Qiang H., Qiang W.W., Review on Sequencing Batch Reactors. Pakistan Journal of nutrition, 2007, 6(1), 11.
13. Nopens I., Capalozza C., Vanrolleghem P.A., Stability analysis of a synthetic municipal wastewater, Univ. Gent, 2001, weblink: http://biomath.ugent.be/~peter/ ftp/pvr334.pdf
14. Gessesse A., Dueholm T., Petersen S.B., Nielsen P.H., Lipase and protease extraction from activated sludge. Water Res, 2007, 37, 3652.
15. Xiao Z., Storms R., Tsang A., A quantitative starch-iodine method for measuring alpha-amylase and glucoamylase activities. Analytical Biochemistry, 2006, 351, 146.
16. Goel R., Mino T., Satoh H., Matsuo T., Enzyme activities under anaerobic and aerobic conditions in activated sludge sequencing batch reactor. Wat. Res, 1988, 32(7), 2081.
17. APHA, Standard methods for the examination of water and wastewater, American Public Health Association, Washington, DC, USA, 1998.

STUDIA UNIVERSITATIS BABEŞ-BOLYAI, CHEMIA, LIV, Sp.Iss. 2, 2009
POLYISOBUTYLENE-POLY(POLY(ETHYLENE OXIDE) (METH)ACRYLATE) BLOCK COPOLYMERS AND CONETWORKS
ÁKOS SZABÓa,b,*, BÉLA IVÁNa,b
ABSTRACT. In our work, first a telechelic bromoisobutyrate-ended polyisobutylene macroinitiator was synthesized via quasiliving carbocationic polymerization and subsequent chain end modification. In the second step, quasiliving atom transfer radical polymerization (ATRP) of poly(ethylene oxide) methacrylate using the macroinitiator was performed. When ethyleneglycol dimethacrylate was further polymerized on the formed triblock copolymer, a conetwork with a unique structure was obtained.
Keywords: polyisobutylene, poly(ethylene oxide)-methacrylate, amphiphilic
block copolymers, amphiphilic conetworks, smart polymers
INTRODUCTION Hydrophobic polyisobutylene [1] and hydrophilic poly(ethylene oxide) [2]
are biocompatible polymers and are applied in therapeutics. However, homopolymers are not appropriate for novel smart medical applications [3]. Therefore, researchers focuse on novel smart macromolecular structures which could open new ways in therapeutical technologies [4].
Poly(poly(ethylene oxide) methacrylate)s are water-soluble homopolymers having lower critical solution temperature (LCST) [5] which is tunable with changing the length of the poly(ethylene oxide) side chains [6]. Polymerization of poly(ethylene oxide) methacrylates is performed often by quasiliving atom transfer radical polymerization (ATRP) [5,7,8] which gives well-defined polymer structures. In our work, amphiphilic triblock copolymers composed of hydrophobic polyisobutylene and hydrophilic poly(poly(ethylene oxide) methacrylate) segments were synthesized by ATRP. During these processes 2-bromoisobutyrate-telechelic polyisobutylene macroinitiators were used [9].
a Chemical Research Center of the Hungarian Academy of Sciences, Institute of Materials and
Environmental Chemistry, Department of Polymer Chemistry and Material Science, Budapest, Hungary; www.chemres.hu/aki/polychem
b Eötvös Loránd University, Institute of Chemistry, Budapest, Hungary; www.chem.elte.hu * E-mail: [email protected]

Á. SZABÓ, B. IVÁN
124
Amphiphilic conetworks are polymer networks composed of covalently bonded hydrophobic and hydrophilic segments which swell both in polar and non-olar solvents [10]. One of the ways of its synthesis is „endlinking” of block copolymers [11]. The main advantage of these conetworks is the well-defined length of the segments. We also obtained conetworks by endlinking of poly(poly(ethylene oxide) methacrylate)-b-polyisobutylene-b-poly(poly(ethylene oxide) methacrylate) block copolymers. Previously, such copolymers were synthesized by Janata et al., however, they performed copolymerization of poly(ethylene oxide) methacrylates and methacrylate-telechelic polyisobutylene [12] which does not result in well-defined segment lengths. RESULTS AND DISCUSSION Synthesis of 2-bromoisobutyrate-telechelic polyisobutylene (5)
ATRP initiator 2-bromoisobutyrate-telechelic polyisobutylene (5) was synthesized via quasiliving carbocationic polymerization of isobutylene followed by chain end modification (Scheme 1).
Scheme 1.
C(CH3)2
(n + m)quasiliving carbocationic polymerization
+ Si
+ 9-borabicyclononane (9-BBN)
+ H2O2/KOH
Cl
C(CH3)2 Cl(CH3)3C
C(CH3)2 CH2
C(CH3)2(CH3)3C
C(CH3)2 Cln
CH2 C(CH3)2 Clm
C(CH3)2 CH2
C(CH3)2(CH3)3C
C(CH3)2 CH2n
CH2 C(CH3)2m
CH CH2
CH2 CH CH2
C(CH3)2 CH2
C(CH3)2(CH3)3C
C(CH3)2 CH2n
CH2 C(CH3)2m
OH
CH2 OH3
3
C(CH3)2 CH2
C(CH3)2(CH3)3C
C(CH3)2 CH2n
CH2 C(CH3)2m
O
CH2 O3
3CO C(CH3)2 Br
CO C(CH3)2 Br
C
CH3
CH3
BrCOBr+
+
1
2
3
4
5

POLYISOBUTYLENE-POLY(POLY(ETHYLENE OXIDE) (METH)ACRYLATE) BLOCK COPOLYMERS...
125
Quasiliving carbocationic polymerization of isobutylene was initiated by the bifunctional initiator 5-tert-butyl-1,3-dicumyl-chloride (1). Figure 1 shows the 1H NMR spectrum of the polyisobutylene (Mn = 7500) before the addition of allyl-trimethylsilane (2). The peaks of the chloro chain ends appear at 1.69 ppm (methyl groups) and 1.96 ppm (methylene groups). (The peak at 3.49 ppm belongs to methanol residue.) When the chloro-ended polyisobutylene (2) was reacted with allyltrimethylsilane under the conditions of the quasiliving carbocationic polymerization [13], allyl-telechelic polyisobutylene (3) was formed. The 1H NMR spectrum of the allyl-telechelic polyisobutylene (3) can be seen in Figure 2. The disappearance of the peaks at 1.69 and 1.96 ppm and the appearance of new peaks at 2.01 ppm, 5.0 ppm and 5.8 ppm confirms that the modification was nearly quantitative. After that, hydroxyl chain ends were synthesized via hydroboration and subsequent oxidizing reaction under alkaline conditions [13]. In the 1H NMR spectrum of 4 (Figure 3), the peaks of allylic chain ends disappear and a new peak appears at 3.61 ppm which confirms the nearly quantitative formation of the hydroxyl end groups. In the last step, an esterification was performed with 2-bromoisobutyryl bromide [9]. The disappearance of the peak of hydroxyl end groups and the appearance of a new triplet at 4.14 ppm on the 1H NMR spectrum (Figure 4) denotes the nearly quantitative formation of the 2-bromoisobutyrate-telechelic polyisobutylene macroinitiator (5). The macroinitiator with 11200 g/mol number average molecular weight was also formed nearly quantitatively by using these reactions.
7.0 6.5 6.0 5.5 5.0 4.5 4.0 3.5 3.0 2.5 2.0 1.5ppm
1.53
1.69
1.83
1.96
7.17
12 11 10 9 8 7 6 5 4 3 2 1 0 -1 -2ppm
Figure 1. 1H NMR spectrum of chloro-ended polyisobutylene (2)
(Mn = 7500 g/mol).

Á. SZABÓ, B. IVÁN
126
7.0 6.5 6.0 5.5 5.0 4.5 4.0 3.5 3.0 2.5 2.0 1.5ppm
1.56
1.71
1.83
1.99
2.02
4.955.04
5.83
5.86
7.17
12 11 10 9 8 7 6 5 4 3 2 1 0 -1 -2ppm
Figure 2. 1H NMR spectrum of allyl-telechelic polyisobutylene (3)
(Mn = 7500 g/mol).
7.0 6.5 6.0 5.5 5.0 4.5 4.0 3.5 3.0 2.5 2.0 1.5ppm
1.57
1.71
1.83
3.61
7.17
12 11 10 9 8 7 6 5 4 3 2 1 0 -1 -2ppm
Figure 3. 1H NMR spectrum of hydroxyl-telechelic polyisobutylene (4)
(Mn = 7500 g/mol).

POLYISOBUTYLENE-POLY(POLY(ETHYLENE OXIDE) (METH)ACRYLATE) BLOCK COPOLYMERS...
127
7.0 6.5 6.0 5.5 5.0 4.5 4.0 3.5 3.0 2.5 2.0 1.5ppm
1.63
1.71
1.83
1.94
1.97
2.00
4.14
7.17
12 11 10 9 8 7 6 5 4 3 2 1 0 -1 -2ppm
Figure 4. 1H NMR spectrum of 2-bromoisobutyrate-telechelic polyisobutylene (5)
(Mn = 7500 g/mol).
The gel permeation chromatograms of the polyisobutylenes obtained in the different steps (Figure 5) show that the initial narrow molecular weight distribution do not change during the different chain end modification reactions since one monomodal peak at same elution volume could be observed in all cases. The measured molecular weight of this polyisobutylene macroinitiator was 7500 g/mol, its polydispersity index was 1.09.
Figure 5. Gel permeation chromatograms of polyisobutylenes (Mn = 7500) obtained in the different steps of chain-end modification.
20 25 30
PIB(Cl)2 PIB(allyl)2 PIB(OH)2 PIB(O(CO)C(Me)2Br)2
elution volume / ml

Á. SZABÓ, B. IVÁN
128
Synthesis of the amphiphilic triblock copolymer
Quasiliving atom transfer radical polymerization (ATRP) of di(ethylene oxide)-methacrylate initiated by 2-bromoisobutyrate-telechelic polyisobutylene (5) was performed. The conversion was calculated on the basis of the 1H-NMR spectrum of the reaction mixture (Figure 6) taken at the end of the reaction since the chemical shift of the -COOCH2- groups of di(ethylene oxide)-methacrylate differs in the case of free monomer molecules (4.30 ppm) and polymerized monomeric units (4.10 ppm). These data indicate that 98% conversion was reached when CuCl was used as catalyst and toluene as solvent at 40 ºC after 94 h reaction time. The characteristic peak of the macroinitiator at 4.14 ppm is invisible in the 1H-NMR spectrum (Figure 6) which indicates that the initiator efficiency was also near to 100%. The gel permeation chromatogram (Figure 7) confirms this, since the peak shifts to the lower elution volumes as a consequence of the polymerization indicates the increase of the molecular weight of most of the chains. The formed amphiphilic triblock copolymer was not water soluble.
12 11 10 9 8 7 6 5 4 3 2 1 0 -1 -2ppm
Figure 6. 1H NMR spectrum of the reaction mixture at the end of the
poly(ethylene oxide)-methacrylate polymerization initiated by 2-bromoisobutyrate-telechelic polyisobutylene.
5 4 3 2 1ppm
1.10
1.41
1.82
1.93
3.39
3.57
3.62
4.10
4.30

POLYISOBUTYLENE-POLY(POLY(ETHYLENE OXIDE) (METH)ACRYLATE) BLOCK COPOLYMERS...
129
Figure 7. Gel permeation chromatogram of P((EO)2MA)-b-PIB-b-P((EO)2MA) triblock copolymer.
Synthesis of amphiphilic conetworks via ATRP
One of the important features of the living polymerizations is that the formed polymer is able to initiate subsequent polymerization with the same mechanism as it was produced with. So, the P((EO)2MA)-b-PIB-b-P((EO)2MA) block copolymer can also act as macroinitiator in ATRP processes. The bifunctional monomer ethyleneglycol dimethacrylate (EGDMA) was polymerized with this block copolymer as macroinitiator. The product was a gel (Figure 8) which was not soluble in any solvent (water, hexane, toluene, tetrahydrofurane, methanol, dichloromethane) indicating the network formation.
Figure 8. Photo of the gel obtained by linking P((EO)2MA)-b-PIB-b-P((EO)2MA)
block copolymers via ATRP of EGDMA after purification.
20 25 30
PIB(O(CO)C(Me)2Br)2 macroinitiator P((EO)2MA)-b-PIB-b-P((EO)2MA)
elution volume / ml

Á. SZABÓ, B. IVÁN
130
The product was purified via extraction with tetrahydrofuran, dichloromethane, acetone and methanol. The gel fraction was 65% after these extraction steps. The formed gel swells in polar solvents (water) and also in apolar solvents (hexane). The swelling ratio was 10% in water and 50% in hexane which indicates the amphiphilic characteristic of the gel. In toluene, which is good solvent for both the hydrophobic and for the hydrophilic segments, the swelling ratio was 460%.
The gel and the block copolymer was also investigated by differential scanning calorimetry (DSC) (Figure 9). For the block copolymer, glass transitions of both segments appear (two inflection points can be seen on the curve at temperature regions where the DSC curves of pure polyisobutylene and poly(poly(ethylene oxide) methacrylate) show also inflection points) although the glass temperature of the di(ethylene oxide) methacrylate (-38 ºC) is lower by 10 ºC than that for the homopolymer (-28 ºC). For the conetwork, only the glass transition of polyisobutylene can be observed at -62 ºC.
Figure 9. Differential scanning calorimetric curves.
Amphiphilic triblock copolymers were also synthesized by ATRP using different hidrophilic monomers, namely di(ethylene oxide) methyl-ether-methacrylate, poly(ethylene oxide) methyl ether methacrylate (M = 300 g/mol), di(ethylene oxide) ethyl ether acrylate and poly(ethylene oxide) methyl ether acrylate (M = 480 g/mol), and 2-bromoisobutyrate-telechelic polyisobutylene macroinitiator (5) with Mn = 11200 g/mol. After the reactions for 71 h reaction time, samples were withdrawn and ethyleneglycol dimethacrylate was added to the reaction mixtures under the same conditions. The conversions
-100 -75 -50 -25 0 25 50 75 100 125 150
PIB macroinitiator P((EO)2MA) homopolymer block copolymer amphiphilic conetwork
t / oC

POLYISOBUTYLENE-POLY(POLY(ETHYLENE OXIDE) (METH)ACRYLATE) BLOCK COPOLYMERS...
131
were determined by 1H-NMR spectra of the samples in the same way described above (Table 1). However, the characteristic methylene peak of the polymerized monomeric units has different chemical shift values in the case of the acrylates (4.20 ppm for di(ethylene oxide) ethyl ether acrylate and 4.16 ppm for poly(ethylene oxide) methyl ether acrylate) than in the case of methacrylates (4.10 ppm).
Table 1. The conversions reached in the ATRP-polymerizations
of different hydrophilic monomers after 71 h reaction time.
monomer conversion di(ethylene oxide) ethyl ether acrylate 90
poly(ethylene oxide) methyl ether acrylate 60 di(ethylene oxide) ethyl ether methacrylate 100
poly(ethylene oxide) methyl ether methacrylate 100
The conversion values show that the polymerization of methacrylates can be perfomed with higher efficiency. Since the characteristic peak of the non-reacting 2-bromoisobutyrate chain ends at 4.14 ppm is not visible in the 1H NMR spectra, we can state that the initiator efficiency was near to 100% in each case.
Table 2. Gel fractions and swelling ratios in water and hexane of conetworks formed by linking block copolymers with different hidrophilic monomer units.
hydrophilic monomer swelling ratio
name molar mass,(Da)
gel fraction,
(%) in water,
(%) in hexane,
(%)
di(ethylene oxide) ethyl ether acrylate 188 36 7 47
poly(ethylene oxide) methyl ether acrylate 480 22 49 14
di(ethylene oxide) methyl ether methacrylate 188 61 8 43 poly(ethylene oxide) methyl ether
methacrylate 300 43 20 20
Since the obtained conetworks swelled in both water and hexane,
we can state that amphiphilic conetworks were formed in our experiments. The data in Table 2 also show that as expected, the longer poly(ethylene oxide) side chains result in higher swelling ratio in water and lower swelling ratio in hexane.

Á. SZABÓ, B. IVÁN
132
CONCLUSIONS In the course of our work bifunctional 2-bromoisobutyrate-telechelic
polyisobutylene macroinitiators were synthesized via quasiliving carbocationic polymerization of isobutylene and subsequent chain end modification. Quasiliving atom transfer radical polymerization of different poly(ethylene oxide) (meth)acrylates was also performed using the polyisobutylene macroinitiator and novel amphiphilic triblock copolymers (P(PEOMA)-b-PIB-b-P(PEOMA)) were synthesized.
Bifunctional monomer ethyleneglycol dimethacrylate was also polymerized using the block copolymers as macroinitiator, and novel amphiphilic conetworks, which swell in both water and hexane, were obtained in this way. EXPERIMENTAL SECTION Synthesis of 2-bromoisobutyrate-telechelic polyisobutylene macroinitiator (5)
Synthesis of 2-bromoisobutyrate-telechelic polyisobutylene macroinitiator (5) was performed using methods described in the literature [9, 13]. Quasiliving carbocationic polymerization of isobutylene was performed in dichloromethane: hexane (45:55 V/V) solvent mixture under nitrogen atmosphere at -78 ºC. Bifunctional 5-tert-butyl-1,3-dicumyl-chloride (1) was used as initiator (0,005 M), TiCl4 as coinitiator (0,06 M) and tetramethyl-ethylenediamine as nucleophilic additive (0,01 M). The chains (2) were terminated at the end of the polymerization with allyl-trimethylsilane (it was in twofold amount relative to the chain ends). The obtained allyl-telechelic polyisobutylene (3) was dissolved in tetrahydrofurane and reacted with 9-borabicyclononane (9-BBN) solution (in fivefold amount of 9-BBN relative to the chain ends). Subsequently, alkaline H2O2 solution was added to the reaction mixture at 0 ºC to get hydroxyl-telechelic polyisobutylene (4). In the last step, hydroxyl-telechelic polyisobutylene was reacted with 2-bromoisobutyryl-bromide in the presence of 4-dimethylaminopyridine (both of them was added in fivefold amount relative to the chain ends) resulting in 2-bromoisobutyrate polyisobutylene macroinitiator (5). We synthesized this macroinitiator with 7500 g/mol and with 11200 g/mol number average molecular weights.
Synthesis of the block copolymer
Poly(poly(ethylene oxid) methacrylate)-b-polyisobutylene-b-poly(poly(ethylene oxide) methacrylate) block copolymers were synthesized by quasiliving atom transfer radical polymerization (ATRP). 2-Bromoisobutyrate-telechelic polyisobutylene (5) was used as initiator, purified CuCl (in the same amount as the initiating chain ends) as catalyst and hexamethyl-triethylene-tetramine (also in the same amount as the initiating chain ends) as complexing agent. The polymerization was performed in toluene at 40 ºC under oxygen-

POLYISOBUTYLENE-POLY(POLY(ETHYLENE OXIDE) (METH)ACRYLATE) BLOCK COPOLYMERS...
133
free conditions. Ascorbic acid was also added to the reaction system to reactivate the oxidized Cu-species. Poly(ethylene oxide) (meth)acrylates with different side chain lengths (di(ethylene oxide) methyl ether methacrylate, poly(ethylene oxide) methyl ether methacrylate M = 300 g/mol, di(ethylene oxide) ethyl ether acrylate and poly(ethylene oxide) methyl ether acrylate M = 480 g/mol), purified by a column filled with neutral Al2O3, were used as hydrophilic monomers. The reaction times were 71-94 h. The obtained polymers were purified by column chromatography with neutral Al2O3.
Synthesis of amphiphilic conetworks
Amphiphilic conetworks were synthesized also by ATRP. In these cases, the block copolymers were used as macroinitiators and bifunctional ethyleneglycol dimethacrylate (EGDMA, 4 EGDMA molecules per chain end) as monomer. The reaction times were 40-70 h. Other conditions were the same as for the synthesis of block copolymers. The conetworks were purified by extraction with tetrahydrofuran, dichloromethane, acetone and methanol.
Characterizations
The number average molecular weight, molecular weight distribution and polydispersity of the polyisobutylene macroinitiators were determined by gel permeation chromatography (GPC) using RI- and viscosity detectors. The eluent was tetrahydrofuran. The chromatograms of the block copolymers were also recorded, however, due to the different chemical behaviour of the hydrophobic and hydrophilic segments, quantitative evaluations could not be performed.
The structure of the macroinitiators and the block copolymers was investigated by 1H NMR spectroscopy (200 MHz) at room temperature. CDCl3 with 0,03% TMS was used as deuterated solvent.
In the case of the conetworks, the gel fractions were calculated as the ratio of the mass of the piece of gels after extraction to the original mass of the same piece of gels before swelling the conetworks in tetrahydrofuran, dichloromethane, acetone and methanol. The swelling ratios were calculated as the ratio of the mass of solvent taken up by the gel to the mass of the dry gel in water and hexane.
Differential scanning calorimetry (DSC) was carried out in N2-stream between -120 and 160 ºC with 10 ºC/min heating rate. The second „heat up” curves were evaluated. ACKNOWLEDGEMENTS
We would like to thank Mr. István Szanka for his useful comments, Dr. Márta Szesztay, Ms. Györgyi Szarka and Mrs. Erzsébet Tyroler for the GPC measurements, Mr. György Kasza for his help in the synthesis of 5-tert-butyl-1,3-dicumyl-chloride initiator, and Ms. Judit Szauer for the DSC measurements.
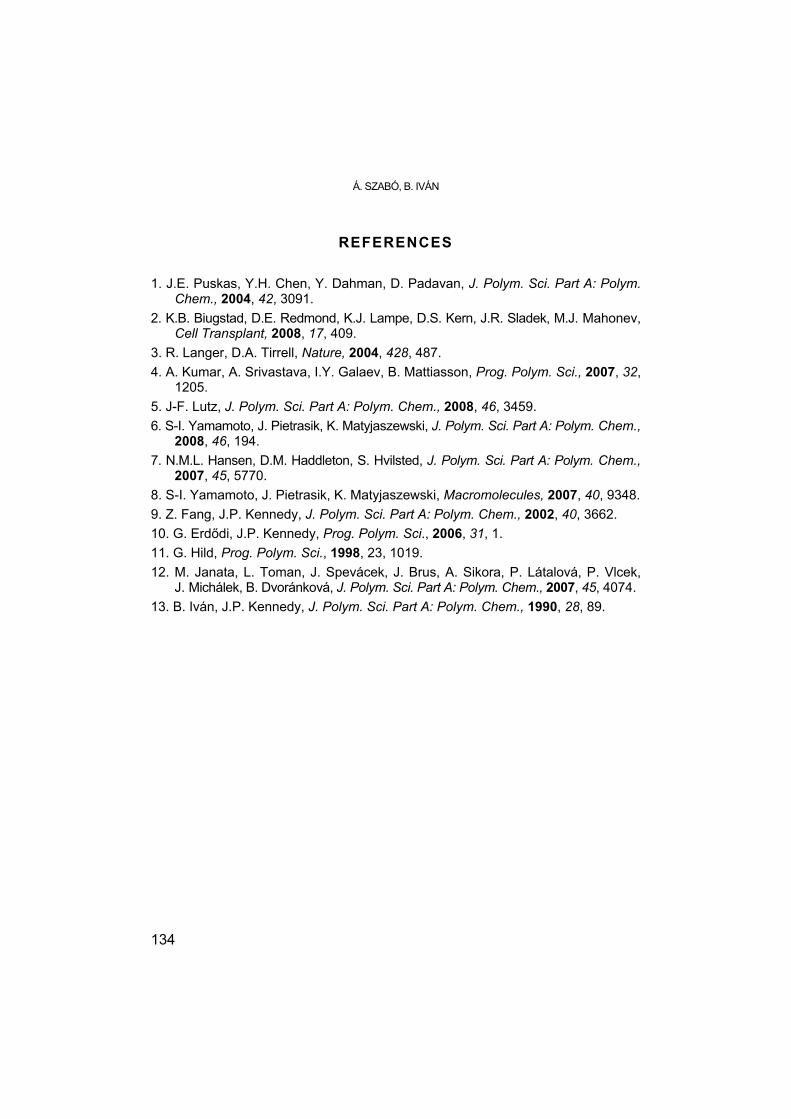
Á. SZABÓ, B. IVÁN
134
REFERENCES
1. J.E. Puskas, Y.H. Chen, Y. Dahman, D. Padavan, J. Polym. Sci. Part A: Polym.
Chem., 2004, 42, 3091. 2. K.B. Biugstad, D.E. Redmond, K.J. Lampe, D.S. Kern, J.R. Sladek, M.J. Mahonev,
Cell Transplant, 2008, 17, 409. 3. R. Langer, D.A. Tirrell, Nature, 2004, 428, 487. 4. A. Kumar, A. Srivastava, I.Y. Galaev, B. Mattiasson, Prog. Polym. Sci., 2007, 32,
1205. 5. J-F. Lutz, J. Polym. Sci. Part A: Polym. Chem., 2008, 46, 3459. 6. S-I. Yamamoto, J. Pietrasik, K. Matyjaszewski, J. Polym. Sci. Part A: Polym. Chem.,
2008, 46, 194. 7. N.M.L. Hansen, D.M. Haddleton, S. Hvilsted, J. Polym. Sci. Part A: Polym. Chem.,
2007, 45, 5770. 8. S-I. Yamamoto, J. Pietrasik, K. Matyjaszewski, Macromolecules, 2007, 40, 9348. 9. Z. Fang, J.P. Kennedy, J. Polym. Sci. Part A: Polym. Chem., 2002, 40, 3662. 10. G. Erdődi, J.P. Kennedy, Prog. Polym. Sci., 2006, 31, 1. 11. G. Hild, Prog. Polym. Sci., 1998, 23, 1019. 12. M. Janata, L. Toman, J. Spevácek, J. Brus, A. Sikora, P. Látalová, P. Vlcek,
J. Michálek, B. Dvoránková, J. Polym. Sci. Part A: Polym. Chem., 2007, 45, 4074. 13. B. Iván, J.P. Kennedy, J. Polym. Sci. Part A: Polym. Chem., 1990, 28, 89.

STUDIA UNIVERSITATIS BABEŞ-BOLYAI, CHEMIA, LIV, Sp.Iss. 2, 2009
MODELLING THE BIOCHEMICAL PROCESSES OF THE ACTIVATED SLUDGE WASTEWATER TREATMENT
RÁDULY BOTONDa, CROGNALE SILVIAb, SZILVESZTER SZABOLCSa, MÉSZÁROS SÁNDORa
ABSTRACT. Modelling and simulation of the activated sludge wastewater treatment processes proved to be very useful in the design, upgrade, control, evaluation and optimisation of wastewater treatment plants. This paper introduces existing activated sludge models and discusses empirical modelling techniques that can be used for the above tasks. Besides the description of the „traditional” Activated Sludge Models (ASMs), the paper suggests that Artificial Neural Network (ANN) models can successfully be used for many modelling applications, outperforming the ASMs in some aspects. Advantages and disadvantages of the different modelling techniques are also discussed.
Keywords: modelling, activated sludge, wastewater treatment, artificial neural
networks INTRODUCTION
Modelling and simulation can significantly contribute to the understanding and design of activated sludge wastewater treatment plants (WWTPs). A mathematical model of a WWTP, which is able to predict how the WWTP will react under various operating conditions, is an excellent tool for the design, analysis, control, forecasting and optimization of WWTPs, helping to assure high effluent quality.
A wastewater treatment plant model describes the biochemical and physical processes involved in the technical purification of wastewater. Through the biochemical processes the organic matter and nutrient content of the wastewater is eventually converted into carbon dioxide, nitrogen and a particulate fraction (cell material). The latter one can be removed from water by means of physical separation processes. Hence the activated sludge WWTP models usually consist of two interconnected sub-models: the activated sludge model and the settler model.
a Fundatia Sapientia Universitatea Sapientia, Facultatea de Stiinte Tehnice si Sociale, Pta Libertatii,
Nr. 1, RO-530104 Miercurea-Ciuc, Romania, [email protected] b Universita degli Studi della Tuscia, DABAC, Via San Camillo de Lellis SNC, 01100 Viterbo, Italia
RÁDULY B., CROGNALE S., SZILVESZTER S., MÉSZÁROS S.
136
MECHANISTIC WWTP MODELLING Activated sludge models
Mechanistic (theoretical) models are based on the underlying physics and bio-chemistry governing the behaviour of the processes involved in activated sludge wastewater treatment. Emphasis is put on the modelling of conversion processes in the biological reactor and on the hydrodynamic modelling of the settler tanks, and less on the hydraulic modelling of the whole treatment plant. WWTP models usually do not describe explicitly flow propagation through the reactors, as in most of the cases treatment plant hydraulics are not sufficiently well known and can only be approximated. A commonly applied simplification is that the plant is considered as a few constant-volume-continuously-stirred-tank-reactors (CSTR) in series. In this way the mixing phenomena are modelled.
The modelling of the biochemical processes is based on several basic kinetic equations, describing bacterial growth, substrate utilization and the endogenous metabolism (decay) of bacteria, as well as the hydrolysis of entrapped organics. In the last 40 years several activated sludge models have been developed, describing the biochemical processes in a various manner [1, 2, 3]. The “state-of-the-art models” for activated sludge processes are considered to be the ASM1 – ASM3 models developed by the IWA Task Group [4]. These models incorporate carbon oxidation, nitrification, denitrification, while ASM2d also describes the biological and chemical phosphorus removal. The ASM models have been “updated” several times since the first coming out of the ASM1 and most of the problems identified in the earlier versions have been corrected. The models are based on COD units (use Chemical Oxygen Demand to define carbonaceous material); ASM3 has a total organic carbon (TOC) based version as well. These models are presented in detail elsewhere [4], here only a short description of ASM3 will be provided.
ASM3 was developed to correct some of the deficiencies of the earlier ASM1 and to include the advances in activated sludge modelling achieved in the decade following the publication of ASM1 [5]. It includes 12 biochemical processes and 13 components. Neither biological nor chemical phosphorus removal processes are included in ASM3. However, these can easily be added to it. Siegrist et al. (2002) [6] developed a relatively simple Bio-P module for ASM3 which was able to deliver accurate prediction both for a Swiss municipal WWTP and a pilot plant.
The compounds present in the wastewater are divided in 13 categories; these constitute the state variables of ASM3:
SALK - alkalinity of the wastewater [mole HCO3
-/m3] SI - inert soluble organic material [g COD/m3]

MODELLING THE BIOCHEMICAL PROCESSES OF THE ACTIVATED SLUDGE WASTEWATER TREATMENT
137
SS - readily biodegradable organic substrates [g COD/m3] SN2 - di-nitrogen [g N2/ m3] SNH4 - ammonium plus ammonia nitrogen [g N/ m3] SNOX - nitrate plus nitrite nitrogen [g N/ m3] SO2 - dissolved oxygen [g COD/m3] TSS - total suspended solids (the same as XSS) [g/m3] XA - nitrifying organisms [g COD/m3] XH - heterotrophic organisms [g COD/m3] XI - inert particulate organic material [g COD/m3] XS - slowly biodegradable substrates [g COD/m3] XSS - suspended solids [g/m3] XSTO - organics stored by heterotrophic organisms [g COD/m3] There are a total of 12 biochemical processes modelled in ASM3.
Figure 1 presents in a schematic way how the different compounds participate in the conversion processes. The kinetic expressions of the conversion processes are presented in detail by Henze et al. [4], here only a list of them is provided:
- hydrolysis of organic matter in readily available soluble substrate - anoxic and aerobic storage of soluble substrate - growth of heterotrophic organisms under aerobic and anoxic
conditions - endogenous respiration of the heterotrophic organisms under
aerobic and anoxic conditions - aerobic growth of autotrophic organisms - aerobic and anaerobic endogenous respiration of the autotrophic
organisms - aerobic and anaerobic endogenous respiration of the storage
products Figure 1. Flow of COD in ASM3 (redrawn from Henze et al., 2000).
The heterotrophic biomass includes cell internal organic
storage products. Endogenous respiration is modelled for
aerobic and anoxic conditions, both for the biomass and
the storage products.

RÁDULY B., CROGNALE S., SZILVESZTER S., MÉSZÁROS S.
138
Settler models
Without a settler model the mass balance of an activated sludge WWTP using biomass recirculation cannot be closed. The clarifier models are based on settling functions, which evaluates the settling velocity of the particles, depending mainly on the solids concentration. The most popular models are simple 1-D models based on the layer approach (frequently the model proposed by Takács et al. [7]). These models describe settling and thickening with an acceptable level of accuracy and have a low computational demand. 1-D models are adequate for coupling with the activated sludge models because they give a reasonable approximation of the sludge balance and of the sludge shift from the aeration tank to the secondary clarifier. Conversion processes are typically not included in these models, being considered less important [8]. In practice clarifier models are implemented using the layer approach, which is a method for applying the flux theory in computer code. The settler tank is divided in horizontal layers and the differential form of the mass conservation equation is solved in each layer. The sludge coming from the activated sludge tanks usually enters the 5th layer of the clarifier. The problem of model complexity
The problem of model complexity rises from the belief that the more detailed a model is, the more accurate its prediction capability will be. Thus models were developed to include more and more knowledge for a better description of the phenomena modelled. Consequently models become more and more complicated, with too many parameters, and thus hard to calibrate, hence overparametrisation occur [9]. Another drawback of model complexity is the high computational demand of the too detailed models. WWTP models have to describe a wide range of processes with a varying timescale of the phenomena described (from seconds for the airflow rate in WWTPs to seasons for the temperature), resulting in a very stiff system of differential equations which is hard to solve numerically. Model stiffness is further worsened by the introduction of control loops, which stand in the way of using stiff numerical solvers and increase simulation time even more [10]. EMPIRICAL WWTP MODELLING
Unlike mechanistic models, empirical models do not use a priori knowledge of the underlying processes, but they are identified from input-output data (measured data). Empirical models address in a radical way the problems of mechanistic models, namely the high complexity and low simulation

MODELLING THE BIOCHEMICAL PROCESSES OF THE ACTIVATED SLUDGE WASTEWATER TREATMENT
139
speed. Data-based models may have a better practical value because of the infinite complexity of the underlying phenomena: according to the empiricists it is not needed to exactly know the phenomena, it is enough to have good input/output response. As to the simulation speed, empirical models consist of simple algebraic equations, and thus they may be several orders of magnitude faster than their mechanistic counterparts.
Among the empirical modelling techniques artificial neural networks (ANN) are more frequently used for WWTP modelling [11, 12, 13]. A neural network model consists of a set of parallel interconnected simple computational units, called neurons. Such a model resembles the brain in two aspects: (1) knowledge is acquired by the neurons through a learning process and (2) inter-neuron connection strengths, known as synaptic weights, are used to store the knowledge [14]. The learning process encompasses the adjustment of the weights of each processing unit, and can be seen as teaching the network to yield a particular response to a specific input [15]. Learning is accomplished by using a so called “training algorithm” that is a mathematical formulation of the rules that determine the magnitude of weight adjustment. If properly trained, the ANN is able to generalize from the examples used for training. RESULTS AND DISCUSSION
The ANN modelling of the activated sludge processes has several specific aspects that are not commonly listed amongst ANN training instructions. As ANN modelling of WWTP plants is a relatively unknown field, we conducted a number of experiments in order to assess the effect of different ANN-related parameters on the prediction of the activated sludge variables
As a result of our series of experiments, three important aspects of ANN modelling of the activated sludge processes have been recognized. These aspects concern the composition of input dataset, the length of the training data set, and the network architecture.
a) Length of the training dataset: as many of the activated sludge biochemical processes have low dynamics, the data used for training has to cover several months. In case when temperature effects have also to be considered, one have to use at least half year of training data: this is the time needed for the wastewater’s temperature to change from it’s minimum to it’s maximum value (winter-summer). For a good training one should cover the whole temperature range, so that the ANN could learn from a representative sample. When artificially generated influent data is used for training, the temperature profile can also be modified in a way that the temperature profile that is normally observed over a complete year is squeezed into a six months period. This leads to better predictions.
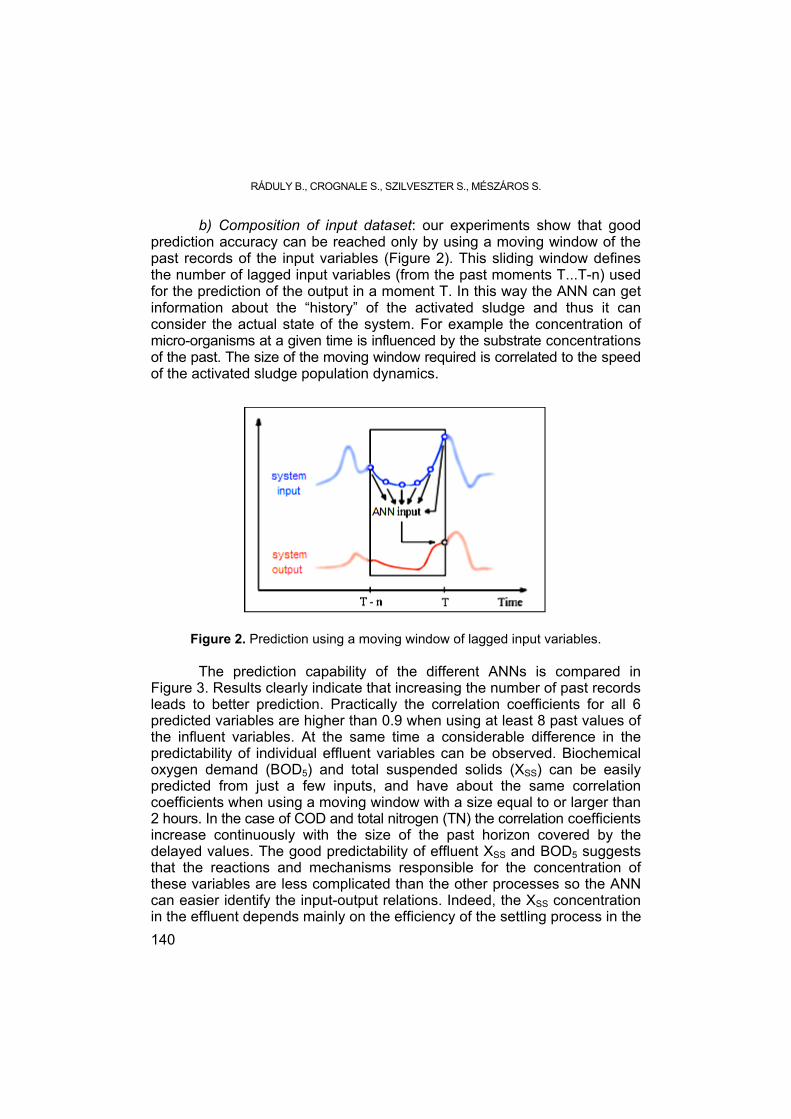
RÁDULY B., CROGNALE S., SZILVESZTER S., MÉSZÁROS S.
140
b) Composition of input dataset: our experiments show that good prediction accuracy can be reached only by using a moving window of the past records of the input variables (Figure 2). This sliding window defines the number of lagged input variables (from the past moments T...T-n) used for the prediction of the output in a moment T. In this way the ANN can get information about the “history” of the activated sludge and thus it can consider the actual state of the system. For example the concentration of micro-organisms at a given time is influenced by the substrate concentrations of the past. The size of the moving window required is correlated to the speed of the activated sludge population dynamics.
Figure 2. Prediction using a moving window of lagged input variables. The prediction capability of the different ANNs is compared in
Figure 3. Results clearly indicate that increasing the number of past records leads to better prediction. Practically the correlation coefficients for all 6 predicted variables are higher than 0.9 when using at least 8 past values of the influent variables. At the same time a considerable difference in the predictability of individual effluent variables can be observed. Biochemical oxygen demand (BOD5) and total suspended solids (XSS) can be easily predicted from just a few inputs, and have about the same correlation coefficients when using a moving window with a size equal to or larger than 2 hours. In the case of COD and total nitrogen (TN) the correlation coefficients increase continuously with the size of the past horizon covered by the delayed values. The good predictability of effluent XSS and BOD5 suggests that the reactions and mechanisms responsible for the concentration of these variables are less complicated than the other processes so the ANN can easier identify the input-output relations. Indeed, the XSS concentration in the effluent depends mainly on the efficiency of the settling process in the

MODELLING THE BIOCHEMICAL PROCESSES OF THE ACTIVATED SLUDGE WASTEWATER TREATMENT
141
secondary clarifier and less on the biochemical reactions in the bioreactor. Hence it is affected very much by the flow rate to the treatment plant and gives sudden response to flow rate changes. The same holds for BOD5, which is strongly related to the output XSS concentration. The reactions of COD and N-products are more complex and take more time, hence the prediction of these variables is more difficult.
Figure 3. Prediction accuracy vs. size of moving window of lagged input variables.
c) Network architecture: the use of the sliding windows of past input variables results in an increase of input nodes. Thus the ANNs with good prediction capacity were all very big, consisting of a total of about 200 neurons. Our results (Table 1) show that network architecture does not have a drastic effect on prediction accuracy (unless the number of neurons in the hidden layer is extremely small). ANNs with only one hidden layer seem to predict slightly worse than ANNs with 2 hidden layers. With respect to learning speed, one can state that ANNs with two hidden layers learn faster than one-layered ANNs with the same number of neurons. The gain in learning speed is increasing together with increasing ANN complexity, reaching 40% in the case of ANNs with 35 hidden nodes. One may note that the time needed for training rises fast with increasing number of hidden nodes, while the prediction gets only slightly more accurate. Thus, the use of too large ANNs is not recommended, and a two-layered configuration should be preferred against a single hidden layer in the interest of minimizing the length of the ANN training phase.

RÁDULY B., CROGNALE S., SZILVESZTER S., MÉSZÁROS S.
142
Table 1. Influence of network architecture on ANN performance.
No. of hidden nodes Layer 1 Layer 2
Training time (s) Mean R2
20 - 161 0.972 25 - 198 0.973 35 - 272 0.973 14 6 150 0.973 15 10 171 0.973 20 15 215 0.975
The prediction accuracy of a well-built ANN can be satisfactory for many model applications. The mean prediction accuracy of our best performing ANN are presented in Table 2.
Table 2. ANN prediction performance indicators,
relative to the mechanistic model predictions.
Predicted variable BOD5 XSS COD SNH4 TKN TN R2 0.990 0.990 0.978 0.975 0.975 0.958 Mean relative error (%) 1.27 1.35 1.62 2.59 2.52 2.97
A sequence of simulated effluent concentration variables obtained with the two modeling approaches is provided in Figure 4. The simulation results presented in Figure 4 illustrate that the ANN performs quite well for effluent COD and BOD5 prediction, whereas results are a little bit less good for effluent TN and SNH4 predictions. Diurnal effluent pollutant concentration variations are well predicted by the ANN, resulting for example in sharp effluent ammonia (SNH4) peaks on dry weather days. These peaks are caused by the variable ammonia load of the household wastewater; they occur twice a day (early morning and late afternoon) in concordance with household habits.
On day 6493 a rain event is visible, and as can be seen, the capacity of the activated sludge plant to remove pollutants is exceeded at peak influent flow rate and both model approaches are able to predict this. During the rain event the increased hydraulic load of the WWTP causes activated sludge losses through the secondary clarifier, the bioreactors being “washed out”. Thus increased amount of organic material will be present in the effluent (see BOD and COD peaks).
The simulation speed of this ANN is about 0.8 years/sec, while training took 5 minutes. The total time needed for training data generation, training, simulation and additional processing is below 13 minutes all together. This is about 16 times less than the time needed for simulation with the mechanistic

MODELLING THE BIOCHEMICAL PROCESSES OF THE ACTIVATED SLUDGE WASTEWATER TREATMENT
143
model (~7 hours in this case). Solving the numerous differential equations of the complex activated sludge processes is very compute-demanding, leading to very long simulation times. The ANNs are not operating with differential equations, thus they do not present a simulation slow-down. For model applications where simulation speed is essential and the prediction accuracy of the ANN model is considered to be adequate, the ANN model is the preferable choice over the mechanistic model of the WWTP [12].
Figure 4. Prediction of wastewater parameters with the mechanistic ASM3-based
model and the ANN model of the WWTP.
CONCLUSIONS While mechanistic modelling of activated sludge WWTPs is well-
estabilished by now and models can readily be found, there is little known about empirical modelling in this field. Our experiments show that ANN modelling is a powerful tool for reproducing the input/output relationships of WWTPs. Static backpropagation neural networks performed well, even if the modeled system was of great complexity. It has been shown that the composition of input data set has the biggest influence on the ANNs prediction accuracy, while network architecture has only a moderate effect on it. This means that predefined ANN architecture and training settings can be used for the modelling of different

RÁDULY B., CROGNALE S., SZILVESZTER S., MÉSZÁROS S.
144
WWTP layouts, making the ANN modelling available also for modelers with no background in neural networks. The resulting ANNs are good enough to replace the original WWTP model in many modelling applications and bring a significant increase in simulation speed. Possible application areas include WWTP performance prediction over a long period of time, for example in the frame of evaluating plant designs, and sub-model substitution in integrated urban water quality modelling.
EXPERIMENTAL SECTION The parameters examined during the ANN tests were: type of
learning algorithm, network architecture, length of training data, sample frequency of training data and components of the input data. Several hundreds of ANNs have been evaluated during the test, in terms of prediction capability, training time and simulation speed. In all of the cases static feedforward backpropagation ANNs were trained to predict six wastewater parameters: BOD5, TN, total Kjeldahl nitrogen (TKN), dissolved ammonium (SNH4), XSS and COD. The ANNs had always tan-sigmoid transfer functions in all nodes, except the output neurons, where linear transfer functions have been used. Neural Network toolbox of Matlab 7.3 (The Mathworks, Inc.) has been used for the development, testing and application of the different ANNs. All of the learning algorithms of the named toolbox have been tested, and the scaled conjugate gradient algorithms were found to give the best results. Early stopping and Bayesian regularization were used for more efficient training and for avoiding overfitting. The 0.85 value of the performance parameter ratio was found to be best suitable for the given task.
Since it is very difficult to find good quality WWTP influent and effluent data, the influent and effluent files of the International Water Association’s Benchmark Simulation Plant no. 1 (BSM1) have been used for ANN training purposes. The BSM1 has a five-compartment reactor: the first two compartments, 1000 m3 each, are non-aerated and fully mixed. The last three compartments have a volume of 1333 m3 each, and are aerated. In the last compartment the dissolved oxygen level is maintained at 2 mg/l with the use of a PI controller. The BSM1 layout has no primary clarifier, the input to the plant is considered to be one that has already undergone primary treatment. The secondary settler tank has a volume of 6000 m3 and a surface area of 1500 m2. The feed point to the settler is 2.2 m from the bottom. The complete specifications of the BSM1 plant layout can be found in Copp, 2002 [16]. For long-term simulation phases the BSM1 was fed with influent data created with an influent disturbance scenario generator [17].
The specifications of the best performing ANN of our test series are given in Table 3.

MODELLING THE BIOCHEMICAL PROCESSES OF THE ACTIVATED SLUDGE WASTEWATER TREATMENT
145
Table 3. Configuration of the best performer ANN.
ANN type Static, feedforward, backpropagation Training algorithm Conjugate gradient with Polak-Ribiere updates Initial weights Random Gaussian distribution Stopping criterion Cross-validation Number of neurons 145 / 35 / 25 / 6 Neuron types Tan-sig / Tan-sig / Tan-sig / Linear Input window size 20 hours Data processing Zero-mean normalization [-1,+1] Training/validation 6 / 1 (every 7th sample used for validation) Optimization Regularization, PPR = 0.85
REFERENCES 1. W.W. Eckenfelder, “Industrial Water Pollution Control”. McGraw-Hill, New York,
1966. 2. G. v. R. Marais and G.A. Ekama, The Activated Sludge Process: Part 1 - Steady
State Behaviour, Water SA, 1976, 2, 163. 3. A.C. Van Haandel, G.A. Ekama and G.v.R. Marais, The Activated Sludge Process:
Part 3 - Single Sludge Denitrification, Water Research, 1981, 15, 1135. 4. M. Henze, W. Gujer, T. Mino, M.C.M. van Loosdrecht, “Activated Sludge Models
ASM1, ASM2, ASM2d, and ASM3”. IWA Scientific and Technical Report n. 9. IWA Publishing, London, UK, 2000.
5. W. Gujer, M. Henze, T. Mino and M.C.M. van Loosdrecht, Activated sludge model No. 3. Water Science and Technology, 1999, 39(1), 183.
6. H. Siegrist, L. Rieger, G. Koch, M. Kühni and W. Gujer, The EAWAG Bio-P module for activated sludge model No. 3. Water Science and Technology, 2002, 45(6), 61.
7. I. Takács, G.G. Patry and D. Nolasco, A dynamic model of the clarification thickening process. Water Research, 1991, 25(10), 1263.
8. G.A. Ekama, J.L. Barnard, F.W. Gunthert, P. Krebs, J.A. McCorquodale, D.S. Parker and E.J. Wahlberg: “Secondary settling tanks: theory, modelling and operation”. IAWQ Scientific and Technical Report no.6, London, 1997.
9. P. Harremoës and H. Madsen: Fiction and reality in the modelling world – balance between simplicity and complexity, calibration and identifiability, verification and falsification; Water Science and Technology, 1999, 39(9), 1.
10. U. Jeppsson, “On the verifiability of activated sludge system dynamics.” Teknisk Licentiat Thesis, KF Sigma, Lund, Sweden, 1993.

RÁDULY B., CROGNALE S., SZILVESZTER S., MÉSZÁROS S.
146
11. M.M. Hamed, M.G. Khalafallah and E.A. Hassanien: Prediction of wastewater treatment plant performance using artificial neural network. Environmental Modelling and Software, 2004, 19(10), 919.
12. B. Ráduly, K.V. Gernaey, A.G. Capodaglio, P.S. Mikkelsen, M. Henze, Artificial neural networks for rapid WWTP performance evaluation: Methodology and case study. Environmental Modelling & Software, 2007, 22(8), 1208.
13. K.P. Oliveira-Esquerre, M. Mori and R.E. Bruns, Simulation of an industrial wastewater treatment plant using artificial neural networks and principal component analysis. Brazilian Journal of Chemical Engineering, 2002, 19(4), 365.
14. S. Haykin, “Neural Networks.” Macmillan College Publishing Company, Inc, New York, 1994.
15. E. Loke, “Artificial neural networks in urban storm drainage”. PhD thesis, Dept. of Environmental Science and Engineering, Technical University of Denmark, Lyngby, Denmark, 1999.
16. J.B. Copp (ed.), “The COST Simulation Benchmark — Description and Simulator Manual”. ISBN 92-894-1658-0, Office for Official Publications of the European Communities, Luxembourg, 2002.
17. K.V. Gernaey, C. Rosen and U. Jeppsson, WWTP dynamic disturbance modelling – an essential module for long-term benchmarking development. Water Science & Technology, 2006, 53(4-5), 225.

STUDIA UNIVERSITATIS BABEŞ-BOLYAI, CHEMIA, LIV, Sp.Iss. 2, 2009 RAMAN STUDY OF INTERFACIAL INTERACTIONS IN CARBON
NANOTUBES(CNTs)-CeO2-Al2O3 INTEGRATED SYSTEM
HENG LIa,b, JIA CAI NIEa,*, SÁNDOR KUNSÁGI-MÁTÉb,**
ABSTRACT. Multiwalled carbon nanotubes (MWCNTs) were deposited from solution phase onto the nanostructured CeO2 film. New interfacial CNTs-CeO2 interactions were identified by Micro-Raman technique. Results show that the typical Raman signal of CNTs is modulated by the surface morphology. As a result of the CNTs-CeO2 interactions the G-peak of CNTs is split into two peaks. Different shift of G-peaks is detected when depositing CNTs onto CeO2 films having different morphologies.
Keywords: Carbon nanotube, CeO2, combinatorial materials, Raman, split, shift.
INTRODUCTION
Carbon nanotubes are a sort of attracting nanomaterials which has attracted wide interest in many areas of science and technology since 1991 [1,2]. The combination of CNTs with nanocrystals is expected to be useful for applications in catalysts, sensors or nanoelectronic devices [3] mainly because its optical and electronic properties are affected by the interface between the CNT and other materials. Several studies showed that deformation of nanotubes adsorbed on different substrate may occur [4]. Since the significant dependence of the electronic structure of CNTs on the conformation, this phenomenon offers a new method for appropriate justification of the optoelectronic properties of CNTs towards application requirements by controlling the surface morphology of the substrate.
As a very useful kind of wide-band-gap semiconductor, CeO2 has been extensively investigated not only because of its excellent biocompatibility, non-toxicity, high chemical stability, transmission in the visible and infrared regions, efficiency for absorbing ultraviolet radiation, but also since it is a key component of the catalyst used for eliminating contaminants in automobile exhaust gases [5-7].
a Department of Physics, Beijing Normal University, 100875, Beijing, People’s Republic of China * [email protected] b Department of General and Physical Chemistry, University of Pécs, H-7624 Pécs, Ifjúság
6, Hungary ** [email protected]

H. LI, J. C. NIE, S. KUNSÁGI-MÁTÉ
148
According to the advantages of CNTs-CeO2 system mentioned above great effort has been performed to coat CNTs with CeO2 nanoparticles [8-10], namely using CNTs as supporters. In contrast, only few studies focus on the other possibility: utilizing CeO2 film as substrate to deposit CNTs on its surface. Preparation of the CNTs-CeO2 combinatorial material on this way may offer stronger interfacial interactions and can result in a possible large deformation of CNTs.
Here we report deposition of CNTs onto the self-assembled CeO2 films formed on Al2O3 substrates [11]. The new interface formed between the later two surfaces was investigated by micro-Raman method. The splitting of the G-peak of CNT was investigated as the function of the surface morphology of the substrate. RESULTS AND DISCUSSION
The functionalized MWCNT-OH nanotubes were dissolved in methanol solvent and the saturated solutions were then characterized by photoluminescence (PL) spectrofluorometer (Jobin-Yvon/SPEX). Using 337 nm excitation wavelength, emission peak were detected at about 442 nm. This peak reflects presence of CNTs in the methanol solutions. This PL setup was then used to identify the carbon nanotubes adsorbed on the CeO2 surfaces. In the case of low surface coverage, no fluorescence signal could be detected by illumination of large surface area. This property probably due to the strong scattered light originated from the substrate region uncovered by the nanotube.
Figure 1. Raman spectra of CNT layer deposited onto the different CeO2 substrate
measured by the conventional method. The typical peaks of CNTs, G-, D- and also the typical peak of sapphire were indicated by arrows.

RAMAN STUDY OF INTERFACIAL INTERACTIONS IN CARBON NANOTUBES(CNTs)-CeO2-Al2O3 …
149
Conventional Raman measurement ended with same conclusion (see Figure 1): The G-peak of CNTs can only be observed, when the D-peak nearly submerged into the background. Considering the applicability of the confocal optical setup for direct investigation of the new CNT-CeO2 interface we applied micro-Raman technique for further studies. In this case the D- and G-peaks of CNTs can be observed clearly when the detection area and the excitation laser beam was exactly focused onto the sparsely distributed black spots (Fig.2). The G- and D-peaks are attributed to the C-C sp2 interaction (E2g) and the structural disorder in the graphite-like material, respectively [12,13]. At the same time two new peaks around 1400cm-1 were observed. It is obvious to attribute these two peaks to the new interactions presented between Al2O3 and CeO2 nanostructures since the following reasons: these peaks at about 1400cm-1 are not observed for the individual Al2O3 or CeO2 crystals. Previous studies showed that most of the characteristic peaks of these materials are located within the 200 cm-1 -1000cm-1 range. Furthermore, supposing that such peaks came from Al2O3 or CeO2, they should appear in one Raman spectra together with other typical peaks. However, in fact on one hand, in conventional Raman spectra the typical sharp peak of Al2O3 appears at 418cm-1 while nothing observed at 1400cm-1. The peaks at 1400cm-1
only dominate in the absence of the Raman active mode of CeO2 (F2g peak) at 464 cm-1. Mention, the mentioned new peaks are not typical peaks of CNTs. In addition, these peaks cannot reflect the new interface formed between CNTs and CeO2. When the G- and D- peak of CNTs are weakened, they are pronounced, namely they don’t appear together with typical peaks of CNTs.
Previous work [14] reported that the G-peak of CNTs at about 1580cm-1 splits into several peaks when the CNTs are strained, e.g. a tube bends and forms a ring. Now we paid more attention if such new interfacial interactions described above will bring some novel changes to the Raman signal of CNTs. Here we observed two interesting phenomena: i) similarly to the previous results, G-peak split into two individual peaks, which strangely discovered in micro Raman only. ii) using two CeO2 films with different morphologies, the G-peaks of CNTs show different Raman shifts by about 9cm-1.
Table 1. Thickness of CeO2 (t) and corresponding Raman shift
Sample Thickness t (nm) Typical Raman shift of CNTs (cm-1) CeO2-1 9.35 1590.4 CeO2-2 10.18 1581.2
Considering that during conventional Raman measurements never
such splitting or shifting of the G-peaks of CNTs was detected we can only associate these properties to the interfacial effect between Al2O3 substrate and CeO2 nanostructures. The CNTs adsorbed on the nanostructured CeO2 surface are very close to such interface and under strain the G-peak will split into two individual peaks. On two CeO2 films which have slightly different

H. LI, J. C. NIE, S. KUNSÁGI-MÁTÉ
150
thickness, the G-peak showed a 9cm-1 shift. If keeping in mind that the changes of CNTs are owing to the interfacial effect, it will be easy to understand this small difference between the Raman shifts. If we increase the mean grain size of CeO2 islands, the detected interfacial interactions, namely the intensity of Raman peaks will decrease and finally disappear while the F2g peak located at 460cm-1 and which is typical for CeO2 crystal will gradually arise. Figure 2 and 3 together with Table 1 clearly show decreased Raman intensity at increased thickness of CeO2. The G-peak also shows different shifts on these two substrates. Indeed, the interfacial interaction are very sensitive to the thickness especially in nanoscale and results in different deformation of CNTs. Finally it shows a shift and splitting of G-peak, indicating the in-plane symmetric C–C stretching.
Figure 2. Micro-Raman spectra of CNT layers deposited onto the different CeO2
substrates. The typical peaks of CNTs, G- and D- , the splitting of G-peaks and also the two typical peaks of the new interfacial interactions were indicated by arrows.
Figure 3. Typical XRD patterns of CeO2 films. The most intense peaks are CeO2 (002).
Laue oscillations were indicated by arrows.

RAMAN STUDY OF INTERFACIAL INTERACTIONS IN CARBON NANOTUBES(CNTs)-CeO2-Al2O3 …
151
CONCLUSIONS CNT layers were deposited onto the nanostructured CeO2 surfaces
originally grown on sapphire substrate. These combinatorial materials were investigated by Raman spectroscopy. Results reflect that the Raman signal of the CNTs is affected by the interactions presented within the CeO2-Al2O3 interface. Furthermore, the split of the G-peak of CNTs highly depends on the thickness of the CeO2 film. Since the morphology of CeO2 is easily controllable by the growth conditions, the optoelectronic properties of the CNTs can be tuned towards the application requirements.
EXPERIMENTAL SECTION All the CeO2 films were grown by pulsed laser deposition technique
and were then annealed at high temperature (1025°C) to form self-assembled nanostructures as described earlier [11]. Before CNTs deposition XRD was routinely employed to measure the thickness of CeO2 film [15]. The deposition method of CNTs is liquid phase epitaxy (LPE). Hydroxylated multiwalled CNTs (MWCNT-OH) powder was first dissolved by MeOH forming MWCNT-OH saturated solution. This solution was dropped onto nanostructured CeO2 films. The raw MWCNTs are 8-10 nm in diameter and 5-15 μm in length with the purity of more than 95%. Volume of the deposited CNTs can be controlled by using different number of drops. During evaporation of MeOH, the CNTs adsorbed onto the CeO2 surface. In details, 20 drops for each sample, each drop 10 μl, the interval between two drops is 25 min.
Conventional Raman spectra were recorded by Nicolet NXR 5700 FT–IR–Raman (UNICAM) photometer. Micro-Raman investigations of the samples were measured using a LabRam 600 spectrometer from Jobin-Yvon. The optimal confocal spatial and depth resolution is down to 1μm. The sample surface was illuminated with 632.8 nm monochromatic light with less than 10 mW/cm2 power density.
ACKNOWLEDGMENT
Authors thank Dr. Gerhard Frank (Institute for Microcharacterization, University of Erlangen, Germany) and Dr. Andrea Petz (Dept. of Inorganic Chemistry, Uni. Pécs, Hungary) for the microRaman and Raman measurements, respectively. This work was supported by the Chinese-Hungarian Intergovernmental S&T Cooperation Programme (Project No: CH-4-32/2008). This work was also supported partly by the National Natural Science Foundation of China (Grant Nos. 50772015 and 10974019) and the Program for New Century Excellent Talents in University of the Ministry of Education of China (Grant No. NCET-06-0129).

H. LI, J. C. NIE, S. KUNSÁGI-MÁTÉ
152
REFERENCES
[1] S. Iijima, Nature, 1991, 354, 56. [2] B. Peles-Lemli, P. Ács, L. Kollár, S. Kunsági-Máté, Fuller., Nanotub. And Carbon
Nanostruct, 2008, 16(4), 247-257. [3] X. Wei, X. Song, J. Xu, Y. Ni, and P. Zhang, Mater. Chem. Phys., 2005, 92, 159. [4] T. Hertel, R.E. Walkup, P. Avouris, Phys. Rev. B , 1998, 58, 13870. [5] A. Hartridge, M.G. Krishna, and K. Bhattacharya, J. Phys. Chem. Solids, 1998,
59, 859. [6] T. Suzuki, I. Kosacki, V. Petrovsky, and H.U. Anderson, J. Appl. Phys., 2002, 91,
2308. [7] See several papers in Catalysis and Automotive Pollution Control II, edited by
A. Crucq, Studies in Surface Science and Catalysis, Vol. 71 (Elsevier, Amsterdam, 1991); C. Morterra, V. Bolis, and G. Magnacca, J. Chem. Soc., Faraday Trans., 1996, 92, 1991; S. Tagliaferri, R.A. Koppel, and A. Baiker, Appl. Catal. B, 1998, 15, 159; J.M.A. Harmsen, J.H.B.J. Hoebink, and J.C. Schouten, Chem. Eng. Sci., 2001, 56, 2019.
[8] J.P. Huo, H.H. Song, X.H. Chen et al., Carbon, 2006, 44, 2849. [9] W. Zhang, T. Yang, X. Zhuang, Z. Guo, K. Jiao, Biosensors and Bioelectronics,
2009, 24, 2417. [10] J. Wei, J. Ding, X. Zhang, D. Wu, Z. Wang, J. Luo et al., Mater. Lett., 2005, 59, 322. [11] J.C. Nie, H. Yamasaki, and Y. Mawatari, Phys. Rev. B, 2004, 70, 195421. [12] A. Kasuya, Y. Sasaki, Y. Saito, K. Tohji, and Y. Nishina, Phys. Rev. Lett., 1997,
78, 4434. [13] C. Thomsen, S. Reich, Phys. Rev. Lett., 2000, 85, 5214. [14] Y. Ren, L. Song, W.J. Ma, Y.C. Zhao, L.F. Sun, C.Z. Gu, W.Y. Zhou, and S.S.
Xie, Phys. Rev. B, 2009, 80, 113412. [15] The thickness of CeO2 films was determined by the XRD Laue oscillations
using ( ) ( )[ ],sinsin2 1−−=
ii
tθθ
λ where θi and θi-1 are the positions of adjacent
satellites.

STUDIA UNIVERSITATIS BABEŞ-BOLYAI, CHEMIA, LIV, Sp.Iss. 2, 2009
FIXED BED STUDIES FOR Cd(II) REMOVAL FROM MODEL SOLUTIONS USING IMMOBILIZED BENTONITE/YEAST
MIXTURES MAJDIK CORNELIAa,*, HASNI OULD TFEILb, ANDRADA MĂICĂNEANUa,
CERASELLA INDOLEANa, SILVIA BURCĂa, TONK SZENDEc, MARIA STANCAa
ABSTRACT. This work presents experimental results obtained in the process of Cd2+ removal from model solutions using batch (magnetic stirring) and fixed bed procedures. As adsorbent we used a mixture consisting of bentonite and baker’s yeast (2, 4, 6 and 8 g in 1:0, 3:1, 1:1, 1:3 and 0:1 ratios), immobilized in calcium alginate. Adsorption capacities were calculated, and breakthrough curves were plotted in order to describe the influence of various working conditions (adsorbent type and ratio, initial cadmium concentration) over the process efficiency. Adsorption capacities up to 12.74 mg Cd2+/g adsorbent were calculated. Keywords: immobilized bentonite/yeast mixture, cadmium removal, adsorption,
breakthrough curve INTRODUCTION
Wastewaters contaminated with heavy metals represent a serious environmental problem because they do not undergo biodegradation and are accumulated [1] into vegetal and animal cells, with different toxic effects. Heavy metals can be released into the aqueous environment from a variety of sources such as metal smelters, effluents from plastic, textile, microelectronic and wood preservative-producing industry, and even fertilizer and pesticide usage [2]. In addition, mining, mineral processing and extractive-metallurgical operations also generate toxic liquid wastes.
Environmental engineers and scientists are facing with the challenging task to develop appropriate low cost technologies for effluent treatment [3]. Conventional methods for removing metals from aqueous solutions include a Universitatea Babeş-Bolyai, Facultatea de Chimie şi Inginerie Chimică, Str. Kogălniceanu Nr. 1,
RO-400028 Cluj-Napoca, România, *[email protected] b L’Office National d’Inspection Sanitaire des Produits de la Pêche et de l’Aquaculture (ONISPA),
B.P 1416, Nouadhibou, Mauritanie c Universitatea Sapientia, Facultatea Ştiinte şi Arte, Str. Matei Corvin, Nr. 4, RO-400112 Cluj-
Napoca, România

C. MAJDIK, H. O. TFEIL, A. MĂICĂNEANU, C. INDOLEAN, S. BURCĂ, S. TONK, M. STANCA
154
chemical precipitation, chemical oxidation or reduction, ion exchange, filtration, electrochemical treatment, reverse osmosis, membrane technologies and evaporation recovery. These processes may be ineffective or extremely expensive especially when the metals in solution are in the range of 1-100 mg/L [4]. Another major disadvantage with conventional treatment technologies is the production of toxic chemical sludge and its disposal/treatment becomes a costly issue and is not environmental friendly. Therefore, removal of toxic heavy metals to an environmentally safe level manner became a great importance process [3]. Cadmium is one of the most toxic heavy metals, heaving half-life of 10-30 years and its accumulation in human body affect kidney, bone and also causes cancer. Cadmium enters in the environment by natural (rock weathering, forest fires, and volcanic activities) and more important anthropogenic activities. Its use is increasing in industrial applications such as electroplating, pigments and electronic (batteries) industries. Mineral fertilizers applied on soil or solid wastes deposited in inappropriate places contains also cadmium compounds, which can be adsorbed on soil particles or can be mobilized in groundwater [5,6]. Because of its mobility in soil, cadmium may be transferred to plants and accumulated in roots, stems and leaves. As a consequence, because of the high toxicity of Cd2+, the crops may become unfit for animal and human consumption, and crop yields may be drastically reduced [5].
Beside conventional methods presented above, eco-friendly processes such as biosorption and phytoremediation are used more often in order to eliminate heavy metals from different environments [3,7]. Biomaterials of microbial and plant origin interact effectively (adsorption and bioaccumulation) with heavy metals. Due to their unique chemical composition, metabolically inactive dead biomass sequesters heavy metal ions and metal complexes from solutions, which obviates the necessity to maintain special growth-supporting conditions. Metal adsorption by various types of biomaterials can find enormous applications for removing and recovery of heavy metals from their solutions [8].
For the economical reason, researchers have paid much attention to various by-products from fermentation industry, such as Saccharomyces Cerevisiae, because they are produced in large quantities. Although Saccharomyces Cerevisiae is a mediocre biosorbent, it is extensively examined as a biomaterial in biosorption studies for heavy metals removal [8]. Vieira et al. have shown that the questioned yeast has commercial application as biosorbent because at least four reasons. In the first place, Saccharomyces Cerevisiae is easy to cultivate at large scale; as a result it can grow with unsophisticated fermentation techniques and inexpensive growth media. Second, the biomass of Saccharomyces Cerevisiae can be obtained from various food and beverage industries. Third, Saccharomyces Cerevisiae is not

FIXED BED STUDIES FOR Cd(II) REMOVAL FROM MODEL SOLUTIONS …
155
usually a waste, but a commercial commodity and considered safe, therefore, biosorbent made from Saccharomyces Cerevisiae may be easily accepted by the public when applied in practice as it can be used at large scale with low cost, especially for treating of large amount of wastewater containing heavy metal in low concentration. Fourth, attempt is to use Saccharomyces Cerevisiae as biosorbent, but not the last, is an ideal model organism to identify the kinetics of the biosorption in metal ion removal, especially to investigate the interactions at molecular level [8].
Alginate beads are often used as a support for biomaterials because of their natural origin with no toxicity towards immobilised micro-organisms or environment and because of their biodegradability after utilisation [5].
Besides biomaterials, other natural cheap materials such as bentonite can be used with success to remove heavy metals from aqueous solutions. Removal of heavy metal ions such as lead, copper, cadmium, cobalt, iron, nickel, zinc from their solutions, was studied on bentonite (suspended in aqueous solution) from deposits situated all over the world [9-14].
In order to study the combined adsorptive properties of Saccharomyces Cerevisiae cells and bentonite, a series of mixtures consisting of bentonite and baker’s yeast, immobilized in calcium alginate were used to establish adsorption capacities towards cadmium from aqueous solution.
RESULTS AND DISCUSSION Batch study
The influence of the adsorbent type and ratio over the time evolution of cadmium concentration in batch conditions is presented in figure 1. Analyzing the decrease of concentration in time for all samples we observed some differences in the evolution of the adsorption process (cadmium concentration trends). In case of samples containing a higher quantity of baker’s yeast (8g D, 6g D + 2g B) it is easy to observe that adsorption takes place in three distinct regions corresponding to cell surface adsorption, membrane diffusion and adsorption equilibrium, [15]. These regions are evidenced on the graph by the presence of two steps. As the baker’s yeast quantity decreases, these specific regions are disappearing being replaced by a continuous decrease, evolution specific to inorganic adsorbents [14,16].
Adsorption equilibrium was reached in 90 minutes for betonite increasing to 150 minutes for the baker’s yeast. This decrease of the adsorption rate in case of baker’s yeast could be associated with the diffusion limitation of the heavy metal ions through the cellular membrane.

C. MAJDIK, H. O. TFEIL, A. MĂICĂNEANU, C. INDOLEAN, S. BURCĂ, S. TONK, M. STANCA
156
0
10
20
30
40
50
60
0 50 100 150 200
t, (min)
C, (
mg
Cd2+
/L) 6g D + 2g B
4g D + 4g B2g D + 6g B8g B8 g D
Figure 1. Influence of the adsorbent type and ratio over the time evolution of cadmium
concentration in batch conditions (Ci = 40 mg Cd2+/L, T = 20°C, pH = 5.4, 8g D, 6g D + 2g B, 4g D + 4g B, 2g D + 6g B, 8g B).
The influence of the adsorbent type and bentonite/baker’s yeast ratio over the cadmium removal process, in terms of maximum removal efficiencies and adsorption capacities are presented in figures 2 and 3. The highest value of the removal efficiency was obtained in case of bentonite (100%). As the bentonite quantity decreases in the adsorbent mixture, figure 2, removal efficiency decreases to 87.08 % for the 6g D + 2g B mixture. When only the baker’s yeast is present in the alginate beads, an increase of the removal efficiency to a value close to that corresponding to the 1:1 mixture ratio, 4g B + 4g D, (92.50%), 91.56% was calculated. Accordingly, the adsorption capacities (maximum values, calculated at equilibrium) will follow the same trend. The highest value was obtained when 8g of bentonite were immobilized, 0.6 mg Cd2+/g adsorbent.
91.56
87.08
92.50
96.35
100.00
8082
84
86
8890
92
94
96
98100
E, (%
)
8 g D 6g D + 2g B 4g D + 4g B 2g D + 6g B 8g B Figure 2. Maximum removal efficiency values for cadmium removal in batch conditions – influence of the adsorbent type and ratio (Ci = 40 mg Cd2+/L, T = 20°C, pH = 5.4, 8g D,
6g D + 2g B, 4g D + 4g B, 2g D + 6g B, 8g B.

FIXED BED STUDIES FOR Cd(II) REMOVAL FROM MODEL SOLUTIONS …
157
0.5494
0.5225
0.5550
0.5781
0.6000
0.48
0.5
0.52
0.54
0.56
0.58
0.6Q
, (m
g/g)
8g D 6g D + 2g B 4g D + 4g B 2g D + 6g B 8g B
Figure 3. Adsorption capacity values for cadmium removal in batch conditions – influence of the adsorbent type and ratio (Ci = 40 mg Cd2+/L, T = 20°C, pH = 5.4, 8g D,
6g D + 2g B, 4g D + 4g B, 2g D + 6g B, 8g B. Fixed bed column study
Results obtained when the cadmium removal experiments were carried out in fixed bed column are presented in terms of cadmium concentration time evolution (breakthrough curves) and adsorption capacities at exhaustion point. As can be observed from figures 4 and 5, when only baker’s yeast is present in the alginate beads, the breakthrough curve is steeper, concentration of cadmium at the outflow of the column increases faster, indicating a favourable kinetic in this case. We can concluded that using this flow rate, the adsorption in case of the baker’s yeast takes place rapidly but only on the membrane cell, the diffusion through the membrane being restricted, therefore the adsorption capacity will be smaller. In all cases the breakthrough point is around 75 minutes, while the exhaustion point was reached after approximately 250 minutes.
0
1
2
3
4
5
6
7
0 100 200 300
t, (min)
C, (
mg
Cd2+
/L)
8g B8g D4g B + 4g D
Figure 4. Influence of the adsorbent type and ratio over the cadmium concentration
evolution in time in fixed bed studies – breakthrough region (Ci = 40 mg Cd2+/L, T = 20°C, pH = 5.4).

C. MAJDIK, H. O. TFEIL, A. MĂICĂNEANU, C. INDOLEAN, S. BURCĂ, S. TONK, M. STANCA
158
0
10
20
30
40
50
60
70
0 100 200 300
t, (min)
C, (
mg
Cd2+
/L)
8g B8g D4g B + 4g D
Figure 5. Influence of the adsorbent type and ratio over the cadmium concentration
evolution in time in fixed bed studies – breakthrough region (Ci = 120 mg Cd2+/L, T = 20°C, pH = 5.4).
4.5123
12.7375
4.2691
12.1113
4.0817
8.6919
0.00
2.00
4.00
6.00
8.00
10.00
12.00
14.00
Q, (
mg/
g)
8g B 4g B+ 4g D 8g D
40 mg/L120 mg/L
Figure 6. Maximum adsorption capacity values for cadmium removal in fixed bed –
influence of the initial cadmium solution concentration, and adsorbent type and ratio (Ci = 40, 120 mg Cd2+/L, T = 20°C, pH = 5.4, 8g D, 4g D + 4g B, 8g B).
EXPERIMENTAL SECTION We used a commercial bentonite (B) sample from Fort Benton distributed
by Interker-Wein kft., Hungary. The bentonite sample was used as powder, (d < 0.2 mm), without any chemical treatment. We used also commercial baker’s yeast (D) produced by Pakmaya (wet). All chemicals used in this study were analytical reagent grade (Cd(NO3)2×4H2O, alginic acid sodium salt and CaCl2).
In order to obtain the bentonite/baker’s yeast mixtures (we will refer to the bentonite-yeast mixture as adsorbent along the paper) immobilized in alginate beads we used the cross-linking procedure with calcium alginate,

FIXED BED STUDIES FOR Cd(II) REMOVAL FROM MODEL SOLUTIONS …
159
which is an adapted version of the method for treatment of fungi biomass outlined by Schiewer et al. (1995) and Zhao and Duncan (1997) [17,18].
For adsorbent immobilization, various quantities of bentonite (2, 4, 6, 8 g) and baker’s yeast (2, 4, 6, 8 g) in different combinations (8g B, 6g B + 2g D, 4g B + 4g D, 2g B + 6g D, 8g D), were suspended in 50 ml distilled water. This suspension was next blended with a mixture formed from 1 g Na-alginate and 2 ml ethanol. The mixture was then dropped with a peristaltic pump into a 0.2 M CaCl2 solution. During this process, alginate-bentonite-yeast mixture drops were gelled into beads with a diameter of 4.0 ± 0.2 mm. The Ca-alginate immobilized adsorbent beads were stored in 0.2 M CaCl2
solution at 4°C for 1 hour to cure. The beads were rinsed with distilled water for remove excess of calcium ions and stored at 4°C prior to use. For the heavy metal ion removal study we used model monocomponent solutions containing cadmium ions of 40 and 120 mg Cd2+/L. The concentration of cadmium ions in solution was determined using a flame atomic absorption spectrophotometer (SensAA Dual GBS Scientific Equipment, Australia).
The heavy metal ions removal process was realized in a batch reactor under magnetic stirring (825 rpm), using 100 ml of cadmium solution in which Ca-alginate bentonite beads obtained from the desired quantity of adsorbent were suspended. For the fixed bed column experiments we used a 32 mm diameter column, in which Ca-alginate beads obtained from the desired quantity of adsorbent were placed. Cadmium solution passes the fixed bed with a flow rate of 4 ml/min.
In order to determine the exact concentration of cadmium ions and establish the evolution of the removal process, in batch conditions, samples of 1 mL (dilution in each case was 25) from the supernatant were collected at different time intervals, every 5 minutes for the first 30 minutes and next every 15 minutes until equilibrium was reached. In case of the fixed bed experiments, 50 ml solution is collected at the outflow of the column every 12.5 minutes until the adsorbent is exhausted (exhaustion point).
We studied the influence of the bentonite and baker’s yeast quantity, cadmium concentration in solution over the process efficiency in batch and fixed bed conditions. The experiments were carried out at room temperature (20°C) and without any modification of the pH value (pH 5.4 of the initial cadmium solution).
The amount of adsorbed cadmium (adsorption capacity Q, mg/g) was calculated using equation 1 (the calculated values of removal efficiencies and adsorption capacities should be regarded according to the precision of the determination methods we used). We also calculated the removal efficiencies (E, %), equation 2, in order to establish the effectiveness of the considered adsorbent in the heavy metal ion removal process, in batch conditions.

C. MAJDIK, H. O. TFEIL, A. MĂICĂNEANU, C. INDOLEAN, S. BURCĂ, S. TONK, M. STANCA
160
1000)( 0 V
wCCQ t ⋅−= (1)
where, C0 is the initial cadmium concentration (mg Cd2+/L), Ct is time t cadmium concentration (mg Cd2+/L), V = 100 ml, and w is the quantity of the adsorbent (g).
1000
0 ⋅−=C
CCE t (2)
CONCLUSIONS
The bentonite sample, yeast biomass and their mixtures, proved to be efficient for the removal of cadmium from model solutions.
The highest adsorption capacity was obtained when only bentonite was included in the Ca-alginate beads in batch conditions. As the bentonite concentration decreases, the adsorption capacity decreases as well, even if the amount of yeast increases in batch conditions, excepting the case of the pure yeast sample, which has an intermediate value.
When the removal process was realized in fixed bed conditions, also the most efficient sample was the immobilized bentonite. The mixture containing the same quantity of bentonite and yeast (4 g) has intermediate values for both cadmium initial concentrations. The breakthrough point for fixed bed experiments was observed at 75 minutes in all cases.
REFERENCES 1. C. Cojocaru, M. Diaconu, I. Creţescu, J. Savić, V. Vasić, Colloids and Surfaces
A: Physicochemical and Engineering. Aspects, 2009, 335, 181. 2. Y.L. Lai, G. Annadurai, F.C. Huang, J.F. Lee, Bioresource Technology, 2008, 99,
6480. 3. S.S. Ahluwalia, D. Goyal, Bioresource Technology, 2007, 98, 2243-2257. 4. M. Nourbakhsh, Y. Sag, D. Ozer, Z. Aksu, T. Katsal, A. Calgar, Process Biochemistry,
1994, 29, 1. 5. D. Bréant, K. Jézéquel, T. Lebeau, Biotechnology Letters, 2002, 24, 1237. 6. A. Măicăneanu, H. Bedelean, M. Stanca, “Zeoliţii naturali. Catacterizare şi aplicaţii
în protecţia mediului”, Presa Universitară Clujeană, Cluj-Napoca, 2008, chapter 6. 7. I. Moreno-Garcia, Bioresource Technology, 2008, 99, 3949. 8. R.H.S.F. Vieira, B. Volensky, International Microbiology, 2000, 3, 17.

FIXED BED STUDIES FOR Cd(II) REMOVAL FROM MODEL SOLUTIONS …
161
9. S. Zhu, H. Hou, Y. Xue, Applied Clay Science, 2008, 40, 171. 10. S. Veli, B. Alyuz, Journal of Hazardous Materials, 2007, 149, 226. 11. A. Sarı, M. Tuzen, M. Soylak, Journal of Hazardous Materials, 2007, 144, 41. 12. S. Yang, J. Li, Y. Lu, Y. Chen, X. Wang, Applied Radiation and Isotopes, 2009,
67, 1600. 13. K.G. Bhattacharyya, S.S. Gupta, Advances in Colloid and Interface Science, 2008,
140, 114. 14. H. Bedelean, A. Măicăneanu, S. Burca, M. Stanca, Clay Minerals, 2009, 44,
487. 15. S. Tonk, A. Măicăneanu, C. Indolean, T. Pernyeszi, C. Majdik, Carpathian Journal
of Earth and Environmental Sciences, in press.
16. H. Bedelean, A. Măicăneanu, S. Burca, M. Stanca, Studia Babeş-Bolyai Geologia, 2010, in press.
17. S. Schiewer, E. Fourest, K.H. Chong, B. Volesky, Biohydrometallurgical Processing, 1995, 2, 219.
18. M. Zhao, J.R. Duncan, Biotechemical Letters, 1997, 19, 953.


STUDIA UNIVERSITATIS BABEŞ-BOLYAI, CHEMIA, LIV, Sp.Iss. 2, 2009
COATED-WIRE TYPE ION SENSITIVE ELECTRODES BASED ON NANOSTRUCTURED ATO THIN FILM
MARIA PAVAIa, DORU MANCIULEAb, FIAMMETTA KORMOSc, IRINA TARSICHEd
ABSTRACT. The functional performances of some cation and anion sensitive self-made, coated-wire type ISEs (ion selective electrodes), where the conventional metallic conductor was replaced by nanostructured ATO (antimony doped tin dioxide) thin film are presented. Two different PVC based membranes, cation and anion sensitive, respectively, were coated on ATO films prepared by the sol-gel technique. By using AFM (Atomic Force Microscopy), EIS (Electrochemical Impedance Spectroscopy) and sheet resistance measurements the film nanostructured morphology and the good electrical conductivity, respectively, were established. The cation sensitive ISE shows the best functional characteristics towards K+: linear response range: 5×10⁻⁵-10-1ML-1, sensitivity: 56±1 ΔmV/ΔpC, detection limit: 2×10⁻⁵ ML-1. The anion sensitive ISE shows the best functional characteristics
towards −3NO : linear response range: 3×10⁻⁵-10-1ML-1, sensitivity: 55±1ΔmV/ΔpC,
detection limit: 1,8×10⁻⁵ML-1. The life time of the ISEs was 8 days.
Keywords: coated-wire type ISE, ATO, sol-gel. INTRODUCTION
Nowadays, ISEs are widely used for the quantification of various cationic or anionic species in industry, medicine or environment quality control.
Coated-wire electrodes were first developed in 1971 and refer to a type of ISE in which an electroactive species is incorporated in a thin polymeric (PVC) support film coated directly on a metallic conductor, usually platinum, silver, copper or graphite rods. Electrodes of this type were developed for a wide variety of both organic and inorganic cations and anions [1, 2, 3, 4, 5]. a Chemical Research Center of the Hungarian Academy of Sciences, str. Pusztaszeri 59-67,
Budapesta, Ungaria, [email protected] b Universitatea “Babes-Bolyai”, Facultatea de Stiinţa Mediului, str. Kogălniceanu Nr. 1, RO-
40084, Cluj-Napoca, Romania, [email protected] c Dekra Certifications SRL, str. C. Brâncuşi, nr. 131, RO-400458 Cluj-Napoca, Romania,
metti @personal.ro d Universitatea “Babeş-Bolyai”, Facultatea de Chimie şi Inginerie Chimică, str. Kogălniceanu Nr. 1,
Cluj-Napoca, RO-40084, Romania, [email protected]

M. PAVAI, D. MANCIULEA, F. KORMOS, I. TARSICHE
164
Literature data show a continuously growing interest in developing new, low cost materials to be used in the construction of electrodes. Among these materials, the ATO thin film plays an important role due to its remarkable electrical and electrochemical properties: good electrical conductivity, large useful potentials range, low double layer capacity and lack of surface phenomena [6]. The paper deals with the study of the functional performances of some self-made coated wire type ISEs obtained by replacing the conventional metallic wire with ATO nanostructured thin film, deposited on glass rod. Two different PVC based membranes, cation and anion sensitive, respectively, were deposited on the ATO thin film. The synthesis route and electrical characteristics of the ATO thin film are also presented.
RESULTS AND DISCUSSIONS 1. Characterization of the ATO nanostructured thin films
The ATO thin films were prepared by the sol-gel technique. In order to establish the electric properties, namely the electric conductivity, of the thin films several parameters were evaluated as follows:
1.1. The number of free charge carriers was evaluated from EIS measurements and by using the Mott-Schottky equation which provides a relationship between the experimentally measured capacitance, the number of free charge carriers and the flat band potential [7, 8]:
)e
kTE(EeNεε
2C1
fb02−−=
where: C – differential capacitance, ε - relative static permittivity of the semiconductor, ε0 – permittivity in vacuum, e- elementary charge, N- number of free charge carriers, E- applied potential, Efb- flat band potential, T- absolute temperature , k- Boltzmann constant.
1.2. The exchange current density was also calculated on the basis of EIS measurements and by using the equation below [8]:
AnFRRTi
ct0 =
where: R- the gas constant, T – absolute temperature, n- number of exchanged electrons, F - Faraday constant, Rct - charge transfer resistance, A - electrode surface aria.

COATED-WIRE TYPE ION SENSITIVE ELECTRODES BASED ON NANOSTRUCTURED ATO THIN FILM
165
1.3. The sheet resistance of the films was evaluated using the four-point method. The experimental results are summarized in Table 1.
Table 1. Parameters characterizing the electrical conductivity of ATO thin films
Number of charge carriers (N/cm3)
Sheet resistance(Ω/cm2)
i0 (A/cm2)
Rct (Ω)
1,5 ×10²⁰ 42 2 ×10⁻⁶ 6500
Considering the experimental data in Table 1, one may see that the ATO thin films prepared according the route described in the experimental section show high number of free charge carriers, relatively large exchange current, low charge transfer resistance, low sheet resistance, meaning an overall good electric conductivity. Therefore the ATO thin film can replace the conventional metallic conductor in the construction of coated-wire type ISEs. On the other hand AFM measurements revealed the nanostructured morphology of the film (particles sizes range between 180-195 nm) (fig. 1) which also contribute to the overall good electrical properties of the thin films.
Figure 1. AFM images for the obtained ATO films
2. Functional characteristics of cation and anion ISEs
2.1. Response characteristics of the ISEs The response of the ISE’s obtained by coating the ATO film with the
PVC based membrane containing as electroactive compound potassium tetraphenylborate was tested by direct potentiometry towards the following cations: K+, NH4
+ and Tl+. The experimental results representing the mean of two successive measurements performed with two electrodes, under the same experimental conditions are summarized in table 2.

M. PAVAI, D. MANCIULEA, F. KORMOS, I. TARSICHE
166
Table 2. Response characteristics of the cation sensitive ISEs
Cation Dynamic response domain
(ML-1)
Linear responsedomain (ML-1)
Sensitivity (ΔmV/ΔpC)
Detection limit
(ML-1)
Repeatability
(mV) K+ 10-5-10-1 5×10⁻⁵-10-1 56±1 2×10⁻⁵
NH+4 10-4-10-1 2×10⁻⁴-5×10⁻² 53±1 1.1×10⁻⁴
Tl+ 10-3-10-1 5×10⁻³-8×10⁻² 52±1 1,8×10⁻³
±1
The working pH range was 5-9 and the response time was 30 sec. According to the experimental data, the ISEs show the best response
characteristics towards K+: wide linear response range, almost Nernstian sensitivity in the linear response range and the lowest detection limit. For this specific ion, measurements were performed from high to low concentration, too. These measurements showed a complete lack of memory effect and a good repeatability. In order to establish the life time of the electrode the measurements were repeated, in the same experimental conditions, for several days. It was found that after 8 days the repeatability and the sensitivity of the electrodes decreased abruptly. Soaking the electrodes in KCl solutions with concentrations ranging between 10-4-10-1 ML-1 did not improve the electrodes behaviour. It can be assumed that after this period of time a leak of the membrane components occurred and therefore the PVC based membrane must be renewed.
The response of the ISE’s prepared by coating the ATO film with the PVC based membrane containing cetylpyridinium chloride as electroactive compound was tested towards the following anions: −
3NO , −4ClO , −TFB
(tetraphenylborate).The experimental results, mean of two successive measurements performed with two electrodes under the same experimental conditions are summarized in table 3.
Table 3. Response characteristics of the anion sensitive ISE
Anion Dynamic response domain
(ML-1)
Linear responsedomain (ML-1)
Sensitivity (ΔmV/ΔpC)
Detection limit
(ML-1)
Repeatability
(mV) NO-
3 10-5-10-1 3×10⁻⁵-10-1 55±1 1,8×10⁻⁵ ClO4
- 5×10⁻⁴-10-1 2×10⁻⁴-8×10⁻² 52±1 1.6×10⁻⁴ TFB- 10-4-10-1 8×10⁻³-8×10⁻² 51±1 6,8×10⁻³
±1
As one may see from the data in table 3, the anion sensitive ISEs show the best functional characteristics towards −
3NO : widest linear response range, lowest detection limit and almost Nernstian sensitivity in the linear

COATED-WIRE TYPE ION SENSITIVE ELECTRODES BASED ON NANOSTRUCTURED ATO THIN FILM
167
response range. The response time was 30 seconds. The measurements performed for this specific ion from high to low concentration showed a slight memory effect especially close to the lower limit of the dynamic response range. Soaking the electrode, between two successive measurements, in a KNO3 10-2M solution for 30 seconds improved the ISEs response. The life time of the electrodes was 8 days. 2.2. Selectivity The selectivity study was performed for both cation and anion sensitive ISEs for K+ and −
3NO as primary ions by using the fixed interference method. The selectivity coefficients Kpot are summarized in table 4.
Table 4. Selectivity study results for the K+ sensitive ISE
Interferent
X
pot
X,KK + Interferent
X
pot
X,NO3K −
+4NH 10-1 −Cl 10-2
+Na 2×10⁻³ −TFB 10-4 +Tl 2×10⁻³ −
4ClO 10-1
Primary ion K+
+2Mg 10-5
Primary ion−3NO
−SCN 10-2
The data in table 4 show that both +K and −
3NO sensitive electrodes show a good selectivity towards the investigated interferents. A more extended study of selectivity may open a good perspective for their use in the determination of these ions in real samples. CONCLUSIONS The aim of the paper was to study the functional performances of some self-made cation and anion sensitive, coated wire type ISEs, based on ATO nanostructured thin film. The electrical properties of the films obtained by using the sol-gel technique, investigated by EIS and sheet resistance measurements, revealed high number of free charge carriers, relatively large exchange current, low charge transfer resistance, low sheet resistance. The AFM measurements revealed the nanostructured morphology of the obtained films. These characteristics make the prepared ATO films adequate to replace a conventional metallic conductor in the construction of ISEs of this type. Considering the functional characteristics of the ISEs prepared by coating the

M. PAVAI, D. MANCIULEA, F. KORMOS, I. TARSICHE
168
ATO film with a PVC based membrane containing potassium tetraphenylborate and cetylpiridinium chloride, respectively, as electroactive compounds, the prepared ISEs can be used especially for the determination K+ and −
3NO . The ISEs show wide linear response ranges, almost Nernstian sensitivities, good repeatability and lack of memory effect. Even if the life time of the ISEs is not longer than 8 days, considering the convenient cost of the materials involved, the ISEs based on ATO nanstructured thin films can be considered as useful and reliable tools that can replace successfully the conventional coated-wire type electrodes for quantitative determinations on real samples, too.
EXPERIMENTAL SECTION 1. Materials SnCl4×5H2O, SbCl3, n-propanol, ammonia, PVC, tetrahydrofurane, dioctylphtalate, potassium tetraphenylborate, cetylpyridinium chloride, KCl, NH4Cl, TlNO3, KClO4, KSCN, Mg(NO3)2, ( )[ ] ( )[ ]6364 CNFeK,CNFeK , Na2SO4, CaCl2 analytical grade, were purchased from Fluka and Merck. 2. ATO films preparation and characterization 2.1. Sol-gel technique: SnCl4⋅ 5H2O and SbCl3, 45/2 (weight ratio), were dissolved in n-propanol under continuous stirring at 250C. After adjusting the pH to 5-6 with dilute ammonia solution, the mixture was heated under stirring at 700C for 1 hour. The ATO films were obtained by one step dip-coating using a Nima Tensiometer. Glass rods, with a diameter of 3 mm, were immersed in the sol with a 5mm/min constant speed and withdrawn in the same conditions. The glass rods were previously cleaned with neutral washing powder and rinsed with distilled water. The layer was heated up to 6000C with a constant rate of 200C/minute and annealed for 1 hour. 2.2. Characterization of the ATO films: 2.2.1. Electrical conductivity measurements: the sheet resistance was measured with a self made device using the four-point method. 2.2.2. EIS measurements: were performed with a Solartron 1250 type frequency analyzer and a Solartron 1286 type potentiostat. The electrochemical cell was a three-electrode type. The electrolyte was 0.5M Na2SO4 for free charge carriers determination and 10-3M ( )[ ] ( )[ ]6364 CNFeK/CNFeK for the exchange current density determination, respectively. The working electrode was the ATO film, the reference electrode was SCE type and the counter electrode was Pt. Frequency was varied between 10 mHz-65KHz.
COATED-WIRE TYPE ION SENSITIVE ELECTRODES BASED ON NANOSTRUCTURED ATO THIN FILM
169
2.2.3. AFM investigation: the surface morphology of the ATO films was investigated using a Nanoscope Dimension 3100 type AFM. 3. Obtaining of ISE’s The glass rods covered with the ATO films, were immersed in a mixture containing: 5% (w/w) PVC, 74.5% (w/w) tetrahydrofuran, 20% (w/w) dioctylphtalate and 0.5% (w/w) electroactive compound: potassium tetraphenylborate and cetylpyridinium chloride, respectively. The covered rods were dried in air for 24 hours. Two ISEs of each type were prepared following this route. 4. Potentiometric measurements Solutions in the concentration range 10-6-1M of all tested ions were prepared from the appropriate salts. The ionic force was kept constant j=0.1M with CaCl2 0.033M and Na2SO4 0.033M, respectively. The reference electrode was a SCE type. Measurements were performed with an Autolab PGSTAT type ion-meter, accuracy ±0.1 mV, from low to high and high to low concentrations. The pH measurements were done by using a pH combined glass electrode, Senzorom, SRL HC type.
REFERENCES 1. L. Cunningham, H. Freiser, Analytica Chemica Acta, 1986, 180, 271. 2. Y.M. Issa, N.T. Abdel-Ghani, A.F. Shoukry, M.H. Ahmed, Analytical Sciences:
the international journal of the Japan Society for Analytical Chemistry, 2005, 21, 1037.
3. M.A. Plesha, B.J. Van Wie, J.M. Mullin, D.A. Kidwell, Analytica Chimica Acta, 2006, 570, 186.
4. N. Alizadeh, H. Teymousian, M. Aghamohammadi, S. Meghdadi, M. Amirnasr, Sensors Journal, IEEE, 2007, 7, 1727.
5. M. Ardakani, M. Savalati-Niasari, M. Khayat Kashani, Analytical and Bioanalytical Chemistry, 2009, 378, 1659.
6. J. Ni, X. Zhao, J. Zhao, B. Liu, Acta Materialia, 2009, 57, 278. 7. C.M. Ragel, M. da Cunha Belo, Portugaliae Electrochemica Acta, 2004, 22, 295. 8. Xiaoge Gregory Zhang, “Electrochemistry of Silicon and its Oxides” Kluwer
Academic/Plenum Publishers, New York, 2001, chap.1. 9. I.R. Lauks, Accounts of Chemical Research, 1998, 31, 317.


STUDIA UNIVERSITATIS BABEŞ-BOLYAI, CHEMIA, LIV, Sp.Iss. 2, 2009
QUANTIFICATION OF IBUPROFEN AND PSEUDOEPHEDRINE IN HUMAN PLASMA BY LC/MS/MS FOR
PHARMACOKINETIC STUDIES
ADRIANA MONICA MARCOVICIa,b, MONICA-IOANA TOŞAb, LAURIAN VLASEc, SORIN E. LEUCUŢAc, FLORIN DAN IRIMIEb
ABSTRACT. A simple, fast and sensitive LC/MS/MS method for quantification of ibuprofen and pseudoephedrine in human plasma has been developed and validated. The lower limit of quantification was established at 0.05 μg/ml IBU and 5 ng/ml PSE. Ibuprofen and pseudoephedrine were separated under isocratic conditions on a Zorbax RX C18 column (3.0 x 100mm, 3µ).
Keywords: ibuprofen, pseudoephedrine, LC/MS/MS, bioequivalence
INTRODUCTION Ibuprofen (IBU), 2-(4-isobutylphenyl)propanoic acid (Figure 1), is a
non-steroidal anti-inflammatory drug commonly used as racemic in treatment of pain and inflammation, available in a variety of preparations [1].
Pseudoephedrine (PSE), (1S, 2S)-2-(methylamino)-1-phenylpropan-1-ol, is a decongestant that relieves the symptoms of nasal and sinus congestion [2].
Products containing IBU and PSE provide decongestant, antipyretic, and analgesic properties [3,4].
IBU is approximately 80% absorbed from the gut; the suspended form is absorbed at about twice the rate of the tablet form. Although absorption is slower if the drug is taken with food, the extent of absorption is not affected. Peak serum concentrations are reached 1—2 hours after a dose. IBU is highly protein-bound (about 90—99%) and undergoes biotransformation in the liver. Plasma half-life is between 2 and 4 hours. IBU is excreted in the urine, 80—90% as metabolites and approximately 10% as unchanged drug. Excretion is usually complete within 24 hours of oral administration.
a Terapia-Ranbaxy, Cluj-Napoca, Romania, [email protected] b “Babeş-Bolyai” University, Faculty of Chemistry and Chemical Engineering, Arany Janos 11,
RO-400028, Cluj-Napoca, Romania c University of Medicine and Pharmacy “Iuliu Haţieganu”, Faculty of Medicine, Emil Isac 13,
RO-400023, Cluj-Napoca, Romania

A. M. MARCOVICI, M.-I. TOŞA, L. VLASE, S.E. LEUCUŢA, F. D. IRIMIE
172
PSE is generally well-absorbed, and its absorption is not affected by food. PSE is presumed to cross the placenta, blood brain barrier, and may be distributed into breast milk. PSE is incompletely metabolized in the liver to norpseudoephedrine, the primary active metabolite. The drug and metabolite are excreted in the urine, with 55—75% excreted as unchanged drug. The elimination half-life of the drug ranges from 6—15 hours dependent primarily upon urinary pH. The rate of urinary excretion is accelerated upon urinary acidification to a pH near 5. Upon alkalinization of the urine to a pH of approximately 8, some of the drug is reabsorbed into the kidney tubule and the rate of urinary excretion is slowed.
Several instrumental methods have been proposed for the determination of either IBU or PSE in biological fluid, including high performance liquid chromatography, liquid chromatography coupled with mass spectrometry. Mainly, high performance liquid chromatography (HPLC) methods with UV detection were described [5, 6]. Liquid chromatography coupled with mass spectrometry (LC/MS or LC/MS/MS) methods were reported also [7, 8]. LC/MS has been widely accepted as the most used method in the identification and quantitative analysis of drugs and its metabolites because of its superior sensitivity and specificity. In the same time, several instrumental methods have been proposed for determination of pseudoephedrine in biological fluids, either individual, either in combination with another drug than ibuprofen [9, 10].
For simultaneous determination of both analytes in biological matrix, only little information was available. For determination of both in pharmaceutical combinations few methods based on spectrophotometric determination, using ratio spectra derivative and multivariate calibration techniques were found [11].
OH
HN
COOH
IBU PSE
Figure 1. Structure of racemic ibuprofen (IBU) and pseudoephedrine (PSE)
The aim of present study is the development of a rapid and specific LC/MS/MS method for the quantification of IBU and PSE in human plasma in order to be applied in pharmacokinetic and bioequivalence studies. In comparison with previously published HPLC methods, the proposed method has the advantage of quantification of both analytes in a single run.

QUANTIFICATION OF IBUPROFEN AND PSEUDOEPHEDRINE IN HUMAN PLASMA BY LC/MS/MS...
173
RESULTS AND DISCUSSION In the electric field created by the electrospray ionization source, the
molecule of IBU readily loose a proton, a negative ion being generated, with m/z 205. Thus, the detection of IBU was carried out in multiple reaction monitoring (MRM) mode, by fragmentation of the parent ion with the m/z 205. The fragmentation of the parent ion is induced by collision of the ion with helium in the ion trap and stable product ions with m/z 159 and m/z161 are observed in the mass spectra (Figure 2). Finally, the sum of abundance of ions with m/z 159 and m/z 161 was monitored and quantitatively correlated with IBU concentration. The retention time of IBU was 4.7 min (Figure 5) and, due detection specificity, no significant interference was observed at the retention time in plasma blank samples chromatograms.
Figure 2. MS/MS spectra of IBU
In the same time, an intense pseudo molecular ion with m/z 166 was
observed for PSE after positive ionization of the analyte. The fragmentation of the parent ion is induced by collision of the ion with helium in the ion trap and stable product ion with m/z 148 is observed in the mass spectra (Figure 3). Finally, the abundance of ions with m/z 148 was monitored and quantitatively correlated with pseudoephedrine concentration. The retention time of PSE was 5.3 min (Figure 5) and no significant matrix interference was observed at the retention time in plasma blank samples chromatograms.
Figure 3. MS/MS spectra of PSE

A. M. MARCOVICI, M.-I. TOŞA, L. VLASE, S.E. LEUCUŢA, F. D. IRIMIE
174
Sodium diclofenac (DCL) was used as internal standard, the MS transition monitored in its case being m/z 250 > m/z 293, in positive mode (Figure 4).
Figure 4. MS/MS spectra of internal standard, DCL
Figure 5. Plasma sample chromatograms of PSE, IBU and DCL at quantification limit (5 ng/ml, respectively 0.05 ng/ml, internal standard, bottom chromatogram)
The calibration curves showed linear response over the range of concentration used in the assay procedure. The calibration curve for IBU was in the concentration range 0.05-60.00 µg/ml, using 8 calibration levels, n = 5 runs with a coefficient of correlation greater than 0.997. The residuals had no tendency of variation with concentration and were between ±14.5% values.
The calibration curve for PSE was in the concentration range 5-300 ng/ml, using 8 calibration levels, n = 5 runs with a coefficient of correlation greater than 0.990. The residuals had no tendency of variation with concentration and were between ±14.7% values.

QUANTIFICATION OF IBUPROFEN AND PSEUDOEPHEDRINE IN HUMAN PLASMA BY LC/MS/MS...
175
The inter- and intra-day precision and accuracy results are showed in Table 2 to Table 5 and they are in agreement to international regulations regarding bioanalytical methods validation [12-17].
Precision and accuracy were for IBU from 1.43% to 16.39% for intra-day assay and from 0.34% to 7.98% for inter-day assay. Precision and accuracy were for PSE from 3.12% to 12.8% for intra-day assay and from 0.8% to 13.07 % for inter-day assay. The lower limit of quantification was established at 0.05 µg/ml for IBU and at 5 ng/ml for PSE. Precision and accuracy of IBU at quantification limit were 16.39% and -5.6% for intra-day determinations and 6.56 % and 4% for inter-day determinations, respectively. For PSE, the precision and accuracy at quantification limit were 4.43% and 12.8% for intra-day determinations and 13.07 % and 0.68% for inter-day determinations, respectively.
The recovery was consistent and averaged at 86.81% for IBU and 69.94% for PSE (Table 2 and 4).
Table 2. Intra-day precision, accuracy and recovery (n = 5) for IBU
cnominal µg/ml
Mean cfound µg/ml (± S.D.)
CV % Bias % Recovery % (± S.D.)
0.05 0.0472 0.0077 16.39 -5.6 89.21 3.1 30.00 29.567 1.52 5.14 -1.43 85.18 2.5 60.00 61.242 2.05 3.34 2.07 86.03 4.9
Table 3. Inter-day precision, accuracy (n = 5) for IBU
cnominal µg/ml
Mean cfound µg/ml (± S.D.)
CV % Bias %
0.05 0.052 0.34 6.56 4 30.00 29.14 2.16 7.41 -2.86 60.00 60.93 4.86 7.98 1.55
Table 4. Int. Intra -day precision, accuracy and recovery (n = 5) for PSE
cnominal ng/ml
Mean cfound ng/ml (± S.D.)
CV % Bias % Recovery % (± S.D.)
5.00 5.64 0.25 4.43 12.8 61.38 4.8 150.00 132.26 4.13 3.12 -11.8 73.89 4.5 300.00 271.42 14.4 5.30 -9.52 74.6 5.6

A. M. MARCOVICI, M.-I. TOŞA, L. VLASE, S.E. LEUCUŢA, F. D. IRIMIE
176
Table 5. Inter-day precision, accuracy (n = 5) for PSE
cnominal ng/ml
Mean cfound ng/ml (± S.D.)
CV % Bias %
5.00 5.2 0.68 13.07 4.0 150.00 149.96 0.94 0.62 -0.02 300.00 286.88 2.29 0.8 -4.37
Method validation
Method validation [10, 12-17] involves verifying specificity by using six different plasma blanks. The linearity of the peak area against standard concentration was verified between 0.05.00-60.00 µg/ml ibuprofen and between 5-300 ng/ml for PSE by applying least-squares linear regression. The applied calibration model was: y = ax+b, 1/y weight, where y is peak area and x, concentration. Distribution of the residuals (% difference of the back-calculated concentration from the nominal concentration) was investigated. The calibration model was accepted, the residuals were within ±20% at the lower limit of quantification and within ±15% at all other calibration levels and at least 2/3 of the standards met these criteria.
The limit of quantification was established as the lowest calibration standard with an accuracy and precision less than 20%. The intra- and inter-day precision (expressed as coefficient of variation, CV%) and accuracy (relative difference % between found and theoretical concentration, bias %) of the assay procedure were determined by the analysis in the same day of three samples at each of three levels of concentration in the considered concentration range and one sample of each in three different days, respectively. The recoveries at each of previous levels of concentration were measured by comparing the response of the treated plasma standards with the response of standards in water with the same concentration in ibuprofen as the final extract from plasma standards. The stability of the stock solutions of IBU, PSE and DCL was checked and found acceptable within 1.36% to 5.39% for 4 weeks of storage in the refrigerator at 4 to 8 oC. The freeze and thaw stability of the analytes IBU and PSE in plasma was checked during three cycles of freeze at -60 oC and thaw at room temperature.The results are presented in table 6 and 7.
Post-Preparative Stability is a procedure designed to measure the analyte stability in samples over the anticipated run time for the batch size, including the resident time in the autosampler by determining concentrations on the basis of original calibration standards. Post-preparative stability was checked for IBU and PSE, for 24 h of keeping the samples at 4oC in the HPLC thermostated autosampler. The results were within 5.15% to 11.6% for IBU respectively within 8.5 to 10.9% for PSE.

QUANTIFICATION OF IBUPROFEN AND PSEUDOEPHEDRINE IN HUMAN PLASMA BY LC/MS/MS...
177
Short-term room temperature stability was checked by preparing at least three spiked plasma aliquots of concentration 0.15 µg/ml IBU, 10 ng/ml PSE and 60 µg/ml IBU, 300 ng/ml PSE. These samples were stored at room temperature for 3 hours, then extracted and analysed against calibration together with freshly prepared samples of the same concentration and number. Mean concentration was calculated for the stored and the reference samples and compared. The results were between 2.34 and 9.32 for IBU and between 13.67 and 13.91 for PSE.
Table 6. Freeze-thaw stability (n = 3) for IBU
cnominal µg/ml
Freshly prepared
After the 3rd
cycle Bias %
0.15 0.148 0.154 3.64 60 54.05 51.3 5.08
Table 7. Freeze-thaw stability (n = 3) for PSE
cnominal ng/ml
Freshly prepared
After the 3rd
cycle Bias %
10 9.46 10.43 10.2 300 307.2 289.03 5.91
CONCLUSIONS
The proposed method is simple and sensitive and provides accuracy and precision in the simultaneously determination of IBU and PSE. The lower limit of quantification was established at 0.05 μg/ml IBU and 5ng/ml PSE, respectively, with accuracy and precision less than 16.4%. The MS/MS detection and the simple sample preparation method allowed a specific and efficient analysis of a large number of plasma samples from the clinical study. The developed method is suitable for quantification of IBU and PSE in human plasma for a bioequivalence study after administration of a solid dosage form combination of both to healthy subjects.
EXPERIMENTAL SECTION Reagents
IBU, PSE and DCL were European Pharmacopoeia standard. Diethyl ether, hexane, methanol, orto phoshoric acid, sodium hydroxide and ammonium acetate were Merck products (Merck KgaA, Darmstadt, Germany). Distilled, deionised water was produced by a Simplicity 185 Millipore (Millipore SA,

A. M. MARCOVICI, M.-I. TOŞA, L. VLASE, S.E. LEUCUŢA, F. D. IRIMIE
178
Molsheim, France) water system. The human blank plasma was supplied by the Local Bleeding Centre Cluj-Napoca, Romania.
Standard solutions
Two stock solutions of IBU and PSE, respectively, with concentration of 10 µg/ml and respectively 100 µg/ml were prepared by dissolving appropriate quantities of reference substances in methanol. The stock solution of internal standard DCL was prepared by dissolving the suitable quantity of substance in methanol to obtain a solution of 103 µg/ml. Ten plasma standards with the concentrations ranged between 0.05 and 60 μg/ml for IBU and respectively 5 and 300 ng/ml PSE were prepared. Accuracy and precision of the method was verified using plasma standards with concentrations of 0.05, 30 and 60 μg/ml IBU and 5, 150, 300 ng/ml PSE, respectively. The concentration of internal standard DCL in plasma was 10 μg/ml.
Chromatographic and mass spectrometry systems and conditions
The HPLC system was an 1100 series model (Agilent Technologies, Darmstadt, Germany) consisted of a binary pump, an in-line degasser, an autosampler, a column thermostat, and an Ion Trap VL mass spectrometer detector (Brucker Daltonics GmbH, Bremen, Germany). Chromatograms were processed using QuantAnalysis software version 5.1 (Brucker Daltonics). The detection of IBU was in MRM mode, using electrospray negative ionization, the ion transition monitored being m/z 205> m/z (159+161). The detection of PSE was in MRM mode using electrospray positive ionization, the transition monitored being m/z 166>148. The detection of internal standard was in MRM mode, using electrospray negative ionization by monitoring the transition m/z 293> m/z 250 m/z.
Mobile phase
The mobile phase consisted of a mixture methanol: ammonium acetate 10 mM in water =60:40, v/v each component being degassed, before elution, for 10 min in an Elma Transsonic 700/H (Singen, Germany) ultrasonic bath. The pump delivered the mobile phase at 0.3 ml/min. The chromatographic separation was performed in less than 8 minutes, at 20C on a Zorbax RX C18 3.0 x 100mm, 3µ column (Agilent Technologies), protected by an in-line filter.
Sample preparation
For chromatographic analysis standard and test plasma samples were prepared as follows. After adding 1.4N phosphoric acid (100 µl) into a previously vortexed (5 s at 1500 rpm) mixture of plasma (1000 μl) and internal

QUANTIFICATION OF IBUPROFEN AND PSEUDOEPHEDRINE IN HUMAN PLASMA BY LC/MS/MS...
179
standard (DCL, 100 μl), the resulted solution was vortex-mixed for 5 s at 1500 rpm. The solution was extracted with a mixture of diethyl ether: hexane (5 ml, 80:20, v/v) by shaking for 25 min. at 1000 rpm. The resulted mixture was centrifuged (5000 rpm) and the organic layer (4 ml) was isolated. The extracted water solution was treated with 2M sodium hydroxide (275 µl), vortex-mixed (5 s at 1500 rpm) and was subjected for extraction as described above. The combined organic layer (2×4 ml) was evaporated to dryness at 50 °C under a stream of nitrogen. The residue was suspended in the mobile phase (200 µl), vortexed (1 min. at 2400 rpm), centrifuged and injected into HPLC.
REFERENCES
1. http://www.rxlist.com/ibuprofen-drug.htm 2.http://www.rxmed.com/b.main/b2.pharmaceutical/b2.1.monographs/CPS-
%20Monographs/CPS-%20(General%20Monographs-%20D)/DRISTAN_SINUS.html 3. http://home.intekom.com/pharm/boots-h/nurof-cf.html#OVERDOSE 4. http://home.intekom.com/pharm/janssen/sinumxib.html 5. Z. Yakugaku, The Pharm.Soc. of Japan, 2005, 125(9), 733. 6. H. Farrar, L. Letzig, M. Gill, J. Chromatogr. B, 2002, 780(2), 341. 7. A. M. Rustum, J. Chromatogr Sci., 1991, 29(1), 16. 8. V.D. Bharathi, K. Radharani, B. Jagadeesh, G. Ramulu, I. Bhushan, A. Naidu, R.
Mullangi, Chromatographia, 2008, 67(5-6), 461. 9. L. Macek, P. Ptacek, J. Klma, J. Chromatogr. B, 2002, 766(2), 289. 10. G. Wang, S. Zhao, Y. Gu, J.W. Zhang, M.W. Huang, F. Shao, H. Li, Q. Zhang, H.T.
Xie, J. of Pharmaceut. Biomed., 2005, 39(1-2), 217. 11. M.I. Palabiyik, E. Dinc, F. Onur, J. of Pharmaceut. Biomed., 2004, 34(3), 473. 12. U. S. Department of Health and Human Services, Food and Drug Administration,
Center for Drug Evaluation and Research. Guidance for Industry. Bioavailability and Bioequivalence Studies for Orally Administrated Drug Products – General Considerations, Rockville, USA, 2003; http://www.fda.gov/cder/guidance /index.htm.
13. The European Agency for the Evaluation of Medicinal Products. Note for Guidance on the Investigation of Bioavailability and Bioequivalence, London, UK, 2001 (CPMP/ EWP/QWP/1401/98).
14. D. Mihu, L. Vlase, S. Imre, C.M. Mihu, M. Achim, D.L. Muntean, Studia Univ. Babeş-Bol., Chemia, 2009, 54(3), 151.
15. M. Achim, D. Muntean, L. Vlase, I. Bâldea, D. Mihu, S.E. Leucuţa, Studia Univ. Babeş-Bol., Chemia, 2009, 54(3), 7.
16. A. Butnariu, D.S. Popa, L. Vlase, M. Andreica, D. Muntean, S.E. Leucuta, Rev. Româna Med. Lab., 2009, 15(2), 7.
17. D. S. Popa, L. Vlase, S. E. Leucuţa, F. Loghin, Farmacia, 2009, 57(3), 301.


![[51st KUG PP] 프레젠테이션 무엇이 먼저인가](https://img.pdfslide.tips/doc/110x75/54b891ad4a795980408b4a93/51st-kug-pp-.jpg)