Embed Size (px)
DESCRIPTION
report on labor
Citation preview

MINISTRY OF PLANNING AND INVESTMENT GENERAL STATISTICS OFFICE
REPORT ON LABOUR FORCE SURVEY
2012
Ha Noi, 2013

INTRODUCTION
On 05 December 2011, the General Statistical Office’s Director General
issued the Decision No 810/QĐ-TCTK on conducting the 2012 Labour Force survey (LFS) and the Project of the 2012 Labour Force survey.
The purpose of the survey had collecting basics information on labour market in 2012 in comparison with data of previous annual survey of the General Statistics Office and in accordance with the international standards. The information of this survey is used to assess the fluctuation of labour market among quarters in the years and monitor the influence of socio-economic change on labour market in Vietnam. The synthetic information is presented for the whole country, urban/rural areas; 6 socio-economic regions, Hanoi and Hochiminh city for quarterly and all centrally governed cities/provinces for yearly.
This report has presented major findings of the 2012 Labour force survey in order to provide information about labour and employment to data users. This survey aim to collect information about main activities relate to labour market for persons aged 15 and above. Because in Vietnam, demand in using labour market indicator for population in working age (15-59 years old for male and 15-54 years old for female), so the results for this age group were separately calculated for some key indicators about unemployment and underemployment. The 2012 LFS were received technical support from International Labour Organization (ILO). The General Statistics Office highly appreciates this support and would like to continue receiving future supports from ILO in the upcoming survey.
The General Statistics Office hope that this report will meet basic demands for information from researchers socio-economic policy makers, especially from those persons related to labour and employment issues and warmly welcome all constructive comments from readers.
iii
Comments and detailed information, please contact the following address:
Department of Population and Labour Statistics, General Statistics Office, 6B Hoang Dieu, Ha Noi. Tel: +(84 4) 38 230 100, 38 433 353; Fax: +(84 4) 37 339 287; Email: [email protected]
GENERAL STATISTICS OFFICE
iv

TABLE OF CONTENTS Introduction...................................................................................................................... iii
Table of contents ............................................................................................................ v
Summary of key indicators .......................................................................................... 1
PART 1: MAJOR FINDINGS ......................................................................................... 11
I. LABOUR FORCE ........................................................................................................... 13
1. Size and distribution of labour force............................................................ 13
2. Labor force participation rate ........................................................................ 14
3. Labour force features ....................................................................................... 16
4. Youth in labour force....................................................................................... 18
II. EMPLOYMENT ............................................................................................................ 20
1. Size and fluctuation of employed population ............................................ 20
2. Employment-to-population ratio................................................................... 21
3. Rate of technical training and qualification of employed population.. 22
4. Composition of employed population by educational attainment ........ 23
5. Composition of employed population by occupation.............................. 24
6. Composition of employed population by industry ................................... 25
7. Composition of employed population by economic sector.................... 27
8. Composition of employed population by employment status ............... 28
9. Youth employment ........................................................................................... 29
III. WORKING CONDITIONS AND JOB QUALITY...................................................... 31
1. Own-account and unpaid family workers................................................... 31
2. Wage workers in the non-agricultural sector ............................................. 32
3. Average monthly earnings of wage workers ............................................. 33
4. Average weekly hours worked ...................................................................... 36
5. Type of contract ................................................................................................ 38
v
IV. UNEMPLOYMENT AND UNDEREMPLOYMENT................................................. 39
1. Some characteristics of the unemployed population ............................... 39
2. Unemployment and underemployment in the statutory working age.. 41
3. Some characteristics of unemployed youth................................................ 43
4. Mode of job search of people looking for work........................................ 45
V. ECONOMICALLY INACTIVE POPULATION.......................................................... 47
VI. LABOUR MIGRANTS ................................................................................................ 50
1. Profile of migrants (internal migrants) ........................................................ 50
2. Migrants in economic activity ....................................................................... 52
PART 2: TABULATED TABLES ................................................................................... 55
PART 3: ANNEXES.......................................................................................................... 191
Annex 1: Detail allocation of sample survey scope...................................... 193
Annex 2: Questionnaire ....................................................................................... 195
vi
SUMMARY OF KEY INDICATORS
1. As of the 1st July 2012, the total working-age population of Viet Nam aged 15 years and older was 52.3 million, on a year-on-year basis grew 624 thousand (1.2%). The labour force consisted of 51.4 million employed persons and 925.6 thousand unemployed persons. 2. The labour force in rural areas accounted 69.7%. 3. More than three-fourth of the working-age population aged 15 years and older participated in the labour force. The labour force participation rate was very different between men and women and varied across regions. The labour force participation rate in rural areas was higher than in urban areas. 4. The youth labour force accounted for 14.2% of the total labour force, equivalent to 7.5 million young people. The labour force participation rate of youth varied among regions. 5. The fluctuation of employed population in urban and rural areas differed considerably. The urban employed population increased by quarter in 2012. In rural areas, the number of employed people increased in quarter 2 and quarter 3, but contracted in quarter 4. The number of employed persons in the agriculture, forestry and fishing sector mainly increased in quarter 3 and significantly decreased in quarter 4. 6. Only around 8.5 million people, or 16.6% of all workers, had been trained. The urban-rural difference in the rates of the trained employed population was significant at 21.6 percentage points. 7. Gender imbalances in some sectors were quite clear, and some sectors employed a very small share of women such as transportation and storage (9.8%), construction (10.2%) and production and distribution of electricity, gas, steam and hot water and air-conditioners (16.3%). In contrast, there were other sectors which employed primarily female workers, for example hired domestic help (92.9%), education and training (70.4%) and hotels and restaurants (70%).
1

8. The share of wage workers increased by 1.3 percentage points since 2009 and accounted for about one-third of the working population. Among unpaid family workers, female were major represented. The proportion of own-account worker and unpaid family workers accounted 62.6% (32.1 million), nearly double the share of wage of workers. 9. The proportion of wage workers in the non-agricultural sector accounted for 31% of total employment. The proportion in urban areas was more than twice as high as in rural areas (50.6% compared to 22.5%). 10. There was a significant decrease in the average monthly earnings between quarter 1 and quarter 2, and this sharp fluctuation was consistent for both men and women and in both urban and rural areas. The average monthly earnings of male was 1.1 times higher than female. 11. More than one third worked between 40 to 48 hours per week (38.4%). The share of workers employed for less than 20 hours per week was low (3.4%). The proportion of working less than 35 hours per week was 15.1%. 12. There were one-fifth of all workers in Vietnam still were employed without a labour contract. The share of workers without labour contracts was higher for women (23.5%) than men (16%) and higher in rural areas (22.4%) than in urban areas (13.4%). Notably, there were more than two-fifths of youths working without contract (42.2%). 13. There were 925.6 thousand unemployed persons aged 15 and above, a year-on-year decrease of 119.7 thousand (11.5%). Urban areas accounted for 51.2% and women accounted for 54.7% of total unemployment. 14. The youth unemployed aged 15-24 accounted for 46.7% of the total unemployed population of the country. 15. The urban unemployment rate in the statutory working age was 3.21% and for rural 1.39%. The rural under-employment rate was 3.27% more than two times higher than in urban areas.
2
16. The youth unemployment rate was five times higher than the adult unemployment rate aged 25 and above in 2012. In general, unemployment was higher among female youth than male youth. 17. There were 15.7 million economic inactivity persons aged 15 and above, or 17.9% of the total population. The proportion of youth was the highest among all economic inactivity persons (39.2%). 18. A majority (91.1%) of the economic inactivity population aged 15 and above had not yet received technical qualification or training. 19. Of the 892.3 thousand internal migrants aged 15 and older, more than four-fifths (81.4%) participated in the labour force. The rate of labour force participation of migrants significantly differed between men (86.4%) and women (78%) and was uneven across regions. The employment-to-population ratio of migrants was slightly lower than the ratio for the total population aged 15 and over. 20. There were about 58.8 thousand unemployed migrants and the migrant unemployment rate was almost five times higher than the unemployment rate of the general population aged 15 years or older.
3

Table A: Selected annual indicators of the labour market, 2010-2012
Indicator 2010 2011 2012
1. Population (thousand persons) 86 933 87 840 88 776
Male 42 986 43 445 43 918
Female 43 947 44 395 44 858
Urban 26 516 27 888 28 810
Rural 60 417 59 952 59 966
2. Population aged 15+ (thousand persons) 65 711 67 165 68 195
Male 31 873 32 608 33 132
Female 33 838 34 557 35 063
Urban 20 491 22 023 22 701
Rural 45 220 45 142 45 495
3. Labour force (thousand persons) 50 837 51 724 52 348
Male 26 125 26 636 26 918
Female 24 712 25 088 25 430
Urban 14 231 15 349 15 886
Rural 36 606 36 375 36 462
4. Distribution of labour force (%)
Sex 100.0 100.0 100.0
Male 51.4 51.5 51.4
Female 48.6 48.5 48.6
Residence 100.0 100.0 100.0
Urban 28.0 29.7 30.3
Rural 72.0 70.3 69.7
Age group 100.0 100.0 100.0
15-19 6.8 6.0 5.2
20-24 11.5 10.5 9.9
25-29 13.6 12.9 12.3
30-34 12.8 12.4 12.0
35-39 12.5 12.6 12.6
40-44 11.6 11.9 12.3
45-49 10.9 11.5 12.0
50-54 8.8 9.4 9.8
55-59 5.4 6.1 6.7
60-64 2.8 3.3 3.6
65+ 3.3 3.5 3.7
4

Indicator 2010 2011 2012
Highest technical training and qualification attained: 100.0 100.0 100.0
No technical training or qualification 85.3 84.4 83.2
Vocation training 3.8 4.0 4.7
Secondary vocation school 3.5 3.7 3.7
College 1.7 1.8 2.0
University and above 5.7 6.1 6.4
5. Labour force participation rate (%) 77.4 77.0 76.8
Male 82.0 81.7 81.2
Female 73.0 72.6 72.5
Urban 69.5 69.7 70.0
Rural 81.0 80.6 80.1
6. Employed population (thousand persons) 49 494 50 679 51 422
Male 25 536 26 194 26 499
Female 23 958 24 485 24 923
Urban 13 654 14 829 15 412
Rural 35 840 35 850 36 010
7. Distribution of employed population (%)
Sex 100.0 100.0 100.0
Male 51.6 51.7 51.5
Female 48.4 48.3 48.5
Residence 100.0 100.0 100.0
Urban 27.6 29.3 30.0
Rural 72.4 70.7 70.0
Age group 100.0 100.0 100.0
15-19 6.5 5.8 5.0
20-24 11.1 10.1 9.5
25-29 13.5 12.8 12.2
30-34 12.9 12.5 12.1
35-39 12.7 12.7 12.7
40-44 11.8 12.0 12.5
45-49 11.0 11.6 12.1
50-54 8.9 9.4 9.8
55-59 5.4 6.1 6.7
60-64 2.9 3.3 3.7
65+ 3.4 3.6 3.7
5

Indicator 2010 2011 2012
Highest technical training and qualification attained 100.0 100.0 100.0
No technical training or qualification 85.4 84.6 83.4
Vocation training 3.8 4.0 4.7
Secondary vocation school 3.4 3.7 3.6
College 1.7 1.7 1.9
University and over 5.7 6.1 6.4
Employment status 100.0 100.0 100.0
Employer 3.4 2.9 2.7
Own account worker 43.3 43.9 45.1
Unpaid family worker 19.4 18.6 17.5
Wage worker 33.8 34.6 34.7
Member of cooperative 0.0 0.0 0.0
Economic sector 100.0 100.0 100.0
State 9.7 10.4 10.4
Non-State 86.8 86.2 86.3
Foreign investment 3.5 3.4 3.3
Industrial sector 100.0 100.0 100.0
Agriculture, forestry and fishing 48.7 48.4 47.4
Industry and construction 21.7 21.3 21.2
Services 29.6 30.3 31.4
Occupation 100.0 100.0 100.0
Leaders, managers and administrators of branches, levels and organizations
0.9 1.1 1.0
Professionals 5.1 5.3 5.5
Technicians and associate professionals 3.7 3.5 3.4
Clerks 1.4 1.5 1.6
Service workers and market sales workers 14.6 15.0 16.0
Skilled agricultural, forestry and fishery workers 15.5 14.1 12.7
Craft and related workers 12.6 12.1 11.8
Plant, machine operator and assemblers 7.0 7.0 7.3
Elementary occupations 39.1 40.4 40.6
8. Average monthly earning of wage workers (thousand dong) 2 519 3 105 3 757
Male 2 668 3 277 3 923
Female 2 297 2 848 3 515
Urban 2 940 3 629 4 466
Rural 2 183 2 687 3 166
6

Indicator 2010 2011 2012
9. Average weekly hours worked 45.0 45.6 45.2 Male 45.8 46.5 46.0 Female 44.1 44.6 44.3 Urban 47.3 47.6 46.7 Rural 44.1 44.7 44.5
10. Employment-to-population ratio (%) 75.3 75.5 75.4 Male 80.1 80.3 80.0 Female 70.8 70.9 71.1 Urban 66.6 67.3 67.9 Rural 79.3 79.4 79.2
11. Underemployment (thousand persons) 1 726 1 428 1 338 Male 877 753 742 Female 849 675 596 Urban 245 231 237 Rural 1 481 1 197 1 101
12. Underemployment rate of the statutory working age (%) 3.57 2.96 2.74 Male 3.50 2.99 2.93
Female 3.64 2.92 2.53 Urban 1.82 1.58 1.56 Rural 4.26 3.56 3.27
13. Unemployment population (thousand persons) 1 344 1 045 926 Male 590 442 419
Female 754 603 507 Urban 577 520 474 Rural 767 525 452
14. Youth unemployment rate (thousand persons) 656 441 432 Male 288 199 198
Female 368 242 234 Urban 246 181 181 Rural 410 260 251
15. Unemployment rate of statutory working age (%) 2.88 2.22 1.96 Male 2.38 1.77 1.67
Female 3.43 2.73 2.30 Urban 4.29 3.60 3.21 Rural 2.30 1.60 1.39
16. Youth unemployment rate (%) 7.03 5.17 5.48 Male 5.90 4.30 4.58
Female 8.26 6.21 6.57 Urban 12.03 9.04 9.17 Rural 5.63 3.98 4.25
Note: Aged 15+, except population for all age and the statutory working age (15-59 for men and 15-54 for women) and youth (aged 15-24).
7
Table B: Selected quarterly indicators of the labour market in 2012
Indicator Quarter 1
Quarter 2
Quarter 3
Quarter 4
1. Population aged 15 and over (thousand persons)
68 011 68 362 68 742 68 822
Male 33 038 33 180 33 379 33 450
Female 34 973 35 182 35 363 35 372
Urban 22 477 22 801 23 025 23 139
Rural 45 534 45 561 45 717 45 683
2. Labor force (thousand persons) 51 978 52 581 53 098 52 788
Male 26 701 26 980 27 312 27 169
Female 25 277 25 601 25 786 25 619
Urban 15 773 16 038 16 154 16 115
Rural 36 205 36 543 36 944 36 673
3. Distribution of labour force by age (%) 100.0 100.0 100.0 100.0
15-19 11.2 10.9 10.8 10.6
20-24 9.9 9.9 9.6 9.1
25-29 10.3 10.1 10.1 9.8
30-34 9.7 9.8 9.7 9.8
35-39 10.2 10.0 10.0 10.2
40-44 9.8 10.0 10.1 10.2
45-49 9.8 9.8 9.9 9.9
50-54 8.4 8.5 8.6 8.7
55-59 6.4 6.5 6.6 6.8
60-64 4.2 4.5 4.6 4.5
65 and over 10.1 10.2 10.1 10.3
4. Labor force participation rate (%) 76.4 76.9 77.2 76.7
Male 80.8 81.3 81.8 81.2
Female 72.3 72.8 72.9 72.4
Urban 70.2 70.3 70.2 69.6
Rural 79.5 80.2 80.8 80.3
5. Employed population (thousand persons) 50 998 51 699 52 114 51 931
Male 26 235 26 596 26 873 26 774
Female 24 763 25 103 25 241 25 157
Urban 15 263 15 574 15 657 15 684
Rural 35 735 36 125 36 457 36 247
6. Employment-to-population ratio (%) 75.0 75.6 75.8 75.5
Male 79.4 80.2 80.5 80.0
Female 70.8 71.4 71.4 71.1
Urban 67.9 68.3 68.0 67.8
Rural 78.5 79.3 79.7 79.3
8
Indicator Quarter 1
Quarter 2
Quarter 3
Quarter 4
7. Average monthly earning of wage worker (thousand dong)
3 905 3 573 3 766 3 805
Male 4 073 3 764 3 924 3 952 Female 3 667 3 293 3 532 3 586 Urban 4 803 4 211 4 401 4 469 Rural 3 157 3 036 3 220 3 257
8. Underemployment (thousand persons) 1 494 1 175 1 369 1 327 Male 828 666 754 737 Female 666 508 615 589 Urban 321 182 225 222 Rural 1 174 992 1 144 1 105
9. Underemployment of the statutory working age (%)
3.09 2.39 2.75 2.71
Male 3.29 2.61 2.94 2.90 Female 2.85 2.14 2.52 2.50 Urban 2.14 1.19 1.46 1.44 Rural 3.51 2.93 3.33 3.29
10. Unemployed population (thousand persons) 981 882 984 857 Male 467 385 439 396 Female 514 497 545 461 Urban 511 463 496 430 Rural 470 419 488 427
11. Youth unemployed population (thousand persons) 455 415 457 392
Male 225 174 211 183 Female 230 241 246 209 Urban 190 180 189 165 Rural 265 235 268 227
12. Unemployment rate of the statutory working age (%)
2.08 1.87 2.06 1.81
Male 1.86 1.54 1.72 1.56 Female 2.34 2.25 2.45 2.10 Urban 3.46 3.12 3.31 2.88 Rural 1.46 1.29 1.48 1.32
13. Youth unemployment rate (%) 5.68 5.21 5.70 5.29 Male 5.13 4.00 4.80 4.49 Female 6.36 6.67 6.78 6.28 Urban 9.55 8.91 9.52 8.73 Rural 4.40 3.96 4.44 4.12
Note: Quarter-to-quarter comparisons may be limited due to seasonal variations. Aged 15+, except population for all age and the statutory working age (15-59 for men and 15-54 for women) and youth (aged 15-24).
9

10

Part 1 MAJOR FINDINGS
11

12

I. LABOR FORCE In this report, the labour force or the economically active population, includes employed and unemployed persons aged 15 and over in the survey reference week. 1. Size and distribution of labour force As of 1 July 2012, the labour force of Vietnam was 52.3 million, a year-on-year increase of 624 thousand (1.2%). The labour force consisted of 51.4 million employed persons and 925.6 thousand unemployed persons. Women (48.6%) accounted for a lower share of the labour force than men (51.4%) (Table 1.1). Moreover, approximately 69.7% of the labour force in Vietnam was still concentrated in rural areas, despite substantial growth in the urban share of the labour force in recent years.
Among the eight socio-economic regions, nearly three-fifths (or 56.7%) of the nation’s labour force was concentrated in three regions: the Red River Delta, the North and South Central Coast and the Mekong River Delta.
Table 1.1: Number and distribution of labour force in 2012
Proportion (%) Residence/Socio-economic region
Labour force (Thousand persons) Total Male Female
Female share (%)
Entire country 52 348.0 100.0 100.0 100.0 48.6 Urban 15 885.7 30.3 30.4 30.3 48.5 Rural 36 462.3 69.7 69.6 69.7 48.6
Socio-economic region Northern Midlands and Mountains 7 209.3 13.8 13.4 14.2 50.1 Red River Delta (*) 8 023.6 15.3 14.7 16.0 50.6 North and South Central Coast 11 309.3 21.6 21.1 22.1 49.7 Central Highlands 3 136.6 6.0 6.1 5.9 48.1 Southeast (*) 4 517.7 8.6 8.8 8.5 47.7 Mekong River Delta 10 362.8 19.8 20.9 18.6 45.6 Ha Noi city 3 702.5 7.1 6.9 7.2 49.6 Ho Chi Minh city 4 086.4 7.8 8.1 7.5 46.9
(*) Red River Delta excludes Hanoi city and Southeast excludes Ho Chi Minh city.
13

The female share of the labour force varied little between urban and rural areas but more noticeably by socio-economic region, ranging from 45.6% in the Mekong River Delta to 50.6% in the Red River Delta. The data indicate contrasting levels of gender parity in labour force participation between the two large delta regions of the country. 2. Labour force participation rate In 2012, more than three-fourths (76.8%) of the working age population aged 15 and older participated in the labour force (Table 1.2). The labour force participation rate was very different between men (81.2%) and women (72.5%) and varied across regions. The labour force participation rate in rural areas was higher than in urban areas by 10.2 percentage points. Both men and women experience this rural-urban differential, although the gap was larger among women (11.7 percentage points) than men (8.3 percentage points). Table 1.2: Labour force participation rate in 2012
Unit: Percentage
Residence/Socio-economic region Total Male Female Male-female
gap Entire country 76.8 81.2 72.5 8.7
Urban 70.0 75.7 64.8 10.8 Rural 80.1 84.0 76.5 7.5
Socio-economic region Northern Midlands and Mountains 84.3 85.9 82.7 3.2 Red River Delta (*) 75.9 77.7 74.3 3.4 North and South Central Coast 77.7 80.6 74.9 5.7 Central Highlands 82.9 85.7 80.1 5.7 Southeast (*) 77.8 84.1 71.9 12.3 Mekong River Delta 77.4 85.5 69.6 15.9 Ha noi city 69.9 72.7 67.3 5.4 Ho Chi Minh city 65.4 74.5 57.4 17.1
(*) Red River Delta excludes Hanoi City and Southeast excludes Ho Chi Minh City.
Notably, the labour force participation rate was highest in the two mountainous regions of the Northern Midlands and Mountains (84.3%) and the Central Highlands (82.9%). By contrast, it was lowest in the two largest socio-economic centers of the country, namely Hanoi (69.9%) and Ho Chi Minh City (65.4%). In all eight socio-economic regions, the labour force participation rate of women was consistently lower than for men. Moreover, the male-female gap in
14

labour force participation rate increased gradually when examining differences from the Northern regions to the Southern regions.
Table 1.3 presents the quarterly labour force participation rates in 2012. The labour force participation rate increased from quarter 1 to quarter 3, but decreased in quarter 4, reflecting the end of summer vacation and the beginning of the school term. In rural areas, the rate of labor force participation increased by 0.7 percentage points from quarter 1 to quarter 2 and by 0.6 percentage points from quarter 2 to quarter 3, but declined by 0.5 percentage points from quarter 3 to quarter 4. By contrast, labour force participation in urban areas tended to be more stable than in the rural areas during the first three quarters, but declined on a quarter-on-quarter basis by 0.6 points in quarter 4.
Table 1.3: Labour force participation rate by quarter in 2012
Unit: Percentage
Residence/Socio-economic region Quarter 1 Quarter 2 Quarter 3 Quarter 4
Entire country 76.4 76.9 77.2 76.7 Male 80.8 81.3 81.8 81.2 Female 72.3 72.8 72.9 72.4 Urban 70.2 70.3 70.2 69.6 Rural 79.5 80.2 80.8 80.3
Socio-economic region Northern Midlands and Mountains 83.7 84.2 85.3 84.3 Red River Delta (*) 74.5 75.5 76.9 76.7 North and South Central Coast 77.4 77.7 78.3 77.9 Central Highlands 82.9 83.4 83.0 82.6 Southeast (*) 77.7 78.4 78.1 77.6 Mekong River Delta 77.2 78.0 77.7 76.8 Ha Noi city 69.7 69.9 70.1 70.0 Ho Chi Minh city 66.4 65.8 65.1 64.6
(*) Red River Delta excludes Hanoi City and Southeast excludes Ho Chi Minh City.
Figure 1.1 shows that the labour force participation rate of women is lower
than men in all age group. The male-female gap in labour force participation rate peaked in the age group of 55-59 years with a gap of 14.5 percentage points. The reason for this is related to women’s statutory retirement age being 55 years, and the fact that after retirement, women usually are not economically active.
15
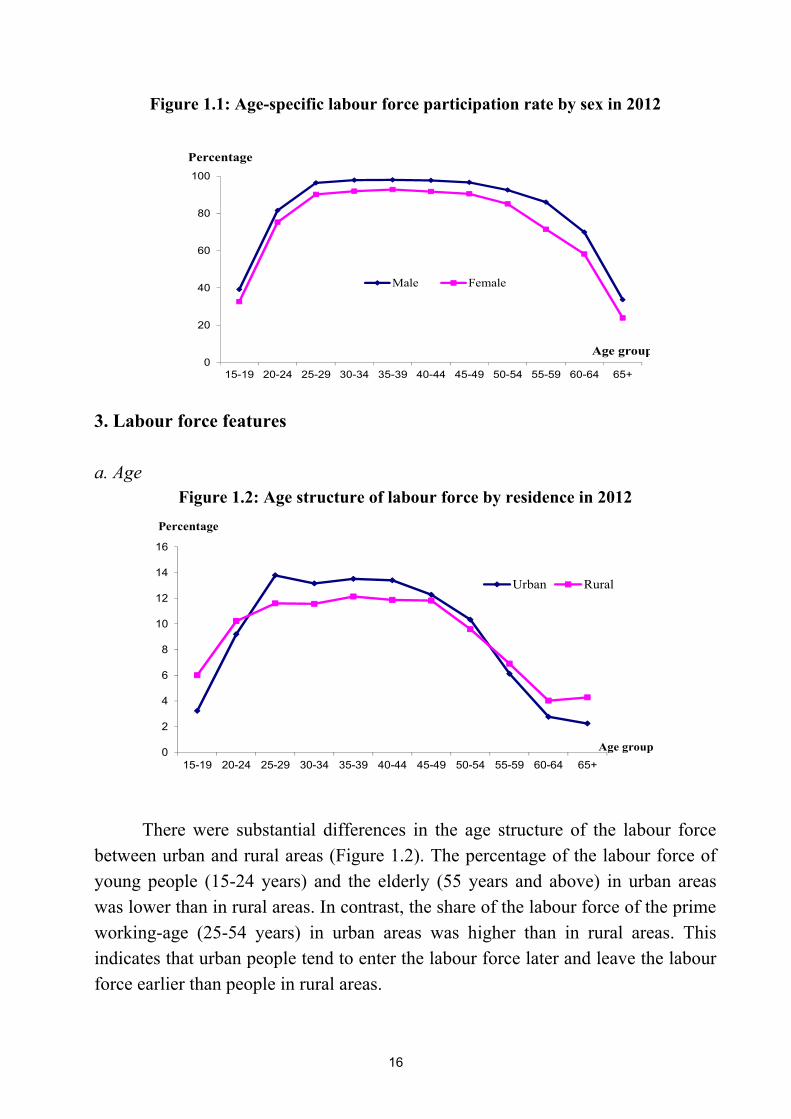
Figure 1.1: Age-specific labour force participation rate by sex in 2012
0
20
40
60
80
100
15-19 20-24 25-29 30-34 35-39 40-44 45-49 50-54 55-59 60-64 65+
Percentage
Age group
Male Female
3. Labour force features a. Age
Figure 1.2: Age structure of labour force by residence in 2012
0
2
4
6
8
10
12
14
16
15-19 20-24 25-29 30-34 35-39 40-44 45-49 50-54 55-59 60-64 65+
Percentage
Age group
Urban Rural
There were substantial differences in the age structure of the labour force between urban and rural areas (Figure 1.2). The percentage of the labour force of young people (15-24 years) and the elderly (55 years and above) in urban areas was lower than in rural areas. In contrast, the share of the labour force of the prime working-age (25-54 years) in urban areas was higher than in rural areas. This indicates that urban people tend to enter the labour force later and leave the labour force earlier than people in rural areas.
16
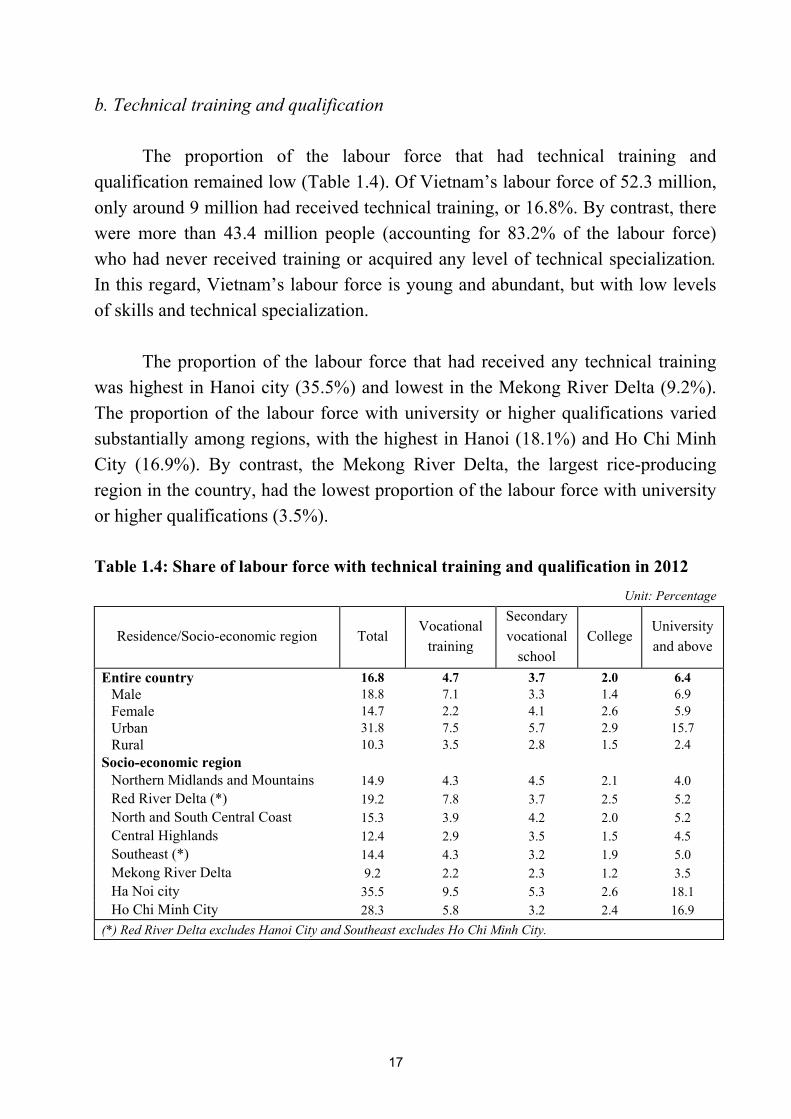
b. Technical training and qualification The proportion of the labour force that had technical training and
qualification remained low (Table 1.4). Of Vietnam’s labour force of 52.3 million, only around 9 million had received technical training, or 16.8%. By contrast, there were more than 43.4 million people (accounting for 83.2% of the labour force) who had never received training or acquired any level of technical specialization. In this regard, Vietnam’s labour force is young and abundant, but with low levels of skills and technical specialization.
The proportion of the labour force that had received any technical training
was highest in Hanoi city (35.5%) and lowest in the Mekong River Delta (9.2%). The proportion of the labour force with university or higher qualifications varied substantially among regions, with the highest in Hanoi (18.1%) and Ho Chi Minh City (16.9%). By contrast, the Mekong River Delta, the largest rice-producing region in the country, had the lowest proportion of the labour force with university or higher qualifications (3.5%).
Table 1.4: Share of labour force with technical training and qualification in 2012
Unit: Percentage
Residence/Socio-economic region Total Vocational
training
Secondary vocational
school College
University and above
Entire country 16.8 4.7 3.7 2.0 6.4 Male 18.8 7.1 3.3 1.4 6.9 Female 14.7 2.2 4.1 2.6 5.9 Urban 31.8 7.5 5.7 2.9 15.7 Rural 10.3 3.5 2.8 1.5 2.4
Socio-economic region Northern Midlands and Mountains 14.9 4.3 4.5 2.1 4.0 Red River Delta (*) 19.2 7.8 3.7 2.5 5.2 North and South Central Coast 15.3 3.9 4.2 2.0 5.2 Central Highlands 12.4 2.9 3.5 1.5 4.5 Southeast (*) 14.4 4.3 3.2 1.9 5.0 Mekong River Delta 9.2 2.2 2.3 1.2 3.5 Ha Noi city 35.5 9.5 5.3 2.6 18.1 Ho Chi Minh City 28.3 5.8 3.2 2.4 16.9
(*) Red River Delta excludes Hanoi City and Southeast excludes Ho Chi Minh City.
17
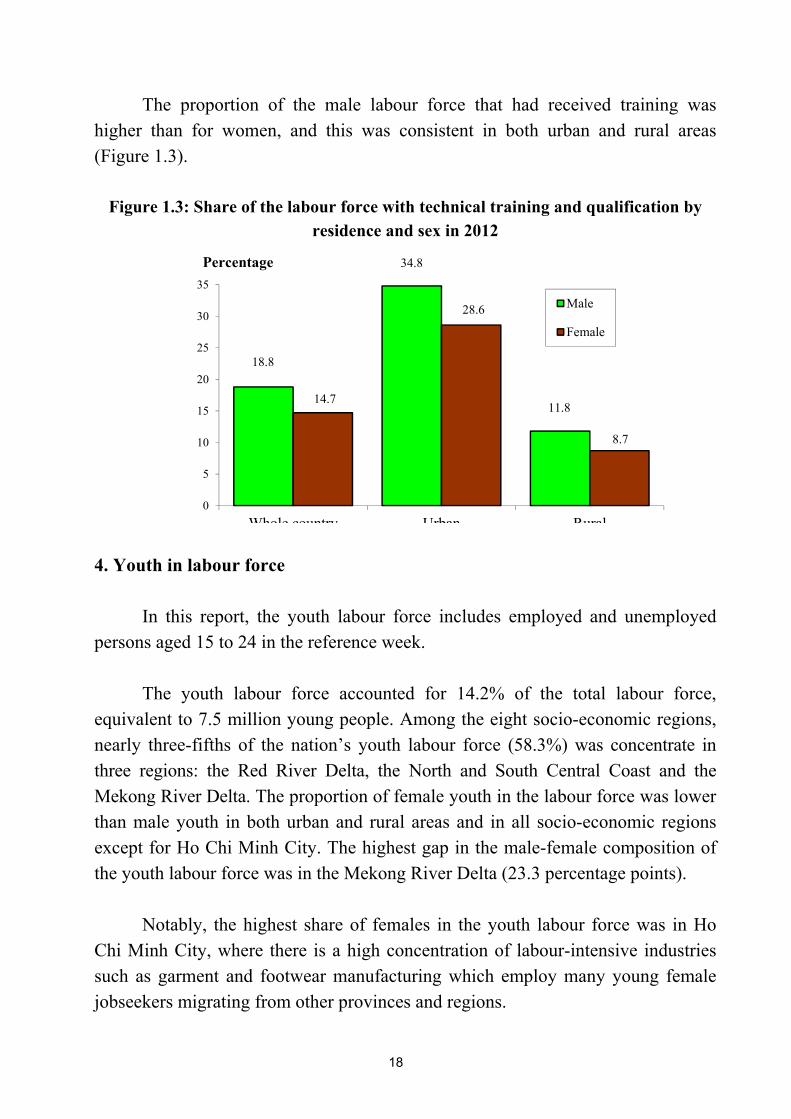
The proportion of the male labour force that had received training was higher than for women, and this was consistent in both urban and rural areas (Figure 1.3).
Figure 1.3: Share of the labour force with technical training and qualification by
residence and sex in 2012
18.8
34.8
11.814.7
28.6
8.7
0
5
10
15
20
25
30
35
Whole country Urban Rural
Percentage
Male
Female
4. Youth in labour force
In this report, the youth labour force includes employed and unemployed
persons aged 15 to 24 in the reference week.
The youth labour force accounted for 14.2% of the total labour force, equivalent to 7.5 million young people. Among the eight socio-economic regions, nearly three-fifths of the nation’s youth labour force (58.3%) was concentrate in three regions: the Red River Delta, the North and South Central Coast and the Mekong River Delta. The proportion of female youth in the labour force was lower than male youth in both urban and rural areas and in all socio-economic regions except for Ho Chi Minh City. The highest gap in the male-female composition of the youth labour force was in the Mekong River Delta (23.3 percentage points). Notably, the highest share of females in the youth labour force was in Ho Chi Minh City, where there is a high concentration of labour-intensive industries such as garment and footwear manufacturing which employ many young female jobseekers migrating from other provinces and regions.
18

Table 1.5: Number and distribution of youth labour force in 2012
Distribution (%) Proportion of youth in the total labour force
(%) Residence/Socio-economic region
Youth labour force
(Thousands persons) Total Male Female Total Male Female
Entire country 7 455.7 100.0 55.4 44.6 14.2 15.3 13.1 Urban 1 792.5 100.0 50.5 49.5 11.3 11.1 11.5 Rural 5 663.2 100.0 57.0 43.0 15.5 17.2 13.7
Socio-economic region Northern Midlands and Mountains 1 322.6 100.0 53.8 46.2 18.3 19.8 16.9 Red River Delta (*) 873.3 100.0 53.5 46.5 10.9 11.8 10.0 North and South Central Coast 1 543.0 100.0 56.0 44.0 13.6 15.2 12.1 Central Highlands 571.0 100.0 56.9 43.1 18.2 19.9 16.3 Southeast (*) 758.8 100.0 51.2 48.8 16.8 16.5 17.2 Mekong River Delta 1 481.1 100.0 61.6 38.4 14.3 16.2 12.0 Ha noi City 416.9 100.0 53.1 46.9 11.3 11.9 10.7 Ho Chi Minh city 488.9 100.0 49.1 50.9 12.0 11.1 13.0
(*) Red River Delta excludes Hanoi City and Southeast excludes Ho Chi Minh City. The labour force participation rate of youth differed between men (56.2%) and women (49.2%) and also varied among regions (Table 1.6). The labour force participation rate of youth in rural areas exceeded that in urban areas by 17.1 percentage points, with the rural-urban gap higher among men (20.3 percentage points) than women (13.4 percentage points). There were clear differences among regions in terms of youth labour participation. While the labour force participation rate of youth in Northern Midlands and Mountains was 69%, the comparable rate for youth in Ho Chi Minh City was only 39.8%. In all eight regions, participation among male youth was higher than for female youth, with the lowest gap in Ho Chi Minh City (0.3%) and the highest in the Mekong River Delta (20.5%).
19

Table 1.6: Labour force participation rate of youth in 2012 Unit: Percentage
Residence/region Total Male Female Male -
female gap Entire country 52.9 56.2 49.2 7.0
Urban 41.1 41.9 40.2 1.7 Rural 58.1 62.2 53.6 8.6
Socio-economic region Northern Midlands and Mountains 69.0 69.7 68.1 1.6 Red River Delta (*) 46.3 47.5 45.0 2.5 North and South Central Coast 49.1 51.7 46.2 5.5 Central Highlands 59.6 63.7 55.0 8.7 Southeast (*) 57.9 60.4 55.4 4.9 Mekong River Delta 56.2 65.9 45.4 20.5 Ha noi city 40.6 41.6 39.5 2.0 Ho Chi Minh city 39.8 40.0 39.7 0.3
(*) Red River Delta excludes Hanoi City and Southeast excludes Ho Chi Minh City. II. EMPLOYMENT 1. Size and fluctuation of employed population Employment indicators are important for assessing economic development and for designing appropriate employment policies. In 2012, the employed population in Vietnam was 51.4 million, a year-on-year increase of 743 thousand (1.5%), and consisted of 26.5 million men and 24.9 million women. Table 2.1 shows the fluctuation of the employed population by quarter in 2012 and by urban/rural area, industrial sector, economic sector and region. Employment increased the most from quarter 1 to quarter 2 (701.2 thousand) but actually decreased from quarter 3 to quarter 4 (183.6 thousand). Quarterly trends in the size of the employed population in urban and rural areas differed considerably. The urban employed population increased throughout 2012, but a slower pace as the year progressed. In rural areas, the number of employed people increased significantly in quarter 2 and 3, but contracted by 210 thousand in quarter 4.
20
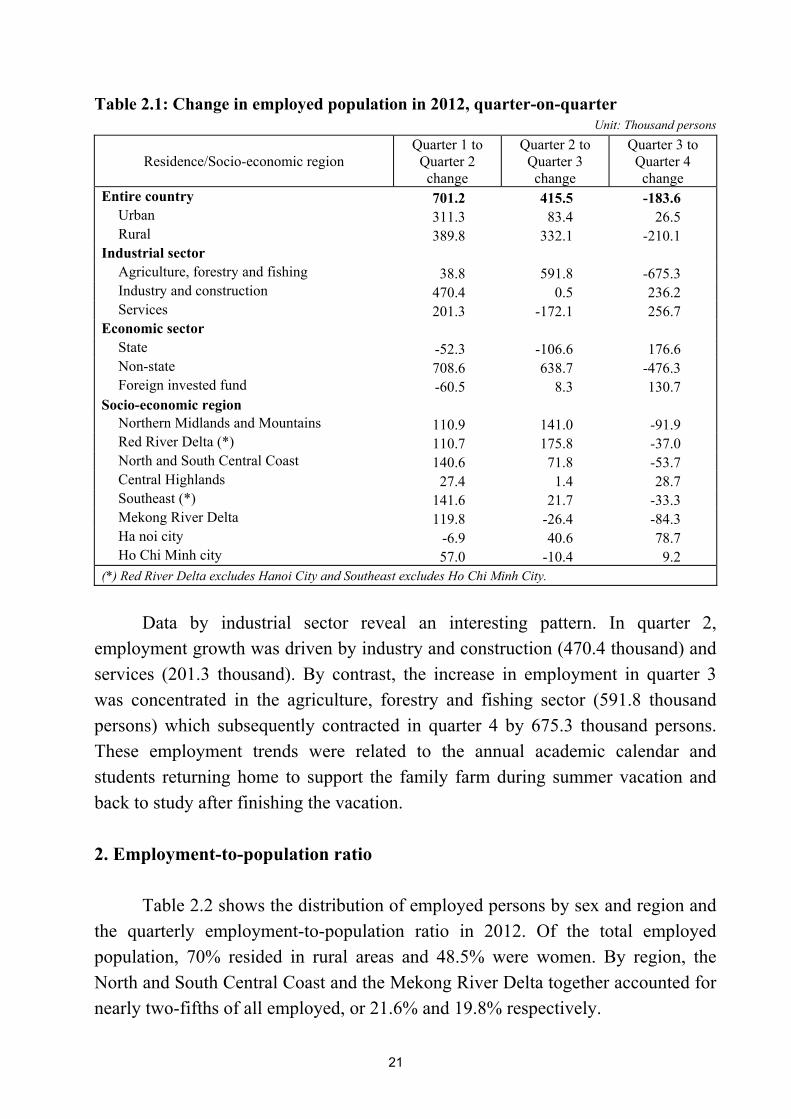
Table 2.1: Change in employed population in 2012, quarter-on-quarter Unit: Thousand persons
Residence/Socio-economic region Quarter 1 to
Quarter 2 change
Quarter 2 to Quarter 3 change
Quarter 3 to Quarter 4 change
Entire country 701.2 415.5 -183.6 Urban 311.3 83.4 26.5 Rural 389.8 332.1 -210.1
Industrial sector Agriculture, forestry and fishing 38.8 591.8 -675.3 Industry and construction 470.4 0.5 236.2 Services 201.3 -172.1 256.7
Economic sector State -52.3 -106.6 176.6 Non-state 708.6 638.7 -476.3 Foreign invested fund -60.5 8.3 130.7
Socio-economic region Northern Midlands and Mountains 110.9 141.0 -91.9 Red River Delta (*) 110.7 175.8 -37.0 North and South Central Coast 140.6 71.8 -53.7 Central Highlands 27.4 1.4 28.7 Southeast (*) 141.6 21.7 -33.3 Mekong River Delta 119.8 -26.4 -84.3 Ha noi city -6.9 40.6 78.7 Ho Chi Minh city 57.0 -10.4 9.2
(*) Red River Delta excludes Hanoi City and Southeast excludes Ho Chi Minh City.
Data by industrial sector reveal an interesting pattern. In quarter 2, employment growth was driven by industry and construction (470.4 thousand) and services (201.3 thousand). By contrast, the increase in employment in quarter 3 was concentrated in the agriculture, forestry and fishing sector (591.8 thousand persons) which subsequently contracted in quarter 4 by 675.3 thousand persons. These employment trends were related to the annual academic calendar and students returning home to support the family farm during summer vacation and back to study after finishing the vacation. 2. Employment-to-population ratio Table 2.2 shows the distribution of employed persons by sex and region and the quarterly employment-to-population ratio in 2012. Of the total employed population, 70% resided in rural areas and 48.5% were women. By region, the North and South Central Coast and the Mekong River Delta together accounted for nearly two-fifths of all employed, or 21.6% and 19.8% respectively.
21

The employment-to-population ratio in quarter 4 reached 75.5%, and was higher in rural areas (79.3%) than in urban areas (67.8%). The gap in the employment-to-population ratio between men and women was 8.9 percentage points. Variances were also notably by region, ranging from 62.8% in Ho Chi Minh City to 83.8% in the Northern Midlands and Mountains. On a quarter-on-quarter basis, the employment-to-population ratio in quarter 4 increased to 68.8% in Hanoi, remained unchanged in Ho Chi Minh City at 62.8% and decreased in all other regions. Table 2.2: Distribution of employed population and employment-to-population
ratio by quarter in 2012 Unit: Percentage
Proportion of employed workers
Employment-to-population ratio
Residence/Socio-economic region Total Male Female
% Female
Q 1 Q 2 Q 3 Q 4
Entire country 100.0 100.0 100.0 48.5 75.0 75.6 75.8 75.5 Urban 30.0 30.0 29.9 48.3 67.9 68.3 68.0 67.8 Rural 70.0 70.0 70.1 48.5 78.5 79.3 79.7 79.3
Socio-economic region Northern Midlands and Mountains 13.9 13.5 14.4 50.1 83.0 83.6 84.7 83.8 Red River Delta (*) 15.4 14.7 16.0 50.6 73.3 74.3 75.7 75.6 North and South Central Coast 21.6 21.1 22.1 49.7 75.8 76.4 76.6 76.3 Central Highlands 6.0 6.1 5.9 47.9 81.7 82.3 81.7 81.6 Southeast (*) 8.6 8.8 8.5 47.6 76.3 77.1 77.1 76.6 Mekong River Delta 19.8 21.0 18.4 45.2 75.7 76.6 76.1 75.4 Ha noi city 7.1 6.9 7.2 49,6 68.4 68.6 68.5 68.8 Ho Chi Minh city 7.7 7.9 7.4 46,6 63.6 63.6 62.8 62.8
(*) Red River Delta excludes Hanoi City and Southeast excludes Ho Chi Minh City.
3. Rate of technical training and qualification of employed population Only around 8.5 million people, or 16.6% of all workers, had been trained (Table 2.3). The urban-rural difference in the rates of the trained employed population was significant at 21.6 percentage points (31.7% for urban areas and 10.1% for rural areas). The share of trained workers was lowest in the Mekong River Delta (9.1%) and Central Highlands (12.1%) and was highest in the two most economically developed centers of Vietnam, namely Ha Noi and Ho Chi Minh City. In regard to
22
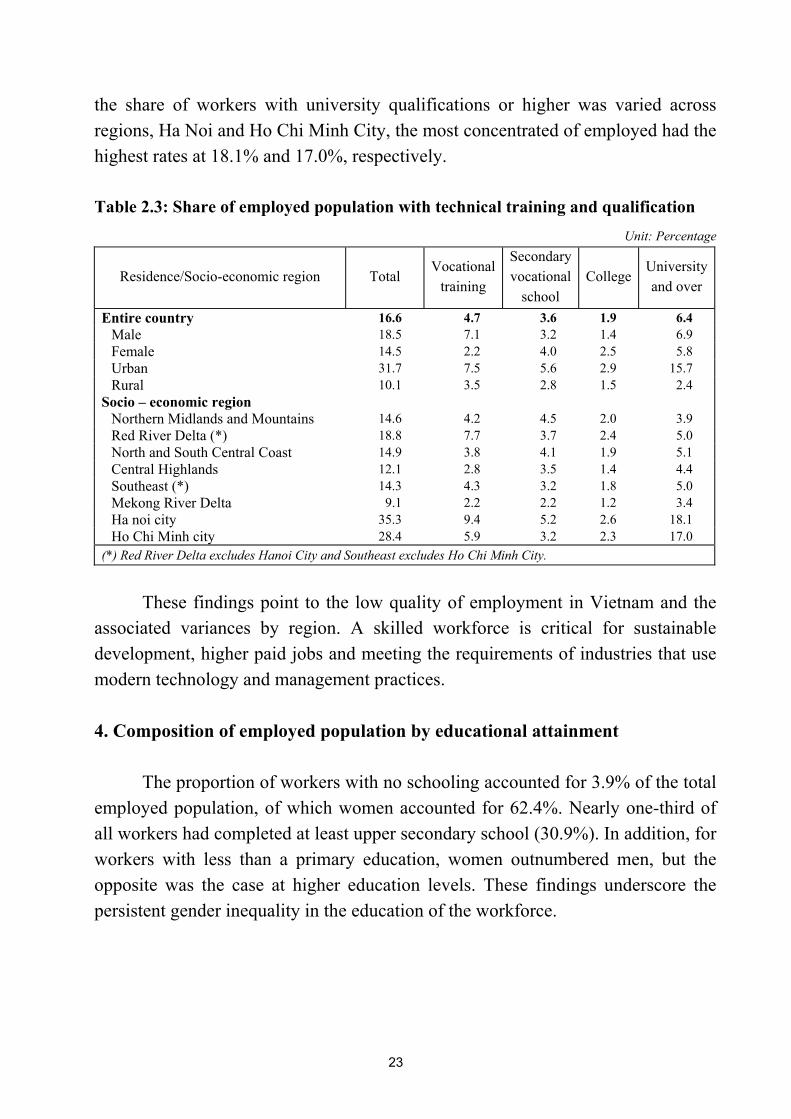
the share of workers with university qualifications or higher was varied across regions, Ha Noi and Ho Chi Minh City, the most concentrated of employed had the highest rates at 18.1% and 17.0%, respectively. Table 2.3: Share of employed population with technical training and qualification
Unit: Percentage
Residence/Socio-economic region Total Vocational
training
Secondary vocational
school College
University and over
Entire country 16.6 4.7 3.6 1.9 6.4 Male 18.5 7.1 3.2 1.4 6.9 Female 14.5 2.2 4.0 2.5 5.8 Urban 31.7 7.5 5.6 2.9 15.7 Rural 10.1 3.5 2.8 1.5 2.4
Socio – economic region Northern Midlands and Mountains 14.6 4.2 4.5 2.0 3.9 Red River Delta (*) 18.8 7.7 3.7 2.4 5.0 North and South Central Coast 14.9 3.8 4.1 1.9 5.1 Central Highlands 12.1 2.8 3.5 1.4 4.4 Southeast (*) 14.3 4.3 3.2 1.8 5.0 Mekong River Delta 9.1 2.2 2.2 1.2 3.4 Ha noi city 35.3 9.4 5.2 2.6 18.1 Ho Chi Minh city 28.4 5.9 3.2 2.3 17.0
(*) Red River Delta excludes Hanoi City and Southeast excludes Ho Chi Minh City. These findings point to the low quality of employment in Vietnam and the associated variances by region. A skilled workforce is critical for sustainable development, higher paid jobs and meeting the requirements of industries that use modern technology and management practices.
4. Composition of employed population by educational attainment The proportion of workers with no schooling accounted for 3.9% of the total employed population, of which women accounted for 62.4%. Nearly one-third of all workers had completed at least upper secondary school (30.9%). In addition, for workers with less than a primary education, women outnumbered men, but the opposite was the case at higher education levels. These findings underscore the persistent gender inequality in the education of the workforce.
23

Table 2.4: Distribution of employed population by educational attainment in 2012 Unit: Percentage
Educational attainment Total Male Female % Female
Total 100.0 100.0 100.0 48.5 Never attended 3.9 2.9 5.1 62.4 Incomplete primary 11.7 10.4 13.0 53.9 Completed primary 24.6 24.0 25.4 49.9 Completed lower secondary 30.9 30.8 31.0 48.6 Completed upper secondary 12.3 13.4 11.1 44.0 Technical qualification 16.6 18.6 14.5 42.3
5. Composition of employed population by occupation
In 2012, 40.5% of the employed population worked in elementary occupations (20.8 million). Other key occupation groups included service workers and market sales workers (8.2 million or 16.0%); skilled agricultural, forestry and fishery workers (6.5 million or 12.7%) and craft and related workers (6.1 million or 11.8%). By contrast, professionals, technicians, and associate professionals accounted for significantly fewer jobs (5.5% and 3.4%, respectively).
Table 2.5: Size and distribution of employed population by occupation in 2012
Proportion (%)
Occupation
Number of employed workers
(Thousand persons)
Total Male Female
% Female
Total 51 422.4 100.0 100.0 100.0 48.5 1. Leaders, managers and administrators of branches, levels and organizations 532.0 1.0 1.5 0.5 23.9
2. Professionals 2 817.7 5.5 5.2 5.8 51.3 3. Technicians and associate professionals 1 745.0 3.4 2.9 3.9 55.7 4. Clerks 839.3 1.6 1.8 1.5 43.1 5. Service workers and market sales workers 8 213.8 16.0 11.5 20.7 63.0 6. Skilled agricultural, forestry and fishery workers 6 533.2 12.7 13.8 11.5 44.0
7. Craft and related workers 6 055.7 11.8 16.3 7.0 28.7 8. Plant, machine operator and assemblers 3 728.5 7.3 8.8 5.7 37.8 9. Elementary occupations 20 828.9 40.5 37.8 43.3 51.8 10. Other (*) 128.3 0.2 0.4 0.1 19.4
Notes: (*) These occupations were held by a small number of workers and hence the statistical reliability is lower.
24

Women were under-represented in five of the nine occupation categories and notably accounted for only 23.9% of leader in all fields. On the other hand, there were higher shares of women than men in service workers and market sale worker; professionals, technicians and associate professionals and elementary occupations. 6. Composition of employed population by industry
The economic structural shift towards industry and modernization is a major policy priority in Vietnam, with implications for employment in various sectors. Table 2.6 indicates a sizeable shift in the distribution of employment by the three main industrial sectors since 2000. Agriculture accounted for 47.4% of the workforce in 2012, a remarkable decline of 14.8 percentage points compared to 2000. By contrast, the share of employment in industry increased from 13% to 21.2% during the same period and from 24.8% to 31.4% in services.
Table 2.6: Structure of employed population by industrial sector in 2000-2012
Unit: Percentage
Year Agriculture, forestry and
fishery Industry and construction Services
2000 62.2 13.0 24.8 2001 60.3 14.5 25.1 2002 58.6 15.4 26.0 2003 57.2 16.8 26.0 2004 56.1 17.4 26.5 2005 55.1 17.6 27.3 2006 54.3 18.2 27.6 2007 52.9 18.9 28.1 2008 52.3 19.3 28.4 2009 51.5 20.0 28.4 2010 49.5 21.0 29.5 2011 48.4 21.3 30.3 2012 47.4 21.2 31.4
Source: 2000-2011: The Statistics Yearbook; 2012: The 2012 labour force survey.
Figure 2.1 presents the proportion of the employed population by industrial
sector for each region. The data show that Ho Chi Minh City had the most developed economic structure with 97.2% of employment based in secondary and tertiary sectors. In the mountainous and coastal areas, the proportion of the workforce in agriculture remained quite high and accounted for 71.2% in the
25
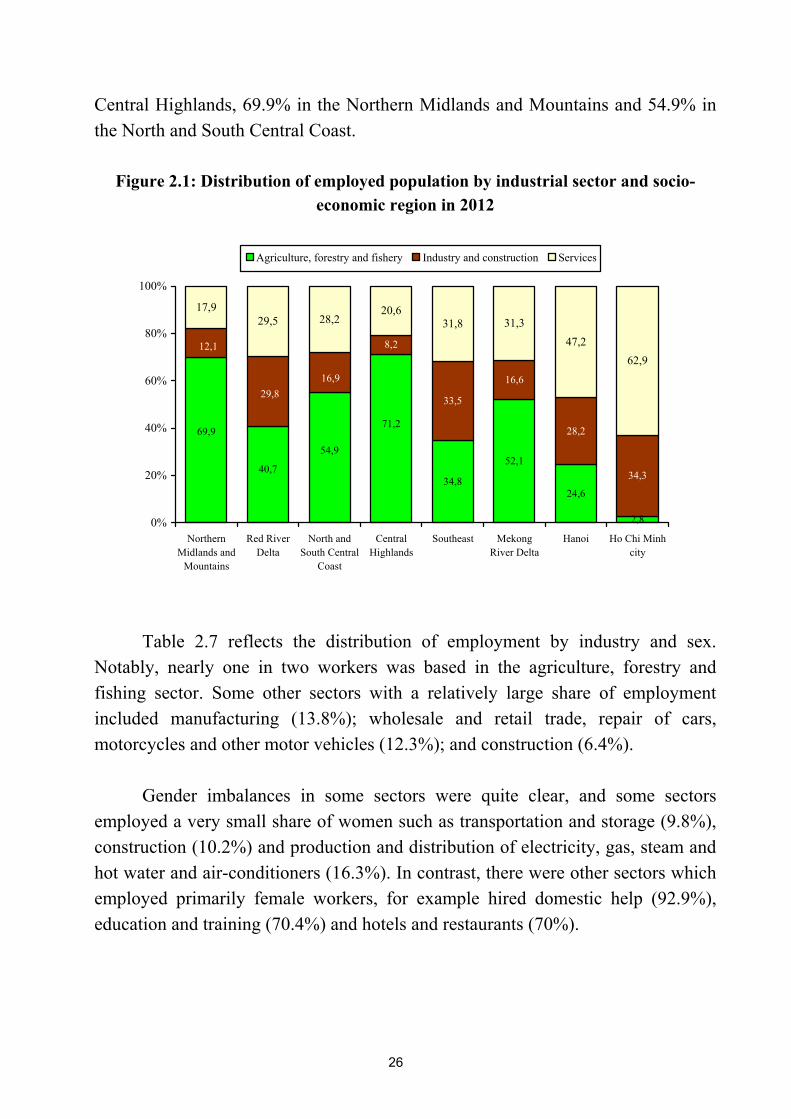
Central Highlands, 69.9% in the Northern Midlands and Mountains and 54.9% in the North and South Central Coast.
Figure 2.1: Distribution of employed population by industrial sector and socio-
economic region in 2012
34,8
52,1
24,6
2,8
8,2
33,5
16,6
28,2
34,3
17,929,5 28,2
20,631,8 31,3
47,262,9
54,9
69,9
40,7
71,2
12,1
29,816,9
0%
20%
40%
60%
80%
100%
NorthernMidlands and
Mountains
Red RiverDelta
North andSouth Central
Coast
CentralHighlands
Southeast MekongRiver Delta
Hanoi Ho Chi Minhcity
Agriculture, forestry and fishery Industry and construction Services
Table 2.7 reflects the distribution of employment by industry and sex. Notably, nearly one in two workers was based in the agriculture, forestry and fishing sector. Some other sectors with a relatively large share of employment included manufacturing (13.8%); wholesale and retail trade, repair of cars, motorcycles and other motor vehicles (12.3%); and construction (6.4%).
Gender imbalances in some sectors were quite clear, and some sectors
employed a very small share of women such as transportation and storage (9.8%), construction (10.2%) and production and distribution of electricity, gas, steam and hot water and air-conditioners (16.3%). In contrast, there were other sectors which employed primarily female workers, for example hired domestic help (92.9%), education and training (70.4%) and hotels and restaurants (70%).
26

Table 2.7: Distribution of employed population by industry in 2012 Unit: Percentage
Industrial sector Total Male Female % Female
Total 100.0 100.0 100.0 48.5 A. Agriculture, forestry and fishery 47.4 45.4 49.5 50.7 B. Mining and quarrying 0.6 0.8 0.3 22.2 C. Manufacturing 13.8 12.7 15.0 52.6 D. Production and distribution of electricity, gas, steam and hot water and air-conditioners 0.3 0.4 0.1 16.3
E. Distribution of water, management and processing activities of sewage and waste 0.2 0.2 0.2 41.4
F. Construction 6.4 11.1 1.3 10.2 G. Wholesale and retail trade, repair of cars, motorcycles and other motor vehicles 12.3 10.0 14.7 57.9
H. Transport and storage 2.9 5.1 0.6 9.8 I. Hotels and restaurants 4.2 2.4 6.0 70.0 J. Information and communication 0.6 0.7 0.4 36.9 K. Financial intermediation, banking and insurance 0.6 0.5 0.7 54.9 L. Real estate activities 0.3 0.3 0.3 47.2 M. Technological, scientific and specialized activities 0.5 0.6 0.3 33.0 N. Administrative activities and supporting services 0.4 0.5 0.4 39.0 O. Activities of communist party, social-political organizations, governmental management, national defense security; compulsory social security
3.1 4.4 1.6 25.8
P. Training and education 3.4 2.0 5.0 70.4 Q. Health and social work 0.9 0.7 1.2 63.5 R. Recreational cultural and sporting activities 0.5 0.5 0.5 52.6 S. Other service activities 1.4 1.6 1.3 42.6 T. Activities of domestic hired laborers in households which producing products and services consuming by themselves 0.3 0.0 0.6 92.9
U. Extra territorial organizations and bodies (*) 0.0 0.0 0.0 69.9
Note: (*) This sector accounted for a very small share of the survey sample, and hence the statistical reliability is low. 7. Composition of employed population by economic sector
Table 2.8 shows the number and proportion of the employed population by economic sector. The self-employed/household enterprise sector accounted for 77.6% of the total, or about 39.9 million workers. In contrast, the cooperative/collective sector that predominated in the 1970s and contributed to the development of socialism in Vietnam, now employed only a very small share of all workers (0.3%). Moreover, employment in private enterprises and foreign invested
27
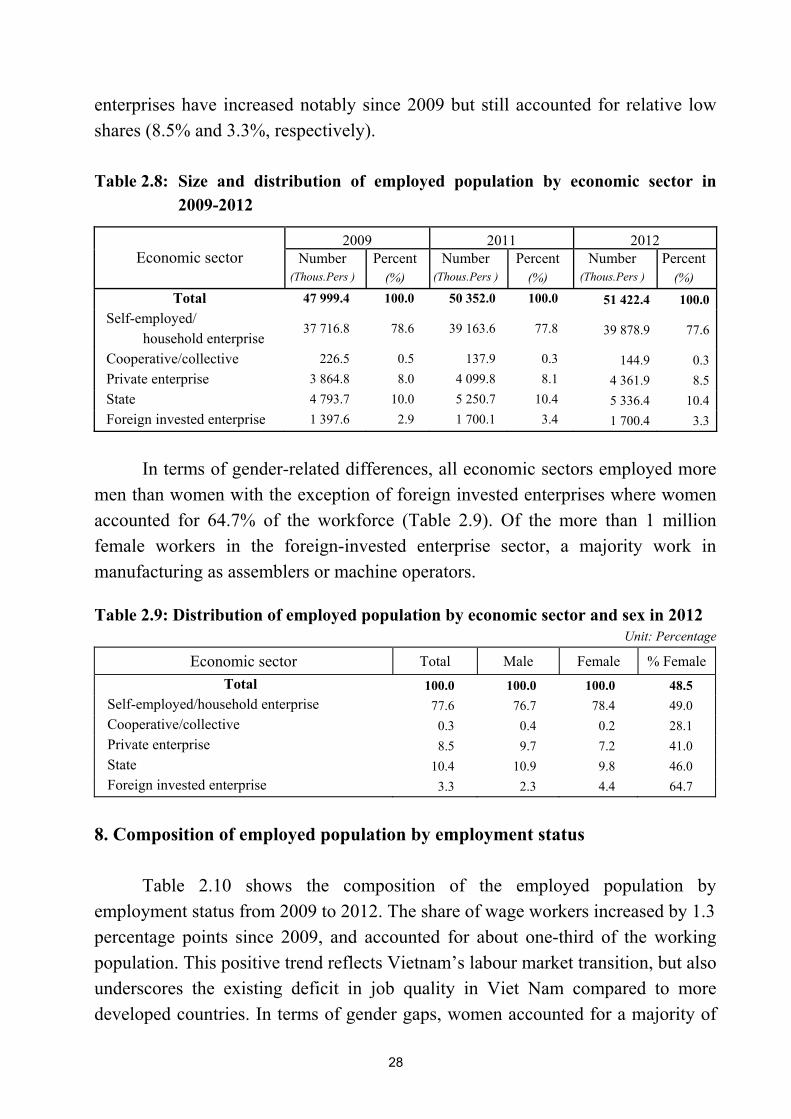
enterprises have increased notably since 2009 but still accounted for relative low shares (8.5% and 3.3%, respectively). Table 2.8: Size and distribution of employed population by economic sector in
2009-2012
2009 2011 2012Economic sector Number
(Thous.Pers ) Percent
(%) Number
(Thous.Pers ) Percent
(%) Number
(Thous.Pers ) Percent
(%) Total 47 999.4 100.0 50 352.0 100.0 51 422.4 100.0
Self-employed/ household enterprise
37 716.8 78.6 39 163.6 77.8 39 878.9 77.6
Cooperative/collective 226.5 0.5 137.9 0.3 144.9 0.3Private enterprise 3 864.8 8.0 4 099.8 8.1 4 361.9 8.5State 4 793.7 10.0 5 250.7 10.4 5 336.4 10.4Foreign invested enterprise 1 397.6 2.9 1 700.1 3.4 1 700.4 3.3
In terms of gender-related differences, all economic sectors employed more men than women with the exception of foreign invested enterprises where women accounted for 64.7% of the workforce (Table 2.9). Of the more than 1 million female workers in the foreign-invested enterprise sector, a majority work in manufacturing as assemblers or machine operators.
Table 2.9: Distribution of employed population by economic sector and sex in 2012 Unit: Percentage
Economic sector Total Male Female % Female Total 100.0 100.0 100.0 48.5
Self-employed/household enterprise 77.6 76.7 78.4 49.0 Cooperative/collective 0.3 0.4 0.2 28.1 Private enterprise 8.5 9.7 7.2 41.0 State 10.4 10.9 9.8 46.0 Foreign invested enterprise 3.3 2.3 4.4 64.7
8. Composition of employed population by employment status Table 2.10 shows the composition of the employed population by employment status from 2009 to 2012. The share of wage workers increased by 1.3 percentage points since 2009, and accounted for about one-third of the working population. This positive trend reflects Vietnam’s labour market transition, but also underscores the existing deficit in job quality in Viet Nam compared to more developed countries. In terms of gender gaps, women accounted for a majority of
28
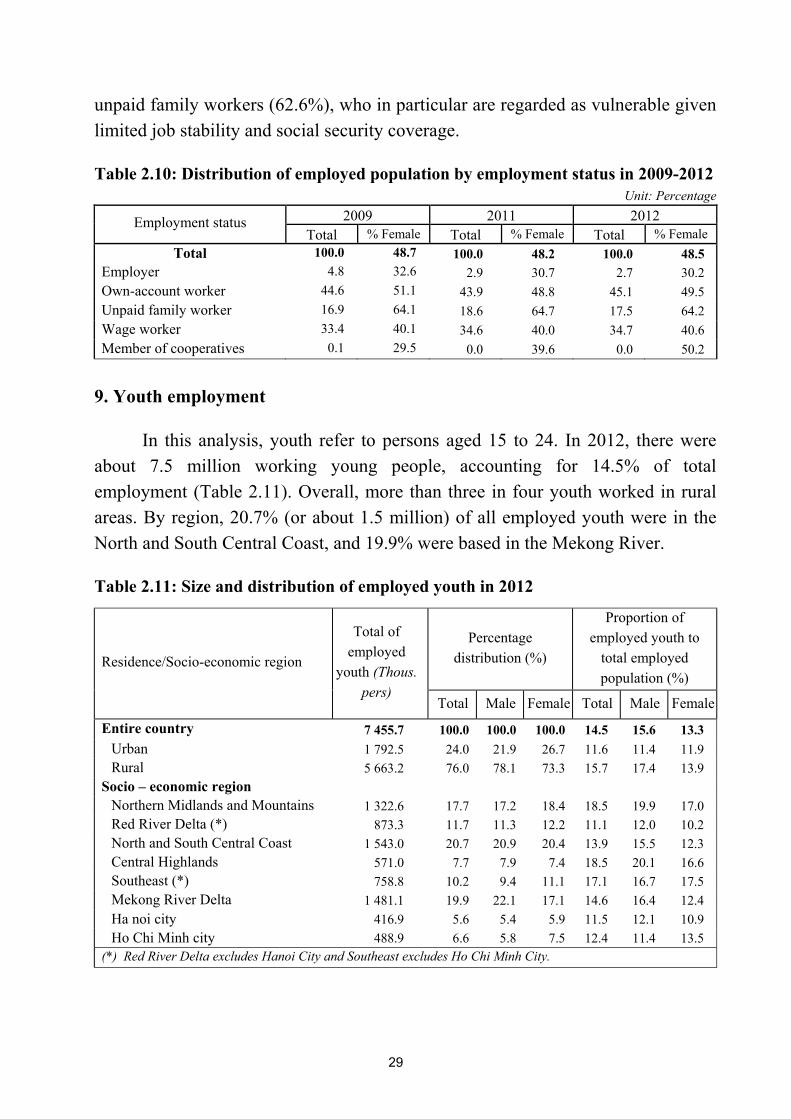
unpaid family workers (62.6%), who in particular are regarded as vulnerable given limited job stability and social security coverage.
Table 2.10: Distribution of employed population by employment status in 2009-2012 Unit: Percentage
2009 2011 2012 Employment status Total % Female Total % Female Total % Female
Total 100.0 48.7 100.0 48.2 100.0 48.5 Employer 4.8 32.6 2.9 30.7 2.7 30.2 Own-account worker 44.6 51.1 43.9 48.8 45.1 49.5 Unpaid family worker 16.9 64.1 18.6 64.7 17.5 64.2 Wage worker 33.4 40.1 34.6 40.0 34.7 40.6 Member of cooperatives 0.1 29.5 0.0 39.6 0.0 50.2
9. Youth employment
In this analysis, youth refer to persons aged 15 to 24. In 2012, there were about 7.5 million working young people, accounting for 14.5% of total employment (Table 2.11). Overall, more than three in four youth worked in rural areas. By region, 20.7% (or about 1.5 million) of all employed youth were in the North and South Central Coast, and 19.9% were based in the Mekong River.
Table 2.11: Size and distribution of employed youth in 2012
Percentage distribution (%)
Proportion of employed youth to
total employed population (%)
Residence/Socio-economic region
Total of employed
youth (Thous. pers)
Total Male Female Total Male Female
Entire country 7 455.7 100.0 100.0 100.0 14.5 15.6 13.3 Urban 1 792.5 24.0 21.9 26.7 11.6 11.4 11.9 Rural 5 663.2 76.0 78.1 73.3 15.7 17.4 13.9
Socio – economic region Northern Midlands and Mountains 1 322.6 17.7 17.2 18.4 18.5 19.9 17.0 Red River Delta (*) 873.3 11.7 11.3 12.2 11.1 12.0 10.2 North and South Central Coast 1 543.0 20.7 20.9 20.4 13.9 15.5 12.3 Central Highlands 571.0 7.7 7.9 7.4 18.5 20.1 16.6 Southeast (*) 758.8 10.2 9.4 11.1 17.1 16.7 17.5 Mekong River Delta 1 481.1 19.9 22.1 17.1 14.6 16.4 12.4 Ha noi city 416.9 5.6 5.4 5.9 11.5 12.1 10.9 Ho Chi Minh city 488.9 6.6 5.8 7.5 12.4 11.4 13.5
(*) Red River Delta excludes Hanoi City and Southeast excludes Ho Chi Minh City.
29
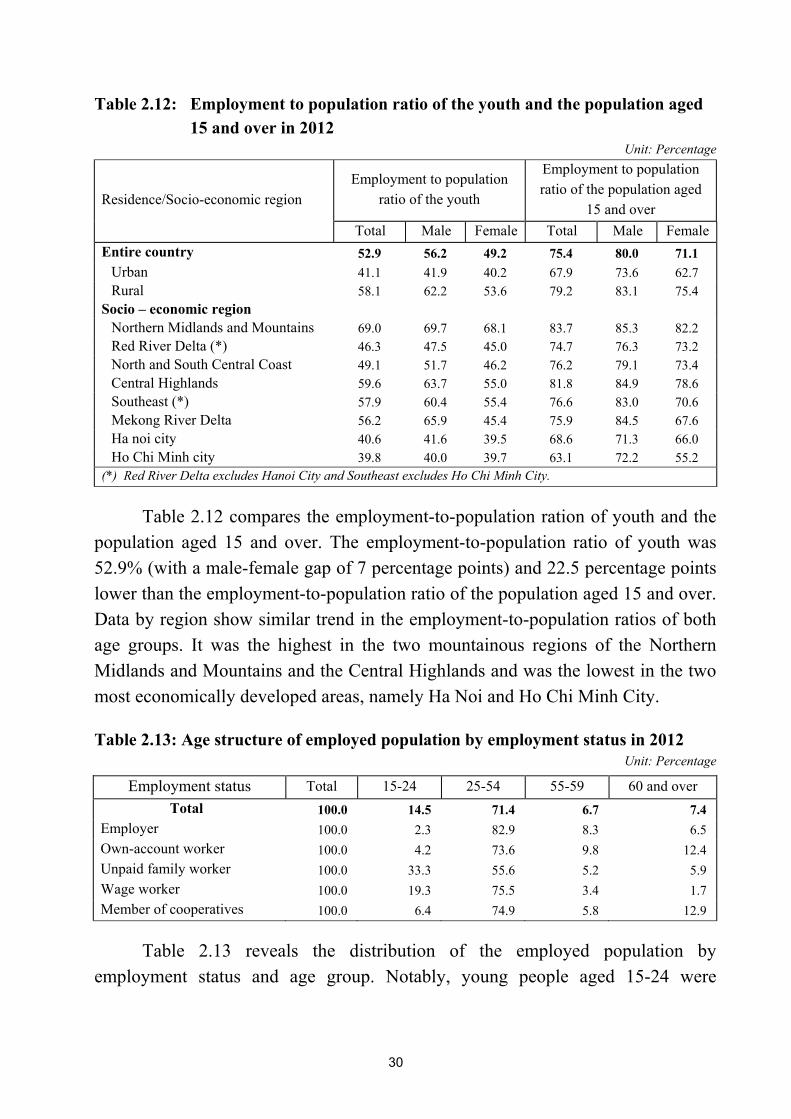
Table 2.12: Employment to population ratio of the youth and the population aged 15 and over in 2012
Unit: Percentage
Employment to population ratio of the youth
Employment to population ratio of the population aged
15 and over Residence/Socio-economic region
Total Male Female Total Male FemaleEntire country 52.9 56.2 49.2 75.4 80.0 71.1
Urban 41.1 41.9 40.2 67.9 73.6 62.7 Rural 58.1 62.2 53.6 79.2 83.1 75.4
Socio – economic region Northern Midlands and Mountains 69.0 69.7 68.1 83.7 85.3 82.2 Red River Delta (*) 46.3 47.5 45.0 74.7 76.3 73.2 North and South Central Coast 49.1 51.7 46.2 76.2 79.1 73.4 Central Highlands 59.6 63.7 55.0 81.8 84.9 78.6 Southeast (*) 57.9 60.4 55.4 76.6 83.0 70.6 Mekong River Delta 56.2 65.9 45.4 75.9 84.5 67.6 Ha noi city 40.6 41.6 39.5 68.6 71.3 66.0 Ho Chi Minh city 39.8 40.0 39.7 63.1 72.2 55.2
(*) Red River Delta excludes Hanoi City and Southeast excludes Ho Chi Minh City.
Table 2.12 compares the employment-to-population ration of youth and the population aged 15 and over. The employment-to-population ratio of youth was 52.9% (with a male-female gap of 7 percentage points) and 22.5 percentage points lower than the employment-to-population ratio of the population aged 15 and over. Data by region show similar trend in the employment-to-population ratios of both age groups. It was the highest in the two mountainous regions of the Northern Midlands and Mountains and the Central Highlands and was the lowest in the two most economically developed areas, namely Ha Noi and Ho Chi Minh City.
Table 2.13: Age structure of employed population by employment status in 2012 Unit: Percentage
Employment status Total 15-24 25-54 55-59 60 and over Total 100.0 14.5 71.4 6.7 7.4
Employer 100.0 2.3 82.9 8.3 6.5 Own-account worker 100.0 4.2 73.6 9.8 12.4 Unpaid family worker 100.0 33.3 55.6 5.2 5.9 Wage worker 100.0 19.3 75.5 3.4 1.7 Member of cooperatives 100.0 6.4 74.9 5.8 12.9
Table 2.13 reveals the distribution of the employed population by employment status and age group. Notably, young people aged 15-24 were
30

disproportionately employed as unpaid family workers (33.3%) but held limited jobs as employers or own-account workers. III. WORKING CONDITIONS AND JOB QUALITY 1. Own-account and unpaid family workers Own-account and unpaid family workers constitute two categories of highly vulnerable workers given limited job stability and social insurance coverage. In Vietnam, they accounted for 62.6% (32.1 million) of the employed population, nearly double the share of wage workers (Table 3.1). Notably, the percentage of own-account and unpaid family workers was considerably higher for women than men by 12.8 percentage points. In addition, own-account and unpaid family workers accounted for a staggering four in five rural workers but only one in five urban workers. Table 3.1: Size and distribution of own-account worker and unpaid family worker
Percentage distribution (%)
Proportion of own-account workers and
unpaid family workers to total employed population (%)
Residence/Socio-economic region
Number of own-account workers and
unpaid family worker (Thous.
pers) Total Male Female Total Male Female
Entire country 32 130 100.0 100.0 100.0 62.6 56.3 69.1 Urban 6 585 20.5 19.8 21.1 42.7 37.0 48.8 Rural 25 544 79.5 80.2 78.9 70.9 64.5 77.7
Socio – economic region Northern Midlands and Mountains 5 656 17.6 17.8 17.4 79.0 74.3 83.6 Red River Delta (*) 4 802 14.9 13.5 16.2 60.8 51.6 69.8 North and South Central Coast 7 480 23.3 22.1 24.3 67.5 58.9 76.1 Central Highlands 2 383 7.4 8.1 6.9 77.0 74.4 79.8 Southeast (*) 2 071 6.4 6.8 6.1 46.6 43.6 49.9 Mekong River Delta 6 623 20.6 22.5 18.9 65.2 60.4 71.0 Ha Noi city 1 807 5.6 5.1 6.1 49.8 41.5 58.2 Ho Chi Minh city 1 308 4.1 4.1 4.0 33.2 29.2 37.7
Age group 15-24 3 960 12.3 14.6 10.4 53.1 52.5 53.8 25-54 22 034 68.6 66.4 70.5 60.0 52.9 67.5 55-59 2 724 8.5 8.3 8.7 78.9 69.5 88.9 60 and over 3 412 10.6 10.8 10.5 89.4 85.5 93.2
(*) Red River Delta excludes Hanoi City and Southeast excludes Ho Chi Minh City.
31

2. Wage workers in the non-agricultural sector Wage employment in industry and services often indicates higher job quality. In Vietnam, the proportion of wage workers in the non-agricultural sector accounted for only 31% of total employment (Table 3.2). As expected, the proportion in urban areas was more than twice as high as in rural areas (50.6% compared to 22.5%). Likewise, wage employment outside of agriculture was six times more common for youth aged 15-24 (40.6%) than elder workers aged 60 and over (6.7%). By region, the proportion was the highest in Ho Chi Minh City (61.5%) but the lowest in the Central Highlands (14.8%). Furthermore, significantly more men than women were working in salaried jobs in the non-agricultural sector (58.8% versus 41.2%). Table 3.2: Size and distribution of wage workers in non-agricultural sector in 2012
Percentage distribution (%)
Distribution by sex (%)
Residence/Socio-economic region
Number of wage
workers in non-
agriculture (Thous. pers)
Proportion in the total employed population
(%) Total Male Female Male Female
Entire country 15 916 31.0 100.0 100.0 100.0 58.8 41.2 Urban 7 802 50.6 49.0 46.3 52.9 55.5 44.5 Rural 8 114 22.5 51.0 53.7 47.1 61.9 38.1
Socio – economic region Northern Midlands and Mountains 1 361 19.0 8.5 8.8 8.3 60.2 39.8 Red River Delta (*) 2 830 35.8 17.8 18.1 17.4 59.7 40.3 North and South Central Coast 2 863 25.8 18.0 18.9 16.7 61.6 38.4 Central Highlands 458 14.8 2.9 2.9 2.9 58.4 41.6 Southeast (*) 1 885 42.4 11.8 10.7 13.5 53.0 47.0 Mekong River Delta 2 436 24.0 15.3 16.1 14.1 62.0 38.0 Ha noi city 1 659 45.7 10.4 10.2 10.8 57.5 42.5 Ho Chi Minh city 2 424 61.5 15.2 14.4 16.4 55.8 44.2
Age group 15-24 3 026 40.6 19.0 17.4 21.3 53.8 46.2 25-54 12 113 33.0 76.1 76.3 75.8 58.9 41.1 55-59 523 15.2 3.3 4.4 1.7 78.9 21.1 60 and over 254 6.7 1.6 1.9 1.2 70.2 29.8
(*) Red River Delta excludes Hanoi City and Southeast excludes Ho Chi Minh City.
32

3. Average monthly earning of wage workers Given data limitations on earnings of non-wage workers, this report presents salaries/wages of wage workers only.
Table 3.3 reflects the quarter-on-quarter change in average monthly earnings
in 2012. There was a significant decrease in the average monthly earnings between quarter 1 and quarter 2, and this sharp fluctuation was consistent for both men and women and in both urban and rural areas. This can be explained by the Traditional New Year Holiday in quarter 1 when employees often receive holiday bonuses that supplement their regular earnings. This trend can be seen clearly in the quarter 1 to quarter 2 fluctuation of average monthly wages by socio-economic region, where the largest change was in Ho Chi Minh City, the Southeast and Ha Noi city. Table 3.3: Change in average monthly earning of wage workers by quarter in 2012
Unit: Thousand VND
Residence/Socio-economic region Q1 to Q2 change
Q2 to Q3 change
Q3 to Q4 change
Entire country -332 193 39 Male -309 160 28 Female -373 239 54 Urban -592 190 68 Rural -121 184 37
Socio-economic region Northern Midlands and Mountains 46 346 -9 Red River Delta (*) -164 149 10 North and South Central Coast -131 211 80 Central Highlands 284 233 32 Southeast (*) -696 331 134 Mekong River Delta -35 229 42 Ha noi city -647 184 -32 Ho Chi Minh city -1 018 -49 17
(*) Red River Delta excludes Hanoi City and Southeast excludes Ho Chi Minh City.
Table 3.4 displays the difference in average monthly earnings of wage-
workers by sex and highest technical qualification attained. A comparison of earnings between men and women reveal an overall gender pay gap of 10.4% and higher earnings for men in all technical qualification groups. Moreover, the earnings differential between wage workers with university or higher qualification and those with no technical qualification was nearly two-fold.
33
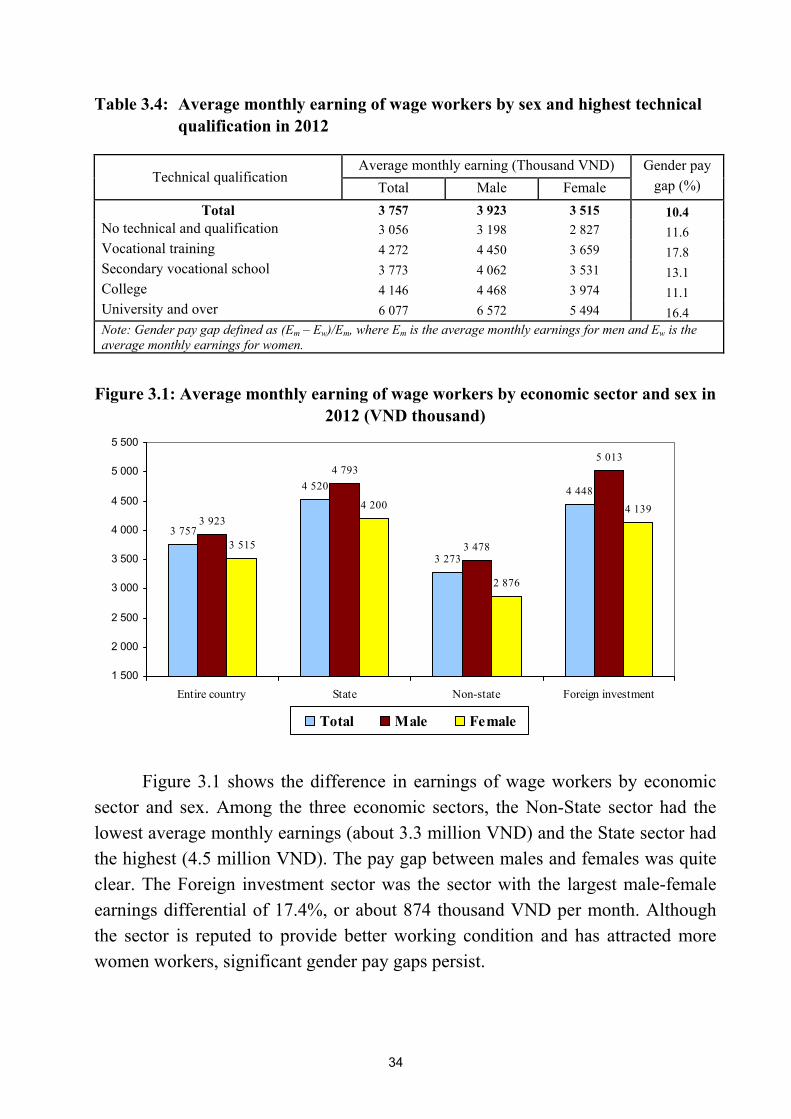
Table 3.4: Average monthly earning of wage workers by sex and highest technical qualification in 2012
Average monthly earning (Thousand VND)
Technical qualification Total Male Female
Gender pay gap (%)
Total 3 757 3 923 3 515 10.4 No technical and qualification 3 056 3 198 2 827 11.6 Vocational training 4 272 4 450 3 659 17.8 Secondary vocational school 3 773 4 062 3 531 13.1 College 4 146 4 468 3 974 11.1 University and over 6 077 6 572 5 494 16.4 Note: Gender pay gap defined as (Em – Ew)/Em, where Em is the average monthly earnings for men and Ew is the average monthly earnings for women.
Figure 3.1: Average monthly earning of wage workers by economic sector and sex in
2012 (VND thousand)
3 757
4 520
3 273
4 448
3 923
4 793
3 478
5 013
3 515
4 200
2 876
4 139
1 500
2 000
2 500
3 000
3 500
4 000
4 500
5 000
5 500
Entire country State Non-state Foreign investment
Total Male Female
Figure 3.1 shows the difference in earnings of wage workers by economic sector and sex. Among the three economic sectors, the Non-State sector had the lowest average monthly earnings (about 3.3 million VND) and the State sector had the highest (4.5 million VND). The pay gap between males and females was quite clear. The Foreign investment sector was the sector with the largest male-female earnings differential of 17.4%, or about 874 thousand VND per month. Although the sector is reputed to provide better working condition and has attracted more women workers, significant gender pay gaps persist.
34

Table 3.5: Average monthly earnings of wage workers by sex and industry in 2012 Unit: Thousand VND
Average monthly earnings Industry
Total Male Female
Total 3 757 3 923 3 515 A. Agriculture, forestry and fishery 2 543 2 759 2 154 B. Mining and quarrying 5 643 5 783 5 064 C. Manufacturing 3 636 4 001 3 325 D. Production and distribution of electricity, gas, steam and hot water and air-conditioners 5 253 5 345 4 733
E. Distribution of water, management and processing activities of sewage and waste 3 769 4 239 3 037
F. Construction 3 369 3 403 3 067 G. Wholesale and retail trade, repair of cars, motorcycles and other motor vehicles 3 774 3 928 3 521
H. Transport and storage 4 660 4 694 4 443 I. Hotels and restaurants 3 248 3 845 2 880 J. Information and communication 5 880 6 014 5 643 K. Financial intermediation, banking and insurance 6 855 6 823 6 880 L. Real estate activities 6 973 7 549 5 869 M. Technological, scientific and specialized activities 5 814 5 953 5 575 N. Administrative activities and supporting services 4 765 4 564 5 138 O. Activities of communist party, social-political organizations, governmental management, national defense security; compulsory social security
3 872 3 978 3 569
P. Training and education 4 260 4 681 4 083 Q. Health and social work 4 422 5 121 4 060 R. Recreational cultural and sporting activities 3 852 4 080 3 583 S. Other service activities 2 795 2 946 2 628 T. Activities of domestic hired laborers in households which producing products and services consuming by themselves 2 298 2 275 2 299
U. Extra territorial organizations and bodies (*) 8 131 8 151 8 122
Note: (*) This sector accounted for a very small share of the survey sample, and hence the statistical reliability is low.
By industry, the lowest average monthly earnings were observed for the category of hired domestic help (about 2.2 million VND) and the highest for extra territorial organizations and bodies (about 8.1 million VND) (Table 3.5). Other industries where the level of monthly earnings exceeded 6 million VND include financial intermediation, banking and insurance (6.9 million VND) and real estate activities (7.0 million VND).
35

Table 3.6 reflects the earnings differential of wage workers by occupation and sex. Wage workers in each occupation group earned more than 3.1 million VND per month with the exception of elementary occupations where average monthly earnings were less than 2.5 million VND. By contrast, professionals and leaders, managers and administrators of branches, level and organizations earned around 5.8 million VND and 6.1 million VND each month, respectively. Table 3.6: Average monthly earning of wage workers by sex and occupation groups
in 2012 Unit: Thousand VND
Average monthly earning Occupation Total Male Female
Total 3 757 3 923 3 515 1. Leaders, managers and administrators of branches, levels and organizations 6 055 6 021 6 160
2. Professionals 5 799 6 373 5 260 3. Technicians and associate professionals 3 999 4 366 3 731 4. Clerks 3 353 3 208 3 548 5. Service workers and market sales workers 3 194 3 395 2 929 6. Skilled agricultural, forestry and fishery workers 3 894 3 846 4 023
7. Craft and related workers 3 308 3 472 2 776 8. Plant, machine operator and assemblers 3 984 4 366 3 551 9. Elementary occupations 2 464 2 639 2 197
4. Average weekly hours worked Table 3.7 indicates the distribution of workers by hours worked per week by sex, urban/rural areas and region. More than one third worked between 40 to 48 hours per week (38.4%), and an alarming 37.4% worked more than 48 hours per week. On the other hand, the share of workers employed for less than 20 hours per week was extremely low (3.4%). By sex, a higher share of men (39.5%) worked in excess of 48 hours per week compared to women (35.5%). The proportion of working less than 35 hours per week was 15.1%, but varied significantly between urban (10.9%) and rural (16.9%) areas and between men (13.4%) and women (17.1%). Among the eight socio-economic regions, the share of workers working less than 35 hours per week was the lowest in Ho Chi Minh City (6.5%) and the highest in the Mekong River Delta (22.4%).
36
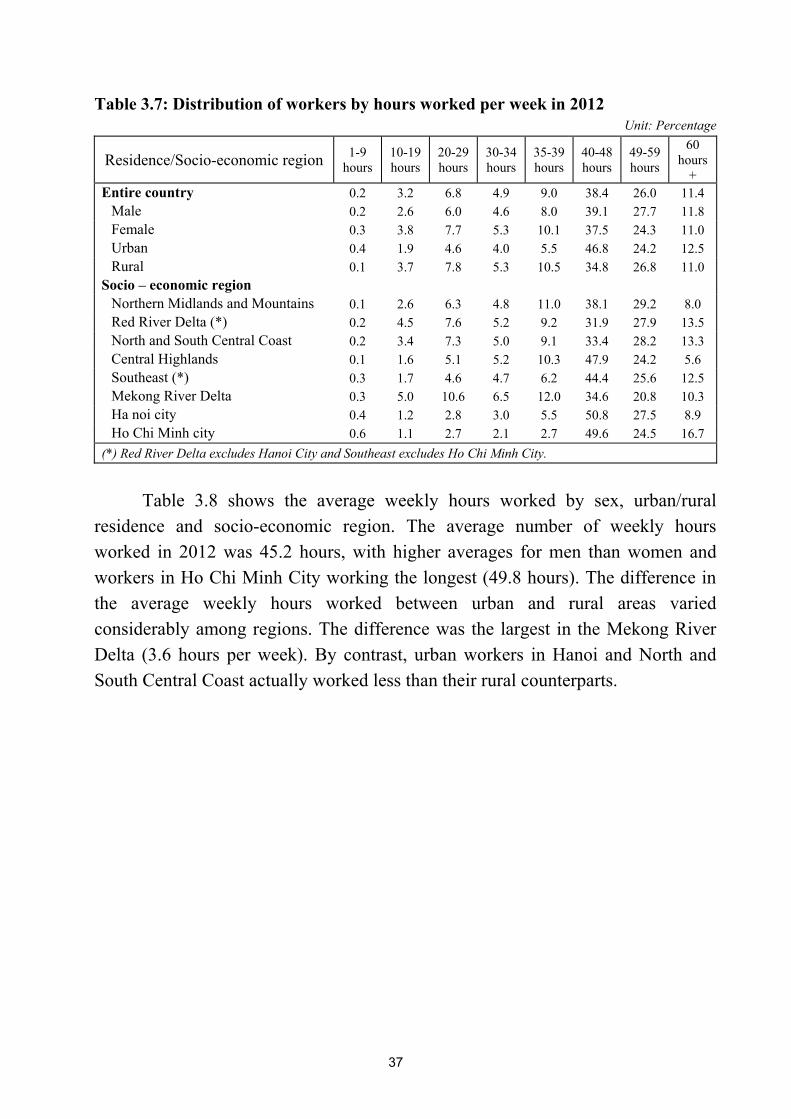
Table 3.7: Distribution of workers by hours worked per week in 2012 Unit: Percentage
Residence/Socio-economic region 1-9 hours
10-19 hours
20-29 hours
30-34 hours
35-39 hours
40-48 hours
49-59 hours
60 hours
+ Entire country 0.2 3.2 6.8 4.9 9.0 38.4 26.0 11.4
Male 0.2 2.6 6.0 4.6 8.0 39.1 27.7 11.8 Female 0.3 3.8 7.7 5.3 10.1 37.5 24.3 11.0 Urban 0.4 1.9 4.6 4.0 5.5 46.8 24.2 12.5 Rural 0.1 3.7 7.8 5.3 10.5 34.8 26.8 11.0
Socio – economic region Northern Midlands and Mountains 0.1 2.6 6.3 4.8 11.0 38.1 29.2 8.0 Red River Delta (*) 0.2 4.5 7.6 5.2 9.2 31.9 27.9 13.5 North and South Central Coast 0.2 3.4 7.3 5.0 9.1 33.4 28.2 13.3 Central Highlands 0.1 1.6 5.1 5.2 10.3 47.9 24.2 5.6 Southeast (*) 0.3 1.7 4.6 4.7 6.2 44.4 25.6 12.5 Mekong River Delta 0.3 5.0 10.6 6.5 12.0 34.6 20.8 10.3 Ha noi city 0.4 1.2 2.8 3.0 5.5 50.8 27.5 8.9 Ho Chi Minh city 0.6 1.1 2.7 2.1 2.7 49.6 24.5 16.7
(*) Red River Delta excludes Hanoi City and Southeast excludes Ho Chi Minh City.
Table 3.8 shows the average weekly hours worked by sex, urban/rural residence and socio-economic region. The average number of weekly hours worked in 2012 was 45.2 hours, with higher averages for men than women and workers in Ho Chi Minh City working the longest (49.8 hours). The difference in the average weekly hours worked between urban and rural areas varied considerably among regions. The difference was the largest in the Mekong River Delta (3.6 hours per week). By contrast, urban workers in Hanoi and North and South Central Coast actually worked less than their rural counterparts.
37

Table 3.8: Average weekly hours worked in 2012 Unit: Hour
Average weekly hours worked Sex/Region
Total Urban Rural Difference between
urban and rural Entire country 45.2 46.7 44.5 2.2
Male 46.0 47.2 45.5 1.7 Female 44.3 46.1 43.5 2.6
Socio – economic region Northern Midlands and Mountains 44.5 44.6 44.4 0.2 Red River Delta (*) 45.1 46.5 44.7 1.8 North and South Central Coast 45.6 45.0 45.8 -0.8 Central Highlands 44.2 45.1 43.8 1.3 Southeast (*) 46.6 48.3 45.5 2.9 Mekong River Delta 42.6 45.3 41.8 3.6 Ha noi city 46.6 45.7 47.2 -1.6 Ho Chi Minh city 49.8 50.0 49.0 1.1
(*) Red River Delta excludes Hanoi City and Southeast excludes Ho Chi Minh City.
5. Type of contract If employers and own-account workers are assumed to have definite-term labour contracts, then nearly one-fifth of all workers in Vietnam still were employed without a labour contract (Table 3.9). The share of workers without labour contracts was higher for women (23.5%) than men (16%) and higher in rural areas (22.4%) than in urban areas (13.4%). Notably, when comparing different age groups, the percentage working without a contract was the highest among youth aged 15-24 (42.2%). Workers in the Northern Midlands and Mountains were the most likely to work without a labour contract (28.1%) and least likely in Ho Chi Minh City (12%). Among workers holding a definite-term labour contract, the share was nearly the same for both men and women (approximately 69%), but was higher in urban areas (76%) than in rural areas (66.2%). By age group, the rate was the lowest for youth (39.6%) and the highest for the elderly aged 60 and over (83%).
38

Table 3.9: Size and distribution of employed population by contract type in 2012
Percentage distribution (%)
Residence/Socio-economic region Definite-term labour
contract
Verbal agreement
No contractNot
stated
Entire country 69.2 10.9 19.7 0.3 Male 69.0 14.7 16.0 0.3 Female 69.3 6.8 23.5 0.3 Urban 76.0 10.4 13.4 0.2 Rural 66.2 11.1 22.4 0.3
Socio – economic region Northern Midlands and Mountains 66.4 5.4 28.1 0.2 Red River Delta (*) 75.2 9.4 15.1 0.3 North and South Central Coast 67.0 11.7 20.9 0.4 Central Highlands 67.9 7.8 24.2 0.1 Southeast (*) 69.1 13.6 17.0 0.2 Mekong River Delta 64.9 16.1 18.8 0.3 Ha noi city 72.4 8.0 19.1 0.6 Ho Chi Minh city 77.4 10.5 12.0 0.1
Age group 15-24 39.6 17.5 42.2 0.7 25-54 72.6 10.8 16.4 0.2 55-59 79.5 6.2 14.2 0.1 60 and over 83.0 3.2 13.4 0.4
(*) Red River Delta excludes Hanoi City and Southeast excludes Ho Chi Minh City.
IV. UNEMPLOYMENT AND UNDEREMPLOYMENT
Data and analysis on unemployment can help to assess the extent of underutilization in the labour market. In developing countries, where levels of unemployment and social security coverage are often low, underemployment indicators can help provide further insights. The data below on unemployment and underemployment cover the population aged 15 and above, the population in the statutory working age (namely men 15-59 years and women aged 15-54 years) and youth aged 15-24. 1. Some characteristics of the unemployed population
Nationally, there were 925.6 thousand unemployed persons aged 15 and above, a year-on-year decrease of 119.7 thousand (11.5%). Urban areas accounted
39

for 51.2% and women accounted for 54.7% of total unemployment (Table 4.1). Young people aged 15-24 disproportionately made up 46.7% of the unemployed, but represented only 20.7% of the entire population aged 15 years and older.
Table 4.1: Size and age structure of the unemployed population aged 15 and above
in 2012
Distribution (%) Age group
Unemployed persons
(Thous. persons) Total Male Female % Female
Total 925.6 100.0 100.0 100.0 54.7 15-24 432.1 46.7 47.2 46.2 54.2 25-54 452.5 48.9 44.0 52.9 59.2 55-59 37.0 4.0 8.3 0.4 6.0 60 and over 4.0 0.4 0.5 0.4 50.7
Urban 473.7 100.0 100.0 100.0 52.7 15-24 180.9 38.2 39.6 36.9 50.9 25-54 268.4 56.7 50.3 62.3 58.0 55-59 22.7 4.8 9.5 0.5 6.0 60 and over 1.7 0.4 0.5 0.2 34.2
Rural 451.9 100.0 100.0 100.0 56.8 15-24 251.1 55.6 56.0 55.3 56.5 25-54 184.1 40.7 36.7 43.8 61.1 55-59 14.3 3.2 6.9 0.3 6.0 60 and over 2.3 0.5 0.4 0.6 62.6
The unemployed population of Vietnam was relatively well-educated, as
those with no schooling accounted for only 2.6% of the unemployed and the share with technical qualification (vocational training and above) represented 29.1% (Table 4.2). With a few exceptions such as at the vocational training level, there were minor differences in the distribution of unemployment by educational attainment for men as compared to women. The last column of Table 4.2 presents the proportion of women in the total unemployed population at each education attainment level. Besides the upper secondary and vocational training categories, where women accounted respectively for 49% and 25.9% of the unemployed, women represented a majority of the unemployed at each education level.
40
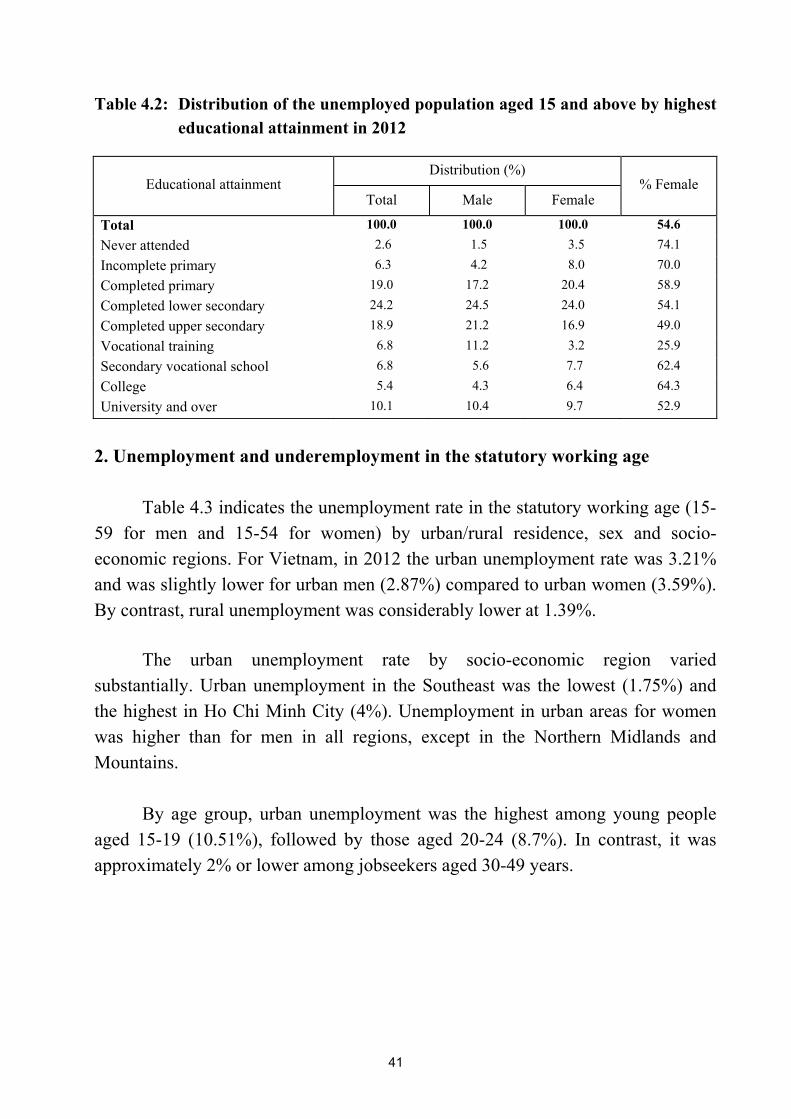
Table 4.2: Distribution of the unemployed population aged 15 and above by highest educational attainment in 2012
Distribution (%) Educational attainment
Total Male Female % Female
Total 100.0 100.0 100.0 54.6 Never attended 2.6 1.5 3.5 74.1 Incomplete primary 6.3 4.2 8.0 70.0 Completed primary 19.0 17.2 20.4 58.9 Completed lower secondary 24.2 24.5 24.0 54.1 Completed upper secondary 18.9 21.2 16.9 49.0 Vocational training 6.8 11.2 3.2 25.9 Secondary vocational school 6.8 5.6 7.7 62.4 College 5.4 4.3 6.4 64.3 University and over 10.1 10.4 9.7 52.9
2. Unemployment and underemployment in the statutory working age
Table 4.3 indicates the unemployment rate in the statutory working age (15-
59 for men and 15-54 for women) by urban/rural residence, sex and socio-economic regions. For Vietnam, in 2012 the urban unemployment rate was 3.21% and was slightly lower for urban men (2.87%) compared to urban women (3.59%). By contrast, rural unemployment was considerably lower at 1.39%. The urban unemployment rate by socio-economic region varied substantially. Urban unemployment in the Southeast was the lowest (1.75%) and the highest in Ho Chi Minh City (4%). Unemployment in urban areas for women was higher than for men in all regions, except in the Northern Midlands and Mountains. By age group, urban unemployment was the highest among young people aged 15-19 (10.51%), followed by those aged 20-24 (8.7%). In contrast, it was approximately 2% or lower among jobseekers aged 30-49 years.
41
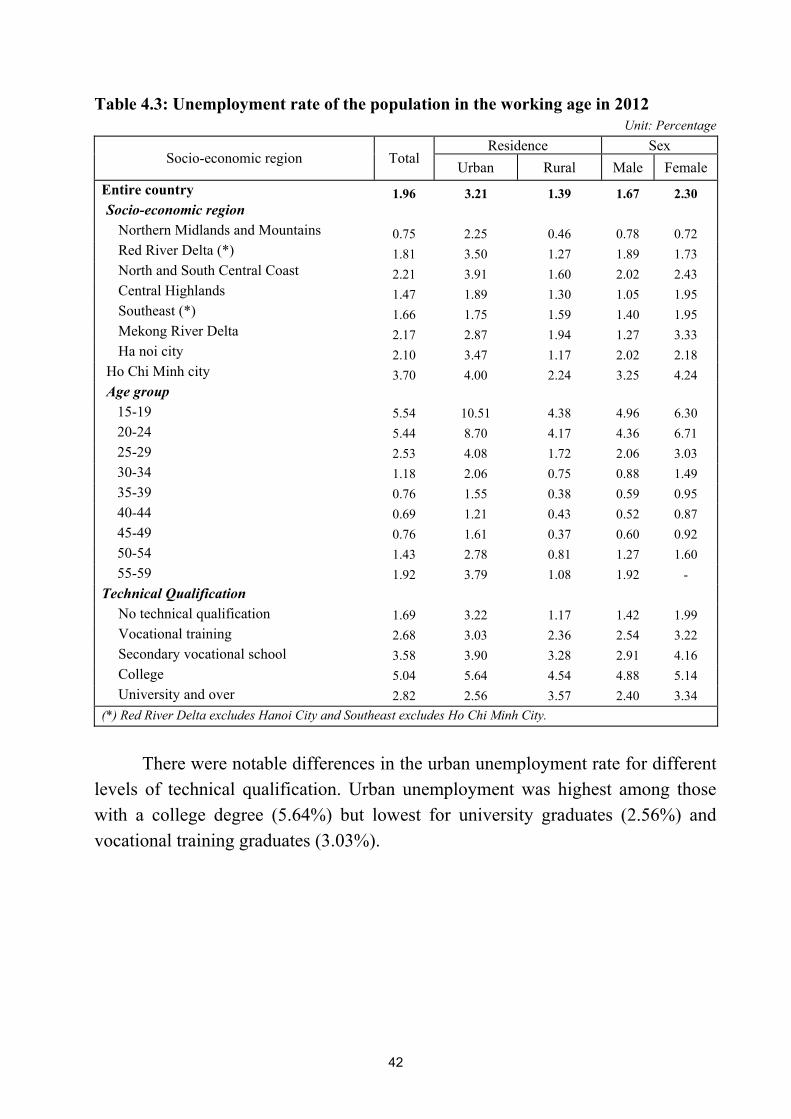
Table 4.3: Unemployment rate of the population in the working age in 2012 Unit: Percentage
Residence Sex Socio-economic region Total Urban Rural Male Female
Entire country 1.96 3.21 1.39 1.67 2.30 Socio-economic region
Northern Midlands and Mountains 0.75 2.25 0.46 0.78 0.72 Red River Delta (*) 1.81 3.50 1.27 1.89 1.73 North and South Central Coast 2.21 3.91 1.60 2.02 2.43 Central Highlands 1.47 1.89 1.30 1.05 1.95 Southeast (*) 1.66 1.75 1.59 1.40 1.95 Mekong River Delta 2.17 2.87 1.94 1.27 3.33 Ha noi city 2.10 3.47 1.17 2.02 2.18
Ho Chi Minh city 3.70 4.00 2.24 3.25 4.24 Age group
15-19 5.54 10.51 4.38 4.96 6.30 20-24 5.44 8.70 4.17 4.36 6.71 25-29 2.53 4.08 1.72 2.06 3.03 30-34 1.18 2.06 0.75 0.88 1.49 35-39 0.76 1.55 0.38 0.59 0.95 40-44 0.69 1.21 0.43 0.52 0.87 45-49 0.76 1.61 0.37 0.60 0.92 50-54 1.43 2.78 0.81 1.27 1.60 55-59 1.92 3.79 1.08 1.92 -
Technical Qualification No technical qualification 1.69 3.22 1.17 1.42 1.99 Vocational training 2.68 3.03 2.36 2.54 3.22 Secondary vocational school 3.58 3.90 3.28 2.91 4.16 College 5.04 5.64 4.54 4.88 5.14 University and over 2.82 2.56 3.57 2.40 3.34
(*) Red River Delta excludes Hanoi City and Southeast excludes Ho Chi Minh City.
There were notable differences in the urban unemployment rate for different
levels of technical qualification. Urban unemployment was highest among those with a college degree (5.64%) but lowest for university graduates (2.56%) and vocational training graduates (3.03%).
42

Table 4.4: Underemployment rate of the population in the statutory working age in 2012
Unit: Percentage Residence Sex
Socio-economic region Total Urban Rural Male Female Entire country 2.74 1.56 3.27 2.93 2.53 Northern Midlands and Mountains 1.96 1.30 2.09 2.15 1.76 Red River Delta (*) 3.30 1.65 3.81 3.34 3.25 North and South Central Coast 3.23 2.45 3.51 3.40 3.05 Central Highlands 2.82 2.66 2.89 3.12 2.48 Southeast (*) 1.40 0.82 1.77 1.58 1.18 Mekong River Delta 4.57 3.02 5.07 4.90 4.15 Ha noi city 0.88 0.39 1.20 0.90 0.86 Ho Chi Minh city 0.44 0.43 0.48 0.37 0.52
(*) Red River Delta excludes Hanoi City and Southeast excludes Ho Chi Minh City. In 2012, for every 1000 persons who were working in rural areas, 33 were under-employed (Table 4.4). The rural under-employment rate was more than two times higher than that in urban areas, with only minor male-female differences in rural unemployment rates across socio-economic regions. 3. Some characteristics of unemployed youth
Youth aged 15 to 24 accounted for 20.7% of the total population aged 15
and over in the entire country, but represented 432.1 thousand or 46.7% of the total unemployed population of the country. Table 4.5 shows the concentration of unemployed youth was the highest in the North and South Central Coast (122.2 thousand or 28.3% of all unemployed youth), followed by the Mekong River Delta (98.7 thousand or 22.9%).
43

Table 4.5: Size and distribution of unemployed youth by socio-economic region in 2012
Percentage distribution of
unemployed youth (%)
Proportion of unemployed youth out of total unemployed
population (%) Socio-economic region
Number of unemployed
youth (Thous. persons) Total Male Female Total Male Female
Entire country 432.1 100.0 100.0 100.0 46.7 47.2 46.2
Northern Midlands and Mountains 24.8 5.7 6.6 5.0 50.7 49.2 52.5
Red River Delta (*) 68.2 15.8 18.6 13.4 54.1 53.5 54.7
North and South Central Coast 122.2 28.3 30.6 26.3 55.1 57.0 53.3
Central Highlands 22.2 5.1 3.4 6.6 51.7 42.1 57.5
Southeast (*) 36.6 8.5 8.5 8.5 52.4 53.4 51.6
Mekong River Delta 98.7 22.9 16.3 28.4 49.0 48.8 49.1
Ha noi city 24.1 5.6 6.6 4.7 33.7 36.1 31.3
Ho Chi Minh city 35.3 8.2 9.5 7.1 24.6 27.6 22.0 (*) Red River Delta excludes Hanoi City and Southeast excludes Ho Chi Minh City
The youth unemployment rate was nearly five times higher than the adult
unemployment rate aged 25 and above in 2012 (Table 4.6). In general, unemployment rate was higher among female youth than male youth and similar by region, exceptions Red River Delta. In the two leading economic cities, namely Hanoi and Ho Chi Minh City had the difference trend.
Table 4.6: Comparison of the youth unemployment rate with the adult aged 25 and
above unemployment rate in 2012
Youth unemployment rate (%)
Adult aged 25 and above unemployment rate (%)
Socio-economic region
Number of unemployed
youth (Thous. persons)
Total Male Female Total Male Female
Entire country 432.1 5.48 4.58 6.57 1.11 0.98 1.25 Northern Midlands and Mountains 24.8 1.84 1.80 1.89 0.41 0.47 0.36 Red River Delta (*) 68.2 7.24 7.29 7.18 0.82 0.92 0.72 North and South Central Coast 122.2 7.34 6.55 8.32 1.03 0.96 1.11 Central Highlands 22.2 3.74 2.06 5.86 0.82 0.73 0.91 Southeast (*) 36.6 4.60 4.15 5.08 0.89 0.75 1.05 Mekong River Delta 98.7 6.25 3.42 10.47 1.17 0.72 1.68 Ha noi city 24.1 5.46 5.55 5.35 1.45 1.41 1.49 Ho Chi Minh city 35.3 6.73 7.24 6.23 3.03 2.58 3.56
(*) Red River Delta excludes Hanoi City and Southeast excludes Ho Chi Minh City.
44

Figure 4.1 shows the gender gap in the unemployment rate in urban areas by five-year age groups. In 2012, the male unemployment rate among youth aged 15-19 was higher than that of young women (11.6% versus 9.2%). However, the unemployment rate among women outpaced men in all other age groups.
Figure 4.1: Urban unemployment rate by sex and age group in 2012
0
2
4
6
8
10
12
14
15-19 20-24 25-29 30-34 35-39 40-44 45-49 50-54 55-59
Age group
Percentage
Male Female
4. Mode of job search of people looking for work In 2012, 53.2% of those seeking work searched via individual relationships with friends or relatives, followed by 35.6% through a job application (Table 4.7). Public employment services represented only a tiny share (4%). However, job applications were used most often for those with higher education and qualifications (secondary vocational school and above) while those without technical qualifications were most likely to resort to job searches via friends and relatives.
45

Table 4.7: Proportion of mode of job search of persons looking for work by technical qualification in 2012
Unit: Percentage Mode of job search
Technical qualification Total
Job application
Employm
ent services
Via friends or relatives
Placing advertisem
ent
Looking at advertisem
ent
Preparation for setting up a
business production
Others
Total 100.0 35.6 4.0 53.2 0.4 5.2 0.3 1.3 No technical qualification 100.0 23.9 3.6 66.2 0.3 4.1 0.4 1.6 Vocational training 100.0 30.8 5.4 57.9 0.7 3.9 0.3 1.1 Secondary vocational school 100.0 56.4 3.1 28.6 0.1 9.8 1.0 1.0 College 100.0 62.9 4.4 24.0 1.7 5.6 0.0 1.5 University and over 100.0 35.6 4.0 53.2 0.4 5.2 0.3 1.3
Table 4.8 indicates that the mode of job search for men was similar to that of women with a few exceptions. The proportion of job search via friends and relatives was the most common approach for both males and females (55.7% and 50.1%, respectively). The next most common method was job applications, and more for women (40.1%) than men (32%). By residence, there were only slight differences between urban and rural areas in terms of the various job search methods. Table 4.8: Proportion of mode of job search of people looking for a job by
residence and sex in 2012 Unit: Percentage
Residence Sex Mode of job search Total
Urban Rural Male Female
Entire country 100.0 100.0 100.0 100.0 100.0
Job application 35.6 36.0 35.1 32.0 40.1
Employment service 4.0 4.4 3.4 4.9 2.7
Via friends or relatives 53.2 52.6 53.8 55.7 50.1
Placing advertisement 0.4 0.8 0.1 0.4 0.5
Looking at advertisements of recruitment 5.2 4.9 5.4 5.4 4.9
Preparation for setting up a business production 0.3 0.3 0.3 0.4 0.3
Others 1.3 0.9 1.8 1.3 1.4
46
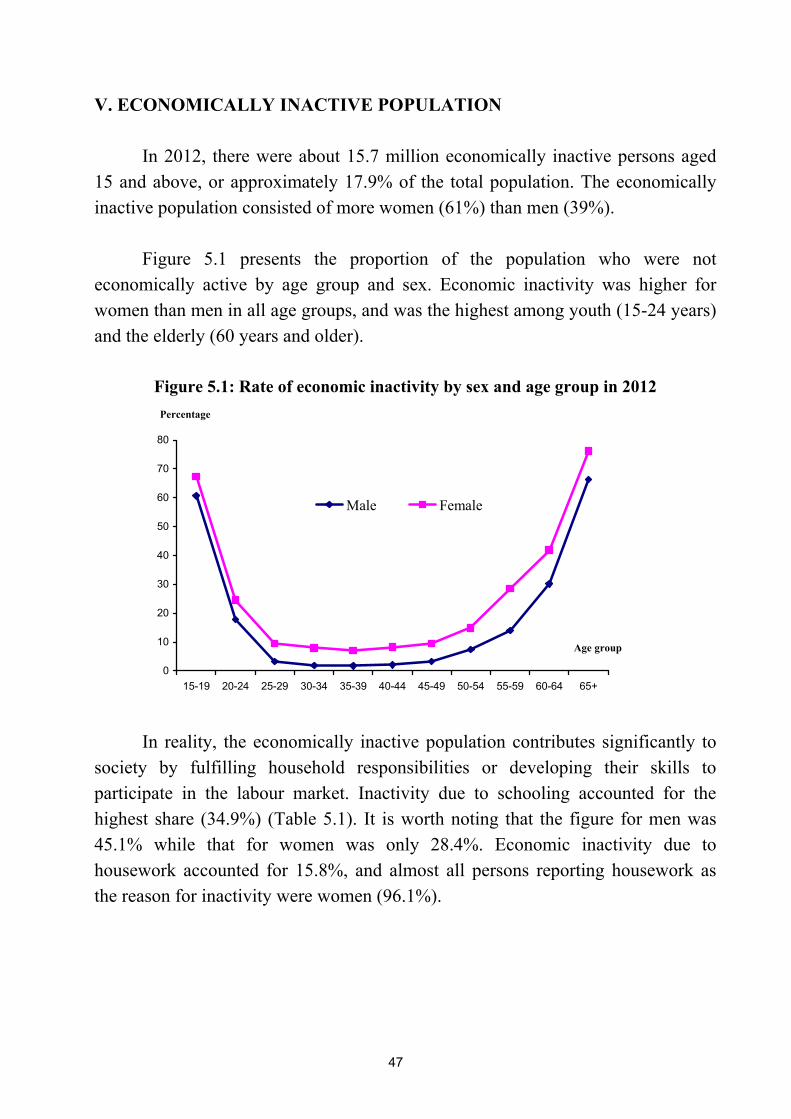
V. ECONOMICALLY INACTIVE POPULATION In 2012, there were about 15.7 million economically inactive persons aged 15 and above, or approximately 17.9% of the total population. The economically inactive population consisted of more women (61%) than men (39%).
Figure 5.1 presents the proportion of the population who were not economically active by age group and sex. Economic inactivity was higher for women than men in all age groups, and was the highest among youth (15-24 years) and the elderly (60 years and older).
Figure 5.1: Rate of economic inactivity by sex and age group in 2012
0
10
20
30
40
50
60
70
80
15-19 20-24 25-29 30-34 35-39 40-44 45-49 50-54 55-59 60-64 65+
Age group
Percentage
Male Female
In reality, the economically inactive population contributes significantly to
society by fulfilling household responsibilities or developing their skills to participate in the labour market. Inactivity due to schooling accounted for the highest share (34.9%) (Table 5.1). It is worth noting that the figure for men was 45.1% while that for women was only 28.4%. Economic inactivity due to housework accounted for 15.8%, and almost all persons reporting housework as the reason for inactivity were women (96.1%).
47
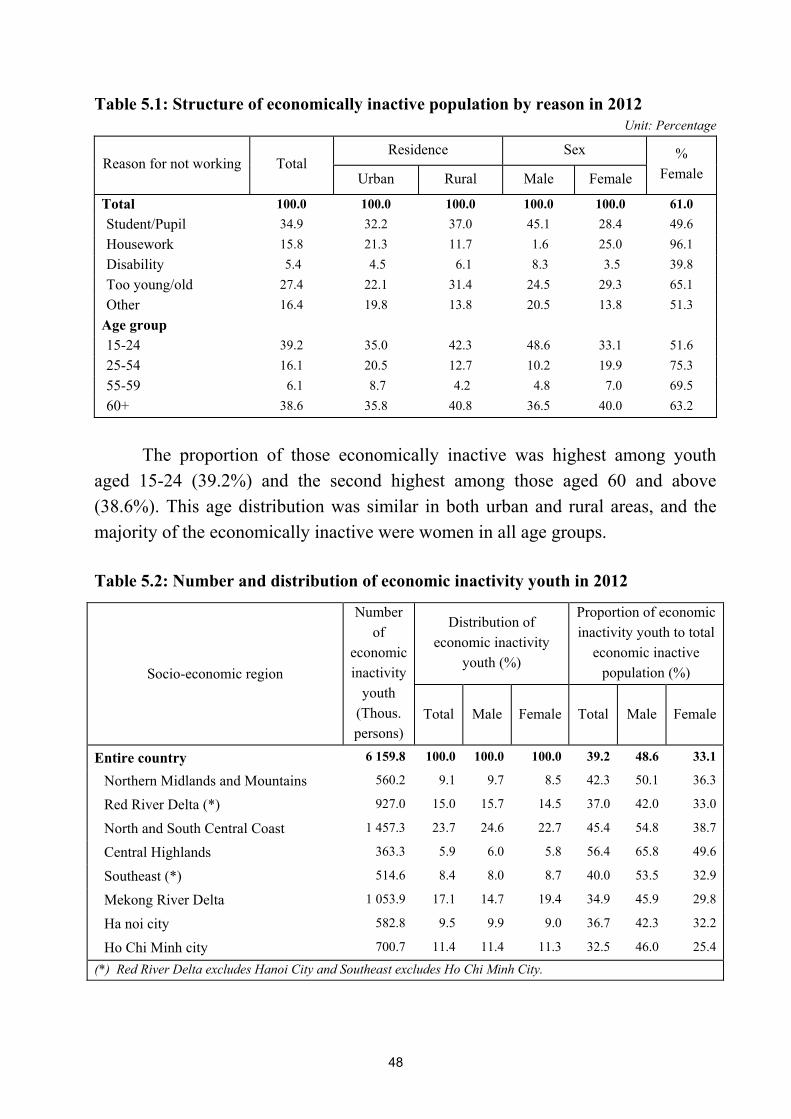
Table 5.1: Structure of economically inactive population by reason in 2012 Unit: Percentage
Residence Sex Reason for not working Total
Urban Rural Male Female
% Female
Total 100.0 100.0 100.0 100.0 100.0 61.0 Student/Pupil 34.9 32.2 37.0 45.1 28.4 49.6 Housework 15.8 21.3 11.7 1.6 25.0 96.1 Disability 5.4 4.5 6.1 8.3 3.5 39.8 Too young/old 27.4 22.1 31.4 24.5 29.3 65.1 Other 16.4 19.8 13.8 20.5 13.8 51.3
Age group 15-24 39.2 35.0 42.3 48.6 33.1 51.6 25-54 16.1 20.5 12.7 10.2 19.9 75.3 55-59 6.1 8.7 4.2 4.8 7.0 69.5 60+ 38.6 35.8 40.8 36.5 40.0 63.2
The proportion of those economically inactive was highest among youth
aged 15-24 (39.2%) and the second highest among those aged 60 and above (38.6%). This age distribution was similar in both urban and rural areas, and the majority of the economically inactive were women in all age groups. Table 5.2: Number and distribution of economic inactivity youth in 2012
Distribution of economic inactivity
youth (%)
Proportion of economic inactivity youth to total
economic inactive population (%) Socio-economic region
Number of
economic inactivity
youth (Thous. persons)
Total Male Female Total Male Female
Entire country 6 159.8 100.0 100.0 100.0 39.2 48.6 33.1
Northern Midlands and Mountains 560.2 9.1 9.7 8.5 42.3 50.1 36.3
Red River Delta (*) 927.0 15.0 15.7 14.5 37.0 42.0 33.0
North and South Central Coast 1 457.3 23.7 24.6 22.7 45.4 54.8 38.7
Central Highlands 363.3 5.9 6.0 5.8 56.4 65.8 49.6
Southeast (*) 514.6 8.4 8.0 8.7 40.0 53.5 32.9
Mekong River Delta 1 053.9 17.1 14.7 19.4 34.9 45.9 29.8
Ha noi city 582.8 9.5 9.9 9.0 36.7 42.3 32.2
Ho Chi Minh city 700.7 11.4 11.4 11.3 32.5 46.0 25.4
(*) Red River Delta excludes Hanoi City and Southeast excludes Ho Chi Minh City.
48
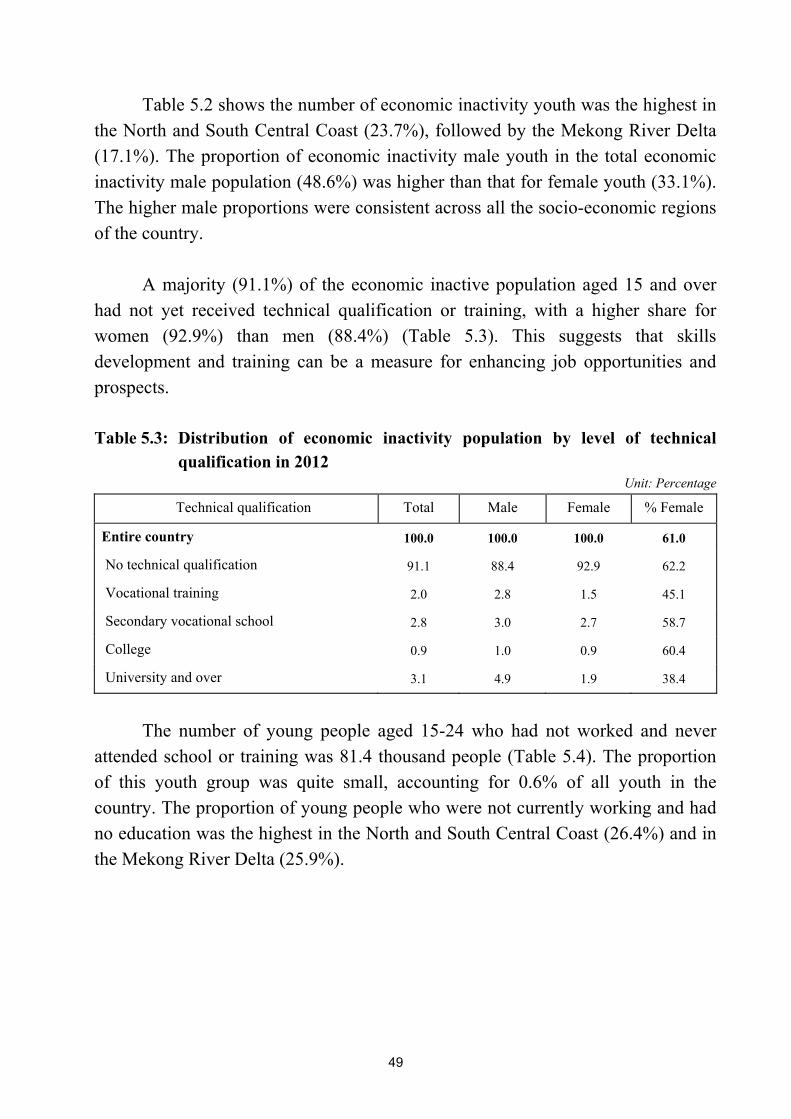
Table 5.2 shows the number of economic inactivity youth was the highest in the North and South Central Coast (23.7%), followed by the Mekong River Delta (17.1%). The proportion of economic inactivity male youth in the total economic inactivity male population (48.6%) was higher than that for female youth (33.1%). The higher male proportions were consistent across all the socio-economic regions of the country.
A majority (91.1%) of the economic inactive population aged 15 and over
had not yet received technical qualification or training, with a higher share for women (92.9%) than men (88.4%) (Table 5.3). This suggests that skills development and training can be a measure for enhancing job opportunities and prospects. Table 5.3: Distribution of economic inactivity population by level of technical
qualification in 2012 Unit: Percentage
Technical qualification Total Male Female % Female
Entire country 100.0 100.0 100.0 61.0
No technical qualification 91.1 88.4 92.9 62.2
Vocational training 2.0 2.8 1.5 45.1
Secondary vocational school 2.8 3.0 2.7 58.7
College 0.9 1.0 0.9 60.4
University and over 3.1 4.9 1.9 38.4
The number of young people aged 15-24 who had not worked and never
attended school or training was 81.4 thousand people (Table 5.4). The proportion of this youth group was quite small, accounting for 0.6% of all youth in the country. The proportion of young people who were not currently working and had no education was the highest in the North and South Central Coast (26.4%) and in the Mekong River Delta (25.9%).
49

Table 5.4: Number and distribution of youth who are not working and never attended school or have no technical qualification in 2012
Distribution of youth who are not working and never
attended school (%)
Proportion of youth who are not working and never
attended school to total youth (%)
Socio-economic region
Number of youth who are
not working
and never attended school
(Thousand persons)
Total Male Female Total Male Female
Entire country 81.4 100.0 100.0 100.0 0.6 0.6 0.6 Northern Midlands and Mountains 7.0 8.7 8.4 9.0 0.4 0.3 0.4 Red River Delta (*) 8.2 10.1 11.0 9.1 0.4 0.5 0.4 North and South Central Coast 21.5 26.4 24.1 28.7 0.7 0.6 0.8 Central Highlands 6.4 7.9 9.2 6.6 0.7 0.7 0.6 Southeast (*) 8.6 10.6 6.8 14.5 0.7 0.4 0.9 Mekong River Delta 21.1 25.9 25.2 26.6 0.8 0.8 0.9 Ha noi city 6.2 7.7 11.4 3.8 0.6 0.9 0.3 Ho Chi Minh city 2.3 2.9 4.0 1.7 0.2 0.3 0.1
(*) Red River Delta excludes Hanoi City and Southeast excludes Ho Chi Minh City.
VI. LABOUR MIGRANTS Migration is a change in the residency of an individual from one territorial unit to another during a given time period. Migration affects socio-economic development and therefore should be a priority for policy-makers and all of society.
In this analysis, migrants included persons aged 15 and over who moved from one commune, ward or town to another within a period of 12 months preceding the survey. These are therefore mostly internal migrants. 1. Profile of migrants (internal migrants) There were 892.3 thousand internal migrants, of which three-fifths were women (60,1%) and the majority (54.7%) re-located to urban areas (Table 6.1). By region, the highest number of migrants were concentrated in Ho Chi Minh City,
50
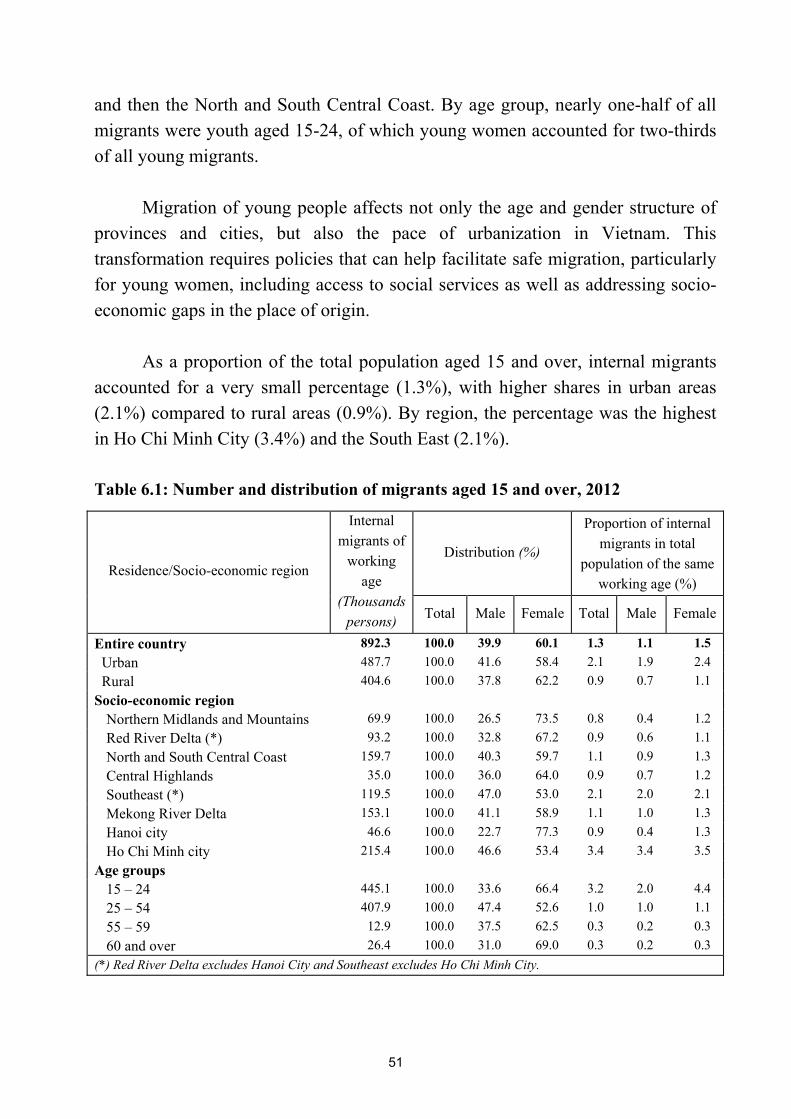
and then the North and South Central Coast. By age group, nearly one-half of all migrants were youth aged 15-24, of which young women accounted for two-thirds of all young migrants.
Migration of young people affects not only the age and gender structure of provinces and cities, but also the pace of urbanization in Vietnam. This transformation requires policies that can help facilitate safe migration, particularly for young women, including access to social services as well as addressing socio-economic gaps in the place of origin.
As a proportion of the total population aged 15 and over, internal migrants accounted for a very small percentage (1.3%), with higher shares in urban areas (2.1%) compared to rural areas (0.9%). By region, the percentage was the highest in Ho Chi Minh City (3.4%) and the South East (2.1%). Table 6.1: Number and distribution of migrants aged 15 and over, 2012
Distribution (%)
Proportion of internal migrants in total
population of the same working age (%)
Residence/Socio-economic region
Internal migrants of
working age
(Thousands persons) Total Male Female Total Male Female
Entire country 892.3 100.0 39.9 60.1 1.3 1.1 1.5 Urban 487.7 100.0 41.6 58.4 2.1 1.9 2.4 Rural 404.6 100.0 37.8 62.2 0.9 0.7 1.1 Socio-economic region
Northern Midlands and Mountains 69.9 100.0 26.5 73.5 0.8 0.4 1.2 Red River Delta (*) 93.2 100.0 32.8 67.2 0.9 0.6 1.1 North and South Central Coast 159.7 100.0 40.3 59.7 1.1 0.9 1.3 Central Highlands 35.0 100.0 36.0 64.0 0.9 0.7 1.2 Southeast (*) 119.5 100.0 47.0 53.0 2.1 2.0 2.1 Mekong River Delta 153.1 100.0 41.1 58.9 1.1 1.0 1.3 Hanoi city 46.6 100.0 22.7 77.3 0.9 0.4 1.3 Ho Chi Minh city 215.4 100.0 46.6 53.4 3.4 3.4 3.5
Age groups 15 – 24 445.1 100.0 33.6 66.4 3.2 2.0 4.4 25 – 54 407.9 100.0 47.4 52.6 1.0 1.0 1.1 55 – 59 12.9 100.0 37.5 62.5 0.3 0.2 0.3 60 and over 26.4 100.0 31.0 69.0 0.3 0.2 0.3
(*) Red River Delta excludes Hanoi City and Southeast excludes Ho Chi Minh City.
51
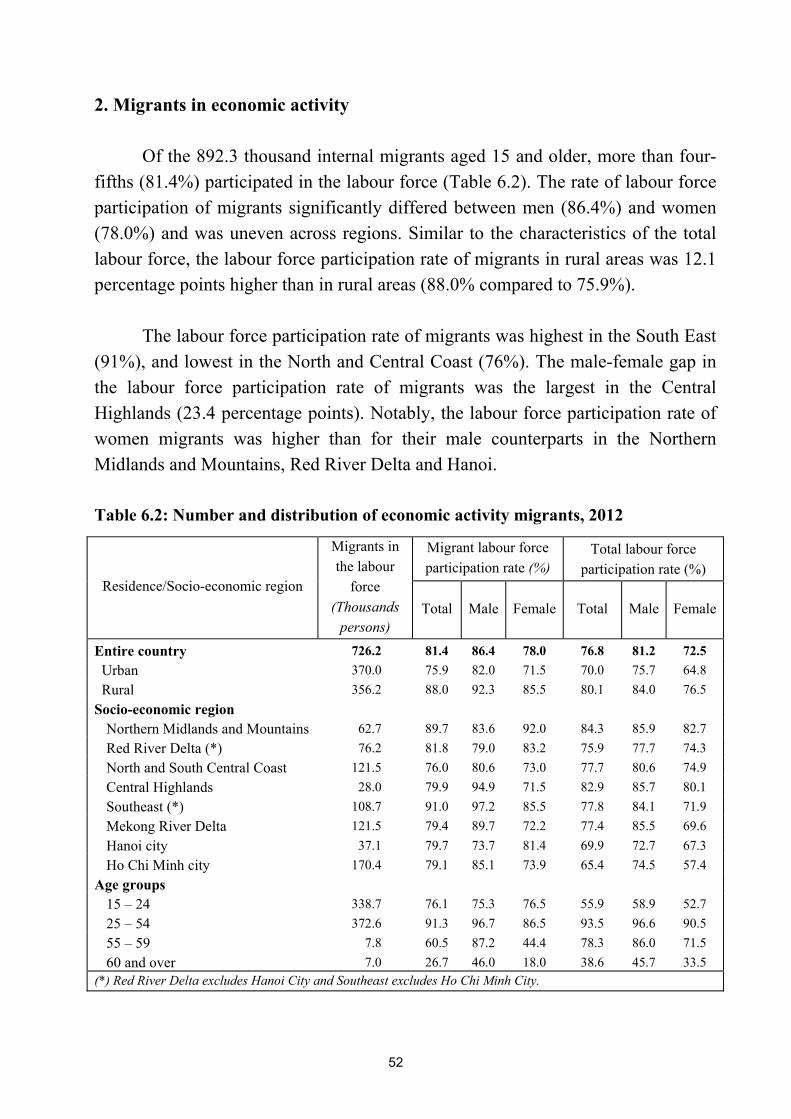
2. Migrants in economic activity Of the 892.3 thousand internal migrants aged 15 and older, more than four-
fifths (81.4%) participated in the labour force (Table 6.2). The rate of labour force participation of migrants significantly differed between men (86.4%) and women (78.0%) and was uneven across regions. Similar to the characteristics of the total labour force, the labour force participation rate of migrants in rural areas was 12.1 percentage points higher than in rural areas (88.0% compared to 75.9%).
The labour force participation rate of migrants was highest in the South East
(91%), and lowest in the North and Central Coast (76%). The male-female gap in the labour force participation rate of migrants was the largest in the Central Highlands (23.4 percentage points). Notably, the labour force participation rate of women migrants was higher than for their male counterparts in the Northern Midlands and Mountains, Red River Delta and Hanoi.
Table 6.2: Number and distribution of economic activity migrants, 2012
Migrant labour force participation rate (%)
Total labour force participation rate (%)
Residence/Socio-economic region
Migrants in the labour
force (Thousands
persons) Total Male Female Total Male Female
Entire country 726.2 81.4 86.4 78.0 76.8 81.2 72.5 Urban 370.0 75.9 82.0 71.5 70.0 75.7 64.8 Rural 356.2 88.0 92.3 85.5 80.1 84.0 76.5 Socio-economic region
Northern Midlands and Mountains 62.7 89.7 83.6 92.0 84.3 85.9 82.7 Red River Delta (*) 76.2 81.8 79.0 83.2 75.9 77.7 74.3 North and South Central Coast 121.5 76.0 80.6 73.0 77.7 80.6 74.9 Central Highlands 28.0 79.9 94.9 71.5 82.9 85.7 80.1 Southeast (*) 108.7 91.0 97.2 85.5 77.8 84.1 71.9 Mekong River Delta 121.5 79.4 89.7 72.2 77.4 85.5 69.6 Hanoi city 37.1 79.7 73.7 81.4 69.9 72.7 67.3 Ho Chi Minh city 170.4 79.1 85.1 73.9 65.4 74.5 57.4
Age groups 15 – 24 338.7 76.1 75.3 76.5 55.9 58.9 52.7 25 – 54 372.6 91.3 96.7 86.5 93.5 96.6 90.5 55 – 59 7.8 60.5 87.2 44.4 78.3 86.0 71.5 60 and over 7.0 26.7 46.0 18.0 38.6 45.7 33.5
(*) Red River Delta excludes Hanoi City and Southeast excludes Ho Chi Minh City.
52
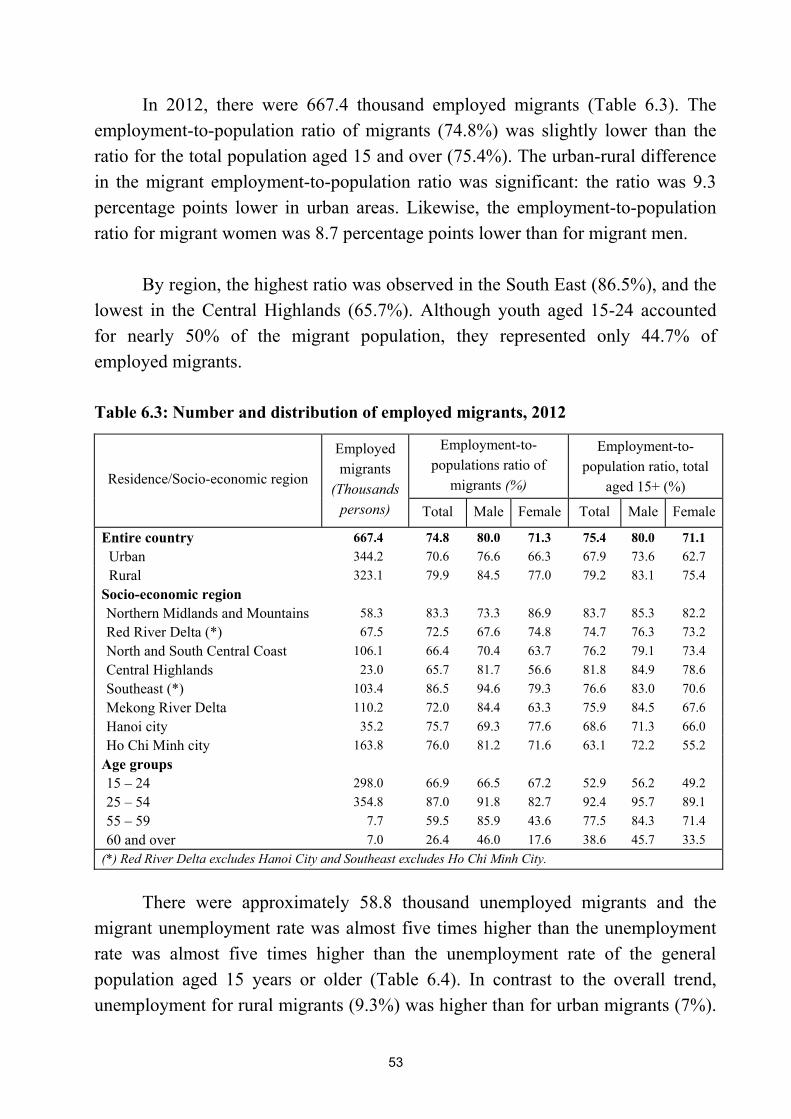
In 2012, there were 667.4 thousand employed migrants (Table 6.3). The employment-to-population ratio of migrants (74.8%) was slightly lower than the ratio for the total population aged 15 and over (75.4%). The urban-rural difference in the migrant employment-to-population ratio was significant: the ratio was 9.3 percentage points lower in urban areas. Likewise, the employment-to-population ratio for migrant women was 8.7 percentage points lower than for migrant men.
By region, the highest ratio was observed in the South East (86.5%), and the lowest in the Central Highlands (65.7%). Although youth aged 15-24 accounted for nearly 50% of the migrant population, they represented only 44.7% of employed migrants. Table 6.3: Number and distribution of employed migrants, 2012
Employment-to-populations ratio of
migrants (%)
Employment-to-population ratio, total
aged 15+ (%) Residence/Socio-economic region
Employed migrants
(Thousands persons) Total Male Female Total Male Female
Entire country 667.4 74.8 80.0 71.3 75.4 80.0 71.1 Urban 344.2 70.6 76.6 66.3 67.9 73.6 62.7 Rural 323.1 79.9 84.5 77.0 79.2 83.1 75.4 Socio-economic region Northern Midlands and Mountains 58.3 83.3 73.3 86.9 83.7 85.3 82.2 Red River Delta (*) 67.5 72.5 67.6 74.8 74.7 76.3 73.2 North and South Central Coast 106.1 66.4 70.4 63.7 76.2 79.1 73.4 Central Highlands 23.0 65.7 81.7 56.6 81.8 84.9 78.6 Southeast (*) 103.4 86.5 94.6 79.3 76.6 83.0 70.6 Mekong River Delta 110.2 72.0 84.4 63.3 75.9 84.5 67.6 Hanoi city 35.2 75.7 69.3 77.6 68.6 71.3 66.0 Ho Chi Minh city 163.8 76.0 81.2 71.6 63.1 72.2 55.2
Age groups 15 – 24 298.0 66.9 66.5 67.2 52.9 56.2 49.2 25 – 54 354.8 87.0 91.8 82.7 92.4 95.7 89.1 55 – 59 7.7 59.5 85.9 43.6 77.5 84.3 71.4 60 and over 7.0 26.4 46.0 17.6 38.6 45.7 33.5
(*) Red River Delta excludes Hanoi City and Southeast excludes Ho Chi Minh City.
There were approximately 58.8 thousand unemployed migrants and the migrant unemployment rate was almost five times higher than the unemployment rate was almost five times higher than the unemployment rate of the general population aged 15 years or older (Table 6.4). In contrast to the overall trend, unemployment for rural migrants (9.3%) was higher than for urban migrants (7%).
53

Moreover, among migrants, the unemployment rate was 1.2 percentage points higher for women than men. Notably, unemployment was concentrated among migrant youth aged 15-24, highlighting their vulnerability in the labour market. By region, the unemployment rate for migrants was the lowest in Ho Chi Minh City (3.9%) and highest in the Central Highlands (17.9%).
Table 6.4: Number and distribution of unemployed migrants in 2012
Unemployment rates of migrant population (%)
Total unemployment rates (%) Residence/Socio-economic region
Unemployed migrants (Person) Total Male Female Total Male Female
Entire country 58 809 8.1 7.4 8.6 1.8 1.6 2.0 Urban 25 774 7.0 6.5 7.3 3.0 2.7 3.2 Rural 33 035 9.3 8.4 9.8 1.2 1.0 1.4
Socio-economic region Northern Midlands and Mountains 4 495 7.2 12.3 5.5 0.7 0.7 0.6 Red River Delta (*) 8 705 11.4 14.5 10.0 1.6 1.7 1.4 North and South Central Coast 15 403 12.7 12.6 12.8 2.0 1.9 2.1 Central Highlands 5 006 17.9 13.9 20.8 1.4 1.0 1.8 Southeast (*) 5 372 4.9 2.6 7.3 1.5 1.3 1.8 Mekong River Delta 11 351 9.3 5.9 12.3 1.9 1.2 2.9 Hanoi city 1 831 4.9 6.0 4.7 1.9 1.9 1.9 Ho Chi Minh city 6 647 3.9 4.6 3.2 3.5 3.1 3.9
Age groups 15 – 24 40 740 12.0 11.7 12.2 5.5 4.6 6.6 25 – 54 17 857 4.8 5.1 4.5 1.2 1.0 1.5 55 – 59 127 1.6 1.5 1.8 1.1 1.9 0.1 60 and over 84 1.2 0.0 2.6 0.1 0.1 0.1
(*) Red River Delta excludes Hanoi City and Southeast excludes Ho Chi Minh City.
54
Part 2 TABULATED TABLES
55

56
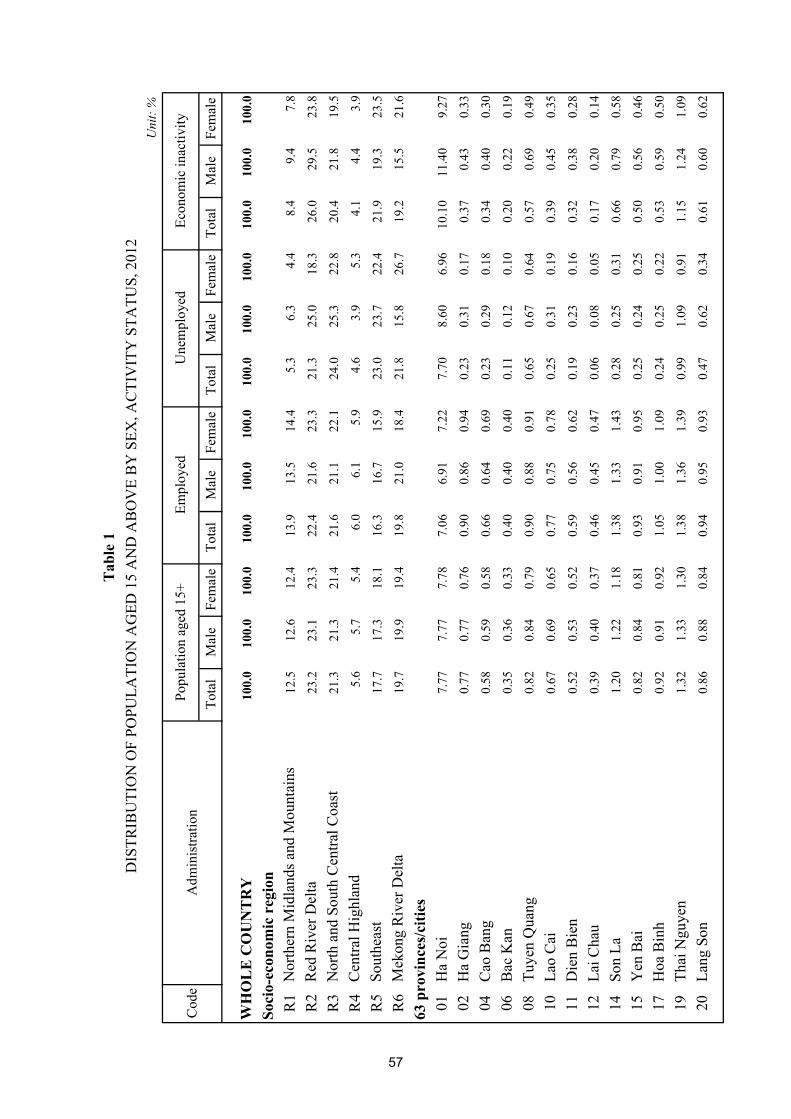
Tota
lM
ale
Fem
ale
Tota
lM
ale
Fem
ale
Tota
lM
ale
Fem
ale
Tota
lM
ale
Fem
ale
WH
OL
E C
OU
NT
RY
100.
010
0.0
100.
010
0.0
100.
010
0.0
100.
010
0.0
100.
010
0.0
100.
010
0.0
Soci
o-ec
onom
ic r
egio
nR
1N
orth
ern
Mid
land
s and
Mou
ntai
ns12
.512
.612
.413
.913
.514
.45.
36.
34.
48.
49.
47.
8
R2
Red
Riv
er D
elta
23.2
23.1
23.3
22.4
21.6
23.3
21.3
25.0
18.3
26.0
29.5
23.8
R3
Nor
th a
nd S
outh
Cen
tral C
oast
21.3
21.3
21.4
21.6
21.1
22.1
24.0
25.3
22.8
20.4
21.8
19.5
R4
Cen
tral H
ighl
and
5.6
5.7
5.4
6.0
6.1
5.9
4.6
3.9
5.3
4.1
4.4
3.9
R5
Sout
heas
t17
.717
.318
.116
.316
.715
.923
.023
.722
.421
.919
.323
.5
R6
Mek
ong
Riv
er D
elta
19.7
19.9
19.4
19.8
21.0
18.4
21.8
15.8
26.7
19.2
15.5
21.6
63 p
rovi
nces
/citi
es01
Ha
Noi
7.77
7.77
7.78
7.06
6.91
7.22
7.70
8.60
6.96
10.1
011
.40
9.27
02H
a G
iang
0.77
0.77
0.76
0.90
0.86
0.94
0.23
0.31
0.17
0.37
0.43
0.33
04C
ao B
ang
0.58
0.59
0.58
0.66
0.64
0.69
0.23
0.29
0.18
0.34
0.40
0.30
06B
ac K
an0.
350.
360.
330.
400.
400.
400.
110.
120.
100.
200.
220.
19
08Tu
yen
Qua
ng0.
820.
840.
790.
900.
880.
910.
650.
670.
640.
570.
690.
49
10La
o C
ai0.
670.
690.
650.
770.
750.
780.
250.
310.
190.
390.
450.
35
11D
ien
Bie
n 0.
520.
530.
520.
590.
560.
620.
190.
230.
160.
320.
380.
28
12La
i Cha
u0.
390.
400.
370.
460.
450.
470.
060.
080.
050.
170.
200.
14
14So
n La
1.20
1.22
1.18
1.38
1.33
1.43
0.28
0.25
0.31
0.66
0.79
0.58
15Y
en B
ai0.
820.
840.
810.
930.
910.
950.
250.
240.
250.
500.
560.
46
17H
oa B
inh
0.92
0.91
0.92
1.05
1.00
1.09
0.24
0.25
0.22
0.53
0.59
0.50
19Th
ai N
guye
n1.
321.
331.
301.
381.
361.
390.
991.
090.
911.
151.
241.
09
20La
ng S
on0.
860.
880.
840.
940.
950.
930.
470.
620.
340.
610.
600.
62
Adm
inis
tratio
n
Uni
t: %
Popu
latio
n ag
ed 1
5+Em
ploy
edEc
onom
ic in
activ
ityU
nem
ploy
ed
Tab
le 1
DIS
TRIB
UTI
ON
OF
POPU
LATI
ON
AG
ED 1
5 A
ND
AB
OV
E B
Y S
EX, A
CTI
VIT
Y S
TATU
S, 2
012
Cod
e
57

Tab
le 1
(con
tinue
)
Tota
lM
ale
Fem
ale
Tota
lM
ale
Fem
ale
Tota
lM
ale
Fem
ale
Tota
lM
ale
Fem
ale
22Q
uang
Nin
h1.
321.
391.
251.
331.
381.
270.
981.
120.
871.
301.
441.
22
24B
ac G
iang
1.79
1.75
1.83
1.93
1.80
2.06
0.69
1.10
0.35
1.41
1.55
1.32
25Ph
u Th
o1.
531.
531.
541.
651.
591.
720.
640.
740.
571.
201.
301.
13
26V
inh
Phuc
1.14
1.15
1.14
1.17
1.14
1.20
0.68
0.62
0.73
1.09
1.25
0.99
27B
ac N
inh
1.18
1.16
1.20
1.20
1.10
1.30
1.04
1.14
0.96
1.13
1.43
0.94
30H
ai D
uong
1.99
1.93
2.05
2.04
1.90
2.19
1.09
1.52
0.73
1.89
2.09
1.76
31H
ai P
hong
2.22
2.23
2.22
2.04
1.98
2.11
4.13
4.82
3.56
2.71
3.14
2.43
33H
ung
Yen
1.33
1.30
1.36
1.35
1.27
1.42
1.07
1.25
0.93
1.30
1.43
1.21
34Th
ai B
inh
2.16
2.09
2.22
2.14
2.00
2.28
1.60
2.12
1.17
2.26
2.48
2.13
35H
a N
am0.
930.
920.
940.
900.
860.
940.
670.
640.
701.
041.
210.
94
36N
am D
inh
2.13
2.13
2.13
2.14
2.05
2.23
1.36
1.91
0.90
2.14
2.47
1.93
37N
inh
Bin
h1.
051.
051.
061.
061.
011.
111.
001.
240.
801.
051.
180.
96
38Th
anh
Hoa
3.83
3.76
3.90
4.08
3.85
4.32
4.28
3.86
4.63
2.99
3.33
2.77
40N
ghe
An
3.34
3.37
3.31
3.52
3.44
3.60
1.83
2.58
1.20
2.86
3.15
2.67
42H
a Ti
nh1.
371.
351.
391.
361.
291.
440.
820.
910.
761.
431.
661.
29
44Q
uang
Bin
h0.
960.
990.
940.
990.
990.
980.
710.
870.
580.
911.
020.
83
45Q
uang
Tri
0.64
0.65
0.63
0.63
0.62
0.65
0.64
0.83
0.49
0.66
0.75
0.60
46Th
ua T
hien
Hue
1.25
1.25
1.25
1.17
1.15
1.20
1.41
1.83
1.06
1.49
1.65
1.39
48D
a N
ang
1.11
1.09
1.13
0.94
0.92
0.96
2.70
2.85
2.58
1.59
1.70
1.51
49Q
uang
Nam
1.62
1.61
1.63
1.59
1.52
1.66
2.32
3.12
1.66
1.68
1.89
1.55
51Q
uang
Nga
i1.
361.
361.
371.
391.
361.
421.
040.
931.
131.
291.
381.
23
52B
inh
Din
h1.
631.
581.
691.
701.
601.
821.
972.
341.
661.
391.
451.
36
54Ph
u Y
en0.
981.
020.
951.
041.
081.
000.
580.
480.
660.
800.
790.
81
56K
hanh
Hoa
1.28
1.28
1.29
1.22
1.26
1.18
2.28
1.77
2.70
1.42
1.32
1.49
58N
inh
Thua
n0.
600.
610.
590.
610.
630.
590.
560.
640.
500.
590.
550.
61
Une
mpl
oyed
Econ
omic
inac
tivity
Uni
t: %
Cod
eA
dmin
istra
tion
Popu
latio
n ag
ed 1
5+Em
ploy
ed
58
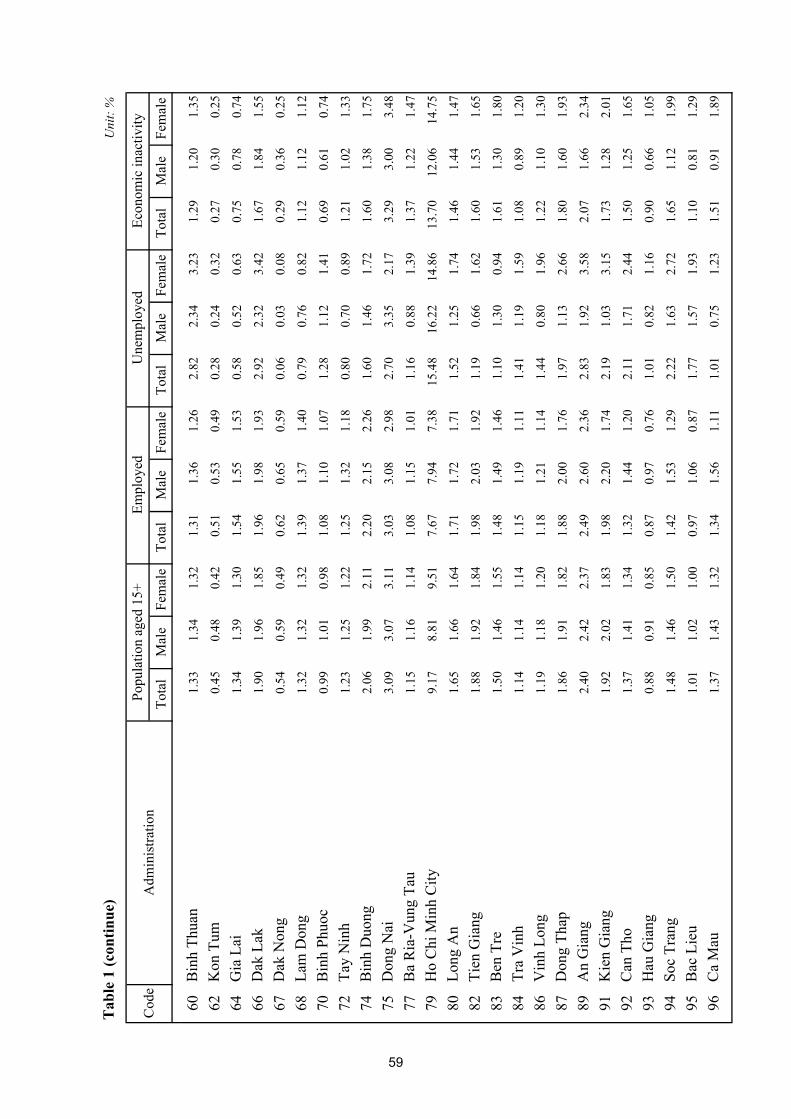
Tab
le 1
(con
tinue
)
Tota
lM
ale
Fem
ale
Tota
lM
ale
Fem
ale
Tota
lM
ale
Fem
ale
Tota
lM
ale
Fem
ale
Une
mpl
oyed
Econ
omic
inac
tivity
Uni
t: %
Cod
eA
dmin
istra
tion
Popu
latio
n ag
ed 1
5+Em
ploy
ed
60B
inh
Thua
n1.
331.
341.
321.
311.
361.
262.
822.
343.
231.
291.
201.
35
62K
on T
um0.
450.
480.
420.
510.
530.
490.
280.
240.
320.
270.
300.
25
64G
ia L
ai1.
341.
391.
301.
541.
551.
530.
580.
520.
630.
750.
780.
74
66D
ak L
ak1.
901.
961.
851.
961.
981.
932.
922.
323.
421.
671.
841.
55
67D
ak N
ong
0.54
0.59
0.49
0.62
0.65
0.59
0.06
0.03
0.08
0.29
0.36
0.25
68La
m D
ong
1.32
1.32
1.32
1.39
1.37
1.40
0.79
0.76
0.82
1.12
1.12
1.12
70B
inh
Phuo
c0.
991.
010.
981.
081.
101.
071.
281.
121.
410.
690.
610.
74
72Ta
y N
inh
1.23
1.25
1.22
1.25
1.32
1.18
0.80
0.70
0.89
1.21
1.02
1.33
74B
inh
Duo
ng2.
061.
992.
112.
202.
152.
261.
601.
461.
721.
601.
381.
75
75D
ong
Nai
3.09
3.07
3.11
3.03
3.08
2.98
2.70
3.35
2.17
3.29
3.00
3.48
77B
a R
ia-V
ung
Tau
1.15
1.16
1.14
1.08
1.15
1.01
1.16
0.88
1.39
1.37
1.22
1.47
79H
o C
hi M
inh
City
9.17
8.81
9.51
7.67
7.94
7.38
15.4
816
.22
14.8
613
.70
12.0
614
.75
80Lo
ng A
n1.
651.
661.
641.
711.
721.
711.
521.
251.
741.
461.
441.
47
82Ti
en G
iang
1.88
1.92
1.84
1.98
2.03
1.92
1.19
0.66
1.62
1.60
1.53
1.65
83B
en T
re1.
501.
461.
551.
481.
491.
461.
101.
300.
941.
611.
301.
80
84Tr
a V
inh
1.14
1.14
1.14
1.15
1.19
1.11
1.41
1.19
1.59
1.08
0.89
1.20
86V
inh
Long
1.19
1.18
1.20
1.18
1.21
1.14
1.44
0.80
1.96
1.22
1.10
1.30
87D
ong
Thap
1.86
1.91
1.82
1.88
2.00
1.76
1.97
1.13
2.66
1.80
1.60
1.93
89A
n G
iang
2.40
2.42
2.37
2.49
2.60
2.36
2.83
1.92
3.58
2.07
1.66
2.34
91K
ien
Gia
ng1.
922.
021.
831.
982.
201.
742.
191.
033.
151.
731.
282.
01
92C
an T
ho1.
371.
411.
341.
321.
441.
202.
111.
712.
441.
501.
251.
65
93H
au G
iang
0.88
0.91
0.85
0.87
0.97
0.76
1.01
0.82
1.16
0.90
0.66
1.05
94So
c Tr
ang
1.48
1.46
1.50
1.42
1.53
1.29
2.22
1.63
2.72
1.65
1.12
1.99
95B
ac L
ieu
1.01
1.02
1.00
0.97
1.06
0.87
1.77
1.57
1.93
1.10
0.81
1.29
96C
a M
au1.
371.
431.
321.
341.
561.
111.
010.
751.
231.
510.
911.
89
59

Tab
le 1
(con
tinue
)
Tota
lM
ale
Fem
ale
Tota
lM
ale
Fem
ale
Tota
lM
ale
Fem
ale
Tota
lM
ale
Fem
ale
Une
mpl
oyed
Econ
omic
inac
tivity
Uni
t: %
Cod
eA
dmin
istra
tion
Popu
latio
n ag
ed 1
5+Em
ploy
ed
UR
BA
N10
0.0
100.
010
0.0
100.
010
0.0
100.
010
0.0
100.
010
0.0
100.
010
0.0
100.
0
Soci
o-ec
onom
ic r
egio
nsR
1N
orth
ern
Mid
land
s and
Mou
ntai
ns6.
86.
86.
97.
57.
08.
05.
15.
64.
65.
46.
15.
0
R2
Red
Riv
er D
elta
22.1
22.8
21.3
20.7
20.7
20.7
22.4
23.8
21.2
25.1
29.3
22.5
R3
Nor
th a
nd S
outh
Cen
tral C
oast
17.9
17.8
18.0
18.2
17.8
18.7
22.0
22.2
21.9
16.9
17.6
16.5
R4
Cen
tral H
ighl
ands
5.0
5.1
5.0
5.7
5.6
5.8
3.4
2.8
3.9
3.6
3.8
3.4
R5
Sout
heas
t33
.132
.833
.532
.233
.031
.433
.332
.833
.635
.232
.237
.1
R6
Mek
ong
Riv
er D
elta
15.1
14.7
15.4
15.7
15.9
15.4
13.8
12.8
14.7
13.7
11.0
15.4
63 p
rovi
nces
/citi
es01
Ha
Noi
10.4
110
.67
10.1
89.
119.
099.
1310
.01
10.5
69.
5113
.40
15.4
712
.10
02H
a G
iang
0.40
0.40
0.39
0.46
0.43
0.50
0.29
0.37
0.21
0.25
0.30
0.21
04C
ao B
ang
0.31
0.32
0.31
0.36
0.35
0.38
0.27
0.31
0.23
0.20
0.25
0.17
06B
ac K
an0.
170.
160.
180.
200.
170.
230.
160.
180.
140.
110.
130.
10
08Tu
yen
Qua
ng0.
340.
350.
340.
360.
350.
370.
440.
470.
400.
290.
320.
27
10La
o C
ai0.
460.
450.
470.
520.
490.
560.
310.
330.
300.
330.
350.
32
11D
ien
Bie
n 0.
260.
270.
250.
290.
290.
300.
160.
200.
130.
190.
230.
17
12La
i Cha
u0.
180.
210.
150.
230.
250.
210.
090.
090.
080.
080.
110.
06
14So
n La
0.56
0.63
0.49
0.64
0.67
0.60
0.37
0.37
0.37
0.38
0.53
0.29
15Y
en B
ai0.
500.
500.
510.
550.
520.
580.
370.
380.
350.
400.
430.
39
17H
oa B
inh
0.42
0.41
0.43
0.46
0.43
0.49
0.24
0.17
0.30
0.35
0.38
0.33
19Th
ai N
guye
n1.
050.
991.
111.
060.
951.
170.
730.
660.
801.
061.
121.
02
20La
ng S
on0.
500.
490.
520.
550.
490.
600.
400.
610.
210.
410.
450.
38
22Q
uang
Nin
h2.
102.
301.
922.
142.
321.
961.
471.
691.
272.
042.
271.
90
24B
ac G
iang
0.54
0.55
0.53
0.56
0.53
0.58
0.77
0.97
0.60
0.49
0.58
0.43
60

Tab
le 1
(con
tinue
)
Tota
lM
ale
Fem
ale
Tota
lM
ale
Fem
ale
Tota
lM
ale
Fem
ale
Tota
lM
ale
Fem
ale
Une
mpl
oyed
Econ
omic
inac
tivity
Uni
t: %
Cod
eA
dmin
istra
tion
Popu
latio
n ag
ed 1
5+Em
ploy
ed
25Ph
u Th
o1.
121.
021.
201.
241.
091.
410.
510.
520.
490.
870.
870.
87
26V
inh
Phuc
0.80
0.85
0.75
0.84
0.86
0.82
0.70
0.79
0.62
0.70
0.82
0.62
27B
ac N
inh
0.93
0.98
0.89
1.00
0.97
1.03
0.75
0.79
0.73
0.79
1.02
0.65
30H
ai D
uong
1.38
1.29
1.47
1.39
1.21
1.57
0.92
0.83
0.99
1.41
1.59
1.30
31H
ai P
hong
3.10
3.34
2.88
2.91
3.03
2.78
4.42
4.52
4.34
3.45
4.19
2.99
33H
ung
Yen
0.50
0.48
0.52
0.54
0.48
0.59
0.55
0.66
0.46
0.43
0.45
0.41
34Th
ai B
inh
0.68
0.66
0.69
0.60
0.56
0.64
1.43
1.59
1.28
0.81
0.91
0.74
35H
a N
am0.
280.
290.
280.
280.
270.
290.
420.
450.
390.
290.
360.
25
36N
am D
inh
1.18
1.12
1.24
1.21
1.09
1.34
0.77
0.67
0.86
1.15
1.26
1.08
37N
inh
Bin
h0.
680.
850.
520.
670.
810.
511.
001.
220.
800.
680.
950.
51
38Th
anh
Hoa
1.37
1.42
1.31
1.44
1.42
1.45
2.75
3.05
2.49
1.11
1.28
1.00
40N
ghe
An
1.40
1.44
1.36
1.45
1.45
1.46
1.23
1.53
0.95
1.28
1.41
1.21
42H
a Ti
nh0.
680.
690.
660.
710.
700.
730.
510.
540.
480.
600.
670.
56
44Q
uang
Bin
h0.
450.
470.
430.
470.
470.
460.
450.
520.
400.
390.
450.
36
45Q
uang
Tri
0.58
0.62
0.53
0.61
0.63
0.60
0.49
0.48
0.49
0.50
0.62
0.42
46Th
ua T
hien
Hue
2.35
2.22
2.47
2.36
2.14
2.61
2.07
2.36
1.82
2.34
2.47
2.27
48D
a N
ang
2.93
2.83
3.03
2.69
2.54
2.84
4.86
4.80
4.92
3.36
3.55
3.24
49Q
uang
Nam
0.99
0.94
1.02
1.00
0.91
1.09
1.29
1.28
1.30
0.94
1.02
0.89
51Q
uang
Nga
i0.
620.
600.
640.
670.
630.
710.
490.
420.
560.
520.
510.
53
52B
inh
Din
h1.
401.
421.
391.
541.
491.
581.
731.
721.
731.
081.
171.
02
54Ph
u Y
en0.
690.
710.
670.
750.
750.
750.
680.
680.
690.
550.
590.
53
56K
hanh
Hoa
2.18
2.12
2.24
2.16
2.14
2.18
2.34
1.86
2.78
2.21
2.06
2.31
58N
inh
Thua
n0.
680.
710.
650.
710.
750.
670.
570.
690.
460.
610.
580.
62
60B
inh
Thua
n1.
611.
651.
571.
661.
771.
552.
542.
242.
821.
421.
251.
53
61

Tab
le 1
(con
tinue
)
Tota
lM
ale
Fem
ale
Tota
lM
ale
Fem
ale
Tota
lM
ale
Fem
ale
Tota
lM
ale
Fem
ale
Une
mpl
oyed
Econ
omic
inac
tivity
Uni
t: %
Cod
eA
dmin
istra
tion
Popu
latio
n ag
ed 1
5+Em
ploy
ed
62K
on T
um0.
520.
540.
510.
610.
610.
610.
480.
370.
570.
320.
330.
32
64G
ia L
ai1.
321.
331.
301.
551.
521.
580.
590.
390.
760.
850.
870.
84
66D
ak L
ak1.
391.
421.
361.
531.
491.
571.
300.
941.
621.
061.
220.
96
67D
ak N
ong
0.26
0.32
0.20
0.31
0.36
0.25
0.06
0.04
0.07
0.15
0.22
0.11
68La
m D
ong
1.56
1.51
1.60
1.74
1.64
1.84
0.96
1.05
0.89
1.19
1.15
1.21
70B
inh
Phuo
c0.
510.
510.
510.
570.
550.
580.
620.
520.
700.
380.
370.
38
72Ta
y N
inh
0.60
0.59
0.60
0.63
0.64
0.62
0.24
0.30
0.17
0.54
0.49
0.58
74B
inh
Duo
ng4.
033.
674.
364.
794.
295.
322.
402.
072.
692.
421.
912.
74
75D
ong
Nai
3.15
3.05
3.24
3.28
3.24
3.32
1.46
1.91
1.05
2.97
2.57
3.23
77B
a R
ia-V
ung
Tau
1.75
1.73
1.76
1.71
1.81
1.61
1.39
1.22
1.55
1.84
1.54
2.04
79H
o C
hi M
inh
City
23.1
023
.22
22.9
921
.22
22.4
219
.94
27.1
526
.78
27.4
827
.09
25.3
628
.17
80Lo
ng A
n0.
920.
860.
970.
960.
901.
020.
770.
670.
850.
860.
780.
90
82Ti
en G
iang
1.02
0.91
1.12
1.05
0.95
1.16
0.78
0.79
0.77
0.98
0.81
1.08
83B
en T
re0.
450.
430.
470.
450.
460.
440.
310.
310.
300.
460.
350.
52
84Tr
a V
inh
0.57
0.57
0.56
0.61
0.63
0.59
0.55
0.47
0.62
0.47
0.42
0.50
86V
inh
Long
0.56
0.52
0.61
0.55
0.53
0.57
0.65
0.61
0.68
0.59
0.48
0.66
87D
ong
Thap
1.03
0.98
1.07
1.05
1.03
1.08
0.68
0.73
0.63
1.01
0.87
1.09
89A
n G
iang
2.41
2.42
2.41
2.63
2.64
2.61
3.22
2.79
3.61
1.88
1.72
1.97
91K
ien
Gia
ng1.
581.
641.
521.
691.
861.
500.
920.
811.
011.
381.
021.
60
92C
an T
ho2.
772.
762.
782.
933.
052.
792.
172.
232.
122.
461.
932.
79
93H
au G
iang
0.65
0.66
0.64
0.69
0.73
0.65
0.63
0.63
0.63
0.55
0.45
0.62
94So
c Tr
ang
1.38
1.26
1.49
1.38
1.37
1.40
1.39
1.29
1.48
1.37
0.91
1.66
95B
ac L
ieu
0.83
0.82
0.84
0.81
0.87
0.74
1.02
0.85
1.18
0.85
0.66
0.98
96C
a M
au0.
880.
820.
930.
900.
890.
900.
740.
650.
830.
850.
631.
00
62

Tab
le 1
(con
tinue
)
Tota
lM
ale
Fem
ale
Tota
lM
ale
Fem
ale
Tota
lM
ale
Fem
ale
Tota
lM
ale
Fem
ale
Une
mpl
oyed
Econ
omic
inac
tivity
Uni
t: %
Cod
eA
dmin
istra
tion
Popu
latio
n ag
ed 1
5+Em
ploy
ed
RU
RA
L10
0.0
100.
010
0.0
100.
010
0.0
100.
010
0.0
100.
010
0.0
100.
010
0.0
100.
0
Soci
o-ec
onom
ic r
egio
nsR
1N
orth
ern
Mid
land
s and
Mou
ntai
ns15
.415
.515
.316
.716
.317
.15.
57.
14.
210
.711
.99.
9
R2
Red
Riv
er D
elta
23.8
23.3
24.4
23.2
22.0
24.4
20.2
26.4
15.5
26.7
29.7
24.7
R3
Nor
th a
nd S
outh
Cen
tral C
oast
23.0
22.9
23.1
23.0
22.5
23.5
26.0
29.0
23.8
23.0
24.9
21.7
R4
Cen
tral H
ighl
ands
5.8
6.0
5.6
6.1
6.3
6.0
5.9
5.1
6.6
4.5
4.9
4.3
R5
Sout
heas
t10
.09.
810
.29.
59.
89.
312
.313
.311
.511
.79.
713
.1
R6
Mek
ong
Riv
er D
elta
22.0
22.5
21.5
21.5
23.2
19.7
30.1
19.1
38.4
23.4
18.9
26.3
63 p
rovi
nces
/citi
es01
Ha
Noi
6.46
6.36
6.55
6.18
5.98
6.41
5.29
6.35
4.48
7.60
8.38
7.09
02H
a G
iang
0.95
0.95
0.95
1.08
1.04
1.13
0.17
0.24
0.12
0.47
0.53
0.43
04C
ao B
ang
0.72
0.72
0.72
0.79
0.77
0.82
0.19
0.26
0.14
0.45
0.51
0.41
06B
ac K
an0.
430.
460.
410.
480.
490.
470.
050.
050.
060.
270.
290.
25
08Tu
yen
Qua
ng1.
061.
081.
031.
131.
111.
140.
880.
900.
870.
780.
970.
66
10La
o C
ai0.
780.
810.
750.
870.
870.
880.
180.
300.
090.
430.
530.
37
11D
ien
Bie
n 0.
650.
650.
660.
720.
680.
760.
220.
270.
190.
410.
490.
36
12La
i Cha
u0.
490.
500.
490.
560.
540.
580.
030.
060.
010.
230.
270.
20
14So
n La
1.52
1.50
1.53
1.69
1.61
1.78
0.19
0.11
0.25
0.87
0.98
0.80
15Y
en B
ai0.
981.
000.
961.
091.
071.
110.
120.
080.
160.
580.
660.
52
17H
oa B
inh
1.16
1.16
1.17
1.30
1.24
1.35
0.23
0.35
0.15
0.68
0.75
0.63
19Th
ai N
guye
n1.
451.
501.
401.
511.
541.
491.
261.
601.
011.
211.
321.
14
20La
ng S
on1.
041.
071.
001.
111.
151.
070.
540.
640.
460.
760.
710.
80
22Q
uang
Nin
h0.
930.
950.
900.
980.
980.
980.
480.
460.
480.
740.
820.
69
24B
ac G
iang
2.42
2.33
2.50
2.52
2.35
2.70
0.60
1.25
0.11
2.10
2.27
2.00
63

Tab
le 1
(con
tinue
)
Tota
lM
ale
Fem
ale
Tota
lM
ale
Fem
ale
Tota
lM
ale
Fem
ale
Tota
lM
ale
Fem
ale
Une
mpl
oyed
Econ
omic
inac
tivity
Uni
t: %
Cod
eA
dmin
istra
tion
Popu
latio
n ag
ed 1
5+Em
ploy
ed
25Ph
u Th
o1.
741.
771.
711.
831.
811.
850.
790.
990.
641.
441.
631.
32
26V
inh
Phuc
1.32
1.30
1.33
1.31
1.26
1.36
0.66
0.42
0.85
1.40
1.57
1.28
27B
ac N
inh
1.30
1.25
1.35
1.28
1.16
1.41
1.34
1.56
1.18
1.38
1.73
1.16
30H
ai D
uong
2.30
2.24
2.36
2.32
2.20
2.46
1.27
2.31
0.48
2.25
2.46
2.12
31H
ai P
hong
1.79
1.70
1.87
1.67
1.53
1.82
3.81
5.16
2.79
2.14
2.37
1.99
33H
ung
Yen
1.74
1.70
1.79
1.69
1.61
1.78
1.62
1.93
1.38
1.96
2.15
1.83
34Th
ai B
inh
2.90
2.79
3.00
2.79
2.62
2.97
1.78
2.74
1.06
3.37
3.64
3.19
35H
a N
am1.
251.
231.
281.
171.
111.
220.
940.
851.
011.
621.
841.
47
36N
am D
inh
2.60
2.62
2.59
2.54
2.47
2.61
1.97
3.34
0.93
2.89
3.37
2.58
37N
inh
Bin
h1.
241.
141.
341.
231.
101.
361.
001.
260.
811.
321.
341.
31
38Th
anh
Hoa
5.06
4.89
5.23
5.21
4.90
5.55
5.89
4.79
6.72
4.41
4.85
4.12
40N
ghe
An
4.31
4.31
4.31
4.40
4.29
4.52
2.46
3.78
1.45
4.05
4.44
3.80
42H
a Ti
nh1.
711.
671.
761.
631.
541.
741.
151.
321.
032.
062.
381.
85
44Q
uang
Bin
h1.
221.
251.
201.
211.
211.
210.
981.
270.
771.
301.
451.
20
45Q
uang
Tri
0.67
0.66
0.68
0.64
0.62
0.67
0.81
1.23
0.49
0.78
0.84
0.74
46Th
ua T
hien
Hue
0.70
0.77
0.62
0.66
0.72
0.59
0.71
1.23
0.32
0.85
1.04
0.72
48D
a N
ang
0.21
0.25
0.16
0.19
0.23
0.16
0.44
0.62
0.30
0.24
0.33
0.19
49Q
uang
Nam
1.94
1.93
1.94
1.84
1.78
1.91
3.41
5.24
2.02
2.24
2.53
2.05
51Q
uang
Nga
i1.
731.
731.
741.
701.
681.
731.
611.
511.
691.
862.
031.
76
52B
inh
Din
h1.
751.
651.
841.
771.
641.
922.
223.
061.
581.
631.
651.
62
54Ph
u Y
en1.
121.
161.
081.
171.
221.
110.
460.
240.
630.
990.
941.
02
56K
hanh
Hoa
0.84
0.88
0.80
0.82
0.89
0.75
2.21
1.67
2.63
0.83
0.78
0.86
58N
inh
Thua
n0.
570.
570.
560.
560.
580.
550.
560.
580.
540.
570.
520.
61
60B
inh
Thua
n1.
191.
191.
191.
161.
181.
143.
112.
453.
621.
201.
161.
22
64

Tab
le 1
(con
tinue
)
Tota
lM
ale
Fem
ale
Tota
lM
ale
Fem
ale
Tota
lM
ale
Fem
ale
Tota
lM
ale
Fem
ale
Une
mpl
oyed
Econ
omic
inac
tivity
Uni
t: %
Cod
eA
dmin
istra
tion
Popu
latio
n ag
ed 1
5+Em
ploy
ed
62K
on T
um0.
420.
460.
370.
470.
500.
440.
080.
090.
070.
220.
280.
19
64G
ia L
ai1.
361.
421.
301.
541.
561.
510.
570.
670.
500.
680.
710.
66
66D
ak L
ak2.
162.
232.
102.
142.
192.
084.
623.
905.
172.
122.
302.
01
67D
ak N
ong
0.68
0.72
0.64
0.76
0.78
0.74
0.06
0.02
0.09
0.39
0.46
0.35
68La
m D
ong
1.20
1.22
1.17
1.24
1.26
1.22
0.61
0.42
0.76
1.07
1.10
1.05
70B
inh
Phuo
c1.
241.
251.
231.
301.
331.
281.
981.
812.
100.
930.
791.
02
72Ta
y N
inh
1.55
1.57
1.53
1.51
1.61
1.41
1.40
1.15
1.58
1.72
1.42
1.91
74B
inh
Duo
ng1.
071.
180.
961.
091.
220.
960.
760.
750.
770.
980.
980.
99
75D
ong
Nai
3.06
3.08
3.04
2.93
3.02
2.83
4.01
4.99
3.26
3.54
3.33
3.67
77B
a R
ia-V
ung
Tau
0.86
0.89
0.83
0.81
0.87
0.75
0.92
0.49
1.24
1.02
0.98
1.04
79H
o C
hi M
inh
City
2.22
1.82
2.60
1.87
1.72
2.02
3.23
4.10
2.58
3.56
2.20
4.45
80Lo
ng A
n2.
012.
051.
992.
042.
072.
002.
301.
912.
601.
921.
931.
91
82Ti
en G
iang
2.31
2.41
2.21
2.38
2.50
2.25
1.62
0.52
2.45
2.07
2.06
2.08
83B
en T
re2.
031.
952.
101.
921.
941.
901.
932.
421.
562.
482.
012.
78
84Tr
a V
inh
1.42
1.41
1.44
1.38
1.43
1.33
2.31
2.03
2.52
1.54
1.25
1.74
86V
inh
Long
1.50
1.51
1.50
1.45
1.50
1.39
2.26
1.02
3.21
1.70
1.56
1.79
87D
ong
Thap
2.28
2.36
2.20
2.23
2.41
2.05
3.31
1.59
4.63
2.40
2.14
2.57
89A
n G
iang
2.39
2.42
2.36
2.43
2.59
2.26
2.41
0.91
3.55
2.22
1.61
2.62
91K
ien
Gia
ng2.
092.
201.
992.
102.
351.
843.
521.
295.
221.
991.
482.
32
92C
an T
ho0.
670.
750.
610.
630.
740.
522.
051.
122.
760.
770.
750.
78
93H
au G
iang
0.99
1.03
0.96
0.94
1.07
0.81
1.41
1.05
1.67
1.16
0.81
1.39
94So
c Tr
ang
1.53
1.55
1.51
1.43
1.60
1.25
3.10
2.02
3.92
1.86
1.27
2.24
95B
ac L
ieu
1.10
1.12
1.09
1.04
1.15
0.93
2.55
2.39
2.67
1.28
0.92
1.52
96C
a M
au1.
621.
721.
521.
531.
841.
201.
300.
871.
622.
001.
122.
57
65
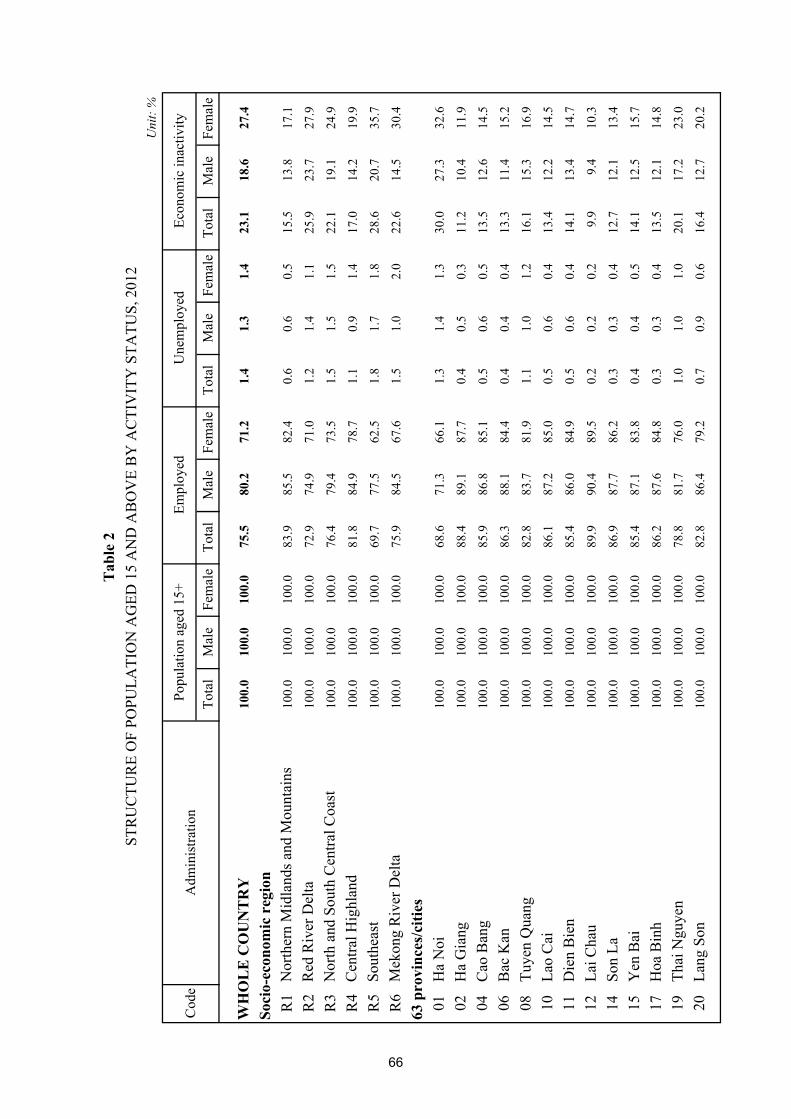
Tota
lM
ale
Fem
ale
Tota
lM
ale
Fem
ale
Tota
lM
ale
Fem
ale
Tota
lM
ale
Fem
ale
WH
OL
E C
OU
NT
RY
100.
010
0.0
100.
075
.580
.271
.21.
41.
31.
423
.118
.627
.4
Soci
o-ec
onom
ic r
egio
nR
1N
orth
ern
Mid
land
s and
Mou
ntai
ns10
0.0
100.
010
0.0
83.9
85.5
82.4
0.6
0.6
0.5
15.5
13.8
17.1
R2
Red
Riv
er D
elta
100.
010
0.0
100.
072
.974
.971
.01.
21.
41.
125
.923
.727
.9
R3
Nor
th a
nd S
outh
Cen
tral C
oast
100.
010
0.0
100.
076
.479
.473
.51.
51.
51.
522
.119
.124
.9
R4
Cen
tral H
ighl
and
100.
010
0.0
100.
081
.884
.978
.71.
10.
91.
417
.014
.219
.9
R5
Sout
heas
t10
0.0
100.
010
0.0
69.7
77.5
62.5
1.8
1.7
1.8
28.6
20.7
35.7
R6
Mek
ong
Riv
er D
elta
100.
010
0.0
100.
075
.984
.567
.61.
51.
02.
022
.614
.530
.4
63 p
rovi
nces
/citi
es01
Ha
Noi
100.
010
0.0
100.
068
.671
.366
.11.
31.
41.
330
.027
.332
.6
02H
a G
iang
100.
010
0.0
100.
088
.489
.187
.70.
40.
50.
311
.210
.411
.9
04C
ao B
ang
100.
010
0.0
100.
085
.986
.885
.10.
50.
60.
513
.512
.614
.5
06B
ac K
an10
0.0
100.
010
0.0
86.3
88.1
84.4
0.4
0.4
0.4
13.3
11.4
15.2
08Tu
yen
Qua
ng10
0.0
100.
010
0.0
82.8
83.7
81.9
1.1
1.0
1.2
16.1
15.3
16.9
10La
o C
ai10
0.0
100.
010
0.0
86.1
87.2
85.0
0.5
0.6
0.4
13.4
12.2
14.5
11D
ien
Bie
n 10
0.0
100.
010
0.0
85.4
86.0
84.9
0.5
0.6
0.4
14.1
13.4
14.7
12La
i Cha
u10
0.0
100.
010
0.0
89.9
90.4
89.5
0.2
0.2
0.2
9.9
9.4
10.3
14So
n La
100.
010
0.0
100.
086
.987
.786
.20.
30.
30.
412
.712
.113
.4
15Y
en B
ai10
0.0
100.
010
0.0
85.4
87.1
83.8
0.4
0.4
0.5
14.1
12.5
15.7
17H
oa B
inh
100.
010
0.0
100.
086
.287
.684
.80.
30.
30.
413
.512
.114
.8
19Th
ai N
guye
n10
0.0
100.
010
0.0
78.8
81.7
76.0
1.0
1.0
1.0
20.1
17.2
23.0
20La
ng S
on10
0.0
100.
010
0.0
82.8
86.4
79.2
0.7
0.9
0.6
16.4
12.7
20.2
Tab
le 2
STR
UC
TUR
E O
F PO
PULA
TIO
N A
GED
15
AN
D A
BO
VE
BY
AC
TIV
ITY
STA
TUS,
201
2
Cod
eA
dmin
istra
tion
Uni
t: %
Popu
latio
n ag
ed 1
5+Em
ploy
edEc
onom
ic in
activ
ityU
nem
ploy
ed
66
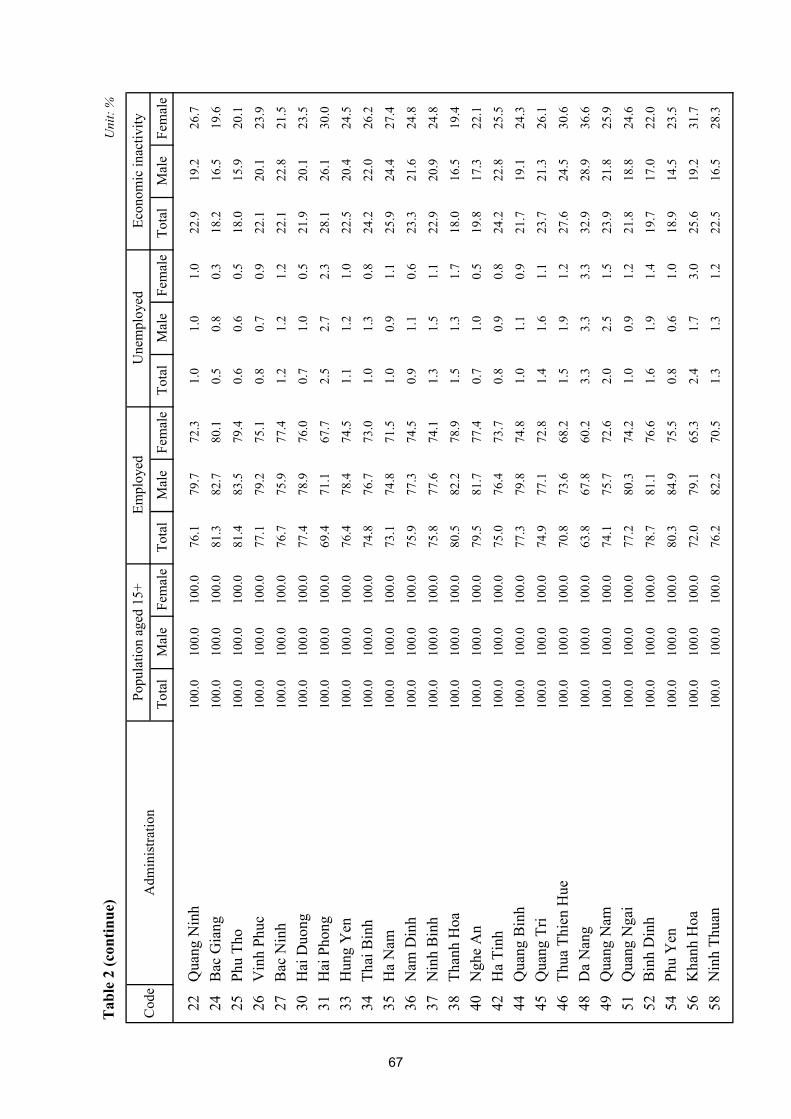
Tab
le 2
(con
tinue
)
Tota
lM
ale
Fem
ale
Tota
lM
ale
Fem
ale
Tota
lM
ale
Fem
ale
Tota
lM
ale
Fem
ale
22Q
uang
Nin
h10
0.0
100.
010
0.0
76.1
79.7
72.3
1.0
1.0
1.0
22.9
19.2
26.7
24B
ac G
iang
100.
010
0.0
100.
081
.382
.780
.10.
50.
80.
318
.216
.519
.6
25Ph
u Th
o10
0.0
100.
010
0.0
81.4
83.5
79.4
0.6
0.6
0.5
18.0
15.9
20.1
26V
inh
Phuc
100.
010
0.0
100.
077
.179
.275
.10.
80.
70.
922
.120
.123
.9
27B
ac N
inh
100.
010
0.0
100.
076
.775
.977
.41.
21.
21.
222
.122
.821
.5
30H
ai D
uong
100.
010
0.0
100.
077
.478
.976
.00.
71.
00.
521
.920
.123
.5
31H
ai P
hong
100.
010
0.0
100.
069
.471
.167
.72.
52.
72.
328
.126
.130
.0
33H
ung
Yen
100.
010
0.0
100.
076
.478
.474
.51.
11.
21.
022
.520
.424
.5
34Th
ai B
inh
100.
010
0.0
100.
074
.876
.773
.01.
01.
30.
824
.222
.026
.2
35H
a N
am10
0.0
100.
010
0.0
73.1
74.8
71.5
1.0
0.9
1.1
25.9
24.4
27.4
36N
am D
inh
100.
010
0.0
100.
075
.977
.374
.50.
91.
10.
623
.321
.624
.8
37N
inh
Bin
h10
0.0
100.
010
0.0
75.8
77.6
74.1
1.3
1.5
1.1
22.9
20.9
24.8
38Th
anh
Hoa
100.
010
0.0
100.
080
.582
.278
.91.
51.
31.
718
.016
.519
.4
40N
ghe
An
100.
010
0.0
100.
079
.581
.777
.40.
71.
00.
519
.817
.322
.1
42H
a Ti
nh10
0.0
100.
010
0.0
75.0
76.4
73.7
0.8
0.9
0.8
24.2
22.8
25.5
44Q
uang
Bin
h10
0.0
100.
010
0.0
77.3
79.8
74.8
1.0
1.1
0.9
21.7
19.1
24.3
45Q
uang
Tri
100.
010
0.0
100.
074
.977
.172
.81.
41.
61.
123
.721
.326
.1
46Th
ua T
hien
Hue
100.
010
0.0
100.
070
.873
.668
.21.
51.
91.
227
.624
.530
.6
48D
a N
ang
100.
010
0.0
100.
063
.867
.860
.23.
33.
33.
332
.928
.936
.6
49Q
uang
Nam
100.
010
0.0
100.
074
.175
.772
.62.
02.
51.
523
.921
.825
.9
51Q
uang
Nga
i10
0.0
100.
010
0.0
77.2
80.3
74.2
1.0
0.9
1.2
21.8
18.8
24.6
52B
inh
Din
h10
0.0
100.
010
0.0
78.7
81.1
76.6
1.6
1.9
1.4
19.7
17.0
22.0
54Ph
u Y
en10
0.0
100.
010
0.0
80.3
84.9
75.5
0.8
0.6
1.0
18.9
14.5
23.5
56K
hanh
Hoa
100.
010
0.0
100.
072
.079
.165
.32.
41.
73.
025
.619
.231
.7
58N
inh
Thua
n10
0.0
100.
010
0.0
76.2
82.2
70.5
1.3
1.3
1.2
22.5
16.5
28.3
Une
mpl
oyed
Econ
omic
inac
tivity
Uni
t: %
Cod
eA
dmin
istra
tion
Popu
latio
n ag
ed 1
5+Em
ploy
ed
67
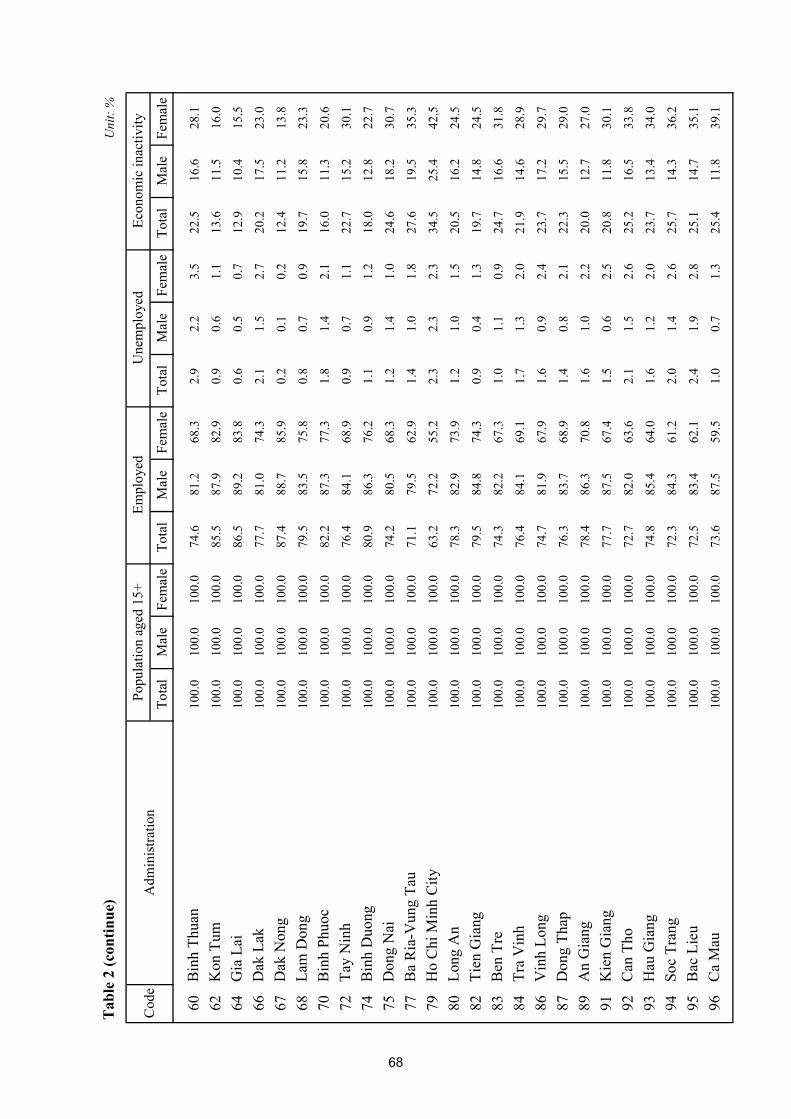
Tab
le 2
(con
tinue
)
Tota
lM
ale
Fem
ale
Tota
lM
ale
Fem
ale
Tota
lM
ale
Fem
ale
Tota
lM
ale
Fem
ale
Une
mpl
oyed
Econ
omic
inac
tivity
Uni
t: %
Cod
eA
dmin
istra
tion
Popu
latio
n ag
ed 1
5+Em
ploy
ed
60B
inh
Thua
n10
0.0
100.
010
0.0
74.6
81.2
68.3
2.9
2.2
3.5
22.5
16.6
28.1
62K
on T
um10
0.0
100.
010
0.0
85.5
87.9
82.9
0.9
0.6
1.1
13.6
11.5
16.0
64G
ia L
ai10
0.0
100.
010
0.0
86.5
89.2
83.8
0.6
0.5
0.7
12.9
10.4
15.5
66D
ak L
ak10
0.0
100.
010
0.0
77.7
81.0
74.3
2.1
1.5
2.7
20.2
17.5
23.0
67D
ak N
ong
100.
010
0.0
100.
087
.488
.785
.90.
20.
10.
212
.411
.213
.8
68La
m D
ong
100.
010
0.0
100.
079
.583
.575
.80.
80.
70.
919
.715
.823
.3
70B
inh
Phuo
c10
0.0
100.
010
0.0
82.2
87.3
77.3
1.8
1.4
2.1
16.0
11.3
20.6
72Ta
y N
inh
100.
010
0.0
100.
076
.484
.168
.90.
90.
71.
122
.715
.230
.1
74B
inh
Duo
ng10
0.0
100.
010
0.0
80.9
86.3
76.2
1.1
0.9
1.2
18.0
12.8
22.7
75D
ong
Nai
100.
010
0.0
100.
074
.280
.568
.31.
21.
41.
024
.618
.230
.7
77B
a R
ia-V
ung
Tau
100.
010
0.0
100.
071
.179
.562
.91.
41.
01.
827
.619
.535
.3
79H
o C
hi M
inh
City
100.
010
0.0
100.
063
.272
.255
.22.
32.
32.
334
.525
.442
.5
80Lo
ng A
n10
0.0
100.
010
0.0
78.3
82.9
73.9
1.2
1.0
1.5
20.5
16.2
24.5
82Ti
en G
iang
100.
010
0.0
100.
079
.584
.874
.30.
90.
41.
319
.714
.824
.5
83B
en T
re10
0.0
100.
010
0.0
74.3
82.2
67.3
1.0
1.1
0.9
24.7
16.6
31.8
84Tr
a V
inh
100.
010
0.0
100.
076
.484
.169
.11.
71.
32.
021
.914
.628
.9
86V
inh
Long
100.
010
0.0
100.
074
.781
.967
.91.
60.
92.
423
.717
.229
.7
87D
ong
Thap
100.
010
0.0
100.
076
.383
.768
.91.
40.
82.
122
.315
.529
.0
89A
n G
iang
100.
010
0.0
100.
078
.486
.370
.81.
61.
02.
220
.012
.727
.0
91K
ien
Gia
ng10
0.0
100.
010
0.0
77.7
87.5
67.4
1.5
0.6
2.5
20.8
11.8
30.1
92C
an T
ho10
0.0
100.
010
0.0
72.7
82.0
63.6
2.1
1.5
2.6
25.2
16.5
33.8
93H
au G
iang
100.
010
0.0
100.
074
.885
.464
.01.
61.
22.
023
.713
.434
.0
94So
c Tr
ang
100.
010
0.0
100.
072
.384
.361
.22.
01.
42.
625
.714
.336
.2
95B
ac L
ieu
100.
010
0.0
100.
072
.583
.462
.12.
41.
92.
825
.114
.735
.1
96C
a M
au10
0.0
100.
010
0.0
73.6
87.5
59.5
1.0
0.7
1.3
25.4
11.8
39.1
68
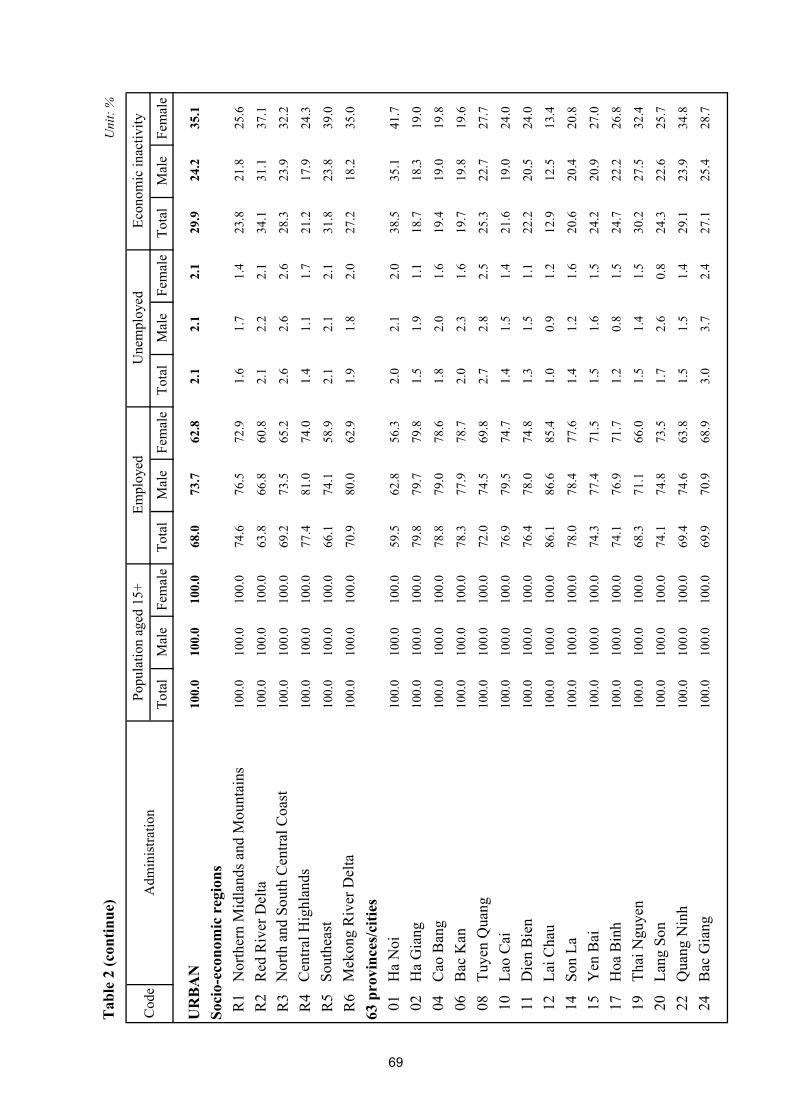
Tab
le 2
(con
tinue
)
Tota
lM
ale
Fem
ale
Tota
lM
ale
Fem
ale
Tota
lM
ale
Fem
ale
Tota
lM
ale
Fem
ale
Une
mpl
oyed
Econ
omic
inac
tivity
Uni
t: %
Cod
eA
dmin
istra
tion
Popu
latio
n ag
ed 1
5+Em
ploy
ed
UR
BA
N10
0.0
100.
010
0.0
68.0
73.7
62.8
2.1
2.1
2.1
29.9
24.2
35.1
Soci
o-ec
onom
ic r
egio
nsR
1N
orth
ern
Mid
land
s and
Mou
ntai
ns10
0.0
100.
010
0.0
74.6
76.5
72.9
1.6
1.7
1.4
23.8
21.8
25.6
R2
Red
Riv
er D
elta
100.
010
0.0
100.
063
.866
.860
.82.
12.
22.
134
.131
.137
.1
R3
Nor
th a
nd S
outh
Cen
tral C
oast
100.
010
0.0
100.
069
.273
.565
.22.
62.
62.
628
.323
.932
.2
R4
Cen
tral H
ighl
ands
100.
010
0.0
100.
077
.481
.074
.01.
41.
11.
721
.217
.924
.3
R5
Sout
heas
t10
0.0
100.
010
0.0
66.1
74.1
58.9
2.1
2.1
2.1
31.8
23.8
39.0
R6
Mek
ong
Riv
er D
elta
100.
010
0.0
100.
070
.980
.062
.91.
91.
82.
027
.218
.235
.0
63 p
rovi
nces
/citi
es01
Ha
Noi
100.
010
0.0
100.
059
.562
.856
.32.
02.
12.
038
.535
.141
.7
02H
a G
iang
100.
010
0.0
100.
079
.879
.779
.81.
51.
91.
118
.718
.319
.0
04C
ao B
ang
100.
010
0.0
100.
078
.879
.078
.61.
82.
01.
619
.419
.019
.8
06B
ac K
an10
0.0
100.
010
0.0
78.3
77.9
78.7
2.0
2.3
1.6
19.7
19.8
19.6
08Tu
yen
Qua
ng10
0.0
100.
010
0.0
72.0
74.5
69.8
2.7
2.8
2.5
25.3
22.7
27.7
10La
o C
ai10
0.0
100.
010
0.0
76.9
79.5
74.7
1.4
1.5
1.4
21.6
19.0
24.0
11D
ien
Bie
n 10
0.0
100.
010
0.0
76.4
78.0
74.8
1.3
1.5
1.1
22.2
20.5
24.0
12La
i Cha
u10
0.0
100.
010
0.0
86.1
86.6
85.4
1.0
0.9
1.2
12.9
12.5
13.4
14So
n La
100.
010
0.0
100.
078
.078
.477
.61.
41.
21.
620
.620
.420
.8
15Y
en B
ai10
0.0
100.
010
0.0
74.3
77.4
71.5
1.5
1.6
1.5
24.2
20.9
27.0
17H
oa B
inh
100.
010
0.0
100.
074
.176
.971
.71.
20.
81.
524
.722
.226
.8
19Th
ai N
guye
n10
0.0
100.
010
0.0
68.3
71.1
66.0
1.5
1.4
1.5
30.2
27.5
32.4
20La
ng S
on10
0.0
100.
010
0.0
74.1
74.8
73.5
1.7
2.6
0.8
24.3
22.6
25.7
22Q
uang
Nin
h10
0.0
100.
010
0.0
69.4
74.6
63.8
1.5
1.5
1.4
29.1
23.9
34.8
24B
ac G
iang
100.
010
0.0
100.
069
.970
.968
.93.
03.
72.
427
.125
.428
.7
69
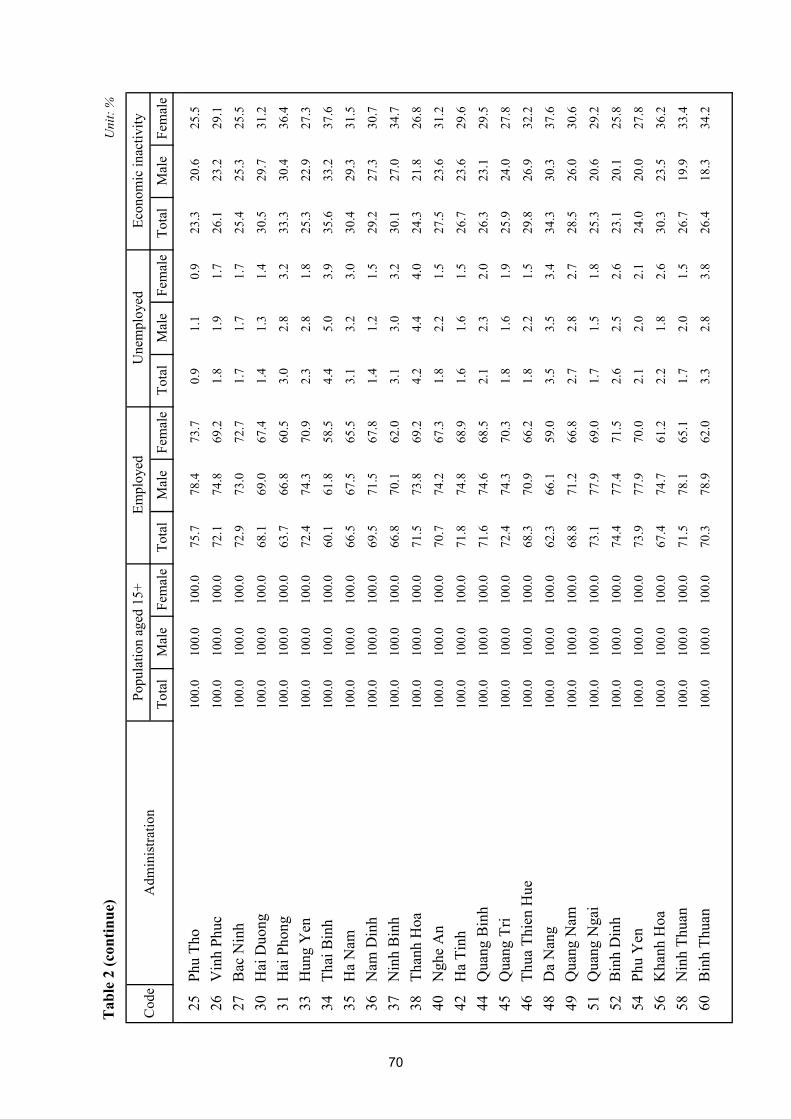
Tab
le 2
(con
tinue
)
Tota
lM
ale
Fem
ale
Tota
lM
ale
Fem
ale
Tota
lM
ale
Fem
ale
Tota
lM
ale
Fem
ale
Une
mpl
oyed
Econ
omic
inac
tivity
Uni
t: %
Cod
eA
dmin
istra
tion
Popu
latio
n ag
ed 1
5+Em
ploy
ed
25Ph
u Th
o10
0.0
100.
010
0.0
75.7
78.4
73.7
0.9
1.1
0.9
23.3
20.6
25.5
26V
inh
Phuc
100.
010
0.0
100.
072
.174
.869
.21.
81.
91.
726
.123
.229
.1
27B
ac N
inh
100.
010
0.0
100.
072
.973
.072
.71.
71.
71.
725
.425
.325
.5
30H
ai D
uong
100.
010
0.0
100.
068
.169
.067
.41.
41.
31.
430
.529
.731
.2
31H
ai P
hong
100.
010
0.0
100.
063
.766
.860
.53.
02.
83.
233
.330
.436
.4
33H
ung
Yen
100.
010
0.0
100.
072
.474
.370
.92.
32.
81.
825
.322
.927
.3
34Th
ai B
inh
100.
010
0.0
100.
060
.161
.858
.54.
45.
03.
935
.633
.237
.6
35H
a N
am10
0.0
100.
010
0.0
66.5
67.5
65.5
3.1
3.2
3.0
30.4
29.3
31.5
36N
am D
inh
100.
010
0.0
100.
069
.571
.567
.81.
41.
21.
529
.227
.330
.7
37N
inh
Bin
h10
0.0
100.
010
0.0
66.8
70.1
62.0
3.1
3.0
3.2
30.1
27.0
34.7
38Th
anh
Hoa
100.
010
0.0
100.
071
.573
.869
.24.
24.
44.
024
.321
.826
.8
40N
ghe
An
100.
010
0.0
100.
070
.774
.267
.31.
82.
21.
527
.523
.631
.2
42H
a Ti
nh10
0.0
100.
010
0.0
71.8
74.8
68.9
1.6
1.6
1.5
26.7
23.6
29.6
44Q
uang
Bin
h10
0.0
100.
010
0.0
71.6
74.6
68.5
2.1
2.3
2.0
26.3
23.1
29.5
45Q
uang
Tri
100.
010
0.0
100.
072
.474
.370
.31.
81.
61.
925
.924
.027
.8
46Th
ua T
hien
Hue
100.
010
0.0
100.
068
.370
.966
.21.
82.
21.
529
.826
.932
.2
48D
a N
ang
100.
010
0.0
100.
062
.366
.159
.03.
53.
53.
434
.330
.337
.6
49Q
uang
Nam
100.
010
0.0
100.
068
.871
.266
.82.
72.
82.
728
.526
.030
.6
51Q
uang
Nga
i10
0.0
100.
010
0.0
73.1
77.9
69.0
1.7
1.5
1.8
25.3
20.6
29.2
52B
inh
Din
h10
0.0
100.
010
0.0
74.4
77.4
71.5
2.6
2.5
2.6
23.1
20.1
25.8
54Ph
u Y
en10
0.0
100.
010
0.0
73.9
77.9
70.0
2.1
2.0
2.1
24.0
20.0
27.8
56K
hanh
Hoa
100.
010
0.0
100.
067
.474
.761
.22.
21.
82.
630
.323
.536
.2
58N
inh
Thua
n10
0.0
100.
010
0.0
71.5
78.1
65.1
1.7
2.0
1.5
26.7
19.9
33.4
60B
inh
Thua
n10
0.0
100.
010
0.0
70.3
78.9
62.0
3.3
2.8
3.8
26.4
18.3
34.2
70
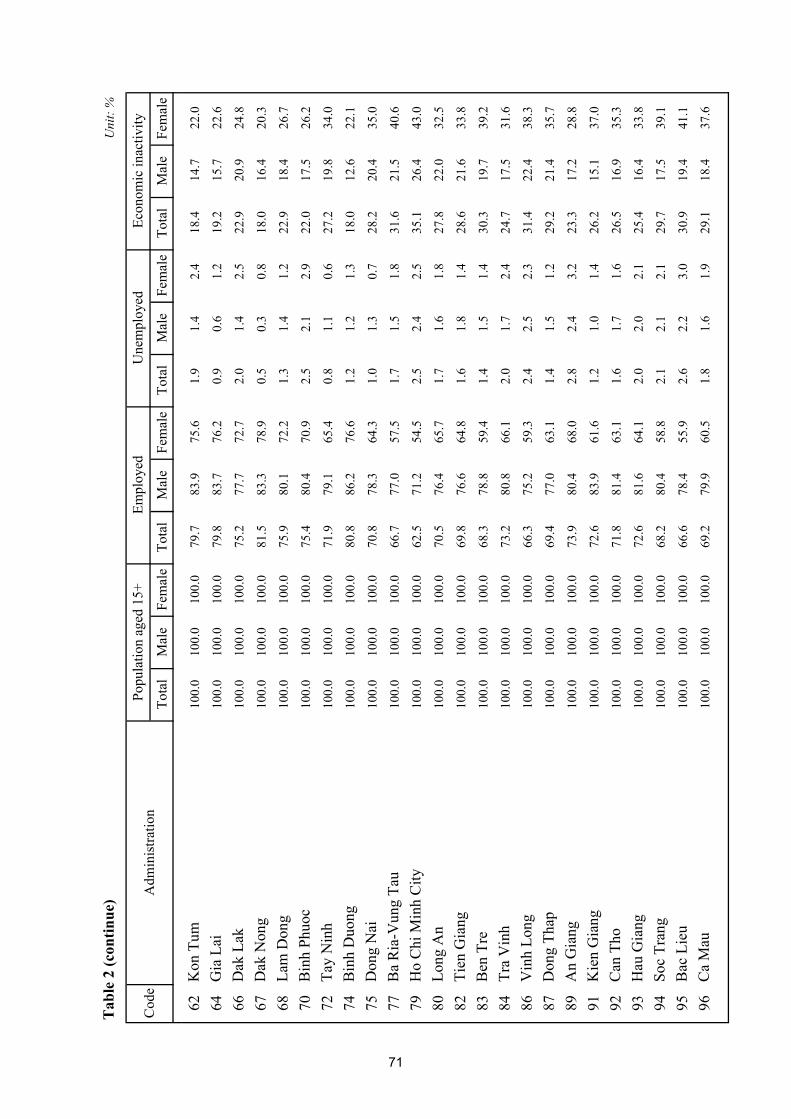
Tab
le 2
(con
tinue
)
Tota
lM
ale
Fem
ale
Tota
lM
ale
Fem
ale
Tota
lM
ale
Fem
ale
Tota
lM
ale
Fem
ale
Une
mpl
oyed
Econ
omic
inac
tivity
Uni
t: %
Cod
eA
dmin
istra
tion
Popu
latio
n ag
ed 1
5+Em
ploy
ed
62K
on T
um10
0.0
100.
010
0.0
79.7
83.9
75.6
1.9
1.4
2.4
18.4
14.7
22.0
64G
ia L
ai10
0.0
100.
010
0.0
79.8
83.7
76.2
0.9
0.6
1.2
19.2
15.7
22.6
66D
ak L
ak10
0.0
100.
010
0.0
75.2
77.7
72.7
2.0
1.4
2.5
22.9
20.9
24.8
67D
ak N
ong
100.
010
0.0
100.
081
.583
.378
.90.
50.
30.
818
.016
.420
.3
68La
m D
ong
100.
010
0.0
100.
075
.980
.172
.21.
31.
41.
222
.918
.426
.7
70B
inh
Phuo
c10
0.0
100.
010
0.0
75.4
80.4
70.9
2.5
2.1
2.9
22.0
17.5
26.2
72Ta
y N
inh
100.
010
0.0
100.
071
.979
.165
.40.
81.
10.
627
.219
.834
.0
74B
inh
Duo
ng10
0.0
100.
010
0.0
80.8
86.2
76.6
1.2
1.2
1.3
18.0
12.6
22.1
75D
ong
Nai
100.
010
0.0
100.
070
.878
.364
.31.
01.
30.
728
.220
.435
.0
77B
a R
ia-V
ung
Tau
100.
010
0.0
100.
066
.777
.057
.51.
71.
51.
831
.621
.540
.6
79H
o C
hi M
inh
City
100.
010
0.0
100.
062
.571
.254
.52.
52.
42.
535
.126
.443
.0
80Lo
ng A
n10
0.0
100.
010
0.0
70.5
76.4
65.7
1.7
1.6
1.8
27.8
22.0
32.5
82Ti
en G
iang
100.
010
0.0
100.
069
.876
.664
.81.
61.
81.
428
.621
.633
.8
83B
en T
re10
0.0
100.
010
0.0
68.3
78.8
59.4
1.4
1.5
1.4
30.3
19.7
39.2
84Tr
a V
inh
100.
010
0.0
100.
073
.280
.866
.12.
01.
72.
424
.717
.531
.6
86V
inh
Long
100.
010
0.0
100.
066
.375
.259
.32.
42.
52.
331
.422
.438
.3
87D
ong
Thap
100.
010
0.0
100.
069
.477
.063
.11.
41.
51.
229
.221
.435
.7
89A
n G
iang
100.
010
0.0
100.
073
.980
.468
.02.
82.
43.
223
.317
.228
.8
91K
ien
Gia
ng10
0.0
100.
010
0.0
72.6
83.9
61.6
1.2
1.0
1.4
26.2
15.1
37.0
92C
an T
ho10
0.0
100.
010
0.0
71.8
81.4
63.1
1.6
1.7
1.6
26.5
16.9
35.3
93H
au G
iang
100.
010
0.0
100.
072
.681
.664
.12.
02.
02.
125
.416
.433
.8
94So
c Tr
ang
100.
010
0.0
100.
068
.280
.458
.82.
12.
12.
129
.717
.539
.1
95B
ac L
ieu
100.
010
0.0
100.
066
.678
.455
.92.
62.
23.
030
.919
.441
.1
96C
a M
au10
0.0
100.
010
0.0
69.2
79.9
60.5
1.8
1.6
1.9
29.1
18.4
37.6
71

Tab
le 2
(con
tinue
)
Tota
lM
ale
Fem
ale
Tota
lM
ale
Fem
ale
Tota
lM
ale
Fem
ale
Tota
lM
ale
Fem
ale
Une
mpl
oyed
Econ
omic
inac
tivity
Uni
t: %
Cod
eA
dmin
istra
tion
Popu
latio
n ag
ed 1
5+Em
ploy
ed
RU
RA
L10
0.0
100.
010
0.0
79.3
83.3
75.5
1.0
0.9
1.1
19.7
15.8
23.4
Soci
o-ec
onom
ic r
egio
nsR
1N
orth
ern
Mid
land
s and
Mou
ntai
ns10
0.0
100.
010
0.0
86.0
87.4
84.5
0.4
0.4
0.3
13.7
12.2
15.2
R2
Red
Riv
er D
elta
100.
010
0.0
100.
077
.178
.875
.50.
81.
00.
722
.120
.223
.8
R3
Nor
th a
nd S
outh
Cen
tral C
oast
100.
010
0.0
100.
079
.281
.776
.81.
11.
11.
119
.717
.222
.0
R4
Cen
tral H
ighl
ands
100.
010
0.0
100.
083
.786
.580
.81.
00.
71.
315
.212
.717
.9
R5
Sout
heas
t10
0.0
100.
010
0.0
75.6
83.1
68.7
1.2
1.2
1.3
23.2
15.7
30.1
R6
Mek
ong
Riv
er D
elta
100.
010
0.0
100.
077
.685
.969
.31.
40.
72.
021
.013
.328
.7
63 p
rovi
nces
/citi
es01
Ha
Noi
100.
010
0.0
100.
076
.078
.273
.90.
80.
90.
823
.220
.925
.4
02H
a G
iang
100.
010
0.0
100.
090
.291
.089
.40.
20.
20.
19.
78.
810
.5
04C
ao B
ang
100.
010
0.0
100.
087
.588
.586
.50.
30.
30.
212
.311
.213
.3
06B
ac K
an10
0.0
100.
010
0.0
87.8
89.9
85.6
0.1
0.1
0.2
12.0
10.0
14.2
08Tu
yen
Qua
ng10
0.0
100.
010
0.0
84.5
85.1
84.0
0.8
0.7
0.9
14.6
14.1
15.1
10La
o C
ai10
0.0
100.
010
0.0
88.9
89.3
88.4
0.2
0.3
0.1
10.9
10.4
11.5
11D
ien
Bie
n 10
0.0
100.
010
0.0
87.2
87.7
86.8
0.3
0.4
0.3
12.4
12.0
12.9
12La
i Cha
u10
0.0
100.
010
0.0
90.6
91.1
90.1
0.1
0.1
0.0
9.3
8.8
9.8
14So
n La
100.
010
0.0
100.
088
.689
.687
.60.
10.
10.
211
.310
.412
.2
15Y
en B
ai10
0.0
100.
010
0.0
88.3
89.4
87.1
0.1
0.1
0.2
11.6
10.5
12.7
17H
oa B
inh
100.
010
0.0
100.
088
.389
.487
.30.
20.
30.
111
.510
.312
.6
19Th
ai N
guye
n10
0.0
100.
010
0.0
82.6
85.1
80.1
0.9
0.9
0.8
16.5
13.9
19.1
20La
ng S
on10
0.0
100.
010
0.0
84.9
89.0
80.8
0.5
0.5
0.5
14.5
10.5
18.7
22Q
uang
Nin
h10
0.0
100.
010
0.0
83.7
85.8
81.6
0.5
0.4
0.6
15.8
13.7
17.8
24B
ac G
iang
100.
010
0.0
100.
082
.684
.181
.30.
20.
50.
017
.215
.518
.7
72

Tab
le 2
(con
tinue
)
Tota
lM
ale
Fem
ale
Tota
lM
ale
Fem
ale
Tota
lM
ale
Fem
ale
Tota
lM
ale
Fem
ale
Une
mpl
oyed
Econ
omic
inac
tivity
Uni
t: %
Cod
eA
dmin
istra
tion
Popu
latio
n ag
ed 1
5+Em
ploy
ed
25Ph
u Th
o10
0.0
100.
010
0.0
83.2
85.0
81.5
0.5
0.5
0.4
16.3
14.5
18.1
26V
inh
Phuc
100.
010
0.0
100.
078
.680
.676
.80.
50.
30.
720
.919
.222
.5
27B
ac N
inh
100.
010
0.0
100.
078
.077
.178
.91.
01.
11.
020
.921
.920
.1
30H
ai D
uong
100.
010
0.0
100.
080
.281
.778
.70.
50.
90.
219
.317
.421
.0
31H
ai P
hong
100.
010
0.0
100.
074
.375
.373
.42.
12.
71.
723
.622
.124
.9
33H
ung
Yen
100.
010
0.0
100.
076
.979
.075
.10.
91.
00.
922
.120
.024
.1
34Th
ai B
inh
100.
010
0.0
100.
076
.578
.574
.70.
60.
90.
422
.920
.724
.9
35H
a N
am10
0.0
100.
010
0.0
73.8
75.6
72.2
0.7
0.6
0.9
25.4
23.8
26.9
36N
am D
inh
100.
010
0.0
100.
077
.378
.576
.20.
81.
10.
421
.920
.423
.4
37N
inh
Bin
h10
0.0
100.
010
0.0
78.2
80.4
76.5
0.8
1.0
0.7
21.0
18.7
22.9
38Th
anh
Hoa
100.
010
0.0
100.
081
.783
.480
.11.
20.
91.
417
.215
.718
.5
40N
ghe
An
100.
010
0.0
100.
080
.982
.979
.00.
60.
80.
418
.516
.320
.6
42H
a Ti
nh10
0.0
100.
010
0.0
75.6
76.7
74.7
0.7
0.7
0.6
23.7
22.6
24.7
44Q
uang
Bin
h10
0.0
100.
010
0.0
78.3
80.7
75.9
0.8
0.9
0.7
20.9
18.4
23.4
45Q
uang
Tri
100.
010
0.0
100.
076
.078
.373
.81.
21.
60.
822
.820
.125
.4
46Th
ua T
hien
Hue
100.
010
0.0
100.
075
.077
.472
.21.
01.
40.
623
.921
.227
.2
48D
a N
ang
100.
010
0.0
100.
074
.676
.971
.42.
12.
22.
023
.220
.926
.6
49Q
uang
Nam
100.
010
0.0
100.
075
.576
.874
.21.
82.
41.
222
.820
.824
.7
51Q
uang
Nga
i10
0.0
100.
010
0.0
77.9
80.7
75.2
0.9
0.8
1.1
21.2
18.5
23.7
52B
inh
Din
h10
0.0
100.
010
0.0
80.4
82.6
78.5
1.3
1.6
1.0
18.3
15.8
20.6
54Ph
u Y
en10
0.0
100.
010
0.0
82.2
87.0
77.3
0.4
0.2
0.6
17.4
12.8
22.1
56K
hanh
Hoa
100.
010
0.0
100.
077
.984
.371
.22.
61.
73.
619
.514
.125
.1
58N
inh
Thua
n10
0.0
100.
010
0.0
79.1
84.6
73.7
1.0
0.9
1.1
20.0
14.5
25.3
60B
inh
Thua
n10
0.0
100.
010
0.0
77.6
82.7
72.6
2.6
1.8
3.4
19.8
15.5
24.0
73
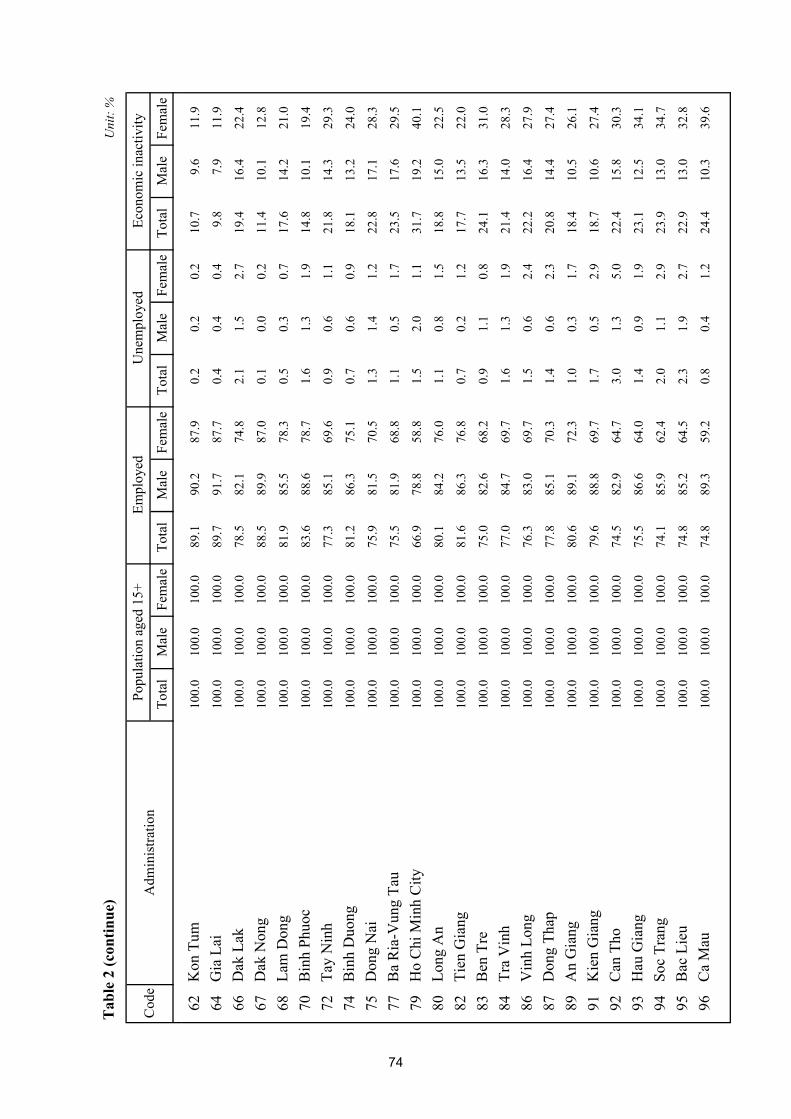
Tab
le 2
(con
tinue
)
Tota
lM
ale
Fem
ale
Tota
lM
ale
Fem
ale
Tota
lM
ale
Fem
ale
Tota
lM
ale
Fem
ale
Une
mpl
oyed
Econ
omic
inac
tivity
Uni
t: %
Cod
eA
dmin
istra
tion
Popu
latio
n ag
ed 1
5+Em
ploy
ed
62K
on T
um10
0.0
100.
010
0.0
89.1
90.2
87.9
0.2
0.2
0.2
10.7
9.6
11.9
64G
ia L
ai10
0.0
100.
010
0.0
89.7
91.7
87.7
0.4
0.4
0.4
9.8
7.9
11.9
66D
ak L
ak10
0.0
100.
010
0.0
78.5
82.1
74.8
2.1
1.5
2.7
19.4
16.4
22.4
67D
ak N
ong
100.
010
0.0
100.
088
.589
.987
.00.
10.
00.
211
.410
.112
.8
68La
m D
ong
100.
010
0.0
100.
081
.985
.578
.30.
50.
30.
717
.614
.221
.0
70B
inh
Phuo
c10
0.0
100.
010
0.0
83.6
88.6
78.7
1.6
1.3
1.9
14.8
10.1
19.4
72Ta
y N
inh
100.
010
0.0
100.
077
.385
.169
.60.
90.
61.
121
.814
.329
.3
74B
inh
Duo
ng10
0.0
100.
010
0.0
81.2
86.3
75.1
0.7
0.6
0.9
18.1
13.2
24.0
75D
ong
Nai
100.
010
0.0
100.
075
.981
.570
.51.
31.
41.
222
.817
.128
.3
77B
a R
ia-V
ung
Tau
100.
010
0.0
100.
075
.581
.968
.81.
10.
51.
723
.517
.629
.5
79H
o C
hi M
inh
City
100.
010
0.0
100.
066
.978
.858
.81.
52.
01.
131
.719
.240
.1
80Lo
ng A
n10
0.0
100.
010
0.0
80.1
84.2
76.0
1.1
0.8
1.5
18.8
15.0
22.5
82Ti
en G
iang
100.
010
0.0
100.
081
.686
.376
.80.
70.
21.
217
.713
.522
.0
83B
en T
re10
0.0
100.
010
0.0
75.0
82.6
68.2
0.9
1.1
0.8
24.1
16.3
31.0
84Tr
a V
inh
100.
010
0.0
100.
077
.084
.769
.71.
61.
31.
921
.414
.028
.3
86V
inh
Long
100.
010
0.0
100.
076
.383
.069
.71.
50.
62.
422
.216
.427
.9
87D
ong
Thap
100.
010
0.0
100.
077
.885
.170
.31.
40.
62.
320
.814
.427
.4
89A
n G
iang
100.
010
0.0
100.
080
.689
.172
.31.
00.
31.
718
.410
.526
.1
91K
ien
Gia
ng10
0.0
100.
010
0.0
79.6
88.8
69.7
1.7
0.5
2.9
18.7
10.6
27.4
92C
an T
ho10
0.0
100.
010
0.0
74.5
82.9
64.7
3.0
1.3
5.0
22.4
15.8
30.3
93H
au G
iang
100.
010
0.0
100.
075
.586
.664
.01.
40.
91.
923
.112
.534
.1
94So
c Tr
ang
100.
010
0.0
100.
074
.185
.962
.42.
01.
12.
923
.913
.034
.7
95B
ac L
ieu
100.
010
0.0
100.
074
.885
.264
.52.
31.
92.
722
.913
.032
.8
96C
a M
au10
0.0
100.
010
0.0
74.8
89.3
59.2
0.8
0.4
1.2
24.4
10.3
39.6
74
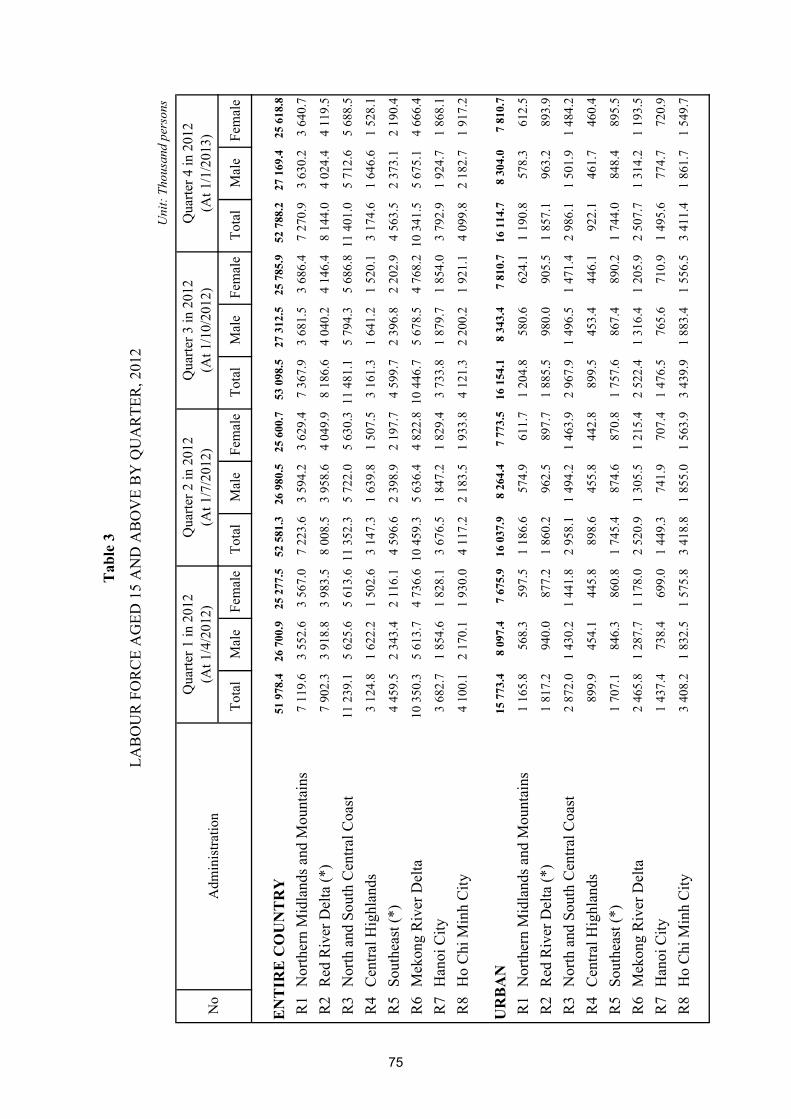
Tota
lM
ale
Fem
ale
Tota
lM
ale
Fem
ale
Tota
lM
ale
Fem
ale
Tota
lM
ale
Fem
ale
EN
TIR
E C
OU
NT
RY
51 9
78.4
26 7
00.9
25 2
77.5
52 5
81.3
26 9
80.5
25 6
00.7
53 0
98.5
27 3
12.5
25 7
85.9
52 7
88.2
27 1
69.4
25 6
18.8
R1
Nor
ther
n M
idla
nds a
nd M
ount
ains
7 11
9.6
3 55
2.6
3 56
7.0
7 22
3.6
3 59
4.2
3 62
9.4
7 36
7.9
3 68
1.5
3 68
6.4
7 27
0.9
3 63
0.2
3 64
0.7
R2
Red
Riv
er D
elta
(*)
7 90
2.3
3 91
8.8
3 98
3.5
8 00
8.5
3 95
8.6
4 04
9.9
8 18
6.6
4 04
0.2
4 14
6.4
8 14
4.0
4 02
4.4
4 11
9.5
R3
Nor
th a
nd S
outh
Cen
tral C
oast
11 2
39.1
5 62
5.6
5 61
3.6
11 3
52.3
5 72
2.0
5 63
0.3
11 4
81.1
5 79
4.3
5 68
6.8
11 4
01.0
5 71
2.6
5 68
8.5
R4
Cen
tral H
ighl
ands
3 12
4.8
1 62
2.2
1 50
2.6
3 14
7.3
1 63
9.8
1 50
7.5
3 16
1.3
1 64
1.2
1 52
0.1
3 17
4.6
1 64
6.6
1 52
8.1
R5
Sout
heas
t (*)
4 45
9.5
2 34
3.4
2 11
6.1
4 59
6.6
2 39
8.9
2 19
7.7
4 59
9.7
2 39
6.8
2 20
2.9
4 56
3.5
2 37
3.1
2 19
0.4
R6
Mek
ong
Riv
er D
elta
10 3
50.3
5 61
3.7
4 73
6.6
10 4
59.3
5 63
6.4
4 82
2.8
10 4
46.7
5 67
8.5
4 76
8.2
10 3
41.5
5 67
5.1
4 66
6.4
R7
Han
oi C
ity3
682.
71
854.
61
828.
13
676.
51
847.
21
829.
43
733.
81
879.
71
854.
03
792.
91
924.
71
868.
1
R8
Ho
Chi
Min
h C
ity4
100.
12
170.
11
930.
04
117.
22
183.
51
933.
84
121.
32
200.
21
921.
14
099.
82
182.
71
917.
2
UR
BA
N15
773
.48
097.
47
675.
916
037
.98
264.
47
773.
516
154
.18
343.
47
810.
716
114
.78
304.
07
810.
7
R1
Nor
ther
n M
idla
nds a
nd M
ount
ains
1 16
5.8
568.
359
7.5
1 18
6.6
574.
961
1.7
1 20
4.8
580.
662
4.1
1 19
0.8
578.
361
2.5
R2
Red
Riv
er D
elta
(*)
1 81
7.2
940.
087
7.2
1 86
0.2
962.
589
7.7
1 88
5.5
980.
090
5.5
1 85
7.1
963.
289
3.9
R3
Nor
th a
nd S
outh
Cen
tral C
oast
2 87
2.0
1 43
0.2
1 44
1.8
2 95
8.1
1 49
4.2
1 46
3.9
2 96
7.9
1 49
6.5
1 47
1.4
2 98
6.1
1 50
1.9
1 48
4.2
R4
Cen
tral H
ighl
ands
899.
945
4.1
445.
889
8.6
455.
844
2.8
899.
545
3.4
446.
192
2.1
461.
746
0.4
R5
Sout
heas
t (*)
1 70
7.1
846.
386
0.8
1 74
5.4
874.
687
0.8
1 75
7.6
867.
489
0.2
1 74
4.0
848.
489
5.5
R6
Mek
ong
Riv
er D
elta
2 46
5.8
1 28
7.7
1 17
8.0
2 52
0.9
1 30
5.5
1 21
5.4
2 52
2.4
1 31
6.4
1 20
5.9
2 50
7.7
1 31
4.2
1 19
3.5
R7
Han
oi C
ity1
437.
473
8.4
699.
01
449.
374
1.9
707.
41
476.
576
5.6
710.
91
495.
677
4.7
720.
9
R8
Ho
Chi
Min
h C
ity3
408.
21
832.
51
575.
83
418.
81
855.
01
563.
93
439.
91
883.
41
556.
53
411.
41
861.
71
549.
7
Tab
le 3
LAB
OU
R F
OR
CE
AG
ED 1
5 A
ND
AB
OV
E B
Y Q
UA
RTE
R, 2
012
Uni
t: Th
ousa
nd p
erso
ns
No
Adm
inis
tratio
n
Qua
rter 1
in 2
012
(At 1
/4/2
012)
Qua
rter 4
in 2
012
(At 1
/1/2
013)
Qua
rter 2
in 2
012
(At 1
/7/2
012)
Qua
rter 3
in 2
012
(At 1
/10/
2012
)
75
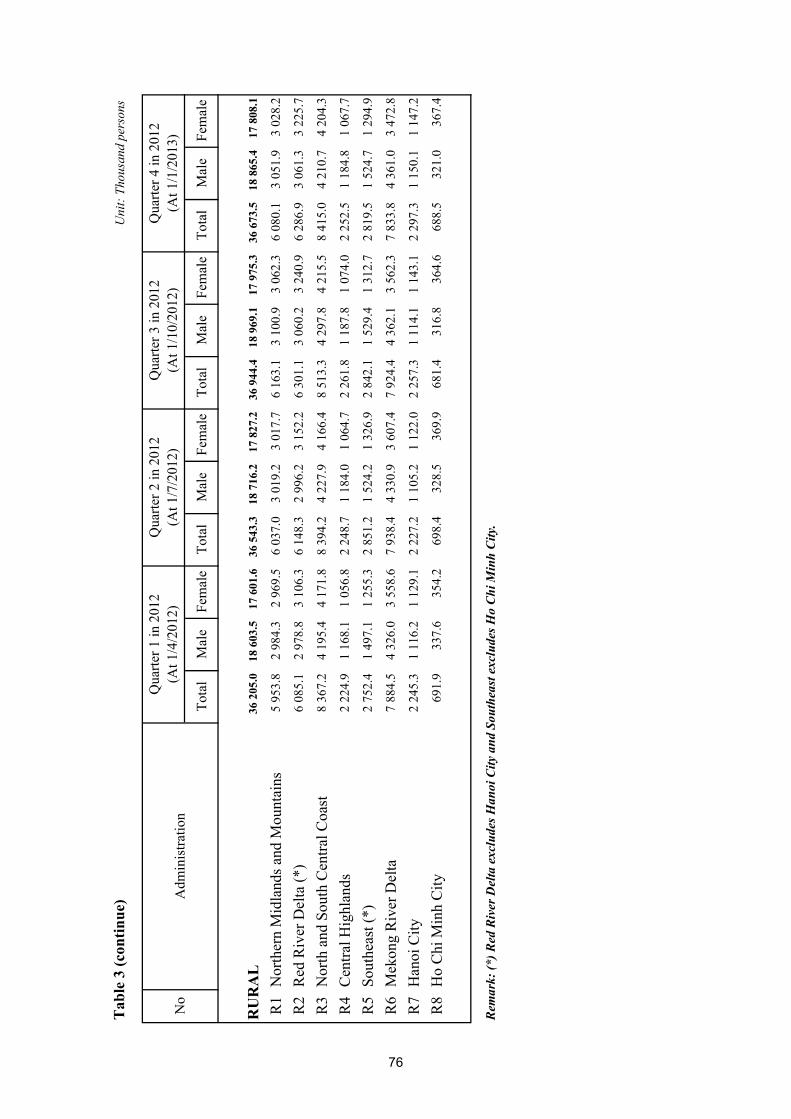
Tab
le 3
(con
tinue
)
Tota
lM
ale
Fem
ale
Tota
lM
ale
Fem
ale
Tota
lM
ale
Fem
ale
Tota
lM
ale
Fem
ale
RU
RA
L36
205
.018
603
.517
601
.636
543
.318
716
.217
827
.236
944
.418
969
.117
975
.336
673
.518
865
.417
808
.1
R1
Nor
ther
n M
idla
nds a
nd M
ount
ains
5 95
3.8
2 98
4.3
2 96
9.5
6 03
7.0
3 01
9.2
3 01
7.7
6 16
3.1
3 10
0.9
3 06
2.3
6 08
0.1
3 05
1.9
3 02
8.2
R2
Red
Riv
er D
elta
(*)
6 08
5.1
2 97
8.8
3 10
6.3
6 14
8.3
2 99
6.2
3 15
2.2
6 30
1.1
3 06
0.2
3 24
0.9
6 28
6.9
3 06
1.3
3 22
5.7
R3
Nor
th a
nd S
outh
Cen
tral C
oast
8 36
7.2
4 19
5.4
4 17
1.8
8 39
4.2
4 22
7.9
4 16
6.4
8 51
3.3
4 29
7.8
4 21
5.5
8 41
5.0
4 21
0.7
4 20
4.3
R4
Cen
tral H
ighl
ands
2 22
4.9
1 16
8.1
1 05
6.8
2 24
8.7
1 18
4.0
1 06
4.7
2 26
1.8
1 18
7.8
1 07
4.0
2 25
2.5
1 18
4.8
1 06
7.7
R5
Sout
heas
t (*)
2 75
2.4
1 49
7.1
1 25
5.3
2 85
1.2
1 52
4.2
1 32
6.9
2 84
2.1
1 52
9.4
1 31
2.7
2 81
9.5
1 52
4.7
1 29
4.9
R6
Mek
ong
Riv
er D
elta
7 88
4.5
4 32
6.0
3 55
8.6
7 93
8.4
4 33
0.9
3 60
7.4
7 92
4.4
4 36
2.1
3 56
2.3
7 83
3.8
4 36
1.0
3 47
2.8
R7
Han
oi C
ity2
245.
31
116.
21
129.
12
227.
21
105.
21
122.
02
257.
31
114.
11
143.
12
297.
31
150.
11
147.
2
R8
Ho
Chi
Min
h C
ity69
1.9
337.
635
4.2
698.
432
8.5
369.
968
1.4
316.
836
4.6
688.
532
1.0
367.
4
Rem
ark:
(*) R
ed R
iver
Del
ta e
xclu
des H
anoi
City
and
Sou
thea
st e
xclu
des H
o C
hi M
inh
City
.
Uni
t: Th
ousa
nd p
erso
ns
No
Adm
inis
tratio
n
Qua
rter 1
in 2
012
(At 1
/4/2
012)
Qua
rter 2
in 2
012
(At 1
/7/2
012)
Qua
rter 3
in 2
012
(At 1
/10/
2012
)Q
uarte
r 4 in
201
2(A
t 1/1
/201
3)
76
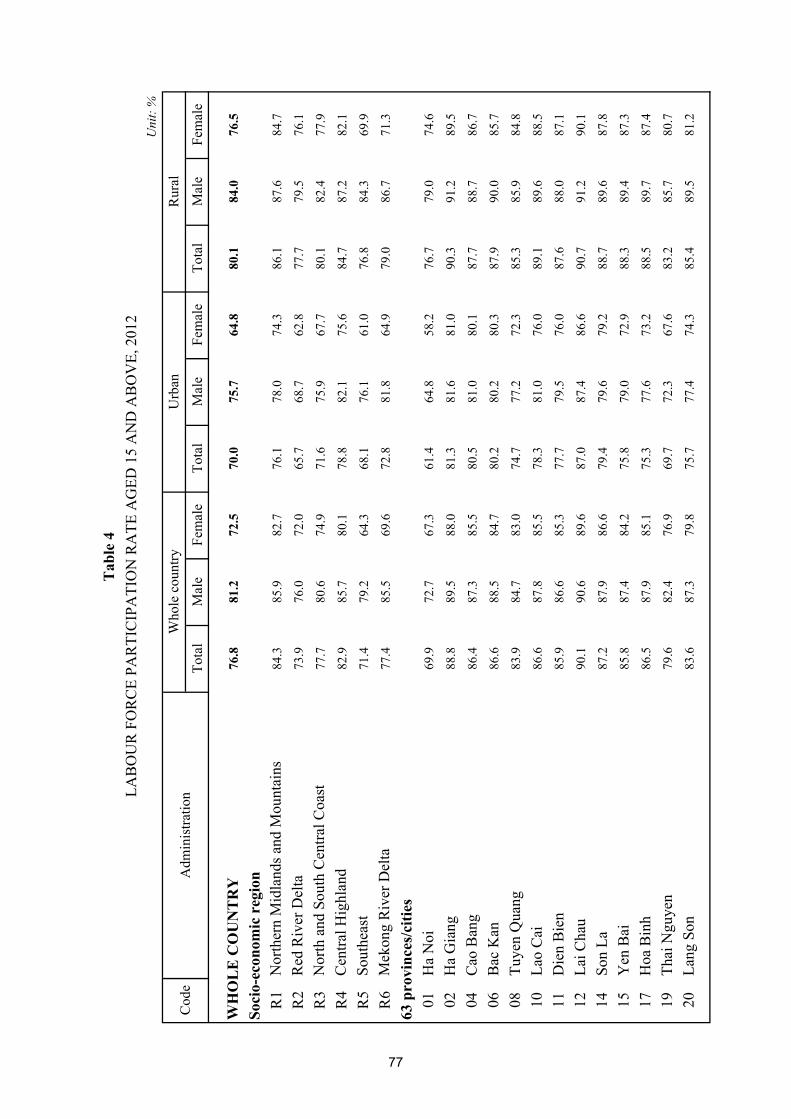
Tota
lM
ale
Fem
ale
Tota
lM
ale
Fem
ale
Tota
lM
ale
Fem
ale
WH
OL
E C
OU
NT
RY
76.8
81.2
72.5
70.0
75.7
64.8
80.1
84.0
76.5
Soci
o-ec
onom
ic r
egio
nR
1N
orth
ern
Mid
land
s and
Mou
ntai
ns84
.385
.982
.776
.178
.074
.386
.187
.684
.7
R2
Red
Riv
er D
elta
73.9
76.0
72.0
65.7
68.7
62.8
77.7
79.5
76.1
R3
Nor
th a
nd S
outh
Cen
tral C
oast
77.7
80.6
74.9
71.6
75.9
67.7
80.1
82.4
77.9
R4
Cen
tral H
ighl
and
82.9
85.7
80.1
78.8
82.1
75.6
84.7
87.2
82.1
R5
Sout
heas
t71
.479
.264
.368
.176
.161
.076
.884
.369
.9
R6
Mek
ong
Riv
er D
elta
77.4
85.5
69.6
72.8
81.8
64.9
79.0
86.7
71.3
63 p
rovi
nces
/citi
es01
Ha
Noi
69.9
72.7
67.3
61.4
64.8
58.2
76.7
79.0
74.6
02H
a G
iang
88.8
89.5
88.0
81.3
81.6
81.0
90.3
91.2
89.5
04C
ao B
ang
86.4
87.3
85.5
80.5
81.0
80.1
87.7
88.7
86.7
06B
ac K
an86
.688
.584
.780
.280
.280
.387
.990
.085
.7
08Tu
yen
Qua
ng83
.984
.783
.074
.777
.272
.385
.385
.984
.8
10La
o C
ai86
.687
.885
.578
.381
.076
.089
.189
.688
.5
11D
ien
Bie
n 85
.986
.685
.377
.779
.576
.087
.688
.087
.1
12La
i Cha
u90
.190
.689
.687
.087
.486
.690
.791
.290
.1
14So
n La
87.2
87.9
86.6
79.4
79.6
79.2
88.7
89.6
87.8
15Y
en B
ai85
.887
.484
.275
.879
.072
.988
.389
.487
.3
17H
oa B
inh
86.5
87.9
85.1
75.3
77.6
73.2
88.5
89.7
87.4
19Th
ai N
guye
n79
.682
.476
.969
.772
.367
.683
.285
.780
.7
20La
ng S
on83
.687
.379
.875
.777
.474
.385
.489
.581
.2
Uni
t: %
Who
le c
ount
ryU
rban
Rur
al
Tab
le 4
LAB
OU
R F
OR
CE
PAR
TIC
IPA
TIO
N R
ATE
AG
ED 1
5 A
ND
AB
OV
E, 2
012
Cod
eA
dmin
istra
tion
77

Tab
le 4
(con
tinue
)
Tota
lM
ale
Fem
ale
Tota
lM
ale
Fem
ale
Tota
lM
ale
Fem
ale
22Q
uang
Nin
h77
.080
.773
.270
.876
.165
.284
.086
.182
.0
24B
ac G
iang
81.1
82.6
79.8
72.6
74.2
71.1
82.1
83.6
80.7
25Ph
u Th
o81
.883
.979
.876
.278
.774
.283
.685
.481
.8
26V
inh
Phuc
77.8
79.6
76.0
73.6
76.2
70.9
79.0
80.7
77.5
27B
ac N
inh
77.6
76.8
78.2
73.9
73.8
74.0
78.9
78.0
79.7
30H
ai D
uong
76.6
77.7
75.7
68.8
69.4
68.3
79.0
79.9
78.1
31H
ai P
hong
71.8
73.7
69.9
66.6
69.5
63.6
76.2
77.7
74.9
33H
ung
Yen
77.5
79.6
75.5
74.7
77.0
72.7
77.9
80.0
75.9
34Th
ai B
inh
75.7
78.0
73.7
64.4
66.8
62.4
77.1
79.3
75.0
35H
a N
am74
.075
.672
.669
.670
.768
.574
.676
.273
.0
36N
am D
inh
76.5
78.1
75.1
70.3
71.7
69.1
77.9
79.4
76.5
37N
inh
Bin
h76
.878
.875
.069
.772
.865
.278
.881
.076
.9
38Th
anh
Hoa
81.7
83.0
80.5
75.6
78.1
73.1
82.5
83.6
81.4
40N
ghe
An
79.9
82.2
77.7
71.3
74.9
67.8
81.3
83.4
79.3
42H
a Ti
nh74
.975
.973
.972
.374
.869
.975
.476
.174
.7
44Q
uang
Bin
h78
.280
.875
.673
.676
.870
.479
.081
.576
.6
45Q
uang
Tri
76.1
78.4
73.8
73.8
75.4
72.1
77.1
79.8
74.5
46Th
ua T
hien
Hue
72.2
75.4
69.3
70.1
73.0
67.7
75.9
78.6
72.6
48D
a N
ang
67.1
71.1
63.4
65.7
69.7
62.4
76.8
79.1
73.4
49Q
uang
Nam
76.0
78.1
74.0
71.5
73.9
69.4
77.2
79.1
75.3
51Q
uang
Nga
i78
.281
.175
.474
.779
.370
.878
.881
.576
.3
52B
inh
Din
h80
.282
.877
.976
.979
.974
.181
.583
.979
.4
54Ph
u Y
en81
.185
.576
.576
.080
.072
.182
.687
.277
.9
56K
hanh
Hoa
74.4
80.8
68.3
69.6
76.4
63.8
80.5
85.9
74.9
58N
inh
Thua
n77
.583
.571
.773
.380
.166
.680
.085
.574
.7
Rur
al
Uni
t: %
Cod
eA
dmin
istra
tion
Who
le c
ount
ryU
rban
78

Tab
le 4
(con
tinue
)
Tota
lM
ale
Fem
ale
Tota
lM
ale
Fem
ale
Tota
lM
ale
Fem
ale
Rur
al
Uni
t: %
Cod
eA
dmin
istra
tion
Who
le c
ount
ryU
rban
60B
inh
Thua
n77
.583
.471
.973
.681
.765
.880
.284
.576
.0
62K
on T
um86
.388
.483
.981
.585
.178
.089
.390
.388
.0
64G
ia L
ai87
.189
.684
.580
.784
.377
.490
.192
.088
.1
66D
ak L
ak79
.782
.576
.977
.179
.075
.280
.683
.677
.5
67D
ak N
ong
87.4
88.6
86.0
81.9
83.5
79.5
88.4
89.7
87.0
68La
m D
ong
80.3
84.2
76.7
77.1
81.6
73.3
82.4
85.8
79.0
70B
inh
Phuo
c84
.088
.779
.477
.982
.573
.785
.289
.980
.6
72Ta
y N
inh
77.3
84.8
69.9
72.8
80.2
66.0
78.1
85.7
70.7
74B
inh
Duo
ng82
.087
.277
.382
.087
.477
.981
.886
.876
.0
75D
ong
Nai
75.3
81.8
69.3
71.7
79.5
65.0
77.2
82.9
71.6
77B
a R
ia-V
ung
Tau
72.4
80.5
64.7
68.4
78.5
59.3
76.5
82.4
70.5
79H
o C
hi M
inh
City
65.4
74.5
57.4
64.9
73.5
56.9
68.3
80.8
59.9
80Lo
ng A
n79
.583
.875
.472
.278
.067
.581
.285
.077
.4
82Ti
en G
iang
80.3
85.2
75.5
71.4
78.4
66.2
82.3
86.5
78.0
83B
en T
re75
.383
.368
.269
.680
.060
.875
.983
.769
.0
84Tr
a V
inh
78.1
85.4
71.1
75.2
82.5
68.4
78.6
86.0
71.7
86V
inh
Long
76.3
82.8
70.3
68.6
77.6
61.7
77.8
83.6
72.1
87D
ong
Thap
77.7
84.4
71.0
70.8
78.5
64.3
79.2
85.6
72.6
89A
n G
iang
80.0
87.3
73.0
76.7
82.8
71.2
81.6
89.5
73.9
91K
ien
Gia
ng79
.288
.269
.973
.884
.963
.081
.389
.472
.6
92C
an T
ho74
.883
.466
.273
.483
.164
.777
.584
.069
.7
93H
au G
iang
76.3
86.5
66.0
74.6
83.6
66.2
76.9
87.5
65.9
94So
c Tr
ang
74.2
85.6
63.8
70.2
82.4
60.9
76.0
86.9
65.3
95B
ac L
ieu
74.9
85.3
64.9
69.1
80.6
58.9
77.1
87.0
67.2
96C
a M
au74
.688
.260
.970
.981
.662
.375
.689
.760
.4
79

Total Male Female Total Male Female Total Male Female
ENTIRE COUNTRY
Total 100.0 100.0 100.0 100.0 100.0 100.0 100.0 100.0 100.0
15-19 5.2 5.7 4.6 3.2 3.4 3.0 6.0 6.7 5.2
20-24 9.9 10.4 9.4 9.2 8.7 9.7 10.2 11.1 9.3
25-29 12.3 12.4 12.2 13.8 13.4 14.1 11.6 11.9 11.3
30-34 12.0 11.8 12.3 13.2 12.7 13.6 11.6 11.4 11.7
35-39 12.6 12.4 12.7 13.5 13.6 13.5 12.1 12.0 12.3
40-44 12.3 12.2 12.5 13.4 13.5 13.3 11.9 11.6 12.1
45-49 12.0 12.0 11.9 12.3 12.5 12.0 11.8 11.8 11.9
50-54 9.8 9.4 10.3 10.3 10.3 10.4 9.6 9.0 10.2
55-59 6.7 6.7 6.6 6.1 6.9 5.3 6.9 6.6 7.2
60-64 3.6 3.6 3.7 2.8 2.8 2.8 4.0 3.9 4.1
65+ 3.7 3.4 3.9 2.2 2.2 2.3 4.3 4.0 4.6
R1 Northern Midlands and MountainsTotal 100.0 100.0 100.0 100.0 100.0 100.0 100.0 100.0 100.0
15-19 7.0 7.6 6.4 2.3 2.7 1.8 7.9 8.5 7.4
20-24 11.7 12.6 10.8 7.6 7.7 7.5 12.5 13.5 11.5
25-29 13.1 13.2 13.0 12.5 12.3 12.7 13.3 13.4 13.1
30-34 11.9 12.0 11.8 12.5 12.1 12.9 11.8 11.9 11.6
35-39 12.3 12.2 12.4 13.5 13.3 13.7 12.1 12.0 12.1
40-44 10.8 10.5 11.1 12.5 12.1 12.9 10.4 10.2 10.7
45-49 11.1 11.0 11.1 13.1 13.0 13.3 10.7 10.6 10.7
50-54 9.4 9.1 9.7 12.9 13.3 12.6 8.7 8.3 9.2
55-59 5.7 5.6 5.9 6.7 7.6 6.0 5.6 5.2 5.9
60-64 3.2 3.0 3.5 3.4 3.3 3.5 3.2 2.9 3.5
65+ 3.7 3.3 4.1 2.9 2.7 3.1 3.9 3.5 4.3
Table 5AGE STRUCTURE OF LABOUR FORCE AGED 15 AND ABOVE, 2012
Age group/ Administration
Unit: %
Whole country Urban Rural
80
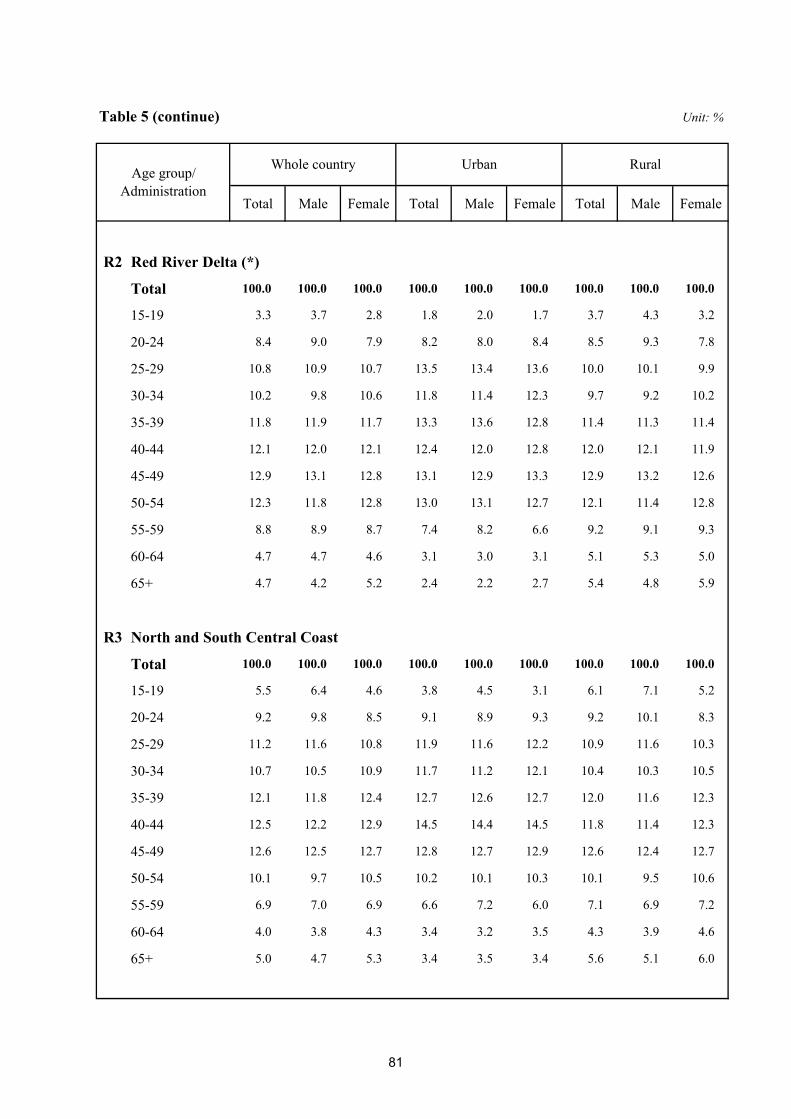
Table 5 (continue)
Total Male Female Total Male Female Total Male Female
R2 Red River Delta (*)
Total 100.0 100.0 100.0 100.0 100.0 100.0 100.0 100.0 100.0
15-19 3.3 3.7 2.8 1.8 2.0 1.7 3.7 4.3 3.2
20-24 8.4 9.0 7.9 8.2 8.0 8.4 8.5 9.3 7.8
25-29 10.8 10.9 10.7 13.5 13.4 13.6 10.0 10.1 9.9
30-34 10.2 9.8 10.6 11.8 11.4 12.3 9.7 9.2 10.2
35-39 11.8 11.9 11.7 13.3 13.6 12.8 11.4 11.3 11.4
40-44 12.1 12.0 12.1 12.4 12.0 12.8 12.0 12.1 11.9
45-49 12.9 13.1 12.8 13.1 12.9 13.3 12.9 13.2 12.6
50-54 12.3 11.8 12.8 13.0 13.1 12.7 12.1 11.4 12.8
55-59 8.8 8.9 8.7 7.4 8.2 6.6 9.2 9.1 9.3
60-64 4.7 4.7 4.6 3.1 3.0 3.1 5.1 5.3 5.0
65+ 4.7 4.2 5.2 2.4 2.2 2.7 5.4 4.8 5.9
R3 North and South Central Coast
Total 100.0 100.0 100.0 100.0 100.0 100.0 100.0 100.0 100.0
15-19 5.5 6.4 4.6 3.8 4.5 3.1 6.1 7.1 5.2
20-24 9.2 9.8 8.5 9.1 8.9 9.3 9.2 10.1 8.3
25-29 11.2 11.6 10.8 11.9 11.6 12.2 10.9 11.6 10.3
30-34 10.7 10.5 10.9 11.7 11.2 12.1 10.4 10.3 10.5
35-39 12.1 11.8 12.4 12.7 12.6 12.7 12.0 11.6 12.3
40-44 12.5 12.2 12.9 14.5 14.4 14.5 11.8 11.4 12.3
45-49 12.6 12.5 12.7 12.8 12.7 12.9 12.6 12.4 12.7
50-54 10.1 9.7 10.5 10.2 10.1 10.3 10.1 9.5 10.6
55-59 6.9 7.0 6.9 6.6 7.2 6.0 7.1 6.9 7.2
60-64 4.0 3.8 4.3 3.4 3.2 3.5 4.3 3.9 4.6
65+ 5.0 4.7 5.3 3.4 3.5 3.4 5.6 5.1 6.0
Rural
Unit: %
Whole country UrbanAge group/ Administration
81

Table 5 (continue)
Total Male Female Total Male Female Total Male Female
Rural
Unit: %
Whole country UrbanAge group/ Administration
R4 Central Highlands
Total 100.0 100.0 100.0 100.0 100.0 100.0 100.0 100.0 100.0
15-19 8.1 9.0 7.1 4.6 5.1 4.1 9.5 10.4 8.4
20-24 10.8 11.4 10.2 9.0 9.1 8.8 11.6 12.3 10.8
25-29 11.7 11.3 12.2 11.1 10.9 11.4 12.0 11.4 12.6
30-34 12.4 11.6 13.3 12.4 11.6 13.2 12.5 11.6 13.4
35-39 13.3 13.2 13.3 14.3 13.8 14.9 12.8 13.0 12.6
40-44 12.8 12.8 12.9 15.5 15.9 15.1 11.8 11.6 12.0
45-49 10.8 10.7 10.9 12.6 12.5 12.8 10.1 10.1 10.1
50-54 8.7 8.5 9.0 10.0 10.1 9.8 8.2 7.9 8.6
55-59 5.4 5.5 5.4 5.7 5.9 5.6 5.3 5.3 5.3
60-64 3.0 3.1 2.9 2.8 2.9 2.6 3.1 3.1 3.0
65+ 2.8 2.9 2.7 2.0 2.1 1.8 3.2 3.2 3.1
R5 Southeast (*)
Total 100.0 100.0 100.0 100.0 100.0 100.0 100.0 100.0 100.0
15-19 5.7 5.4 6.0 4.9 3.9 5.9 6.2 6.2 6.1
20-24 11.9 11.8 12.1 12.7 10.9 14.5 11.4 12.2 10.4
25-29 14.0 14.2 13.7 17.0 17.1 16.8 12.1 12.5 11.7
30-34 13.3 13.1 13.5 14.4 14.2 14.5 12.6 12.4 12.8
35-39 13.3 13.0 13.6 14.7 15.2 14.2 12.4 11.8 13.2
40-44 12.5 12.7 12.4 11.7 12.2 11.2 13.1 13.0 13.2
45-49 11.1 11.3 10.9 9.8 10.5 9.1 11.9 11.7 12.1
50-54 8.2 8.1 8.3 7.6 7.4 7.7 8.6 8.4 8.7
55-59 5.1 5.5 4.8 4.1 5.1 3.2 5.8 5.7 5.8
60-64 2.6 2.6 2.5 1.6 1.8 1.4 3.1 3.1 3.2
65+ 2.3 2.4 2.2 1.5 1.6 1.3 2.9 2.9 2.8
82
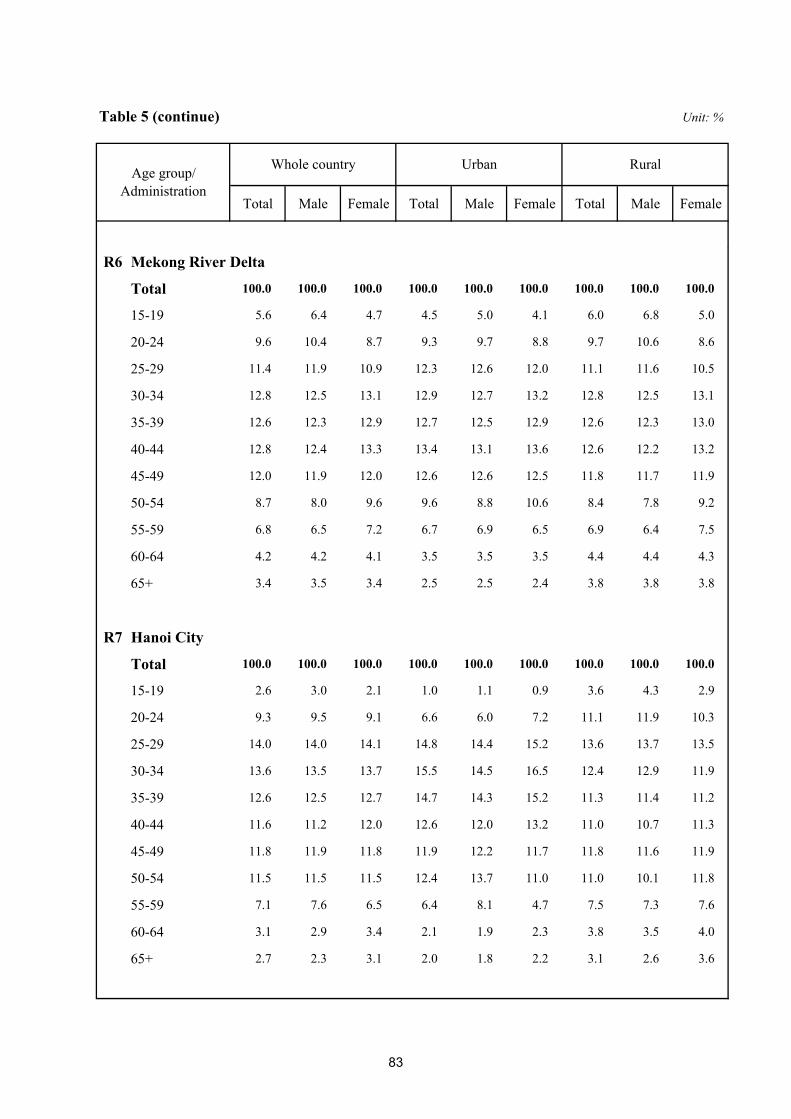
Table 5 (continue)
Total Male Female Total Male Female Total Male Female
Rural
Unit: %
Whole country UrbanAge group/ Administration
R6 Mekong River Delta
Total 100.0 100.0 100.0 100.0 100.0 100.0 100.0 100.0 100.0
15-19 5.6 6.4 4.7 4.5 5.0 4.1 6.0 6.8 5.0
20-24 9.6 10.4 8.7 9.3 9.7 8.8 9.7 10.6 8.6
25-29 11.4 11.9 10.9 12.3 12.6 12.0 11.1 11.6 10.5
30-34 12.8 12.5 13.1 12.9 12.7 13.2 12.8 12.5 13.1
35-39 12.6 12.3 12.9 12.7 12.5 12.9 12.6 12.3 13.0
40-44 12.8 12.4 13.3 13.4 13.1 13.6 12.6 12.2 13.2
45-49 12.0 11.9 12.0 12.6 12.6 12.5 11.8 11.7 11.9
50-54 8.7 8.0 9.6 9.6 8.8 10.6 8.4 7.8 9.2
55-59 6.8 6.5 7.2 6.7 6.9 6.5 6.9 6.4 7.5
60-64 4.2 4.2 4.1 3.5 3.5 3.5 4.4 4.4 4.3
65+ 3.4 3.5 3.4 2.5 2.5 2.4 3.8 3.8 3.8
R7 Hanoi City
Total 100.0 100.0 100.0 100.0 100.0 100.0 100.0 100.0 100.0
15-19 2.6 3.0 2.1 1.0 1.1 0.9 3.6 4.3 2.9
20-24 9.3 9.5 9.1 6.6 6.0 7.2 11.1 11.9 10.3
25-29 14.0 14.0 14.1 14.8 14.4 15.2 13.6 13.7 13.5
30-34 13.6 13.5 13.7 15.5 14.5 16.5 12.4 12.9 11.9
35-39 12.6 12.5 12.7 14.7 14.3 15.2 11.3 11.4 11.2
40-44 11.6 11.2 12.0 12.6 12.0 13.2 11.0 10.7 11.3
45-49 11.8 11.9 11.8 11.9 12.2 11.7 11.8 11.6 11.9
50-54 11.5 11.5 11.5 12.4 13.7 11.0 11.0 10.1 11.8
55-59 7.1 7.6 6.5 6.4 8.1 4.7 7.5 7.3 7.6
60-64 3.1 2.9 3.4 2.1 1.9 2.3 3.8 3.5 4.0
65+ 2.7 2.3 3.1 2.0 1.8 2.2 3.1 2.6 3.6
83
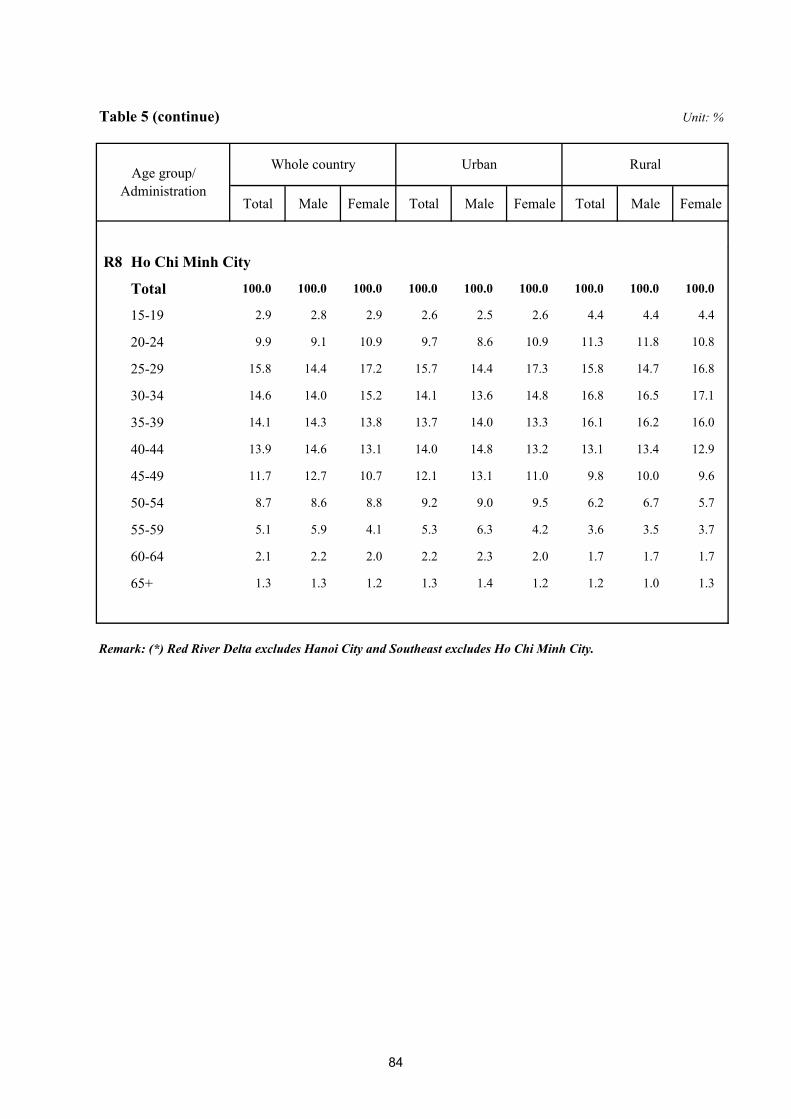
Table 5 (continue)
Total Male Female Total Male Female Total Male Female
Rural
Unit: %
Whole country UrbanAge group/ Administration
R8 Ho Chi Minh City
Total 100.0 100.0 100.0 100.0 100.0 100.0 100.0 100.0 100.0
15-19 2.9 2.8 2.9 2.6 2.5 2.6 4.4 4.4 4.4
20-24 9.9 9.1 10.9 9.7 8.6 10.9 11.3 11.8 10.8
25-29 15.8 14.4 17.2 15.7 14.4 17.3 15.8 14.7 16.8
30-34 14.6 14.0 15.2 14.1 13.6 14.8 16.8 16.5 17.1
35-39 14.1 14.3 13.8 13.7 14.0 13.3 16.1 16.2 16.0
40-44 13.9 14.6 13.1 14.0 14.8 13.2 13.1 13.4 12.9
45-49 11.7 12.7 10.7 12.1 13.1 11.0 9.8 10.0 9.6
50-54 8.7 8.6 8.8 9.2 9.0 9.5 6.2 6.7 5.7
55-59 5.1 5.9 4.1 5.3 6.3 4.2 3.6 3.5 3.7
60-64 2.1 2.2 2.0 2.2 2.3 2.0 1.7 1.7 1.7
65+ 1.3 1.3 1.2 1.3 1.4 1.2 1.2 1.0 1.3
Remark: (*) Red River Delta excludes Hanoi City and Southeast excludes Ho Chi Minh City.
84

Tota
lM
ale
Fem
ale
Tota
lM
ale
Fem
ale
Tota
lM
ale
Fem
ale
EN
TIR
E C
OU
NT
RY
Tot
al10
0.0
100.
010
0.0
100.
010
0.0
100.
010
0.0
100.
010
0.0
No
qual
ifica
tion
83.2
81.3
85.3
68.3
65.3
71.5
89.7
88.3
91.3
Voc
atio
n tra
inin
g4.
77.
12.
27.
511
.03.
73.
55.
41.
5Se
cond
ary
voca
tiona
l sch
ool
3.7
3.3
4.1
5.7
4.8
6.5
2.8
2.6
3.0
Col
lege
2.0
1.4
2.5
2.9
2.1
3.8
1.5
1.1
2.0
Uni
vers
ity a
nd o
ver
6.4
6.9
5.9
15.6
16.8
14.4
2.4
2.6
2.2
R1
Nor
ther
n M
idla
nds a
nd M
ount
ains
Tot
al10
0.0
100.
010
0.0
100.
010
0.0
100.
010
0.0
100.
010
0.0
No
qual
ifica
tion
85.2
84.0
86.3
56.3
53.6
58.8
90.8
89.8
91.8
Voc
atio
n tra
inin
g4.
36.
32.
210
.915
.76.
43.
04.
51.
4Se
cond
ary
voca
tiona
l sch
ool
4.5
4.1
4.9
11.8
10.4
13.1
3.1
3.0
3.3
Col
lege
2.1
1.3
2.8
5.1
3.3
6.8
1.5
1.0
2.0
Uni
vers
ity a
nd o
ver
4.0
4.2
3.7
15.9
16.9
14.9
1.6
1.8
1.5
R2
Red
Riv
er D
elta
(*)
Tot
al10
0.0
100.
010
0.0
100.
010
0.0
100.
010
0.0
100.
010
0.0
No
qual
ifica
tion
80.9
76.8
84.9
63.6
58.5
69.1
86.0
82.6
89.3
Voc
atio
n tra
inin
g7.
812
.13.
513
.119
.06.
86.
210
.02.
6Se
cond
ary
voca
tiona
l sch
ool
3.7
3.7
3.7
6.2
5.6
6.8
3.0
3.1
2.9
Col
lege
2.5
1.6
3.3
3.8
2.5
5.1
2.1
1.4
2.8
Uni
vers
ity a
nd o
ver
5.1
5.7
4.6
13.3
14.4
12.2
2.7
3.0
2.5
Urb
anR
ural
Tab
le 6
Tech
nica
l tra
inin
g an
d qu
alifi
catio
n/A
dmin
istra
tion
STR
UC
TUR
E O
F LA
BO
UR
FO
RC
E A
GED
15
AN
D A
BO
VE
BY
TEC
HN
ICA
L TR
AIN
ING
AN
D Q
UA
LIFI
CA
TIO
N, 2
012
Uni
t: %
Who
le c
ount
ry
85

Tab
le 6
(con
tinue
)
Tota
lM
ale
Fem
ale
Tota
lM
ale
Fem
ale
Tota
lM
ale
Fem
ale
R3
Nor
th a
nd S
outh
Cen
tral
Coa
stT
otal
100.
010
0.0
100.
010
0.0
100.
010
0.0
100.
010
0.0
100.
0
No
qual
ifica
tion
84.7
82.9
86.6
70.5
67.3
73.7
89.7
88.3
91.1
Voc
atio
n tra
inin
g3.
96.
21.
56.
410
.22.
63.
04.
81.
2
Seco
ndar
y vo
catio
nal s
choo
l4.
23.
74.
76.
55.
57.
63.
43.
13.
7
Col
lege
2.0
1.4
2.6
3.1
2.1
4.2
1.6
1.1
2.0
Uni
vers
ity a
nd o
ver
5.2
5.8
4.6
13.5
14.9
12.0
2.3
2.7
2.0
R4
Cen
tral
Hig
hlan
dsT
otal
100.
010
0.0
100.
010
0.0
100.
010
0.0
100.
010
0.0
100.
0
No
qual
ifica
tion
87.6
86.9
88.4
75.7
73.4
78.1
92.4
92.1
92.8
Voc
atio
n tra
inin
g2.
94.
41.
25.
08.
11.
92.
03.
01.
0
Seco
ndar
y vo
catio
nal s
choo
l3.
53.
14.
06.
45.
67.
22.
42.
12.
7
Col
lege
1.5
1.1
1.9
2.6
1.7
3.5
1.1
0.9
1.3
Uni
vers
ity a
nd o
ver
4.5
4.5
4.4
10.3
11.2
9.4
2.1
1.9
2.3
R5
Sout
heas
t (*)
Tot
al10
0.0
100.
010
0.0
100.
010
0.0
100.
010
0.0
100.
010
0.0
No
qual
ifica
tion
85.6
83.6
87.8
78.1
74.0
82.2
90.3
89.1
91.7
Voc
atio
n tra
inin
g4.
37.
01.
46.
010
.31.
93.
25.
11.
1
Seco
ndar
y vo
catio
nal s
choo
l3.
22.
83.
64.
74.
45.
02.
31.
92.
7
Col
lege
1.9
1.2
2.6
2.8
1.7
3.8
1.3
0.8
1.8
Uni
vers
ity a
nd o
ver
5.0
5.4
4.5
8.4
9.6
7.2
2.9
3.1
2.7
Rur
al
Uni
t: %
Who
le c
ount
ryTe
chni
cal t
rain
ing
and
qual
ifica
tion/
Adm
inis
tratio
n
Urb
an
86
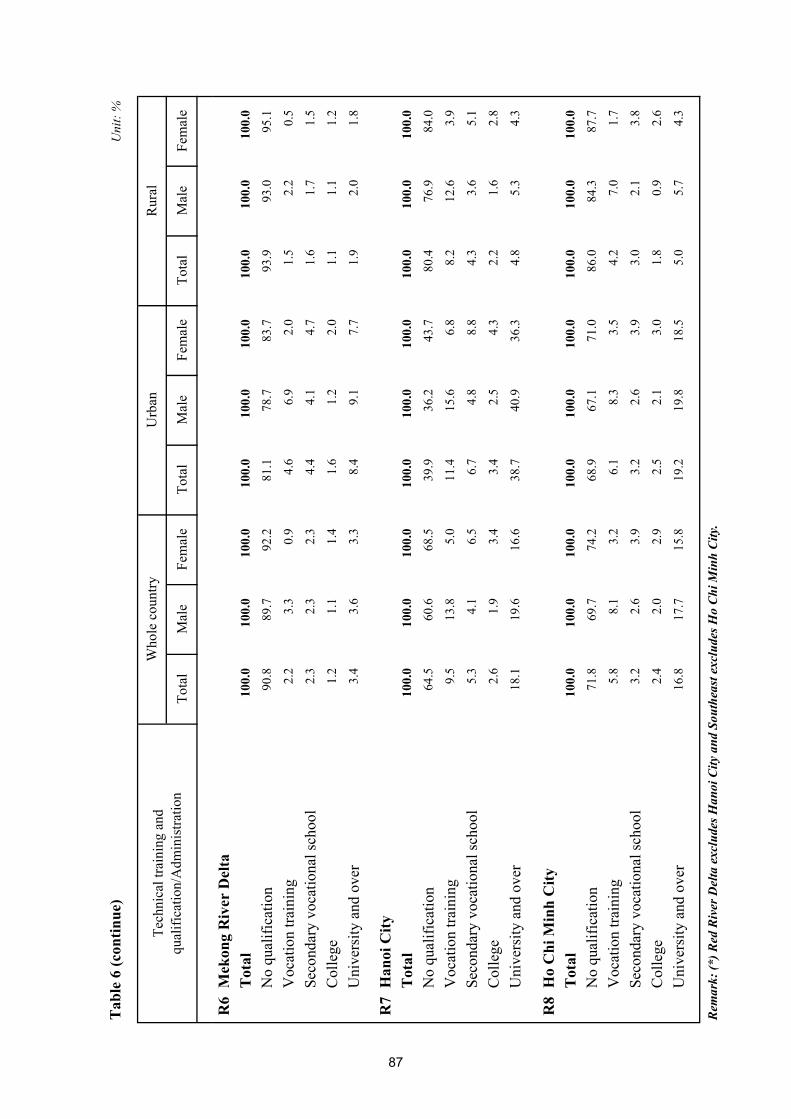
Tab
le 6
(con
tinue
)
Tota
lM
ale
Fem
ale
Tota
lM
ale
Fem
ale
Tota
lM
ale
Fem
ale
Rur
al
Uni
t: %
Who
le c
ount
ryTe
chni
cal t
rain
ing
and
qual
ifica
tion/
Adm
inis
tratio
n
Urb
an
R6
Mek
ong
Riv
er D
elta
Tot
al10
0.0
100.
010
0.0
100.
010
0.0
100.
010
0.0
100.
010
0.0
No
qual
ifica
tion
90.8
89.7
92.2
81.1
78.7
83.7
93.9
93.0
95.1
Voc
atio
n tra
inin
g2.
23.
30.
94.
66.
92.
01.
52.
20.
5
Seco
ndar
y vo
catio
nal s
choo
l2.
32.
32.
34.
44.
14.
71.
61.
71.
5
Col
lege
1.2
1.1
1.4
1.6
1.2
2.0
1.1
1.1
1.2
Uni
vers
ity a
nd o
ver
3.4
3.6
3.3
8.4
9.1
7.7
1.9
2.0
1.8
R7
Han
oi C
ityT
otal
100.
010
0.0
100.
010
0.0
100.
010
0.0
100.
010
0.0
100.
0
No
qual
ifica
tion
64.5
60.6
68.5
39.9
36.2
43.7
80.4
76.9
84.0
Voc
atio
n tra
inin
g9.
513
.85.
011
.415
.66.
88.
212
.63.
9
Seco
ndar
y vo
catio
nal s
choo
l5.
34.
16.
56.
74.
88.
84.
33.
65.
1
Col
lege
2.6
1.9
3.4
3.4
2.5
4.3
2.2
1.6
2.8
Uni
vers
ity a
nd o
ver
18.1
19.6
16.6
38.7
40.9
36.3
4.8
5.3
4.3
R8
Ho
Chi
Min
h C
ityT
otal
100.
010
0.0
100.
010
0.0
100.
010
0.0
100.
010
0.0
100.
0
No
qual
ifica
tion
71.8
69.7
74.2
68.9
67.1
71.0
86.0
84.3
87.7
Voc
atio
n tra
inin
g5.
88.
13.
26.
18.
33.
54.
27.
01.
7
Seco
ndar
y vo
catio
nal s
choo
l3.
22.
63.
93.
22.
63.
93.
02.
13.
8
Col
lege
2.4
2.0
2.9
2.5
2.1
3.0
1.8
0.9
2.6
Uni
vers
ity a
nd o
ver
16.8
17.7
15.8
19.2
19.8
18.5
5.0
5.7
4.3
Rem
ark:
(*) R
ed R
iver
Del
ta e
xclu
des H
anoi
City
and
Sou
thea
st e
xclu
des H
o C
hi M
inh
City
.
87

Tota
lM
ale
Fem
ale
Tota
lM
ale
Fem
ale
Tota
lM
ale
Fem
ale
Tota
lM
ale
Fem
ale
EN
TIR
E C
OU
NT
RY
50 9
97.8
26 2
34.4
24 7
63.4
51 6
99.0
26 5
95.5
25 1
03.5
52 1
14.5
26 8
73.2
25 2
41.3
51 9
30.9
26 7
73.6
25 1
57.3
R1
Nor
ther
n M
idla
nds a
nd M
ount
ains
7 06
6.2
3 52
2.3
3 54
3.9
7 17
7.1
3 56
9.9
3 60
7.2
7 31
8.1
3 65
7.1
3 66
1.0
7 22
6.2
3 60
4.6
3 62
1.7
R2
Red
Riv
er D
elta
(*)
7 77
1.8
3 84
3.9
3 92
8.0
7 88
2.6
3 88
6.9
3 99
5.7
8 05
8.3
3 96
6.8
4 09
1.5
8 02
1.4
3 96
3.0
4 05
8.4
R3
Nor
th a
nd S
outh
Cen
tral C
oast
11 0
19.2
5 51
0.9
5 50
8.4
11 1
59.8
5 63
2.9
5 52
6.9
11 2
31.6
5 68
2.7
5 54
8.9
11 1
78.0
5 60
4.3
5 57
3.6
R4
Cen
tral H
ighl
ands
3 08
0.5
1 60
4.3
1 47
6.2
3 10
7.9
1 62
5.6
1 48
2.3
3 10
9.3
1 62
2.1
1 48
7.2
3 13
8.0
1 63
2.2
1 50
5.8
R5
Sout
heas
t (*)
4 37
7.2
2 30
0.4
2 07
6.8
4 51
8.8
2 36
7.8
2 15
1.0
4 54
0.5
2 36
8.0
2 17
2.5
4 50
7.1
2 35
2.8
2 15
4.4
R6
Mek
ong
Riv
er D
elta
10 1
41.9
5 54
3.7
4 59
8.2
10 2
61.7
5 58
1.2
4 68
0.5
10 2
35.3
5 61
0.2
4 62
5.1
10 1
51.0
5 60
2.0
4 54
9.0
R7
Han
oi C
ity3
614.
71
816.
31
798.
43
607.
81
818.
31
789.
43
648.
31
837.
11
811.
23
727.
01
889.
61
837.
4
R8
Ho
Chi
Min
h C
ity3
926.
42
092.
81
833.
53
983.
42
112.
91
870.
53
973.
02
129.
01
844.
03
982.
32
125.
21
857.
0
UR
BA
N15
263
.07
846.
17
416.
915
574
.38
046.
27
528.
215
657
.78
107.
67
550.
115
684
.28
107.
07
577.
3
R1
Nor
ther
n M
idla
nds a
nd M
ount
ains
1 13
8.0
554.
158
3.9
1 16
3.5
562.
460
1.1
1 17
7.9
566.
561
1.4
1 17
1.9
568.
560
3.3
R2
Red
Riv
er D
elta
(*)
1 75
8.0
905.
585
2.5
1 79
6.6
929.
086
7.6
1 82
2.0
948.
287
3.9
1 80
6.0
942.
086
4.0
R3
Nor
th a
nd S
outh
Cen
tral C
oast
2 76
4.9
1 37
5.5
1 38
9.4
2 86
2.5
1 44
8.2
1 41
4.3
2 85
9.1
1 44
5.6
1 41
3.5
2 87
9.5
1 45
4.9
1 42
4.6
R4
Cen
tral H
ighl
ands
882.
644
7.4
435.
288
4.2
450.
243
3.9
881.
444
7.4
434.
090
8.4
455.
245
3.2
R5
Sout
heas
t (*)
1 67
1.1
827.
384
3.8
1 71
2.9
862.
585
0.4
1 73
6.1
855.
088
1.2
1 72
0.5
839.
588
1.0
R6
Mek
ong
Riv
er D
elta
2 40
1.7
1 25
6.3
1 14
5.4
2 45
4.9
1 28
0.8
1 17
4.1
2 45
1.9
1 28
4.5
1 16
7.3
2 44
2.6
1 28
6.4
1 15
6.2
R7
Han
oi C
ity1
394.
471
5.1
679.
21
399.
471
9.0
680.
41
422.
373
8.5
683.
71
451.
875
2.9
698.
9
R8
Ho
Chi
Min
h C
ity3
252.
41
764.
91
487.
53
300.
41
794.
11
506.
33
307.
01
821.
91
485.
13
303.
61
807.
51
496.
0
Tab
le 7
EMPL
OY
ED P
OPU
LATI
ON
AG
ED 1
5 A
ND
AB
OV
E B
Y Q
UA
RTE
R, 2
012
Uni
t: Th
ousa
nd p
erso
ns
No
Adm
inis
tratio
n
Qua
rter 1
in 2
012
(At 1
/4/2
012)
Qua
rter 4
in 2
012
(At 1
/1/2
013)
Qua
rter 2
in 2
012
(At 1
/7/2
012)
Qua
rter 3
in 2
012
(At 1
/10/
2012
)
88

Tab
le 7
(con
tinue
)
Tota
lM
ale
Fem
ale
Tota
lM
ale
Fem
ale
Tota
lM
ale
Fem
ale
Tota
lM
ale
Fem
ale
RU
RA
L35
734
.918
388
.317
346
.636
124
.718
549
.417
575
.336
456
.818
765
.517
691
.236
246
.618
666
.617
580
.0
R1
Nor
ther
n M
idla
nds a
nd M
ount
ains
5 92
8.2
2 96
8.1
2 96
0.1
6 01
3.6
3 00
7.6
3 00
6.1
6 14
0.2
3 09
0.6
3 04
9.6
6 05
4.4
3 03
6.0
3 01
8.4
R2
Red
Riv
er D
elta
(*)
6 01
3.9
2 93
8.4
3 07
5.5
6 08
6.0
2 95
7.9
3 12
8.1
6 23
6.3
3 01
8.6
3 21
7.6
6 21
5.3
3 02
1.0
3 19
4.3
R3
Nor
th a
nd S
outh
Cen
tral C
oast
8 25
4.4
4 13
5.4
4 11
9.0
8 29
7.3
4 18
4.6
4 11
2.7
8 37
2.5
4 23
7.1
4 13
5.4
8 29
8.5
4 14
9.5
4 14
9.0
R4
Cen
tral H
ighl
ands
2 19
7.9
1 15
6.9
1 04
1.0
2 22
3.7
1 17
5.4
1 04
8.4
2 22
7.9
1 17
4.7
1 05
3.2
2 22
9.5
1 17
6.9
1 05
2.6
R5
Sout
heas
t (*)
2 70
6.1
1 47
3.1
1 23
3.0
2 80
5.9
1 50
5.3
1 30
0.6
2 80
4.3
1 51
3.0
1 29
1.3
2 78
6.6
1 51
3.2
1 27
3.4
R6
Mek
ong
Riv
er D
elta
7 74
0.2
4 28
7.4
3 45
2.8
7 80
6.8
4 30
0.4
3 50
6.4
7 78
3.4
4 32
5.7
3 45
7.7
7 70
8.3
4 31
5.6
3 39
2.7
R7
Han
oi C
ity2
220.
31
101.
11
119.
22
208.
41
099.
31
109.
02
226.
11
098.
61
127.
52
275.
21
136.
71
138.
6
R8
Ho
Chi
Min
h C
ity67
4.0
327.
934
6.1
683.
031
8.8
364.
266
6.0
307.
235
8.8
678.
731
7.7
361.
0
Rem
ark:
(*) R
ed R
iver
Del
ta e
xclu
des H
anoi
City
and
Sou
thea
st e
xclu
des H
o C
hi M
inh
City
.
Uni
t: Th
ousa
nd p
erso
ns
No
Adm
inis
tratio
n
Qua
rter 1
in 2
012
(At 1
/4/2
012)
Qua
rter 2
in 2
012
(At 1
/7/2
012)
Qua
rter 3
in 2
012
(At 1
/10/
2012
)Q
uarte
r 4 in
201
2(A
t 1/1
/201
3)
89
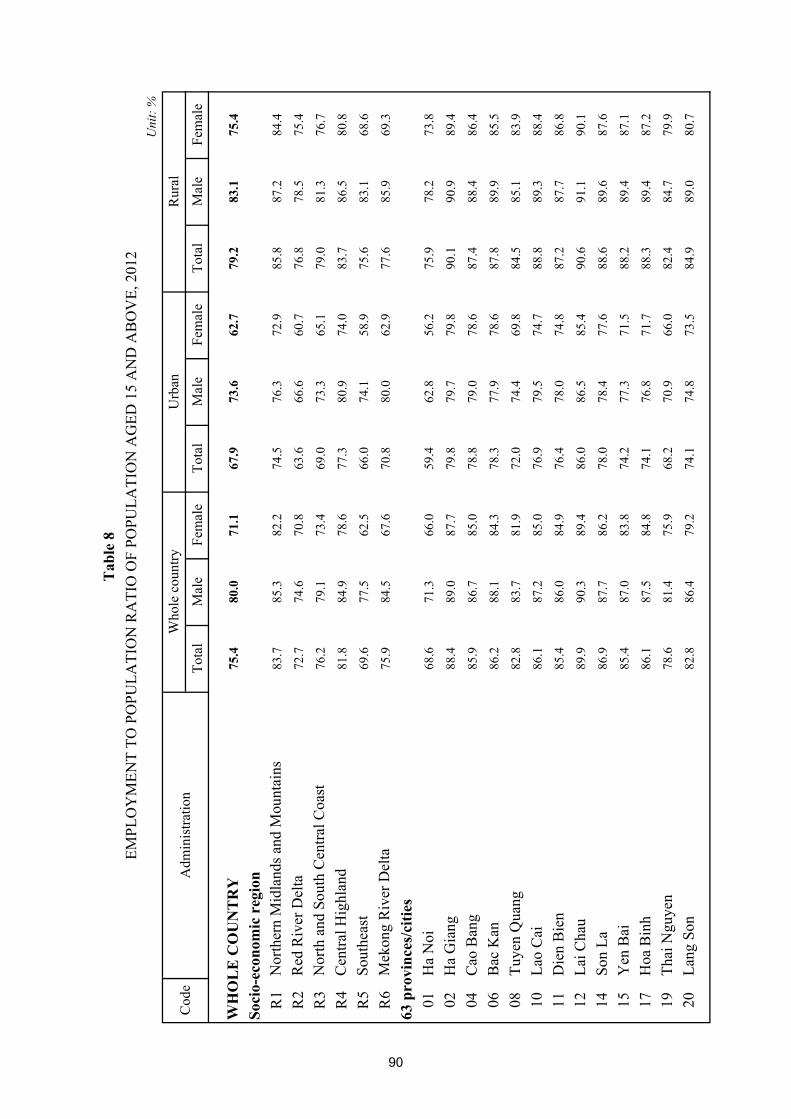
Tota
lM
ale
Fem
ale
Tota
lM
ale
Fem
ale
Tota
lM
ale
Fem
ale
WH
OL
E C
OU
NT
RY
75.4
80.0
71.1
67.9
73.6
62.7
79.2
83.1
75.4
Soci
o-ec
onom
ic r
egio
nR
1N
orth
ern
Mid
land
s and
Mou
ntai
ns83
.785
.382
.274
.576
.372
.985
.887
.284
.4
R2
Red
Riv
er D
elta
72.7
74.6
70.8
63.6
66.6
60.7
76.8
78.5
75.4
R3
Nor
th a
nd S
outh
Cen
tral C
oast
76.2
79.1
73.4
69.0
73.3
65.1
79.0
81.3
76.7
R4
Cen
tral H
ighl
and
81.8
84.9
78.6
77.3
80.9
74.0
83.7
86.5
80.8
R5
Sout
heas
t69
.677
.562
.566
.074
.158
.975
.683
.168
.6
R6
Mek
ong
Riv
er D
elta
75.9
84.5
67.6
70.8
80.0
62.9
77.6
85.9
69.3
63 p
rovi
nces
/citi
es01
Ha
Noi
68.6
71.3
66.0
59.4
62.8
56.2
75.9
78.2
73.8
02H
a G
iang
88.4
89.0
87.7
79.8
79.7
79.8
90.1
90.9
89.4
04C
ao B
ang
85.9
86.7
85.0
78.8
79.0
78.6
87.4
88.4
86.4
06B
ac K
an86
.288
.184
.378
.377
.978
.687
.889
.985
.5
08Tu
yen
Qua
ng82
.883
.781
.972
.074
.469
.884
.585
.183
.9
10La
o C
ai86
.187
.285
.076
.979
.574
.788
.889
.388
.4
11D
ien
Bie
n 85
.486
.084
.976
.478
.074
.887
.287
.786
.8
12La
i Cha
u89
.990
.389
.486
.086
.585
.490
.691
.190
.1
14So
n La
86.9
87.7
86.2
78.0
78.4
77.6
88.6
89.6
87.6
15Y
en B
ai85
.487
.083
.874
.277
.371
.588
.289
.487
.1
17H
oa B
inh
86.1
87.5
84.8
74.1
76.8
71.7
88.3
89.4
87.2
19Th
ai N
guye
n78
.681
.475
.968
.270
.966
.082
.484
.779
.9
20La
ng S
on82
.886
.479
.274
.174
.873
.584
.989
.080
.7
Tab
le 8
EMPL
OY
MEN
T TO
PO
PULA
TIO
N R
ATI
O O
F PO
PULA
TIO
N A
GED
15
AN
D A
BO
VE,
201
2
Cod
eA
dmin
istra
tion
Uni
t: %
Who
le c
ount
ryU
rban
Rur
al
90
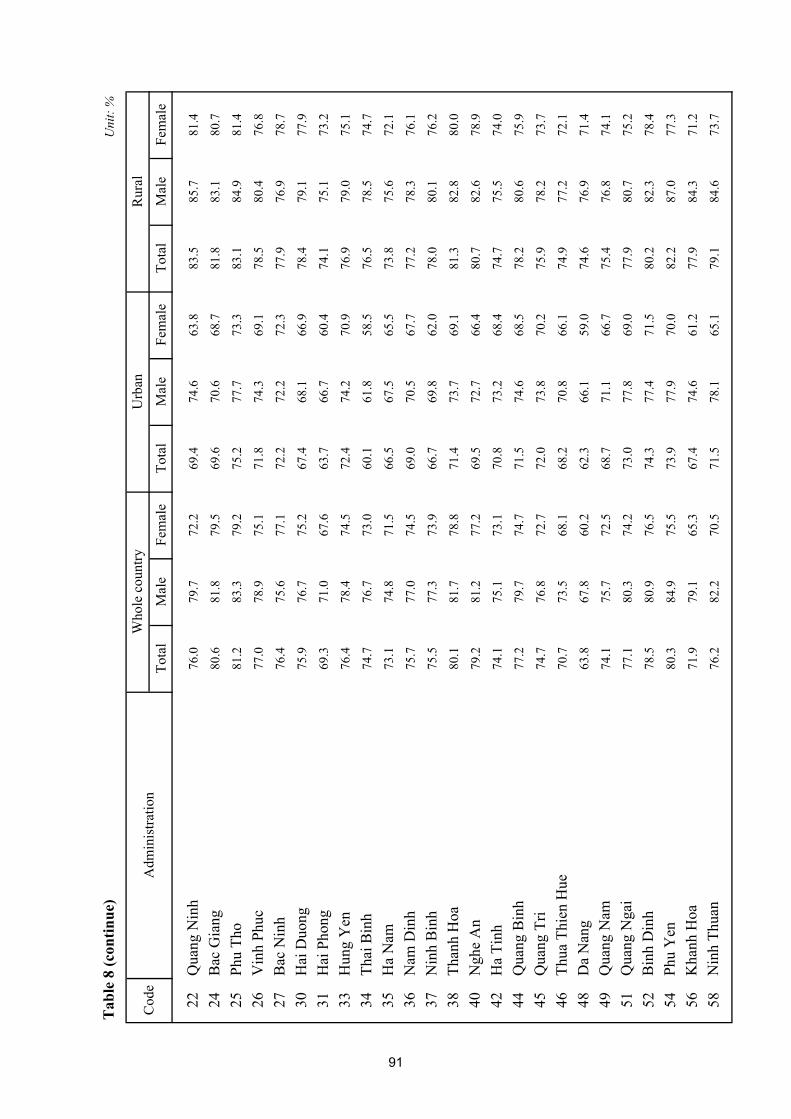
Tab
le 8
(con
tinue
)
Tota
lM
ale
Fem
ale
Tota
lM
ale
Fem
ale
Tota
lM
ale
Fem
ale
22Q
uang
Nin
h76
.079
.772
.269
.474
.663
.883
.585
.781
.4
24B
ac G
iang
80.6
81.8
79.5
69.6
70.6
68.7
81.8
83.1
80.7
25Ph
u Th
o81
.283
.379
.275
.277
.773
.383
.184
.981
.4
26V
inh
Phuc
77.0
78.9
75.1
71.8
74.3
69.1
78.5
80.4
76.8
27B
ac N
inh
76.4
75.6
77.1
72.2
72.2
72.3
77.9
76.9
78.7
30H
ai D
uong
75.9
76.7
75.2
67.4
68.1
66.9
78.4
79.1
77.9
31H
ai P
hong
69.3
71.0
67.6
63.7
66.7
60.4
74.1
75.1
73.2
33H
ung
Yen
76.4
78.4
74.5
72.4
74.2
70.9
76.9
79.0
75.1
34Th
ai B
inh
74.7
76.7
73.0
60.1
61.8
58.5
76.5
78.5
74.7
35H
a N
am73
.174
.871
.566
.567
.565
.573
.875
.672
.1
36N
am D
inh
75.7
77.0
74.5
69.0
70.5
67.7
77.2
78.3
76.1
37N
inh
Bin
h75
.577
.373
.966
.769
.862
.078
.080
.176
.2
38Th
anh
Hoa
80.1
81.7
78.8
71.4
73.7
69.1
81.3
82.8
80.0
40N
ghe
An
79.2
81.2
77.2
69.5
72.7
66.4
80.7
82.6
78.9
42H
a Ti
nh74
.175
.173
.170
.873
.268
.474
.775
.574
.0
44Q
uang
Bin
h77
.279
.774
.771
.574
.668
.578
.280
.675
.9
45Q
uang
Tri
74.7
76.8
72.7
72.0
73.8
70.2
75.9
78.2
73.7
46Th
ua T
hien
Hue
70.7
73.5
68.1
68.2
70.8
66.1
74.9
77.2
72.1
48D
a N
ang
63.8
67.8
60.2
62.3
66.1
59.0
74.6
76.9
71.4
49Q
uang
Nam
74.1
75.7
72.5
68.7
71.1
66.7
75.4
76.8
74.1
51Q
uang
Nga
i77
.180
.374
.273
.077
.869
.077
.980
.775
.2
52B
inh
Din
h78
.580
.976
.574
.377
.471
.580
.282
.378
.4
54Ph
u Y
en80
.384
.975
.573
.977
.970
.082
.287
.077
.3
56K
hanh
Hoa
71.9
79.1
65.3
67.4
74.6
61.2
77.9
84.3
71.2
58N
inh
Thua
n76
.282
.270
.571
.578
.165
.179
.184
.673
.7
Rur
al
Uni
t: %
Cod
eA
dmin
istra
tion
Who
le c
ount
ryU
rban
91

Tab
le 8
(con
tinue
)
Tota
lM
ale
Fem
ale
Tota
lM
ale
Fem
ale
Tota
lM
ale
Fem
ale
Rur
al
Uni
t: %
Cod
eA
dmin
istra
tion
Who
le c
ount
ryU
rban
60B
inh
Thua
n74
.681
.268
.370
.378
.962
.077
.682
.772
.6
62K
on T
um85
.487
.882
.879
.683
.775
.689
.190
.187
.8
64G
ia L
ai86
.589
.183
.879
.883
.776
.289
.791
.687
.7
66D
ak L
ak77
.681
.074
.275
.177
.772
.778
.582
.174
.8
67D
ak N
ong
87.2
88.5
85.8
81.4
83.2
78.7
88.3
89.6
86.9
68La
m D
ong
79.5
83.5
75.8
75.9
80.1
72.2
81.9
85.5
78.3
70B
inh
Phuo
c82
.287
.377
.375
.480
.370
.883
.688
.678
.7
72Ta
y N
inh
76.4
84.1
68.9
71.9
79.1
65.4
77.2
85.1
69.5
74B
inh
Duo
ng80
.986
.376
.280
.886
.276
.681
.186
.375
.1
75D
ong
Nai
74.1
80.4
68.2
70.7
78.2
64.3
75.9
81.4
70.4
77B
a R
ia-V
ung
Tau
71.0
79.5
62.9
66.7
77.0
57.5
75.5
81.9
68.8
79H
o C
hi M
inh
City
63.1
72.2
55.2
62.4
71.1
54.4
66.8
78.8
58.8
80Lo
ng A
n78
.382
.973
.970
.576
.465
.780
.184
.276
.0
82Ti
en G
iang
79.5
84.8
74.3
69.8
76.6
64.7
81.6
86.3
76.8
83B
en T
re74
.382
.267
.368
.278
.559
.475
.082
.668
.2
84Tr
a V
inh
76.4
84.1
69.1
73.2
80.8
66.0
77.0
84.7
69.7
86V
inh
Long
74.7
81.9
67.9
66.3
75.2
59.3
76.3
83.0
69.7
87D
ong
Thap
76.2
83.7
68.9
69.4
76.9
63.1
77.8
85.1
70.3
89A
n G
iang
78.4
86.3
70.8
73.9
80.4
68.0
80.6
89.1
72.2
91K
ien
Gia
ng77
.787
.567
.472
.683
.961
.679
.688
.869
.7
92C
an T
ho72
.781
.963
.671
.881
.463
.174
.582
.764
.7
93H
au G
iang
74.8
85.4
64.0
72.6
81.6
64.1
75.5
86.6
64.0
94So
c Tr
ang
72.2
84.2
61.2
68.1
80.2
58.8
74.0
85.8
62.4
95B
ac L
ieu
72.5
83.4
62.1
66.5
78.4
55.9
74.8
85.1
64.5
96C
a M
au73
.687
.559
.569
.179
.960
.574
.889
.359
.2
92

Tota
lM
ale
Fem
ale
Tota
lM
ale
Fem
ale
Tota
lM
ale
Fem
ale
EN
TIR
E C
OU
NT
RY
Tot
al10
0.0
100.
010
0.0
100.
010
0.0
100.
010
0.0
100.
010
0.0
No
qual
ifica
tion
83.4
81.5
85.5
68.3
65.3
71.6
89.9
88.4
91.5
Voc
atio
n tra
inin
g4.
77.
12.
27.
511
.03.
73.
55.
31.
5Se
cond
ary
voca
tiona
l sch
ool
3.6
3.2
4.0
5.6
4.8
6.5
2.8
2.6
2.9
Col
lege
1.9
1.4
2.5
2.9
2.0
3.7
1.5
1.1
1.9
Uni
vers
ity a
nd o
ver
6.4
6.9
5.8
15.7
16.9
14.5
2.4
2.6
2.1
R1
Nor
ther
n M
idla
nds a
nd M
ount
ains
Tot
al10
0.0
100.
010
0.0
100.
010
0.0
100.
010
0.0
100.
010
0.0
No
qual
ifica
tion
85.4
84.3
86.5
56.6
53.8
59.2
90.9
89.9
92.0
Voc
atio
n tra
inin
g4.
26.
22.
210
.815
.66.
32.
94.
51.
4Se
cond
ary
voca
tiona
l sch
ool
4.5
4.1
4.8
11.7
10.4
13.0
3.1
2.9
3.2
Col
lege
2.0
1.3
2.8
5.0
3.2
6.7
1.5
0.9
2.0
Uni
vers
ity a
nd o
ver
3.9
4.1
3.7
15.9
17.0
14.9
1.6
1.7
1.4
R2
Red
Riv
er D
elta
(*)
Tot
al10
0.0
100.
010
0.0
100.
010
0.0
100.
010
0.0
100.
010
0.0
No
qual
ifica
tion
81.2
77.0
85.2
63.8
58.6
69.3
86.3
82.8
89.6
Voc
atio
n tra
inin
g7.
712
.13.
513
.218
.96.
96.
19.
92.
6Se
cond
ary
voca
tiona
l sch
ool
3.7
3.6
3.7
6.2
5.6
6.8
2.9
3.0
2.9
Col
lege
2.4
1.6
3.1
3.6
2.4
4.9
2.0
1.3
2.7
Uni
vers
ity a
nd o
ver
5.0
5.7
4.4
13.3
14.5
12.0
2.6
2.9
2.3
Urb
anR
ural
Tab
le 9
Tech
nica
l tra
inin
g an
d qu
alifi
catio
n/A
dmin
istra
tion
STR
UC
TUR
E O
F EM
PLO
YED
PO
PULA
TIO
N A
GE
15 A
ND
AB
OV
E B
Y T
ECH
NIC
AL
TRA
ININ
G A
ND
QU
ALI
FIC
ATI
ON
, 201
2 Uni
t: %
Who
le c
ount
ry
93

Tab
le 9
(con
tinue
)
Tota
lM
ale
Fem
ale
Tota
lM
ale
Fem
ale
Tota
lM
ale
Fem
ale
R3
Nor
th a
nd S
outh
Cen
tral
Coa
stT
otal
100.
010
0.0
100.
010
0.0
100.
010
0.0
100.
010
0.0
100.
0
No
qual
ifica
tion
85.1
83.2
87.1
70.8
67.4
74.2
90.0
88.6
91.4
Voc
atio
n tra
inin
g3.
86.
11.
56.
410
.12.
52.
94.
71.
2
Seco
ndar
y vo
catio
nal s
choo
l4.
13.
74.
66.
45.
47.
33.
33.
13.
6
Col
lege
1.9
1.3
2.4
3.0
2.1
4.0
1.5
1.1
1.9
Uni
vers
ity a
nd o
ver
5.1
5.7
4.4
13.5
14.9
12.0
2.2
2.6
1.9
R4
Cen
tral
Hig
hlan
dsT
otal
100.
010
0.0
100.
010
0.0
100.
010
0.0
100.
010
0.0
100.
0
No
qual
ifica
tion
87.9
87.2
88.7
76.1
73.7
78.6
92.7
92.4
93.0
Voc
atio
n tra
inin
g2.
84.
31.
24.
98.
01.
72.
02.
90.
9
Seco
ndar
y vo
catio
nal s
choo
l3.
53.
04.
06.
35.
57.
22.
32.
12.
6
Col
lege
1.4
1.0
1.9
2.5
1.6
3.4
1.0
0.8
1.2
Uni
vers
ity a
nd o
ver
4.4
4.4
4.3
10.2
11.2
9.2
2.1
1.9
2.3
R5
Sout
heas
t (*)
Tot
al10
0.0
100.
010
0.0
100.
010
0.0
100.
010
0.0
100.
010
0.0
No
qual
ifica
tion
85.7
83.7
88.0
78.2
74.1
82.2
90.4
89.1
91.9
Voc
atio
n tra
inin
g4.
36.
91.
46.
010
.21.
93.
25.
11.
0
Seco
ndar
y vo
catio
nal s
choo
l3.
22.
83.
64.
74.
45.
02.
31.
92.
6
Col
lege
1.8
1.2
2.6
2.7
1.7
3.7
1.3
0.8
1.8
Uni
vers
ity a
nd o
ver
5.0
5.4
4.5
8.4
9.6
7.2
2.9
3.0
2.7
Rur
al
Uni
t: %
Who
le c
ount
ryTe
chni
cal t
rain
ing
and
qual
ifica
tion/
Adm
inis
tratio
n
Urb
an
94

Tab
le 9
(con
tinue
)
Tota
lM
ale
Fem
ale
Tota
lM
ale
Fem
ale
Tota
lM
ale
Fem
ale
Rur
al
Uni
t: %
Who
le c
ount
ryTe
chni
cal t
rain
ing
and
qual
ifica
tion/
Adm
inis
tratio
n
Urb
an
R6
Mek
ong
Riv
er D
elta
Tot
al10
0.0
100.
010
0.0
100.
010
0.0
100.
010
0.0
100.
010
0.0
No
qual
ifica
tion
90.9
89.8
92.3
81.1
78.7
83.7
94.0
93.1
95.1
Voc
atio
n tra
inin
g2.
23.
30.
94.
56.
82.
01.
52.
20.
5
Seco
ndar
y vo
catio
nal s
choo
l2.
22.
22.
24.
44.
14.
71.
61.
71.
4
Col
lege
1.2
1.1
1.4
1.5
1.2
1.9
1.1
1.1
1.2
Uni
vers
ity a
nd o
ver
3.4
3.6
3.3
8.5
9.2
7.7
1.9
1.9
1.8
R7
Han
oi C
ityT
otal
100.
010
0.0
100.
010
0.0
100.
010
0.0
100.
010
0.0
100.
0
No
qual
ifica
tion
64.7
60.5
68.9
39.3
35.4
43.6
80.6
77.0
84.3
Voc
atio
n tra
inin
g9.
413
.94.
911
.415
.86.
78.
212
.63.
9
Seco
ndar
y vo
catio
nal s
choo
l5.
24.
16.
36.
64.
88.
64.
33.
65.
0
Col
lege
2.6
1.9
3.3
3.4
2.5
4.3
2.1
1.6
2.6
Uni
vers
ity a
nd o
ver
18.1
19.6
16.6
39.2
41.5
36.8
4.8
5.3
4.3
R8
Ho
Chi
Min
h C
ityT
otal
100.
010
0.0
100.
010
0.0
100.
010
0.0
100.
010
0.0
100.
0
No
qual
ifica
tion
71.6
69.4
74.0
68.6
66.8
70.7
86.1
84.1
87.8
Voc
atio
n tra
inin
g5.
98.
23.
36.
38.
43.
64.
27.
01.
7
Seco
ndar
y vo
catio
nal s
choo
l3.
22.
63.
93.
22.
73.
92.
92.
03.
7
Col
lege
2.3
1.9
2.8
2.4
2.0
2.9
1.8
1.0
2.5
Uni
vers
ity a
nd o
ver
17.0
17.9
16.0
19.5
20.0
18.8
5.0
5.9
4.3
Rem
ark:
(*) R
ed R
iver
Del
ta e
xclu
des H
anoi
City
and
Sou
thea
st e
xclu
des H
o C
hi M
inh
City
.
95

Tota
lM
ale
Fem
ale
Tota
lM
ale
Fem
ale
Tota
lM
ale
Fem
ale
EN
TIR
E C
OU
NT
RY
100.
010
0.0
100.
010
0.0
100.
010
0.0
100.
010
0.0
100.
01.
Lea
ders
, man
ager
s and
adm
inis
trato
rs o
f bra
nche
s, le
vels
and
org
aniz
atio
ns1.
01.
50.
52.
13.
01.
10.
60.
90.
2
2. P
rofe
ssio
nals
5.5
5.2
5.8
13.1
12.7
13.6
2.2
2.0
2.5
3. T
echn
icia
ns a
nd a
ssoc
iate
pro
fess
iona
ls3.
42.
93.
95.
75.
06.
52.
42.
02.
8
4. C
lerk
s1.
61.
81.
53.
23.
03.
31.
01.
30.
7
5. S
ervi
ce w
orke
rs a
nd m
arke
t sal
es w
orke
rs16
.011
.520
.727
.619
.636
.011
.08.
014
.2
6. S
kille
d ag
ricul
tura
l, fo
rest
ry a
nd fi
sher
y w
orke
rs12
.713
.811
.55.
56.
44.
515
.817
.014
.5
7. C
raft
and
rela
ted
wor
kers
11.8
16.3
7.0
13.8
18.7
8.5
10.9
15.2
6.3
8. P
lant
, mac
hine
ope
rato
r and
ass
embl
ers
7.3
8.8
5.7
11.5
14.3
8.4
5.4
6.3
4.5
9. E
lem
enta
ry o
ccup
atio
ns
40.8
38.2
43.4
17.6
17.1
18.1
50.7
47.3
54.3
R1
Nor
ther
n M
idla
nds a
nd M
ount
ains
100.
010
0.0
100.
010
0.0
100.
010
0.0
100.
010
0.0
100.
0
1. L
eade
rs, m
anag
ers a
nd a
dmin
istra
tors
of b
ranc
hes,
leve
ls a
nd o
rgan
izat
ions
1.0
1.5
0.5
3.2
4.7
1.8
0.6
0.9
0.3
2. P
rofe
ssio
nals
3.4
2.9
3.9
13.1
11.6
14.5
1.5
1.2
1.8
3. T
echn
icia
ns a
nd a
ssoc
iate
pro
fess
iona
ls3.
42.
74.
19.
37.
810
.72.
31.
82.
8
4. C
lerk
s0.
80.
90.
62.
02.
02.
00.
50.
70.
4
5. S
ervi
ce w
orke
rs a
nd m
arke
t sal
es w
orke
rs7.
66.
09.
222
.816
.728
.64.
74.
15.
3
6. S
kille
d ag
ricul
tura
l, fo
rest
ry a
nd fi
sher
y w
orke
rs4.
65.
43.
73.
23.
43.
14.
85.
83.
9
7. C
raft
and
rela
ted
wor
kers
7.1
11.0
3.3
11.2
16.5
6.2
6.4
9.9
2.8
8. P
lant
, mac
hine
ope
rato
r and
ass
embl
ers
3.1
4.7
1.6
6.6
10.8
2.6
2.5
3.5
1.4
9. E
lem
enta
ry o
ccup
atio
ns
68.9
64.9
73.0
28.6
26.5
30.6
76.7
72.0
81.4
Tab
le 1
0ST
RU
CTU
RE
OF
EMPL
OY
ED P
OPU
LATI
ON
AG
ED 1
5 A
ND
AB
OV
E B
Y O
CC
UPA
TIO
N, 2
012
Occ
upat
ion/
Adm
inis
tratio
n
Uni
t: %
Who
le c
ount
ryU
rban
Rur
al
96

Tab
le 1
0 (c
ontin
ue)
Tota
lM
ale
Fem
ale
Tota
lM
ale
Fem
ale
Tota
lM
ale
Fem
ale
R2
Red
Riv
er D
elta
(*)
100.
010
0.0
100.
010
0.0
100.
010
0.0
100.
010
0.0
100.
0
1. L
eade
rs, m
anag
ers a
nd a
dmin
istra
tors
of b
ranc
hes,
leve
ls a
nd o
rgan
izat
ions
1.0
1.6
0.5
2.1
2.9
1.3
0.7
1.1
0.3
2. P
rofe
ssio
nals
4.2
4.0
4.4
10.6
10.4
10.8
2.3
2.0
2.6
3. T
echn
icia
ns a
nd a
ssoc
iate
pro
fess
iona
ls3.
32.
83.
75.
85.
06.
72.
62.
22.
9
4. C
lerk
s1.
41.
71.
12.
93.
02.
90.
91.
30.
6
5. S
ervi
ce w
orke
rs a
nd m
arke
t sal
es w
orke
rs15
.512
.518
.527
.819
.936
.411
.910
.213
.6
6. S
kille
d ag
ricul
tura
l, fo
rest
ry a
nd fi
sher
y w
orke
rs5.
75.
36.
23.
43.
23.
76.
46.
06.
8
7. C
raft
and
rela
ted
wor
kers
16.0
25.3
7.0
15.2
22.9
6.9
16.3
26.1
7.0
8. P
lant
, mac
hine
ope
rato
r and
ass
embl
ers
11.4
12.4
10.4
14.3
17.8
10.5
10.5
10.7
10.4
9. E
lem
enta
ry o
ccup
atio
ns
41.4
34.3
48.2
17.8
15.0
20.8
48.3
40.4
55.8
R3
Nor
th a
nd S
outh
Cen
tral
Coa
st10
0.0
100.
010
0.0
100.
010
0.0
100.
010
0.0
100.
010
0.0
1. L
eade
rs, m
anag
ers a
nd a
dmin
istra
tors
of b
ranc
hes,
leve
ls a
nd o
rgan
izat
ions
1.0
1.6
0.4
2.3
3.4
1.1
0.6
1.0
0.2
2. P
rofe
ssio
nals
4.3
4.1
4.4
10.9
10.6
11.3
2.0
1.8
2.1
3. T
echn
icia
ns a
nd a
ssoc
iate
pro
fess
iona
ls3.
32.
63.
95.
54.
36.
72.
52.
13.
0
4. C
lerk
s1.
31.
51.
12.
42.
32.
60.
91.
20.
5
5. S
ervi
ce w
orke
rs a
nd m
arke
t sal
es w
orke
rs14
.38.
620
.027
.415
.539
.49.
86.
213
.5
6. S
kille
d ag
ricul
tura
l, fo
rest
ry a
nd fi
sher
y w
orke
rs22
.322
.222
.410
.311
.69.
026
.325
.826
.9
7. C
raft
and
rela
ted
wor
kers
11.4
17.1
5.6
14.1
20.3
7.7
10.5
16.0
4.8
8. P
lant
, mac
hine
ope
rato
r and
ass
embl
ers
4.0
6.4
1.6
7.1
11.1
3.1
3.0
4.8
1.1
9. E
lem
enta
ry o
ccup
atio
ns
38.2
35.9
40.6
20.0
20.8
19.1
44.4
41.1
47.8
Rur
al
Uni
t: %
Who
le c
ount
ryU
rban
Occ
upat
ion/
Adm
inis
tratio
n
97

Tab
le 1
0 (c
ontin
ue)
Tota
lM
ale
Fem
ale
Tota
lM
ale
Fem
ale
Tota
lM
ale
Fem
ale
Rur
al
Uni
t: %
Who
le c
ount
ryU
rban
Occ
upat
ion/
Adm
inis
tratio
n
R4
Cen
tral
Hig
hlan
ds10
0.0
100.
010
0.0
100.
010
0.0
100.
010
0.0
100.
010
0.0
1. L
eade
rs, m
anag
ers a
nd a
dmin
istra
tors
of b
ranc
hes,
leve
ls a
nd o
rgan
izat
ions
0.9
1.3
0.4
1.7
2.5
0.9
0.6
0.8
0.3
2. P
rofe
ssio
nals
3.7
3.2
4.2
8.3
7.8
8.7
1.9
1.4
2.3
3. T
echn
icia
ns a
nd a
ssoc
iate
pro
fess
iona
ls3.
12.
63.
75.
54.
46.
62.
21.
92.
5
4. C
lerk
s0.
70.
80.
61.
11.
11.
20.
50.
70.
3
5. S
ervi
ce w
orke
rs a
nd m
arke
t sal
es w
orke
rs9.
85.
814
.217
.610
.425
.06.
74.
09.
7
6. S
kille
d ag
ricul
tura
l, fo
rest
ry a
nd fi
sher
y w
orke
rs21
.227
.214
.616
.420
.312
.423
.129
.915
.5
7. C
raft
and
rela
ted
wor
kers
5.9
8.1
3.6
10.1
14.1
6.0
4.3
5.8
2.5
8. P
lant
, mac
hine
ope
rato
r and
ass
embl
ers
2.2
3.8
0.5
4.6
8.1
1.0
1.3
2.1
0.3
9. E
lem
enta
ry o
ccup
atio
ns
52.4
47.1
58.2
34.7
31.3
38.2
59.5
53.2
66.6
R5
Sout
heas
t (*)
100.
010
0.0
100.
010
0.0
100.
010
0.0
100.
010
0.0
100.
01.
Lea
ders
, man
ager
s and
adm
inis
trato
rs o
f bra
nche
s, le
vels
and
org
aniz
atio
ns0.
81.
10.
41.
32.
00.
60.
50.
70.
3
2. P
rofe
ssio
nals
4.5
3.9
5.3
7.3
6.6
7.9
2.9
2.4
3.5
3. T
echn
icia
ns a
nd a
ssoc
iate
pro
fess
iona
ls3.
62.
94.
46.
05.
16.
82.
21.
72.
7
4. C
lerk
s2.
02.
21.
72.
62.
72.
41.
72.
01.
3
5. S
ervi
ce w
orke
rs a
nd m
arke
t sal
es w
orke
rs17
.913
.123
.122
.117
.226
.915
.310
.820
.5
6. S
kille
d ag
ricul
tura
l, fo
rest
ry a
nd fi
sher
y w
orke
rs14
.315
.812
.64.
66.
42.
820
.221
.119
.2
7. C
raft
and
rela
ted
wor
kers
14.3
17.9
10.3
18.7
24.3
13.3
11.5
14.3
8.3
8. P
lant
, mac
hine
ope
rato
r and
ass
embl
ers
15.3
13.9
16.8
24.2
21.8
26.6
9.8
9.5
10.1
9. E
lem
enta
ry o
ccup
atio
ns
27.4
29.1
25.5
13.4
14.0
12.7
36.0
37.6
34.1
98

Tab
le 1
0 (c
ontin
ue)
Tota
lM
ale
Fem
ale
Tota
lM
ale
Fem
ale
Tota
lM
ale
Fem
ale
Rur
al
Uni
t: %
Who
le c
ount
ryU
rban
Occ
upat
ion/
Adm
inis
tratio
n
R6
Mek
ong
Riv
er D
elta
100.
010
0.0
100.
010
0.0
100.
010
0.0
100.
010
0.0
100.
0
1. L
eade
rs, m
anag
ers a
nd a
dmin
istra
tors
of b
ranc
hes,
leve
ls a
nd o
rgan
izat
ions
0.6
0.9
0.3
1.4
1.9
0.9
0.4
0.6
0.2
2. P
rofe
ssio
nals
3.0
2.8
3.3
6.7
6.4
6.9
1.9
1.7
2.0
3. T
echn
icia
ns a
nd a
ssoc
iate
pro
fess
iona
ls2.
42.
32.
53.
93.
54.
41.
91.
91.
9
4. C
lerk
s1.
31.
51.
12.
52.
52.
41.
01.
30.
6
5. S
ervi
ce w
orke
rs a
nd m
arke
t sal
es w
orke
rs17
.911
.825
.333
.122
.644
.813
.18.
618
.8
6. S
kille
d ag
ricul
tura
l, fo
rest
ry a
nd fi
sher
y w
orke
rs18
.820
.916
.48.
610
.76.
322
.023
.819
.8
7. C
raft
and
rela
ted
wor
kers
9.7
10.6
8.7
14.6
17.4
11.5
8.2
8.6
7.8
8. P
lant
, mac
hine
ope
rato
r and
ass
embl
ers
4.5
6.2
2.5
5.9
9.5
1.9
4.1
5.2
2.7
9. E
lem
enta
ry o
ccup
atio
ns
41.7
43.1
39.9
23.3
25.5
20.9
47.4
48.3
46.3
R7
Han
oi C
ity10
0.0
100.
010
0.0
100.
010
0.0
100.
010
0.0
100.
010
0.0
1. L
eade
rs, m
anag
ers a
nd a
dmin
istra
tors
of b
ranc
hes,
leve
ls a
nd o
rgan
izat
ions
1.8
2.8
0.8
3.7
5.6
1.7
0.6
1.0
0.2
2. P
rofe
ssio
nals
15.5
14.9
16.1
32.6
31.3
33.9
4.8
4.2
5.3
3. T
echn
icia
ns a
nd a
ssoc
iate
pro
fess
iona
ls4.
03.
34.
85.
14.
36.
03.
32.
64.
0
4. C
lerk
s2.
83.
12.
44.
03.
84.
32.
02.
61.
3
5. S
ervi
ce w
orke
rs a
nd m
arke
t sal
es w
orke
rs21
.017
.124
.927
.421
.333
.816
.914
.319
.5
6. S
kille
d ag
ricul
tura
l, fo
rest
ry a
nd fi
sher
y w
orke
rs0.
40.
40.
30.
40.
50.
30.
30.
40.
3
7. C
raft
and
rela
ted
wor
kers
18.1
24.7
11.4
8.8
11.8
5.5
24.0
33.1
15.0
8. P
lant
, mac
hine
ope
rato
r and
ass
embl
ers
7.4
10.1
4.7
8.7
12.9
4.2
6.6
8.2
4.9
9. E
lem
enta
ry o
ccup
atio
ns
29.1
23.6
34.6
9.3
8.4
10.2
41.5
33.6
49.5
99

Tab
le 1
0 (c
ontin
ue)
Tota
lM
ale
Fem
ale
Tota
lM
ale
Fem
ale
Tota
lM
ale
Fem
ale
Rur
al
Uni
t: %
Who
le c
ount
ryU
rban
Occ
upat
ion/
Adm
inis
tratio
n
R8
Ho
Chi
Min
h C
ity10
0.0
100.
010
0.0
100.
010
0.0
100.
010
0.0
100.
010
0.0
1. L
eade
rs, m
anag
ers a
nd a
dmin
istra
tors
of b
ranc
hes,
leve
ls a
nd o
rgan
izat
ions
1.7
2.4
1.0
1.9
2.6
1.1
0.8
1.0
0.5
2. P
rofe
ssio
nals
14.9
15.0
14.9
17.1
16.8
17.4
4.6
4.8
4.4
3. T
echn
icia
ns a
nd a
ssoc
iate
pro
fess
iona
ls5.
95.
86.
16.
26.
26.
34.
53.
55.
4
4. C
lerk
s4.
74.
25.
45.
34.
66.
22.
02.
02.
0
5. S
ervi
ce w
orke
rs a
nd m
arke
t sal
es w
orke
rs29
.923
.537
.330
.824
.438
.425
.818
.232
.7
6. S
kille
d ag
ricul
tura
l, fo
rest
ry a
nd fi
sher
y w
orke
rs1.
62.
11.
10.
60.
80.
36.
79.
24.
5
7. C
raft
and
rela
ted
wor
kers
14.0
18.8
8.5
13.7
18.3
8.2
15.6
21.9
10.0
8. P
lant
, mac
hine
ope
rato
r and
ass
embl
ers
17.3
18.8
15.5
16.0
18.4
13.1
23.7
21.4
25.8
9. E
lem
enta
ry o
ccup
atio
ns
9.8
9.4
10.1
8.4
7.9
9.0
16.2
18.0
14.6
Rem
ark:
(*) R
ed R
iver
Del
ta e
xclu
des H
anoi
City
and
Sou
thea
st e
xclu
des H
o C
hi M
inh
City
.
100

Tota
lM
ale
Fem
ale
Tota
lM
ale
Fem
ale
Tota
lM
ale
Fem
ale
WH
OL
E C
OU
NT
RY
100.
010
0.0
100.
010
0.0
100.
010
0.0
100.
010
0.0
100.
0
A. A
gric
ultu
re, f
ores
try a
nd fi
sher
y47
.445
.449
.515
.115
.514
.761
.258
.264
.4
B. M
inin
g an
d qu
arry
ing
0.6
0.8
0.3
0.8
1.1
0.5
0.5
0.7
0.2
C. M
anuf
actu
ring
13.8
12.7
15.0
19.3
17.9
20.7
11.5
10.5
12.5
D. P
rodu
ctio
n an
d di
strib
utio
n of
ele
ctric
ity, g
as, s
team
and
hot
wat
er a
nd a
ir-co
nditi
oner
s0.
30.
40.
10.
50.
80.
20.
10.
20.
0
E. D
istri
butio
n of
wat
er, m
anag
emen
t and
pro
cess
ing
activ
ities
of s
ewag
e an
d w
aste
0.2
0.2
0.2
0.4
0.5
0.3
0.1
0.1
0.1
F. C
onst
ruct
ion
6.4
11.1
1.3
6.5
11.1
1.7
6.3
11.1
1.2
G. W
hole
sale
and
reta
il tra
de, r
epai
r of c
ars,
mot
orcy
cles
and
oth
er m
otor
veh
icle
s12
.310
.014
.719
.916
.323
.79.
07.
310
.8
H. T
rans
port
and
stor
age
2.9
5.1
0.6
5.3
9.1
1.3
1.9
3.4
0.3
I. H
otel
s and
rest
aura
nts
4.2
2.4
6.0
8.6
5.1
12.3
2.3
1.3
3.3
J. In
form
atio
n an
d co
mm
unic
atio
n0.
60.
70.
41.
41.
71.
10.
20.
20.
1
K. F
inan
cial
inte
rmed
iatio
n, b
anki
ng a
nd in
sura
nce
0.6
0.5
0.7
1.6
1.3
1.9
0.2
0.2
0.2
L.R
eal e
stat
e ac
tiviti
es0.
30.
30.
30.
80.
80.
80.
10.
10.
1
M. T
echn
olog
ical
, sci
entif
ic a
nd sp
icili
zed
activ
ities
0.5
0.6
0.3
1.3
1.6
0.9
0.1
0.2
0.1
N. A
dmin
istra
tive
activ
ities
and
supp
ortin
g se
rvic
es0.
40.
50.
41.
01.
20.
80.
20.
20.
2
O. A
ctiv
ities
of c
omm
unis
t par
ty, s
ocia
l-pol
itica
l org
aniz
atio
ns, g
over
nmen
tal
man
agem
ent,
natio
nal d
efen
ce se
curit
y; c
ompu
lsor
y so
cial
secu
rity
3.1
4.4
1.6
5.6
7.6
3.5
2.0
3.0
0.8
P. T
rain
ing
and
educ
atio
n3.
42.
05.
05.
73.
28.
42.
51.
43.
5
Q. H
ealth
and
soci
al w
ork
0.9
0.7
1.2
1.8
1.3
2.4
0.6
0.4
0.7
R. R
ecre
atio
nal c
ultu
ral a
nd sp
ortin
g ac
tiviti
es0.
50.
50.
51.
00.
91.
20.
30.
20.
3
S. O
ther
serv
ice
activ
ities
1.4
1.6
1.3
2.5
2.6
2.4
0.9
1.1
0.8
T. A
ctiv
ities
of d
omes
tic h
ired
labo
urer
s in
hous
ehol
ds w
hich
pro
duci
ng p
rodu
cts a
nd
serv
ices
con
sum
ing
by th
emse
lves
0.
30.
00.
60.
70.
11.
30.
20.
00.
4
U. E
xtra
terr
itoria
l org
aniz
atio
ns a
nd b
odie
s0.
00.
00.
00.
00.
00.
00.
00.
00.
0
Urb
anR
ural
Tab
le 1
1
Indu
stry
/Adm
inis
tratio
n
STR
UC
TUR
E O
F EM
PLO
YED
PO
PULA
TIO
N A
GED
15
AN
D A
BO
VE
BY
IND
UST
RY
, 201
2U
nit:
%
Who
le c
ount
ry
101

Tab
le 1
1 (c
ontin
ue)
Tota
lM
ale
Fem
ale
Tota
lM
ale
Fem
ale
Tota
lM
ale
Fem
ale
R1.
Nor
ther
n M
idla
nds a
nd M
ount
ains
100.
010
0.0
100.
010
0.0
100.
010
0.0
100.
010
0.0
100.
0
A. A
gric
ultu
re, f
ores
try a
nd fi
sher
y70
.065
.574
.426
.824
.029
.578
.273
.283
.3B
. Min
ing
and
quar
ryin
g0.
71.
10.
20.
71.
10.
40.
71.
10.
2C
. Man
ufac
turin
g6.
47.
05.
811
.312
.410
.35.
46.
04.
9D
. Pro
duct
ion
and
dist
ribut
ion
of e
lect
ricity
, gas
, ste
am a
nd h
ot w
ater
and
air-
cond
ition
ers
0.2
0.4
0.1
0.9
1.5
0.4
0.1
0.2
0.0
E. D
istri
butio
n of
wat
er, m
anag
emen
t and
pro
cess
ing
activ
ities
of s
ewag
e an
d w
aste
0.1
0.2
0.1
0.6
0.6
0.5
0.0
0.1
0.0
F. C
onst
ruct
ion
4.7
8.5
1.0
5.7
9.8
1.9
4.5
8.2
0.8
G. W
hole
sale
and
reta
il tra
de, r
epai
r of c
ars,
mot
orcy
cles
and
oth
er m
otor
veh
icle
s6.
15.
17.
217
.212
.821
.34.
03.
64.
4H
. Tra
nspo
rt an
d st
orag
e1.
62.
90.
24.
17.
60.
71.
12.
10.
1I.
Hot
els a
nd re
stau
rant
s1.
20.
81.
54.
73.
45.
90.
50.
40.
6J.
Info
rmat
ion
and
com
mun
icat
ion
0.2
0.3
0.2
1.1
1.4
0.7
0.1
0.1
0.1
K. F
inan
cial
inte
rmed
iatio
n, b
anki
ng a
nd in
sura
nce
0.3
0.3
0.2
1.4
1.4
1.3
0.1
0.1
0.0
L.R
eal e
stat
e ac
tiviti
es0.
00.
00.
00.
10.
10.
00.
00.
00.
0M
. Tec
hnol
ogic
al, s
cien
tific
and
spic
ilize
d ac
tiviti
es0.
10.
20.
10.
60.
80.
40.
10.
10.
0N
. Adm
inis
trativ
e ac
tiviti
es a
nd su
ppor
ting
serv
ices
0.1
0.1
0.1
0.4
0.4
0.4
0.1
0.1
0.1
O. A
ctiv
ities
of c
omm
unis
t par
ty, s
ocia
l-pol
itica
l org
aniz
atio
ns, g
over
nmen
tal
man
agem
ent,
natio
nal d
efen
ce se
curit
y; c
ompu
lsor
y so
cial
secu
rity
3.1
4.5
1.6
9.8
13.6
6.1
1.8
2.8
0.7
P. T
rain
ing
and
educ
atio
n3.
71.
85.
59.
94.
814
.72.
51.
33.
7Q
. Hea
lth a
nd so
cial
wor
k0.
70.
40.
92.
31.
53.
00.
40.
20.
5R
. Rec
reat
iona
l cul
tura
l and
spor
ting
activ
ities
0.1
0.1
0.1
0.5
0.5
0.4
0.0
0.0
0.0
S. O
ther
serv
ice
activ
ities
0.6
0.8
0.4
1.8
2.2
1.5
0.3
0.5
0.2
T. A
ctiv
ities
of d
omes
tic h
ired
labo
urer
s in
hous
ehol
ds w
hich
pro
duci
ng p
rodu
cts a
nd
serv
ices
con
sum
ing
by th
emse
lves
0.
20.
00.
30.
30.
10.
50.
20.
00.
3U
. Ext
ra te
rrito
rial o
rgan
izat
ions
and
bod
ies
0.0
0.0
0.0
0.0
0.0
0.0
0.0
0.0
0.0
Rur
al
Uni
t: %
Who
le c
ount
ryIn
dust
ry/A
dmin
istra
tion
Urb
an
102

Tab
le 1
1 (c
ontin
ue)
Tota
lM
ale
Fem
ale
Tota
lM
ale
Fem
ale
Tota
lM
ale
Fem
ale
Rur
al
Uni
t: %
Who
le c
ount
ryIn
dust
ry/A
dmin
istra
tion
Urb
an
R2.
Red
Riv
er D
elta
(*)
100.
010
0.0
100.
010
0.0
100.
010
0.0
100.
010
0.0
100.
0
A. A
gric
ultu
re, f
ores
try a
nd fi
sher
y40
.733
.447
.813
.811
.616
.148
.640
.156
.5
B. M
inin
g an
d qu
arry
ing
1.6
2.4
0.7
4.2
5.5
2.8
0.8
1.4
0.2
C. M
anuf
actu
ring
18.1
17.2
19.0
19.7
19.3
20.1
17.6
16.5
18.7
D. P
rodu
ctio
n an
d di
strib
utio
n of
ele
ctric
ity, g
as, s
team
and
hot
wat
er a
nd a
ir-co
nditi
oner
s0.
20.
30.
10.
71.
00.
30.
10.
10.
0
E. D
istri
butio
n of
wat
er, m
anag
emen
t and
pro
cess
ing
activ
ities
of s
ewag
e an
d w
aste
0.3
0.3
0.3
0.7
0.7
0.6
0.1
0.1
0.2
F. C
onst
ruct
ion
9.7
16.8
2.8
7.3
11.4
2.8
10.4
18.4
2.8
G. W
hole
sale
and
reta
il tra
de, r
epai
r of c
ars,
mot
orcy
cles
and
oth
er m
otor
veh
icle
s13
.511
.115
.921
.516
.227
.111
.29.
512
.8
H. T
rans
port
and
stor
age
3.5
6.5
0.6
6.2
10.5
1.6
2.7
5.2
0.4
I. H
otel
s and
rest
aura
nts
2.4
1.9
2.8
6.1
4.2
8.1
1.3
1.2
1.3
J. In
form
atio
n an
d co
mm
unic
atio
n0.
40.
40.
31.
01.
10.
80.
20.
20.
2
K. F
inan
cial
inte
rmed
iatio
n, b
anki
ng a
nd in
sura
nce
0.4
0.4
0.5
1.2
1.0
1.4
0.2
0.2
0.2
L.R
eal e
stat
e ac
tiviti
es0.
10.
10.
10.
20.
20.
20.
00.
00.
0
M. T
echn
olog
ical
, sci
entif
ic a
nd sp
icili
zed
activ
ities
0.2
0.3
0.1
0.5
0.6
0.3
0.1
0.2
0.1
N. A
dmin
istra
tive
activ
ities
and
supp
ortin
g se
rvic
es0.
50.
60.
41.
01.
20.
70.
30.
40.
3O
. Act
iviti
es o
f com
mun
ist p
arty
, soc
ial-p
oliti
cal o
rgan
izat
ions
, gov
ernm
enta
l m
anag
emen
t, na
tiona
l def
ence
secu
rity;
com
puls
ory
soci
al se
curit
y2.
84.
51.
25.
57.
93.
02.
03.
40.
7
P. T
rain
ing
and
educ
atio
n3.
21.
54.
95.
22.
68.
12.
61.
24.
0
Q. H
ealth
and
soci
al w
ork
0.7
0.5
0.9
1.7
1.2
2.3
0.5
0.3
0.6
R. R
ecre
atio
nal c
ultu
ral a
nd sp
ortin
g ac
tiviti
es0.
20.
20.
30.
80.
61.
00.
10.
10.
1
S. O
ther
serv
ice
activ
ities
1.2
1.7
0.8
2.4
3.1
1.7
0.9
1.3
0.5
T. A
ctiv
ities
of d
omes
tic h
ired
labo
urer
s in
hous
ehol
ds w
hich
pro
duci
ng p
rodu
cts a
nd
serv
ices
con
sum
ing
by th
emse
lves
0.
30.
00.
50.
50.
10.
80.
30.
00.
5
U. E
xtra
terr
itoria
l org
aniz
atio
ns a
nd b
odie
s0.
00.
00.
00.
00.
00.
00.
00.
00.
0
103
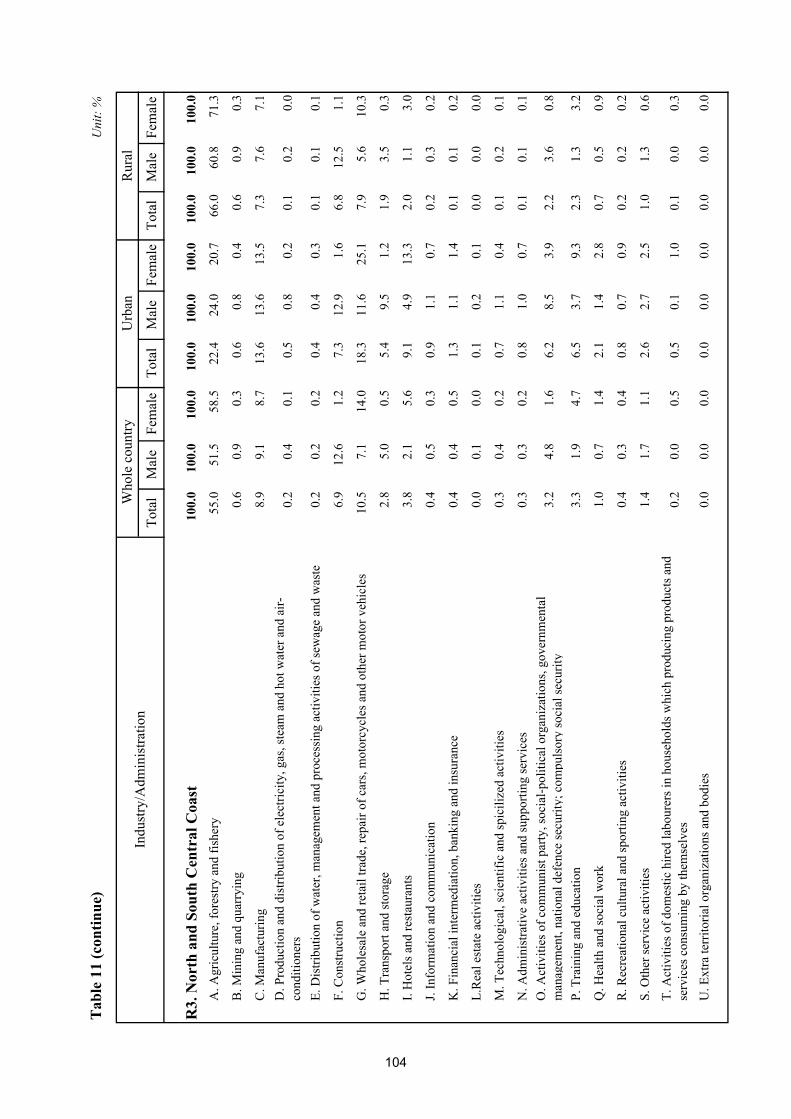
Tab
le 1
1 (c
ontin
ue)
Tota
lM
ale
Fem
ale
Tota
lM
ale
Fem
ale
Tota
lM
ale
Fem
ale
Rur
al
Uni
t: %
Who
le c
ount
ryIn
dust
ry/A
dmin
istra
tion
Urb
an
R3.
Nor
th a
nd S
outh
Cen
tral
Coa
st10
0.0
100.
010
0.0
100.
010
0.0
100.
010
0.0
100.
010
0.0
A. A
gric
ultu
re, f
ores
try a
nd fi
sher
y55
.051
.558
.522
.424
.020
.766
.060
.871
.3
B. M
inin
g an
d qu
arry
ing
0.6
0.9
0.3
0.6
0.8
0.4
0.6
0.9
0.3
C. M
anuf
actu
ring
8.9
9.1
8.7
13.6
13.6
13.5
7.3
7.6
7.1
D. P
rodu
ctio
n an
d di
strib
utio
n of
ele
ctric
ity, g
as, s
team
and
hot
wat
er a
nd a
ir-co
nditi
oner
s0.
20.
40.
10.
50.
80.
20.
10.
20.
0
E. D
istri
butio
n of
wat
er, m
anag
emen
t and
pro
cess
ing
activ
ities
of s
ewag
e an
d w
aste
0.2
0.2
0.2
0.4
0.4
0.3
0.1
0.1
0.1
F. C
onst
ruct
ion
6.9
12.6
1.2
7.3
12.9
1.6
6.8
12.5
1.1
G. W
hole
sale
and
reta
il tra
de, r
epai
r of c
ars,
mot
orcy
cles
and
oth
er m
otor
veh
icle
s10
.57.
114
.018
.311
.625
.17.
95.
610
.3
H. T
rans
port
and
stor
age
2.8
5.0
0.5
5.4
9.5
1.2
1.9
3.5
0.3
I. H
otel
s and
rest
aura
nts
3.8
2.1
5.6
9.1
4.9
13.3
2.0
1.1
3.0
J. In
form
atio
n an
d co
mm
unic
atio
n0.
40.
50.
30.
91.
10.
70.
20.
30.
2
K. F
inan
cial
inte
rmed
iatio
n, b
anki
ng a
nd in
sura
nce
0.4
0.4
0.5
1.3
1.1
1.4
0.1
0.1
0.2
L.R
eal e
stat
e ac
tiviti
es0.
00.
10.
00.
10.
20.
10.
00.
00.
0
M. T
echn
olog
ical
, sci
entif
ic a
nd sp
icili
zed
activ
ities
0.3
0.4
0.2
0.7
1.1
0.4
0.1
0.2
0.1
N. A
dmin
istra
tive
activ
ities
and
supp
ortin
g se
rvic
es0.
30.
30.
20.
81.
00.
70.
10.
10.
1O
. Act
iviti
es o
f com
mun
ist p
arty
, soc
ial-p
oliti
cal o
rgan
izat
ions
, gov
ernm
enta
l m
anag
emen
t, na
tiona
l def
ence
secu
rity;
com
puls
ory
soci
al se
curit
y3.
24.
81.
66.
28.
53.
92.
23.
60.
8
P. T
rain
ing
and
educ
atio
n3.
31.
94.
76.
53.
79.
32.
31.
33.
2
Q. H
ealth
and
soci
al w
ork
1.0
0.7
1.4
2.1
1.4
2.8
0.7
0.5
0.9
R. R
ecre
atio
nal c
ultu
ral a
nd sp
ortin
g ac
tiviti
es0.
40.
30.
40.
80.
70.
90.
20.
20.
2
S. O
ther
serv
ice
activ
ities
1.4
1.7
1.1
2.6
2.7
2.5
1.0
1.3
0.6
T. A
ctiv
ities
of d
omes
tic h
ired
labo
urer
s in
hous
ehol
ds w
hich
pro
duci
ng p
rodu
cts a
nd
serv
ices
con
sum
ing
by th
emse
lves
0.
20.
00.
50.
50.
11.
00.
10.
00.
3
U. E
xtra
terr
itoria
l org
aniz
atio
ns a
nd b
odie
s0.
00.
00.
00.
00.
00.
00.
00.
00.
0
104

Tab
le 1
1 (c
ontin
ue)
Tota
lM
ale
Fem
ale
Tota
lM
ale
Fem
ale
Tota
lM
ale
Fem
ale
Rur
al
Uni
t: %
Who
le c
ount
ryIn
dust
ry/A
dmin
istra
tion
Urb
an
R4.
Cen
tral
Hig
hlan
ds10
0.0
100.
010
0.0
100.
010
0.0
100.
010
0.0
100.
010
0.0
A. A
gric
ultu
re, f
ores
try a
nd fi
sher
y71
.271
.870
.646
.346
.546
.181
.281
.580
.8
B. M
inin
g an
d qu
arry
ing
0.2
0.3
0.0
0.4
0.8
0.1
0.1
0.2
0.0
C. M
anuf
actu
ring
4.8
4.8
4.9
7.9
7.6
8.2
3.6
3.7
3.5
D. P
rodu
ctio
n an
d di
strib
utio
n of
ele
ctric
ity, g
as, s
team
and
hot
wat
er a
nd a
ir-co
nditi
oner
s0.
20.
40.
00.
50.
90.
10.
10.
20.
0
E. D
istri
butio
n of
wat
er, m
anag
emen
t and
pro
cess
ing
activ
ities
of s
ewag
e an
d w
aste
0.2
0.1
0.2
0.4
0.4
0.4
0.1
0.0
0.2
F. C
onst
ruct
ion
2.8
4.9
0.5
5.3
9.1
1.4
1.8
3.3
0.1
G. W
hole
sale
and
reta
il tra
de, r
epai
r of c
ars,
mot
orcy
cles
and
oth
er m
otor
veh
icle
s7.
55.
29.
913
.19.
516
.85.
23.
57.
0
H. T
rans
port
and
stor
age
1.3
2.4
0.2
3.3
6.1
0.4
0.6
1.0
0.1
I. H
otel
s and
rest
aura
nts
2.2
1.2
3.4
4.9
2.3
7.4
1.2
0.7
1.7
J. In
form
atio
n an
d co
mm
unic
atio
n0.
20.
30.
20.
60.
80.
50.
00.
10.
0
K. F
inan
cial
inte
rmed
iatio
n, b
anki
ng a
nd in
sura
nce
0.4
0.4
0.4
0.9
0.8
1.1
0.1
0.2
0.1
L.R
eal e
stat
e ac
tiviti
es0.
00.
00.
00.
10.
10.
00.
00.
00.
0
M. T
echn
olog
ical
, sci
entif
ic a
nd sp
icili
zed
activ
ities
0.3
0.4
0.1
0.6
0.9
0.2
0.2
0.2
0.1
N. A
dmin
istra
tive
activ
ities
and
supp
ortin
g se
rvic
es0.
10.
10.
10.
30.
30.
20.
00.
00.
0O
. Act
iviti
es o
f com
mun
ist p
arty
, soc
ial-p
oliti
cal o
rgan
izat
ions
, gov
ernm
enta
l m
anag
emen
t, na
tiona
l def
ence
secu
rity;
com
puls
ory
soci
al se
curit
y3.
14.
51.
65.
67.
93.
22.
13.
11.
0
P. T
rain
ing
and
educ
atio
n3.
71.
95.
66.
33.
19.
52.
61.
44.
0
Q. H
ealth
and
soci
al w
ork
0.6
0.4
0.8
1.3
0.9
1.8
0.3
0.3
0.4
R. R
ecre
atio
nal c
ultu
ral a
nd sp
ortin
g ac
tiviti
es0.
30.
10.
40.
60.
40.
80.
10.
00.
2
S. O
ther
serv
ice
activ
ities
0.9
0.9
0.9
1.6
1.5
1.6
0.6
0.6
0.6
T. A
ctiv
ities
of d
omes
tic h
ired
labo
urer
s in
hous
ehol
ds w
hich
pro
duci
ng p
rodu
cts a
nd
serv
ices
con
sum
ing
by th
emse
lves
0.
00.
00.
10.
10.
00.
20.
00.
00.
0
U. E
xtra
terr
itoria
l org
aniz
atio
ns a
nd b
odie
s0.
00.
00.
00.
00.
00.
00.
00.
00.
0
105

Tab
le 1
1 (c
ontin
ue)
Tota
lM
ale
Fem
ale
Tota
lM
ale
Fem
ale
Tota
lM
ale
Fem
ale
Rur
al
Uni
t: %
Who
le c
ount
ryIn
dust
ry/A
dmin
istra
tion
Urb
an
R5.
Sou
thea
st (*
)10
0.0
100.
010
0.0
100.
010
0.0
100.
010
0.0
100.
010
0.0
A. A
gric
ultu
re, f
ores
try a
nd fi
sher
y34
.837
.831
.59.
411
.96.
950
.452
.348
.1
B. M
inin
g an
d qu
arry
ing
0.4
0.6
0.1
0.7
1.1
0.2
0.2
0.3
0.0
C. M
anuf
actu
ring
27.2
22.4
32.6
41.6
35.6
47.5
18.4
14.9
22.5
D. P
rodu
ctio
n an
d di
strib
utio
n of
ele
ctric
ity, g
as, s
team
and
hot
wat
er a
nd a
ir-co
nditi
oner
s0.
30.
40.
00.
30.
60.
00.
20.
30.
1
E. D
istri
butio
n of
wat
er, m
anag
emen
t and
pro
cess
ing
activ
ities
of s
ewag
e an
d w
aste
0.2
0.2
0.1
0.2
0.3
0.1
0.1
0.2
0.1
F. C
onst
ruct
ion
5.4
9.9
0.5
5.5
10.6
0.6
5.4
9.5
0.5
G. W
hole
sale
and
reta
il tra
de, r
epai
r of c
ars,
mot
orcy
cles
and
oth
er m
otor
veh
icle
s11
.99.
814
.114
.412
.416
.410
.38.
412
.6
H. T
rans
port
and
stor
age
2.6
4.6
0.4
3.6
6.6
0.6
2.0
3.5
0.3
I. H
otel
s and
rest
aura
nts
5.3
2.8
8.0
6.9
3.9
10.0
4.3
2.3
6.7
J. In
form
atio
n an
d co
mm
unic
atio
n0.
40.
60.
20.
71.
10.
30.
20.
30.
1
K. F
inan
cial
inte
rmed
iatio
n, b
anki
ng a
nd in
sura
nce
0.5
0.5
0.6
0.8
0.7
0.9
0.4
0.3
0.4
L.R
eal e
stat
e ac
tiviti
es0.
60.
60.
61.
21.
21.
20.
30.
30.
3
M. T
echn
olog
ical
, sci
entif
ic a
nd sp
icili
zed
activ
ities
0.3
0.4
0.2
0.5
0.6
0.3
0.2
0.3
0.1
N. A
dmin
istra
tive
activ
ities
and
supp
ortin
g se
rvic
es0.
40.
60.
20.
61.
00.
20.
30.
40.
2O
. Act
iviti
es o
f com
mun
ist p
arty
, soc
ial-p
oliti
cal o
rgan
izat
ions
, gov
ernm
enta
l m
anag
emen
t, na
tiona
l def
ence
secu
rity;
com
puls
ory
soci
al se
curit
y2.
94.
11.
54.
16.
12.
22.
13.
01.
1
P. T
rain
ing
and
educ
atio
n3.
31.
65.
24.
62.
17.
12.
51.
33.
9
Q. H
ealth
and
soci
al w
ork
0.9
0.6
1.2
1.3
1.0
1.7
0.6
0.4
0.8
R. R
ecre
atio
nal c
ultu
ral a
nd sp
ortin
g ac
tiviti
es0.
60.
60.
70.
90.
90.
90.
50.
50.
5
S. O
ther
serv
ice
activ
ities
1.7
1.8
1.7
2.1
2.3
1.9
1.5
1.5
1.5
T. A
ctiv
ities
of d
omes
tic h
ired
labo
urer
s in
hous
ehol
ds w
hich
pro
duci
ng p
rodu
cts a
nd
serv
ices
con
sum
ing
by th
emse
lves
0.
30.
00.
50.
40.
00.
70.
20.
00.
4
U. E
xtra
terr
itoria
l org
aniz
atio
ns a
nd b
odie
s0.
00.
00.
00.
00.
00.
00.
00.
00.
0
106

Tab
le 1
1 (c
ontin
ue)
Tota
lM
ale
Fem
ale
Tota
lM
ale
Fem
ale
Tota
lM
ale
Fem
ale
Rur
al
Uni
t: %
Who
le c
ount
ryIn
dust
ry/A
dmin
istra
tion
Urb
an
R6.
Mek
ong
Riv
er D
elta
100.
010
0.0
100.
010
0.0
100.
010
0.0
100.
010
0.0
100.
0
A. A
gric
ultu
re, f
ores
try a
nd fi
sher
y52
.154
.649
.120
.323
.417
.062
.163
.859
.9
B. M
inin
g an
d qu
arry
ing
0.1
0.2
0.1
0.0
0.0
0.0
0.1
0.2
0.1
C. M
anuf
actu
ring
11.1
9.0
13.7
14.0
12.4
15.7
10.2
8.0
13.0
D. P
rodu
ctio
n an
d di
strib
utio
n of
ele
ctric
ity, g
as, s
team
and
hot
wat
er a
nd a
ir-co
nditi
oner
s0.
20.
30.
10.
50.
70.
20.
10.
20.
0
E. D
istri
butio
n of
wat
er, m
anag
emen
t and
pro
cess
ing
activ
ities
of s
ewag
e an
d w
aste
0.1
0.1
0.1
0.2
0.2
0.2
0.1
0.1
0.0
F. C
onst
ruct
ion
5.0
8.6
0.6
6.8
12.0
1.1
4.4
7.6
0.4
G. W
hole
sale
and
reta
il tra
de, r
epai
r of c
ars,
mot
orcy
cles
and
oth
er m
otor
veh
icle
s13
.711
.716
.123
.420
.426
.710
.79.
212
.6
H. T
rans
port
and
stor
age
2.3
3.9
0.5
4.3
7.5
0.8
1.7
2.8
0.4
I. H
otel
s and
rest
aura
nts
5.6
2.4
9.4
11.3
5.6
17.5
3.8
1.5
6.7
J. In
form
atio
n an
d co
mm
unic
atio
n0.
30.
40.
20.
70.
80.
50.
20.
20.
1
K. F
inan
cial
inte
rmed
iatio
n, b
anki
ng a
nd in
sura
nce
0.4
0.4
0.4
1.2
1.2
1.2
0.2
0.2
0.2
L.R
eal e
stat
e ac
tiviti
es0.
10.
10.
00.
20.
20.
20.
00.
00.
0
M. T
echn
olog
ical
, sci
entif
ic a
nd sp
icili
zed
activ
ities
0.2
0.2
0.1
0.4
0.6
0.2
0.1
0.1
0.0
N. A
dmin
istra
tive
activ
ities
and
supp
ortin
g se
rvic
es0.
30.
30.
30.
70.
80.
60.
10.
10.
2O
. Act
iviti
es o
f com
mun
ist p
arty
, soc
ial-p
oliti
cal o
rgan
izat
ions
, gov
ernm
enta
l m
anag
emen
t, na
tiona
l def
ence
secu
rity;
com
puls
ory
soci
al se
curit
y2.
33.
11.
44.
76.
13.
11.
62.
20.
9
P. T
rain
ing
and
educ
atio
n2.
62.
03.
34.
02.
55.
62.
21.
92.
5
Q. H
ealth
and
soci
al w
ork
0.8
0.6
1.0
1.8
1.6
2.1
0.5
0.4
0.6
R. R
ecre
atio
nal c
ultu
ral a
nd sp
ortin
g ac
tiviti
es0.
80.
61.
01.
61.
32.
00.
50.
40.
6
S. O
ther
serv
ice
activ
ities
1.5
1.4
1.6
2.8
2.5
3.1
1.1
1.0
1.1
T. A
ctiv
ities
of d
omes
tic h
ired
labo
urer
s in
hous
ehol
ds w
hich
pro
duci
ng p
rodu
cts a
nd
serv
ices
con
sum
ing
by th
emse
lves
0.
50.
11.
01.
10.
22.
10.
30.
00.
6
U. E
xtra
terr
itoria
l org
aniz
atio
ns a
nd b
odie
s0.
00.
00.
00.
00.
00.
00.
00.
00.
0
107
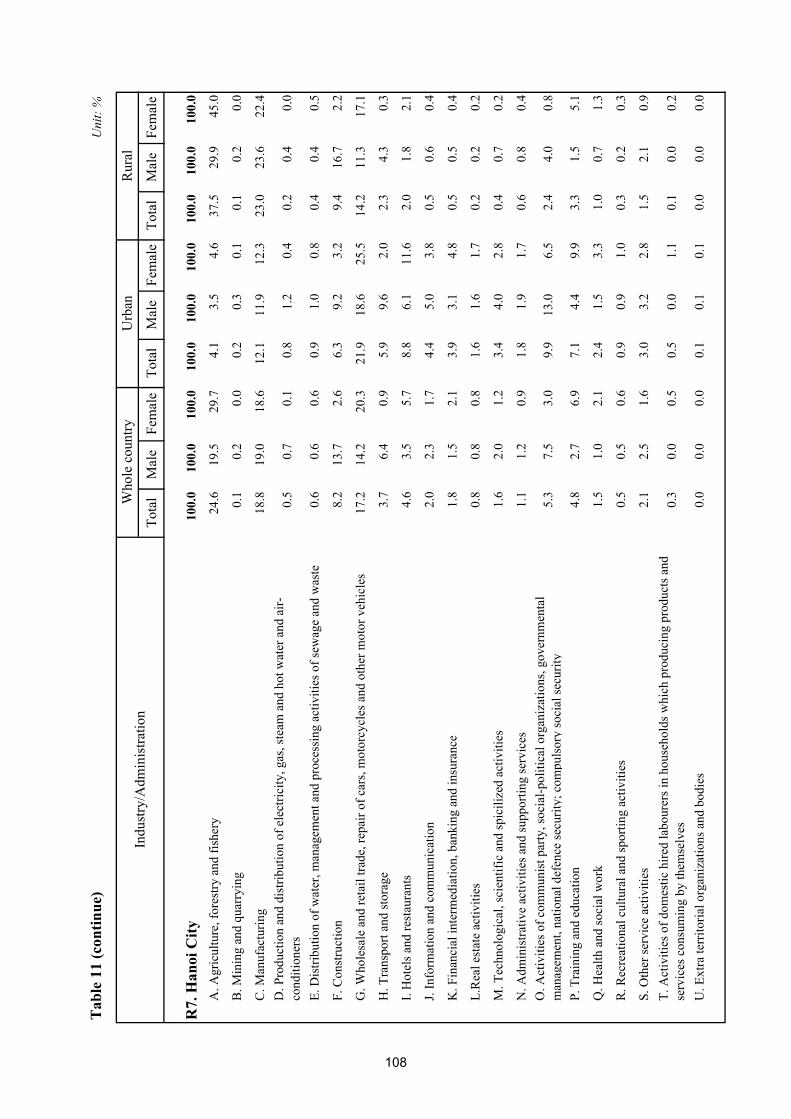
Tab
le 1
1 (c
ontin
ue)
Tota
lM
ale
Fem
ale
Tota
lM
ale
Fem
ale
Tota
lM
ale
Fem
ale
Rur
al
Uni
t: %
Who
le c
ount
ryIn
dust
ry/A
dmin
istra
tion
Urb
an
R7.
Han
oi C
ity10
0.0
100.
010
0.0
100.
010
0.0
100.
010
0.0
100.
010
0.0
A. A
gric
ultu
re, f
ores
try a
nd fi
sher
y24
.619
.529
.74.
13.
54.
637
.529
.945
.0
B. M
inin
g an
d qu
arry
ing
0.1
0.2
0.0
0.2
0.3
0.1
0.1
0.2
0.0
C. M
anuf
actu
ring
18.8
19.0
18.6
12.1
11.9
12.3
23.0
23.6
22.4
D. P
rodu
ctio
n an
d di
strib
utio
n of
ele
ctric
ity, g
as, s
team
and
hot
wat
er a
nd a
ir-co
nditi
oner
s0.
50.
70.
10.
81.
20.
40.
20.
40.
0
E. D
istri
butio
n of
wat
er, m
anag
emen
t and
pro
cess
ing
activ
ities
of s
ewag
e an
d w
aste
0.6
0.6
0.6
0.9
1.0
0.8
0.4
0.4
0.5
F. C
onst
ruct
ion
8.2
13.7
2.6
6.3
9.2
3.2
9.4
16.7
2.2
G. W
hole
sale
and
reta
il tra
de, r
epai
r of c
ars,
mot
orcy
cles
and
oth
er m
otor
veh
icle
s17
.214
.220
.321
.918
.625
.514
.211
.317
.1
H. T
rans
port
and
stor
age
3.7
6.4
0.9
5.9
9.6
2.0
2.3
4.3
0.3
I. H
otel
s and
rest
aura
nts
4.6
3.5
5.7
8.8
6.1
11.6
2.0
1.8
2.1
J. In
form
atio
n an
d co
mm
unic
atio
n2.
02.
31.
74.
45.
03.
80.
50.
60.
4
K. F
inan
cial
inte
rmed
iatio
n, b
anki
ng a
nd in
sura
nce
1.8
1.5
2.1
3.9
3.1
4.8
0.5
0.5
0.4
L.R
eal e
stat
e ac
tiviti
es0.
80.
80.
81.
61.
61.
70.
20.
20.
2
M. T
echn
olog
ical
, sci
entif
ic a
nd sp
icili
zed
activ
ities
1.6
2.0
1.2
3.4
4.0
2.8
0.4
0.7
0.2
N. A
dmin
istra
tive
activ
ities
and
supp
ortin
g se
rvic
es1.
11.
20.
91.
81.
91.
70.
60.
80.
4O
. Act
iviti
es o
f com
mun
ist p
arty
, soc
ial-p
oliti
cal o
rgan
izat
ions
, gov
ernm
enta
l m
anag
emen
t, na
tiona
l def
ence
secu
rity;
com
puls
ory
soci
al se
curit
y5.
37.
53.
09.
913
.06.
52.
44.
00.
8
P. T
rain
ing
and
educ
atio
n4.
82.
76.
97.
14.
49.
93.
31.
55.
1
Q. H
ealth
and
soci
al w
ork
1.5
1.0
2.1
2.4
1.5
3.3
1.0
0.7
1.3
R. R
ecre
atio
nal c
ultu
ral a
nd sp
ortin
g ac
tiviti
es0.
50.
50.
60.
90.
91.
00.
30.
20.
3
S. O
ther
serv
ice
activ
ities
2.1
2.5
1.6
3.0
3.2
2.8
1.5
2.1
0.9
T. A
ctiv
ities
of d
omes
tic h
ired
labo
urer
s in
hous
ehol
ds w
hich
pro
duci
ng p
rodu
cts a
nd
serv
ices
con
sum
ing
by th
emse
lves
0.
30.
00.
50.
50.
01.
10.
10.
00.
2
U. E
xtra
terr
itoria
l org
aniz
atio
ns a
nd b
odie
s0.
00.
00.
00.
10.
10.
10.
00.
00.
0
108
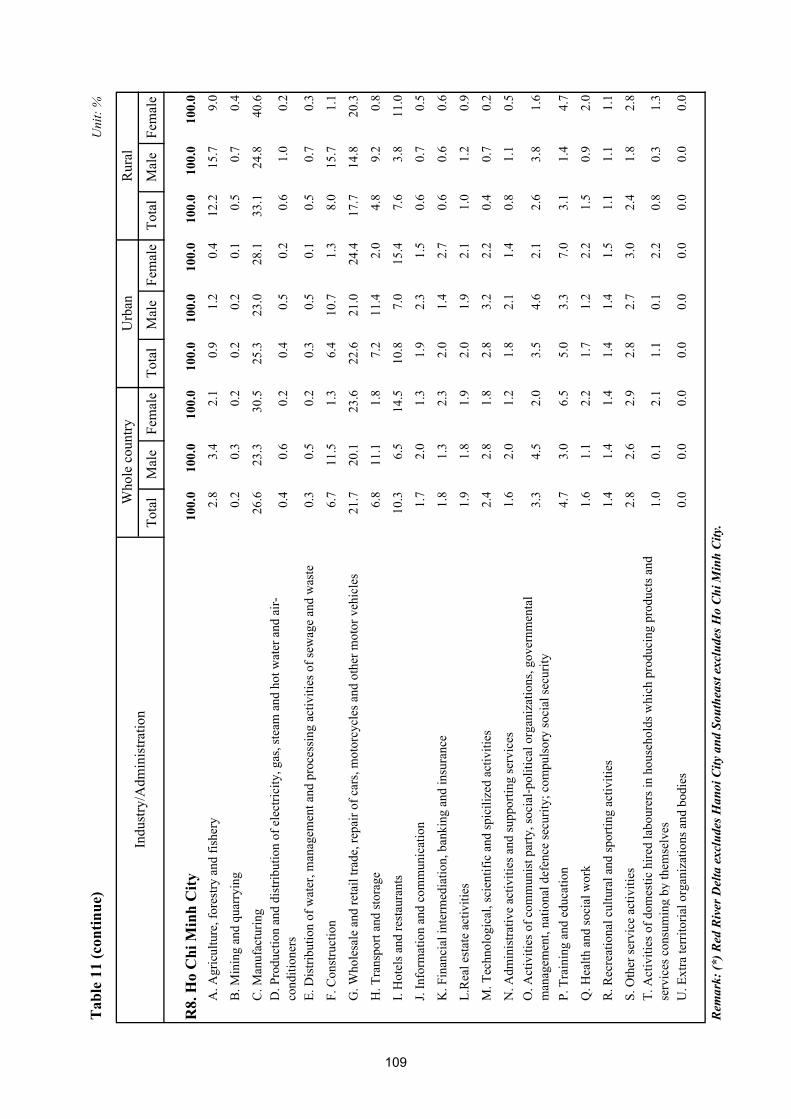
Tab
le 1
1 (c
ontin
ue)
Tota
lM
ale
Fem
ale
Tota
lM
ale
Fem
ale
Tota
lM
ale
Fem
ale
Rur
al
Uni
t: %
Who
le c
ount
ryIn
dust
ry/A
dmin
istra
tion
Urb
an
R8.
Ho
Chi
Min
h C
ity10
0.0
100.
010
0.0
100.
010
0.0
100.
010
0.0
100.
010
0.0
A. A
gric
ultu
re, f
ores
try a
nd fi
sher
y2.
83.
42.
10.
91.
20.
412
.215
.79.
0
B. M
inin
g an
d qu
arry
ing
0.2
0.3
0.2
0.2
0.2
0.1
0.5
0.7
0.4
C. M
anuf
actu
ring
26.6
23.3
30.5
25.3
23.0
28.1
33.1
24.8
40.6
D. P
rodu
ctio
n an
d di
strib
utio
n of
ele
ctric
ity, g
as, s
team
and
hot
wat
er a
nd a
ir-co
nditi
oner
s0.
40.
60.
20.
40.
50.
20.
61.
00.
2
E. D
istri
butio
n of
wat
er, m
anag
emen
t and
pro
cess
ing
activ
ities
of s
ewag
e an
d w
aste
0.3
0.5
0.2
0.3
0.5
0.1
0.5
0.7
0.3
F. C
onst
ruct
ion
6.7
11.5
1.3
6.4
10.7
1.3
8.0
15.7
1.1
G. W
hole
sale
and
reta
il tra
de, r
epai
r of c
ars,
mot
orcy
cles
and
oth
er m
otor
veh
icle
s21
.720
.123
.622
.621
.024
.417
.714
.820
.3
H. T
rans
port
and
stor
age
6.8
11.1
1.8
7.2
11.4
2.0
4.8
9.2
0.8
I. H
otel
s and
rest
aura
nts
10.3
6.5
14.5
10.8
7.0
15.4
7.6
3.8
11.0
J. In
form
atio
n an
d co
mm
unic
atio
n1.
72.
01.
31.
92.
31.
50.
60.
70.
5
K. F
inan
cial
inte
rmed
iatio
n, b
anki
ng a
nd in
sura
nce
1.8
1.3
2.3
2.0
1.4
2.7
0.6
0.6
0.6
L.R
eal e
stat
e ac
tiviti
es1.
91.
81.
92.
01.
92.
11.
01.
20.
9
M. T
echn
olog
ical
, sci
entif
ic a
nd sp
icili
zed
activ
ities
2.4
2.8
1.8
2.8
3.2
2.2
0.4
0.7
0.2
N. A
dmin
istra
tive
activ
ities
and
supp
ortin
g se
rvic
es1.
62.
01.
21.
82.
11.
40.
81.
10.
5O
. Act
iviti
es o
f com
mun
ist p
arty
, soc
ial-p
oliti
cal o
rgan
izat
ions
, gov
ernm
enta
l m
anag
emen
t, na
tiona
l def
ence
secu
rity;
com
puls
ory
soci
al se
curit
y3.
34.
52.
03.
54.
62.
12.
63.
81.
6
P. T
rain
ing
and
educ
atio
n4.
73.
06.
55.
03.
37.
03.
11.
44.
7
Q. H
ealth
and
soci
al w
ork
1.6
1.1
2.2
1.7
1.2
2.2
1.5
0.9
2.0
R. R
ecre
atio
nal c
ultu
ral a
nd sp
ortin
g ac
tiviti
es1.
41.
41.
41.
41.
41.
51.
11.
11.
1
S. O
ther
serv
ice
activ
ities
2.8
2.6
2.9
2.8
2.7
3.0
2.4
1.8
2.8
T. A
ctiv
ities
of d
omes
tic h
ired
labo
urer
s in
hous
ehol
ds w
hich
pro
duci
ng p
rodu
cts a
nd
serv
ices
con
sum
ing
by th
emse
lves
1.
00.
12.
11.
10.
12.
20.
80.
31.
3
U. E
xtra
terr
itoria
l org
aniz
atio
ns a
nd b
odie
s0.
00.
00.
00.
00.
00.
00.
00.
00.
0
Rem
ark:
(*) R
ed R
iver
Del
ta e
xclu
des H
anoi
City
and
Sou
thea
st e
xclu
des H
o C
hi M
inh
City
.
109

Tota
lM
ale
Fem
ale
Tota
lM
ale
Fem
ale
Tota
lM
ale
Fem
ale
WH
OL
E C
OU
NT
RY
100.
010
0.0
100.
010
0.0
100.
010
0.0
100.
010
0.0
100.
0
Self-
empl
oyed
/ hou
seho
ld e
nter
pris
e77
.676
.778
.458
.256
.460
.185
.885
.586
.2
Coo
pera
tive/
colle
ctiv
e0.
30.
40.
20.
30.
40.
20.
30.
40.
1
Priv
ate
ente
rpris
e8.
59.
77.
215
.918
.313
.35.
36.
04.
5
Stat
e10
.410
.99.
819
.820
.818
.86.
36.
66.
0
Fore
ign
inve
sted
ent
erpr
ise
3.3
2.3
4.4
5.8
4.2
7.5
2.2
1.5
3.1
R1
Nor
ther
n M
idla
nds a
nd M
ount
ains
100.
010
0.0
100.
010
0.0
100.
010
0.0
100.
010
0.0
100.
0
Self-
empl
oyed
/ hou
seho
ld e
nter
pris
e86
.185
.786
.661
.459
.263
.490
.990
.691
.2
Coo
pera
tive/
colle
ctiv
e0.
10.
20.
00.
20.
20.
10.
10.
20.
0
Priv
ate
ente
rpris
e3.
03.
72.
26.
68.
64.
82.
22.
81.
7
Stat
e9.
69.
79.
430
.331
.029
.65.
65.
85.
4
Fore
ign
inve
sted
ent
erpr
ise
1.2
0.7
1.7
1.5
1.0
2.1
1.1
0.7
1.6
R2
Red
Riv
er D
elta
(*)
100.
010
0.0
100.
010
0.0
100.
010
0.0
100.
010
0.0
100.
0
Self-
empl
oyed
/ hou
seho
ld e
nter
pris
e75
.774
.576
.858
.656
.161
.280
.680
.181
.1
Coo
pera
tive/
colle
ctiv
e0.
50.
70.
20.
30.
40.
20.
50.
80.
2
Priv
ate
ente
rpris
e10
.211
.88.
713
.515
.011
.99.
210
.87.
8
Stat
e10
.010
.99.
123
.025
.520
.46.
26.
46.
0
Fore
ign
inve
sted
ent
erpr
ise
3.7
2.2
5.2
4.6
3.0
6.3
3.4
1.9
4.9
Urb
anR
ural
Tab
le 1
2
Econ
omic
sect
or/A
dmin
istra
tion
STR
UC
TUR
E O
F EM
PLO
YED
PO
PULA
TIO
N A
GED
15
AN
D A
BO
VE
BY
EC
ON
OM
IC S
ECTO
R, 2
012
Uni
t: %
Who
le c
ount
ry
110
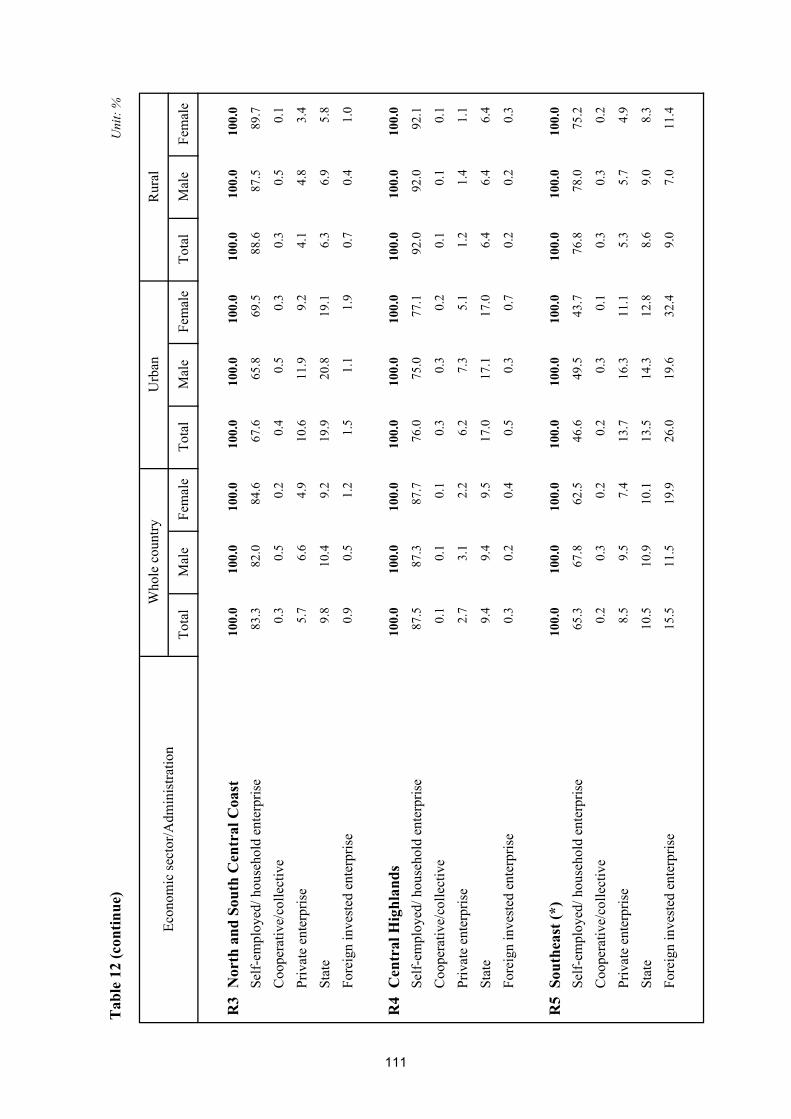
Tab
le 1
2 (c
ontin
ue)
Tota
lM
ale
Fem
ale
Tota
lM
ale
Fem
ale
Tota
lM
ale
Fem
ale
R3
Nor
th a
nd S
outh
Cen
tral
Coa
st10
0.0
100.
010
0.0
100.
010
0.0
100.
010
0.0
100.
010
0.0
Self-
empl
oyed
/ hou
seho
ld e
nter
pris
e83
.382
.084
.667
.665
.869
.588
.687
.589
.7
Coo
pera
tive/
colle
ctiv
e0.
30.
50.
20.
40.
50.
30.
30.
50.
1
Priv
ate
ente
rpris
e5.
76.
64.
910
.611
.99.
24.
14.
83.
4
Stat
e9.
810
.49.
219
.920
.819
.16.
36.
95.
8
Fore
ign
inve
sted
ent
erpr
ise
0.9
0.5
1.2
1.5
1.1
1.9
0.7
0.4
1.0
R4
Cen
tral
Hig
hlan
ds10
0.0
100.
010
0.0
100.
010
0.0
100.
010
0.0
100.
010
0.0
Self-
empl
oyed
/ hou
seho
ld e
nter
pris
e87
.587
.387
.776
.075
.077
.192
.092
.092
.1
Coo
pera
tive/
colle
ctiv
e0.
10.
10.
10.
30.
30.
20.
10.
10.
1
Priv
ate
ente
rpris
e2.
73.
12.
26.
27.
35.
11.
21.
41.
1
Stat
e9.
49.
49.
517
.017
.117
.06.
46.
46.
4
Fore
ign
inve
sted
ent
erpr
ise
0.3
0.2
0.4
0.5
0.3
0.7
0.2
0.2
0.3
R5
Sout
heas
t (*)
100.
010
0.0
100.
010
0.0
100.
010
0.0
100.
010
0.0
100.
0
Self-
empl
oyed
/ hou
seho
ld e
nter
pris
e65
.367
.862
.546
.649
.543
.776
.878
.075
.2
Coo
pera
tive/
colle
ctiv
e0.
20.
30.
20.
20.
30.
10.
30.
30.
2
Priv
ate
ente
rpris
e8.
59.
57.
413
.716
.311
.15.
35.
74.
9
Stat
e10
.510
.910
.113
.514
.312
.88.
69.
08.
3
Fore
ign
inve
sted
ent
erpr
ise
15.5
11.5
19.9
26.0
19.6
32.4
9.0
7.0
11.4
Rur
al
Uni
t: %
Who
le c
ount
ryEc
onom
ic se
ctor
/Adm
inis
tratio
nU
rban
111
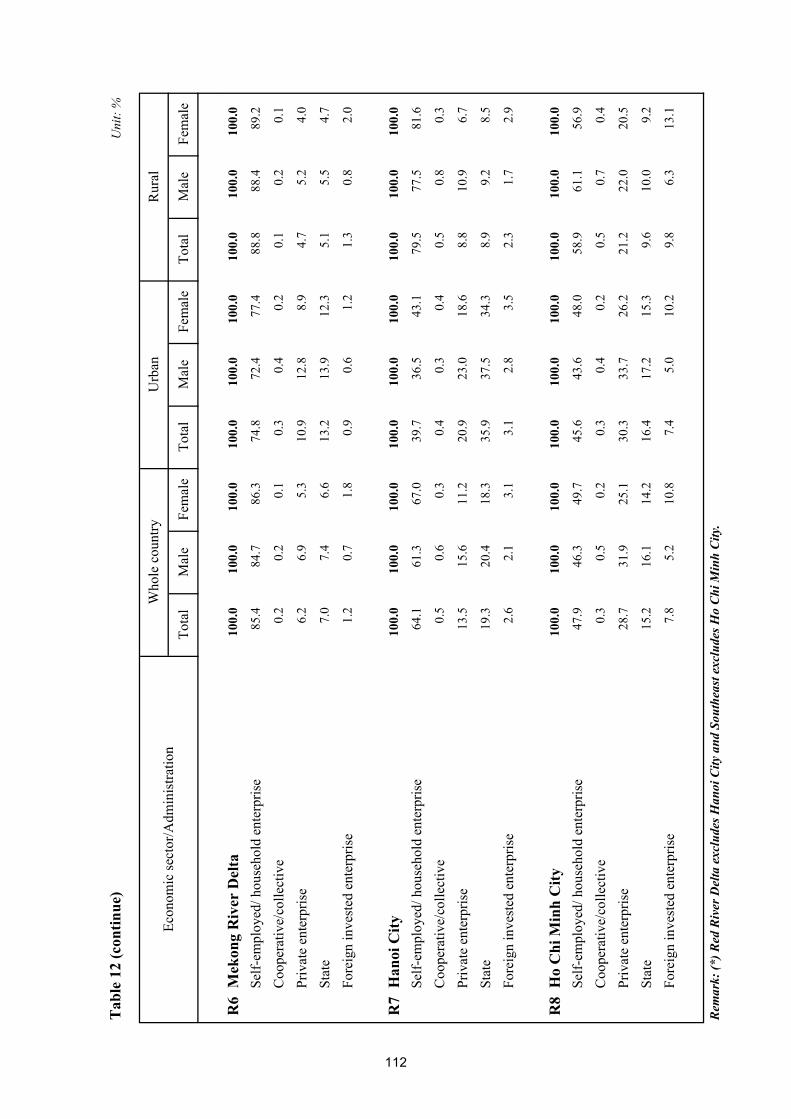
Tab
le 1
2 (c
ontin
ue)
Tota
lM
ale
Fem
ale
Tota
lM
ale
Fem
ale
Tota
lM
ale
Fem
ale
Rur
al
Uni
t: %
Who
le c
ount
ryEc
onom
ic se
ctor
/Adm
inis
tratio
nU
rban
R6
Mek
ong
Riv
er D
elta
100.
010
0.0
100.
010
0.0
100.
010
0.0
100.
010
0.0
100.
0
Self-
empl
oyed
/ hou
seho
ld e
nter
pris
e85
.484
.786
.374
.872
.477
.488
.888
.489
.2
Coo
pera
tive/
colle
ctiv
e0.
20.
20.
10.
30.
40.
20.
10.
20.
1
Priv
ate
ente
rpris
e6.
26.
95.
310
.912
.88.
94.
75.
24.
0
Stat
e7.
07.
46.
613
.213
.912
.35.
15.
54.
7
Fore
ign
inve
sted
ent
erpr
ise
1.2
0.7
1.8
0.9
0.6
1.2
1.3
0.8
2.0
R7
Han
oi C
ity10
0.0
100.
010
0.0
100.
010
0.0
100.
010
0.0
100.
010
0.0
Self-
empl
oyed
/ hou
seho
ld e
nter
pris
e64
.161
.367
.039
.736
.543
.179
.577
.581
.6
Coo
pera
tive/
colle
ctiv
e0.
50.
60.
30.
40.
30.
40.
50.
80.
3
Priv
ate
ente
rpris
e13
.515
.611
.220
.923
.018
.68.
810
.96.
7
Stat
e19
.320
.418
.335
.937
.534
.38.
99.
28.
5
Fore
ign
inve
sted
ent
erpr
ise
2.6
2.1
3.1
3.1
2.8
3.5
2.3
1.7
2.9
R8
Ho
Chi
Min
h C
ity10
0.0
100.
010
0.0
100.
010
0.0
100.
010
0.0
100.
010
0.0
Self-
empl
oyed
/ hou
seho
ld e
nter
pris
e47
.946
.349
.745
.643
.648
.058
.961
.156
.9
Coo
pera
tive/
colle
ctiv
e0.
30.
50.
20.
30.
40.
20.
50.
70.
4
Priv
ate
ente
rpris
e28
.731
.925
.130
.333
.726
.221
.222
.020
.5
Stat
e15
.216
.114
.216
.417
.215
.39.
610
.09.
2
Fore
ign
inve
sted
ent
erpr
ise
7.8
5.2
10.8
7.4
5.0
10.2
9.8
6.3
13.1
Rem
ark:
(*) R
ed R
iver
Del
ta e
xclu
des H
anoi
City
and
Sou
thea
st e
xclu
des H
o C
hi M
inh
City
.
112

Total Male Female Total Male Female Total Male Female
WHOLE COUNTRYTotal 100.0 100.0 100.0 100.0 100.0 100.0 100.0 100.0 100.0
Employer 2.7 3.7 1.7 4.6 5.8 3.3 1.9 2.7 1.0
Own-account worker 45.1 44.2 46.1 33.1 29.6 36.8 50.3 50.5 50.1
Unpaid family worker 17.5 12.1 23.1 9.7 7.5 12.1 20.8 14.1 27.8
Wage worker 34.7 40.0 29.1 52.6 57.0 47.8 27.1 32.7 21.1
Member of cooperatives 0.0 0.0 0.0 0.0 0.0 0.0 0.0 0.0 0.0
R1 Northern Midlands and MountainsTotal 100.0 100.0 100.0 100.0 100.0 100.0 100.0 100.0 100.0
Employer 1.2 1.7 0.7 3.4 4.6 2.4 0.8 1.2 0.3
Own-account worker 50.8 54.6 46.9 40.6 37.6 43.5 52.7 57.8 47.6
Unpaid family worker 28.3 19.8 36.8 11.8 9.1 14.4 31.5 21.8 41.2
Wage worker 19.7 23.8 15.6 44.1 48.7 39.7 15.0 19.2 10.8
Member of cooperatives 0.0 0.0 0.0 0.0 0.0 0.0 0.0 0.0 0.0
R2 Red River Delta (*)Total 100.0 100.0 100.0 100.0 100.0 100.0 100.0 100.0 100.0
Employer 2.4 3.9 1.0 3.8 5.7 1.8 2.0 3.4 0.7
Own-account worker 49.4 45.0 53.7 37.7 32.5 43.3 52.9 48.9 56.6
Unpaid family worker 11.5 6.6 16.3 7.9 5.4 10.6 12.6 7.0 17.8
Wage worker 36.6 44.3 29.0 50.6 56.4 44.2 32.5 40.6 24.8
Member of cooperatives 0.1 0.1 0.1 0.0 0.0 0.0 0.1 0.1 0.1
R3 North and South Central CoastTotal 100.0 100.0 100.0 100.0 100.0 100.0 100.0 100.0 100.0
Employer 2.4 3.4 1.4 4.4 5.8 3.0 1.7 2.6 0.8
Own-account worker 49.2 46.6 51.8 38.8 32.7 45.0 52.7 51.4 54.1
Unpaid family worker 18.3 12.4 24.4 9.9 8.2 11.6 21.2 13.8 28.7
Wage worker 30.0 37.5 22.4 46.9 53.3 40.4 24.3 32.2 16.3
Member of cooperatives 0.0 0.0 0.1 0.0 0.0 0.0 0.0 0.0 0.1
Urban Rural
Table 13
Status of employment/ Administration
STRUCTURE OF EMPLOYED POPULATION AGED 15 BY STATUS OF EMPLOYMENT, 2012
Unit: %
Whole country
113

Table 13 (continue)
Total Male Female Total Male Female Total Male Female
R4 Central HighlandsTotal 100.0 100.0 100.0 100.0 100.0 100.0 100.0 100.0 100.0
Employer 2.0 2.5 1.4 3.2 4.2 2.2 1.4 1.8 1.0
Own-account worker 53.3 54.9 51.6 47.2 44.8 49.7 55.8 58.8 52.4
Unpaid family worker 23.8 19.7 28.3 15.0 12.1 17.9 27.3 22.6 32.6
Wage worker 20.8 22.9 18.6 34.5 38.9 30.1 15.4 16.8 13.8
Member of cooperatives 0.1 0.1 0.1 0.0 0.0 0.0 0.1 0.1 0.1
R5 Southeast (*)Total 100.0 100.0 100.0 100.0 100.0 100.0 100.0 100.0 100.0
Employer 2.7 3.8 1.5 3.3 4.8 1.9 2.3 3.2 1.2
Own-account worker 32.5 33.9 30.9 23.0 21.9 24.0 38.3 40.7 35.5
Unpaid family worker 14.1 9.7 19.1 8.3 6.0 10.5 17.8 11.7 24.9
Wage worker 50.7 52.6 48.6 65.4 67.2 63.7 41.6 44.4 38.4
Member of cooperatives 0.0 0.0 0.0 0.0 0.0 0.0 0.0 0.0 0.0
R6 Mekong River DeltaTotal 100.0 100.0 100.0 100.0 100.0 100.0 100.0 100.0 100.0
Employer 3.2 3.7 2.6 5.3 6.0 4.6 2.6 3.1 2.0
Own-account worker 47.4 47.3 47.4 38.8 35.9 41.9 50.0 50.7 49.2
Unpaid family worker 17.9 13.1 23.7 13.8 10.1 18.0 19.2 14.0 25.7
Wage worker 31.5 35.8 26.2 42.1 47.9 35.6 28.2 32.3 23.1
Member of cooperatives 0.0 0.0 0.0 0.0 0.0 0.0 0.0 0.0 0.0
R7 Hanoi CityTotal 100.0 100.0 100.0 100.0 100.0 100.0 100.0 100.0 100.0
Employer 4.0 5.8 2.2 6.1 7.8 4.4 2.6 4.5 0.8
Own-account worker 35.0 32.8 37.3 22.2 20.5 24.0 43.1 40.8 45.4
Unpaid family worker 14.8 8.8 21.0 8.2 6.1 10.5 19.0 10.6 27.3
Wage worker 46.1 52.6 39.5 63.3 65.6 60.9 35.3 44.1 26.5
Member of cooperatives 0.0 0.0 0.0 0.1 0.0 0.1 0.0 0.0 0.0
R8 Ho Chi Minh CityTotal 100.0 100.0 100.0 100.0 100.0 100.0 100.0 100.0 100.0
Employer 4.8 5.7 3.7 5.4 6.3 4.4 1.5 2.2 0.9
Own-account worker 26.1 23.4 29.1 24.8 22.1 28.0 32.3 30.4 34.0
Unpaid family worker 7.1 5.8 8.6 6.8 5.8 8.0 8.8 6.0 11.3
Wage worker 62.0 65.0 58.6 63.0 65.7 59.7 57.3 61.1 53.9
Member of cooperatives 0.1 0.1 0.0 0.0 0.1 0.0 0.1 0.2 0.1
Remark: (*) Red River Delta excludes Hanoi City and Southeast excludes Ho Chi Minh City.
Rural
Unit: %
Whole countryStatus of employment/ Administration
Urban
114
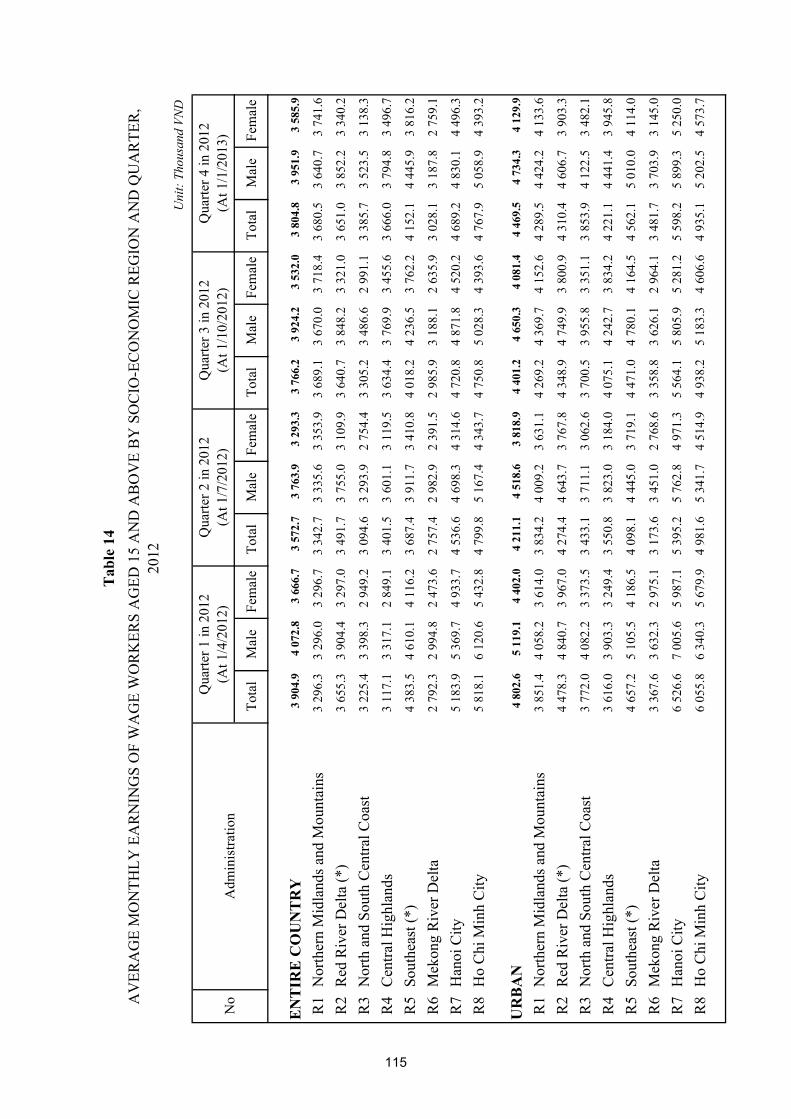
Tota
lM
ale
Fem
ale
Tota
lM
ale
Fem
ale
Tota
lM
ale
Fem
ale
Tota
lM
ale
Fem
ale
EN
TIR
E C
OU
NT
RY
3 90
4.9
4 07
2.8
3 66
6.7
3 57
2.7
3 76
3.9
3 29
3.3
3 76
6.2
3 92
4.2
3 53
2.0
3 80
4.8
3 95
1.9
3 58
5.9
R1
Nor
ther
n M
idla
nds a
nd M
ount
ains
3 29
6.3
3 29
6.0
3 29
6.7
3 34
2.7
3 33
5.6
3 35
3.9
3 68
9.1
3 67
0.0
3 71
8.4
3 68
0.5
3 64
0.7
3 74
1.6
R2
Red
Riv
er D
elta
(*)
3 65
5.3
3 90
4.4
3 29
7.0
3 49
1.7
3 75
5.0
3 10
9.9
3 64
0.7
3 84
8.2
3 32
1.0
3 65
1.0
3 85
2.2
3 34
0.2
R3
Nor
th a
nd S
outh
Cen
tral C
oast
3 22
5.4
3 39
8.3
2 94
9.2
3 09
4.6
3 29
3.9
2 75
4.4
3 30
5.2
3 48
6.6
2 99
1.1
3 38
5.7
3 52
3.5
3 13
8.3
R4
Cen
tral H
ighl
ands
3 11
7.1
3 31
7.1
2 84
9.1
3 40
1.5
3 60
1.1
3 11
9.5
3 63
4.4
3 76
9.9
3 45
5.6
3 66
6.0
3 79
4.8
3 49
6.7
R5
Sout
heas
t (*)
4 38
3.5
4 61
0.1
4 11
6.2
3 68
7.4
3 91
1.7
3 41
0.8
4 01
8.2
4 23
6.5
3 76
2.2
4 15
2.1
4 44
5.9
3 81
6.2
R6
Mek
ong
Riv
er D
elta
2 79
2.3
2 99
4.8
2 47
3.6
2 75
7.4
2 98
2.9
2 39
1.5
2 98
5.9
3 18
8.1
2 63
5.9
3 02
8.1
3 18
7.8
2 75
9.1
R7
Han
oi C
ity5
183.
95
369.
74
933.
74
536.
64
698.
34
314.
64
720.
84
871.
84
520.
24
689.
24
830.
14
496.
3
R8
Ho
Chi
Min
h C
ity5
818.
16
120.
65
432.
84
799.
85
167.
44
343.
74
750.
85
028.
34
393.
64
767.
95
058.
94
393.
2
UR
BA
N4
802.
65
119.
14
402.
04
211.
14
518.
63
818.
94
401.
24
650.
34
081.
44
469.
54
734.
34
129.
9
R1
Nor
ther
n M
idla
nds a
nd M
ount
ains
3 85
1.4
4 05
8.2
3 61
4.0
3 83
4.2
4 00
9.2
3 63
1.1
4 26
9.2
4 36
9.7
4 15
2.6
4 28
9.5
4 42
4.2
4 13
3.6
R2
Red
Riv
er D
elta
(*)
4 47
8.3
4 84
0.7
3 96
7.0
4 27
4.4
4 64
3.7
3 76
7.8
4 34
8.9
4 74
9.9
3 80
0.9
4 31
0.4
4 60
6.7
3 90
3.3
R3
Nor
th a
nd S
outh
Cen
tral C
oast
3 77
2.0
4 08
2.2
3 37
3.5
3 43
3.1
3 71
1.1
3 06
2.6
3 70
0.5
3 95
5.8
3 35
1.1
3 85
3.9
4 12
2.5
3 48
2.1
R4
Cen
tral H
ighl
ands
3 61
6.0
3 90
3.3
3 24
9.4
3 55
0.8
3 82
3.0
3 18
4.0
4 07
5.1
4 24
2.7
3 83
4.2
4 22
1.1
4 44
1.4
3 94
5.8
R5
Sout
heas
t (*)
4 65
7.2
5 10
5.5
4 18
6.5
4 09
8.1
4 44
5.0
3 71
9.1
4 47
1.0
4 78
0.1
4 16
4.5
4 56
2.1
5 01
0.0
4 11
4.0
R6
Mek
ong
Riv
er D
elta
3 36
7.6
3 63
2.3
2 97
5.1
3 17
3.6
3 45
1.0
2 76
8.6
3 35
8.8
3 62
6.1
2 96
4.1
3 48
1.7
3 70
3.9
3 14
5.0
R7
Han
oi C
ity6
526.
67
005.
65
987.
15
395.
25
762.
84
971.
35
564.
15
805.
95
281.
25
598.
25
899.
35
250.
0
R8
Ho
Chi
Min
h C
ity6
055.
86
340.
35
679.
94
981.
65
341.
74
514.
94
938.
25
183.
34
606.
64
935.
15
202.
54
573.
7
Tab
le 1
4A
VER
AG
E M
ON
THLY
EA
RN
ING
S O
F W
AG
E W
OR
KER
S A
GED
15
AN
D A
BO
VE
BY
SO
CIO
-EC
ON
OM
IC R
EGIO
N A
ND
QU
AR
TER
, 20
12U
nit:
Thou
sand
VN
D
No
Adm
inis
tratio
n
Qua
rter 1
in 2
012
(At 1
/4/2
012)
Qua
rter 4
in 2
012
(At 1
/1/2
013)
Qua
rter 2
in 2
012
(At 1
/7/2
012)
Qua
rter 3
in 2
012
(At 1
/10/
2012
)
115

Tab
le 1
4 (c
ontin
ue)
Tota
lM
ale
Fem
ale
Tota
lM
ale
Fem
ale
Tota
lM
ale
Fem
ale
Tota
lM
ale
Fem
ale
RU
RA
L3
157.
53
274.
52
974.
73
036.
03
191.
62
780.
43
219.
83
364.
42
976.
53
257.
23
375.
03
058.
6
R1
Nor
ther
n M
idla
nds a
nd M
ount
ains
2 98
7.5
2 93
7.0
3 07
3.9
3 07
4.1
3 03
2.4
3 15
2.2
3 34
1.7
3 32
0.7
3 37
9.8
3 33
9.0
3 27
4.6
3 45
5.4
R2
Red
Riv
er D
elta
(*)
3 27
5.5
3 47
7.3
2 98
2.6
3 13
7.3
3 36
5.8
2 79
7.4
3 31
2.2
3 45
8.5
3 07
3.6
3 35
0.8
3 53
1.5
3 05
6.0
R3
Nor
th a
nd S
outh
Cen
tral C
oast
2 86
1.9
3 00
4.9
2 59
6.2
2 85
9.2
3 04
7.1
2 47
4.0
3 03
8.3
3 21
4.1
2 67
8.1
3 09
6.7
3 20
8.0
2 85
9.9
R4
Cen
tral H
ighl
ands
2 69
9.8
2 84
5.4
2 49
6.6
3 26
4.8
3 40
5.4
3 05
7.2
3 22
3.0
3 29
6.1
3 13
4.1
3 16
7.2
3 23
7.5
3 07
0.5
R5
Sout
heas
t (*)
4 12
1.8
4 18
3.6
4 04
0.2
3 29
8.3
3 45
7.4
3 07
8.1
3 55
6.5
3 76
2.7
3 26
9.0
3 75
2.1
3 95
9.7
3 48
1.4
R6
Mek
ong
Riv
er D
elta
2 52
5.1
2 70
8.7
2 22
7.8
2 55
2.3
2 76
6.0
2 18
6.6
2 80
7.0
2 99
5.9
2 45
3.2
2 82
6.1
2 97
1.0
2 57
0.0
R7
Han
oi C
ity3
682.
93
815.
23
464.
33
592.
83
696.
93
418.
83
734.
53
901.
83
475.
93
602.
13
738.
03
372.
9
R8
Ho
Chi
Min
h C
ity4
529.
44
793.
44
253.
73
833.
64
114.
23
557.
13
749.
84
070.
03
433.
73
873.
14
174.
73
572.
0
Rem
ark:
(*) R
ed R
iver
Del
ta e
xclu
des H
anoi
City
and
Sou
thea
st e
xclu
des H
o C
hi M
inh
City
.
Uni
t: Th
ousa
nd V
ND
No
Adm
inis
tratio
n
Qua
rter 1
in 2
012
(At 1
/4/2
012)
Qua
rter 2
in 2
012
(At 1
/7/2
012)
Qua
rter 3
in 2
012
(At 1
/10/
2012
)Q
uarte
r 4 in
201
2(A
t 1/1
/201
3)
116
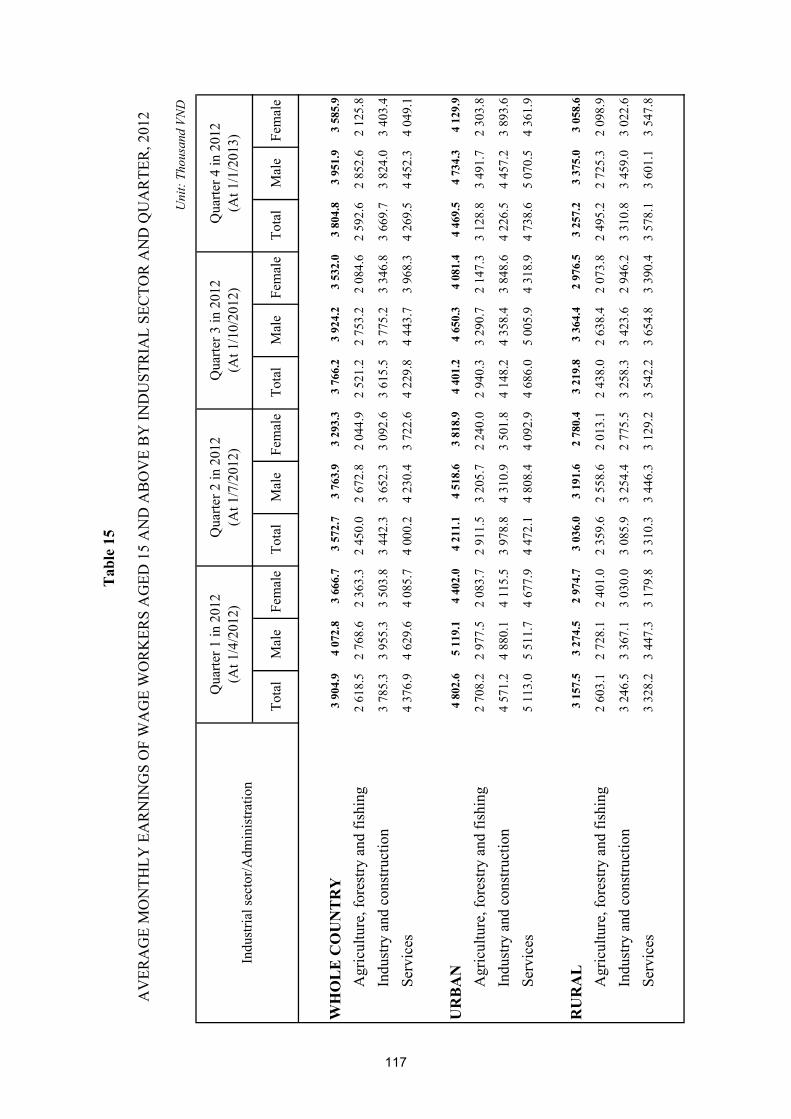
Tota
lM
ale
Fem
ale
Tota
lM
ale
Fem
ale
Tota
lM
ale
Fem
ale
Tota
lM
ale
Fem
ale
WH
OL
E C
OU
NT
RY
3 90
4.9
4 07
2.8
3 66
6.7
3 57
2.7
3 76
3.9
3 29
3.3
3 76
6.2
3 92
4.2
3 53
2.0
3 80
4.8
3 95
1.9
3 58
5.9
Agr
icul
ture
, for
estry
and
fish
ing
2 61
8.5
2 76
8.6
2 36
3.3
2 45
0.0
2 67
2.8
2 04
4.9
2 52
1.2
2 75
3.2
2 08
4.6
2 59
2.6
2 85
2.6
2 12
5.8
Indu
stry
and
con
stru
ctio
n3
785.
33
955.
33
503.
83
442.
33
652.
33
092.
63
615.
53
775.
23
346.
83
669.
73
824.
03
403.
4
Serv
ices
4 37
6.9
4 62
9.6
4 08
5.7
4 00
0.2
4 23
0.4
3 72
2.6
4 22
9.8
4 44
3.7
3 96
8.3
4 26
9.5
4 45
2.3
4 04
9.1
UR
BA
N4
802.
65
119.
14
402.
04
211.
14
518.
63
818.
94
401.
24
650.
34
081.
44
469.
54
734.
34
129.
9
Agr
icul
ture
, for
estry
and
fish
ing
2 70
8.2
2 97
7.5
2 08
3.7
2 91
1.5
3 20
5.7
2 24
0.0
2 94
0.3
3 29
0.7
2 14
7.3
3 12
8.8
3 49
1.7
2 30
3.8
Indu
stry
and
con
stru
ctio
n4
571.
24
880.
14
115.
53
978.
84
310.
93
501.
84
148.
24
358.
43
848.
64
226.
54
457.
23
893.
6
Serv
ices
5 11
3.0
5 51
1.7
4 67
7.9
4 47
2.1
4 80
8.4
4 09
2.9
4 68
6.0
5 00
5.9
4 31
8.9
4 73
8.6
5 07
0.5
4 36
1.9
RU
RA
L3
157.
53
274.
52
974.
73
036.
03
191.
62
780.
43
219.
83
364.
42
976.
53
257.
23
375.
03
058.
6
Agr
icul
ture
, for
estry
and
fish
ing
2 60
3.1
2 72
8.1
2 40
1.0
2 35
9.6
2 55
8.6
2 01
3.1
2 43
8.0
2 63
8.4
2 07
3.8
2 49
5.2
2 72
5.3
2 09
8.9
Indu
stry
and
con
stru
ctio
n3
246.
53
367.
13
030.
03
085.
93
254.
42
775.
53
258.
33
423.
62
946.
23
310.
83
459.
03
022.
6
Serv
ices
3 32
8.2
3 44
7.3
3 17
9.8
3 31
0.3
3 44
6.3
3 12
9.2
3 54
2.2
3 65
4.8
3 39
0.4
3 57
8.1
3 60
1.1
3 54
7.8
Tab
le 1
5
AV
ERA
GE
MO
NTH
LY E
AR
NIN
GS
OF
WA
GE
WO
RK
ERS
AG
ED 1
5 A
ND
AB
OV
E B
Y IN
DU
STR
IAL
SEC
TOR
AN
D Q
UA
RTE
R, 2
012
Uni
t: Th
ousa
nd V
ND
Qua
rter 1
in 2
012
(At 1
/4/2
012)
Qua
rter 4
in 2
012
(At 1
/1/2
013)
Qua
rter 2
in 2
012
(At 1
/7/2
012)
Qua
rter 3
in 2
012
(At 1
/10/
2012
)In
dust
rial s
ecto
r/Adm
inis
tratio
n
117

Tab
le 1
5 (c
ontin
ue)
Tota
lM
ale
Fem
ale
Tota
lM
ale
Fem
ale
Tota
lM
ale
Fem
ale
Tota
lM
ale
Fem
ale
R1
Nor
ther
n M
idla
nds a
nd M
ount
ains
3 29
6.3
3 29
6.0
3 29
6.7
3 34
2.7
3 33
5.6
3 35
3.9
3 68
9.1
3 67
0.0
3 71
8.4
3 68
0.5
3 64
0.7
3 74
1.6
Agr
icul
ture
, for
estry
and
fish
ing
1 95
5.3
2 01
4.1
1 82
7.3
2 27
9.3
2 43
6.5
1 96
4.9
2 47
1.0
2 57
7.3
2 25
5.0
2 24
4.9
2 38
3.3
2 04
8.5
Indu
stry
and
con
stru
ctio
n3
174.
53
224.
53
060.
52
980.
23
012.
32
895.
53
180.
43
239.
23
029.
13
245.
23
304.
23
096.
3
Serv
ices
3 52
4.0
3 53
9.5
3 50
8.7
3 72
4.9
3 81
5.2
3 63
2.6
4 18
2.1
4 26
5.6
4 09
7.3
4 23
0.4
4 23
8.7
4 22
2.0
R2
Red
Riv
er D
elta
(*)
3 65
5.3
3 90
4.4
3 29
7.0
3 49
1.7
3 75
5.0
3 10
9.9
3 64
0.7
3 84
8.2
3 32
1.0
3 65
1.0
3 85
2.2
3 34
0.2
Agr
icul
ture
, for
estry
and
fish
ing
2 47
2.0
2 42
5.3
2 56
8.0
2 32
8.7
2 40
1.3
2 19
3.6
2 77
4.1
3 09
6.8
2 31
6.0
3 15
4.1
3 49
0.1
2 57
6.4
Indu
stry
and
con
stru
ctio
n3
595.
63
886.
43
146.
73
319.
33
617.
72
865.
03
488.
03
697.
93
150.
53
521.
43
760.
93
130.
7
Serv
ices
3 84
1.9
4 06
3.9
3 56
5.7
3 87
4.2
4 11
1.0
3 56
4.5
3 97
9.5
4 19
2.1
3 67
7.4
3 93
0.9
4 06
3.7
3 74
6.7
R3
Nor
th a
nd S
outh
Cen
tral
Coa
st3
225.
43
398.
32
949.
23
094.
63
293.
92
754.
43
305.
23
486.
62
991.
13
385.
73
523.
53
138.
3
Agr
icul
ture
, for
estry
and
fish
ing
2 37
5.1
2 54
9.3
1 95
2.1
2 38
0.1
2 69
0.4
1 67
4.4
2 50
6.2
2 77
5.0
1 74
1.4
2 57
7.0
2 84
0.2
1 87
9.9
Indu
stry
and
con
stru
ctio
n3
101.
83
281.
02
691.
73
007.
13
188.
62
560.
53
164.
63
394.
52
588.
53
224.
93
412.
92
714.
2
Serv
ices
3 58
9.0
3 88
6.8
3 27
1.3
3 39
0.2
3 65
0.9
3 08
1.7
3 66
3.8
3 88
6.7
3 41
1.2
3 81
0.0
3 98
4.2
3 61
6.0
R4
Cen
tral
Hig
hlan
ds3
117.
13
317.
12
849.
13
401.
53
601.
13
119.
53
634.
43
769.
93
455.
63
666.
03
794.
83
496.
7
Agr
icul
ture
, for
estry
and
fish
ing
2 32
3.8
2 55
0.8
2 06
5.1
3 01
1.2
3 36
4.4
2 55
2.0
2 41
4.1
2 49
5.6
2 32
2.3
2 54
9.9
2 70
4.6
2 34
7.8
Indu
stry
and
con
stru
ctio
n3
168.
63
518.
32
194.
13
160.
63
515.
92
372.
73
291.
93
641.
12
503.
03
511.
83
815.
22
685.
6
Serv
ices
3 65
2.3
3 73
3.9
3 56
1.9
3 74
5.8
3 79
5.6
3 68
6.8
4 45
8.5
4 53
9.1
4 36
6.7
4 40
2.5
4 52
5.6
4 27
9.9
Indu
stria
l sec
tor/A
dmin
istra
tion
Uni
t: Th
ousa
nd V
ND
Qua
rter 1
in 2
012
(At 1
/4/2
012)
Qua
rter 2
in 2
012
(At 1
/7/2
012)
Qua
rter 3
in 2
012
(At 1
/10/
2012
)Q
uarte
r 4 in
201
2(A
t 1/1
/201
3)
118

Tab
le 1
5 (c
ontin
ue)
Tota
lM
ale
Fem
ale
Tota
lM
ale
Fem
ale
Tota
lM
ale
Fem
ale
Tota
lM
ale
Fem
ale
Indu
stria
l sec
tor/A
dmin
istra
tion
Uni
t: Th
ousa
nd V
ND
Qua
rter 1
in 2
012
(At 1
/4/2
012)
Qua
rter 2
in 2
012
(At 1
/7/2
012)
Qua
rter 3
in 2
012
(At 1
/10/
2012
)Q
uarte
r 4 in
201
2(A
t 1/1
/201
3)
R5
Sout
heas
t (*)
4 38
3.5
4 61
0.1
4 11
6.2
3 68
7.4
3 91
1.7
3 41
0.8
4 01
8.2
4 23
6.5
3 76
2.2
4 15
2.1
4 44
5.9
3 81
6.2
Agr
icul
ture
, for
estry
and
fish
ing
4 54
2.4
4 53
1.4
4 55
9.1
3 11
2.6
3 30
4.9
2 81
4.3
3 12
4.2
3 32
3.8
2 81
0.9
3 32
8.7
3 58
5.9
2 93
9.5
Indu
stry
and
con
stru
ctio
n4
361.
84
576.
34
133.
53
865.
64
118.
93
582.
94
225.
44
440.
93
988.
84
301.
54
628.
43
953.
2
Serv
ices
4 32
5.9
4 72
4.4
3 83
4.2
3 67
5.3
3 91
7.0
3 35
6.6
4 04
9.3
4 37
5.4
3 67
0.6
4 30
3.9
4 62
4.6
3 93
8.4
R6
Mek
ong
Riv
er D
elta
2 79
2.3
2 99
4.8
2 47
3.6
2 75
7.4
2 98
2.9
2 39
1.5
2 98
5.9
3 18
8.1
2 63
5.9
3 02
8.1
3 18
7.8
2 75
9.1
Agr
icul
ture
, for
estry
and
fish
ing
1 93
1.1
2 19
0.5
1 52
1.9
1 98
5.8
2 20
5.5
1 58
2.1
2 22
4.6
2 48
3.2
1 75
0.8
2 23
4.9
2 52
8.8
1 74
3.4
Indu
stry
and
con
stru
ctio
n2
948.
23
138.
92
583.
42
823.
33
040.
72
415.
62
957.
33
130.
82
606.
83
042.
73
171.
92
781.
5
Serv
ices
3 21
4.0
3 41
0.2
2 95
7.3
3 19
3.3
3 49
6.7
2 79
9.9
3 48
3.5
3 73
7.2
3 12
3.9
3 51
6.1
3 65
4.2
3 32
0.9
R7
Han
oi C
ity5
183.
95
369.
74
933.
74
536.
64
698.
34
314.
64
720.
84
871.
84
520.
24
689.
24
830.
14
496.
3
Agr
icul
ture
, for
estry
and
fish
ing
3 02
7.7
2 88
2.4
3 43
2.1
2 42
3.9
2 59
5.7
2 11
6.4
3 37
9.3
3 82
8.5
2 50
1.1
2 89
0.0
2 84
9.5
2 98
7.5
Indu
stry
and
con
stru
ctio
n4
323.
64
675.
63
713.
33
807.
74
093.
73
321.
74
025.
54
280.
53
607.
03
949.
54
194.
03
481.
1
Serv
ices
5 88
2.0
6 08
1.6
5 66
1.9
5 13
2.3
5 28
6.2
4 95
2.6
5 26
4.0
5 41
1.9
5 09
6.5
5 27
0.0
5 47
2.8
5 05
3.4
R8
Ho
Chi
Min
h C
ity5
818.
16
120.
65
432.
84
799.
85
167.
44
343.
74
750.
85
028.
34
393.
64
767.
95
058.
94
393.
2
Agr
icul
ture
, for
estry
and
fish
ing
2 67
6.2
2 90
7.9
1 78
1.5
4 16
5.8
3 98
1.3
4 63
9.6
3 34
9.7
3 53
0.8
2 74
3.4
3 50
8.3
3 74
3.9
2 13
2.2
Indu
stry
and
con
stru
ctio
n5
258.
95
492.
24
932.
94
482.
54
936.
03
893.
14
443.
74
712.
74
099.
34
539.
94
766.
64
263.
6
Serv
ices
6 33
3.2
6 76
0.1
5 83
6.6
5 07
1.9
5 39
9.0
4 68
6.9
5 01
3.5
5 30
8.5
4 63
7.3
4 96
5.7
5 30
7.9
4 51
1.2
Rem
ark:
(*) R
ed R
iver
Del
ta e
xclu
des H
anoi
City
and
Sou
thea
st e
xclu
des H
o C
hi M
inh
City
.
119
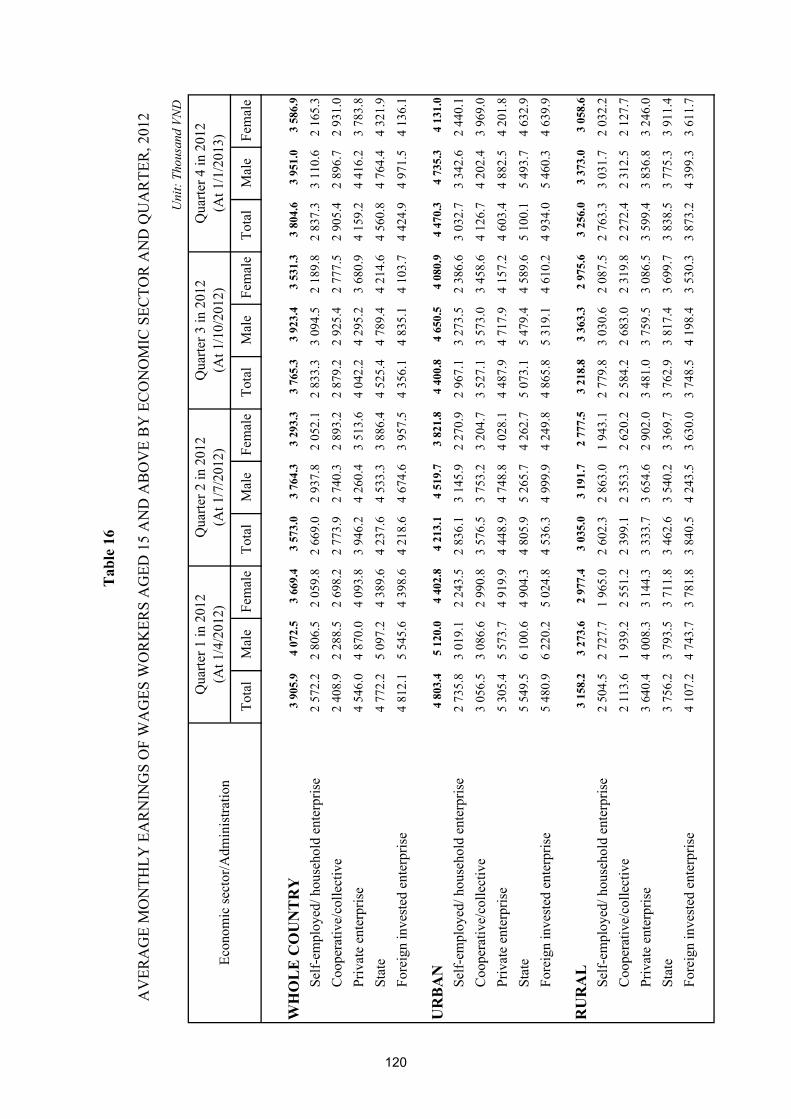
Tota
lM
ale
Fem
ale
Tota
lM
ale
Fem
ale
Tota
lM
ale
Fem
ale
Tota
lM
ale
Fem
ale
WH
OL
E C
OU
NT
RY
3 90
5.9
4 07
2.5
3 66
9.4
3 57
3.0
3 76
4.3
3 29
3.3
3 76
5.3
3 92
3.4
3 53
1.3
3 80
4.6
3 95
1.0
3 58
6.9
Self-
empl
oyed
/ hou
seho
ld e
nter
pris
e2
572.
22
806.
52
059.
82
669.
02
937.
82
052.
12
833.
33
094.
52
189.
82
837.
33
110.
62
165.
3
Coo
pera
tive/
colle
ctiv
e2
408.
92
288.
52
698.
22
773.
92
740.
32
893.
22
879.
22
925.
42
777.
52
905.
42
896.
72
931.
0
Priv
ate
ente
rpris
e4
546.
04
870.
04
093.
83
946.
24
260.
43
513.
64
042.
24
295.
23
680.
94
159.
24
416.
23
783.
8
Stat
e4
772.
25
097.
24
389.
64
237.
64
533.
33
886.
44
525.
44
789.
44
214.
64
560.
84
764.
44
321.
9
Fore
ign
inve
sted
ent
erpr
ise
4 81
2.1
5 54
5.6
4 39
8.6
4 21
8.6
4 67
4.6
3 95
7.5
4 35
6.1
4 83
5.1
4 10
3.7
4 42
4.9
4 97
1.5
4 13
6.1
UR
BA
N4
803.
45
120.
04
402.
84
213.
14
519.
73
821.
84
400.
84
650.
54
080.
94
470.
34
735.
34
131.
0
Self-
empl
oyed
/ hou
seho
ld e
nter
pris
e2
735.
83
019.
12
243.
52
836.
13
145.
92
270.
92
967.
13
273.
52
386.
63
032.
73
342.
62
440.
1
Coo
pera
tive/
colle
ctiv
e3
056.
53
086.
62
990.
83
576.
53
753.
23
204.
73
527.
13
573.
03
458.
64
126.
74
202.
43
969.
0
Priv
ate
ente
rpris
e5
305.
45
573.
74
919.
94
448.
94
748.
84
028.
14
487.
94
717.
94
157.
24
603.
44
882.
54
201.
8
Stat
e5
549.
56
100.
64
904.
34
805.
95
265.
74
262.
75
073.
15
479.
44
589.
65
100.
15
493.
74
632.
9
Fore
ign
inve
sted
ent
erpr
ise
5 48
0.9
6 22
0.2
5 02
4.8
4 53
6.3
4 99
9.9
4 24
9.8
4 86
5.8
5 31
9.1
4 61
0.2
4 93
4.0
5 46
0.3
4 63
9.9
RU
RA
L3
158.
23
273.
62
977.
43
035.
03
191.
72
777.
53
218.
83
363.
32
975.
63
256.
03
373.
03
058.
6
Self-
empl
oyed
/ hou
seho
ld e
nter
pris
e2
504.
52
727.
71
965.
02
602.
32
863.
01
943.
12
779.
83
030.
62
087.
52
763.
33
031.
72
032.
2
Coo
pera
tive/
colle
ctiv
e2
113.
61
939.
22
551.
22
399.
12
353.
32
620.
22
584.
22
683.
02
319.
82
272.
42
312.
52
127.
7
Priv
ate
ente
rpris
e3
640.
44
008.
33
144.
33
333.
73
654.
62
902.
03
481.
03
759.
53
086.
53
599.
43
836.
83
246.
0
Stat
e3
756.
23
793.
53
711.
83
462.
63
540.
23
369.
73
762.
93
817.
43
699.
73
838.
53
775.
33
911.
4
Fore
ign
inve
sted
ent
erpr
ise
4 10
7.2
4 74
3.7
3 78
1.8
3 84
0.5
4 24
3.5
3 63
0.0
3 74
8.5
4 19
8.4
3 53
0.3
3 87
3.2
4 39
9.3
3 61
1.7
Tab
le 1
6
AV
ERA
GE
MO
NTH
LY E
AR
NIN
GS
OF
WA
GES
WO
RK
ERS
AG
ED 1
5 A
ND
AB
OV
E B
Y E
CO
NO
MIC
SEC
TOR
AN
D Q
UA
RTE
R, 2
012
Uni
t: Th
ousa
nd V
ND
Qua
rter 1
in 2
012
(At 1
/4/2
012)
Qua
rter 4
in 2
012
(At 1
/1/2
013)
Qua
rter 2
in 2
012
(At 1
/7/2
012)
Qua
rter 3
in 2
012
(At 1
/10/
2012
)Ec
onom
ic se
ctor
/Adm
inis
tratio
n
120

Tab
le 1
6 (c
ontin
ue)
Tota
lM
ale
Fem
ale
Tota
lM
ale
Fem
ale
Tota
lM
ale
Fem
ale
Tota
lM
ale
Fem
ale
R1
Nor
ther
n M
idla
nds a
nd M
ount
ains
3 29
5.8
3 29
5.5
3 29
6.2
3 34
3.7
3 33
5.8
3 35
6.3
3 68
9.3
3 67
0.0
3 71
8.9
3 67
9.1
3 63
9.8
3 73
9.4
Self-
empl
oyed
/ hou
seho
ld e
nter
pris
e2
495.
82
626.
72
006.
32
610.
12
731.
62
055.
12
834.
72
968.
32
235.
92
786.
72
914.
62
232.
9
Coo
pera
tive/
colle
ctiv
e2
302.
22
297.
52
322.
05
098.
95
001.
55
533.
93
146.
13
310.
52
359.
22
302.
12
318.
02
227.
9
Priv
ate
ente
rpris
e3
434.
63
711.
22
960.
73
254.
83
470.
62
905.
73
145.
43
301.
72
911.
23
425.
63
622.
53
122.
0
Stat
e3
734.
03
770.
13
696.
33
818.
13
903.
73
729.
84
381.
44
457.
74
302.
84
371.
04
387.
64
354.
1
Fore
ign
inve
sted
ent
erpr
ise
3 44
3.7
3 60
1.6
3 38
4.8
3 53
6.5
3 53
6.1
3 53
6.6
3 37
7.5
3 71
4.9
3 20
9.5
3 70
5.4
4 80
1.9
3 32
4.9
R2
Red
Riv
er D
elta
(*)
3 65
6.9
3 90
0.7
3 30
5.6
3 48
8.6
3 75
0.3
3 10
8.5
3 63
8.8
3 84
7.7
3 31
7.6
3 64
7.7
3 84
7.3
3 33
8.8
Self-
empl
oyed
/ hou
seho
ld e
nter
pris
e2
853.
63
026.
02
348.
42
930.
83
167.
02
264.
43
200.
93
407.
72
508.
33
170.
53
438.
52
323.
3
Coo
pera
tive/
colle
ctiv
e2
149.
22
018.
62
583.
22
360.
02
357.
62
373.
42
324.
42
300.
62
373.
22
446.
22
564.
42
020.
8
Priv
ate
ente
rpris
e3
750.
74
126.
03
250.
43
345.
03
644.
72
992.
03
552.
43
799.
13
225.
43
616.
13
868.
73
276.
1
Stat
e4
471.
64
931.
63
939.
44
289.
24
744.
83
780.
64
322.
84
729.
33
851.
34
278.
44
481.
84
020.
6
Fore
ign
inve
sted
ent
erpr
ise
3 88
8.2
5 28
0.4
3 36
0.3
3 91
7.6
5 22
9.2
3 27
4.2
3 79
5.1
4 45
6.0
3 54
1.5
3 80
3.5
4 51
4.9
3 51
3.1
R3
Nor
th a
nd S
outh
Cen
tral
Coa
st3
224.
23
398.
72
944.
93
092.
53
293.
92
747.
53
303.
33
484.
32
989.
83
385.
63
523.
53
138.
2
Self-
empl
oyed
/ hou
seho
ld e
nter
pris
e2
488.
92
682.
21
966.
02
606.
52
868.
41
920.
72
793.
93
050.
02
064.
82
809.
13
046.
02
069.
1
Coo
pera
tive/
colle
ctiv
e2
010.
01
957.
92
146.
11
854.
61
917.
21
465.
72
577.
82
754.
21
948.
71
944.
81
869.
22
179.
6
Priv
ate
ente
rpris
e3
656.
34
092.
93
136.
53
154.
83
475.
22
680.
73
406.
33
792.
12
873.
33
645.
93
974.
93
163.
8
Stat
e3
896.
04
237.
43
502.
43
703.
93
948.
13
414.
03
983.
34
163.
83
767.
94
135.
84
303.
03
954.
3
Fore
ign
inve
sted
ent
erpr
ise
3 90
0.6
4 86
9.2
3 50
5.8
3 51
1.0
4 19
0.5
3 10
5.0
3 24
0.9
3 46
7.3
3 14
4.6
3 57
8.4
4 54
6.8
3 17
1.2
R4
Cen
tral
Hig
hlan
ds3
117.
13
317.
82
848.
53
401.
73
602.
33
118.
53
634.
33
770.
03
455.
23
666.
13
795.
33
496.
4
Self-
empl
oyed
/ hou
seho
ld e
nter
pris
e2
279.
92
576.
91
826.
12
881.
23
204.
22
237.
92
600.
82
859.
72
123.
82
529.
62
829.
52
034.
6
Coo
pera
tive/
colle
ctiv
e2
085.
41
273.
92
816.
63
058.
93
399.
42
466.
82
289.
63
536.
81
707.
32
279.
72
214.
22
309.
2
Priv
ate
ente
rpris
e3
707.
34
222.
62
714.
13
279.
03
785.
62
496.
83
517.
63
920.
62
987.
13
995.
24
536.
83
219.
4
Stat
e3
765.
03
841.
63
678.
93
936.
64
039.
43
828.
84
613.
24
751.
44
467.
34
663.
44
689.
54
635.
0
Fore
ign
inve
sted
ent
erpr
ise
3 58
6.5
4 42
6.7
2 98
6.4
2 90
4.5
2 68
2.3
3 03
3.1
3 85
0.7
5 70
7.4
3 52
2.3
4 35
1.4
4 86
3.1
4 04
6.7
Econ
omic
sect
or/A
dmin
istra
tion
Uni
t: Th
ousa
nd V
ND
Qua
rter 1
in 2
012
(At 1
/4/2
012)
Qua
rter 2
in 2
012
(At 1
/7/2
012)
Qua
rter 3
in 2
012
(At 1
/10/
2012
)Q
uarte
r 4 in
201
2(A
t 1/1
/201
3)
121

Tab
le 1
6 (c
ontin
ue)
Tota
lM
ale
Fem
ale
Tota
lM
ale
Fem
ale
Tota
lM
ale
Fem
ale
Tota
lM
ale
Fem
ale
Econ
omic
sect
or/A
dmin
istra
tion
Uni
t: Th
ousa
nd V
ND
Qua
rter 1
in 2
012
(At 1
/4/2
012)
Qua
rter 2
in 2
012
(At 1
/7/2
012)
Qua
rter 3
in 2
012
(At 1
/10/
2012
)Q
uarte
r 4 in
201
2(A
t 1/1
/201
3)
R5
Sout
heas
t (*)
4 38
4.2
4 61
0.1
4 11
7.5
3 68
8.5
3 91
3.0
3 41
1.8
4 01
8.5
4 23
6.5
3 76
2.7
4 15
1.9
4 44
5.5
3 81
6.4
Self-
empl
oyed
/ hou
seho
ld e
nter
pris
e2
887.
63
184.
82
301.
52
922.
63
246.
12
296.
43
043.
63
367.
82
376.
33
069.
33
426.
42
373.
5C
oope
rativ
e/co
llect
ive
4 06
7.8
4 10
3.0
4 02
1.7
4 24
0.8
4 46
6.7
3 30
4.2
3 66
6.7
3 66
0.1
3 67
3.6
4 40
8.9
5 09
8.1
3 11
3.6
Priv
ate
ente
rpris
e4
749.
95
382.
73
929.
73
926.
74
266.
53
431.
14
177.
14
568.
43
643.
84
383.
14
830.
43
751.
6St
ate
6 06
4.3
6 50
7.9
5 56
7.8
4 28
8.4
4 49
8.7
4 03
1.0
4 76
5.9
5 11
0.6
4 32
8.9
5 09
5.5
5 68
4.2
4 40
9.1
Fore
ign
inve
sted
ent
erpr
ise
4 58
7.6
4 77
9.9
4 45
7.8
4 02
0.6
4 32
4.1
3 81
5.9
4 48
7.6
4 79
0.7
4 30
7.8
4 48
6.8
4 74
7.5
4 32
7.2
R6
Mek
ong
Riv
er D
elta
2 79
1.8
2 99
1.2
2 47
6.7
2 75
6.0
2 98
2.8
2 38
8.8
2 98
5.3
3 18
8.8
2 63
3.3
3 02
7.8
3 18
7.0
2 75
9.2
Self-
empl
oyed
/ hou
seho
ld e
nter
pris
e2
103.
32
394.
41
574.
42
187.
62
471.
21
650.
02
382.
12
673.
71
754.
72
379.
22
693.
81
729.
2C
oope
rativ
e/co
llect
ive
2 10
0.4
2 12
0.6
2 05
8.2
2 88
4.3
2 88
8.9
2 85
8.7
2 64
3.0
2 88
5.1
2 27
4.0
2 99
4.4
3 28
6.7
2 19
2.7
Priv
ate
ente
rpris
e3
374.
93
599.
23
047.
83
325.
33
659.
22
844.
33
441.
23
664.
23
051.
43
484.
93
591.
13
299.
0St
ate
3 83
7.6
3 92
5.7
3 71
2.6
3 68
4.3
3 88
3.3
3 40
1.1
3 92
2.4
4 13
1.7
3 64
9.5
4 06
4.8
4 06
6.5
4 06
2.5
Fore
ign
inve
sted
ent
erpr
ise
3 88
5.6
4 70
5.8
3 33
4.4
3 32
1.0
3 45
1.0
3 25
2.4
3 51
7.4
3 79
1.4
3 39
7.1
3 58
2.6
4 34
4.2
3 27
1.4
R7
Han
oi C
ity5
185.
05
370.
64
935.
14
539.
84
699.
84
319.
94
716.
84
866.
94
518.
24
691.
44
830.
84
500.
5
Self-
empl
oyed
/ hou
seho
ld e
nter
pris
e3
085.
23
299.
02
649.
73
108.
93
344.
12
565.
63
128.
03
347.
22
651.
33
132.
83
345.
92
644.
1C
oope
rativ
e/co
llect
ive
2 87
9.1
2 43
2.4
3 92
8.2
2 15
8.8
1 91
0.8
2 48
9.7
3 00
0.3
3 14
3.5
2 71
1.7
2 99
0.1
2 66
6.3
3 81
6.6
Priv
ate
ente
rpris
e5
712.
05
957.
15
370.
64
746.
34
943.
34
474.
94
926.
65
177.
64
593.
34
974.
55
201.
54
664.
7St
ate
5 79
0.2
6 23
5.4
5 29
0.2
5 01
2.9
5 44
3.4
4 51
2.0
5 37
1.0
5 67
8.1
5 02
6.5
5 19
6.6
5 51
5.8
4 83
7.8
Fore
ign
inve
sted
ent
erpr
ise
7 94
9.5
9 06
7.8
7 14
7.1
6 65
9.6
6 67
3.9
6 65
1.4
5 73
8.0
6 17
0.5
5 48
3.8
6 24
8.0
6 55
7.5
6 00
6.5
R8
Ho
Chi
Min
h C
ity5
817.
56
120.
95
430.
84
802.
75
170.
94
346.
34
751.
45
028.
54
395.
04
771.
95
062.
94
397.
9
Self-
empl
oyed
/ hou
seho
ld e
nter
pris
e3
246.
43
523.
02
839.
13
313.
83
692.
52
672.
53
377.
33
708.
82
834.
73
511.
03
847.
72
960.
5C
oope
rativ
e/co
llect
ive
3 41
3.4
3 83
3.0
2 70
3.2
4 10
1.8
3 76
7.1
4 50
2.9
4 81
3.6
4 31
4.5
5 91
1.4
5 44
9.9
4 73
9.7
8 46
2.2
Priv
ate
ente
rpris
e6
012.
46
179.
75
762.
25
011.
75
373.
04
517.
14
844.
35
040.
14
564.
74
920.
35
202.
44
512.
6St
ate
7 32
9.9
7 85
2.4
6 64
2.7
5 43
6.6
5 92
6.6
4 79
3.7
5 46
2.3
5 92
4.0
4 87
8.8
5 34
6.9
5 70
3.5
4 86
6.8
Fore
ign
inve
sted
ent
erpr
ise
6 31
7.8
7 28
3.2
5 76
3.4
4 97
7.9
5 46
5.9
4 73
0.8
5 12
1.0
5 76
0.8
4 73
7.3
5 09
6.2
5 63
5.5
4 80
2.9
Rem
ark:
(*) R
ed R
iver
Del
ta e
xclu
des H
anoi
City
and
Sou
thea
st e
xclu
des H
o C
hi M
inh
City
.
122

Tota
lM
ale
Fem
ale
Tota
lM
ale
Fem
ale
Tota
lM
ale
Fem
ale
WH
OL
E C
OU
NT
RY
3 75
73
923
3 51
54
466
4 74
94
106
3 16
63
303
2 94
3
Soci
o-ec
onom
ic r
egio
nR
1N
orth
ern
Mid
land
s and
Mou
ntai
ns3
495
3 48
23
515
4 05
24
208
3 87
23
181
3 14
03
254
R2
Red
Riv
er D
elta
4
039
4 23
43
758
5 05
75
381
4 65
13
381
3 56
03
099
R3
Nor
th a
nd S
outh
Cen
tral C
oast
3 24
93
422
2 95
33
678
3 95
43
307
2 96
73
122
2 65
6
R4
Cen
tral H
ighl
and
3 44
13
608
3 21
73
858
4 09
93
539
3 06
63
171
2 92
3
R5
Sout
heas
t 4
560
4 84
24
213
4 94
75
287
4 53
53
757
3 93
63
530
R6
Mek
ong
Riv
er D
elta
2 88
53
082
2 55
83
336
3 59
02
960
2 67
42
860
2 35
1
63 p
rovi
nces
/citi
es01
Ha
Noi
4 77
84
930
4 57
25
772
6 10
95
386
3 65
13
781
3 43
7
02H
a G
iang
3 96
43
869
4 09
34
702
4 81
74
571
2 95
62
794
3 24
3
04C
ao B
ang
3 86
43
687
4 04
64
159
4 18
24
134
3 65
83
316
3 99
0
06B
ac K
an3
325
3 18
13
520
3 69
83
702
3 69
33
069
2 91
43
346
08Tu
yen
Qua
ng3
091
3 00
73
219
3 74
73
848
3 62
22
798
2 67
73
003
10La
o C
ai4
191
4 17
54
212
4 40
64
582
4 21
23
844
3 63
14
214
11D
ien
Bie
n 4
666
4 81
04
489
4 91
15
160
4 63
24
396
4 45
64
313
12La
i Cha
u3
777
3 75
73
805
4 01
44
161
3 80
23
572
3 41
03
808
14So
n La
4 09
14
068
4 12
34
503
4 62
14
339
3 58
03
398
3 84
7
15Y
en B
ai3
052
3 00
73
123
3 82
93
836
3 82
12
600
2 61
02
583
17H
oa B
inh
3 30
33
371
3 20
33
837
4 04
63
617
3 08
13
142
2 98
0
19Th
ai N
guye
n3
274
3 33
63
184
3 62
53
884
3 35
03
078
3 08
93
058
20La
ng S
on3
431
3 37
43
513
3 93
44
151
3 69
83
044
2 88
43
325
Uni
t: Th
ousa
nd V
ND
Who
le c
ount
ryU
rban
Rur
al
Tab
le 1
7A
VER
AG
E M
ON
THLY
EA
RN
ING
S O
F W
AG
E W
OR
KER
S A
GED
15
AN
D A
BO
VE,
201
2
Cod
eA
dmin
istra
tion
123
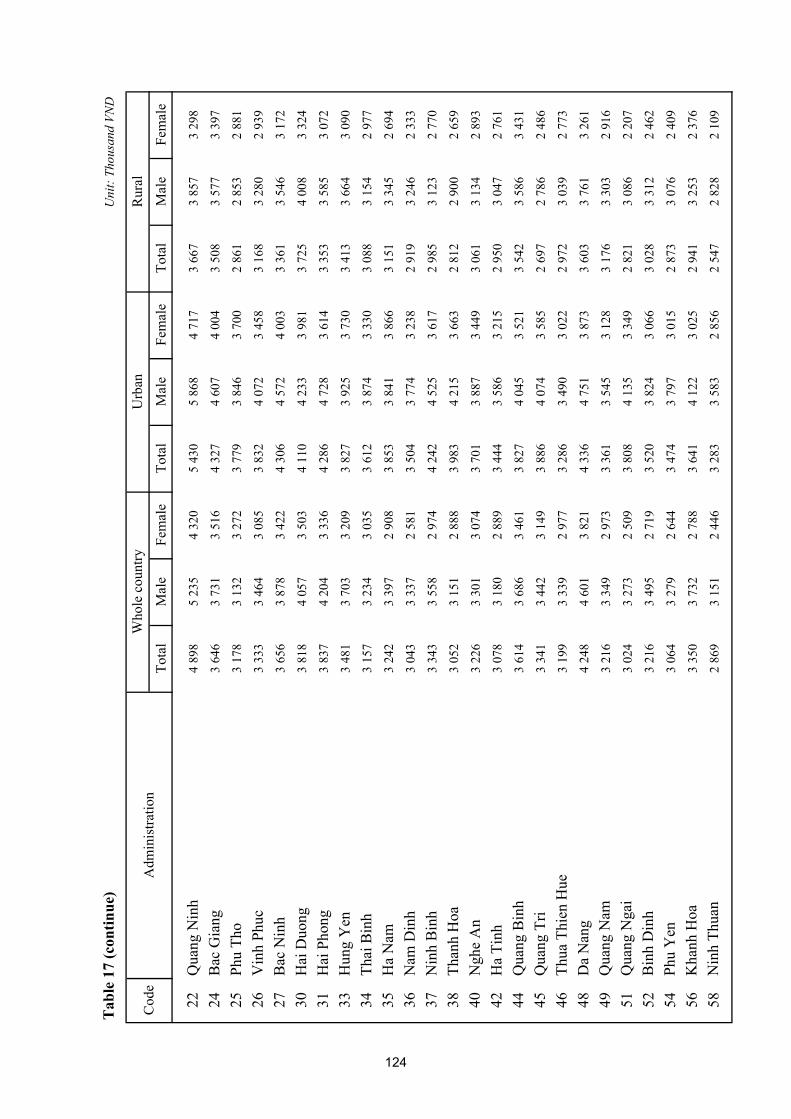
Tab
le 1
7 (c
ontin
ue)
Tota
lM
ale
Fem
ale
Tota
lM
ale
Fem
ale
Tota
lM
ale
Fem
ale
22Q
uang
Nin
h4
898
5 23
54
320
5 43
05
868
4 71
73
667
3 85
73
298
24B
ac G
iang
3 64
63
731
3 51
64
327
4 60
74
004
3 50
83
577
3 39
7
25Ph
u Th
o3
178
3 13
23
272
3 77
93
846
3 70
02
861
2 85
32
881
26V
inh
Phuc
3 33
33
464
3 08
53
832
4 07
23
458
3 16
83
280
2 93
9
27B
ac N
inh
3 65
63
878
3 42
24
306
4 57
24
003
3 36
13
546
3 17
2
30H
ai D
uong
3 81
84
057
3 50
34
110
4 23
33
981
3 72
54
008
3 32
4
31H
ai P
hong
3 83
74
204
3 33
64
286
4 72
83
614
3 35
33
585
3 07
2
33H
ung
Yen
3 48
13
703
3 20
93
827
3 92
53
730
3 41
33
664
3 09
0
34Th
ai B
inh
3 15
73
234
3 03
53
612
3 87
43
330
3 08
83
154
2 97
7
35H
a N
am3
242
3 39
72
908
3 85
33
841
3 86
63
151
3 34
52
694
36N
am D
inh
3 04
33
337
2 58
13
504
3 77
43
238
2 91
93
246
2 33
3
37N
inh
Bin
h3
343
3 55
82
974
4 24
24
525
3 61
72
985
3 12
32
770
38Th
anh
Hoa
3 05
23
151
2 88
83
983
4 21
53
663
2 81
22
900
2 65
9
40N
ghe
An
3 22
63
301
3 07
43
701
3 88
73
449
3 06
13
134
2 89
3
42H
a Ti
nh3
078
3 18
02
889
3 44
43
586
3 21
52
950
3 04
72
761
44Q
uang
Bin
h3
614
3 68
63
461
3 82
74
045
3 52
13
542
3 58
63
431
45Q
uang
Tri
3 34
13
442
3 14
93
886
4 07
43
585
2 69
72
786
2 48
6
46Th
ua T
hien
Hue
3 19
93
339
2 97
73
286
3 49
03
022
2 97
23
039
2 77
3
48D
a N
ang
4 24
84
601
3 82
14
336
4 75
13
873
3 60
33
761
3 26
1
49Q
uang
Nam
3 21
63
349
2 97
33
361
3 54
53
128
3 17
63
303
2 91
6
51Q
uang
Nga
i3
024
3 27
32
509
3 80
84
135
3 34
92
821
3 08
62
207
52B
inh
Din
h3
216
3 49
52
719
3 52
03
824
3 06
63
028
3 31
22
462
54Ph
u Y
en3
064
3 27
92
644
3 47
43
797
3 01
52
873
3 07
62
409
56K
hanh
Hoa
3 35
03
732
2 78
83
641
4 12
23
025
2 94
13
253
2 37
6
58N
inh
Thua
n2
869
3 15
12
446
3 28
33
583
2 85
62
547
2 82
82
109
Rur
al
Uni
t: Th
ousa
nd V
ND
Cod
eA
dmin
istra
tion
Who
le c
ount
ryU
rban
124

Tab
le 1
7 (c
ontin
ue)
Tota
lM
ale
Fem
ale
Tota
lM
ale
Fem
ale
Tota
lM
ale
Fem
ale
Rur
al
Uni
t: Th
ousa
nd V
ND
Cod
eA
dmin
istra
tion
Who
le c
ount
ryU
rban
60B
inh
Thua
n2
927
3 16
52
554
3 05
93
294
2 65
92
796
3 03
02
461
62K
on T
um3
928
4 09
13
719
4 13
44
342
3 85
33
484
3 50
93
455
64G
ia L
ai3
591
3 80
53
310
3 89
84
117
3 57
83
247
3 42
03
045
66D
ak L
ak3
283
3 33
73
198
3 99
44
201
3 71
42
845
2 85
12
836
67D
ak N
ong
4 17
24
545
3 58
94
075
4 23
83
774
4 23
64
768
3 48
6
68La
m D
ong
3 25
13
482
2 98
63
570
3 86
33
235
2 93
93
110
2 74
3
70B
inh
Phuo
c3
368
3 67
82
999
3 90
84
214
3 56
43
209
3 52
52
825
72Ta
y N
inh
2 90
03
041
2 69
43
476
3 66
43
222
2 80
22
939
2 60
0
74B
inh
Duo
ng4
474
4 69
34
245
4 55
34
844
4 29
04
277
4 39
64
097
75D
ong
Nai
4 14
14
317
3 93
24
324
4 62
63
976
4 00
64
094
3 89
9
77B
a R
ia-V
ung
Tau
4 35
15
019
3 38
84
774
5 77
53
445
3 83
54
164
3 31
0
79H
o C
hi M
inh
City
5 01
85
324
4 63
05
211
5 49
84
832
3 98
34
272
3 68
9
80Lo
ng A
n3
224
3 40
32
993
3 70
43
969
3 39
23
087
3 25
02
871
82Ti
en G
iang
3 05
83
369
2 56
93
328
3 80
72
817
2 99
03
279
2 48
5
83B
en T
re2
651
2 86
92
253
3 22
43
404
2 97
82
551
2 78
82
097
84Tr
a V
inh
2 93
13
140
2 60
13
397
3 64
62
966
2 82
53
019
2 52
3
86V
inh
Long
2 76
12
943
2 50
23
531
3 87
93
111
2 56
92
729
2 33
3
87D
ong
Thap
2 40
22
540
2 18
13
247
3 39
33
026
2 19
32
335
1 96
1
89A
n G
iang
2 74
12
960
2 36
02
855
3 03
32
594
2 67
52
922
2 19
8
91K
ien
Gia
ng3
115
3 35
52
633
3 51
03
840
2 80
12
846
3 01
22
527
92C
an T
ho3
416
3 52
33
239
3 70
73
909
3 41
22
583
2 59
52
555
93H
au G
iang
2 80
62
926
2 52
33
333
3 57
52
902
2 56
02
661
2 28
6
94So
c Tr
ang
2 52
12
723
2 20
32
913
3 16
22
559
2 29
72
488
1 97
9
95B
ac L
ieu
2 94
43
155
2 54
23
323
3 57
52
845
2 66
12
841
2 31
4
96C
a M
au2
793
2 94
02
537
3 17
23
475
2 77
42
572
2 67
82
351
125

Tota
lM
ale
Fem
ale
Tota
lM
ale
Fem
ale
Tota
lM
ale
Fem
ale
Tota
lM
ale
Fem
ale
EN
TIR
E C
OU
NT
RY
44.3
45.0
43.5
45.6
46.5
44.6
45.3
46.1
44.4
45.5
46.4
44.7
R1
Nor
ther
n M
idla
nds a
nd M
ount
ains
43.2
43.3
43.1
45.4
45.8
45.0
45.1
45.3
44.8
44.3
44.5
44.2
R2
Red
Riv
er D
elta
(*)
43.7
44.5
43.0
45.5
46.7
44.3
45.7
46.6
44.9
45.5
46.5
44.5
R3
Nor
th a
nd S
outh
Cen
tral C
oast
44.5
45.2
43.8
46.4
47.6
45.2
45.5
46.7
44.2
45.9
47.1
44.7
R4
Cen
tral H
ighl
ands
44.1
44.6
43.6
44.3
44.9
43.7
43.2
43.6
42.8
45.1
45.7
44.4
R5
Sout
heas
t (*)
45.6
45.9
45.2
45.9
46.4
45.4
46.9
47.2
46.5
47.8
48.0
47.6
R6
Mek
ong
Riv
er D
elta
42.4
43.8
40.7
43.2
44.7
41.5
42.4
43.9
40.5
42.5
43.9
40.7
R7
Han
oi C
ity46
.346
.845
.746
.947
.346
.546
.346
.646
.146
.947
.346
.4
R8
Ho
Chi
Min
h C
ity48
.549
.147
.949
.449
.848
.950
.551
.049
.951
.051
.450
.5
UR
BA
N45
.646
.145
.146
.647
.146
.047
.047
.646
.547
.547
.947
.1
R1
Nor
ther
n M
idla
nds a
nd M
ount
ains
43.5
43.7
43.4
44.9
45.3
44.5
44.9
45.3
44.6
45.2
45.3
45.2
R2
Red
Riv
er D
elta
(*)
45.2
46.1
44.3
46.5
47.2
45.8
47.3
47.8
46.9
46.8
47.2
46.4
R3
Nor
th a
nd S
outh
Cen
tral C
oast
43.6
43.8
43.3
45.6
46.2
45.1
45.2
46.0
44.3
45.5
46.1
45.0
R4
Cen
tral H
ighl
ands
44.4
45.0
43.7
44.9
45.7
44.0
44.7
45.4
44.0
46.6
47.2
46.1
R5
Sout
heas
t (*)
46.5
46.8
46.2
47.8
48.1
47.5
49.2
49.2
49.2
50.0
49.8
50.2
R6
Mek
ong
Riv
er D
elta
44.4
44.9
43.8
45.3
46.1
44.4
45.7
46.3
45.0
45.9
46.5
45.2
R7
Han
oi C
ity45
.845
.845
.745
.345
.345
.245
.345
.345
.346
.346
.546
.0
R8
Ho
Chi
Min
h C
ity49
.149
.848
.249
.449
.849
.050
.551
.049
.851
.151
.550
.6
Tab
le 1
8A
VER
AG
E W
EEK
LY H
OU
RS
WO
RK
ED O
F EM
PLO
YED
PO
PULA
TIO
N A
GED
15
AN
D A
BO
VE
BY
SO
CIO
-EC
ON
OM
IC R
EGIO
N A
ND
Q
UA
RTE
R, 2
012
Uni
t:Hou
r
No
Adm
inis
tratio
n
Qua
rter 1
in 2
012
(At 1
/4/2
012)
Qua
rter 4
in 2
012
(At 1
/1/2
013)
Qua
rter 2
in 2
012
(At 1
/7/2
012)
Qua
rter 3
in 2
012
(At 1
/10/
2012
)
126

Tab
le 1
8 (c
ontin
ue)
Tota
lM
ale
Fem
ale
Tota
lM
ale
Fem
ale
Tota
lM
ale
Fem
ale
Tota
lM
ale
Fem
ale
RU
RA
L43
.744
.542
.945
.246
.244
.044
.545
.543
.544
.745
.743
.6
R1
Nor
ther
n M
idla
nds a
nd M
ount
ains
43.1
43.2
43.0
45.5
45.9
45.1
45.1
45.3
44.9
44.2
44.3
44.0
R2
Red
Riv
er D
elta
(*)
43.3
44.0
42.6
45.1
46.5
43.8
45.2
46.2
44.3
45.1
46.3
44.0
R3
Nor
th a
nd S
outh
Cen
tral C
oast
44.8
45.6
43.9
46.7
48.1
45.3
45.6
46.9
44.2
46.0
47.5
44.6
R4
Cen
tral H
ighl
ands
44.0
44.5
43.6
44.1
44.6
43.6
42.6
42.9
42.3
44.5
45.2
43.7
R5
Sout
heas
t (*)
45.0
45.4
44.5
44.8
45.4
44.1
45.5
46.1
44.7
46.5
47.0
45.9
R6
Mek
ong
Riv
er D
elta
41.8
43.4
39.7
42.6
44.3
40.5
41.4
43.2
39.0
41.4
43.1
39.1
R7
Han
oi C
ity46
.647
.545
.847
.948
.647
.247
.047
.546
.647
.347
.946
.7
R8
Ho
Chi
Min
h C
ity46
.045
.746
.448
.949
.348
.750
.750
.950
.550
.350
.450
.2
Rem
ark:
(*) R
ed R
iver
Del
ta e
xclu
des H
anoi
City
and
Sou
thea
st e
xclu
des H
o C
hi M
inh
City
.
Uni
t: H
our
No
Adm
inis
tratio
n
Qua
rter 1
in 2
012
(At 1
/4/2
012)
Qua
rter 2
in 2
012
(At 1
/7/2
012)
Qua
rter 3
in 2
012
(At 1
/10/
2012
)Q
uarte
r 4 in
201
2(A
t 1/1
/201
3)
127

Tota
lM
ale
Fem
ale
Tota
lM
ale
Fem
ale
Tota
lM
ale
Fem
ale
Tota
lM
ale
Fem
ale
EN
TIR
E C
OU
NT
RY
44.3
45.0
43.5
45.6
46.5
44.6
45.3
46.1
44.4
45.5
46.4
44.7
Agr
icul
ture
, for
estry
and
fish
ing
41.1
42.1
40.1
42.4
43.6
41.2
41.7
42.7
40.6
41.5
42.6
40.4
Indu
stry
and
con
stru
ctio
n48
.148
.447
.749
.649
.949
.249
.949
.949
.950
.650
.650
.7
Serv
ices
46.6
46.7
46.5
47.6
48.0
47.3
47.7
48.1
47.4
48.0
48.2
47.7
UR
BA
N45
.646
.145
.146
.647
.146
.047
.047
.646
.547
.547
.947
.1
Agr
icul
ture
, for
estry
and
fish
ing
40.0
42.1
37.7
40.9
42.8
38.8
40.6
42.6
38.4
41.0
43.0
38.7
Indu
stry
and
con
stru
ctio
n47
.047
.146
.848
.248
.347
.949
.149
.049
.449
.949
.650
.3
Serv
ices
46.4
46.7
46.2
47.3
47.7
47.0
47.7
48.2
47.3
48.1
48.4
47.8
RU
RA
L43
.744
.542
.945
.246
.244
.044
.545
.543
.544
.745
.743
.6
Agr
icul
ture
, for
estry
and
fish
ing
41.2
42.1
40.3
42.5
43.7
41.5
41.8
42.7
40.9
41.6
42.6
40.6
Indu
stry
and
con
stru
ctio
n48
.849
.248
.350
.650
.850
.250
.450
.550
.251
.151
.151
.0
Serv
ices
46.8
46.7
47.0
48.0
48.4
47.7
47.7
48.0
47.5
47.9
48.1
47.7
Tab
le 1
9A
VER
AG
E W
EEK
LY H
OU
RS
WO
RK
ED O
F EM
PLO
YED
PO
PULA
TIO
N A
GED
15
AN
D A
BO
VE
BY
IND
UST
RIA
L SE
CTO
R A
ND
Q
UA
RTE
R, 2
012
Uni
t: H
our
Qua
rter 1
in 2
012
(At 1
/4/2
012)
Qua
rter 4
in 2
012
(At 1
/1/2
013)
Qua
rter 2
in 2
012
(At 1
/7/2
012)
Qua
rter 3
in 2
012
(At 1
/10/
2012
)In
dust
rial s
ecto
r/Adm
inis
tratio
n
128

Tab
le 1
9 (c
ontin
ue)
Tota
lM
ale
Fem
ale
Tota
lM
ale
Fem
ale
Tota
lM
ale
Fem
ale
Tota
lM
ale
Fem
ale
R1
Nor
ther
n M
idla
nds a
nd M
ount
ains
43.2
43.3
43.1
45.4
45.8
45.0
45.1
45.3
44.8
44.3
44.5
44.2
Agr
icul
ture
, for
estry
and
fish
ing
41.7
41.3
42.0
44.5
44.5
44.5
44.1
44.0
44.2
42.8
42.5
43.0
Indu
stry
and
con
stru
ctio
n48
.749
.147
.849
.850
.149
.149
.849
.849
.750
.150
.150
.1
Serv
ices
44.9
44.6
45.1
45.6
46.1
45.2
45.9
46.2
45.7
46.4
46.4
46.4
R2
Red
Riv
er D
elta
(*)
43.7
44.5
43.0
45.5
46.7
44.3
45.7
46.6
44.9
45.5
46.5
44.5
Agr
icul
ture
, for
estry
and
fish
ing
37.6
37.6
37.6
37.6
37.8
37.4
39.1
39.0
39.2
38.4
38.2
38.6
Indu
stry
and
con
stru
ctio
n49
.949
.849
.952
.252
.052
.552
.251
.852
.852
.452
.252
.8
Serv
ices
46.3
46.3
46.4
48.9
49.4
48.4
48.7
48.8
48.6
48.2
48.6
47.8
R3
Nor
th a
nd S
outh
Cen
tral
Coa
st44
.545
.243
.846
.447
.645
.245
.546
.744
.245
.947
.144
.7
Agr
icul
ture
, for
estry
and
fish
ing
43.0
44.0
42.0
44.9
46.3
43.6
43.5
45.0
42.2
43.4
45.2
41.9
Indu
stry
and
con
stru
ctio
n47
.447
.846
.749
.950
.548
.449
.349
.948
.050
.550
.650
.2
Serv
ices
45.8
45.3
46.1
47.4
47.6
47.3
47.1
47.1
47.0
47.6
47.3
47.9
R4
Cen
tral
Hig
hlan
ds44
.144
.643
.644
.344
.943
.743
.243
.642
.845
.145
.744
.4
Agr
icul
ture
, for
estry
and
fish
ing
43.4
44.3
42.5
43.6
44.2
42.9
41.9
42.4
41.4
44.2
45.0
43.4
Indu
stry
and
con
stru
ctio
n45
.145
.245
.046
.046
.844
.546
.046
.145
.947
.848
.346
.9
Serv
ices
46.2
45.5
46.7
46.1
46.2
46.0
46.5
47.0
46.0
47.2
47.4
47.1
Indu
stria
l sec
tor/A
dmin
istra
tion
Uni
t: H
our
Qua
rter 1
in 2
012
(At 1
/4/2
012)
Qua
rter 2
in 2
012
(At 1
/7/2
012)
Qua
rter 3
in 2
012
(At 1
/10/
2012
)Q
uarte
r 4 in
201
2(A
t 1/1
/201
3)
129

Tab
le 1
9 (c
ontin
ue)
Tota
lM
ale
Fem
ale
Tota
lM
ale
Fem
ale
Tota
lM
ale
Fem
ale
Tota
lM
ale
Fem
ale
Indu
stria
l sec
tor/A
dmin
istra
tion
Uni
t: H
our
Qua
rter 1
in 2
012
(At 1
/4/2
012)
Qua
rter 2
in 2
012
(At 1
/7/2
012)
Qua
rter 3
in 2
012
(At 1
/10/
2012
)Q
uarte
r 4 in
201
2(A
t 1/1
/201
3)
R5
Sout
heas
t (*)
45.6
45.9
45.2
45.9
46.4
45.4
46.9
47.2
46.5
47.8
48.0
47.6
Agr
icul
ture
, for
estry
and
fish
ing
42.9
44.2
41.2
42.3
43.7
40.5
42.4
43.8
40.6
43.3
44.6
41.6
Indu
stry
and
con
stru
ctio
n47
.647
.148
.248
.548
.448
.650
.350
.050
.752
.051
.352
.7
Serv
ices
46.5
46.9
46.1
47.3
47.5
47.1
48.1
48.4
47.7
48.2
48.6
47.9
R6
Mek
ong
Riv
er D
elta
42.4
43.8
40.7
43.2
44.7
41.5
42.4
43.9
40.5
42.5
43.9
40.7
Agr
icul
ture
, for
estry
and
fish
ing
38.7
41.3
35.2
39.8
42.4
36.3
38.2
40.9
34.7
38.1
40.8
34.5
Indu
stry
and
con
stru
ctio
n46
.647
.545
.347
.348
.146
.147
.448
.146
.247
.748
.247
.0
Serv
ices
46.3
46.5
46.1
46.9
47.2
46.6
46.7
47.1
46.3
46.7
47.0
46.4
R7
Han
oi C
ity46
.346
.845
.746
.947
.346
.546
.346
.646
.146
.947
.346
.4
Agr
icul
ture
, for
estry
and
fish
ing
41.6
41.9
41.3
42.6
43.0
42.4
41.9
41.7
42.0
42.6
42.1
43.0
Indu
stry
and
con
stru
ctio
n49
.449
.749
.050
.350
.350
.449
.549
.349
.750
.250
.549
.6
Serv
ices
46.8
46.7
46.9
47.0
46.9
47.1
46.9
46.9
46.9
47.2
47.3
47.2
R8
Ho
Chi
Min
h C
ity48
.549
.147
.949
.449
.848
.950
.551
.049
.951
.051
.450
.5
Agr
icul
ture
, for
estry
and
fish
ing
43.3
44.0
42.0
44.7
46.7
40.9
46.0
47.1
44.1
44.9
46.3
42.3
Indu
stry
and
con
stru
ctio
n47
.548
.146
.749
.048
.849
.350
.650
.550
.950
.950
.851
.0
Serv
ices
49.3
50.1
48.6
49.7
50.5
49.0
50.6
51.5
49.7
51.3
52.0
50.5
Rem
ark:
(*) R
ed R
iver
Del
ta e
xclu
des H
anoi
City
and
Sou
thea
st e
xclu
des H
o C
hi M
inh
City
.
130
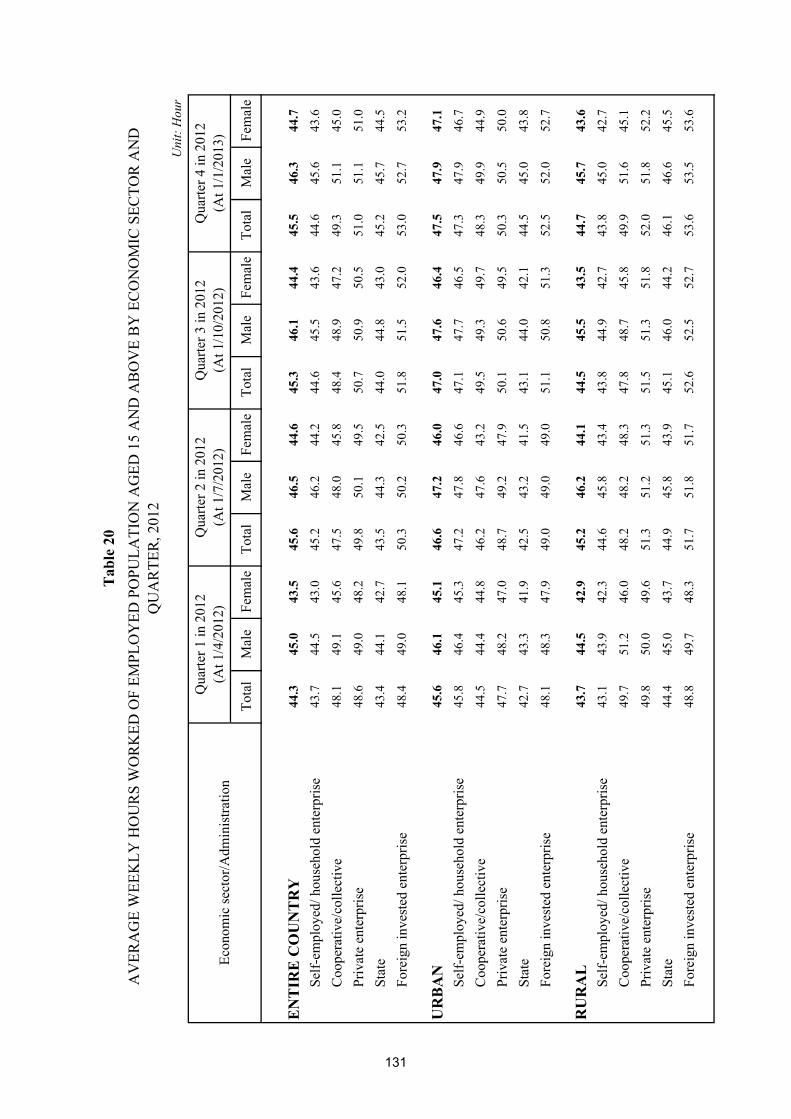
Tota
lM
ale
Fem
ale
Tota
lM
ale
Fem
ale
Tota
lM
ale
Fem
ale
Tota
lM
ale
Fem
ale
EN
TIR
E C
OU
NT
RY
44.3
45.0
43.5
45.6
46.5
44.6
45.3
46.1
44.4
45.5
46.3
44.7
Self-
empl
oyed
/ hou
seho
ld e
nter
pris
e43
.744
.543
.045
.246
.244
.244
.645
.543
.644
.645
.643
.6
Coo
pera
tive/
colle
ctiv
e48
.149
.145
.647
.548
.045
.848
.448
.947
.249
.351
.145
.0
Priv
ate
ente
rpris
e48
.649
.048
.249
.850
.149
.550
.750
.950
.551
.051
.151
.0
Stat
e43
.444
.142
.743
.544
.342
.544
.044
.843
.045
.245
.744
.5
Fore
ign
inve
sted
ent
erpr
ise
48.4
49.0
48.1
50.3
50.2
50.3
51.8
51.5
52.0
53.0
52.7
53.2
UR
BA
N45
.646
.145
.146
.647
.246
.047
.047
.646
.447
.547
.947
.1
Self-
empl
oyed
/ hou
seho
ld e
nter
pris
e45
.846
.445
.347
.247
.846
.647
.147
.746
.547
.347
.946
.7
Coo
pera
tive/
colle
ctiv
e44
.544
.444
.846
.247
.643
.249
.549
.349
.748
.349
.944
.9
Priv
ate
ente
rpris
e47
.748
.247
.048
.749
.247
.950
.150
.649
.550
.350
.550
.0
Stat
e42
.743
.341
.942
.543
.241
.543
.144
.042
.144
.545
.043
.8
Fore
ign
inve
sted
ent
erpr
ise
48.1
48.3
47.9
49.0
49.0
49.0
51.1
50.8
51.3
52.5
52.0
52.7
RU
RA
L43
.744
.542
.945
.246
.244
.144
.545
.543
.544
.745
.743
.6
Self-
empl
oyed
/ hou
seho
ld e
nter
pris
e43
.143
.942
.344
.645
.843
.443
.844
.942
.743
.845
.042
.7
Coo
pera
tive/
colle
ctiv
e49
.751
.246
.048
.248
.248
.347
.848
.745
.849
.951
.645
.1
Priv
ate
ente
rpris
e49
.850
.049
.651
.351
.251
.351
.551
.351
.852
.051
.852
.2
Stat
e44
.445
.043
.744
.945
.843
.945
.146
.044
.246
.146
.645
.5
Fore
ign
inve
sted
ent
erpr
ise
48.8
49.7
48.3
51.7
51.8
51.7
52.6
52.5
52.7
53.6
53.5
53.6
Tab
le 2
0A
VER
AG
E W
EEK
LY H
OU
RS
WO
RK
ED O
F EM
PLO
YED
PO
PULA
TIO
N A
GED
15
AN
D A
BO
VE
BY
EC
ON
OM
IC S
ECTO
R A
ND
Q
UA
RTE
R, 2
012
Uni
t: H
our
Qua
rter 1
in 2
012
(At 1
/4/2
012)
Qua
rter 4
in 2
012
(At 1
/1/2
013)
Qua
rter 2
in 2
012
(At 1
/7/2
012)
Qua
rter 3
in 2
012
(At 1
/10/
2012
)Ec
onom
ic se
ctor
/Adm
inis
tratio
n
131

Tab
le 2
0 (c
ontin
ue)
Tota
lM
ale
Fem
ale
Tota
lM
ale
Fem
ale
Tota
lM
ale
Fem
ale
Tota
lM
ale
Fem
ale
R1
Nor
ther
n M
idla
nds a
nd M
ount
ains
43.1
43.3
43.0
45.4
45.8
45.0
45.1
45.3
44.8
44.3
44.5
44.2
Self-
empl
oyed
/ hou
seho
ld e
nter
pris
e43
.043
.043
.045
.545
.945
.245
.045
.244
.844
.044
.243
.9
Coo
pera
tive/
colle
ctiv
e47
.347
.646
.344
.645
.241
.746
.246
.046
.749
.749
.749
.7
Priv
ate
ente
rpris
e49
.149
.049
.349
.950
.448
.950
.750
.750
.650
.750
.650
.7
Stat
e41
.942
.741
.042
.142
.841
.542
.843
.442
.243
.844
.343
.3
Fore
ign
inve
sted
ent
erpr
ise
50.0
51.7
49.4
51.0
51.6
50.8
52.8
52.6
53.0
53.4
54.5
53.1
R2
Red
Riv
er D
elta
(*)
43.7
44.5
43.0
45.5
46.7
44.3
45.7
46.6
44.9
45.5
46.5
44.5
Self-
empl
oyed
/ hou
seho
ld e
nter
pris
e42
.343
.241
.544
.145
.742
.644
.545
.643
.544
.145
.442
.8
Coo
pera
tive/
colle
ctiv
e49
.148
.850
.348
.848
.749
.850
.954
.144
.551
.654
.142
.0
Priv
ate
ente
rpris
e50
.450
.350
.652
.251
.752
.852
.452
.252
.652
.351
.952
.8
Stat
e45
.245
.744
.745
.345
.944
.745
.446
.144
.645
.946
.145
.6
Fore
ign
inve
sted
ent
erpr
ise
48.7
50.1
48.2
52.9
53.6
52.6
52.8
51.6
53.2
53.9
53.3
54.2
R3
Nor
th a
nd S
outh
Cen
tral
Coa
st44
.545
.243
.846
.447
.645
.245
.546
.744
.245
.947
.144
.7
Self-
empl
oyed
/ hou
seho
ld e
nter
pris
e44
.445
.143
.746
.547
.845
.345
.346
.644
.045
.646
.944
.2
Coo
pera
tive/
colle
ctiv
e47
.650
.042
.046
.148
.234
.246
.747
.046
.142
.344
.837
.9
Priv
ate
ente
rpris
e48
.448
.648
.250
.351
.049
.249
.650
.348
.751
.151
.151
.0
Stat
e43
.043
.442
.543
.444
.142
.644
.044
.743
.145
.545
.845
.2
Fore
ign
inve
sted
ent
erpr
ise
44.5
48.5
42.8
49.2
48.0
49.9
52.4
51.4
52.8
52.1
51.6
52.4
R4
Cen
tral
Hig
hlan
ds44
.144
.643
.644
.344
.943
.743
.243
.642
.845
.145
.744
.4
Self-
empl
oyed
/ hou
seho
ld e
nter
pris
e44
.144
.643
.644
.344
.843
.843
.143
.442
.744
.945
.544
.3
Coo
pera
tive/
colle
ctiv
e43
.438
.648
.842
.342
.541
.945
.747
.744
.850
.851
.550
.2
Priv
ate
ente
rpris
e47
.247
.646
.548
.749
.148
.248
.248
.048
.549
.850
.948
.2
Stat
e43
.544
.043
.042
.743
.641
.742
.843
.941
.745
.346
.244
.5
Fore
ign
inve
sted
ent
erpr
ise
46.4
51.3
43.0
54.2
58.3
51.8
51.1
56.9
50.1
50.4
56.2
46.9
Econ
omic
sect
or/A
dmin
istra
tion
Uni
t: H
our
Qua
rter 1
in 2
012
(At 1
/4/2
012)
Qua
rter 2
in 2
012
(At 1
/7/2
012)
Qua
rter 3
in 2
012
(At 1
/10/
2012
)Q
uarte
r 4 in
201
2(A
t 1/1
/201
3)
132
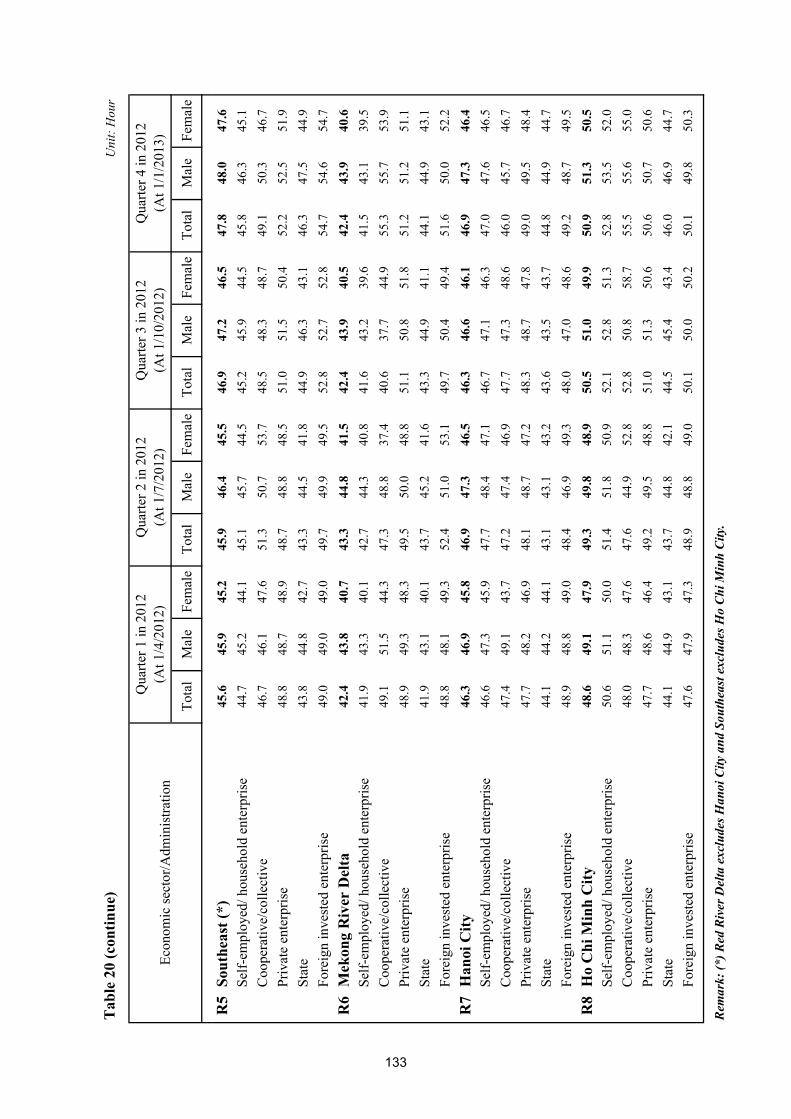
Tab
le 2
0 (c
ontin
ue)
Tota
lM
ale
Fem
ale
Tota
lM
ale
Fem
ale
Tota
lM
ale
Fem
ale
Tota
lM
ale
Fem
ale
Econ
omic
sect
or/A
dmin
istra
tion
Uni
t: H
our
Qua
rter 1
in 2
012
(At 1
/4/2
012)
Qua
rter 2
in 2
012
(At 1
/7/2
012)
Qua
rter 3
in 2
012
(At 1
/10/
2012
)Q
uarte
r 4 in
201
2(A
t 1/1
/201
3)
R5
Sout
heas
t (*)
45.6
45.9
45.2
45.9
46.4
45.5
46.9
47.2
46.5
47.8
48.0
47.6
Self-
empl
oyed
/ hou
seho
ld e
nter
pris
e44
.745
.244
.145
.145
.744
.545
.245
.944
.545
.846
.345
.1C
oope
rativ
e/co
llect
ive
46.7
46.1
47.6
51.3
50.7
53.7
48.5
48.3
48.7
49.1
50.3
46.7
Priv
ate
ente
rpris
e48
.848
.748
.948
.748
.848
.551
.051
.550
.452
.252
.551
.9St
ate
43.8
44.8
42.7
43.3
44.5
41.8
44.9
46.3
43.1
46.3
47.5
44.9
Fore
ign
inve
sted
ent
erpr
ise
49.0
49.0
49.0
49.7
49.9
49.5
52.8
52.7
52.8
54.7
54.6
54.7
R6
Mek
ong
Riv
er D
elta
42.4
43.8
40.7
43.3
44.8
41.5
42.4
43.9
40.5
42.4
43.9
40.6
Self-
empl
oyed
/ hou
seho
ld e
nter
pris
e41
.943
.340
.142
.744
.340
.841
.643
.239
.641
.543
.139
.5C
oope
rativ
e/co
llect
ive
49.1
51.5
44.3
47.3
48.8
37.4
40.6
37.7
44.9
55.3
55.7
53.9
Priv
ate
ente
rpris
e48
.949
.348
.349
.550
.048
.851
.150
.851
.851
.251
.251
.1St
ate
41.9
43.1
40.1
43.7
45.2
41.6
43.3
44.9
41.1
44.1
44.9
43.1
Fore
ign
inve
sted
ent
erpr
ise
48.8
48.1
49.3
52.4
51.0
53.1
49.7
50.4
49.4
51.6
50.0
52.2
R7
Han
oi C
ity46
.346
.945
.846
.947
.346
.546
.346
.646
.146
.947
.346
.4Se
lf-em
ploy
ed/ h
ouse
hold
ent
erpr
ise
46.6
47.3
45.9
47.7
48.4
47.1
46.7
47.1
46.3
47.0
47.6
46.5
Coo
pera
tive/
colle
ctiv
e47
.449
.143
.747
.247
.446
.947
.747
.348
.646
.045
.746
.7Pr
ivat
e en
terp
rise
47.7
48.2
46.9
48.1
48.7
47.2
48.3
48.7
47.8
49.0
49.5
48.4
Stat
e44
.144
.244
.143
.143
.143
.243
.643
.543
.744
.844
.944
.7Fo
reig
n in
vest
ed e
nter
pris
e 48
.948
.849
.048
.446
.949
.348
.047
.048
.649
.248
.749
.5
R8
Ho
Chi
Min
h C
ity48
.649
.147
.949
.349
.848
.950
.551
.049
.950
.951
.350
.5Se
lf-em
ploy
ed/ h
ouse
hold
ent
erpr
ise
50.6
51.1
50.0
51.4
51.8
50.9
52.1
52.8
51.3
52.8
53.5
52.0
Coo
pera
tive/
colle
ctiv
e48
.048
.347
.647
.644
.952
.852
.850
.858
.755
.555
.655
.0Pr
ivat
e en
terp
rise
47.7
48.6
46.4
49.2
49.5
48.8
51.0
51.3
50.6
50.6
50.7
50.6
Stat
e44
.144
.943
.143
.744
.842
.144
.545
.443
.446
.046
.944
.7Fo
reig
n in
vest
ed e
nter
pris
e 47
.647
.947
.348
.948
.849
.050
.150
.050
.250
.149
.850
.3
Rem
ark:
(*) R
ed R
iver
Del
ta e
xclu
des H
anoi
City
and
Sou
thea
st e
xclu
des H
o C
hi M
inh
City
.
133

Tota
lM
ale
Fem
ale
Tota
lM
ale
Fem
ale
Tota
lM
ale
Fem
ale
WH
OL
E C
OU
NT
RY
45.2
46.0
44.3
46.7
47.2
46.1
44.5
45.5
43.5
Soci
o-ec
onom
ic r
egio
nR
1N
orth
ern
Mid
land
s and
Mou
ntai
ns44
.544
.744
.344
.644
.944
.444
.444
.744
.2
R2
Red
Riv
er D
elta
45.6
46.4
44.8
46.1
46.5
45.7
45.4
46.4
44.4
R3
Nor
th a
nd S
outh
Cen
tral C
oast
45.6
46.7
44.5
45.0
45.5
44.4
45.8
47.0
44.5
R4
Cen
tral H
ighl
and
44.2
44.7
43.6
45.1
45.8
44.4
43.8
44.3
43.3
R5
Sout
heas
t48
.148
.547
.649
.449
.949
.046
.146
.545
.7
R6
Mek
ong
Riv
er D
elta
42.6
44.1
40.9
45.3
46.0
44.6
41.8
43.5
39.6
63 p
rovi
nces
/citi
es01
Ha
Noi
46.6
47.0
46.2
45.7
45.8
45.5
47.2
47.9
46.6
02H
a G
iang
45.5
45.7
45.4
43.6
44.0
43.2
45.9
46.0
45.8
04C
ao B
ang
44.2
43.6
44.9
43.8
42.9
44.7
44.3
43.7
45.0
06B
ac K
an44
.644
.544
.844
.544
.244
.844
.644
.544
.8
08Tu
yen
Qua
ng42
.742
.942
.544
.144
.144
.142
.542
.742
.3
10La
o C
ai46
.246
.246
.144
.745
.044
.446
.646
.546
.6
11D
ien
Bie
n 42
.642
.942
.442
.342
.941
.542
.742
.942
.5
12La
i Cha
u43
.243
.043
.443
.443
.443
.443
.243
.043
.3
14So
n La
44.6
44.5
44.8
45.1
45.3
44.8
44.6
44.4
44.8
15Y
en B
ai45
.946
.545
.246
.046
.046
.045
.846
.745
.0
17H
oa B
inh
41.1
41.6
40.6
41.9
42.2
41.6
41.0
41.5
40.5
19Th
ai N
guye
n44
.945
.144
.645
.445
.745
.144
.744
.944
.5
20La
ng S
on43
.743
.543
.845
.545
.645
.543
.343
.143
.4
Tab
le 2
1A
VER
AG
E W
EEK
LY H
OU
RS
WO
RK
ED O
F EM
PLO
YED
PO
PULA
TIO
N A
GED
15
AN
D A
BO
VE,
201
2
Cod
eA
dmin
istra
tion
Uni
t: H
our
Who
le c
ount
ryU
rban
Rur
al
134

Tab
le 2
1 (c
ontin
ue)
Tota
lM
ale
Fem
ale
Tota
lM
ale
Fem
ale
Tota
lM
ale
Fem
ale
22Q
uang
Nin
h47
.247
.946
.447
.247
.746
.647
.248
.146
.3
24B
ac G
iang
44.0
44.3
43.8
44.5
44.5
44.5
44.0
44.2
43.7
25Ph
u Th
o47
.047
.946
.145
.546
.544
.847
.448
.346
.6
26V
inh
Phuc
45.4
47.1
43.7
46.0
46.8
45.1
45.3
47.2
43.4
27B
ac N
inh
46.0
46.3
45.7
48.5
48.4
48.6
45.1
45.5
44.7
30H
ai D
uong
44.0
45.5
42.6
45.6
46.7
44.7
43.6
45.2
42.0
31H
ai P
hong
42.7
43.9
41.4
44.9
46.0
43.6
41.0
42.2
40.0
33H
ung
Yen
40.9
41.6
40.2
46.0
46.8
45.4
40.2
40.9
39.4
34Th
ai B
inh
45.5
46.5
44.7
49.7
50.5
48.9
45.2
46.1
44.3
35H
a N
am47
.249
.145
.546
.045
.946
.147
.449
.445
.4
36N
am D
inh
47.3
47.8
46.8
47.1
46.9
47.2
47.3
47.9
46.7
37N
inh
Bin
h46
.446
.945
.847
.347
.347
.246
.246
.845
.6
38Th
anh
Hoa
47.5
48.6
46.5
45.6
47.4
43.7
47.8
48.7
46.8
40N
ghe
An
46.9
47.9
45.9
40.9
41.4
40.5
47.7
48.8
46.6
42H
a Ti
nh43
.144
.541
.845
.446
.744
.142
.744
.141
.4
44Q
uang
Bin
h45
.847
.244
.546
.747
.346
.245
.747
.144
.2
45Q
uang
Tri
45.6
46.3
44.9
47.1
47.4
46.8
45.0
45.9
44.2
46Th
ua T
hien
Hue
43.6
44.0
43.1
45.3
45.4
45.1
41.0
42.3
39.3
48D
a N
ang
46.7
45.9
47.6
46.8
46.0
47.6
46.1
45.4
47.1
49Q
uang
Nam
42.6
43.8
41.4
44.4
45.5
43.4
42.2
43.4
41.0
51Q
uang
Nga
i45
.746
.744
.746
.847
.246
.445
.546
.644
.4
52B
inh
Din
h47
.148
.545
.845
.445
.845
.147
.749
.646
.0
54Ph
u Y
en47
.549
.844
.947
.748
.946
.547
.550
.144
.4
56K
hanh
Hoa
41.7
43.0
40.2
41.7
42.6
40.8
41.7
43.4
39.5
58N
inh
Thua
n40
.742
.338
.844
.044
.543
.338
.941
.136
.5
Rur
al
Uni
t: H
our
Cod
eA
dmin
istra
tion
Who
le c
ount
ryU
rban
135
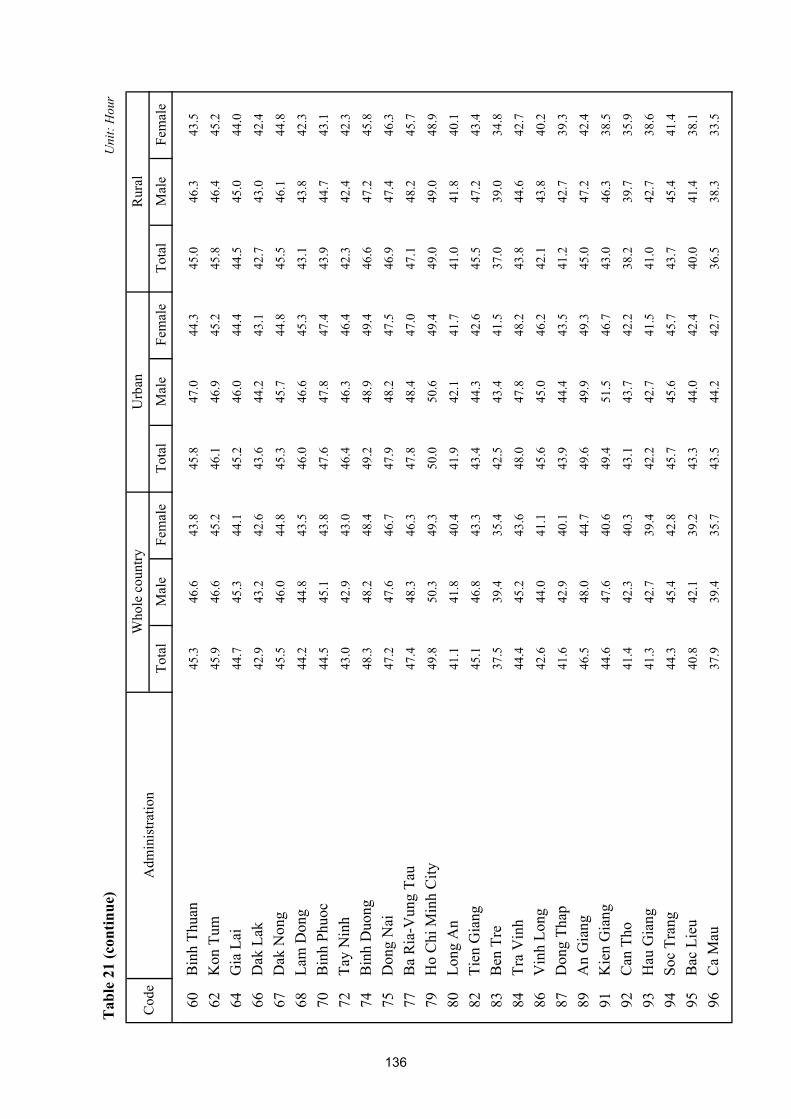
Tab
le 2
1 (c
ontin
ue)
Tota
lM
ale
Fem
ale
Tota
lM
ale
Fem
ale
Tota
lM
ale
Fem
ale
Rur
al
Uni
t: H
our
Cod
eA
dmin
istra
tion
Who
le c
ount
ryU
rban
60B
inh
Thua
n45
.346
.643
.845
.847
.044
.345
.046
.343
.5
62K
on T
um45
.946
.645
.246
.146
.945
.245
.846
.445
.2
64G
ia L
ai44
.745
.344
.145
.246
.044
.444
.545
.044
.0
66D
ak L
ak42
.943
.242
.643
.644
.243
.142
.743
.042
.4
67D
ak N
ong
45.5
46.0
44.8
45.3
45.7
44.8
45.5
46.1
44.8
68La
m D
ong
44.2
44.8
43.5
46.0
46.6
45.3
43.1
43.8
42.3
70B
inh
Phuo
c44
.545
.143
.847
.647
.847
.443
.944
.743
.1
72Ta
y N
inh
43.0
42.9
43.0
46.4
46.3
46.4
42.3
42.4
42.3
74B
inh
Duo
ng48
.348
.248
.449
.248
.949
.446
.647
.245
.8
75D
ong
Nai
47.2
47.6
46.7
47.9
48.2
47.5
46.9
47.4
46.3
77B
a R
ia-V
ung
Tau
47.4
48.3
46.3
47.8
48.4
47.0
47.1
48.2
45.7
79H
o C
hi M
inh
City
49.8
50.3
49.3
50.0
50.6
49.4
49.0
49.0
48.9
80Lo
ng A
n41
.141
.840
.441
.942
.141
.741
.041
.840
.1
82Ti
en G
iang
45.1
46.8
43.3
43.4
44.3
42.6
45.5
47.2
43.4
83B
en T
re37
.539
.435
.442
.543
.441
.537
.039
.034
.8
84Tr
a V
inh
44.4
45.2
43.6
48.0
47.8
48.2
43.8
44.6
42.7
86V
inh
Long
42.6
44.0
41.1
45.6
45.0
46.2
42.1
43.8
40.2
87D
ong
Thap
41.6
42.9
40.1
43.9
44.4
43.5
41.2
42.7
39.3
89A
n G
iang
46.5
48.0
44.7
49.6
49.9
49.3
45.0
47.2
42.4
91K
ien
Gia
ng44
.647
.640
.649
.451
.546
.743
.046
.338
.5
92C
an T
ho41
.442
.340
.343
.143
.742
.238
.239
.735
.9
93H
au G
iang
41.3
42.7
39.4
42.2
42.7
41.5
41.0
42.7
38.6
94So
c Tr
ang
44.3
45.4
42.8
45.7
45.6
45.7
43.7
45.4
41.4
95B
ac L
ieu
40.8
42.1
39.2
43.3
44.0
42.4
40.0
41.4
38.1
96C
a M
au37
.939
.435
.743
.544
.242
.736
.538
.333
.5
136

Cod
eA
dmin
istra
tion
Tota
l 1
-9 h
ours
10-1
9 ho
urs
20-2
9 ho
urs
30-3
4 ho
urs
35-3
9 ho
urs
40-4
8 ho
urs
49-5
9 ho
urs
60 h
ours
+
WH
OL
E C
OU
NT
RY
100.
00.
23.
26.
84.
99.
038
.426
.011
.4
Soci
o-ec
onom
ic r
egio
nR
1N
orth
ern
Mid
land
s and
Mou
ntai
ns10
0.0
0.1
2.6
6.3
4.8
11.0
38.1
29.2
8.0
R2
Red
Riv
er D
elta
100.
00.
33.
46.
14.
58.
037
.927
.812
.0
R3
Nor
th a
nd S
outh
Cen
tral C
oast
100.
00.
23.
47.
35.
09.
133
.428
.213
.3
R4
Cen
tral H
ighl
and
100.
00.
11.
65.
15.
210
.347
.924
.25.
6
R5
Sout
heas
t10
0.0
0.4
1.4
3.7
3.5
4.6
46.8
25.1
14.5
R6
Mek
ong
Riv
er D
elta
100.
00.
35.
010
.66.
512
.034
.620
.810
.3
63 p
rovi
nces
/citi
es01
Ha
Noi
100.
00.
41.
22.
83.
05.
550
.827
.58.
9
02H
a G
iang
100.
00.
13.
46.
65.
910
.530
.132
.610
.7
04C
ao B
ang
100.
00.
02.
05.
93.
314
.938
.428
.76.
8
06B
ac K
an10
0.0
0.1
2.6
6.7
4.7
11.9
33.5
31.7
8.8
08Tu
yen
Qua
ng10
0.0
0.1
4.0
7.6
4.7
11.5
44.9
21.8
5.5
10La
o C
ai10
0.0
0.0
1.0
2.1
2.4
6.1
47.7
36.9
3.8
11D
ien
Bie
n 10
0.0
0.1
4.1
8.7
8.8
11.7
30.2
31.1
5.2
12La
i Cha
u10
0.0
0.1
3.2
5.8
4.7
11.3
44.6
26.6
3.7
14So
n La
100.
00.
12.
67.
75.
69.
434
.330
.210
.2
15Y
en B
ai10
0.0
0.0
2.6
4.4
3.0
8.9
34.0
40.5
6.5
17H
oa B
inh
100.
00.
22.
26.
97.
215
.649
.316
.22.
5
19Th
ai N
guye
n10
0.0
0.1
2.3
5.3
4.1
7.7
46.0
26.3
8.3
20La
ng S
on10
0.0
0.0
3.5
7.1
6.4
15.0
32.2
25.8
9.9
Tab
le 2
2D
ISTR
IBU
TIO
N O
F W
OR
KER
S B
Y G
RO
UP
OF
HO
UR
S W
OR
KED
PER
WEE
K, 2
012
Uni
t: %
137

Tab
le 2
2 (c
ontin
ue)
Cod
eA
dmin
istra
tion
Tota
l 1
-9 h
ours
10-1
9 ho
urs
20-2
9 ho
urs
30-3
4 ho
urs
35-3
9 ho
urs
40-4
8 ho
urs
49-5
9 ho
urs
60 h
ours
+
22Q
uang
Nin
h10
0.0
0.0
0.6
2.3
2.9
7.7
46.7
29.2
10.7
24B
ac G
iang
100.
00.
01.
97.
44.
814
.337
.925
.28.
5
25Ph
u Th
o10
0.0
0.1
2.6
5.2
3.0
7.4
31.5
37.6
12.7
26V
inh
Phuc
100.
00.
12.
88.
15.
510
.230
.029
.513
.8
27B
ac N
inh
100.
00.
26.
68.
65.
55.
526
.524
.922
.2
30H
ai D
uong
100.
00.
55.
58.
45.
312
.128
.727
.412
.3
31H
ai P
hong
100.
00.
45.
39.
57.
48.
438
.723
.66.
8
33H
ung
Yen
100.
00.
711
.412
.25.
58.
530
.220
.710
.9
34Th
ai B
inh
100.
00.
02.
06.
66.
910
.532
.427
.913
.7
35H
a N
am10
0.0
0.0
2.9
7.0
4.5
7.7
30.4
28.9
18.5
36N
am D
inh
100.
00.
13.
66.
23.
59.
727
.033
.516
.4
37N
inh
Bin
h10
0.0
0.2
4.3
7.3
3.5
8.5
27.8
33.6
14.9
38Th
anh
Hoa
100.
00.
24.
16.
94.
88.
724
.430
.720
.2
40N
ghe
An
100.
00.
13.
76.
53.
98.
629
.230
.617
.5
42H
a Ti
nh10
0.0
0.2
5.5
10.5
4.4
11.4
31.7
26.0
10.4
44Q
uang
Bin
h10
0.0
0.1
3.2
5.9
3.8
8.6
36.9
28.0
13.4
45Q
uang
Tri
100.
00.
22.
06.
24.
110
.737
.128
.710
.9
46Th
ua T
hien
Hue
100.
00.
24.
09.
05.
68.
340
.623
.98.
4
48D
a N
ang
100.
00.
52.
85.
66.
14.
444
.621
.614
.4
49Q
uang
Nam
100.
00.
34.
110
.07.
011
.536
.023
.77.
6
51Q
uang
Nga
i10
0.0
0.2
2.4
6.4
4.6
10.1
33.3
34.4
8.6
52B
inh
Din
h10
0.0
0.2
2.4
6.8
5.3
7.8
28.6
32.7
16.3
54Ph
u Y
en10
0.0
0.0
1.8
5.8
3.8
5.6
34.8
36.1
12.1
56K
hanh
Hoa
100.
00.
22.
57.
76.
913
.846
.918
.53.
4
58N
inh
Thua
n10
0.0
0.4
6.9
13.0
7.3
9.5
35.7
19.7
7.6
Uni
t: %
138

Tab
le 2
2 (c
ontin
ue)
Cod
eA
dmin
istra
tion
Tota
l 1
-9 h
ours
10-1
9 ho
urs
20-2
9 ho
urs
30-3
4 ho
urs
35-3
9 ho
urs
40-4
8 ho
urs
49-5
9 ho
urs
60 h
ours
+
Uni
t: %
60B
inh
Thua
n10
0.0
0.0
1.1
4.9
5.8
9.0
44.6
24.7
9.9
62K
on T
um10
0.0
0.0
0.7
1.5
2.9
7.6
52.5
30.7
4.1
64G
ia L
ai10
0.0
0.2
0.9
2.6
4.4
10.1
52.5
25.5
4.0
66D
ak L
ak10
0.0
0.1
2.6
7.9
7.0
12.6
41.3
22.5
6.0
67D
ak N
ong
100.
00.
00.
21.
31.
96.
860
.026
.43.
4
68La
m D
ong
100.
00.
11.
96.
96.
19.
845
.121
.88.
4
70B
inh
Phuo
c10
0.0
0.1
1.5
7.0
4.9
9.9
44.7
23.3
8.6
72Ta
y N
inh
100.
00.
22.
78.
35.
011
.245
.921
.55.
2
74B
inh
Duo
ng10
0.0
0.4
1.6
3.2
5.7
4.7
40.0
26.1
18.3
75D
ong
Nai
100.
00.
31.
63.
64.
34.
545
.427
.612
.6
77B
a R
ia-V
ung
Tau
100.
00.
31.
23.
73.
14.
948
.325
.912
.6
79H
o C
hi M
inh
City
100.
00.
61.
12.
72.
12.
749
.624
.516
.7
80Lo
ng A
n10
0.0
0.3
5.9
11.4
6.9
11.7
39.0
18.1
6.7
82Ti
en G
iang
100.
00.
23.
37.
55.
18.
536
.327
.611
.5
83B
en T
re10
0.0
0.8
11.5
19.9
7.9
9.8
26.8
15.2
8.0
84Tr
a V
inh
100.
00.
35.
510
.95.
68.
232
.421
.515
.6
86V
inh
Long
100.
00.
14.
210
.56.
615
.531
.822
.29.
0
87D
ong
Thap
100.
00.
15.
110
.77.
514
.036
.416
.89.
4
89A
n G
iang
100.
00.
22.
56.
75.
89.
731
.925
.717
.6
91K
ien
Gia
ng10
0.0
0.2
4.5
10.1
6.0
10.8
30.0
22.3
16.1
92C
an T
ho10
0.0
0.3
3.7
11.9
7.3
12.9
38.9
20.8
4.3
93H
au G
iang
100.
00.
35.
110
.67.
213
.535
.422
.85.
1
94So
c Tr
ang
100.
00.
13.
29.
24.
99.
938
.522
.811
.4
95B
ac L
ieu
100.
00.
00.
83.
411
.721
.649
.012
.61.
0
96C
a M
au10
0.0
0.4
10.9
16.5
4.7
16.2
28.9
15.2
7.1
139
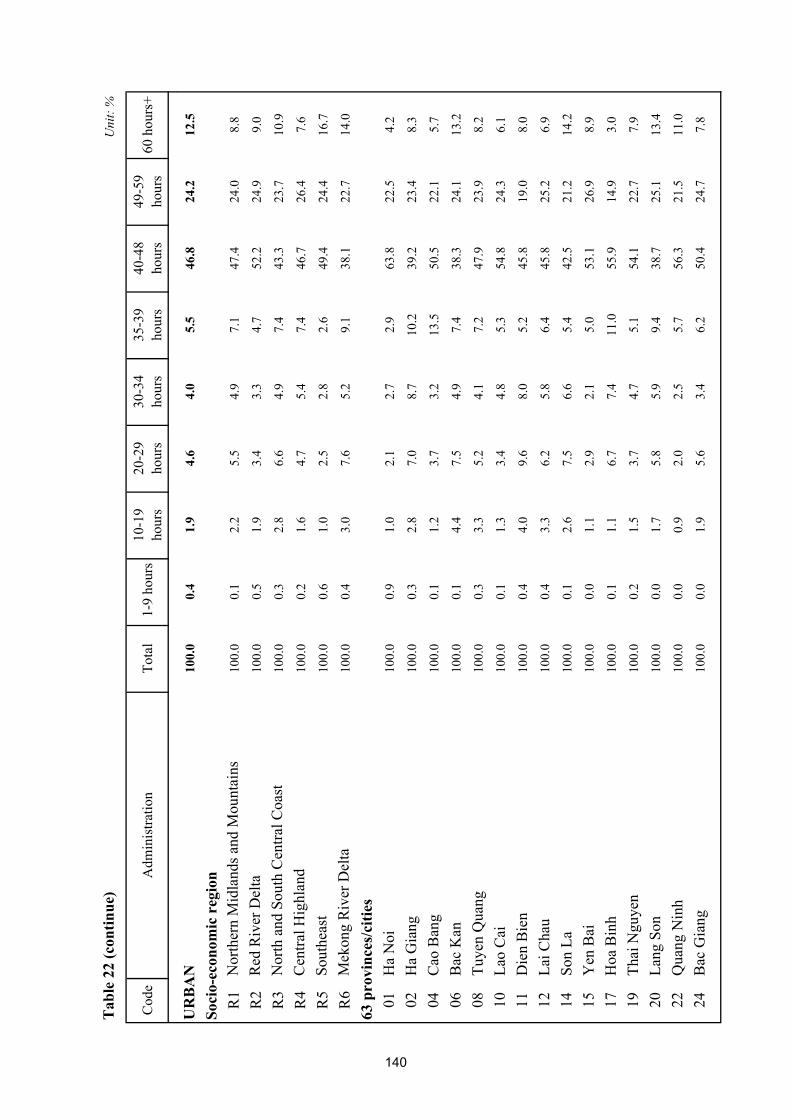
Tab
le 2
2 (c
ontin
ue)
Cod
eA
dmin
istra
tion
Tota
l 1
-9 h
ours
10-1
9 ho
urs
20-2
9 ho
urs
30-3
4 ho
urs
35-3
9 ho
urs
40-4
8 ho
urs
49-5
9 ho
urs
60 h
ours
+
Uni
t: %
UR
BA
N10
0.0
0.4
1.9
4.6
4.0
5.5
46.8
24.2
12.5
Soci
o-ec
onom
ic r
egio
nR
1N
orth
ern
Mid
land
s and
Mou
ntai
ns10
0.0
0.1
2.2
5.5
4.9
7.1
47.4
24.0
8.8
R2
Red
Riv
er D
elta
100.
00.
51.
93.
43.
34.
752
.224
.99.
0
R3
Nor
th a
nd S
outh
Cen
tral C
oast
100.
00.
32.
86.
64.
97.
443
.323
.710
.9
R4
Cen
tral H
ighl
and
100.
00.
21.
64.
75.
47.
446
.726
.47.
6
R5
Sout
heas
t10
0.0
0.6
1.0
2.5
2.8
2.6
49.4
24.4
16.7
R6
Mek
ong
Riv
er D
elta
100.
00.
43.
07.
65.
29.
138
.122
.714
.0
63 p
rovi
nces
/citi
es01
Ha
Noi
100.
00.
91.
02.
12.
72.
963
.822
.54.
2
02H
a G
iang
100.
00.
32.
87.
08.
710
.239
.223
.48.
3
04C
ao B
ang
100.
00.
11.
23.
73.
213
.550
.522
.15.
7
06B
ac K
an10
0.0
0.1
4.4
7.5
4.9
7.4
38.3
24.1
13.2
08Tu
yen
Qua
ng10
0.0
0.3
3.3
5.2
4.1
7.2
47.9
23.9
8.2
10La
o C
ai10
0.0
0.1
1.3
3.4
4.8
5.3
54.8
24.3
6.1
11D
ien
Bie
n 10
0.0
0.4
4.0
9.6
8.0
5.2
45.8
19.0
8.0
12La
i Cha
u10
0.0
0.4
3.3
6.2
5.8
6.4
45.8
25.2
6.9
14So
n La
100.
00.
12.
67.
56.
65.
442
.521
.214
.2
15Y
en B
ai10
0.0
0.0
1.1
2.9
2.1
5.0
53.1
26.9
8.9
17H
oa B
inh
100.
00.
11.
16.
77.
411
.055
.914
.93.
0
19Th
ai N
guye
n10
0.0
0.2
1.5
3.7
4.7
5.1
54.1
22.7
7.9
20La
ng S
on10
0.0
0.0
1.7
5.8
5.9
9.4
38.7
25.1
13.4
22Q
uang
Nin
h10
0.0
0.0
0.9
2.0
2.5
5.7
56.3
21.5
11.0
24B
ac G
iang
100.
00.
01.
95.
63.
46.
250
.424
.77.
8
140

Tab
le 2
2 (c
ontin
ue)
Cod
eA
dmin
istra
tion
Tota
l 1
-9 h
ours
10-1
9 ho
urs
20-2
9 ho
urs
30-3
4 ho
urs
35-3
9 ho
urs
40-4
8 ho
urs
49-5
9 ho
urs
60 h
ours
+
Uni
t: %
25Ph
u Th
o10
0.0
0.0
2.7
6.2
3.0
7.0
42.0
29.6
9.4
26V
inh
Phuc
100.
00.
31.
95.
85.
16.
139
.229
.911
.8
27B
ac N
inh
100.
00.
33.
13.
94.
33.
932
.130
.821
.5
30H
ai D
uong
100.
00.
22.
55.
85.
08.
537
.629
.510
.8
31H
ai P
hong
100.
00.
53.
65.
94.
66.
546
.323
.29.
5
33H
ung
Yen
100.
00.
54.
46.
94.
17.
032
.328
.915
.9
34Th
ai B
inh
100.
00.
11.
11.
51.
54.
936
.136
.618
.3
35H
a N
am10
0.0
0.0
1.2
2.7
2.1
5.8
55.6
25.7
6.9
36N
am D
inh
100.
00.
23.
55.
03.
66.
436
.827
.417
.1
37N
inh
Bin
h10
0.0
0.2
1.8
4.3
3.0
5.2
40.9
32.7
11.9
38Th
anh
Hoa
100.
00.
42.
35.
75.
28.
338
.926
.712
.4
40N
ghe
An
100.
00.
66.
79.
04.
98.
545
.021
.83.
7
42H
a Ti
nh10
0.0
0.1
4.0
9.4
4.8
8.0
31.9
24.8
17.0
44Q
uang
Bin
h10
0.0
0.4
1.1
4.1
2.2
4.9
49.4
24.8
13.2
45Q
uang
Tri
100.
00.
31.
64.
65.
26.
541
.023
.817
.0
46Th
ua T
hien
Hue
100.
00.
32.
87.
54.
75.
743
.125
.610
.3
48D
a N
ang
100.
00.
52.
85.
25.
54.
446
.520
.914
.3
49Q
uang
Nam
100.
00.
03.
07.
35.
37.
940
.526
.19.
8
51Q
uang
Nga
i10
0.0
0.3
3.0
5.9
3.0
5.3
36.6
33.9
12.1
52B
inh
Din
h10
0.0
0.6
2.3
7.4
5.2
7.9
38.5
25.3
12.9
54Ph
u Y
en10
0.0
0.0
1.4
3.7
3.1
5.6
42.9
29.2
14.2
56K
hanh
Hoa
100.
00.
32.
88.
45.
811
.849
.217
.54.
2
58N
inh
Thua
n10
0.0
0.3
2.0
7.3
6.6
9.5
42.3
22.7
9.4
60B
inh
Thua
n10
0.0
0.0
1.0
4.3
4.5
8.0
47.1
23.0
12.1
141

Tab
le 2
2 (c
ontin
ue)
Cod
eA
dmin
istra
tion
Tota
l 1
-9 h
ours
10-1
9 ho
urs
20-2
9 ho
urs
30-3
4 ho
urs
35-3
9 ho
urs
40-4
8 ho
urs
49-5
9 ho
urs
60 h
ours
+
Uni
t: %
62K
on T
um10
0.0
0.0
1.0
1.4
3.9
6.1
53.1
28.5
6.0
64G
ia L
ai10
0.0
0.3
1.1
2.9
5.8
6.4
49.7
28.7
5.2
66D
ak L
ak10
0.0
0.2
1.8
6.3
5.0
10.7
47.2
22.7
6.1
67D
ak N
ong
100.
00.
00.
21.
22.
58.
858
.124
.15.
1
68La
m D
ong
100.
00.
22.
36.
66.
45.
739
.427
.212
.1
70B
inh
Phuo
c10
0.0
0.1
0.9
3.0
2.7
4.9
46.4
29.3
12.7
72Ta
y N
inh
100.
00.
01.
24.
32.
65.
350
.927
.38.
4
74B
inh
Duo
ng10
0.0
0.6
1.1
2.1
5.7
2.1
41.9
26.8
19.7
75D
ong
Nai
100.
00.
21.
01.
94.
22.
851
.425
.413
.2
77B
a R
ia-V
ung
Tau
100.
00.
51.
12.
12.
33.
751
.226
.412
.7
79H
o C
hi M
inh
City
100.
00.
71.
02.
72.
02.
450
.623
.317
.3
80Lo
ng A
n10
0.0
0.9
4.9
8.2
6.1
8.2
46.7
20.2
4.8
82Ti
en G
iang
100.
00.
83.
58.
56.
08.
341
.623
.38.
0
83B
en T
re10
0.0
0.8
4.3
12.3
4.6
10.2
39.7
19.0
9.1
84Tr
a V
inh
100.
00.
22.
26.
74.
34.
939
.222
.919
.7
86V
inh
Long
100.
00.
32.
18.
17.
77.
835
.822
.116
.1
87D
ong
Thap
100.
00.
33.
89.
05.
612
.636
.219
.413
.1
89A
n G
iang
100.
00.
32.
05.
73.
56.
729
.625
.226
.9
91K
ien
Gia
ng10
0.0
0.7
2.4
4.1
3.5
6.7
33.0
24.4
25.2
92C
an T
ho10
0.0
0.4
2.9
9.1
6.6
11.9
38.6
24.4
6.0
93H
au G
iang
100.
00.
83.
910
.75.
911
.337
.424
.55.
5
94So
c Tr
ang
100.
00.
22.
27.
23.
78.
045
.920
.911
.9
95B
ac L
ieu
100.
00.
00.
44.
58.
98.
954
.820
.71.
8
96C
a M
au10
0.0
0.2
6.3
10.2
4.9
12.4
32.3
17.4
16.3
142

Tab
le 2
2 (c
ontin
ue)
Cod
eA
dmin
istra
tion
Tota
l 1
-9 h
ours
10-1
9 ho
urs
20-2
9 ho
urs
30-3
4 ho
urs
35-3
9 ho
urs
40-4
8 ho
urs
49-5
9 ho
urs
60 h
ours
+
Uni
t: %
RU
RA
L10
0.0
0.1
3.7
7.8
5.3
10.5
34.8
26.8
11.0
Soci
o-ec
onom
ic r
egio
nR
1N
orth
ern
Mid
land
s and
Mou
ntai
ns10
0.0
0.1
2.7
6.4
4.8
11.7
36.3
30.2
7.8
R2
Red
Riv
er D
elta
100.
00.
24.
07.
15.
09.
332
.428
.813
.2
R3
Nor
th a
nd S
outh
Cen
tral C
oast
100.
00.
13.
67.
55.
19.
730
.129
.714
.2
R4
Cen
tral H
ighl
and
100.
00.
11.
65.
25.
211
.448
.423
.34.
8
R5
Sout
heas
t10
0.0
0.2
1.9
5.4
4.4
7.5
43.1
26.1
11.2
R6
Mek
ong
Riv
er D
elta
100.
00.
25.
611
.56.
912
.933
.520
.29.
2
63 p
rovi
nces
/citi
es01
Ha
Noi
100.
00.
01.
33.
23.
27.
142
.630
.711
.9
02H
a G
iang
100.
00.
13.
56.
65.
410
.628
.434
.311
.1
04C
ao B
ang
100.
00.
02.
26.
33.
315
.236
.030
.07.
0
06B
ac K
an10
0.0
0.0
2.3
6.6
4.7
12.7
32.7
33.0
8.0
08Tu
yen
Qua
ng10
0.0
0.1
4.0
7.9
4.8
12.1
44.5
21.5
5.1
10La
o C
ai10
0.0
0.0
0.9
1.7
1.8
6.3
45.9
40.1
3.3
11D
ien
Bie
n 10
0.0
0.0
4.1
8.5
9.0
12.9
27.5
33.2
4.8
12La
i Cha
u10
0.0
0.0
3.2
5.7
4.5
12.2
44.4
26.9
3.1
14So
n La
100.
00.
12.
67.
75.
410
.033
.031
.79.
5
15Y
en B
ai10
0.0
0.0
2.9
4.8
3.2
9.7
30.0
43.4
6.0
17H
oa B
inh
100.
00.
22.
37.
07.
116
.348
.216
.42.
5
19Th
ai N
guye
n10
0.0
0.0
2.5
5.8
3.9
8.5
43.5
27.4
8.4
20La
ng S
on10
0.0
0.0
3.9
7.3
6.5
16.2
30.9
26.0
9.2
22Q
uang
Nin
h10
0.0
0.0
0.4
2.5
3.2
9.5
37.6
36.4
10.3
24B
ac G
iang
100.
00.
01.
97.
54.
915
.036
.825
.28.
6
143

Tab
le 2
2 (c
ontin
ue)
Cod
eA
dmin
istra
tion
Tota
l 1
-9 h
ours
10-1
9 ho
urs
20-2
9 ho
urs
30-3
4 ho
urs
35-3
9 ho
urs
40-4
8 ho
urs
49-5
9 ho
urs
60 h
ours
+
Uni
t: %
25Ph
u Th
o10
0.0
0.1
2.5
4.9
3.0
7.5
28.4
39.9
13.7
26V
inh
Phuc
100.
00.
13.
08.
75.
611
.327
.429
.414
.4
27B
ac N
inh
100.
00.
27.
710
.25.
86.
124
.622
.922
.4
30H
ai D
uong
100.
00.
56.
39.
15.
313
.026
.426
.812
.6
31H
ai P
hong
100.
00.
36.
612
.29.
49.
733
.124
.04.
8
33H
ung
Yen
100.
00.
712
.312
.95.
78.
729
.919
.610
.2
34Th
ai B
inh
100.
00.
02.
17.
17.
411
.032
.127
.113
.2
35H
a N
am10
0.0
0.0
3.0
7.5
4.8
7.9
27.9
29.3
19.6
36N
am D
inh
100.
00.
13.
66.
53.
510
.425
.034
.716
.3
37N
inh
Bin
h10
0.0
0.2
4.8
8.0
3.6
9.2
24.7
33.9
15.6
38Th
anh
Hoa
100.
00.
24.
37.
14.
78.
722
.731
.221
.1
40N
ghe
An
100.
00.
03.
36.
13.
78.
626
.931
.819
.5
42H
a Ti
nh10
0.0
0.2
5.8
10.6
4.3
12.0
31.6
26.3
9.2
44Q
uang
Bin
h10
0.0
0.1
3.5
6.2
4.1
9.2
34.8
28.5
13.5
45Q
uang
Tri
100.
00.
22.
26.
93.
712
.435
.630
.78.
4
46Th
ua T
hien
Hue
100.
00.
15.
911
.47.
012
.236
.621
.25.
5
48D
a N
ang
100.
00.
42.
88.
29.
64.
733
.725
.714
.9
49Q
uang
Nam
100.
00.
34.
310
.67.
412
.334
.923
.27.
0
51Q
uang
Nga
i10
0.0
0.2
2.3
6.4
4.9
10.9
32.7
34.5
8.0
52B
inh
Din
h10
0.0
0.1
2.4
6.5
5.4
7.7
24.9
35.4
17.6
54Ph
u Y
en10
0.0
0.0
2.0
6.4
4.0
5.6
32.6
37.9
11.5
56K
hanh
Hoa
100.
00.
12.
26.
98.
216
.144
.419
.52.
5
58N
inh
Thua
n10
0.0
0.5
9.5
16.0
7.7
9.5
32.2
18.0
6.6
60B
inh
Thua
n10
0.0
0.0
1.1
5.3
6.6
9.7
43.1
25.7
8.5
144

Tab
le 2
2 (c
ontin
ue)
Cod
eA
dmin
istra
tion
Tota
l 1
-9 h
ours
10-1
9 ho
urs
20-2
9 ho
urs
30-3
4 ho
urs
35-3
9 ho
urs
40-4
8 ho
urs
49-5
9 ho
urs
60 h
ours
+
Uni
t: %
62K
on T
um10
0.0
0.1
0.5
1.5
2.4
8.4
52.1
32.0
3.0
64G
ia L
ai10
0.0
0.1
0.8
2.5
3.7
11.7
53.7
24.1
3.4
66D
ak L
ak10
0.0
0.0
2.9
8.4
7.5
13.2
39.5
22.5
6.0
67D
ak N
ong
100.
00.
00.
21.
31.
86.
460
.326
.83.
1
68La
m D
ong
100.
00.
01.
77.
05.
912
.248
.518
.56.
2
70B
inh
Phuo
c10
0.0
0.1
1.6
7.8
5.3
10.8
44.3
22.3
7.8
72Ta
y N
inh
100.
00.
22.
99.
05.
412
.345
.020
.54.
7
74B
inh
Duo
ng10
0.0
0.1
2.4
5.2
5.7
9.4
36.6
24.7
15.9
75D
ong
Nai
100.
00.
31.
94.
54.
35.
442
.628
.712
.4
77B
a R
ia-V
ung
Tau
100.
00.
01.
35.
13.
86.
045
.625
.612
.5
79H
o C
hi M
inh
City
100.
00.
21.
52.
72.
44.
444
.530
.413
.8
80Lo
ng A
n10
0.0
0.2
6.1
12.0
7.1
12.4
37.4
17.7
7.1
82Ti
en G
iang
100.
00.
13.
27.
35.
08.
535
.328
.412
.1
83B
en T
re10
0.0
0.8
12.2
20.6
8.3
9.8
25.6
14.9
7.9
84Tr
a V
inh
100.
00.
46.
111
.75.
88.
831
.121
.314
.8
86V
inh
Long
100.
00.
14.
510
.96.
416
.831
.222
.27.
9
87D
ong
Thap
100.
00.
15.
311
.07.
914
.336
.416
.28.
6
89A
n G
iang
100.
00.
12.
77.
16.
811
.133
.025
.913
.3
91K
ien
Gia
ng10
0.0
0.0
5.3
12.2
6.8
12.2
28.9
21.6
12.9
92C
an T
ho10
0.0
0.0
5.4
17.4
8.6
15.0
39.3
13.5
0.8
93H
au G
iang
100.
00.
15.
410
.67.
614
.234
.822
.34.
9
94So
c Tr
ang
100.
00.
13.
710
.15.
410
.735
.423
.511
.2
95B
ac L
ieu
100.
00.
00.
93.
012
.625
.847
.09.
90.
7
96C
a M
au10
0.0
0.5
12.1
18.1
4.7
17.2
28.0
14.6
4.8
145
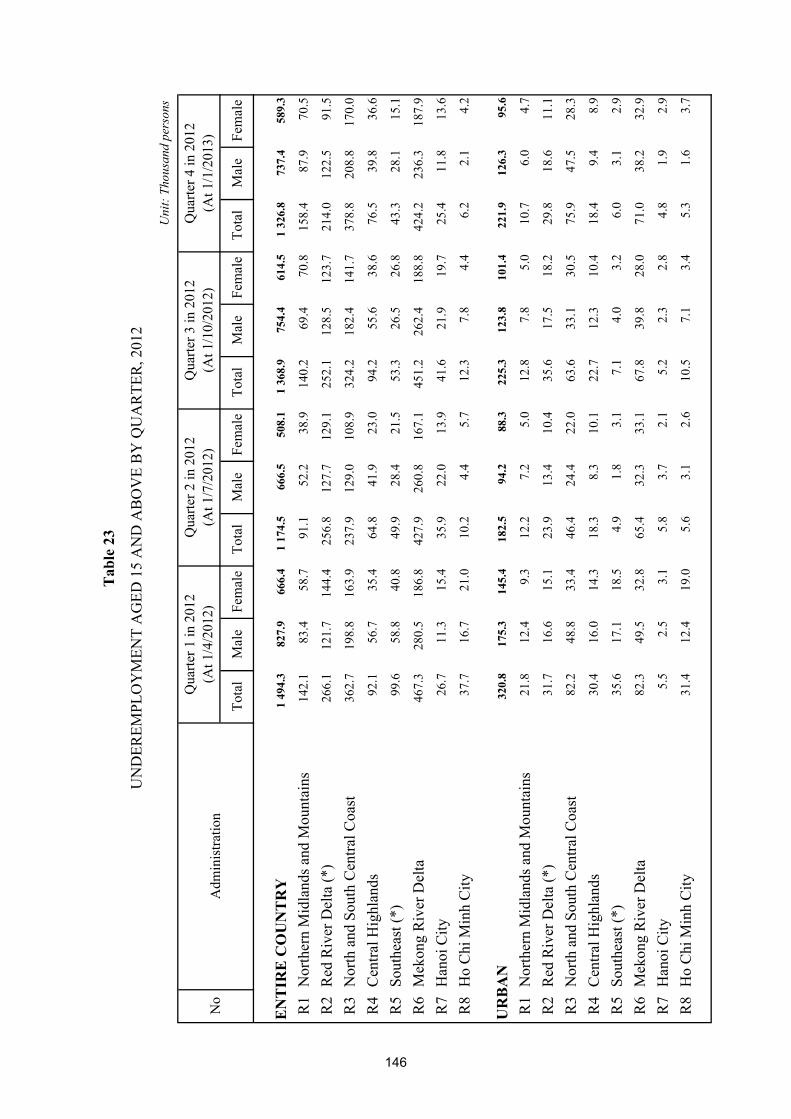
Tota
lM
ale
Fem
ale
Tota
lM
ale
Fem
ale
Tota
lM
ale
Fem
ale
Tota
lM
ale
Fem
ale
EN
TIR
E C
OU
NT
RY
1 49
4.3
827.
966
6.4
1 17
4.5
666.
550
8.1
1 36
8.9
754.
461
4.5
1 32
6.8
737.
458
9.3
R1
Nor
ther
n M
idla
nds a
nd M
ount
ains
142.
183
.458
.791
.152
.238
.914
0.2
69.4
70.8
158.
487
.970
.5
R2
Red
Riv
er D
elta
(*)
266.
112
1.7
144.
425
6.8
127.
712
9.1
252.
112
8.5
123.
721
4.0
122.
591
.5
R3
Nor
th a
nd S
outh
Cen
tral C
oast
362.
719
8.8
163.
923
7.9
129.
010
8.9
324.
218
2.4
141.
737
8.8
208.
817
0.0
R4
Cen
tral H
ighl
ands
92.1
56.7
35.4
64.8
41.9
23.0
94.2
55.6
38.6
76.5
39.8
36.6
R5
Sout
heas
t (*)
99.6
58.8
40.8
49.9
28.4
21.5
53.3
26.5
26.8
43.3
28.1
15.1
R6
Mek
ong
Riv
er D
elta
467.
328
0.5
186.
842
7.9
260.
816
7.1
451.
226
2.4
188.
842
4.2
236.
318
7.9
R7
Han
oi C
ity26
.711
.315
.435
.922
.013
.941
.621
.919
.725
.411
.813
.6
R8
Ho
Chi
Min
h C
ity37
.716
.721
.010
.24.
45.
712
.37.
84.
46.
22.
14.
2
UR
BA
N32
0.8
175.
314
5.4
182.
594
.288
.322
5.3
123.
810
1.4
221.
912
6.3
95.6
R1
Nor
ther
n M
idla
nds a
nd M
ount
ains
21.8
12.4
9.3
12.2
7.2
5.0
12.8
7.8
5.0
10.7
6.0
4.7
R2
Red
Riv
er D
elta
(*)
31.7
16.6
15.1
23.9
13.4
10.4
35.6
17.5
18.2
29.8
18.6
11.1
R3
Nor
th a
nd S
outh
Cen
tral C
oast
82.2
48.8
33.4
46.4
24.4
22.0
63.6
33.1
30.5
75.9
47.5
28.3
R4
Cen
tral H
ighl
ands
30.4
16.0
14.3
18.3
8.3
10.1
22.7
12.3
10.4
18.4
9.4
8.9
R5
Sout
heas
t (*)
35.6
17.1
18.5
4.9
1.8
3.1
7.1
4.0
3.2
6.0
3.1
2.9
R6
Mek
ong
Riv
er D
elta
82.3
49.5
32.8
65.4
32.3
33.1
67.8
39.8
28.0
71.0
38.2
32.9
R7
Han
oi C
ity5.
52.
53.
15.
83.
72.
15.
22.
32.
84.
81.
92.
9
R8
Ho
Chi
Min
h C
ity31
.412
.419
.05.
63.
12.
610
.57.
13.
45.
31.
63.
7
Tab
le 2
3
UN
DER
EMPL
OY
MEN
T A
GED
15
AN
D A
BO
VE
BY
QU
AR
TER
, 201
2
Uni
t: Th
ousa
nd p
erso
ns
No
Adm
inis
tratio
n
Qua
rter 1
in 2
012
(At 1
/4/2
012)
Qua
rter 4
in 2
012
(At 1
/1/2
013)
Qua
rter 2
in 2
012
(At 1
/7/2
012)
Qua
rter 3
in 2
012
(At 1
/10/
2012
)
146

Tab
le 2
3 (c
ontin
ue)
Tota
lM
ale
Fem
ale
Tota
lM
ale
Fem
ale
Tota
lM
ale
Fem
ale
Tota
lM
ale
Fem
ale
RU
RA
L1
173.
565
2.6
520.
999
2.0
572.
341
9.7
1 14
3.7
630.
651
3.1
1 10
4.9
611.
149
3.8
R1
Nor
ther
n M
idla
nds a
nd M
ount
ains
120.
370
.949
.478
.945
.033
.912
7.4
61.6
65.8
147.
781
.965
.8
R2
Red
Riv
er D
elta
(*)
234.
410
5.1
129.
323
2.9
114.
311
8.7
216.
511
1.0
105.
518
4.2
103.
980
.3
R3
Nor
th a
nd S
outh
Cen
tral C
oast
280.
515
0.0
130.
619
1.5
104.
686
.926
0.6
149.
311
1.3
302.
916
1.3
141.
6
R4
Cen
tral H
ighl
ands
61.8
40.7
21.1
46.5
33.6
12.9
71.5
43.3
28.2
58.1
30.4
27.7
R5
Sout
heas
t (*)
64.0
41.7
22.3
45.0
26.6
18.4
46.1
22.5
23.6
37.3
25.1
12.2
R6
Mek
ong
Riv
er D
elta
385.
023
1.0
154.
136
2.5
228.
513
4.0
383.
422
2.6
160.
835
3.2
198.
115
5.1
R7
Han
oi C
ity21
.28.
912
.330
.218
.311
.936
.419
.516
.920
.610
.010
.6
R8
Ho
Chi
Min
h C
ity6.
34.
32.
04.
51.
43.
11.
80.
81.
00.
90.
50.
4
Rem
ark:
(*) R
ed R
iver
Del
ta e
xclu
des H
anoi
City
and
Sou
thea
st e
xclu
des H
o C
hi M
inh
City
.
Uni
t: Th
ousa
nd p
erso
ns
No
Adm
inis
tratio
n
Qua
rter 1
in 2
012
(At 1
/4/2
012)
Qua
rter 2
in 2
012
(At 1
/7/2
012)
Qua
rter 3
in 2
012
(At 1
/10/
2012
)Q
uarte
r 4 in
201
2(A
t 1/1
/201
3)
147

Tota
lM
ale
Fem
ale
Tota
lM
ale
Fem
ale
Tota
lM
ale
Fem
ale
Tota
lM
ale
Fem
ale
EN
TIR
E C
OU
NT
RY
1 41
2.0
804.
960
7.1
1 10
1.8
642.
945
8.9
1 27
5.1
733.
054
2.2
1 25
4.9
719.
553
5.4
R1
Nor
ther
n M
idla
nds a
nd M
ount
ains
136.
582
.653
.988
.352
.036
.313
6.0
69.3
66.7
150.
086
.763
.2
R2
Red
Riv
er D
elta
(*)
238.
011
6.5
121.
423
5.2
120.
311
4.9
231.
012
4.1
106.
919
4.4
119.
175
.3
R3
Nor
th a
nd S
outh
Cen
tral C
oast
346.
019
1.6
154.
422
4.4
123.
410
1.0
309.
417
7.6
131.
836
9.7
205.
416
4.3
R4
Cen
tral H
ighl
ands
90.9
56.3
34.6
64.3
41.6
22.8
93.5
55.2
38.3
74.5
39.5
35.1
R5
Sout
heas
t (*)
95.3
58.8
36.6
47.8
28.3
19.5
46.4
25.0
21.3
41.8
28.1
13.7
R6
Mek
ong
Riv
er D
elta
443.
727
2.3
171.
439
8.1
251.
614
6.5
410.
225
4.2
156.
039
9.7
228.
217
1.5
R7
Han
oi C
ity25
.311
.314
.033
.721
.312
.436
.819
.817
.019
.810
.59.
2
R8
Ho
Chi
Min
h C
ity36
.215
.520
.79.
94.
45.
511
.97.
74.
25.
12.
13.
0
UR
BA
N30
1.6
167.
713
3.9
170.
689
.181
.621
0.4
118.
991
.520
7.5
122.
784
.8
R1
Nor
ther
n M
idla
nds a
nd M
ount
ains
20.4
11.8
8.6
11.5
6.9
4.6
12.4
7.7
4.8
10.4
5.8
4.6
R2
Red
Riv
er D
elta
(*)
30.4
15.8
14.6
20.3
12.4
8.0
30.4
16.6
13.8
26.9
18.3
8.6
R3
Nor
th a
nd S
outh
Cen
tral C
oast
74.6
45.3
29.3
42.7
22.3
20.4
59.1
31.0
28.1
71.7
45.7
26.0
R4
Cen
tral H
ighl
ands
29.2
15.6
13.5
17.8
8.0
9.9
22.5
12.0
10.4
17.4
9.1
8.3
R5
Sout
heas
t (*)
34.8
17.1
17.7
4.9
1.7
3.1
7.0
3.9
3.2
5.9
3.0
2.9
R6
Mek
ong
Riv
er D
elta
76.4
48.2
28.2
62.0
31.0
31.0
63.3
38.3
25.0
66.2
37.2
28.9
R7
Han
oi C
ity5.
52.
53.
15.
83.
72.
15.
22.
32.
84.
81.
92.
9
R8
Ho
Chi
Min
h C
ity30
.411
.419
.05.
63.
12.
610
.57.
13.
44.
21.
62.
6
Tab
le 2
4
UN
DER
EMPL
OY
MEN
T IN
TH
E ST
ATU
TOR
Y W
OR
KIN
G A
GE
BY
QU
AR
TER
, 201
2
Uni
t: Th
ousa
nd p
erso
ns
No
Adm
inis
tratio
n
Qua
rter 1
in 2
012
(At 1
/4/2
012)
Qua
rter 4
in 2
012
(At 1
/1/2
013)
Qua
rter 2
in 2
012
(At 1
/7/2
012)
Qua
rter 3
in 2
012
(At 1
/10/
2012
)
148
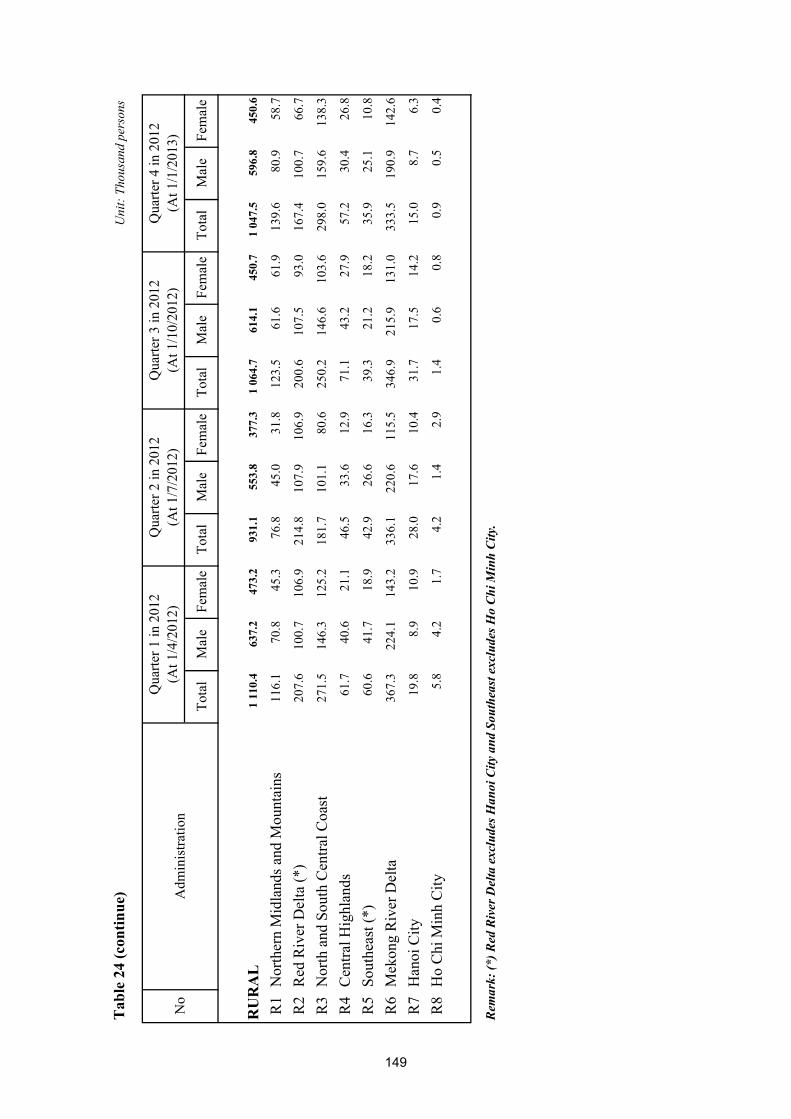
Tab
le 2
4 (c
ontin
ue)
Tota
lM
ale
Fem
ale
Tota
lM
ale
Fem
ale
Tota
lM
ale
Fem
ale
Tota
lM
ale
Fem
ale
RU
RA
L1
110.
463
7.2
473.
293
1.1
553.
837
7.3
1 06
4.7
614.
145
0.7
1 04
7.5
596.
845
0.6
R1
Nor
ther
n M
idla
nds a
nd M
ount
ains
116.
170
.845
.376
.845
.031
.812
3.5
61.6
61.9
139.
680
.958
.7
R2
Red
Riv
er D
elta
(*)
207.
610
0.7
106.
921
4.8
107.
910
6.9
200.
610
7.5
93.0
167.
410
0.7
66.7
R3
Nor
th a
nd S
outh
Cen
tral C
oast
271.
514
6.3
125.
218
1.7
101.
180
.625
0.2
146.
610
3.6
298.
015
9.6
138.
3
R4
Cen
tral H
ighl
ands
61.7
40.6
21.1
46.5
33.6
12.9
71.1
43.2
27.9
57.2
30.4
26.8
R5
Sout
heas
t (*)
60.6
41.7
18.9
42.9
26.6
16.3
39.3
21.2
18.2
35.9
25.1
10.8
R6
Mek
ong
Riv
er D
elta
367.
322
4.1
143.
233
6.1
220.
611
5.5
346.
921
5.9
131.
033
3.5
190.
914
2.6
R7
Han
oi C
ity19
.88.
910
.928
.017
.610
.431
.717
.514
.215
.08.
76.
3
R8
Ho
Chi
Min
h C
ity5.
84.
21.
74.
21.
42.
91.
40.
60.
80.
90.
50.
4
Rem
ark:
(*) R
ed R
iver
Del
ta e
xclu
des H
anoi
City
and
Sou
thea
st e
xclu
des H
o C
hi M
inh
City
.
Uni
t: Th
ousa
nd p
erso
ns
No
Adm
inis
tratio
n
Qua
rter 1
in 2
012
(At 1
/4/2
012)
Qua
rter 2
in 2
012
(At 1
/7/2
012)
Qua
rter 3
in 2
012
(At 1
/10/
2012
)Q
uarte
r 4 in
201
2(A
t 1/1
/201
3)
149

Tota
lM
ale
Fem
ale
Tota
lM
ale
Fem
ale
Tota
lM
ale
Fem
ale
EN
TIR
E C
OU
NT
RY
2.60
2.80
2.39
1.54
1.63
1.44
3.06
3.30
2.80
Soci
o-ec
onom
ic r
egio
nsR
1N
orth
ern
Mid
land
s and
Mou
ntai
ns1.
842.
031.
651.
241.
481.
001.
952.
131.
78
R2
Red
Riv
er D
elta
2.42
2.45
2.39
1.10
1.14
1.06
2.93
2.98
2.88
R3
Nor
th a
nd S
outh
Cen
tral C
oast
2.94
3.20
2.68
2.39
2.72
2.05
3.13
3.36
2.90
R4
Cen
tral H
ighl
ands
2.62
2.95
2.25
2.54
2.55
2.52
2.65
3.11
2.14
R5
Sout
heas
t0.
930.
980.
880.
550.
490.
621.
481.
691.
25
R6
Mek
ong
Riv
er D
elta
4.35
4.66
3.98
2.93
3.12
2.71
4.80
5.12
4.40
63 p
rovi
nces
/citi
es01
Ha
Noi
0.90
0.91
0.88
0.37
0.35
0.38
1.23
1.28
1.18
02H
a G
iang
1.36
2.03
0.70
1.20
1.51
0.91
1.38
2.12
0.67
04C
ao B
ang
0.36
0.44
0.28
1.05
1.01
1.08
0.22
0.33
0.12
06B
ac K
an0.
690.
790.
581.
581.
871.
340.
530.
620.
42
08Tu
yen
Qua
ng5.
625.
345.
913.
193.
912.
485.
955.
536.
39
10La
o C
ai0.
500.
810.
180.
961.
340.
620.
380.
680.
06
11D
ien
Bie
n 6.
217.
155.
311.
691.
481.
927.
008.
195.
87
12La
i Cha
u1.
922.
231.
602.
412.
392.
441.
832.
191.
47
14So
n La
0.66
0.80
0.52
1.40
1.66
1.09
0.54
0.64
0.44
15Y
en B
ai0.
440.
470.
410.
180.
380.
000.
500.
490.
51
17H
oa B
inh
2.29
2.71
1.88
1.59
2.05
1.16
2.40
2.81
1.99
19Th
ai N
guye
n1.
221.
151.
290.
771.
070.
501.
351.
171.
55
20La
ng S
on1.
802.
031.
562.
062.
491.
681.
751.
951.
53
Tab
le 2
5U
ND
EREM
PLO
YM
ENT
RA
TE A
GED
15
AN
D A
BO
VE,
201
2
Cod
eA
dmin
istra
tion
Uni
t: %
Who
le c
ount
ryU
rban
Rur
al
150

Tab
le 2
5 (c
ontin
ue)
Tota
lM
ale
Fem
ale
Tota
lM
ale
Fem
ale
Tota
lM
ale
Fem
ale
22Q
uang
Nin
h0.
510.
660.
330.
310.
420.
160.
700.
910.
48
24B
ac G
iang
2.84
2.93
2.75
1.57
1.81
1.34
2.95
3.04
2.88
25Ph
u Th
o0.
811.
100.
530.
600.
580.
630.
871.
230.
50
26V
inh
Phuc
1.89
1.94
1.84
1.83
1.96
1.69
1.90
1.93
1.88
27B
ac N
inh
3.52
4.12
2.97
3.79
4.30
3.28
3.42
4.06
2.87
30H
ai D
uong
4.70
3.75
5.58
3.19
2.78
3.53
5.09
3.98
6.14
31H
ai P
hong
2.90
3.87
1.93
1.22
1.51
0.87
4.15
5.87
2.62
33H
ung
Yen
2.28
2.89
1.70
1.80
1.84
1.76
2.34
3.02
1.69
34Th
ai B
inh
4.54
4.15
4.91
0.58
0.25
0.88
4.91
4.51
5.28
35H
a N
am4.
133.
634.
612.
171.
922.
424.
333.
814.
83
36N
am D
inh
3.33
3.30
3.36
2.44
2.94
2.01
3.51
3.37
3.65
37N
inh
Bin
h1.
642.
281.
010.
961.
170.
621.
802.
631.
08
38Th
anh
Hoa
3.14
3.02
3.26
2.11
1.82
2.40
3.26
3.17
3.35
40N
ghe
An
1.94
2.28
1.60
3.92
4.80
2.98
1.66
1.91
1.41
42H
a Ti
nh2.
672.
482.
853.
213.
413.
002.
572.
302.
82
44Q
uang
Bin
h1.
601.
551.
661.
531.
601.
461.
611.
541.
69
45Q
uang
Tri
2.36
2.32
2.41
2.52
2.35
2.71
2.30
2.31
2.29
46Th
ua T
hien
Hue
2.06
2.77
1.33
1.81
2.58
1.14
2.43
3.01
1.68
48D
a N
ang
1.53
2.00
1.05
1.51
1.92
1.11
1.69
2.40
0.58
49Q
uang
Nam
3.67
4.85
2.51
2.67
3.02
2.37
3.90
5.26
2.55
51Q
uang
Nga
i2.
522.
922.
112.
042.
121.
972.
603.
052.
14
52B
inh
Din
h4.
904.
874.
923.
533.
583.
485.
415.
385.
43
54Ph
u Y
en1.
852.
121.
542.
041.
892.
201.
792.
181.
35
56K
hanh
Hoa
2.99
3.11
2.86
2.29
2.43
2.14
3.79
3.81
3.76
58N
inh
Thua
n8.
819.
597.
923.
714.
293.
0211
.57
12.5
610
.48
Rur
al
Uni
t: %
Cod
eA
dmin
istra
tion
Who
le c
ount
ryU
rban
151
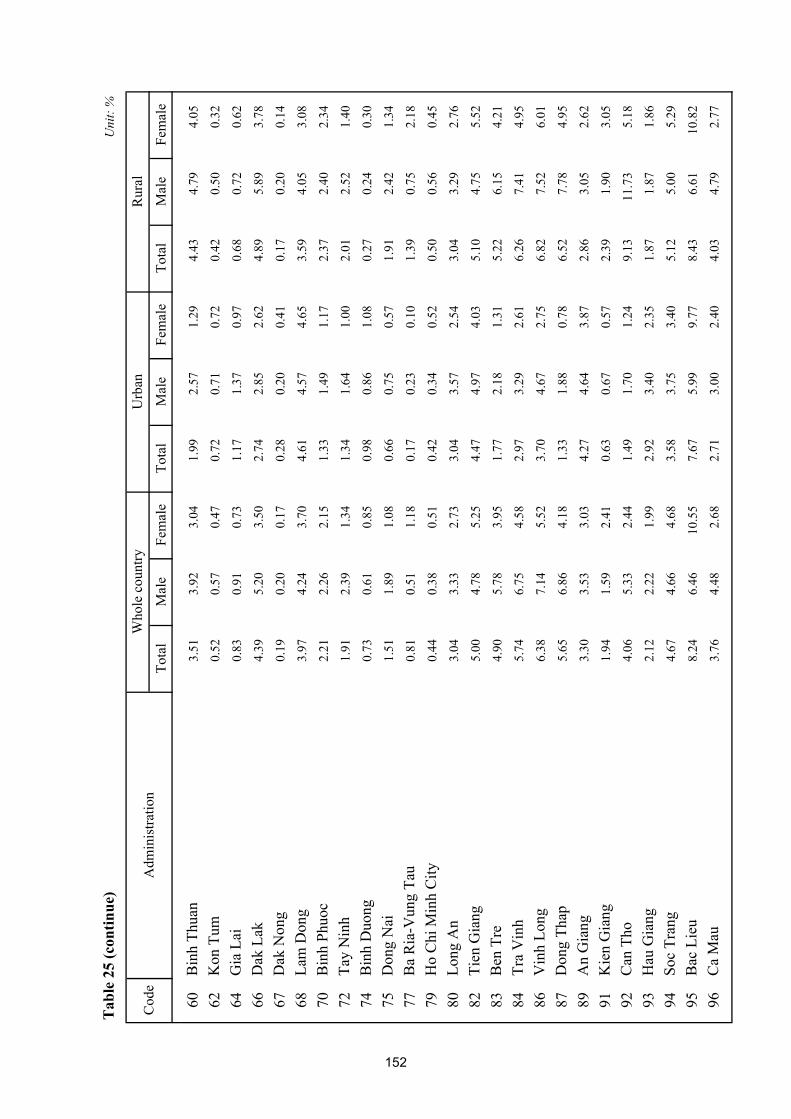
Tab
le 2
5 (c
ontin
ue)
Tota
lM
ale
Fem
ale
Tota
lM
ale
Fem
ale
Tota
lM
ale
Fem
ale
Rur
al
Uni
t: %
Cod
eA
dmin
istra
tion
Who
le c
ount
ryU
rban
60B
inh
Thua
n3.
513.
923.
041.
992.
571.
294.
434.
794.
05
62K
on T
um0.
520.
570.
470.
720.
710.
720.
420.
500.
32
64G
ia L
ai0.
830.
910.
731.
171.
370.
970.
680.
720.
62
66D
ak L
ak4.
395.
203.
502.
742.
852.
624.
895.
893.
78
67D
ak N
ong
0.19
0.20
0.17
0.28
0.20
0.41
0.17
0.20
0.14
68La
m D
ong
3.97
4.24
3.70
4.61
4.57
4.65
3.59
4.05
3.08
70B
inh
Phuo
c2.
212.
262.
151.
331.
491.
172.
372.
402.
34
72Ta
y N
inh
1.91
2.39
1.34
1.34
1.64
1.00
2.01
2.52
1.40
74B
inh
Duo
ng0.
730.
610.
850.
980.
861.
080.
270.
240.
30
75D
ong
Nai
1.51
1.89
1.08
0.66
0.75
0.57
1.91
2.42
1.34
77B
a R
ia-V
ung
Tau
0.81
0.51
1.18
0.17
0.23
0.10
1.39
0.75
2.18
79H
o C
hi M
inh
City
0.44
0.38
0.51
0.42
0.34
0.52
0.50
0.56
0.45
80Lo
ng A
n3.
043.
332.
733.
043.
572.
543.
043.
292.
76
82Ti
en G
iang
5.00
4.78
5.25
4.47
4.97
4.03
5.10
4.75
5.52
83B
en T
re4.
905.
783.
951.
772.
181.
315.
226.
154.
21
84Tr
a V
inh
5.74
6.75
4.58
2.97
3.29
2.61
6.26
7.41
4.95
86V
inh
Long
6.38
7.14
5.52
3.70
4.67
2.75
6.82
7.52
6.01
87D
ong
Thap
5.65
6.86
4.18
1.33
1.88
0.78
6.52
7.78
4.95
89A
n G
iang
3.30
3.53
3.03
4.27
4.64
3.87
2.86
3.05
2.62
91K
ien
Gia
ng1.
941.
592.
410.
630.
670.
572.
391.
903.
05
92C
an T
ho4.
065.
332.
441.
491.
701.
249.
1311
.73
5.18
93H
au G
iang
2.12
2.22
1.99
2.92
3.40
2.35
1.87
1.87
1.86
94So
c Tr
ang
4.67
4.66
4.68
3.58
3.75
3.40
5.12
5.00
5.29
95B
ac L
ieu
8.24
6.46
10.5
57.
675.
999.
778.
436.
6110
.82
96C
a M
au3.
764.
482.
682.
713.
002.
404.
034.
792.
77
152

Tota
lM
ale
Fem
ale
Tota
lM
ale
Fem
ale
Tota
lM
ale
Fem
ale
EN
TIR
E C
OU
NT
RY
2.74
2.93
2.53
1.56
1.64
1.47
3.27
3.50
3.01
Soci
o-ec
onom
ic r
egio
nsR
1N
orth
ern
Mid
land
s and
Mou
ntai
ns1.
962.
151.
761.
301.
531.
082.
092.
271.
89
R2
Red
Riv
er D
elta
2.51
2.54
2.47
1.09
1.15
1.02
3.09
3.13
3.05
R3
Nor
th a
nd S
outh
Cen
tral C
oast
3.23
3.40
3.05
2.45
2.74
2.14
3.51
3.62
3.37
R4
Cen
tral H
ighl
ands
2.82
3.12
2.48
2.66
2.62
2.70
2.89
3.32
2.39
R5
Sout
heas
t0.
941.
000.
870.
570.
490.
651.
511.
761.
21
R6
Mek
ong
Riv
er D
elta
4.57
4.90
4.15
3.02
3.22
2.77
5.07
5.40
4.63
63 p
rovi
nces
/citi
es01
Ha
Noi
0.88
0.90
0.86
0.39
0.37
0.42
1.20
1.26
1.14
02H
a G
iang
1.50
2.16
0.81
1.27
1.51
1.03
1.54
2.28
0.77
04C
ao B
ang
0.38
0.45
0.31
1.19
1.09
1.30
0.22
0.33
0.11
06B
ac K
an0.
710.
820.
591.
531.
821.
280.
570.
670.
45
08Tu
yen
Qua
ng5.
905.
586.
263.
373.
852.
866.
255.
816.
74
10La
o C
ai0.
530.
830.
200.
981.
300.
660.
410.
710.
07
11D
ien
Bie
n 6.
507.
525.
481.
721.
531.
937.
348.
646.
07
12La
i Cha
u1.
952.
291.
582.
522.
502.
561.
852.
251.
44
14So
n La
0.70
0.83
0.57
1.49
1.68
1.24
0.58
0.68
0.48
15Y
en B
ai0.
490.
500.
480.
210.
400.
000.
550.
520.
58
17H
oa B
inh
2.52
2.89
2.12
1.67
2.18
1.15
2.65
3.00
2.28
19Th
ai N
guye
n1.
271.
221.
340.
781.
150.
431.
421.
241.
65
20La
ng S
on1.
952.
141.
722.
212.
531.
911.
892.
071.
68
Uni
t: %
Who
le c
ount
ryU
rban
Rur
al
Tab
le 2
6U
ND
EREM
PLO
YM
ENT
RA
TE IN
TH
E ST
ATU
TOR
Y W
OR
KIN
G A
GE,
201
2
Cod
eA
dmin
istra
tion
153

Tab
le 2
6 (c
ontin
ue)
Tota
lM
ale
Fem
ale
Tota
lM
ale
Fem
ale
Tota
lM
ale
Fem
ale
22Q
uang
Nin
h0.
560.
710.
380.
320.
440.
170.
790.
990.
56
24B
ac G
iang
3.04
3.15
2.92
1.61
1.85
1.36
3.18
3.28
3.07
25Ph
u Th
o0.
891.
200.
550.
650.
630.
670.
961.
350.
51
26V
inh
Phuc
2.03
2.06
2.00
1.85
2.00
1.68
2.08
2.07
2.08
27B
ac N
inh
3.84
4.34
3.34
3.79
4.28
3.26
3.86
4.36
3.37
30H
ai D
uong
4.74
3.77
5.72
2.90
2.59
3.18
5.22
4.06
6.43
31H
ai P
hong
3.25
4.14
2.25
1.21
1.57
0.76
4.92
6.45
3.33
33H
ung
Yen
2.69
3.30
2.05
1.93
1.95
1.92
2.81
3.49
2.08
34Th
ai B
inh
4.99
4.60
5.41
0.65
0.27
1.03
5.41
5.00
5.84
35H
a N
am4.
443.
845.
121.
981.
792.
184.
714.
065.
44
36N
am D
inh
3.03
3.16
2.88
2.62
3.26
2.01
3.12
3.14
3.09
37N
inh
Bin
h1.
942.
511.
301.
001.
150.
722.
182.
961.
40
38Th
anh
Hoa
3.46
3.22
3.72
2.15
1.96
2.38
3.62
3.38
3.88
40N
ghe
An
2.09
2.34
1.82
3.80
4.71
2.77
1.85
2.00
1.69
42H
a Ti
nh3.
212.
893.
553.
573.
623.
523.
132.
733.
55
44Q
uang
Bin
h1.
751.
681.
841.
681.
701.
651.
771.
681.
87
45Q
uang
Tri
2.67
2.55
2.80
2.67
2.46
2.93
2.67
2.60
2.75
46Th
ua T
hien
Hue
2.07
2.86
1.18
1.70
2.59
0.83
2.65
3.22
1.86
48D
a N
ang
1.57
1.93
1.18
1.51
1.77
1.24
1.97
2.70
0.72
49Q
uang
Nam
4.14
5.12
3.04
2.84
3.16
2.52
4.45
5.56
3.18
51Q
uang
Nga
i2.
763.
122.
352.
162.
222.
102.
863.
272.
40
52B
inh
Din
h5.
575.
345.
813.
893.
843.
966.
235.
956.
51
54Ph
u Y
en2.
012.
221.
752.
071.
962.
201.
992.
291.
61
56K
hanh
Hoa
3.10
3.18
3.00
2.31
2.30
2.32
3.98
4.10
3.83
58N
inh
Thua
n9.
4810
.17
8.65
4.03
4.50
3.42
12.5
213
.47
11.4
1
Rur
al
Uni
t: %
Cod
eA
dmin
istra
tion
Who
le c
ount
ryU
rban
154
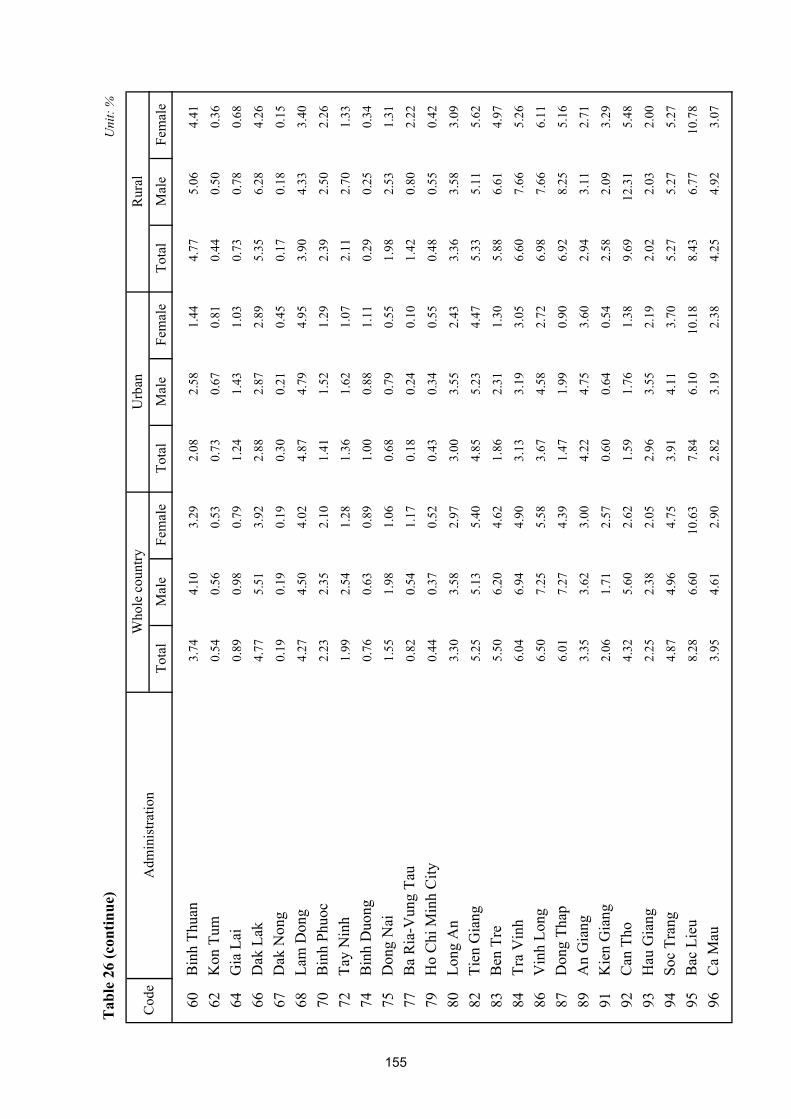
Tab
le 2
6 (c
ontin
ue)
Tota
lM
ale
Fem
ale
Tota
lM
ale
Fem
ale
Tota
lM
ale
Fem
ale
Rur
al
Uni
t: %
Cod
eA
dmin
istra
tion
Who
le c
ount
ryU
rban
60B
inh
Thua
n3.
744.
103.
292.
082.
581.
444.
775.
064.
41
62K
on T
um0.
540.
560.
530.
730.
670.
810.
440.
500.
36
64G
ia L
ai0.
890.
980.
791.
241.
431.
030.
730.
780.
68
66D
ak L
ak4.
775.
513.
922.
882.
872.
895.
356.
284.
26
67D
ak N
ong
0.19
0.19
0.19
0.30
0.21
0.45
0.17
0.18
0.15
68La
m D
ong
4.27
4.50
4.02
4.87
4.79
4.95
3.90
4.33
3.40
70B
inh
Phuo
c2.
232.
352.
101.
411.
521.
292.
392.
502.
26
72Ta
y N
inh
1.99
2.54
1.28
1.36
1.62
1.07
2.11
2.70
1.33
74B
inh
Duo
ng0.
760.
630.
891.
000.
881.
110.
290.
250.
34
75D
ong
Nai
1.55
1.98
1.06
0.68
0.79
0.55
1.98
2.53
1.31
77B
a R
ia-V
ung
Tau
0.82
0.54
1.17
0.18
0.24
0.10
1.42
0.80
2.22
79H
o C
hi M
inh
City
0.44
0.37
0.52
0.43
0.34
0.55
0.48
0.55
0.42
80Lo
ng A
n3.
303.
582.
973.
003.
552.
433.
363.
583.
09
82Ti
en G
iang
5.25
5.13
5.40
4.85
5.23
4.47
5.33
5.11
5.62
83B
en T
re5.
506.
204.
621.
862.
311.
305.
886.
614.
97
84Tr
a V
inh
6.04
6.94
4.90
3.13
3.19
3.05
6.60
7.66
5.26
86V
inh
Long
6.50
7.25
5.58
3.67
4.58
2.72
6.98
7.66
6.11
87D
ong
Thap
6.01
7.27
4.39
1.47
1.99
0.90
6.92
8.25
5.16
89A
n G
iang
3.35
3.62
3.00
4.22
4.75
3.60
2.94
3.11
2.71
91K
ien
Gia
ng2.
061.
712.
570.
600.
640.
542.
582.
093.
29
92C
an T
ho4.
325.
602.
621.
591.
761.
389.
6912
.31
5.48
93H
au G
iang
2.25
2.38
2.05
2.96
3.55
2.19
2.02
2.03
2.00
94So
c Tr
ang
4.87
4.96
4.75
3.91
4.11
3.70
5.27
5.27
5.27
95B
ac L
ieu
8.28
6.60
10.6
37.
846.
1010
.18
8.43
6.77
10.7
8
96C
a M
au3.
954.
612.
902.
823.
192.
384.
254.
923.
07
155
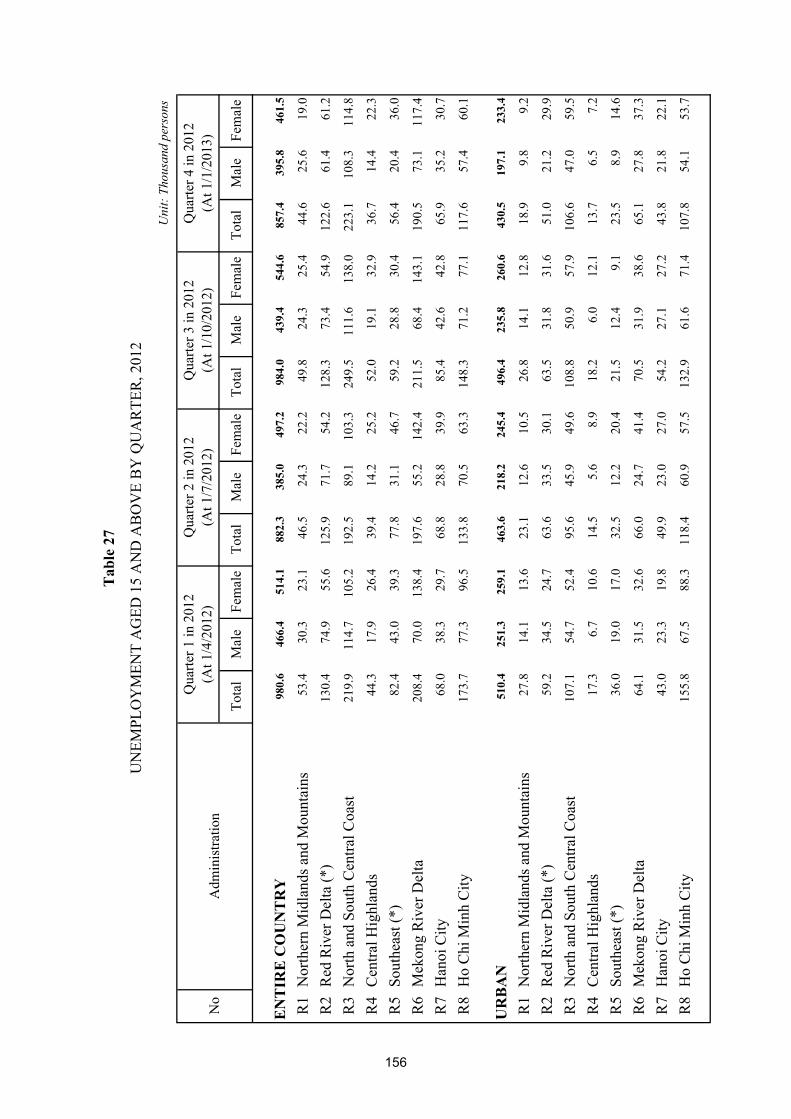
Tota
lM
ale
Fem
ale
Tota
lM
ale
Fem
ale
Tota
lM
ale
Fem
ale
Tota
lM
ale
Fem
ale
EN
TIR
E C
OU
NT
RY
980.
646
6.4
514.
188
2.3
385.
049
7.2
984.
043
9.4
544.
685
7.4
395.
846
1.5
R1
Nor
ther
n M
idla
nds a
nd M
ount
ains
53.4
30.3
23.1
46.5
24.3
22.2
49.8
24.3
25.4
44.6
25.6
19.0
R2
Red
Riv
er D
elta
(*)
130.
474
.955
.612
5.9
71.7
54.2
128.
373
.454
.912
2.6
61.4
61.2
R3
Nor
th a
nd S
outh
Cen
tral C
oast
219.
911
4.7
105.
219
2.5
89.1
103.
324
9.5
111.
613
8.0
223.
110
8.3
114.
8
R4
Cen
tral H
ighl
ands
44.3
17.9
26.4
39.4
14.2
25.2
52.0
19.1
32.9
36.7
14.4
22.3
R5
Sout
heas
t (*)
82.4
43.0
39.3
77.8
31.1
46.7
59.2
28.8
30.4
56.4
20.4
36.0
R6
Mek
ong
Riv
er D
elta
208.
470
.013
8.4
197.
655
.214
2.4
211.
568
.414
3.1
190.
573
.111
7.4
R7
Han
oi C
ity68
.038
.329
.768
.828
.839
.985
.442
.642
.865
.935
.230
.7
R8
Ho
Chi
Min
h C
ity17
3.7
77.3
96.5
133.
870
.563
.314
8.3
71.2
77.1
117.
657
.460
.1
UR
BA
N51
0.4
251.
325
9.1
463.
621
8.2
245.
449
6.4
235.
826
0.6
430.
519
7.1
233.
4
R1
Nor
ther
n M
idla
nds a
nd M
ount
ains
27.8
14.1
13.6
23.1
12.6
10.5
26.8
14.1
12.8
18.9
9.8
9.2
R2
Red
Riv
er D
elta
(*)
59.2
34.5
24.7
63.6
33.5
30.1
63.5
31.8
31.6
51.0
21.2
29.9
R3
Nor
th a
nd S
outh
Cen
tral C
oast
107.
154
.752
.495
.645
.949
.610
8.8
50.9
57.9
106.
647
.059
.5
R4
Cen
tral H
ighl
ands
17.3
6.7
10.6
14.5
5.6
8.9
18.2
6.0
12.1
13.7
6.5
7.2
R5
Sout
heas
t (*)
36.0
19.0
17.0
32.5
12.2
20.4
21.5
12.4
9.1
23.5
8.9
14.6
R6
Mek
ong
Riv
er D
elta
64.1
31.5
32.6
66.0
24.7
41.4
70.5
31.9
38.6
65.1
27.8
37.3
R7
Han
oi C
ity43
.023
.319
.849
.923
.027
.054
.227
.127
.243
.821
.822
.1
R8
Ho
Chi
Min
h C
ity15
5.8
67.5
88.3
118.
460
.957
.513
2.9
61.6
71.4
107.
854
.153
.7
Tab
le 2
7
UN
EMPL
OY
MEN
T A
GED
15
AN
D A
BO
VE
BY
QU
AR
TER
, 201
2
Uni
t: Th
ousa
nd p
erso
ns
No
Adm
inis
tratio
n
Qua
rter 1
in 2
012
(At 1
/4/2
012)
Qua
rter 4
in 2
012
(At 1
/1/2
013)
Qua
rter 2
in 2
012
(At 1
/7/2
012)
Qua
rter 3
in 2
012
(At 1
/10/
2012
)
156

Tab
le 2
7 (c
ontin
ue)
Tota
lM
ale
Fem
ale
Tota
lM
ale
Fem
ale
Tota
lM
ale
Fem
ale
Tota
lM
ale
Fem
ale
RU
RA
L47
0.2
215.
225
5.0
418.
716
6.8
251.
948
7.6
203.
628
4.0
426.
919
8.8
228.
2
R1
Nor
ther
n M
idla
nds a
nd M
ount
ains
25.6
16.1
9.5
23.3
11.7
11.7
22.9
10.3
12.7
25.7
15.9
9.8
R2
Red
Riv
er D
elta
(*)
71.2
40.4
30.8
62.3
38.2
24.1
64.8
41.6
23.2
71.6
40.3
31.3
R3
Nor
th a
nd S
outh
Cen
tral C
oast
112.
860
.052
.896
.943
.253
.714
0.7
60.7
80.1
116.
561
.255
.3
R4
Cen
tral H
ighl
ands
27.0
11.3
15.7
25.0
8.6
16.3
33.9
13.1
20.8
23.0
7.9
15.1
R5
Sout
heas
t (*)
46.3
24.0
22.3
45.2
18.9
26.3
37.8
16.4
21.3
32.9
11.4
21.5
R6
Mek
ong
Riv
er D
elta
144.
338
.510
5.8
131.
630
.510
1.0
141.
036
.410
4.5
125.
545
.480
.1
R7
Han
oi C
ity25
.015
.19.
918
.95.
913
.031
.215
.515
.722
.013
.48.
6
R8
Ho
Chi
Min
h C
ity17
.99.
78.
215
.49.
75.
815
.49.
65.
79.
83.
36.
5
Rem
ark:
(*) R
ed R
iver
Del
ta e
xclu
des H
anoi
City
and
Sou
thea
st e
xclu
des H
o C
hi M
inh
City
.
Uni
t: Th
ousa
nd p
erso
ns
No
Adm
inis
tratio
n
Qua
rter 1
in 2
012
(At 1
/4/2
012)
Qua
rter 2
in 2
012
(At 1
/7/2
012)
Qua
rter 3
in 2
012
(At 1
/10/
2012
)Q
uarte
r 4 in
201
2(A
t 1/1
/201
3)
157

Tota
lM
ale
Fem
ale
Tota
lM
ale
Fem
ale
Tota
lM
ale
Fem
ale
Tota
lM
ale
Fem
ale
EN
TIR
E C
OU
NT
RY
974.
146
4.2
509.
987
7.1
384.
449
2.7
975.
743
6.4
539.
385
2.4
393.
445
9.1
R1
Nor
ther
n M
idla
nds a
nd M
ount
ains
53.1
30.1
23.0
46.4
24.2
22.2
49.4
24.2
25.2
44.5
25.5
19.0
R2
Red
Riv
er D
elta
(*)
130.
474
.955
.612
5.9
71.7
54.2
126.
472
.454
.012
2.3
61.4
60.8
R3
Nor
th a
nd S
outh
Cen
tral C
oast
216.
011
2.9
103.
119
0.5
88.7
101.
824
7.3
110.
913
6.5
220.
510
6.4
114.
1
R4
Cen
tral H
ighl
ands
44.3
17.9
26.4
37.7
14.2
23.5
51.9
18.9
32.9
35.6
14.1
21.6
R5
Sout
heas
t (*)
81.6
43.0
38.6
77.8
31.1
46.7
58.2
28.8
29.4
56.3
20.3
36.0
R6
Mek
ong
Riv
er D
elta
206.
869
.813
7.1
196.
155
.014
1.1
211.
168
.214
2.9
189.
873
.111
6.6
R7
Han
oi C
ity68
.038
.329
.768
.828
.839
.983
.041
.741
.365
.935
.230
.7
R8
Ho
Chi
Min
h C
ity17
3.7
77.3
96.5
133.
870
.563
.314
8.3
71.2
77.1
117.
657
.460
.1
UR
BA
N50
5.7
249.
125
6.6
461.
521
7.6
243.
949
3.5
234.
725
8.8
428.
019
6.5
231.
5
R1
Nor
ther
n M
idla
nds a
nd M
ount
ains
27.5
13.9
13.6
23.1
12.6
10.5
26.6
14.0
12.6
18.8
9.6
9.2
R2
Red
Riv
er D
elta
(*)
59.2
34.5
24.7
63.6
33.5
30.1
63.5
31.8
31.6
50.7
21.2
29.5
R3
Nor
th a
nd S
outh
Cen
tral C
oast
103.
952
.951
.094
.545
.549
.010
7.5
50.2
57.3
106.
547
.059
.4
R4
Cen
tral H
ighl
ands
17.3
6.7
10.6
14.5
5.6
8.9
18.0
5.9
12.1
12.7
6.2
6.5
R5
Sout
heas
t (*)
35.3
19.0
16.3
32.5
12.2
20.4
21.5
12.4
9.1
23.4
8.8
14.6
R6
Mek
ong
Riv
er D
elta
63.5
31.2
32.3
65.0
24.4
40.6
70.2
31.8
38.4
64.3
27.8
36.5
R7
Han
oi C
ity43
.023
.319
.849
.923
.027
.053
.427
.126
.343
.821
.822
.1
R8
Ho
Chi
Min
h C
ity15
5.8
67.5
88.3
118.
460
.957
.513
2.9
61.6
71.4
107.
854
.153
.7
Tab
le 2
8
UN
EMPL
OY
MEN
T IN
TH
E ST
ATU
TOR
Y W
OR
KIN
G A
GE
BY
QU
AR
TER
, 201
2
Uni
t: Th
ousa
nd p
erso
ns
No
Adm
inis
tratio
n
Qua
rter 1
in 2
012
(At 1
/4/2
012)
Qua
rter 4
in 2
012
(At 1
/1/2
013)
Qua
rter 2
in 2
012
(At 1
/7/2
012)
Qua
rter 3
in 2
012
(At 1
/10/
2012
)
158

Tab
le 2
8 (c
ontin
ue)
Tota
lM
ale
Fem
ale
Tota
lM
ale
Fem
ale
Tota
lM
ale
Fem
ale
Tota
lM
ale
Fem
ale
RU
RA
L46
8.5
215.
225
3.3
415.
616
6.8
248.
848
2.1
201.
728
0.5
424.
419
6.9
227.
6
R1
Nor
ther
n M
idla
nds a
nd M
ount
ains
25.6
16.1
9.5
23.3
11.7
11.7
22.8
10.3
12.6
25.7
15.9
9.8
R2
Red
Riv
er D
elta
(*)
71.2
40.4
30.8
62.3
38.2
24.1
62.9
40.5
22.4
71.6
40.3
31.3
R3
Nor
th a
nd S
outh
Cen
tral C
oast
112.
160
.052
.196
.043
.252
.813
9.8
60.7
79.2
114.
059
.354
.7
R4
Cen
tral H
ighl
ands
27.0
11.3
15.7
23.3
8.6
14.6
33.9
13.1
20.8
23.0
7.9
15.1
R5
Sout
heas
t (*)
46.3
24.0
22.3
45.2
18.9
26.3
36.8
16.4
20.4
32.9
11.4
21.5
R6
Mek
ong
Riv
er D
elta
143.
338
.510
4.8
131.
030
.510
0.5
141.
036
.410
4.5
125.
545
.480
.1
R7
Han
oi C
ity25
.015
.19.
918
.95.
913
.029
.614
.714
.922
.013
.48.
6
R8
Ho
Chi
Min
h C
ity17
.99.
78.
215
.49.
75.
815
.49.
65.
79.
83.
36.
5
Rem
ark:
(*) R
ed R
iver
Del
ta e
xclu
des H
anoi
City
and
Sou
thea
st e
xclu
des H
o C
hi M
inh
City
.
Uni
t: Th
ousa
nd p
erso
ns
No
Adm
inis
tratio
n
Qua
rter 1
in 2
012
(At 1
/4/2
012)
Qua
rter 2
in 2
012
(At 1
/7/2
012)
Qua
rter 3
in 2
012
(At 1
/10/
2012
)Q
uarte
r 4 in
201
2(A
t 1/1
/201
3)
159
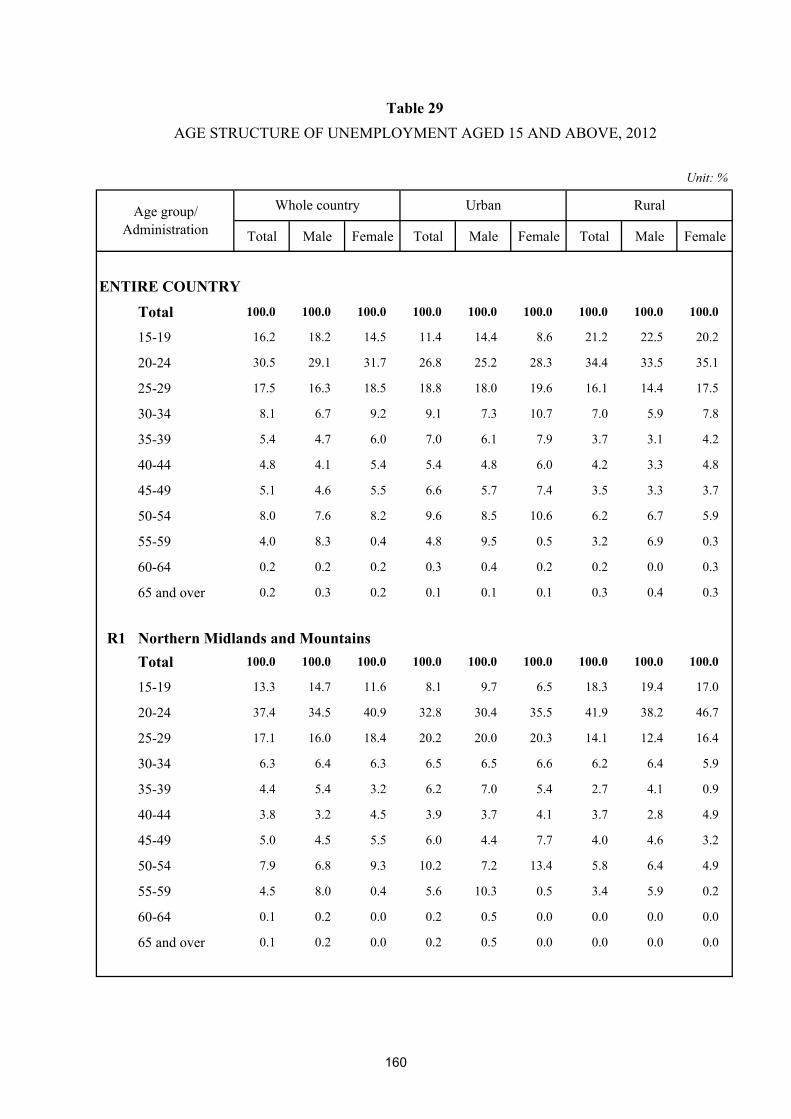
Total Male Female Total Male Female Total Male Female
ENTIRE COUNTRY
Total 100.0 100.0 100.0 100.0 100.0 100.0 100.0 100.0 100.0
15-19 16.2 18.2 14.5 11.4 14.4 8.6 21.2 22.5 20.2
20-24 30.5 29.1 31.7 26.8 25.2 28.3 34.4 33.5 35.1
25-29 17.5 16.3 18.5 18.8 18.0 19.6 16.1 14.4 17.5
30-34 8.1 6.7 9.2 9.1 7.3 10.7 7.0 5.9 7.8
35-39 5.4 4.7 6.0 7.0 6.1 7.9 3.7 3.1 4.2
40-44 4.8 4.1 5.4 5.4 4.8 6.0 4.2 3.3 4.8
45-49 5.1 4.6 5.5 6.6 5.7 7.4 3.5 3.3 3.7
50-54 8.0 7.6 8.2 9.6 8.5 10.6 6.2 6.7 5.9
55-59 4.0 8.3 0.4 4.8 9.5 0.5 3.2 6.9 0.3
60-64 0.2 0.2 0.2 0.3 0.4 0.2 0.2 0.0 0.3
65 and over 0.2 0.3 0.2 0.1 0.1 0.1 0.3 0.4 0.3
R1 Northern Midlands and MountainsTotal 100.0 100.0 100.0 100.0 100.0 100.0 100.0 100.0 100.0
15-19 13.3 14.7 11.6 8.1 9.7 6.5 18.3 19.4 17.0
20-24 37.4 34.5 40.9 32.8 30.4 35.5 41.9 38.2 46.7
25-29 17.1 16.0 18.4 20.2 20.0 20.3 14.1 12.4 16.4
30-34 6.3 6.4 6.3 6.5 6.5 6.6 6.2 6.4 5.9
35-39 4.4 5.4 3.2 6.2 7.0 5.4 2.7 4.1 0.9
40-44 3.8 3.2 4.5 3.9 3.7 4.1 3.7 2.8 4.9
45-49 5.0 4.5 5.5 6.0 4.4 7.7 4.0 4.6 3.2
50-54 7.9 6.8 9.3 10.2 7.2 13.4 5.8 6.4 4.9
55-59 4.5 8.0 0.4 5.6 10.3 0.5 3.4 5.9 0.2
60-64 0.1 0.2 0.0 0.2 0.5 0.0 0.0 0.0 0.0
65 and over 0.1 0.2 0.0 0.2 0.5 0.0 0.0 0.0 0.0
Table 29AGE STRUCTURE OF UNEMPLOYMENT AGED 15 AND ABOVE, 2012
Age group/ Administration
Unit: %
Whole country Urban Rural
160
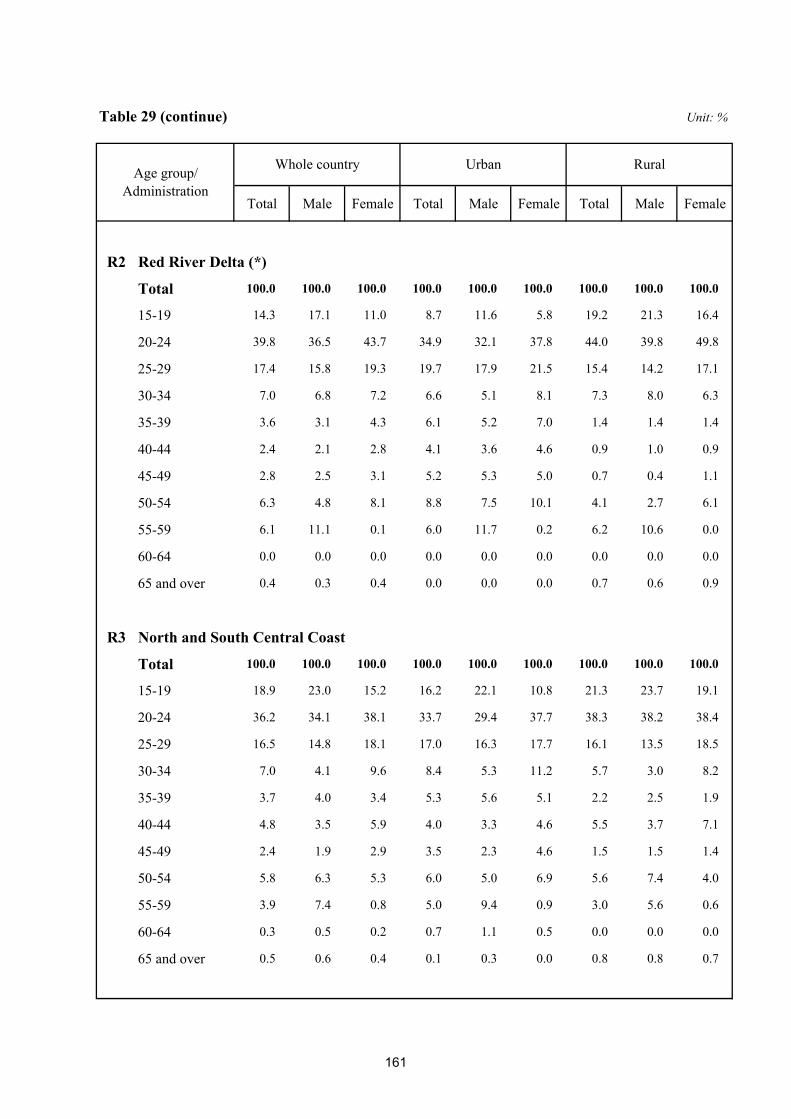
Table 29 (continue)
Total Male Female Total Male Female Total Male Female
R2 Red River Delta (*)
Total 100.0 100.0 100.0 100.0 100.0 100.0 100.0 100.0 100.0
15-19 14.3 17.1 11.0 8.7 11.6 5.8 19.2 21.3 16.4
20-24 39.8 36.5 43.7 34.9 32.1 37.8 44.0 39.8 49.8
25-29 17.4 15.8 19.3 19.7 17.9 21.5 15.4 14.2 17.1
30-34 7.0 6.8 7.2 6.6 5.1 8.1 7.3 8.0 6.3
35-39 3.6 3.1 4.3 6.1 5.2 7.0 1.4 1.4 1.4
40-44 2.4 2.1 2.8 4.1 3.6 4.6 0.9 1.0 0.9
45-49 2.8 2.5 3.1 5.2 5.3 5.0 0.7 0.4 1.1
50-54 6.3 4.8 8.1 8.8 7.5 10.1 4.1 2.7 6.1
55-59 6.1 11.1 0.1 6.0 11.7 0.2 6.2 10.6 0.0
60-64 0.0 0.0 0.0 0.0 0.0 0.0 0.0 0.0 0.0
65 and over 0.4 0.3 0.4 0.0 0.0 0.0 0.7 0.6 0.9
R3 North and South Central Coast
Total 100.0 100.0 100.0 100.0 100.0 100.0 100.0 100.0 100.0
15-19 18.9 23.0 15.2 16.2 22.1 10.8 21.3 23.7 19.1
20-24 36.2 34.1 38.1 33.7 29.4 37.7 38.3 38.2 38.4
25-29 16.5 14.8 18.1 17.0 16.3 17.7 16.1 13.5 18.5
30-34 7.0 4.1 9.6 8.4 5.3 11.2 5.7 3.0 8.2
35-39 3.7 4.0 3.4 5.3 5.6 5.1 2.2 2.5 1.9
40-44 4.8 3.5 5.9 4.0 3.3 4.6 5.5 3.7 7.1
45-49 2.4 1.9 2.9 3.5 2.3 4.6 1.5 1.5 1.4
50-54 5.8 6.3 5.3 6.0 5.0 6.9 5.6 7.4 4.0
55-59 3.9 7.4 0.8 5.0 9.4 0.9 3.0 5.6 0.6
60-64 0.3 0.5 0.2 0.7 1.1 0.5 0.0 0.0 0.0
65 and over 0.5 0.6 0.4 0.1 0.3 0.0 0.8 0.8 0.7
Rural
Unit: %
Whole country UrbanAge group/ Administration
161

Table 29 (continue)
Total Male Female Total Male Female Total Male Female
Rural
Unit: %
Whole country UrbanAge group/ Administration
R4 Central Highlands
Total 100.0 100.0 100.0 100.0 100.0 100.0 100.0 100.0 100.0
15-19 20.3 15.2 23.5 10.1 13.2 8.1 26.4 16.4 32.3
20-24 31.3 26.9 34.1 39.9 32.5 44.6 26.2 23.3 28.0
25-29 20.3 25.0 17.5 16.6 13.7 18.5 22.5 32.1 16.9
30-34 9.2 6.0 11.2 6.2 2.7 8.5 11.0 8.0 12.8
35-39 3.4 2.0 4.2 6.5 5.3 7.3 1.5 0.0 2.4
40-44 1.9 2.0 1.8 5.1 5.2 5.0 0.0 0.0 0.0
45-49 1.6 1.7 1.5 2.7 4.4 1.5 0.9 0.0 1.4
50-54 7.6 12.8 4.3 7.1 10.6 4.9 7.8 14.2 4.0
55-59 4.0 7.5 1.9 4.9 10.2 1.6 3.5 5.9 2.1
60-64 0.3 0.8 0.0 0.8 2.1 0.0 0.0 0.0 0.0
65 and over 0.0 0.0 0.0 0.0 0.0 0.0 0.0 0.0 0.0
R5 Southeast (*)
Total 100.0 100.0 100.0 100.0 100.0 100.0 100.0 100.0 100.0
15-19 23.2 28.4 18.9 20.9 19.5 22.1 24.9 35.2 16.8
20-24 29.2 25.0 32.7 28.9 24.3 33.0 29.4 25.5 32.5
25-29 18.5 12.8 23.2 19.9 16.2 23.1 17.5 10.2 23.2
30-34 8.1 8.4 7.8 8.6 9.2 8.1 7.7 7.8 7.6
35-39 4.1 3.5 4.6 4.0 6.0 2.3 4.1 1.5 6.2
40-44 3.3 3.3 3.3 2.9 2.0 3.7 3.6 4.2 3.1
45-49 5.1 6.3 4.1 6.9 9.6 4.5 3.8 3.8 3.8
50-54 4.1 3.8 4.4 2.9 3.8 2.2 4.9 3.8 5.8
55-59 3.8 8.5 0.0 4.3 9.2 0.0 3.5 8.0 0.0
60-64 0.6 0.1 1.0 0.6 0.2 1.0 0.6 0.0 1.0
65 and over 0.0 0.0 0.1 0.1 0.0 0.2 0.0 0.0 0.0
162
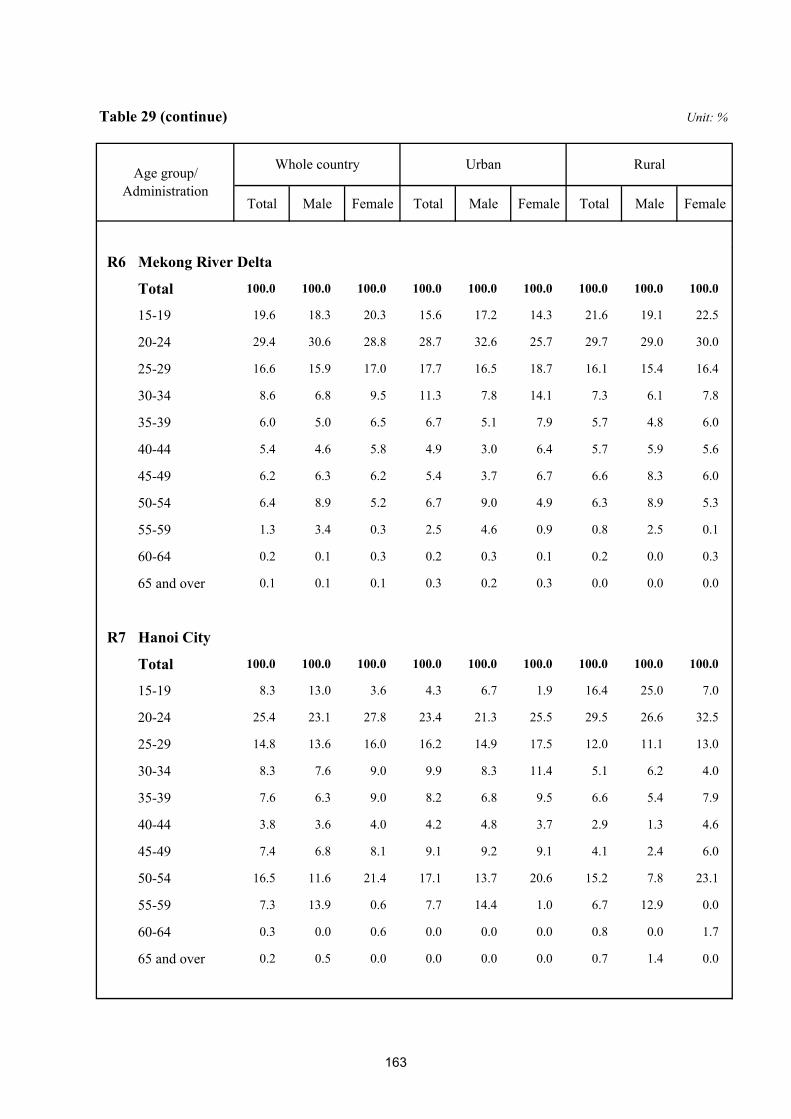
Table 29 (continue)
Total Male Female Total Male Female Total Male Female
Rural
Unit: %
Whole country UrbanAge group/ Administration
R6 Mekong River Delta
Total 100.0 100.0 100.0 100.0 100.0 100.0 100.0 100.0 100.0
15-19 19.6 18.3 20.3 15.6 17.2 14.3 21.6 19.1 22.5
20-24 29.4 30.6 28.8 28.7 32.6 25.7 29.7 29.0 30.0
25-29 16.6 15.9 17.0 17.7 16.5 18.7 16.1 15.4 16.4
30-34 8.6 6.8 9.5 11.3 7.8 14.1 7.3 6.1 7.8
35-39 6.0 5.0 6.5 6.7 5.1 7.9 5.7 4.8 6.0
40-44 5.4 4.6 5.8 4.9 3.0 6.4 5.7 5.9 5.6
45-49 6.2 6.3 6.2 5.4 3.7 6.7 6.6 8.3 6.0
50-54 6.4 8.9 5.2 6.7 9.0 4.9 6.3 8.9 5.3
55-59 1.3 3.4 0.3 2.5 4.6 0.9 0.8 2.5 0.1
60-64 0.2 0.1 0.3 0.2 0.3 0.1 0.2 0.0 0.3
65 and over 0.1 0.1 0.1 0.3 0.2 0.3 0.0 0.0 0.0
R7 Hanoi City
Total 100.0 100.0 100.0 100.0 100.0 100.0 100.0 100.0 100.0
15-19 8.3 13.0 3.6 4.3 6.7 1.9 16.4 25.0 7.0
20-24 25.4 23.1 27.8 23.4 21.3 25.5 29.5 26.6 32.5
25-29 14.8 13.6 16.0 16.2 14.9 17.5 12.0 11.1 13.0
30-34 8.3 7.6 9.0 9.9 8.3 11.4 5.1 6.2 4.0
35-39 7.6 6.3 9.0 8.2 6.8 9.5 6.6 5.4 7.9
40-44 3.8 3.6 4.0 4.2 4.8 3.7 2.9 1.3 4.6
45-49 7.4 6.8 8.1 9.1 9.2 9.1 4.1 2.4 6.0
50-54 16.5 11.6 21.4 17.1 13.7 20.6 15.2 7.8 23.1
55-59 7.3 13.9 0.6 7.7 14.4 1.0 6.7 12.9 0.0
60-64 0.3 0.0 0.6 0.0 0.0 0.0 0.8 0.0 1.7
65 and over 0.2 0.5 0.0 0.0 0.0 0.0 0.7 1.4 0.0
163

Table 29 (continue)
Total Male Female Total Male Female Total Male Female
Rural
Unit: %
Whole country UrbanAge group/ Administration
R8 Ho Chi Minh City
Total 100.0 100.0 100.0 100.0 100.0 100.0 100.0 100.0 100.0
15-19 8.9 11.8 6.3 7.8 11.1 4.9 18.6 16.9 20.8
20-24 15.8 15.8 15.7 14.7 14.9 14.5 25.5 22.8 28.9
25-29 20.6 20.7 20.5 21.3 21.9 20.8 14.4 11.9 17.5
30-34 10.1 9.4 10.7 10.3 9.5 11.1 7.5 8.4 6.5
35-39 9.4 7.2 11.3 9.5 7.0 11.7 8.1 8.9 7.2
40-44 8.6 7.9 9.3 8.8 8.1 9.5 6.8 5.7 8.1
45-49 9.7 8.2 11.1 10.1 7.9 11.9 6.7 10.2 2.5
50-54 12.8 10.1 15.1 13.4 10.7 15.8 7.3 6.2 8.6
55-59 4.2 8.9 0.0 4.2 8.9 0.0 4.9 9.0 0.0
60-64 0.0 0.0 0.0 0.0 0.0 0.0 0.0 0.0 0.0
65 and over 0.0 0.0 0.0 0.0 0.0 0.0 0.0 0.0 0.0
Remark: (*) Red River Delta excludes Hanoi City and Southeast excludes Ho Chi Minh City.
164
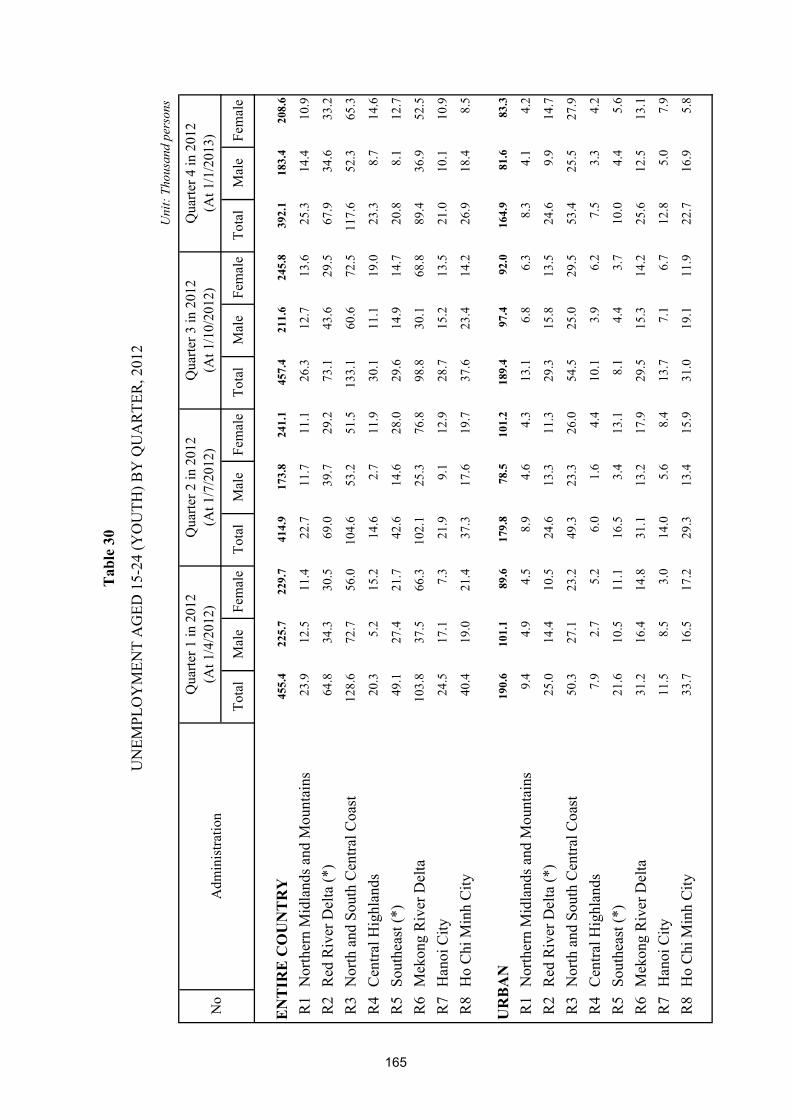
Tota
lM
ale
Fem
ale
Tota
lM
ale
Fem
ale
Tota
lM
ale
Fem
ale
Tota
lM
ale
Fem
ale
EN
TIR
E C
OU
NT
RY
455.
422
5.7
229.
741
4.9
173.
824
1.1
457.
421
1.6
245.
839
2.1
183.
420
8.6
R1
Nor
ther
n M
idla
nds a
nd M
ount
ains
23.9
12.5
11.4
22.7
11.7
11.1
26.3
12.7
13.6
25.3
14.4
10.9
R2
Red
Riv
er D
elta
(*)
64.8
34.3
30.5
69.0
39.7
29.2
73.1
43.6
29.5
67.9
34.6
33.2
R3
Nor
th a
nd S
outh
Cen
tral C
oast
128.
672
.756
.010
4.6
53.2
51.5
133.
160
.672
.511
7.6
52.3
65.3
R4
Cen
tral H
ighl
ands
20.3
5.2
15.2
14.6
2.7
11.9
30.1
11.1
19.0
23.3
8.7
14.6
R5
Sout
heas
t (*)
49.1
27.4
21.7
42.6
14.6
28.0
29.6
14.9
14.7
20.8
8.1
12.7
R6
Mek
ong
Riv
er D
elta
103.
837
.566
.310
2.1
25.3
76.8
98.8
30.1
68.8
89.4
36.9
52.5
R7
Han
oi C
ity24
.517
.17.
321
.99.
112
.928
.715
.213
.521
.010
.110
.9
R8
Ho
Chi
Min
h C
ity40
.419
.021
.437
.317
.619
.737
.623
.414
.226
.918
.48.
5
UR
BA
N19
0.6
101.
189
.617
9.8
78.5
101.
218
9.4
97.4
92.0
164.
981
.683
.3
R1
Nor
ther
n M
idla
nds a
nd M
ount
ains
9.4
4.9
4.5
8.9
4.6
4.3
13.1
6.8
6.3
8.3
4.1
4.2
R2
Red
Riv
er D
elta
(*)
25.0
14.4
10.5
24.6
13.3
11.3
29.3
15.8
13.5
24.6
9.9
14.7
R3
Nor
th a
nd S
outh
Cen
tral C
oast
50.3
27.1
23.2
49.3
23.3
26.0
54.5
25.0
29.5
53.4
25.5
27.9
R4
Cen
tral H
ighl
ands
7.9
2.7
5.2
6.0
1.6
4.4
10.1
3.9
6.2
7.5
3.3
4.2
R5
Sout
heas
t (*)
21.6
10.5
11.1
16.5
3.4
13.1
8.1
4.4
3.7
10.0
4.4
5.6
R6
Mek
ong
Riv
er D
elta
31.2
16.4
14.8
31.1
13.2
17.9
29.5
15.3
14.2
25.6
12.5
13.1
R7
Han
oi C
ity11
.58.
53.
014
.05.
68.
413
.77.
16.
712
.85.
07.
9
R8
Ho
Chi
Min
h C
ity33
.716
.517
.229
.313
.415
.931
.019
.111
.922
.716
.95.
8
Tab
le 3
0
UN
EMPL
OY
MEN
T A
GED
15-
24 (Y
OU
TH) B
Y Q
UA
RTE
R, 2
012
Uni
t: Th
ousa
nd p
erso
ns
No
Adm
inis
tratio
n
Qua
rter 1
in 2
012
(At 1
/4/2
012)
Qua
rter 4
in 2
012
(At 1
/1/2
013)
Qua
rter 2
in 2
012
(At 1
/7/2
012)
Qua
rter 3
in 2
012
(At 1
/10/
2012
)
165

Tab
le 3
0 (c
ontin
ue)
Tota
lM
ale
Fem
ale
Tota
lM
ale
Fem
ale
Tota
lM
ale
Fem
ale
Tota
lM
ale
Fem
ale
RU
RA
L26
4.7
124.
614
0.1
235.
195
.313
9.8
268.
011
4.3
153.
822
7.2
101.
812
5.3
R1
Nor
ther
n M
idla
nds a
nd M
ount
ains
14.5
7.6
6.9
13.9
7.1
6.8
13.2
5.9
7.3
17.0
10.3
6.7
R2
Red
Riv
er D
elta
(*)
39.8
19.9
19.9
44.3
26.4
17.9
43.8
27.8
16.0
43.2
24.7
18.5
R3
Nor
th a
nd S
outh
Cen
tral C
oast
78.3
45.6
32.7
55.3
29.9
25.5
78.6
35.7
42.9
64.2
26.8
37.4
R4
Cen
tral H
ighl
ands
12.4
2.5
9.9
8.6
1.1
7.5
20.0
7.2
12.8
15.8
5.4
10.4
R5
Sout
heas
t (*)
27.5
16.9
10.6
26.1
11.2
15.0
21.6
10.5
11.1
10.8
3.7
7.1
R6
Mek
ong
Riv
er D
elta
72.6
21.1
51.5
71.0
12.1
58.9
69.4
14.8
54.6
63.8
24.4
39.4
R7
Han
oi C
ity13
.08.
64.
47.
93.
44.
515
.08.
26.
88.
25.
23.
0
R8
Ho
Chi
Min
h C
ity6.
72.
64.
28.
04.
23.
86.
64.
32.
34.
21.
42.
7
Rem
ark:
(*) R
ed R
iver
Del
ta e
xclu
des H
anoi
City
and
Sou
thea
st e
xclu
des H
o C
hi M
inh
City
.
Uni
t: Th
ousa
nd p
erso
ns
No
Adm
inis
tratio
n
Qua
rter 1
in 2
012
(At 1
/4/2
012)
Qua
rter 2
in 2
012
(At 1
/7/2
012)
Qua
rter 3
in 2
012
(At 1
/10/
2012
)Q
uarte
r 4 in
201
2(A
t 1/1
/201
3)
166

Tota
lM
ale
Fem
ale
Tota
lM
ale
Fem
ale
Tota
lM
ale
Fem
ale
EN
TIR
E C
OU
NT
RY
1.77
1.56
1.99
2.98
2.74
3.24
1.24
1.04
1.45
Soci
o-ec
onom
ic r
egio
nsR
1N
orth
ern
Mid
land
s and
Mou
ntai
ns0.
680.
740.
622.
052.
211.
910.
410.
460.
36
R2
Red
Riv
er D
elta
1.68
1.79
1.57
3.23
3.13
3.33
1.08
1.25
0.92
R3
Nor
th a
nd S
outh
Cen
tral C
oast
1.96
1.87
2.06
3.58
3.38
3.78
1.40
1.34
1.46
R4
Cen
tral H
ighl
ands
1.37
1.00
1.77
1.78
1.38
2.19
1.20
0.85
1.59
R5
Sout
heas
t2.
482.
192.
793.
082.
733.
471.
601.
411.
80
R6
Mek
ong
Riv
er D
elta
1.94
1.17
2.86
2.64
2.22
3.09
1.72
0.86
2.78
63 p
rovi
nces
/citi
es01
Ha
Noi
1.93
1.93
1.92
3.27
3.17
3.37
1.06
1.11
1.02
02H
a G
iang
0.46
0.57
0.36
1.88
2.37
1.41
0.20
0.24
0.16
04C
ao B
ang
0.62
0.71
0.53
2.21
2.47
1.95
0.30
0.36
0.25
06B
ac K
an0.
490.
480.
502.
432.
902.
050.
140.
110.
18
08Tu
yen
Qua
ng1.
301.
191.
403.
573.
653.
480.
980.
851.
11
10La
o C
ai0.
580.
650.
501.
811.
841.
780.
260.
360.
14
11D
ien
Bie
n 0.
580.
650.
521.
701.
891.
500.
380.
410.
36
12La
i Cha
u0.
230.
270.
201.
151.
011.
330.
070.
120.
03
14So
n La
0.37
0.30
0.44
1.76
1.54
2.02
0.14
0.07
0.21
15Y
en B
ai0.
480.
420.
542.
022.
032.
000.
140.
080.
21
17H
oa B
inh
0.40
0.40
0.41
1.56
1.09
1.99
0.23
0.29
0.16
19Th
ai N
guye
n1.
281.
261.
302.
091.
902.
251.
031.
080.
98
20La
ng S
on0.
891.
030.
732.
193.
371.
140.
610.
580.
63
Uni
t: %
Who
le c
ount
ryU
rban
Rur
al
Tab
le 3
1U
NEM
PLO
YM
ENT
RA
TE A
GED
15
AN
D A
BO
VE,
201
2
Cod
eA
dmin
istra
tion
167

Tab
le 3
1 (c
ontin
ue)
Tota
lM
ale
Fem
ale
Tota
lM
ale
Fem
ale
Tota
lM
ale
Fem
ale
22Q
uang
Nin
h1.
321.
271.
382.
062.
012.
130.
610.
500.
72
24B
ac G
iang
0.64
0.96
0.34
4.11
4.90
3.32
0.30
0.55
0.06
25Ph
u Th
o0.
700.
730.
671.
231.
331.
160.
540.
580.
50
26V
inh
Phuc
1.04
0.85
1.23
2.48
2.50
2.45
0.63
0.35
0.91
27B
ac N
inh
1.54
1.62
1.47
2.27
2.23
2.31
1.30
1.40
1.21
30H
ai D
uong
0.95
1.25
0.67
1.99
1.90
2.07
0.68
1.10
0.29
31H
ai P
hong
3.51
3.70
3.31
4.47
4.03
4.97
2.78
3.42
2.20
33H
ung
Yen
1.41
1.53
1.31
3.08
3.68
2.54
1.19
1.25
1.13
34Th
ai B
inh
1.33
1.65
1.03
6.82
7.44
6.24
0.79
1.09
0.52
35H
a N
am1.
321.
161.
494.
394.
484.
311.
000.
801.
19
36N
am D
inh
1.13
1.45
0.81
1.92
1.71
2.10
0.97
1.40
0.52
37N
inh
Bin
h1.
671.
901.
454.
394.
064.
941.
011.
190.
86
38Th
anh
Hoa
1.85
1.56
2.13
5.56
5.68
5.45
1.40
1.02
1.75
40N
ghe
An
0.93
1.17
0.67
2.52
2.89
2.13
0.70
0.92
0.47
42H
a Ti
nh1.
081.
101.
062.
142.
132.
150.
880.
900.
86
44Q
uang
Bin
h1.
281.
371.
192.
892.
992.
781.
011.
090.
93
45Q
uang
Tri
1.80
2.07
1.52
2.39
2.12
2.68
1.55
2.04
1.06
46Th
ua T
hien
Hue
2.12
2.47
1.77
2.63
3.01
2.29
1.34
1.76
0.78
48D
a N
ang
4.92
4.66
5.18
5.27
5.05
5.48
2.78
2.78
2.78
49Q
uang
Nam
2.57
3.15
1.99
3.83
3.79
3.85
2.27
3.01
1.53
51Q
uang
Nga
i1.
331.
071.
592.
211.
832.
581.
180.
941.
42
52B
inh
Din
h2.
042.
271.
823.
343.
143.
541.
551.
931.
20
54Ph
u Y
en0.
990.
701.
312.
732.
512.
970.
490.
210.
82
56K
hanh
Hoa
3.24
2.16
4.44
3.22
2.38
4.09
3.26
1.94
4.87
58N
inh
Thua
n1.
641.
581.
702.
382.
512.
221.
231.
051.
43
Rur
al
Uni
t: %
Cod
eA
dmin
istra
tion
Who
le c
ount
ryU
rban
168

Tab
le 3
1 (c
ontin
ue)
Tota
lM
ale
Fem
ale
Tota
lM
ale
Fem
ale
Tota
lM
ale
Fem
ale
Rur
al
Uni
t: %
Cod
eA
dmin
istra
tion
Who
le c
ount
ryU
rban
60B
inh
Thua
n3.
732.
654.
934.
503.
445.
773.
252.
144.
44
62K
on T
um0.
990.
721.
312.
351.
693.
040.
220.
200.
24
64G
ia L
ai0.
670.
530.
821.
150.
721.
590.
460.
450.
48
66D
ak L
ak2.
621.
823.
472.
531.
743.
332.
641.
843.
52
67D
ak N
ong
0.17
0.08
0.28
0.59
0.34
0.99
0.10
0.03
0.18
68La
m D
ong
1.02
0.87
1.18
1.68
1.77
1.59
0.62
0.35
0.91
70B
inh
Phuo
c2.
091.
592.
623.
252.
583.
941.
871.
412.
36
72Ta
y N
inh
1.14
0.83
1.51
1.13
1.33
0.92
1.15
0.75
1.62
74B
inh
Duo
ng1.
291.
061.
521.
511.
341.
670.
870.
641.
17
75D
ong
Nai
1.58
1.69
1.46
1.35
1.64
1.05
1.69
1.71
1.66
77B
a R
ia-V
ung
Tau
1.89
1.20
2.73
2.44
1.86
3.11
1.40
0.59
2.37
79H
o C
hi M
inh
City
3.51
3.13
3.93
3.78
3.25
4.41
2.13
2.45
1.84
80Lo
ng A
n1.
571.
142.
032.
402.
072.
721.
400.
961.
87
82Ti
en G
iang
1.07
0.51
1.68
2.23
2.30
2.17
0.85
0.22
1.58
83B
en T
re1.
321.
351.
292.
031.
872.
221.
251.
301.
19
84Tr
a V
inh
2.16
1.56
2.84
2.70
2.04
3.45
2.06
1.47
2.72
86V
inh
Long
2.15
1.04
3.36
3.49
3.16
3.81
1.93
0.71
3.28
87D
ong
Thap
1.85
0.89
2.98
1.95
1.97
1.92
1.83
0.69
3.21
89A
n G
iang
2.01
1.15
2.99
3.63
2.89
4.43
1.23
0.37
2.26
91K
ien
Gia
ng1.
950.
743.
551.
641.
202.
222.
060.
574.
01
92C
an T
ho2.
801.
853.
982.
232.
012.
483.
891.
567.
24
93H
au G
iang
2.04
1.33
2.99
2.71
2.35
3.14
1.83
1.02
2.94
94So
c Tr
ang
2.75
1.65
4.09
2.99
2.58
3.43
2.64
1.31
4.40
95B
ac L
ieu
3.17
2.28
4.30
3.74
2.68
5.04
2.98
2.15
4.05
96C
a M
au1.
340.
762.
212.
492.
003.
011.
050.
501.
95
169

Tota
lM
ale
Fem
ale
Tota
lM
ale
Fem
ale
Tota
lM
ale
Fem
ale
EN
TIR
E C
OU
NT
RY
1.96
1.67
2.30
3.21
2.87
3.59
1.39
1.13
1.71
Soci
o-ec
onom
ic r
egio
nsR
1N
orth
ern
Mid
land
s and
Mou
ntai
ns0.
750.
780.
722.
252.
332.
170.
460.
490.
42
R2
Red
Riv
er D
elta
1.91
1.94
1.88
3.49
3.28
3.72
1.25
1.36
1.12
R3
Nor
th a
nd S
outh
Cen
tral C
oast
2.21
2.02
2.43
3.91
3.58
4.27
1.60
1.46
1.76
R4
Cen
tral H
ighl
ands
1.47
1.05
1.95
1.89
1.42
2.40
1.30
0.91
1.76
R5
Sout
heas
t2.
642.
293.
043.
242.
833.
711.
731.
492.
00
R6
Mek
ong
Riv
er D
elta
2.17
1.27
3.33
2.87
2.35
3.48
1.94
0.94
3.28
63 p
rovi
nces
/citi
es01
Ha
Noi
2.10
2.02
2.18
3.47
3.29
3.68
1.17
1.16
1.18
02H
a G
iang
0.51
0.60
0.41
2.01
2.42
1.59
0.22
0.26
0.18
04C
ao B
ang
0.71
0.77
0.64
2.50
2.66
2.33
0.35
0.39
0.30
06B
ac K
an0.
520.
510.
532.
623.
012.
270.
140.
120.
17
08Tu
yen
Qua
ng1.
441.
281.
623.
963.
934.
001.
080.
911.
28
10La
o C
ai0.
610.
670.
551.
871.
831.
920.
270.
380.
16
11D
ien
Bie
n 0.
620.
680.
571.
801.
961.
630.
410.
440.
39
12La
i Cha
u0.
250.
280.
221.
241.
051.
480.
080.
130.
03
14So
n La
0.40
0.31
0.48
1.92
1.64
2.28
0.15
0.07
0.23
15Y
en B
ai0.
530.
440.
622.
252.
182.
330.
150.
080.
24
17H
oa B
inh
0.44
0.41
0.47
1.64
1.07
2.20
0.25
0.31
0.19
19Th
ai N
guye
n1.
421.
331.
522.
322.
042.
581.
151.
141.
16
20La
ng S
on0.
971.
090.
842.
403.
541.
290.
670.
620.
72
Tab
le 3
2U
NEM
PLO
YM
ENT
RA
TE IN
TH
E ST
ATU
TOR
Y W
OR
KIN
G A
GE,
201
2
Cod
eA
dmin
istra
tion
Uni
t: %
Who
le c
ount
ryU
rban
Rur
al
170

Tab
le 3
2 (c
ontin
ue)
Tota
lM
ale
Fem
ale
Tota
lM
ale
Fem
ale
Tota
lM
ale
Fem
ale
22Q
uang
Nin
h1.
441.
341.
562.
172.
072.
300.
690.
540.
85
24B
ac G
iang
0.72
1.02
0.40
4.42
5.14
3.66
0.34
0.60
0.07
25Ph
u Th
o0.
800.
800.
811.
411.
441.
380.
630.
630.
62
26V
inh
Phuc
1.16
0.91
1.42
2.71
2.65
2.79
0.71
0.38
1.06
27B
ac N
inh
1.74
1.73
1.75
2.52
2.37
2.68
1.47
1.50
1.45
30H
ai D
uong
1.09
1.37
0.80
2.22
2.05
2.38
0.79
1.20
0.35
31H
ai P
hong
3.97
3.95
4.00
4.81
4.18
5.62
3.28
3.74
2.79
33H
ung
Yen
1.62
1.67
1.56
3.38
3.88
2.90
1.35
1.35
1.34
34Th
ai B
inh
1.57
1.82
1.29
7.61
8.01
7.22
0.94
1.20
0.66
35H
a N
am1.
551.
261.
874.
864.
754.
971.
180.
871.
51
36N
am D
inh
1.38
1.68
1.06
2.22
1.90
2.51
1.20
1.64
0.70
37N
inh
Bin
h1.
982.
101.
854.
854.
365.
721.
231.
341.
12
38Th
anh
Hoa
2.11
1.69
2.55
5.97
5.97
5.97
1.61
1.12
2.12
40N
ghe
An
1.04
1.26
0.79
2.75
3.07
2.38
0.80
1.00
0.56
42H
a Ti
nh1.
341.
301.
372.
492.
392.
611.
101.
071.
13
44Q
uang
Bin
h1.
451.
481.
423.
153.
173.
131.
151.
191.
11
45Q
uang
Tri
2.05
2.24
1.82
2.54
2.15
2.99
1.83
2.28
1.32
46Th
ua T
hien
Hue
2.43
2.72
2.11
3.00
3.27
2.73
1.53
1.98
0.89
48D
a N
ang
5.31
4.85
5.79
5.62
5.19
6.05
3.23
3.11
3.43
49Q
uang
Nam
2.94
3.39
2.44
4.29
4.06
4.53
2.62
3.24
1.90
51Q
uang
Nga
i1.
481.
091.
912.
542.
003.
111.
290.
931.
70
52B
inh
Din
h2.
352.
492.
203.
703.
364.
061.
812.
131.
48
54Ph
u Y
en1.
080.
721.
512.
952.
703.
230.
530.
180.
98
56K
hanh
Hoa
3.49
2.26
4.92
3.43
2.43
4.51
3.55
2.08
5.42
58N
inh
Thua
n1.
811.
691.
942.
582.
632.
501.
371.
141.
64
Rur
al
Uni
t: %
Cod
eA
dmin
istra
tion
Who
le c
ount
ryU
rban
171

Tab
le 3
2 (c
ontin
ue)
Tota
lM
ale
Fem
ale
Tota
lM
ale
Fem
ale
Tota
lM
ale
Fem
ale
Rur
al
Uni
t: %
Cod
eA
dmin
istra
tion
Who
le c
ount
ryU
rban
60B
inh
Thua
n3.
992.
805.
414.
833.
656.
313.
462.
264.
87
62K
on T
um1.
080.
761.
472.
531.
763.
400.
240.
210.
27
64G
ia L
ai0.
730.
560.
931.
210.
711.
740.
510.
490.
54
66D
ak L
ak2.
791.
923.
792.
661.
773.
592.
831.
963.
85
67D
ak N
ong
0.18
0.09
0.31
0.63
0.35
1.07
0.11
0.03
0.19
68La
m D
ong
1.12
0.92
1.33
1.83
1.87
1.78
0.68
0.38
1.04
70B
inh
Phuo
c2.
281.
702.
943.
432.
674.
252.
061.
522.
67
72Ta
y N
inh
1.23
0.89
1.67
1.23
1.38
1.05
1.23
0.80
1.79
74B
inh
Duo
ng1.
341.
101.
591.
551.
371.
710.
930.
671.
30
75D
ong
Nai
1.70
1.78
1.61
1.42
1.71
1.10
1.84
1.82
1.87
77B
a R
ia-V
ung
Tau
2.03
1.26
3.00
2.55
1.94
3.30
1.54
0.63
2.70
79H
o C
hi M
inh
City
3.70
3.25
4.24
4.00
3.38
4.76
2.24
2.52
1.97
80Lo
ng A
n1.
751.
232.
342.
512.
192.
831.
591.
052.
23
82Ti
en G
iang
1.22
0.56
2.02
2.46
2.44
2.48
0.97
0.24
1.92
83B
en T
re1.
551.
481.
632.
282.
012.
621.
471.
421.
53
84Tr
a V
inh
2.45
1.70
3.38
3.00
2.18
4.01
2.35
1.61
3.26
86V
inh
Long
2.42
1.12
3.98
3.75
3.29
4.22
2.19
0.78
3.93
87D
ong
Thap
2.02
0.94
3.38
2.11
2.01
2.22
2.01
0.74
3.63
89A
n G
iang
2.24
1.25
3.47
4.02
3.06
5.12
1.39
0.40
2.63
91K
ien
Gia
ng2.
180.
804.
091.
791.
282.
512.
320.
634.
64
92C
an T
ho3.
011.
974.
372.
422.
152.
754.
161.
657.
93
93H
au G
iang
2.27
1.43
3.47
2.90
2.49
3.43
2.06
1.11
3.49
94So
c Tr
ang
3.06
1.80
4.71
3.29
2.75
3.88
2.96
1.45
5.12
95B
ac L
ieu
3.43
2.40
4.84
3.96
2.79
5.48
3.25
2.26
4.62
96C
a M
au1.
500.
822.
572.
742.
123.
441.
180.
542.
28
172

Total Male Female Total Male Female Total Male Female
ENTIRE COUNTRY
Total 1.77 1.56 1.99 2.98 2.74 3.24 1.24 1.04 1.45
15-19 5.54 4.96 6.30 10.51 11.61 9.20 4.38 3.50 5.58
20-24 5.44 4.36 6.71 8.70 7.90 9.47 4.17 3.14 5.46
25-29 2.53 2.06 3.03 4.08 3.67 4.49 1.72 1.26 2.24
30-34 1.18 0.88 1.49 2.06 1.57 2.55 0.75 0.54 0.96
35-39 0.76 0.59 0.95 1.55 1.23 1.90 0.38 0.27 0.49
40-44 0.69 0.52 0.87 1.21 0.97 1.47 0.43 0.29 0.58
45-49 0.76 0.60 0.92 1.61 1.25 2.01 0.37 0.30 0.45
50-54 1.43 1.27 1.60 2.78 2.26 3.32 0.81 0.77 0.84
55-59 1.06 1.92 0.13 2.34 3.79 0.33 0.57 1.08 0.07
60-64 0.11 0.09 0.12 0.29 0.37 0.20 0.05 0.00 0.10
65 and over 0.10 0.12 0.09 0.12 0.15 0.08 0.10 0.12 0.09
R1 Northern Midlands and MountainsTotal 0.68 0.74 0.62 2.05 2.21 1.91 0.41 0.46 0.36
15-19 1.29 1.43 1.12 7.42 7.93 6.71 0.95 1.04 0.84
20-24 2.17 2.02 2.35 8.88 8.70 9.05 1.38 1.29 1.48
25-29 0.88 0.89 0.88 3.32 3.61 3.05 0.44 0.42 0.45
30-34 0.36 0.39 0.33 1.07 1.18 0.97 0.21 0.24 0.18
35-39 0.24 0.33 0.16 0.94 1.16 0.74 0.09 0.15 0.03
40-44 0.24 0.23 0.25 0.64 0.68 0.60 0.15 0.13 0.16
45-49 0.30 0.30 0.31 0.93 0.74 1.11 0.15 0.20 0.11
50-54 0.57 0.55 0.59 1.62 1.21 2.03 0.27 0.36 0.19
55-59 0.53 1.05 0.04 1.72 3.00 0.18 0.25 0.51 0.01
60-64 0.03 0.06 0.00 0.15 0.32 0.00 0.00 0.00 0.00
65 and over 0.02 0.05 0.00 0.17 0.38 0.00 0.00 0.00 0.00
Urban Rural
Table 33
Age group/ Administration
UNEMPLOYMENT RATE AGED 15 AND ABOVE BY AGE GROUP, 2012
Unit: %
Whole country
173

Table 33 (continue)
Total Male Female Total Male Female Total Male Female
R2 Red River Delta (*)
Total 1.57 1.73 1.42 3.20 3.10 3.29 1.09 1.30 0.89
15-19 6.83 7.90 5.46 15.01 17.81 11.37 5.62 6.43 4.59
20-24 7.40 7.04 7.79 13.63 12.46 14.83 5.61 5.57 5.67
25-29 2.54 2.52 2.56 4.66 4.14 5.20 1.68 1.84 1.54
30-34 1.07 1.20 0.96 1.78 1.39 2.17 0.82 1.13 0.55
35-39 0.48 0.44 0.52 1.47 1.18 1.81 0.14 0.16 0.11
40-44 0.31 0.30 0.32 1.06 0.94 1.17 0.09 0.10 0.07
45-49 0.34 0.33 0.34 1.26 1.28 1.24 0.06 0.04 0.08
50-54 0.80 0.70 0.90 2.17 1.77 2.60 0.37 0.31 0.42
55-59 1.09 2.16 0.02 2.57 4.40 0.12 0.73 1.52 0.00
60-64 0.00 0.00 0.00 0.00 0.00 0.00 0.00 0.00 0.00
65 and over 0.13 0.14 0.12 0.00 0.00 0.00 0.14 0.16 0.13
R3 North and South Central Coast
Total 1.96 1.87 2.06 3.58 3.38 3.78 1.40 1.34 1.46
15-19 6.70 6.67 6.74 15.20 16.46 13.32 4.87 4.49 5.40
20-24 7.72 6.48 9.18 13.23 11.12 15.29 5.83 5.05 6.79
25-29 2.90 2.39 3.46 5.12 4.76 5.47 2.07 1.57 2.63
30-34 1.27 0.72 1.81 2.58 1.60 3.49 0.77 0.39 1.14
35-39 0.59 0.62 0.56 1.50 1.50 1.51 0.26 0.29 0.23
40-44 0.75 0.54 0.95 0.99 0.78 1.21 0.64 0.43 0.85
45-49 0.38 0.28 0.47 0.99 0.62 1.36 0.16 0.16 0.16
50-54 1.12 1.21 1.04 2.09 1.66 2.51 0.78 1.04 0.55
55-59 1.11 1.97 0.23 2.70 4.41 0.59 0.60 1.09 0.12
60-64 0.17 0.24 0.10 0.79 1.11 0.49 0.00 0.00 0.00
65 and over 0.19 0.23 0.15 0.15 0.30 0.00 0.20 0.22 0.18
Rural
Unit: %
Whole countryAge group/ Administration
Urban
174

Table 33 (continue)
Total Male Female Total Male Female Total Male Female
Rural
Unit: %
Whole countryAge group/ Administration
Urban
R4 Central Highlands
Total 1.37 1.00 1.77 1.78 1.38 2.19 1.20 0.85 1.59
15-19 3.44 1.69 5.82 3.91 3.56 4.37 3.35 1.34 6.11
20-24 3.96 2.35 5.89 7.93 4.91 11.11 2.72 1.62 4.11
25-29 2.37 2.21 2.52 2.66 1.73 3.57 2.26 2.39 2.13
30-34 1.02 0.51 1.49 0.90 0.33 1.41 1.06 0.59 1.52
35-39 0.35 0.15 0.56 0.81 0.53 1.08 0.14 0.00 0.31
40-44 0.20 0.16 0.25 0.58 0.45 0.72 0.00 0.00 0.00
45-49 0.20 0.16 0.24 0.38 0.49 0.26 0.11 0.00 0.22
50-54 1.18 1.50 0.86 1.27 1.44 1.09 1.14 1.53 0.75
55-59 1.01 1.37 0.62 1.53 2.39 0.61 0.79 0.94 0.63
60-64 0.14 0.27 0.00 0.53 1.01 0.00 0.00 0.00 0.00
65 and over 0.00 0.00 0.00 0.00 0.00 0.00 0.00 0.00 0.00
R5 Southeast (*)
Total 1.55 1.33 1.78 1.68 1.59 1.77 1.46 1.19 1.79
15-19 6.31 7.02 5.62 7.15 7.88 6.67 5.90 6.71 4.93
20-24 3.79 2.83 4.81 3.81 3.53 4.02 3.77 2.48 5.56
25-29 2.05 1.20 3.00 1.96 1.50 2.42 2.12 0.97 3.56
30-34 0.94 0.86 1.03 1.01 1.03 0.99 0.89 0.75 1.06
35-39 0.48 0.35 0.60 0.46 0.63 0.28 0.49 0.16 0.84
40-44 0.41 0.34 0.48 0.41 0.26 0.58 0.40 0.39 0.42
45-49 0.71 0.74 0.67 1.18 1.45 0.87 0.47 0.38 0.56
50-54 0.77 0.63 0.93 0.65 0.81 0.50 0.84 0.53 1.19
55-59 1.15 2.07 0.00 1.76 2.90 0.00 0.89 1.66 0.00
60-64 0.35 0.04 0.71 0.62 0.15 1.21 0.26 0.00 0.56
65 and over 0.02 0.00 0.05 0.10 0.00 0.21 0.00 0.00 0.00
175

Table 33 (continue)
Total Male Female Total Male Female Total Male Female
Rural
Unit: %
Whole countryAge group/ Administration
Urban
R6 Mekong River Delta
Total 1.94 1.17 2.86 2.64 2.22 3.09 1.72 0.86 2.78
15-19 6.80 3.38 12.26 9.04 7.66 10.90 6.26 2.43 12.63
20-24 5.93 3.44 9.50 8.16 7.44 9.03 5.26 2.35 9.66
25-29 2.84 1.58 4.47 3.80 2.91 4.82 2.50 1.14 4.34
30-34 1.31 0.64 2.07 2.31 1.36 3.31 0.99 0.42 1.65
35-39 0.93 0.47 1.44 1.39 0.91 1.91 0.78 0.34 1.29
40-44 0.82 0.44 1.25 0.97 0.51 1.46 0.77 0.42 1.18
45-49 1.01 0.62 1.47 1.13 0.65 1.65 0.97 0.61 1.40
50-54 1.43 1.30 1.55 1.83 2.26 1.43 1.29 0.98 1.60
55-59 0.38 0.61 0.13 0.99 1.47 0.44 0.19 0.33 0.04
60-64 0.10 0.04 0.18 0.14 0.19 0.07 0.09 0.00 0.21
65 and over 0.05 0.03 0.08 0.31 0.20 0.42 0.00 0.00 0.00
R7 Hanoi City
Total 1.93 1.93 1.92 3.27 3.17 3.37 1.06 1.11 1.02
15-19 6.22 8.30 3.21 13.94 19.17 7.07 4.84 6.44 2.48
20-24 5.25 4.68 5.85 11.54 11.15 11.89 2.82 2.48 3.21
25-29 2.03 1.88 2.18 3.58 3.27 3.89 0.94 0.90 0.99
30-34 1.18 1.08 1.27 2.09 1.82 2.35 0.44 0.53 0.35
35-39 1.16 0.97 1.36 1.81 1.50 2.12 0.62 0.52 0.72
40-44 0.62 0.61 0.63 1.09 1.26 0.94 0.28 0.13 0.41
45-49 1.21 1.11 1.31 2.49 2.38 2.62 0.37 0.23 0.52
50-54 2.75 1.95 3.58 4.52 3.16 6.31 1.47 0.85 1.99
55-59 2.00 3.51 0.19 3.88 5.65 0.68 0.95 1.95 0.00
60-64 0.17 0.00 0.31 0.00 0.00 0.00 0.23 0.00 0.43
65 and over 0.18 0.41 0.00 0.00 0.00 0.00 0.25 0.59 0.00
176

Table 33 (continue)
Total Male Female Total Male Female Total Male Female
Rural
Unit: %
Whole countryAge group/ Administration
Urban
R8 Ho Chi Minh City
Total 3.51 3.13 3.93 3.78 3.25 4.41 2.13 2.45 1.84
15-19 10.80 13.04 8.37 11.41 14.15 8.24 9.03 9.40 8.70
20-24 5.55 5.44 5.66 5.73 5.62 5.83 4.82 4.72 4.92
25-29 4.58 4.50 4.67 5.12 4.95 5.29 1.94 1.97 1.91
30-34 2.42 2.10 2.75 2.77 2.28 3.30 0.95 1.25 0.70
35-39 2.33 1.58 3.21 2.63 1.63 3.87 1.08 1.34 0.83
40-44 2.18 1.69 2.80 2.38 1.79 3.17 1.10 1.04 1.15
45-49 2.90 2.03 4.08 3.14 1.96 4.80 1.46 2.50 0.47
50-54 5.14 3.67 6.77 5.49 3.86 7.33 2.51 2.27 2.76
55-59 2.94 4.72 0.00 2.94 4.57 0.00 2.89 6.27 0.00
60-64 0.00 0.00 0.00 0.00 0.00 0.00 0.00 0.00 0.00
65 and over 0.00 0.00 0.00 0.00 0.00 0.00 0.00 0.00 0.00
Remark: (*) Red River Delta excludes Hanoi City and Southeast excludes Ho Chi Minh City.
177

Tota
lM
ale
Fem
ale
Tota
lM
ale
Fem
ale
Tota
lM
ale
Fem
ale
EN
TIR
E C
OU
NT
RY
Tot
al10
0.0
100.
010
0.0
100.
010
0.0
100.
010
0.0
100.
010
0.0
Job
appl
icat
ion
35.6
32.0
40.1
36.0
32.6
40.6
35.1
31.3
39.6
Empl
oym
ent s
ervi
ce4.
04.
92.
74.
45.
23.
43.
44.
72.
0
Via
frie
nds o
r rel
ativ
es53
.255
.750
.152
.655
.149
.453
.856
.350
.7
Plac
ing
adve
rtise
men
t0.
40.
40.
50.
80.
70.
90.
10.
10.
1
Look
ing
at a
dver
tisem
ents
of r
ecru
itmen
t5.
25.
44.
94.
95.
44.
35.
45.
35.
5
Prep
arat
ion
for
setti
ngup
abu
sine
sspr
oduc
tion
0.3
0.4
0.3
0.3
0.3
0.4
0.3
0.5
0.1
Oth
ers
1.3
1.3
1.4
0.9
0.8
0.9
1.8
1.8
1.9
R1
Nor
ther
n M
idla
nds a
nd M
ount
ains
Tot
al10
0.0
100.
010
0.0
100.
010
0.0
100.
010
0.0
100.
010
0.0
Job
appl
icat
ion
39.7
31.1
54.3
34.0
25.8
45.5
45.5
35.8
66.1
Empl
oym
ent s
ervi
ce5.
36.
92.
63.
55.
01.
37.
28.
64.
4
Via
frie
nds o
r rel
ativ
es49
.355
.738
.356
.161
.848
.142
.250
.325
.2
Plac
ing
adve
rtise
men
t0.
10.
00.
30.
20.
00.
50.
00.
00.
0
Look
ing
at a
dver
tisem
ents
of r
ecru
itmen
t4.
34.
73.
64.
24.
63.
64.
44.
73.
6Pr
epar
atio
nfo
rse
tting
upa
busi
ness
prod
uctio
n0.
40.
40.
30.
80.
90.
60.
00.
00.
0
Oth
ers
1.0
1.2
0.6
1.3
1.9
0.4
0.7
0.7
0.8
Tab
le 3
4PR
OPO
RTI
ON
OF
MO
DE
OF
JOB
SEA
RC
H O
F PE
OPL
E A
GED
15
AN
D A
BO
VE
LOO
KIN
G F
OR
WO
RK
, 201
2
Mod
e of
job
sear
ch/A
dmin
istra
tion
Uni
t: %
Who
le c
ount
ryU
rban
Rur
al
178
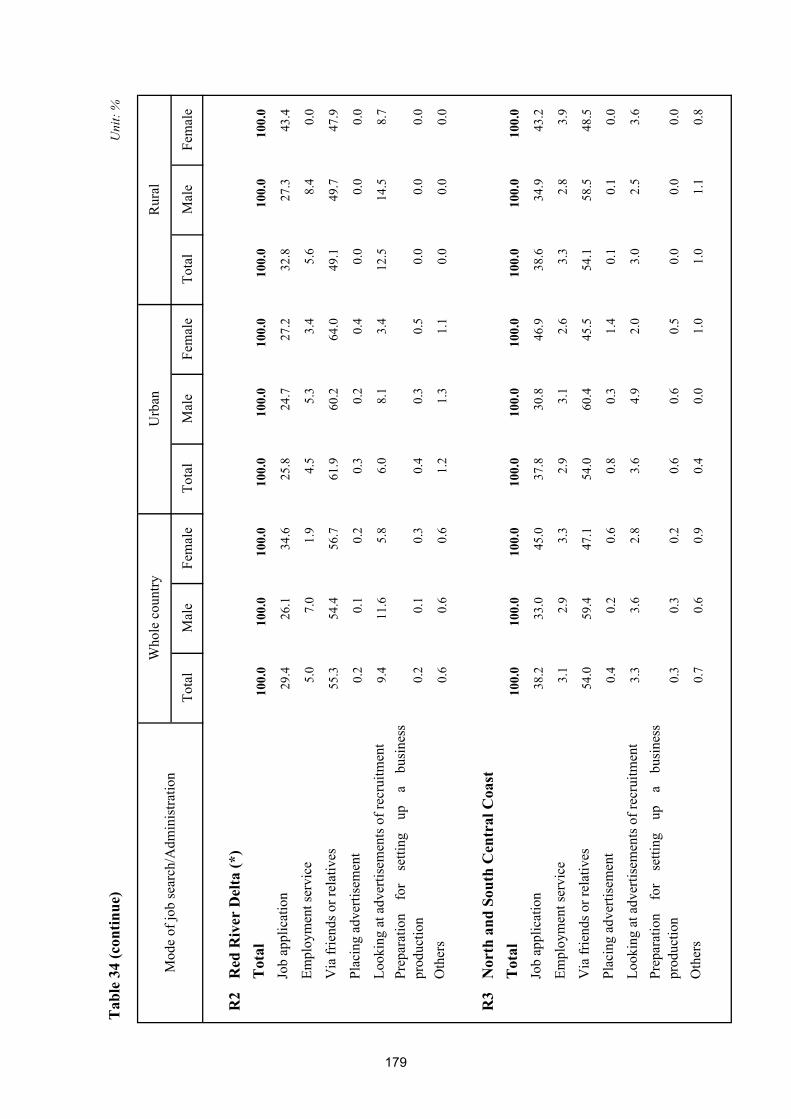
Tab
le 3
4 (c
ontin
ue)
Tota
lM
ale
Fem
ale
Tota
lM
ale
Fem
ale
Tota
lM
ale
Fem
ale
R2
Red
Riv
er D
elta
(*)
Tot
al10
0.0
100.
010
0.0
100.
010
0.0
100.
010
0.0
100.
010
0.0
Job
appl
icat
ion
29.4
26.1
34.6
25.8
24.7
27.2
32.8
27.3
43.4
Empl
oym
ent s
ervi
ce5.
07.
01.
94.
55.
33.
45.
68.
40.
0
Via
frie
nds o
r rel
ativ
es55
.354
.456
.761
.960
.264
.049
.149
.747
.9
Plac
ing
adve
rtise
men
t0.
20.
10.
20.
30.
20.
40.
00.
00.
0
Look
ing
at a
dver
tisem
ents
of r
ecru
itmen
t9.
411
.65.
86.
08.
13.
412
.514
.58.
7Pr
epar
atio
nfo
rse
tting
upa
busi
ness
prod
uctio
n0.
20.
10.
30.
40.
30.
50.
00.
00.
0
Oth
ers
0.6
0.6
0.6
1.2
1.3
1.1
0.0
0.0
0.0
R3
Nor
th a
nd S
outh
Cen
tral
Coa
stT
otal
100.
010
0.0
100.
010
0.0
100.
010
0.0
100.
010
0.0
100.
0
Job
appl
icat
ion
38.2
33.0
45.0
37.8
30.8
46.9
38.6
34.9
43.2
Empl
oym
ent s
ervi
ce3.
12.
93.
32.
93.
12.
63.
32.
83.
9
Via
frie
nds o
r rel
ativ
es54
.059
.447
.154
.060
.445
.554
.158
.548
.5
Plac
ing
adve
rtise
men
t0.
40.
20.
60.
80.
31.
40.
10.
10.
0
Look
ing
at a
dver
tisem
ents
of r
ecru
itmen
t3.
33.
62.
83.
64.
92.
03.
02.
53.
6Pr
epar
atio
nfo
rse
tting
upa
busi
ness
prod
uctio
n0.
30.
30.
20.
60.
60.
50.
00.
00.
0
Oth
ers
0.7
0.6
0.9
0.4
0.0
1.0
1.0
1.1
0.8
Rur
al
Uni
t: %
Who
le c
ount
ryU
rban
Mod
e of
job
sear
ch/A
dmin
istra
tion
179
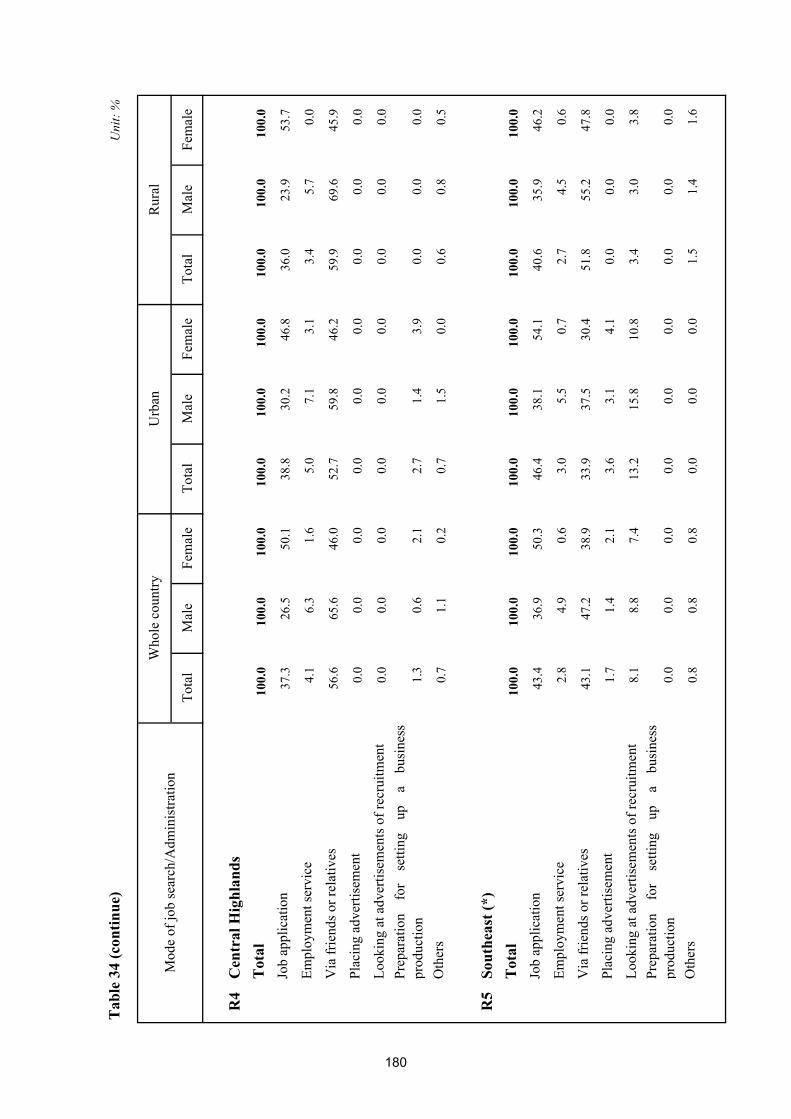
Tab
le 3
4 (c
ontin
ue)
Tota
lM
ale
Fem
ale
Tota
lM
ale
Fem
ale
Tota
lM
ale
Fem
ale
Rur
al
Uni
t: %
Who
le c
ount
ryU
rban
Mod
e of
job
sear
ch/A
dmin
istra
tion
R4
Cen
tral
Hig
hlan
dsT
otal
100.
010
0.0
100.
010
0.0
100.
010
0.0
100.
010
0.0
100.
0
Job
appl
icat
ion
37.3
26.5
50.1
38.8
30.2
46.8
36.0
23.9
53.7
Empl
oym
ent s
ervi
ce4.
16.
31.
65.
07.
13.
13.
45.
70.
0
Via
frie
nds o
r rel
ativ
es56
.665
.646
.052
.759
.846
.259
.969
.645
.9
Plac
ing
adve
rtise
men
t0.
00.
00.
00.
00.
00.
00.
00.
00.
0
Look
ing
at a
dver
tisem
ents
of r
ecru
itmen
t0.
00.
00.
00.
00.
00.
00.
00.
00.
0Pr
epar
atio
nfo
rse
tting
upa
busi
ness
prod
uctio
n1.
30.
62.
12.
71.
43.
90.
00.
00.
0
Oth
ers
0.7
1.1
0.2
0.7
1.5
0.0
0.6
0.8
0.5
R5
Sout
heas
t (*)
Tot
al10
0.0
100.
010
0.0
100.
010
0.0
100.
010
0.0
100.
010
0.0
Job
appl
icat
ion
43.4
36.9
50.3
46.4
38.1
54.1
40.6
35.9
46.2
Empl
oym
ent s
ervi
ce2.
84.
90.
63.
05.
50.
72.
74.
50.
6
Via
frie
nds o
r rel
ativ
es43
.147
.238
.933
.937
.530
.451
.855
.247
.8
Plac
ing
adve
rtise
men
t1.
71.
42.
13.
63.
14.
10.
00.
00.
0
Look
ing
at a
dver
tisem
ents
of r
ecru
itmen
t8.
18.
87.
413
.215
.810
.83.
43.
03.
8Pr
epar
atio
nfo
rse
tting
upa
busi
ness
prod
uctio
n0.
00.
00.
00.
00.
00.
00.
00.
00.
0
Oth
ers
0.8
0.8
0.8
0.0
0.0
0.0
1.5
1.4
1.6
180
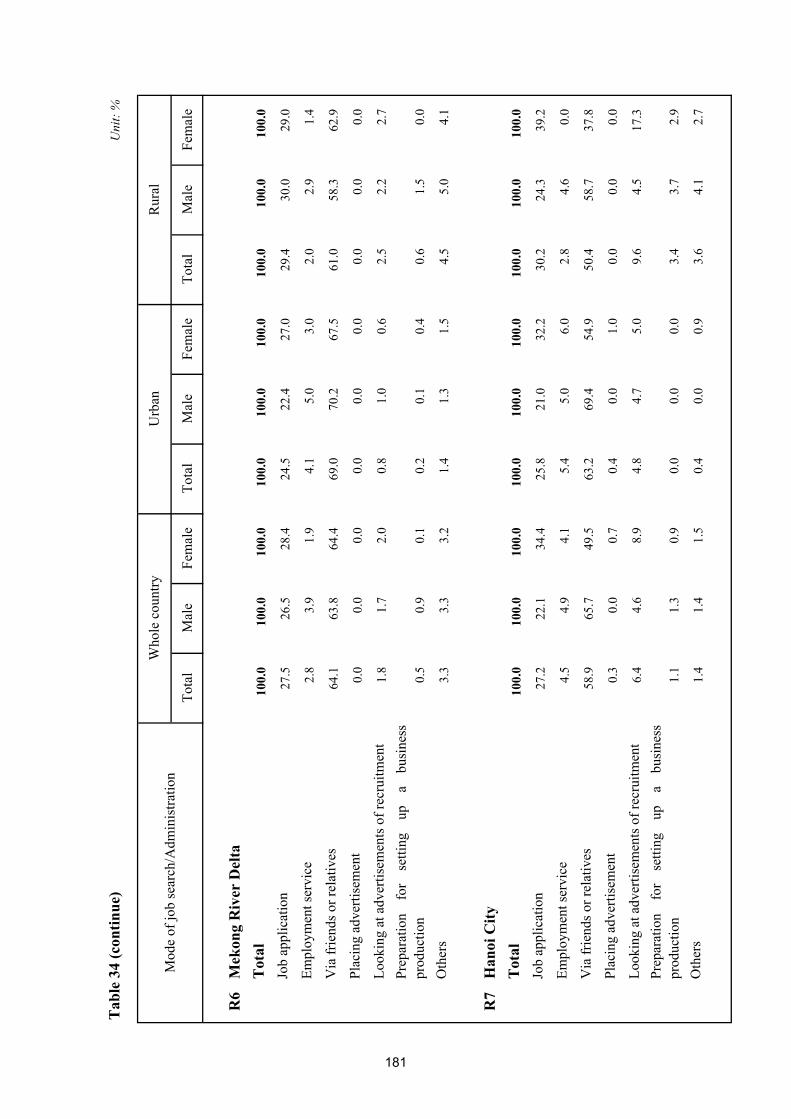
Tab
le 3
4 (c
ontin
ue)
Tota
lM
ale
Fem
ale
Tota
lM
ale
Fem
ale
Tota
lM
ale
Fem
ale
Rur
al
Uni
t: %
Who
le c
ount
ryU
rban
Mod
e of
job
sear
ch/A
dmin
istra
tion
R6
Mek
ong
Riv
er D
elta
Tot
al10
0.0
100.
010
0.0
100.
010
0.0
100.
010
0.0
100.
010
0.0
Job
appl
icat
ion
27.5
26.5
28.4
24.5
22.4
27.0
29.4
30.0
29.0
Empl
oym
ent s
ervi
ce2.
83.
91.
94.
15.
03.
02.
02.
91.
4
Via
frie
nds o
r rel
ativ
es64
.163
.864
.469
.070
.267
.561
.058
.362
.9
Plac
ing
adve
rtise
men
t0.
00.
00.
00.
00.
00.
00.
00.
00.
0
Look
ing
at a
dver
tisem
ents
of r
ecru
itmen
t1.
81.
72.
00.
81.
00.
62.
52.
22.
7Pr
epar
atio
nfo
rse
tting
upa
busi
ness
prod
uctio
n0.
50.
90.
10.
20.
10.
40.
61.
50.
0
Oth
ers
3.3
3.3
3.2
1.4
1.3
1.5
4.5
5.0
4.1
R7
Han
oi C
ityT
otal
100.
010
0.0
100.
010
0.0
100.
010
0.0
100.
010
0.0
100.
0
Job
appl
icat
ion
27.2
22.1
34.4
25.8
21.0
32.2
30.2
24.3
39.2
Empl
oym
ent s
ervi
ce4.
54.
94.
15.
45.
06.
02.
84.
60.
0
Via
frie
nds o
r rel
ativ
es58
.965
.749
.563
.269
.454
.950
.458
.737
.8
Plac
ing
adve
rtise
men
t0.
30.
00.
70.
40.
01.
00.
00.
00.
0
Look
ing
at a
dver
tisem
ents
of r
ecru
itmen
t6.
44.
68.
94.
84.
75.
09.
64.
517
.3Pr
epar
atio
nfo
rse
tting
upa
busi
ness
prod
uctio
n1.
11.
30.
90.
00.
00.
03.
43.
72.
9
Oth
ers
1.4
1.4
1.5
0.4
0.0
0.9
3.6
4.1
2.7
181
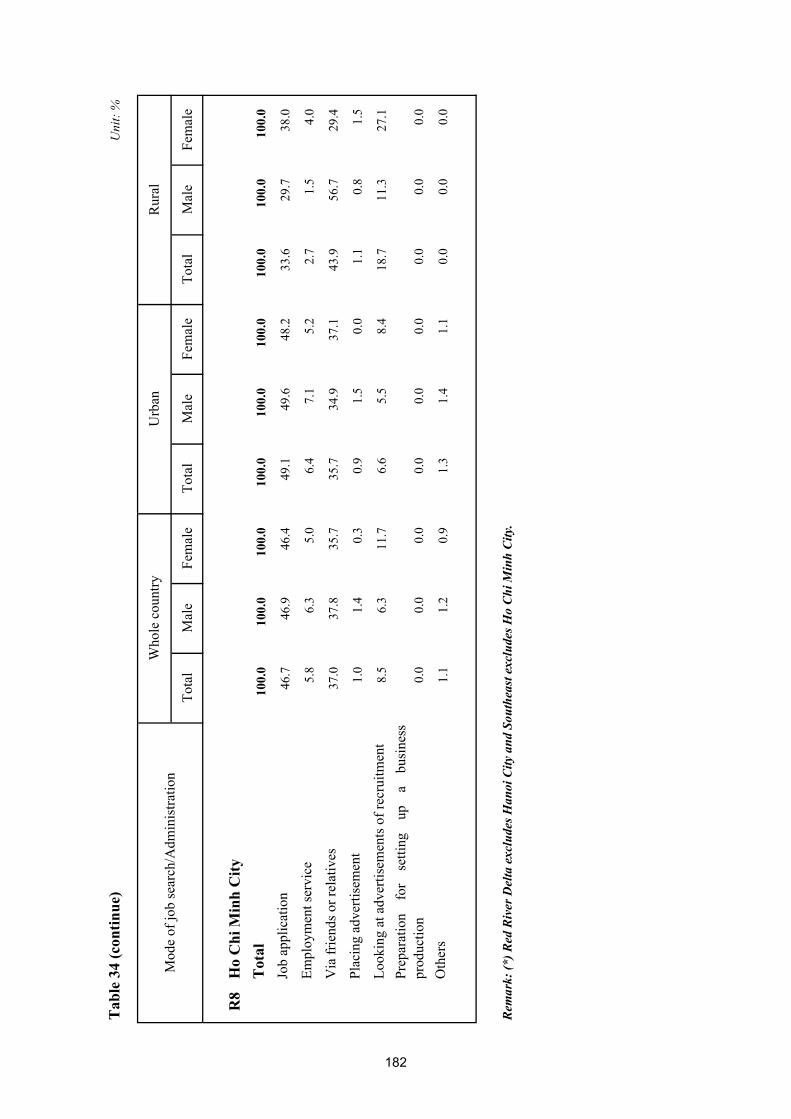
Tab
le 3
4 (c
ontin
ue)
Tota
lM
ale
Fem
ale
Tota
lM
ale
Fem
ale
Tota
lM
ale
Fem
ale
Rur
al
Uni
t: %
Who
le c
ount
ryU
rban
Mod
e of
job
sear
ch/A
dmin
istra
tion
R8
Ho
Chi
Min
h C
ityT
otal
100.
010
0.0
100.
010
0.0
100.
010
0.0
100.
010
0.0
100.
0
Job
appl
icat
ion
46.7
46.9
46.4
49.1
49.6
48.2
33.6
29.7
38.0
Empl
oym
ent s
ervi
ce5.
86.
35.
06.
47.
15.
22.
71.
54.
0
Via
frie
nds o
r rel
ativ
es37
.037
.835
.735
.734
.937
.143
.956
.729
.4
Plac
ing
adve
rtise
men
t1.
01.
40.
30.
91.
50.
01.
10.
81.
5
Look
ing
at a
dver
tisem
ents
of r
ecru
itmen
t8.
56.
311
.76.
65.
58.
418
.711
.327
.1Pr
epar
atio
nfo
rse
tting
upa
busi
ness
prod
uctio
n0.
00.
00.
00.
00.
00.
00.
00.
00.
0
Oth
ers
1.1
1.2
0.9
1.3
1.4
1.1
0.0
0.0
0.0
Rem
ark:
(*) R
ed R
iver
Del
ta e
xclu
des H
anoi
City
and
Sou
thea
st e
xclu
des H
o C
hi M
inh
City
.
182
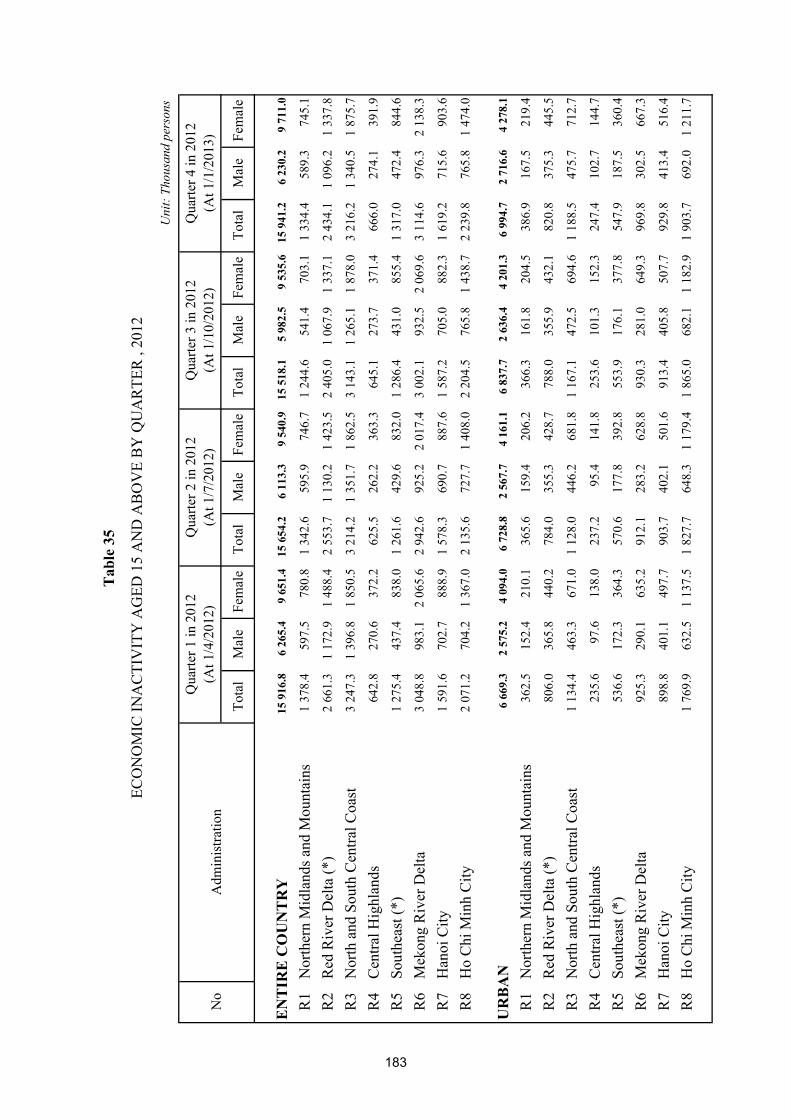
Tota
lM
ale
Fem
ale
Tota
lM
ale
Fem
ale
Tota
lM
ale
Fem
ale
Tota
lM
ale
Fem
ale
EN
TIR
E C
OU
NT
RY
15 9
16.8
6 26
5.4
9 65
1.4
15 6
54.2
6 11
3.3
9 54
0.9
15 5
18.1
5 98
2.5
9 53
5.6
15 9
41.2
6 23
0.2
9 71
1.0
R1
Nor
ther
n M
idla
nds a
nd M
ount
ains
1 37
8.4
597.
578
0.8
1 34
2.6
595.
974
6.7
1 24
4.6
541.
470
3.1
1 33
4.4
589.
374
5.1
R2
Red
Riv
er D
elta
(*)
2 66
1.3
1 17
2.9
1 48
8.4
2 55
3.7
1 13
0.2
1 42
3.5
2 40
5.0
1 06
7.9
1 33
7.1
2 43
4.1
1 09
6.2
1 33
7.8
R3
Nor
th a
nd S
outh
Cen
tral C
oast
3 24
7.3
1 39
6.8
1 85
0.5
3 21
4.2
1 35
1.7
1 86
2.5
3 14
3.1
1 26
5.1
1 87
8.0
3 21
6.2
1 34
0.5
1 87
5.7
R4
Cen
tral H
ighl
ands
642.
827
0.6
372.
262
5.5
262.
236
3.3
645.
127
3.7
371.
466
6.0
274.
139
1.9
R5
Sout
heas
t (*)
1 27
5.4
437.
483
8.0
1 26
1.6
429.
683
2.0
1 28
6.4
431.
085
5.4
1 31
7.0
472.
484
4.6
R6
Mek
ong
Riv
er D
elta
3 04
8.8
983.
12
065.
62
942.
692
5.2
2 01
7.4
3 00
2.1
932.
52
069.
63
114.
697
6.3
2 13
8.3
R7
Han
oi C
ity1
591.
670
2.7
888.
91
578.
369
0.7
887.
61
587.
270
5.0
882.
31
619.
271
5.6
903.
6
R8
Ho
Chi
Min
h C
ity2
071.
270
4.2
1 36
7.0
2 13
5.6
727.
71
408.
02
204.
576
5.8
1 43
8.7
2 23
9.8
765.
81
474.
0
UR
BA
N6
669.
32
575.
24
094.
06
728.
82
567.
74
161.
16
837.
72
636.
44
201.
36
994.
72
716.
64
278.
1
R1
Nor
ther
n M
idla
nds a
nd M
ount
ains
362.
515
2.4
210.
136
5.6
159.
420
6.2
366.
316
1.8
204.
538
6.9
167.
521
9.4
R2
Red
Riv
er D
elta
(*)
806.
036
5.8
440.
278
4.0
355.
342
8.7
788.
035
5.9
432.
182
0.8
375.
344
5.5
R3
Nor
th a
nd S
outh
Cen
tral C
oast
1 13
4.4
463.
367
1.0
1 12
8.0
446.
268
1.8
1 16
7.1
472.
569
4.6
1 18
8.5
475.
771
2.7
R4
Cen
tral H
ighl
ands
235.
697
.613
8.0
237.
295
.414
1.8
253.
610
1.3
152.
324
7.4
102.
714
4.7
R5
Sout
heas
t (*)
536.
617
2.3
364.
357
0.6
177.
839
2.8
553.
917
6.1
377.
854
7.9
187.
536
0.4
R6
Mek
ong
Riv
er D
elta
925.
329
0.1
635.
291
2.1
283.
262
8.8
930.
328
1.0
649.
396
9.8
302.
566
7.3
R7
Han
oi C
ity89
8.8
401.
149
7.7
903.
740
2.1
501.
691
3.4
405.
850
7.7
929.
841
3.4
516.
4
R8
Ho
Chi
Min
h C
ity1
769.
963
2.5
1 13
7.5
1 82
7.7
648.
31
179.
41
865.
068
2.1
1 18
2.9
1 90
3.7
692.
01
211.
7
Tab
le 3
5
ECO
NO
MIC
INA
CTI
VIT
Y A
GED
15
AN
D A
BO
VE
BY
QU
AR
TER
, 20
12
Uni
t: Th
ousa
nd p
erso
ns
No
Adm
inis
tratio
n
Qua
rter 1
in 2
012
(At 1
/4/2
012)
Qua
rter 4
in 2
012
(At 1
/1/2
013)
Qua
rter 2
in 2
012
(At 1
/7/2
012)
Qua
rter 3
in 2
012
(At 1
/10/
2012
)
183

Tab
le 3
5 (c
ontin
ue)
Tota
lM
ale
Fem
ale
Tota
lM
ale
Fem
ale
Tota
lM
ale
Fem
ale
Tota
lM
ale
Fem
ale
RU
RA
L9
247.
53
690.
15
557.
48
925.
43
545.
65
379.
88
680.
43
346.
15
334.
38
946.
53
513.
65
432.
9
R1
Nor
ther
n M
idla
nds a
nd M
ount
ains
1 01
5.8
445.
157
0.7
977.
143
6.5
540.
587
8.3
379.
649
8.6
947.
542
1.8
525.
7
R2
Red
Riv
er D
elta
(*)
1 85
5.3
807.
11
048.
11
769.
777
4.9
994.
81
617.
071
1.9
905.
11
613.
372
0.9
892.
4
R3
Nor
th a
nd S
outh
Cen
tral C
oast
2 11
3.0
933.
51
179.
42
086.
290
5.5
1 18
0.7
1 97
6.0
792.
61
183.
42
027.
786
4.7
1 16
3.0
R4
Cen
tral H
ighl
ands
407.
217
3.0
234.
238
8.3
166.
922
1.5
391.
517
2.4
219.
141
8.6
171.
424
7.2
R5
Sout
heas
t (*)
738.
726
5.0
473.
769
0.9
251.
743
9.2
732.
525
5.0
477.
576
9.1
285.
048
4.2
R6
Mek
ong
Riv
er D
elta
2 12
3.4
693.
01
430.
42
030.
564
2.0
1 38
8.5
2 07
1.8
651.
51
420.
32
144.
867
3.9
1 47
1.0
R7
Han
oi C
ity69
2.8
301.
639
1.3
674.
628
8.7
386.
067
3.8
299.
237
4.6
689.
430
2.2
387.
2
R8
Ho
Chi
Min
h C
ity30
1.3
71.8
229.
530
8.0
79.4
228.
633
9.5
83.8
255.
833
6.1
73.8
262.
3
Rem
ark:
(*) R
ed R
iver
Del
ta e
xclu
des H
anoi
City
and
Sou
thea
st e
xclu
des H
o C
hi M
inh
City
.
Uni
t: Th
ousa
nd p
erso
ns
No
Adm
inis
tratio
n
Qua
rter 1
in 2
012
(At 1
/4/2
012)
Qua
rter 2
in 2
012
(At 1
/7/2
012)
Qua
rter 3
in 2
012
(At 1
/10/
2012
)Q
uarte
r 4 in
201
2(A
t 1/1
/201
3)
184
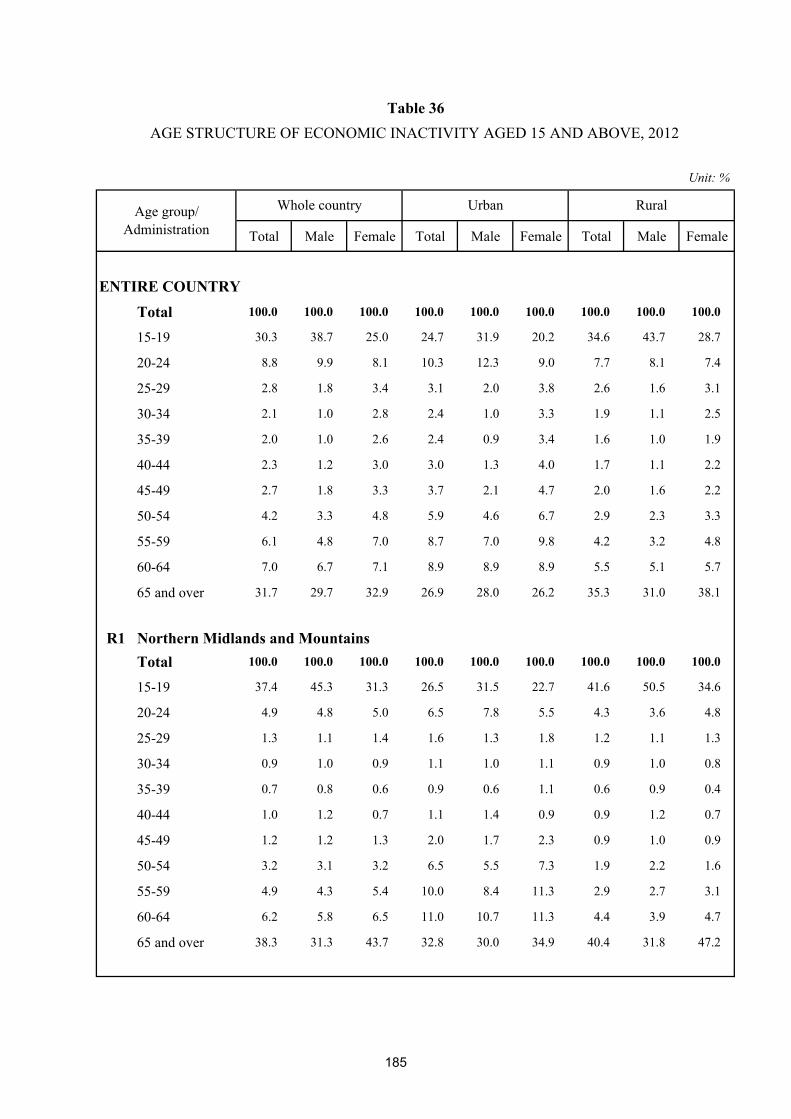
Total Male Female Total Male Female Total Male Female
ENTIRE COUNTRY
Total 100.0 100.0 100.0 100.0 100.0 100.0 100.0 100.0 100.0
15-19 30.3 38.7 25.0 24.7 31.9 20.2 34.6 43.7 28.7
20-24 8.8 9.9 8.1 10.3 12.3 9.0 7.7 8.1 7.4
25-29 2.8 1.8 3.4 3.1 2.0 3.8 2.6 1.6 3.1
30-34 2.1 1.0 2.8 2.4 1.0 3.3 1.9 1.1 2.5
35-39 2.0 1.0 2.6 2.4 0.9 3.4 1.6 1.0 1.9
40-44 2.3 1.2 3.0 3.0 1.3 4.0 1.7 1.1 2.2
45-49 2.7 1.8 3.3 3.7 2.1 4.7 2.0 1.6 2.2
50-54 4.2 3.3 4.8 5.9 4.6 6.7 2.9 2.3 3.3
55-59 6.1 4.8 7.0 8.7 7.0 9.8 4.2 3.2 4.8
60-64 7.0 6.7 7.1 8.9 8.9 8.9 5.5 5.1 5.7
65 and over 31.7 29.7 32.9 26.9 28.0 26.2 35.3 31.0 38.1
R1 Northern Midlands and MountainsTotal 100.0 100.0 100.0 100.0 100.0 100.0 100.0 100.0 100.0
15-19 37.4 45.3 31.3 26.5 31.5 22.7 41.6 50.5 34.6
20-24 4.9 4.8 5.0 6.5 7.8 5.5 4.3 3.6 4.8
25-29 1.3 1.1 1.4 1.6 1.3 1.8 1.2 1.1 1.3
30-34 0.9 1.0 0.9 1.1 1.0 1.1 0.9 1.0 0.8
35-39 0.7 0.8 0.6 0.9 0.6 1.1 0.6 0.9 0.4
40-44 1.0 1.2 0.7 1.1 1.4 0.9 0.9 1.2 0.7
45-49 1.2 1.2 1.3 2.0 1.7 2.3 0.9 1.0 0.9
50-54 3.2 3.1 3.2 6.5 5.5 7.3 1.9 2.2 1.6
55-59 4.9 4.3 5.4 10.0 8.4 11.3 2.9 2.7 3.1
60-64 6.2 5.8 6.5 11.0 10.7 11.3 4.4 3.9 4.7
65 and over 38.3 31.3 43.7 32.8 30.0 34.9 40.4 31.8 47.2
Urban RuralAge group/ Administration
Table 36AGE STRUCTURE OF ECONOMIC INACTIVITY AGED 15 AND ABOVE, 2012
Unit: %
Whole country
185
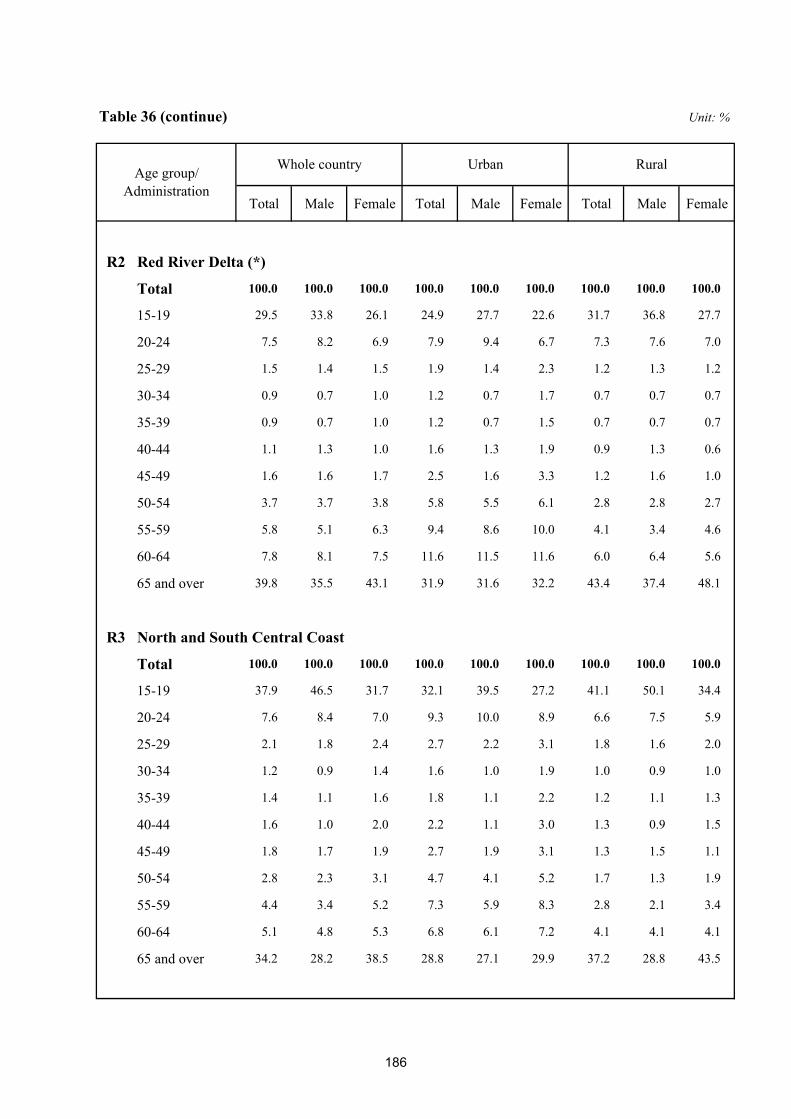
Table 36 (continue)
Total Male Female Total Male Female Total Male Female
R2 Red River Delta (*)
Total 100.0 100.0 100.0 100.0 100.0 100.0 100.0 100.0 100.0
15-19 29.5 33.8 26.1 24.9 27.7 22.6 31.7 36.8 27.7
20-24 7.5 8.2 6.9 7.9 9.4 6.7 7.3 7.6 7.0
25-29 1.5 1.4 1.5 1.9 1.4 2.3 1.2 1.3 1.2
30-34 0.9 0.7 1.0 1.2 0.7 1.7 0.7 0.7 0.7
35-39 0.9 0.7 1.0 1.2 0.7 1.5 0.7 0.7 0.7
40-44 1.1 1.3 1.0 1.6 1.3 1.9 0.9 1.3 0.6
45-49 1.6 1.6 1.7 2.5 1.6 3.3 1.2 1.6 1.0
50-54 3.7 3.7 3.8 5.8 5.5 6.1 2.8 2.8 2.7
55-59 5.8 5.1 6.3 9.4 8.6 10.0 4.1 3.4 4.6
60-64 7.8 8.1 7.5 11.6 11.5 11.6 6.0 6.4 5.6
65 and over 39.8 35.5 43.1 31.9 31.6 32.2 43.4 37.4 48.1
R3 North and South Central Coast
Total 100.0 100.0 100.0 100.0 100.0 100.0 100.0 100.0 100.0
15-19 37.9 46.5 31.7 32.1 39.5 27.2 41.1 50.1 34.4
20-24 7.6 8.4 7.0 9.3 10.0 8.9 6.6 7.5 5.9
25-29 2.1 1.8 2.4 2.7 2.2 3.1 1.8 1.6 2.0
30-34 1.2 0.9 1.4 1.6 1.0 1.9 1.0 0.9 1.0
35-39 1.4 1.1 1.6 1.8 1.1 2.2 1.2 1.1 1.3
40-44 1.6 1.0 2.0 2.2 1.1 3.0 1.3 0.9 1.5
45-49 1.8 1.7 1.9 2.7 1.9 3.1 1.3 1.5 1.1
50-54 2.8 2.3 3.1 4.7 4.1 5.2 1.7 1.3 1.9
55-59 4.4 3.4 5.2 7.3 5.9 8.3 2.8 2.1 3.4
60-64 5.1 4.8 5.3 6.8 6.1 7.2 4.1 4.1 4.1
65 and over 34.2 28.2 38.5 28.8 27.1 29.9 37.2 28.8 43.5
Age group/ Administration
Rural
Unit: %
Whole country Urban
186

Table 36 (continue)
Total Male Female Total Male Female Total Male Female
Age group/ Administration
Rural
Unit: %
Whole country Urban
R4 Central Highlands
Total 100.0 100.0 100.0 100.0 100.0 100.0 100.0 100.0 100.0
15-19 50.3 59.0 44.1 45.2 53.7 39.4 53.4 62.1 47.1
20-24 6.0 6.8 5.5 7.7 8.5 7.2 5.0 5.8 4.4
25-29 2.3 2.0 2.5 2.7 2.2 3.1 2.0 1.9 2.1
30-34 1.5 0.8 1.9 1.8 0.6 2.6 1.3 1.0 1.5
35-39 1.1 0.5 1.6 1.7 1.2 2.1 0.8 0.2 1.3
40-44 0.8 0.4 1.0 1.5 0.9 2.0 0.3 0.2 0.4
45-49 1.5 1.3 1.6 2.0 1.2 2.6 1.1 1.4 0.9
50-54 2.4 1.9 2.7 3.4 2.4 4.0 1.8 1.6 1.9
55-59 3.5 2.6 4.2 4.6 3.6 5.2 2.9 2.1 3.6
60-64 5.2 4.1 5.9 5.3 4.8 5.6 5.1 3.8 6.1
65 and over 25.4 20.3 29.0 24.0 20.9 26.2 26.1 20.0 30.7
R5 Southeast (*)
Total 100.0 100.0 100.0 100.0 100.0 100.0 100.0 100.0 100.0
15-19 30.5 42.8 23.9 25.2 38.6 18.8 34.4 45.7 28.0
20-24 9.6 10.7 8.9 10.3 12.1 9.5 9.0 9.8 8.5
25-29 3.8 1.4 5.0 4.6 1.2 6.2 3.1 1.6 4.0
30-34 3.4 1.1 4.6 4.2 1.1 5.8 2.8 1.1 3.7
35-39 2.7 1.3 3.5 3.2 1.0 4.3 2.3 1.6 2.8
40-44 3.2 1.1 4.2 3.8 1.3 5.0 2.7 1.1 3.7
45-49 3.9 2.7 4.5 4.4 3.7 4.8 3.5 2.0 4.3
50-54 5.3 3.8 6.2 5.9 4.0 6.9 4.9 3.6 5.6
55-59 6.5 4.9 7.3 7.5 6.4 8.0 5.7 3.9 6.8
60-64 6.7 5.7 7.2 6.5 6.4 6.6 6.8 5.3 7.6
65 and over 24.6 24.4 24.6 24.2 24.3 24.2 24.8 24.5 25.0
187
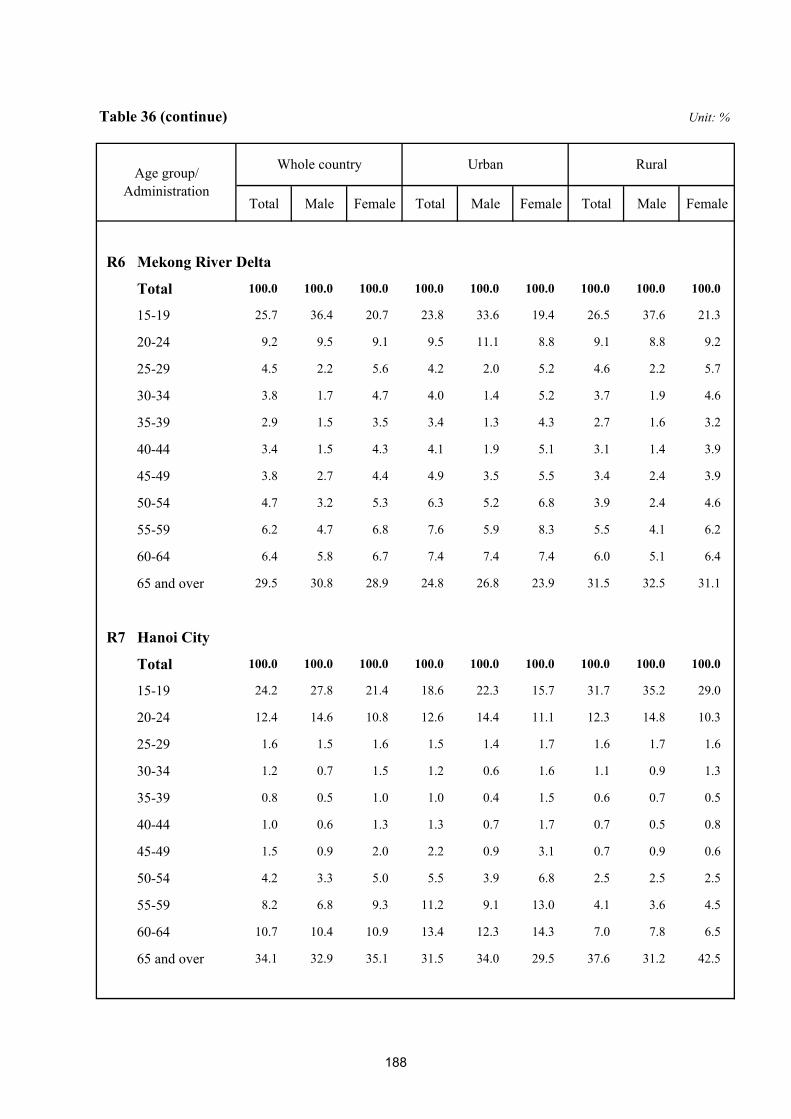
Table 36 (continue)
Total Male Female Total Male Female Total Male Female
Age group/ Administration
Rural
Unit: %
Whole country Urban
R6 Mekong River Delta
Total 100.0 100.0 100.0 100.0 100.0 100.0 100.0 100.0 100.0
15-19 25.7 36.4 20.7 23.8 33.6 19.4 26.5 37.6 21.3
20-24 9.2 9.5 9.1 9.5 11.1 8.8 9.1 8.8 9.2
25-29 4.5 2.2 5.6 4.2 2.0 5.2 4.6 2.2 5.7
30-34 3.8 1.7 4.7 4.0 1.4 5.2 3.7 1.9 4.6
35-39 2.9 1.5 3.5 3.4 1.3 4.3 2.7 1.6 3.2
40-44 3.4 1.5 4.3 4.1 1.9 5.1 3.1 1.4 3.9
45-49 3.8 2.7 4.4 4.9 3.5 5.5 3.4 2.4 3.9
50-54 4.7 3.2 5.3 6.3 5.2 6.8 3.9 2.4 4.6
55-59 6.2 4.7 6.8 7.6 5.9 8.3 5.5 4.1 6.2
60-64 6.4 5.8 6.7 7.4 7.4 7.4 6.0 5.1 6.4
65 and over 29.5 30.8 28.9 24.8 26.8 23.9 31.5 32.5 31.1
R7 Hanoi City
Total 100.0 100.0 100.0 100.0 100.0 100.0 100.0 100.0 100.0
15-19 24.2 27.8 21.4 18.6 22.3 15.7 31.7 35.2 29.0
20-24 12.4 14.6 10.8 12.6 14.4 11.1 12.3 14.8 10.3
25-29 1.6 1.5 1.6 1.5 1.4 1.7 1.6 1.7 1.6
30-34 1.2 0.7 1.5 1.2 0.6 1.6 1.1 0.9 1.3
35-39 0.8 0.5 1.0 1.0 0.4 1.5 0.6 0.7 0.5
40-44 1.0 0.6 1.3 1.3 0.7 1.7 0.7 0.5 0.8
45-49 1.5 0.9 2.0 2.2 0.9 3.1 0.7 0.9 0.6
50-54 4.2 3.3 5.0 5.5 3.9 6.8 2.5 2.5 2.5
55-59 8.2 6.8 9.3 11.2 9.1 13.0 4.1 3.6 4.5
60-64 10.7 10.4 10.9 13.4 12.3 14.3 7.0 7.8 6.5
65 and over 34.1 32.9 35.1 31.5 34.0 29.5 37.6 31.2 42.5
188
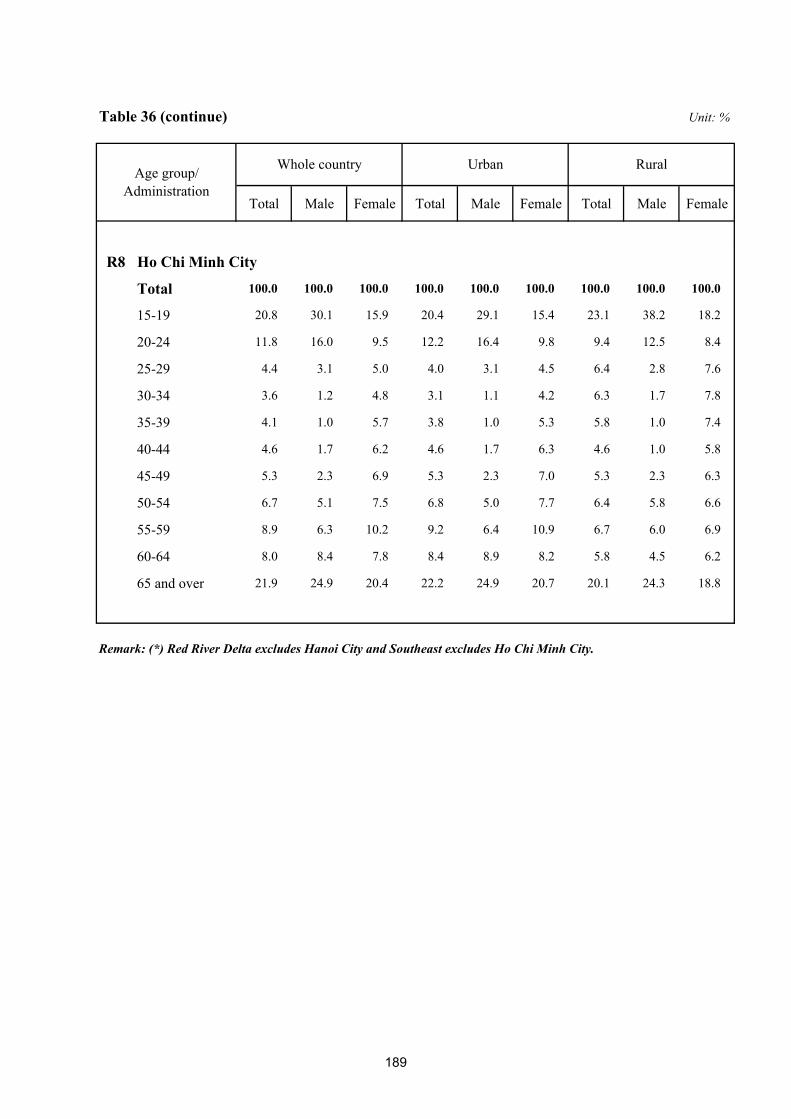
Table 36 (continue)
Total Male Female Total Male Female Total Male Female
Age group/ Administration
Rural
Unit: %
Whole country Urban
R8 Ho Chi Minh City
Total 100.0 100.0 100.0 100.0 100.0 100.0 100.0 100.0 100.0
15-19 20.8 30.1 15.9 20.4 29.1 15.4 23.1 38.2 18.2
20-24 11.8 16.0 9.5 12.2 16.4 9.8 9.4 12.5 8.4
25-29 4.4 3.1 5.0 4.0 3.1 4.5 6.4 2.8 7.6
30-34 3.6 1.2 4.8 3.1 1.1 4.2 6.3 1.7 7.8
35-39 4.1 1.0 5.7 3.8 1.0 5.3 5.8 1.0 7.4
40-44 4.6 1.7 6.2 4.6 1.7 6.3 4.6 1.0 5.8
45-49 5.3 2.3 6.9 5.3 2.3 7.0 5.3 2.3 6.3
50-54 6.7 5.1 7.5 6.8 5.0 7.7 6.4 5.8 6.6
55-59 8.9 6.3 10.2 9.2 6.4 10.9 6.7 6.0 6.9
60-64 8.0 8.4 7.8 8.4 8.9 8.2 5.8 4.5 6.2
65 and over 21.9 24.9 20.4 22.2 24.9 20.7 20.1 24.3 18.8
Remark: (*) Red River Delta excludes Hanoi City and Southeast excludes Ho Chi Minh City.
189

190

Part 3 ANNEXES
191

192

Total Urban Rural Total Urban Rural
WHOLE COUNTRY 1 272 778 494 303 116 185 450 117 666
Socio-economic regionR1 Northern Midlands and Mountains 280 168 112 66 547 39 847 26 700
R2 Red River Delta 240 150 90 57 044 35 575 21 469
R3 North and South Central Coast 224 131 93 53 700 31 401 22 299
R4 Central Highland 120 70 50 28 713 16 744 11 969
R5 Southeast 200 129 71 47 526 30 919 16 607
R6 Mekong River Delta 208 130 78 49 586 30 964 18 622
63 provinces/cities01 Ha Noi 80 50 30 19 072 11 903 7 169
02 Ha Giang 20 12 8 4 801 2 881 1 920
04 Cao Bang 20 12 8 4 716 2 811 1 905
06 Bac Kan 20 12 8 4 775 2 860 1 915
08 Tuyen Quang 20 12 8 4 699 2 809 1 890
10 Lao Cai 20 12 8 4 734 2 827 1 907
11 Dien Bien 20 12 8 4 798 2 879 1 919
12 Lai Chau 20 12 8 4 694 2 826 1 868
14 Son La 20 12 8 4 799 2 880 1 919
15 Yen Bai 20 12 8 4 704 2 812 1 892
17 Hoa Binh 20 12 8 4 798 2 878 1 920
19 Thai Nguyen 20 12 8 4 799 2 879 1 920
20 Lang Son 20 12 8 4 794 2 874 1 920
22 Quang Ninh 16 10 6 3 836 2 396 1 440
24 Bac Giang 20 12 8 4 739 2 841 1 898
25 Phu Tho 20 12 8 4 697 2 790 1 907
26 Vinh Phuc 16 10 6 3 723 2 309 1 414
27 Bac Ninh 16 10 6 3 737 2 323 1 414
30 Hai Duong 16 10 6 3 818 2 388 1 430
31 Hai Phong 16 10 6 3 840 2 400 1 440
33 Hung Yen 16 10 6 3 840 2 400 1 440
34 Thai Binh 16 10 6 3 770 2 341 1 429
35 Ha Nam 16 10 6 3 739 2 324 1 415
36 Nam Dinh 16 10 6 3 829 2 391 1 438
37 Ninh Binh 16 10 6 3 840 2 400 1 440
38 Thanh Hoa 16 9 7 3 833 2 157 1 676
Annex 1DETAIL ALLOCATION OF SAMPLE SURVEY SCOPE
Code AdministrationNumber of EAs per month Number of enumerated
household per year
193
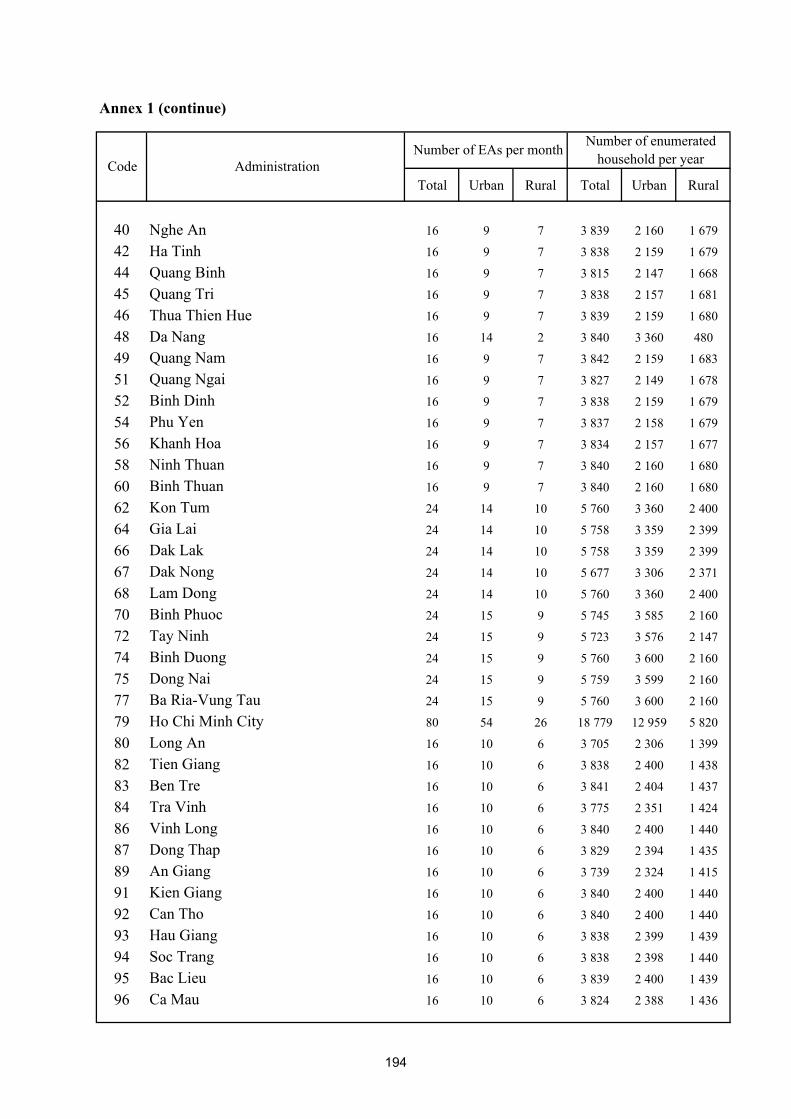
Annex 1 (continue)
Total Urban Rural Total Urban Rural
40 Nghe An 16 9 7 3 839 2 160 1 679
42 Ha Tinh 16 9 7 3 838 2 159 1 679
44 Quang Binh 16 9 7 3 815 2 147 1 668
45 Quang Tri 16 9 7 3 838 2 157 1 681
46 Thua Thien Hue 16 9 7 3 839 2 159 1 680
48 Da Nang 16 14 2 3 840 3 360 480
49 Quang Nam 16 9 7 3 842 2 159 1 683
51 Quang Ngai 16 9 7 3 827 2 149 1 678
52 Binh Dinh 16 9 7 3 838 2 159 1 679
54 Phu Yen 16 9 7 3 837 2 158 1 679
56 Khanh Hoa 16 9 7 3 834 2 157 1 677
58 Ninh Thuan 16 9 7 3 840 2 160 1 680
60 Binh Thuan 16 9 7 3 840 2 160 1 680
62 Kon Tum 24 14 10 5 760 3 360 2 400
64 Gia Lai 24 14 10 5 758 3 359 2 399
66 Dak Lak 24 14 10 5 758 3 359 2 399
67 Dak Nong 24 14 10 5 677 3 306 2 371
68 Lam Dong 24 14 10 5 760 3 360 2 400
70 Binh Phuoc 24 15 9 5 745 3 585 2 160
72 Tay Ninh 24 15 9 5 723 3 576 2 147
74 Binh Duong 24 15 9 5 760 3 600 2 160
75 Dong Nai 24 15 9 5 759 3 599 2 160
77 Ba Ria-Vung Tau 24 15 9 5 760 3 600 2 160
79 Ho Chi Minh City 80 54 26 18 779 12 959 5 820
80 Long An 16 10 6 3 705 2 306 1 399
82 Tien Giang 16 10 6 3 838 2 400 1 438
83 Ben Tre 16 10 6 3 841 2 404 1 437
84 Tra Vinh 16 10 6 3 775 2 351 1 424
86 Vinh Long 16 10 6 3 840 2 400 1 440
87 Dong Thap 16 10 6 3 829 2 394 1 435
89 An Giang 16 10 6 3 739 2 324 1 415
91 Kien Giang 16 10 6 3 840 2 400 1 440
92 Can Tho 16 10 6 3 840 2 400 1 440
93 Hau Giang 16 10 6 3 838 2 399 1 439
94 Soc Trang 16 10 6 3 838 2 398 1 440
95 Bac Lieu 16 10 6 3 839 2 400 1 439
96 Ca Mau 16 10 6 3 824 2 388 1 436
Code AdministrationNumber of EAs per month Number of enumerated
household per year
194

1
MIN
ISTR
Y O
F P
LAN
NIN
G A
ND
INV
ES
TME
NT
GEN
ERA
L ST
ATI
STIC
S O
FFIC
E Q
UES
TIO
NN
AIR
E O
F LA
BO
UR
FO
RC
E A
ND
EM
PLO
YMEN
T SU
RVE
Y O
F 20
12
(App
lied
for O
ctob
er)
IDEN
TIFI
CA
TIO
N
INTE
RVI
EWED
RES
ULT
S
D
ATE
OF
INTE
RVI
EW
RES
ULT
(*
) H
OU
R/D
AY
TO
CO
ME
BA
CK
SI
GN
ATU
RE
OF
INTE
RVI
EWER
SI
GN
ATU
RE
OF
HEA
D
THE
1S
T TH
E 2
ND
THE
3R
D
(*) C
OD
E O
F R
ES
ULT
:
1 =
CO
MP
LETE
D
2
= P
AR
TLY
CO
MP
LETE
D
3 =
RE
FUS
ED
/AB
SE
NT/
NO
T TO
BE
RE
SP
ON
DE
NT/
NO
BO
DY
TO A
NS
WE
R
4 =
DW
ELL
ING
DE
STR
OY
ED
/DW
ELL
ING
NO
T FO
UN
D
5 =
OTH
ER
___
____
____
____
____
____
____
____
____
____
____
____
____
____
____
____
____
___
(SP
EC
IFY)
TH
IS IS
TH
E
SET
OF
T
OTA
L S
ET(S
)
PR
OV
INC
E/C
ITY:
____
____
____
____
____
____
____
____
____
____
__
DIS
TRIC
T/Q
UA
TER
:__
____
____
____
____
____
____
____
____
____
_
CO
MM
UN
E/W
ARD
:___
____
____
____
____
____
____
____
____
____
_
EN
UM
ER
ATI
ON
AR
EA
NU
MB
ER
:....
......
......
......
......
......
......
......
......
....
EN
UM
ER
ATI
ON
AR
EA
NA
ME
: ___
____
____
____
____
____
____
____
HO
US
EH
OLD
NU
MBE
R:_
____
____
____
____
____
____
____
____
___
FULL
-NA
ME
OF
THE
HO
USE
HO
LD H
EAD
: __
____
____
____
____
__
NU
MB
ER
OF
US
UA
L R
ES
IDE
NTS
IN T
HE
HO
US
EH
OLD
:.....
......
......
.
O
F W
HIC
H, N
UM
BE
R O
F FE
MA
LES
:.....
......
......
......
......
......
.
NU
MB
ER
OF
MA
LES
US
UA
L R
ES
IDE
NTS
AG
ED
15
AN
D O
VE
R:.
....
NU
MB
ER
OF
FEM
ALE
S U
SU
AL
RE
SID
EN
TS A
GE
D 1
5 A
ND
OV
ER
:.
NU
MB
ER
OF
EM
PLO
YE
D P
EO
PLE
:....
......
......
......
......
......
......
......
......
NU
MB
ER
OF
UN
EM
PLO
YE
D P
EO
PLE
:....
......
......
......
......
......
......
......
.
NU
MB
ER
OF
UN
DE
R-E
MP
LOY
ED
PE
OP
LE:.
......
......
......
......
......
......
.
ALL
INFO
RM
ATI
ON
H
EREI
N W
ILL
BE
KEP
T ST
RIC
TLY
CO
NFI
DEN
TIA
L
X
SA
MP
LE D
IGIT
S TO
FIL
L IN
TO B
OX
P
LAC
E “X
” IN
TO T
HE
SM
ALL
BO
X TO
IND
ICA
TE T
HE
RE
SP
EC
TIV
E A
NS
WE
R

2
PAR
T 1:
HO
USE
HO
LD Q
UES
TIO
NN
AIR
E
OR
DER
NO
Q
UES
TIO
NS
NU
MB
ER
......
......
NU
MB
ER
......
......
NU
MB
ER
....
......
.
NU
MB
ER
....
......
.
NU
MB
ER
.....
......
.
NU
MB
ER
....
......
.
1. P
leas
e le
t me
know
the
full
nam
e of
ea
ch
pers
on u
sual
ly r
esid
ing
in
the
hous
ehol
d,
star
ting
with
the
head
of
hous
ehol
d?
____
____
____
____
____
__
__
____
____
____
____
____
__
____
____
____
____
____
____
____
____
____
____
__
__
____
____
____
____
____
__
____
____
____
____
____
____
____
____
____
____
__
__
____
____
____
____
____
__
____
____
____
____
____
____
____
____
____
____
__
__
____
____
____
____
____
__
____
____
____
____
____
____
____
____
____
____
__
__
____
____
____
____
____
__
____
____
____
____
____
____
____
____
____
____
__
__
____
____
____
____
____
__
____
____
____
____
____
2.
Wha
t is
[N
AM
E]’s
re
latio
nshi
p to
th
e ho
useh
old
head
?
H.H
HE
AD
......
......
...1
SP
OU
SE
......
......
......
2
NA
TUR
AL
CH
ILD
....3
PA
RE
NTS
.....
......
....4
OTH
ER
S...
......
......
...5
H.H
HE
AD
......
......
....1
SP
OU
SE
......
......
......
2
NA
TUR
AL
CH
ILD
....3
PA
RE
NTS
.....
......
....4
OTH
ER
S...
......
......
...5
H.H
HE
AD
......
......
...1
SP
OU
SE
......
......
......
2
NA
TUR
AL
CH
ILD
....3
PA
RE
NTS
.....
......
....4
OTH
ER
S...
......
......
...5
H.H
HE
AD
......
......
...1
SP
OU
SE
......
......
......
2
NA
TUR
AL
CH
ILD
....3
PA
RE
NTS
.....
......
....4
OTH
ER
S...
......
......
...5
H.H
HE
AD
......
......
....1
SP
OU
SE
......
......
......
2
NA
TUR
AL
CH
ILD
.....3
PA
RE
NTS
....
......
.....4
OTH
ER
S...
......
......
...5
H.H
HE
AD
......
......
....1
SP
OU
SE
......
......
......
2
NA
TUR
AL
CH
ILD
....3
PA
RE
NTS
.....
......
....4
OTH
ER
S...
......
......
...5
3.
Is
[NA
ME
] m
ale
of
fem
ale?
M
ALE
......
......
......
.....
1
FEM
ALE
......
......
......
2
MA
LE...
......
......
......
..1
FEM
ALE
......
......
......
2
MA
LE...
......
......
......
..1
FEM
ALE
......
......
......
2
MA
LE...
......
......
......
..1
FEM
ALE
......
......
......
2
MA
LE...
......
......
......
..1
FEM
ALE
......
......
......
.2
MA
LE...
......
......
......
..1
FEM
ALE
......
......
......
2
4.
In w
hat s
olar
cal
enda
r m
onth
and
yea
r w
as
[NA
ME
] bor
n?
MO
NTH
YE
AR
Q
6
NO
T ST
ATED
YEA
R 9
998
MO
NTH
YE
AR
Q
6
NO
T ST
ATED
YEA
R 9
998
MO
NTH
YE
AR
Q
6
NO
T ST
ATED
YEA
R 9
998
MO
NTH
YE
AR
Q
6
NO
T ST
ATED
YEA
R 9
998
MO
NTH
YE
AR
Q
6
NO
T ST
ATED
YEA
R 9
998
MO
NTH
YE
AR
Q
6
NO
T ST
ATED
YEA
R 9
998
5.
At
pres
ent,
wha
t is
[N
AM
E]’s
ag
e as
of
hi
s/he
r las
t birt
hday
?
IF
AG
E I
S 95
YE
AR
S
OR
M
OR
E, W
RIT
E ‘9
5’
AG
E
AG
E
AG
E
AG
E
AG
E
AG
E
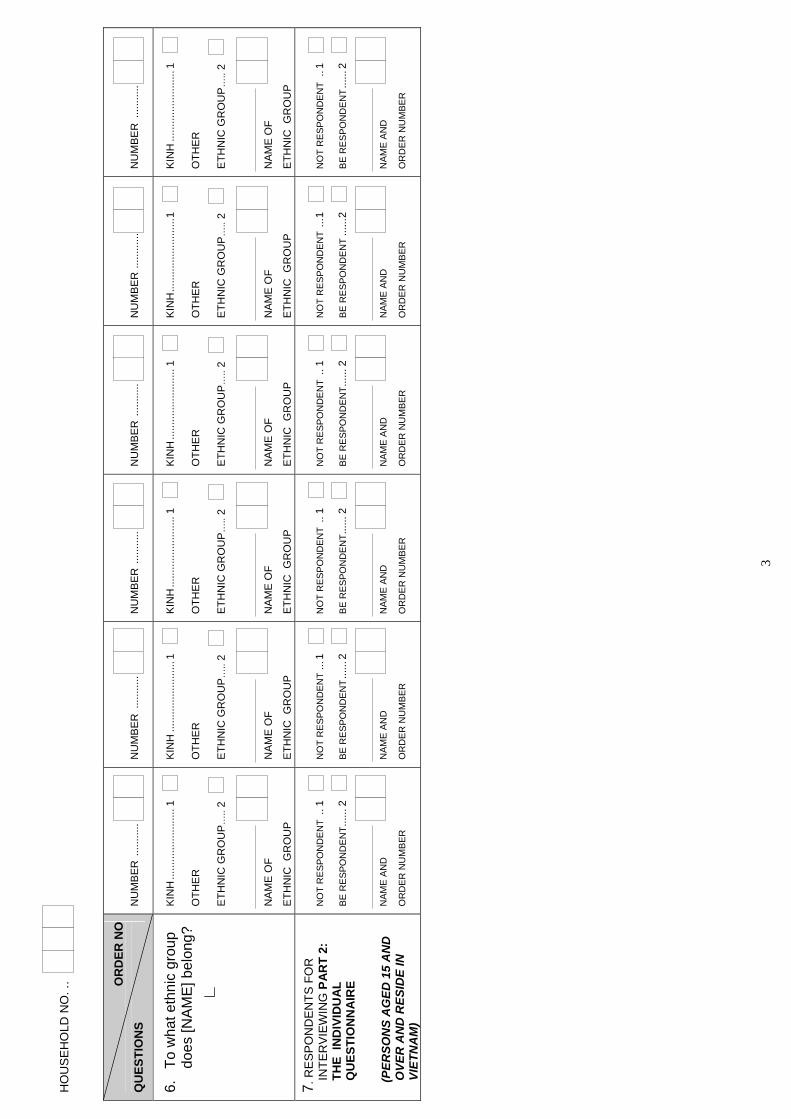
3
HO
US
EH
OLD
NO
. ..
O
RD
ER N
O
QU
ESTI
ON
S
NU
MB
ER
....
......
.
NU
MB
ER
....
......
.
NU
MB
ER
....
......
.
NU
MB
ER
....
......
.
NU
MB
ER
.....
......
.
NU
MB
ER
....
......
.
6.
To w
hat e
thni
c gr
oup
does
[NA
ME
] bel
ong?
KIN
H...
......
......
......
...1
OTH
ER
ETH
NIC
GR
OU
P…
.. 2
NA
ME
OF
ETH
NIC
GR
OU
P
KIN
H...
......
......
......
...1
OTH
ER
ETH
NIC
GR
OU
P…
.. 2
NA
ME
OF
ETH
NIC
GR
OU
P
KIN
H...
......
......
......
...1
OTH
ER
ETH
NIC
GR
OU
P…
.. 2
NA
ME
OF
ETH
NIC
GR
OU
P
KIN
H...
......
......
......
...1
OTH
ER
ETH
NIC
GR
OU
P…
.. 2
NA
ME
OF
ETH
NIC
GR
OU
P
KIN
H...
......
......
......
....1
OTH
ER
ETH
NIC
GR
OU
P…
.. 2
NA
ME
OF
ETH
NIC
GR
OU
P
KIN
H...
......
......
......
...1
OTH
ER
ETH
NIC
GR
OU
P…
.. 2
NA
ME
OF
ETH
NIC
GR
OU
P
7. R
ES
PO
ND
EN
TS F
OR
IN
TER
VIE
WIN
G P
AR
T 2:
TH
E IN
DIV
IDU
AL
QU
ESTI
ON
NA
IRE
(PER
SON
S A
GED
15
AN
D
OVE
R A
ND
RES
IDE
IN
VIET
NA
M)
NO
T R
ESPO
ND
ENT
..1
BE R
ESPO
ND
ENT.
.....
2
NAM
E AN
D
OR
DER
NU
MBE
R
NO
T R
ESPO
ND
ENT
...1
BE R
ESPO
ND
ENT
......
2
NAM
E AN
D
OR
DER
NU
MBE
R
NO
T R
ESPO
ND
ENT
..1
BE R
ESPO
ND
ENT.
.....
2
NAM
E AN
D
OR
DER
NU
MBE
R
NO
T R
ESPO
ND
ENT
..1
BE R
ESPO
ND
ENT.
.....
2
NAM
E AN
D
OR
DER
NU
MBE
R
NO
T R
ESPO
ND
ENT
...1
BE R
ESPO
ND
ENT
......
2
NAM
E AN
D
OR
DER
NU
MBE
R
NO
T R
ESPO
ND
ENT
..1
BE R
ESPO
ND
ENT
......
2
NAM
E AN
D
OR
DER
NU
MBE
R

4
PAR
T 2:
IND
IVID
UA
L Q
UES
TIO
NN
AIR
E
NA
ME
AN
D O
RD
ER N
O.
QU
ESTI
ON
S
____
____
____
____
____
___
____
____
____
____
____
___
____
____
____
____
____
__
____
____
____
____
____
___
8.
How
long
hav
e yo
u m
oved
fro
m
othe
r com
mun
e/w
ard/
tow
n to
this
ho
useh
old?
UN
DE
R 6
MO
NTH
S...
......
......
...1
6 TO
UN
DE
R 1
2 M
ON
THS
......
.2
12 M
ON
THS
AN
D O
VE
R...
......
.3
NO
MO
VE
ME
NT
......
......
......
.....
4
Q
11
UN
DE
R 6
MO
NTH
S...
......
......
...1
6 TO
UN
DE
R 1
2 M
ON
THS
......
.2
12 M
ON
THS
AN
D O
VE
R...
......
.3
NO
MO
VE
ME
NT
......
......
......
.....
4
Q
11
UN
DE
R 6
MO
NTH
S...
......
......
...1
6 TO
UN
DE
R 1
2 M
ON
THS
......
.2
12 M
ON
THS
AN
D O
VE
R...
......
.3
NO
MO
VE
ME
NT
......
......
......
.....
4
Q
11
UN
DE
R 6
MO
NTH
S...
......
......
....1
6 TO
UN
DE
R 1
2 M
ON
THS
......
..2
12 M
ON
THS
AN
D O
VE
R...
......
..3
NO
MO
VE
ME
NT
......
......
......
......
4
Q
11
9.
Is y
our
prev
ious
pla
ce o
f us
ual
resi
denc
e th
e w
ard/
tow
n or
co
mm
une?
WA
RD
/TO
WN
......
......
......
......
......
1
CO
MM
UN
E...
......
......
......
......
......
.2
WA
RD
/TO
WN
......
......
......
......
......
1
CO
MM
UN
E...
......
......
......
......
......
.2
WA
RD
/TO
WN
......
......
......
......
......
1
CO
MM
UN
E...
......
......
......
......
......
.2
WA
RD
/TO
WN
......
......
......
......
......
1
CO
MM
UN
E...
......
......
......
......
......
.2
10.
Wha
t w
as t
he m
ain
reas
on y
ou
mov
ed to
this
hou
seho
ld?
TO F
IND
WO
RK
......
......
......
......
...1
TO S
TAR
T A
NE
W J
OB
......
......
...2
CO
ME
BA
CK
HO
ME
DU
E T
O
LOS
T JO
B/E
ND
ED
JO
B/
C
OU
LD N
OT
FIN
D J
OB
......
..3
FOLL
OW
FA
MIL
Y/M
AR
RIE
D...
...4
SC
HO
OLI
NG
......
......
......
......
......
..5
OTH
ER
S__
____
____
____
____
6
(S
PE
CIF
Y)
TO F
IND
WO
RK
......
......
......
......
...1
TO S
TAR
T A
NE
W J
OB
......
......
...2
CO
ME
BA
CK
HO
ME
DU
E T
O
LOS
T JO
B/E
ND
ED
JO
B/
C
OU
LD N
OT
FIN
D J
OB
......
..3
FOLL
OW
FA
MIL
Y/M
AR
RIE
D...
...4
SC
HO
OLI
NG
......
......
......
......
......
..5
OTH
ER
S__
____
____
____
____
_6
(SP
EC
IFY)
TO F
IND
WO
RK
......
......
......
......
..1
TO S
TAR
T A
NE
W J
OB
......
......
..2
CO
ME
BA
CK
HO
ME
DU
E T
O
LOS
T JO
B/E
ND
ED
JO
B/
C
OU
LD N
OT
FIN
D J
OB
......
.3
FOLL
OW
FA
MIL
Y/M
AR
RIE
D...
...4
SC
HO
OLI
NG
......
......
......
......
......
.5
OTH
ER
S__
____
____
____
____
6
(S
PE
CIF
Y)
11. A
t pre
sent
, are
you
cur
rent
ly
atte
ndin
g an
y sc
hool
s/cl
asse
s fro
m 3
mon
ths
and
over
?
YES
......
......
......
......
......
.1
NO
......
......
......
......
......
...2
Q13
YES
......
......
......
......
......
.1
NO
......
......
......
......
......
...2
Q13
YES
......
......
......
......
......
.1
NO
......
......
......
......
......
...2
Q13
YES
......
......
......
......
......
.1
NO
......
......
......
......
......
...2
Q13
12. W
hat i
s th
e gr
ade
of
educ
atio
n/tra
inin
g th
at y
ou a
re
curr
ently
atte
ndin
g?
A
BB
REV
IATI
ON
:
VO
C. -
VO
CA
TIO
NA
L
PR
E-S
CH
OO
L...
......
......
......
......
.01
PR
IMA
RY
......
......
......
......
......
......
02
LOW
ER
SE
CO
ND
AR
Y...
......
......
03
SH
OR
T-TE
RM
TR
AIN
ING
......
....0
4
HIG
HE
R S
EC
ON
DA
RY
......
......
..05
TRA
DE
VO
C. S
CH
OO
L...
......
.....0
6
VO
C. S
CH
OO
L...
......
......
......
......
07
TRA
DE
CO
LLE
GE
......
......
......
....0
8
CO
LLE
GE
......
......
......
......
......
.....0
9
UN
IVE
RS
ITY
AN
D O
VE
R...
......
..10
PR
E-S
CH
OO
L....
......
......
......
......
.01
PR
IMA
RY
......
......
......
......
......
......
02
LOW
ER
SE
CO
ND
AR
Y...
......
......
03
SH
OR
T-TE
RM
TR
AIN
ING
......
....0
4
HIG
HE
R S
EC
ON
DA
RY
......
......
...05
TRA
DE
VO
C. S
CH
OO
L...
......
.....0
6
VO
C. S
CH
OO
L...
......
......
......
......
07
TRA
DE
CO
LLE
GE
......
......
......
....0
8
CO
LLE
GE
......
......
......
......
......
.....0
9
UN
IVE
RS
ITY
AN
D O
VE
R...
......
..10
PR
E-S
CH
OO
L...
......
......
......
......
.01
PR
IMA
RY
......
......
......
......
......
......
02
LOW
ER
SE
CO
ND
AR
Y...
......
......
03
SH
OR
T-TE
RM
TR
AIN
ING
......
....0
4
HIG
HE
R S
EC
ON
DA
RY
......
......
..05
TRA
DE
VO
C. S
CH
OO
L...
......
.....0
6
VO
C. S
CH
OO
L...
......
......
......
......
07
TRA
DE
CO
LLE
GE
......
......
......
....0
8
CO
LLE
GE
......
......
......
......
......
.....0
9
UN
IVE
RS
ITY
AN
D O
VE
R...
......
..10
PR
E-S
CH
OO
L...
......
......
......
......
.01
PR
IMA
RY
......
......
......
......
......
......
02
LOW
ER
SE
CO
ND
AR
Y...
......
......
03
SH
OR
T-TE
RM
TR
AIN
ING
......
....0
4
HIG
HE
R S
EC
ON
DA
RY
......
......
..05
TRA
DE
VO
C. S
CH
OO
L....
......
....0
6
VO
C. S
CH
OO
L...
......
......
......
......
07
TRA
DE
CO
LLE
GE
......
......
......
....0
8
CO
LLE
GE
......
......
......
......
......
.....
09
UN
IVE
RS
ITY
AN
D O
VE
R...
......
..10
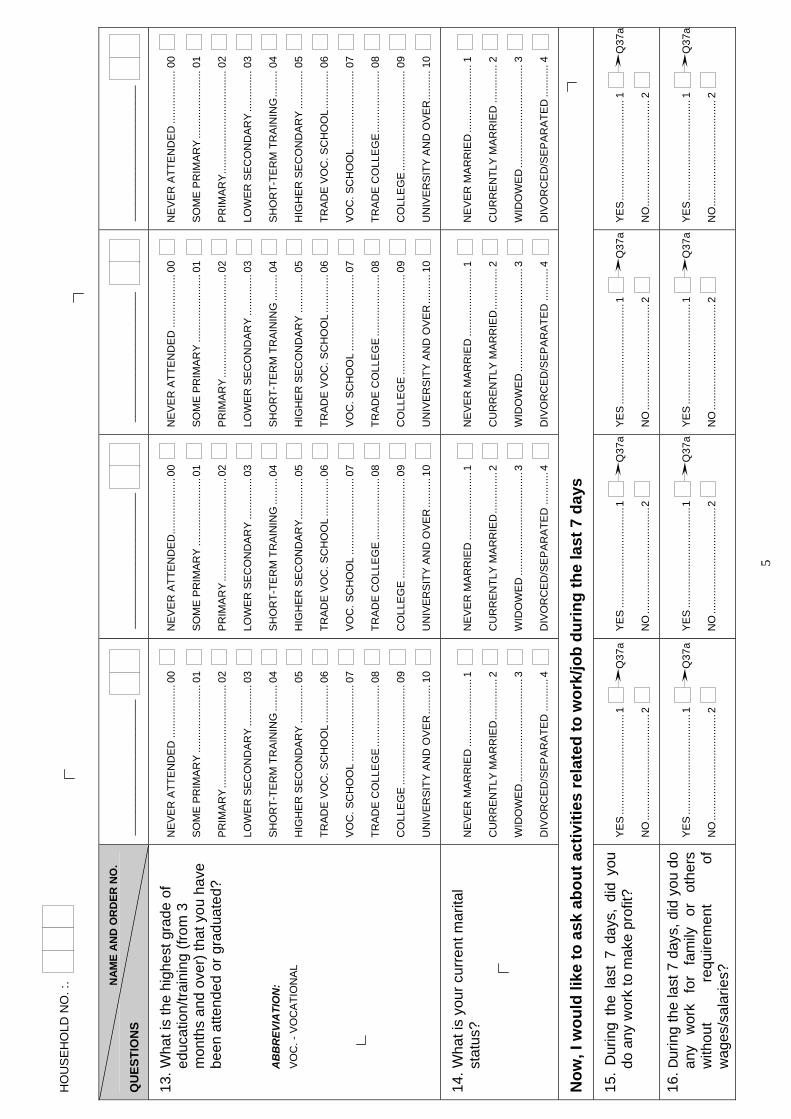
5
HO
US
EH
OLD
NO
. :.
N
AM
E A
ND
OR
DER
NO
.
QU
ESTI
ON
S
____
____
____
____
____
___
____
____
____
____
____
___
____
____
____
____
____
__
____
____
____
____
____
___
13. W
hat i
s th
e hi
ghes
t gra
de o
f ed
ucat
ion/
train
ing
(from
3
mon
ths
and
over
) tha
t you
hav
e be
en a
ttend
ed o
r gra
duat
ed?
AB
BR
EVIA
TIO
N:
V
OC
. - V
OC
ATI
ON
AL
NE
VE
R A
TTE
ND
ED
......
......
......
00
SO
ME
PR
IMA
RY
......
......
......
.....
01
PR
IMA
RY
......
......
......
......
......
.....
02
LOW
ER
SE
CO
ND
AR
Y...
......
.....
03
SH
OR
T-TE
RM
TR
AIN
ING
......
...04
HIG
HE
R S
EC
ON
DA
RY
......
......
.05
TRA
DE
VO
C. S
CH
OO
L...
......
....0
6
VO
C. S
CH
OO
L...
......
......
......
.....
07
TRA
DE
CO
LLE
GE
......
......
......
...08
CO
LLE
GE
......
......
......
......
......
....0
9
UN
IVE
RS
ITY
AN
D O
VE
R...
......
.10
NE
VE
R A
TTE
ND
ED
......
......
......
.00
SO
ME
PR
IMA
RY
......
......
......
.....
01
PR
IMA
RY
......
......
......
......
......
.....
02
LOW
ER
SE
CO
ND
AR
Y...
......
.....
03
SH
OR
T-TE
RM
TR
AIN
ING
......
...04
HIG
HE
R S
EC
ON
DA
RY
......
......
..05
TRA
DE
VO
C. S
CH
OO
L...
......
....0
6
VO
C. S
CH
OO
L...
......
......
......
.....
07
TRA
DE
CO
LLE
GE
......
......
......
...08
CO
LLE
GE
......
......
......
......
......
....0
9
UN
IVE
RS
ITY
AN
D O
VE
R...
......
.10
NE
VE
R A
TTE
ND
ED
......
......
......
00
SO
ME
PR
IMA
RY
......
......
......
.....
01
PR
IMA
RY
......
......
......
......
......
.....
02
LOW
ER
SE
CO
ND
AR
Y...
......
.....
03
SH
OR
T-TE
RM
TR
AIN
ING
......
...04
HIG
HE
R S
EC
ON
DA
RY
......
......
.05
TRA
DE
VO
C. S
CH
OO
L...
......
....0
6
VO
C. S
CH
OO
L...
......
......
......
.....
07
TRA
DE
CO
LLE
GE
......
......
......
...08
CO
LLE
GE
......
......
......
......
......
....0
9
UN
IVE
RS
ITY
AN
D O
VE
R...
......
.10
NE
VE
R A
TTE
ND
ED
......
......
......
00
SO
ME
PR
IMA
RY
......
......
......
.....
01
PR
IMA
RY
......
......
......
......
......
.....
02
LOW
ER
SE
CO
ND
AR
Y...
......
.....
03
SH
OR
T-TE
RM
TR
AIN
ING
......
...04
HIG
HE
R S
EC
ON
DA
RY
......
......
.05
TRA
DE
VO
C. S
CH
OO
L....
......
...06
VO
C. S
CH
OO
L...
......
......
......
.....
07
TRA
DE
CO
LLE
GE
......
......
......
...08
CO
LLE
GE
......
......
......
......
......
....0
9
UN
IVE
RS
ITY
AN
D O
VE
R...
......
.10
14. W
hat i
s yo
ur c
urre
nt m
arita
l st
atus
?
NE
VE
R M
AR
RIE
D...
......
......
......
..1
CU
RR
EN
TLY
MA
RR
IED
......
......
..2
WID
OW
ED
......
......
......
......
......
.....
3
DIV
OR
CE
D/S
EP
AR
ATE
D...
......
..4
NE
VE
R M
AR
RIE
D...
......
......
......
..1
CU
RR
EN
TLY
MA
RR
IED
......
......
..2
WID
OW
ED
......
......
......
......
......
.....
3
DIV
OR
CE
D/S
EP
AR
ATE
D...
......
..4
NE
VE
R M
AR
RIE
D...
......
......
......
..1
CU
RR
EN
TLY
MA
RR
IED
......
......
..2
WID
OW
ED
......
......
......
......
......
.....
3
DIV
OR
CE
D/S
EP
AR
ATE
D...
......
..4
NE
VE
R M
AR
RIE
D...
......
......
......
..1
CU
RR
EN
TLY
MA
RR
IED
......
......
.2
WID
OW
ED
......
......
......
......
......
.....
3
DIV
OR
CE
D/S
EP
AR
ATE
D...
......
..4
Now
, I w
ould
like
to a
sk a
bout
act
iviti
es re
late
d to
wor
k/jo
b du
ring
the
last
7 d
ays
15.
Dur
ing
the
last
7 d
ays,
did
you
do
any
wor
k to
mak
e pr
ofit?
YE
S...
......
......
......
......
......
.1
Q
37a
NO
......
......
......
......
......
......
2
YES
......
......
......
......
......
....1
Q37
a
NO
......
......
......
......
......
......
2
YES
......
......
......
......
......
....1
Q37
a
NO
......
......
......
......
......
......
2
YES
......
......
......
......
......
....1
Q37
a
NO
......
......
......
......
......
......
2
16. D
urin
g th
e la
st 7
day
s, d
id y
ou d
o an
y w
ork
for
fam
ily
or
othe
rs
with
out
requ
irem
ent
of
wag
es/s
alar
ies?
YES
......
......
......
......
......
....1
Q37
a
NO
......
......
......
......
......
......
2
YES
......
......
......
......
......
....1
Q37
a
NO
......
......
......
......
......
......
2
YES
......
......
......
......
......
....1
Q37
a
NO
......
......
......
......
......
......
2
YES
......
......
......
......
......
....1
Q37
a
NO
......
......
......
......
......
......
2

6
NA
ME
AN
D O
RD
ER N
O.
QU
ESTI
ON
S
____
____
____
____
____
___
____
____
____
____
____
___
____
____
____
____
____
__
____
____
____
____
____
___
17.
Alth
ough
you
did
not
wor
k du
ring
the
last
7 d
ays,
did
you
still
rece
ive
sala
ries/
wag
es f
rom
you
r pr
evio
us
wor
k or
pro
fits
from
you
r pr
evio
us
busi
ness
-pro
duct
ion
activ
ity?
AB
BR
EVIA
TIO
N: B
US
I-PR
OD
- B
US
INE
SS
-P
RO
DU
CTI
ON
AC
TIV
ITY
PA
ID S
ALA
RIE
S/W
AG
ES
:
+ FR
OM
WO
RK
......
......
.1
Q
19
+ FR
OM
BU
SI-P
RO
D...
.2
Q
37b
NO
......
......
......
......
......
......
3
PA
ID S
ALA
RIE
S/W
AG
ES
:
+ FR
OM
WO
RK
......
......
.1
Q
19
+ FR
OM
BU
SI-P
RO
D...
.2
Q
37b
NO
......
......
......
......
......
......
3
PA
ID S
ALA
RIE
S/W
AG
ES
:
+ FR
OM
WO
RK
......
......
.1
Q
19
+ FR
OM
BU
SI-P
RO
D...
.2
Q
37b
NO
......
......
......
......
......
......
3
PA
ID S
ALA
RIE
S/W
AG
ES
:
+ FR
OM
WO
RK
......
......
1
Q
19
+ FR
OM
BU
SI-P
RO
D...
2
Q
37b
NO
......
......
......
......
......
......
3
18.
Did
yo
u ha
ve
a jo
b or
th
e bu
sine
ss-p
rodu
ctio
n ac
tivity
to
re
turn
to
w
ork
afte
r te
mpo
rary
ab
senc
e fro
m w
ork?
A
BB
REV
IATI
ON
: BU
SI-P
RO
D -
BU
SIN
ES
S-
PR
OD
UC
TIO
N A
CTI
VIT
Y
A J
OB
......
......
......
......
......
.1
A B
US
I-PR
OD
......
......
......
2
Q
20
NO
......
......
......
......
......
......
3
Q
21
A J
OB
......
......
......
......
......
.1
A B
US
I-PR
OD
......
......
......
2
Q
20
NO
......
......
......
......
......
......
3
Q
21
A J
OB
......
......
......
......
......
.1
A B
US
I-PR
OD
......
......
......
2
Q
20
NO
......
......
......
......
......
......
3
Q
21
A J
OB
......
......
......
......
......
.1
A B
US
I-PR
OD
......
......
......
2
Q
20
NO
......
......
......
......
......
......
3
Q
21
19.
Wha
t is
the
mai
n re
ason
that
you
w
ere
tem
pora
rily
abse
nt
from
w
ork
durin
g th
e la
st 7
day
s?
PE
RS
ON
AL
MA
TTE
R...
......
......
1
SIC
KN
ES
S/P
RE
GN
AN
CY
......
..2
SC
HO
OLI
NG
/TR
AIN
ING
......
....3
WA
IT F
OR
JO
B/
DIS
MIS
SA
L...
......
......
......
.4
STR
IKE
/DE
MO
NS
TRA
TIO
N...
..5
WA
IT F
OR
SE
AS
ON
......
......
.....
6
PREP
ARAT
ION
FO
R A
NEW
JO
B..
7
OTH
ER
S__
____
____
____
___
8
(S
PE
CIF
Y)
Q37
b
PE
RS
ON
AL
MA
TTE
R...
......
......
1
SIC
KN
ES
S/P
RE
GN
AN
CY
......
..2
SC
HO
OLI
NG
/TR
AIN
ING
......
.....
3
WA
IT F
OR
JO
B/
DIS
MIS
SA
L...
......
......
......
.4
STR
IKE
/DE
MO
NS
TRA
TIO
N...
..5
WA
IT F
OR
SE
AS
ON
......
......
.....
6
PREP
ARAT
ION
FO
R A
NEW
JO
B..
7
OTH
ER
S__
____
____
____
___
8
(S
PE
CIF
Y)
Q37
b
PE
RS
ON
AL
MA
TTE
R...
......
......
1
SIC
KN
ES
S/P
RE
GN
AN
CY
......
..2
SC
HO
OLI
NG
/TR
AIN
ING
......
....3
WA
IT F
OR
JO
B/
DIS
MIS
SA
L...
......
......
......
.4
STR
IKE
/DE
MO
NS
TRA
TIO
N...
..5
WA
IT F
OR
SE
AS
ON
......
......
.....
6
PREP
ARAT
ION
FO
R A
NEW
JO
B..
7
OTH
ER
S__
____
____
____
___
8
(S
PE
CIF
Y)
Q37
b
PE
RS
ON
AL
MA
TTE
R...
......
......
.1
SIC
KN
ES
S/P
RE
GN
AN
CY
......
...2
SC
HO
OLI
NG
/TR
AIN
ING
......
.....3
WA
IT F
OR
JO
B/
DIS
MIS
SA
L....
......
......
......
.4
STR
IKE
/DE
MO
NS
TRA
TIO
N...
..5
WA
IT F
OR
SE
AS
ON
......
......
.....6
PREP
ARAT
ION
FO
R A
NEW
JO
B...
7
OTH
ER
S__
____
____
____
___
8
(S
PE
CIF
Y)
Q37
b
20. H
ence
, will
you
retu
rn to
wor
k fo
r ne
xt 3
0 da
ys?
YES
......
......
......
......
......
....1
Q37
b
NO
......
......
......
......
......
......
2
YES
......
......
......
......
......
....1
Q37
b
NO
......
......
......
......
......
......
2
YES
......
......
......
......
......
....1
Q37
b
NO
......
......
......
......
......
......
2
YES
......
......
......
......
......
....1
Q37
b
NO
......
......
......
......
......
......
2

7
HO
US
EH
OLD
NO
.:..
NA
ME
AN
D O
RD
ER N
O.
QU
ESTI
ON
S
____
____
____
____
____
___
____
____
____
____
____
___
____
____
____
____
____
__
____
____
____
____
____
___
21. D
urin
g th
e la
st 3
0 da
ys,
did
you
activ
ely
look
for a
ny w
ork?
YE
S...
......
......
......
......
......
.1
NO
......
......
......
......
......
......
2
Q
23
YES
......
......
......
......
......
....1
NO
......
......
......
......
......
......
2
Q
23
YES
......
......
......
......
......
....1
NO
......
......
......
......
......
......
2
Q
23
YES
......
......
......
......
......
....1
NO
......
......
......
......
......
......
2
Q
23
22. D
urin
g th
e la
st 3
0 da
ys, h
ow d
id
you
seek
wor
k or
app
ly fo
r a jo
b?
AB
BR
EVIA
TIO
N:
BU
SI-P
RO
D -
BU
SIN
ES
S-P
RO
DU
CTI
ON
A
CTI
VIT
Y
AP
PLI
ED
FO
R J
OB
S...
......
......
.....
1
CO
NTA
CTE
D/C
HE
CKE
D A
T
EM
PLO
YME
NT
SE
RV
ICE
......
......
.2
VIA
FRIE
ND
S AN
D R
ELAT
IVES
.....
3
PLAC
ED A
DVE
RTI
SEM
ENTS
......
..4
LOO
KE
D A
T A
DV
ERTI
SE
ME
NTS
OF
REC
RU
ITM
ENT
......
......
......
....5
PREP
ARAT
ION
FO
R S
ETT
ING
UP
A B
US
I-PR
OD
……
……
……
……
……
6
OTH
ERS
____
____
____
____
__7
( S
PE
CIF
Y)
Q24
AP
PLI
ED
FO
R J
OB
S...
......
......
.....
1
CO
NTA
CTE
D/C
HE
CKE
D A
T
EM
PLO
YME
NT
SE
RV
ICE
......
......
..2
VIA
FRIE
ND
S AN
D R
ELAT
IVES
.....
3
PLAC
ED A
DVE
RTI
SEM
ENTS
......
..4
LOO
KE
D A
T A
DV
ERTI
SE
ME
NTS
OF
REC
RU
ITM
ENT
......
......
......
....5
PREP
ARAT
ION
FO
R S
ETT
ING
UP
A B
US
I-PR
OD
……
……
……
……
……
6
OTH
ERS
____
____
____
____
__7
( S
PE
CIF
Y)
Q24
AP
PLI
ED
FO
R J
OB
S...
......
......
.....
1
CO
NTA
CTE
D/C
HE
CKE
D A
T
EM
PLO
YME
NT
SE
RV
ICE
......
......
.2
VIA
FRIE
ND
S AN
D R
ELAT
IVES
.....
3
PLAC
ED A
DVE
RTI
SEM
ENTS
......
..4
LOO
KE
D A
T A
DV
ERTI
SE
ME
NTS
OF
REC
RU
ITM
ENT
......
......
......
....5
PREP
ARAT
ION
FO
R S
ETT
ING
UP
A B
US
I-PR
OD
……
……
……
……
……
6
OTH
ERS
____
____
____
____
__7
( S
PE
CIF
Y)
Q24
AP
PLI
ED
FO
R J
OB
S...
......
......
......
1
CO
NTA
CTE
D/C
HE
CKE
D A
T
EM
PLO
YME
NT
SE
RV
ICE
......
......
..2
VIA
FRIE
ND
S AN
D R
ELAT
IVES
.....3
PLAC
ED A
DVE
RTI
SEM
ENTS
......
...4
LOO
KE
D A
T A
DV
ERTI
SE
ME
NTS
OF
REC
RU
ITM
ENT
......
......
......
.....5
PREP
ARAT
ION
FO
R S
ETT
ING
UP
A B
US
I-PR
OD
……
……
……
……
……
6
OTH
ERS
____
____
____
____
__7
( S
PE
CIF
Y)
Q24
23. W
hat i
s th
e m
ain
reas
on th
at y
ou
did
not
look
for
wor
k du
ring
the
last
30
days
?
DO
NO
T W
AN
T/N
EED
TO
WO
RK
...01
BE
LIE
VE N
O W
OR
K A
VAI
LABL
E/
NO
SU
ITA
BLE
WO
RK
......
......
......
..02
DO
N’T
KN
OW
WH
ERE
/HO
W...
.....
03
TEM
PO
RA
RIL
Y A
BSE
NT
DU
E T
O
CU
T D
OW
N O
R S
TOP
PR
OD
UC
TIO
N...
..04
WAI
T FO
R J
OB/
JOB
AP
PLI
CA
TIO
N R
ES
ULT
/ LA
UN
CH
ING
BU
SI-P
RO
D...
......
.....
05
WAI
T FO
R S
EA
SO
N...
......
......
......
.06
BAD
WEA
THER
......
......
......
......
....0
7
BU
SY
IN F
AM
ILY
CA
RE
/RE
STT
ING
08
TEM
PO
RA
RY
ILLN
ES
S...
......
......
..09
OTH
ERS
____
____
____
____
__10
(
SP
EC
IFY)
DO
NO
T W
AN
T/N
EED
TO
WO
RK
...01
BE
LIE
VE N
O W
OR
K A
VAI
LABL
E/
NO
SU
ITA
BLE
WO
RK
......
......
......
..02
DO
N’T
KN
OW
WH
ERE
/HO
W...
......
03
TEM
PO
RA
RIL
Y A
BSE
NT
DU
E T
O
CU
T D
OW
N O
R S
TOP
PR
OD
UC
TIO
N...
..04
WAI
T FO
R J
OB/
JOB
AP
PLI
CA
TIO
N R
ES
ULT
/ LA
UN
CH
ING
BU
SI-P
RO
D...
......
.....
05
WAI
T FO
R S
EA
SO
N...
......
......
......
.06
BAD
WEA
THER
......
......
......
......
....0
7
BUSY
IN F
AMIL
Y C
ARE/
RES
TTIN
G08
TEM
PO
RA
RY
ILLN
ES
S...
......
......
...09
OTH
ERS
____
____
____
____
__10
(
SP
EC
IFY)
DO
NO
T W
AN
T/N
EED
TO
WO
RK
...01
BE
LIE
VE N
O W
OR
K A
VAI
LABL
E/
NO
SU
ITA
BLE
WO
RK
......
......
......
..02
DO
N’T
KN
OW
WH
ERE
/HO
W...
......
03
TEM
PO
RA
RIL
Y A
BSE
NT
DU
E T
O
CU
T D
OW
N O
R S
TOP
PR
OD
UC
TIO
N...
..04
WAI
T FO
R J
OB/
JOB
AP
PLI
CA
TIO
N R
ES
ULT
/ LA
UN
CH
ING
BU
SI-P
RO
D...
......
.....
05
WAI
T FO
R S
EA
SO
N...
......
......
......
.06
BAD
WEA
THER
......
......
......
......
....0
7
BUSY
IN F
AMIL
Y C
ARE/
RES
TTIN
G08
TEM
PO
RA
RY
ILLN
ES
S...
......
......
..09
OTH
ERS
____
____
____
____
___
10
(
SP
EC
IFY)
DO
NO
T W
AN
T/N
EED
TO
WO
RK
...01
BE
LIE
VE N
O W
OR
K A
VAI
LABL
E/
NO
SU
ITA
BLE
WO
RK
......
......
......
.02
DO
N’T
KN
OW
WH
ERE
/HO
W...
.....
03
TEM
PO
RA
RIL
Y A
BSE
NT
DU
E T
O
CU
T D
OW
N O
R S
TOP
PR
OD
UC
TIO
N...
.04
WAI
T FO
R J
OB/
JOB
AP
PLI
CA
TIO
N R
ES
ULT
/ LA
UN
CH
ING
BU
SI-P
RO
D...
......
.....
05
WAI
T FO
R S
EA
SO
N...
......
......
......
.06
BAD
WEA
THER
......
......
......
......
....0
7
BUSY
IN F
AMIL
Y C
ARE/
RES
TTIN
G08
TEM
PO
RA
RY
ILLN
ES
S...
......
......
..09
OTH
ERS
____
____
____
____
__10
(
SP
EC
IFY)

8
N
AM
E A
ND
OR
DER
NO
. Q
UES
TIO
NS
____
____
____
____
____
___
____
____
____
____
____
___
____
____
____
____
____
__
____
____
____
____
____
___
24.
Wer
e yo
u av
aila
ble
for
wor
k im
med
iate
ly if
you
hav
e fo
und
a jo
b du
ring
the
last
7 d
ays?
YES
......
......
......
......
......
....1
Q26
NO
......
......
......
......
......
......
2
YES
......
......
......
......
......
....1
Q26
NO
......
......
......
......
......
......
2
YES
......
......
......
......
......
....1
Q26
NO
......
......
......
......
......
......
2
YES
......
......
......
......
......
....1
Q26
NO
......
......
......
......
......
......
2
25. W
hat i
s th
e m
ain
reas
on th
at y
ou
wer
e no
t av
aila
ble
for
wor
k im
med
iate
ly?
SC
HO
OLI
NG
/TR
AIN
ING
....
......
..1
BU
SY
IN F
AM
ILY
WO
RK
......
......
.2
OFF
SE
AS
ON
......
......
......
......
......
3
BA
D W
EA
THE
R...
......
......
......
......
4
HA
VIN
G A
RE
ST
......
......
......
......
.5
TEM
PO
RA
RY
ILLN
ES
S...
......
......
6
OTH
ER
S__
____
____
____
____
7
(S
PE
CIF
Y)
SC
HO
OLI
NG
/TR
AIN
ING
.....
......
..1
BU
SY
IN F
AM
ILY
WO
RK
......
......
.2
OFF
SE
AS
ON
......
......
......
......
......
3
BA
D W
EA
THE
R...
......
......
......
......
4
HA
VIN
G A
RE
ST.
......
......
......
......
.5
TEM
PO
RA
RY
ILLN
ES
S...
......
......
6
OTH
ER
S__
____
____
____
____
7
(S
PE
CIF
Y)
SC
HO
OLI
NG
/TR
AIN
ING
....
......
..1
BU
SY
IN F
AM
ILY
WO
RK
......
......
.2
OFF
SE
AS
ON
......
......
......
......
......
3
BA
D W
EA
THE
R...
......
......
......
......
4
HA
VIN
G A
RE
ST
......
......
......
......
.5
TEM
PO
RA
RY
ILLN
ES
S...
......
......
6
OTH
ER
S__
____
____
____
____
_7
(
SP
EC
IFY)
SC
HO
OLI
NG
/TR
AIN
ING
....
......
..1
BU
SY
IN F
AM
ILY
WO
RK
......
......
2
OFF
SE
AS
ON
......
......
......
......
......
3
BA
D W
EA
THE
R...
......
......
......
......
4
HA
VIN
G A
RE
ST
......
......
......
......
.5
TEM
PO
RA
RY
ILLN
ES
S...
......
.....
6
OTH
ER
S__
____
____
____
____
7
(S
PE
CIF
Y)
26. C
HE
CK
Q21
AN
D Q
24:
IF Q
21 =
2 A
ND
Q24
= 2
Q28
; O
THE
RW
ISE
Q27
27.
How
lon
g w
ere
you
look
ing
or
avai
labl
e fo
r wor
k?
UN
DE
R 3
MO
NTH
S...
......
......
......
1
3 TO
UN
DE
R 6
MO
NTH
S...
......
...2
6 TO
UN
DE
R 9
MO
NTH
S...
......
...3
9 TO
UN
DE
R 1
2 M
ON
THS
......
....4
12 M
ON
THS
AN
D O
VE
R...
......
....5
UN
DE
R 3
MO
NTH
S...
......
......
......
1
3 TO
UN
DE
R 6
MO
NTH
S...
......
...2
6 TO
UN
DE
R 9
MO
NTH
S...
......
...3
9 TO
UN
DE
R 1
2 M
ON
THS
......
....4
12 M
ON
THS
AN
D O
VE
R...
......
....5
UN
DE
R 3
MO
NTH
S...
......
......
......
1
3 TO
UN
DE
R 6
MO
NTH
S...
......
...2
6 TO
UN
DE
R 9
MO
NTH
S...
......
...3
9 TO
UN
DE
R 1
2 M
ON
THS
......
....4
12 M
ON
THS
AN
D O
VE
R...
......
....5
UN
DE
R 3
MO
NTH
S...
......
......
......
1
3 TO
UN
DE
R 6
MO
NTH
S...
......
...2
6 TO
UN
DE
R 9
MO
NTH
S...
......
...3
9 TO
UN
DE
R 1
2 M
ON
THS
......
....4
12 M
ON
THS
AN
D O
VE
R...
......
....5
28. W
hat i
s th
e m
ain
reas
on th
at y
ou
did
not
wor
k du
ring
the
last
7
days
?
STU
DE
NT/
PU
PIL
.....
......
......
......
.1
HO
US
EW
OR
K...
......
......
......
......
..2
DIS
AB
ILIT
Y...
......
......
......
......
......
.3
TOO
YO
UN
G/O
LD...
......
......
......
..4
OTH
ER
____
____
____
____
____
5
(S
PE
CIF
Y)
STU
DE
NT/
PU
PIL
....
......
......
......
..1
HO
US
EW
OR
K...
......
......
......
......
..2
DIS
AB
ILIT
Y...
......
......
......
......
......
.3
TOO
YO
UN
G/O
LD...
......
......
......
..4
OTH
ER
____
____
____
____
____
5
(S
PE
CIF
Y)
STU
DE
NT/
PU
PIL
.....
......
......
......
.1
HO
US
EW
OR
K...
......
......
......
......
..2
DIS
AB
ILIT
Y...
......
......
......
......
......
.3
TOO
YO
UN
G/O
LD...
......
......
......
..4
OTH
ER
____
____
____
____
____
5
(S
PE
CIF
Y)
STU
DE
NT/
PU
PIL
.....
......
......
......
.1
HO
US
EW
OR
K...
......
......
......
......
..2
DIS
AB
ILIT
Y...
......
......
......
......
......
.3
TOO
YO
UN
G/O
LD...
......
......
......
..4
OTH
ER
____
____
____
____
___
5
(S
PE
CIF
Y)
29. H
ave
you
ever
wor
ked
yet?
W
OR
KE
D...
......
......
......
....1
NE
VE
R...
......
......
......
......
..2
Q80
WO
RK
ED
......
......
......
......
.1
NE
VE
R...
......
......
......
......
..2
Q
80
WO
RK
ED
......
......
......
......
.1
NE
VE
R...
......
......
......
......
..2
Q
80
WO
RK
ED
......
......
......
......
.1
NE
VE
R...
......
......
......
......
..2
Q80
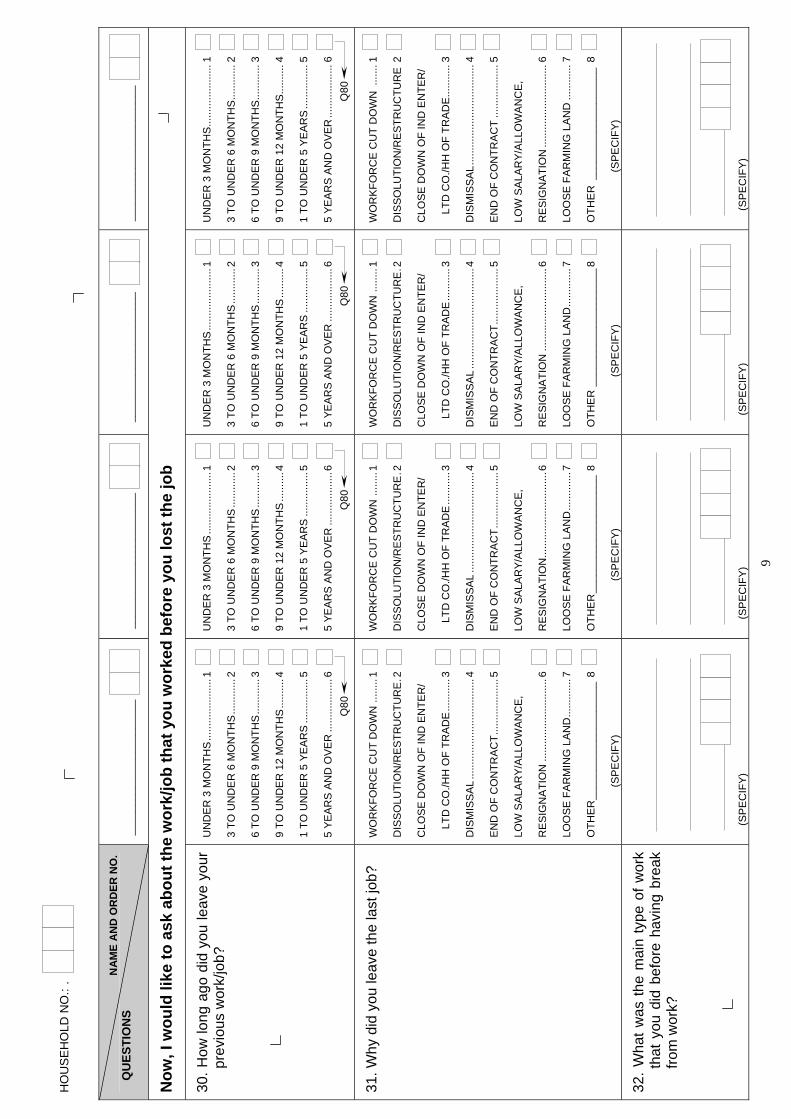
9
HO
US
EH
OLD
NO
.: .
NA
ME
AN
D O
RD
ER N
O.
QU
ESTI
ON
S
____
____
____
____
____
___
____
____
____
____
____
___
____
____
____
____
____
__
____
____
____
____
____
___
Now
, I w
ould
like
to a
sk a
bout
the
wor
k/jo
b th
at y
ou w
orke
d be
fore
you
lost
the
job
30. H
ow lo
ng a
go d
idyo
u le
ave
your
pr
evio
us w
ork/
job?
UN
DE
R 3
MO
NTH
S...
......
......
......
1
3 TO
UN
DE
R 6
MO
NTH
S...
......
...2
6 TO
UN
DE
R 9
MO
NTH
S...
......
...3
9 TO
UN
DE
R 1
2 M
ON
THS
......
....4
1 TO
UN
DE
R 5
YE
AR
S...
......
......
5
5 YE
AR
S A
ND
OV
ER
......
......
......
6
Q80
UN
DE
R 3
MO
NTH
S...
......
......
......
1
3 TO
UN
DE
R 6
MO
NTH
S...
......
...2
6 TO
UN
DE
R 9
MO
NTH
S...
......
...3
9 TO
UN
DE
R 1
2 M
ON
THS
......
....4
1 TO
UN
DE
R 5
YE
AR
S...
......
......
5
5 YE
AR
S A
ND
OV
ER
......
......
......
6
Q80
UN
DE
R 3
MO
NTH
S...
......
......
......
1
3 TO
UN
DE
R 6
MO
NTH
S...
......
...2
6 TO
UN
DE
R 9
MO
NTH
S...
......
...3
9 TO
UN
DE
R 1
2 M
ON
THS
......
....4
1 TO
UN
DE
R 5
YE
AR
S...
......
......
5
5 YE
AR
S A
ND
OV
ER
......
......
......
6
Q80
UN
DE
R 3
MO
NTH
S...
......
......
......
1
3 TO
UN
DE
R 6
MO
NTH
S...
......
...2
6 TO
UN
DE
R 9
MO
NTH
S...
......
...3
9 TO
UN
DE
R 1
2 M
ON
THS
......
....4
1 TO
UN
DE
R 5
YE
AR
S...
......
......
5
5 YE
AR
S A
ND
OV
ER
......
......
......
6
Q80
31. W
hy d
id y
ou le
ave
the
last
job?
WO
RK
FOR
CE
CU
T D
OW
N ..
......
1
DIS
SO
LUTI
ON
/RE
STR
UC
TUR
E.2
CLO
SE
DO
WN
OF
IND
EN
TER
/
LTD
CO
./HH
OF
TRA
DE
......
.....
3
DIS
MIS
SA
L...
......
......
......
......
......
.4
EN
D O
F C
ON
TRA
CT.
......
......
......
5
LOW
SA
LAR
Y/A
LLO
WA
NC
E,
RE
SIG
NA
TIO
N...
......
......
......
......
.6
LOO
SE
FA
RM
ING
LA
ND
......
......
.7
OTH
ER
____
____
____
____
____
8
(
SP
EC
IFY)
WO
RK
FOR
CE
CU
T D
OW
N ..
......
1
DIS
SO
LUTI
ON
/RE
STR
UC
TUR
E.2
CLO
SE
DO
WN
OF
IND
EN
TER
/
LTD
CO
./HH
OF
TRA
DE
......
.....
3
DIS
MIS
SA
L...
......
......
......
......
......
.4
EN
D O
F C
ON
TRA
CT
......
......
......
.5
LOW
SA
LAR
Y/A
LLO
WA
NC
E,
RE
SIG
NA
TIO
N...
......
......
......
......
..6
LOO
SE
FA
RM
ING
LA
ND
......
......
.7
OTH
ER
____
____
____
____
____
8
(
SP
EC
IFY)
WO
RK
FOR
CE
CU
T D
OW
N ..
......
1
DIS
SO
LUTI
ON
/RE
STR
UC
TUR
E.2
CLO
SE
DO
WN
OF
IND
EN
TER
/
LTD
CO
./HH
OF
TRA
DE
......
.....
3
DIS
MIS
SA
L...
......
......
......
......
......
.4
EN
D O
F C
ON
TRA
CT.
......
......
......
5
LOW
SA
LAR
Y/A
LLO
WA
NC
E,
RE
SIG
NA
TIO
N...
......
......
......
......
.6
LOO
SE
FA
RM
ING
LA
ND
......
......
.7
OTH
ER
____
____
____
____
____
8
(
SP
EC
IFY)
WO
RK
FOR
CE
CU
T D
OW
N .
......
1
DIS
SO
LUTI
ON
/RE
STR
UC
TUR
E2
CLO
SE
DO
WN
OF
IND
EN
TER
/
LTD
CO
./HH
OF
TRA
DE
......
.....
3
DIS
MIS
SA
L....
......
......
......
......
......
4
EN
D O
F C
ON
TRA
CT
......
......
......
5
LOW
SA
LAR
Y/A
LLO
WA
NC
E,
RE
SIG
NA
TIO
N...
......
......
......
......
.6
LOO
SE
FA
RM
ING
LA
ND
......
......
7
OTH
ER
____
____
____
____
___
8
(
SP
EC
IFY)
32. W
hat w
as th
e m
ain
type
of w
ork
that
you
did
bef
ore
havi
ng b
reak
fro
m w
ork?
(S
PE
CIF
Y)
(S
PE
CIF
Y)
(S
PE
CIF
Y)
(S
PE
CIF
Y)
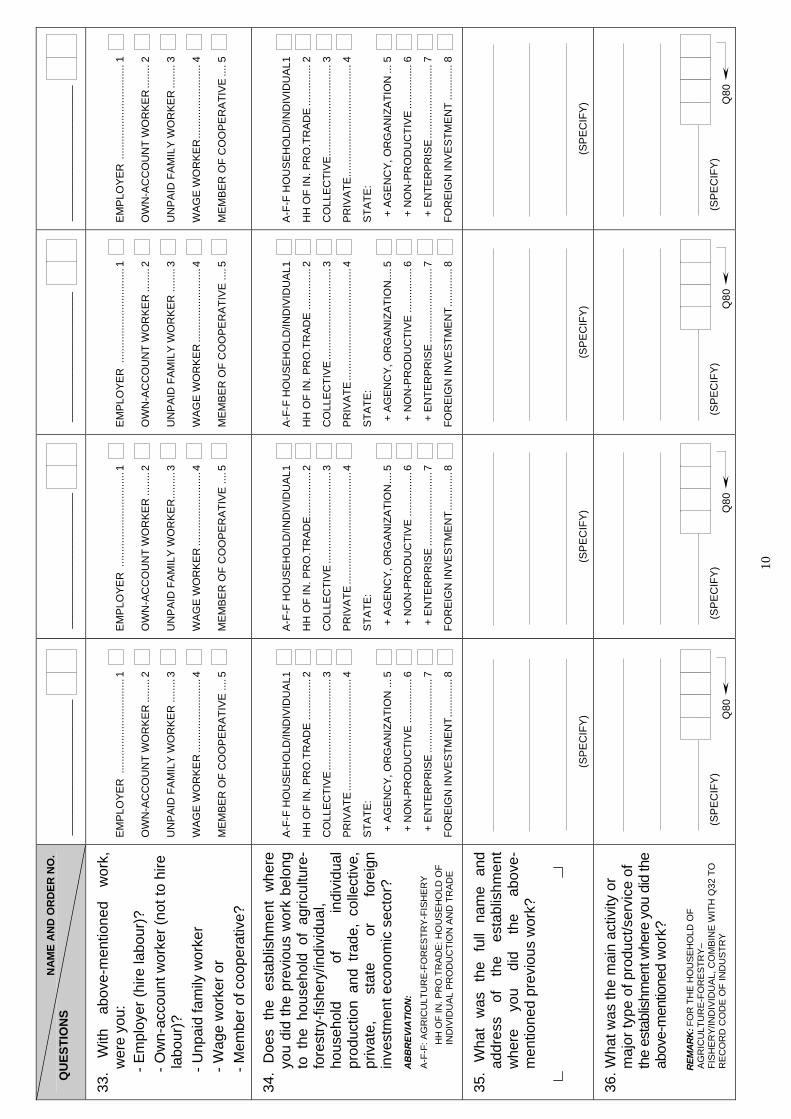
10
N
AM
E A
ND
OR
DER
NO
. Q
UES
TIO
NS
____
____
____
____
____
___
____
____
____
____
____
___
____
____
____
____
____
__
____
____
____
____
____
___
33.
With
ab
ove-
men
tione
d w
ork,
w
ere
you:
- E
mpl
oyer
(hire
labo
ur)?
- O
wn-
acco
unt w
orke
r (no
t to
hire
la
bour
)?
-
Unp
aid
fam
ily w
orke
r
- W
age
wor
ker o
r
- M
embe
r of c
oope
rativ
e?
EM
PLO
YER
....
......
......
......
......
....1
OW
N-A
CC
OU
NT
WO
RK
ER
......
..2
UN
PA
ID F
AM
ILY
WO
RK
ER
......
..3
WA
GE
WO
RK
ER
......
......
......
......
.4
ME
MB
ER
OF
CO
OP
ER
ATI
VE
....5
EM
PLO
YER
....
......
......
......
......
....1
OW
N-A
CC
OU
NT
WO
RK
ER
......
..2
UN
PA
ID F
AM
ILY
WO
RK
ER
......
...3
WA
GE
WO
RK
ER
......
......
......
......
.4
ME
MB
ER
OF
CO
OP
ER
ATI
VE
....5
EM
PLO
YER
....
......
......
......
......
....1
OW
N-A
CC
OU
NT
WO
RK
ER
......
..2
UN
PA
ID F
AM
ILY
WO
RK
ER
......
..3
WA
GE
WO
RK
ER
......
......
......
......
.4
ME
MB
ER
OF
CO
OP
ER
ATI
VE
....5
EM
PLO
YER
....
......
......
......
......
....1
OW
N-A
CC
OU
NT
WO
RK
ER
......
..2
UN
PA
ID F
AM
ILY
WO
RK
ER
......
..3
WA
GE
WO
RK
ER
......
......
......
......
.4
ME
MB
ER
OF
CO
OP
ER
ATI
VE
....5
34.
Doe
s th
e es
tabl
ishm
ent
whe
re
you
did
the
prev
ious
wor
k be
long
to
the
hou
seho
ld o
f ag
ricul
ture
-fo
rest
ry-fi
sher
y/in
divi
dual
, ho
useh
old
of
indi
vidu
al
prod
uctio
n an
d tra
de,
colle
ctiv
e,
priv
ate,
st
ate
or
fore
ign
inve
stm
ent e
cono
mic
sec
tor?
AB
BR
EVIA
TIO
N:
A-
F-F:
AG
RIC
ULT
UR
E-FO
RES
TRY-
FIS
HER
Y
HH
OF
IN. P
RO
.TR
AD
E: H
OU
SE
HO
LD O
F IN
DIV
IDU
AL P
RO
DU
CTI
ON
AN
D T
RAD
E
A-F
-F H
OU
SE
HO
LD/IN
DIV
IDU
AL1
HH
OF
IN. P
RO
.TR
AD
E...
......
.....
2
CO
LLE
CTI
VE
......
......
......
......
......
.3
PR
IVA
TE...
......
......
......
......
......
.....
4
STA
TE:
+ A
GE
NC
Y, O
RG
AN
IZA
TIO
N...
5
+ N
ON
-PR
OD
UC
TIV
E...
......
......
6
+ E
NTE
RP
RIS
E...
......
......
......
....7
FOR
EIG
N IN
VE
STM
EN
T....
......
...8
A-F
-F H
OU
SE
HO
LD/IN
DIV
IDU
AL1
HH
OF
IN. P
RO
.TR
AD
E...
......
......
2
CO
LLE
CTI
VE
......
......
......
......
......
.3
PR
IVA
TE...
......
......
......
......
......
.....
4
STA
TE:
+ A
GE
NC
Y, O
RG
AN
IZA
TIO
N...
.5
+ N
ON
-PR
OD
UC
TIV
E...
......
......
6
+ E
NTE
RP
RIS
E...
......
......
......
....7
FOR
EIG
N IN
VE
STM
EN
T...
......
....8
A-F
-F H
OU
SE
HO
LD/IN
DIV
IDU
AL1
HH
OF
IN. P
RO
.TR
AD
E...
......
.....
2
CO
LLE
CTI
VE
......
......
......
......
......
.3
PR
IVA
TE...
......
......
......
......
......
.....
4
STA
TE:
+ A
GE
NC
Y, O
RG
AN
IZA
TIO
N...
.5
+ N
ON
-PR
OD
UC
TIV
E...
......
......
6
+ E
NTE
RP
RIS
E...
......
......
......
....7
FOR
EIG
N IN
VE
STM
EN
T....
......
...8
A-F
-F H
OU
SE
HO
LD/IN
DIV
IDU
AL1
HH
OF
IN. P
RO
.TR
AD
E...
......
.....
2
CO
LLE
CTI
VE
......
......
......
......
......
.3
PR
IVA
TE...
......
......
......
......
......
.....
4
STA
TE:
+ A
GE
NC
Y, O
RG
AN
IZA
TIO
N...
5
+ N
ON
-PR
OD
UC
TIV
E...
......
......
6
+ E
NTE
RP
RIS
E...
......
......
......
....7
FOR
EIG
N IN
VE
STM
EN
T...
......
...8
35.
Wha
t w
as
the
full
nam
e an
d ad
dres
s of
th
e es
tabl
ishm
ent
whe
re
you
did
the
abov
e-m
entio
ned
prev
ious
wor
k?
(S
PE
CIF
Y)
(S
PE
CIF
Y)
(S
PE
CIF
Y)
(S
PE
CIF
Y)
36. W
hat w
as th
e m
ain
activ
ity o
r m
ajor
type
of p
rodu
ct/s
ervi
ce o
f th
e es
tabl
ishm
ent w
here
you
did
the
abov
e-m
entio
ned
wor
k?
REM
AR
K: F
OR
TH
E H
OU
SEH
OLD
OF
AGR
ICU
LTU
RE-
FOR
ESTR
Y–FI
SH
ER
Y/IN
DIV
IDU
AL,
CO
MBI
NE
WIT
H Q
32 T
O
REC
OR
D C
OD
E O
F IN
DU
STR
Y
(S
PE
CIF
Y)
Q
80
(S
PE
CIF
Y)
Q
80
(S
PE
CIF
Y)
Q
80
(S
PE
CIF
Y)
Q
80
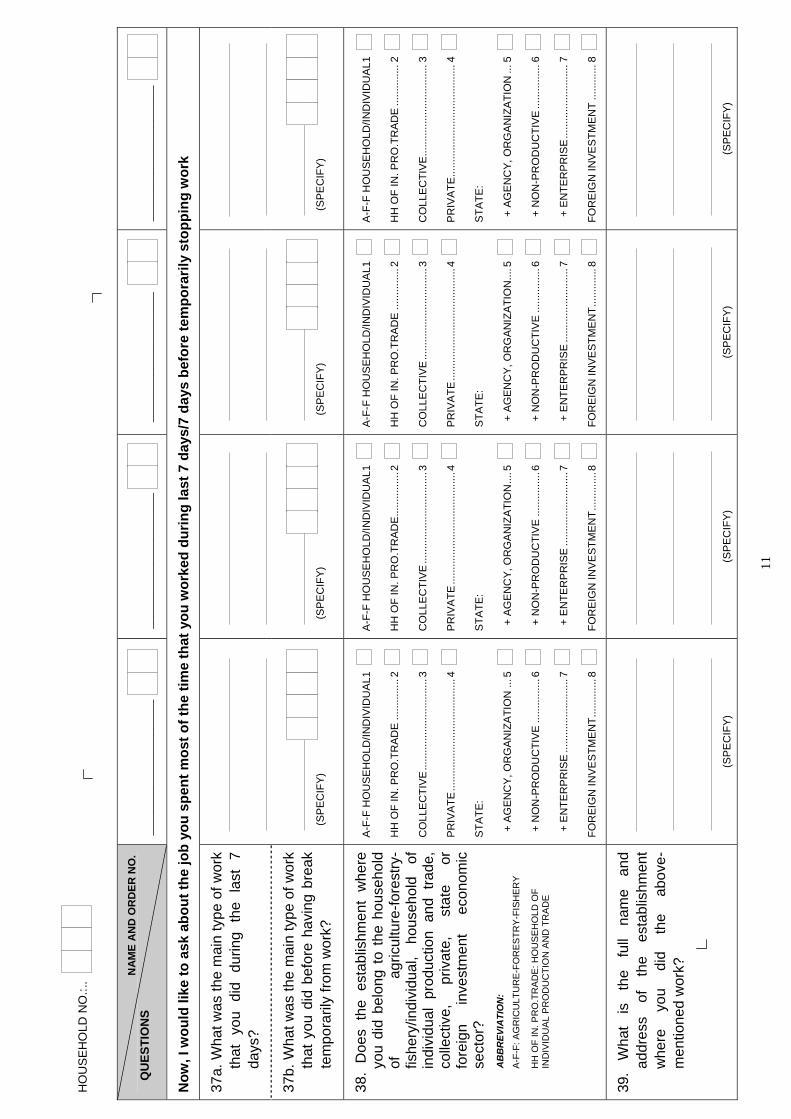
11
HO
US
EH
OLD
NO
.:..
NA
ME
AN
D O
RD
ER N
O.
QU
ESTI
ON
S
____
____
____
____
____
___
____
____
____
____
____
___
____
____
____
____
____
__
____
____
____
____
____
___
Now
, I w
ould
like
to a
sk a
bout
the
job
you
spen
t mos
t of t
he ti
me
that
you
wor
ked
durin
g la
st 7
day
s/7
days
bef
ore
tem
pora
rily
stop
ping
wor
k
37a.
Wha
t was
the
mai
n ty
pe o
f wor
k th
at y
ou d
id d
urin
g th
e la
st 7
da
ys?
37b.
Wha
t was
the
mai
n ty
pe o
f wor
k th
at y
ou d
id b
efor
e ha
ving
bre
ak
tem
pora
rily
from
wor
k?
(S
PE
CIF
Y)
(S
PE
CIF
Y)
(S
PE
CIF
Y)
(S
PE
CIF
Y)
38.
Doe
s th
e es
tabl
ishm
ent
whe
re
you
did
belo
ng t
o th
e ho
useh
old
of
agric
ultu
re-fo
rest
ry-
fishe
ry/in
divi
dual
, ho
useh
old
of
indi
vidu
al p
rodu
ctio
n an
d tra
de,
colle
ctiv
e,
priv
ate,
st
ate
or
fore
ign
inve
stm
ent
econ
omic
se
ctor
?
A
BB
REV
IATI
ON
:
A-F-
F: A
GR
ICU
LTU
RE-
FOR
ESTR
Y-FI
SH
ERY
H
H O
F IN
. PR
O.T
RA
DE
: HO
US
EH
OLD
OF
IND
IVID
UAL
PR
OD
UC
TIO
N A
ND
TR
ADE
A-F
-F H
OU
SE
HO
LD/IN
DIV
IDU
AL1
HH
OF
IN. P
RO
.TR
AD
E...
......
.....
2
CO
LLE
CTI
VE
......
......
......
......
......
.3
PR
IVA
TE...
......
......
......
......
......
.....
4
STA
TE:
+ A
GE
NC
Y, O
RG
AN
IZA
TIO
N...
5
+ N
ON
-PR
OD
UC
TIV
E...
......
......
6
+ E
NTE
RP
RIS
E...
......
......
......
....7
FOR
EIG
N IN
VE
STM
EN
T....
......
...8
A-F
-F H
OU
SE
HO
LD/IN
DIV
IDU
AL1
HH
OF
IN. P
RO
.TR
AD
E...
......
......
2
CO
LLE
CTI
VE
......
......
......
......
......
.3
PR
IVA
TE...
......
......
......
......
......
.....
4
STA
TE:
+ A
GE
NC
Y, O
RG
AN
IZA
TIO
N...
.5
+ N
ON
-PR
OD
UC
TIV
E...
......
......
6
+ E
NTE
RP
RIS
E...
......
......
......
....7
FOR
EIG
N IN
VE
STM
EN
T...
......
....8
A-F
-F H
OU
SE
HO
LD/IN
DIV
IDU
AL1
HH
OF
IN. P
RO
.TR
AD
E...
......
.....
2
CO
LLE
CTI
VE
......
......
......
......
......
.3
PR
IVA
TE...
......
......
......
......
......
.....
4
STA
TE:
+ A
GE
NC
Y, O
RG
AN
IZA
TIO
N...
.5
+ N
ON
-PR
OD
UC
TIV
E...
......
......
6
+ E
NTE
RP
RIS
E...
......
......
......
....7
FOR
EIG
N IN
VE
STM
EN
T....
......
...8
A-F
-F H
OU
SE
HO
LD/IN
DIV
IDU
AL1
HH
OF
IN. P
RO
.TR
AD
E...
......
.....
2
CO
LLE
CTI
VE
......
......
......
......
......
.3
PR
IVA
TE...
......
......
......
......
......
.....
4
STA
TE:
+ A
GE
NC
Y, O
RG
AN
IZA
TIO
N...
5
+ N
ON
-PR
OD
UC
TIV
E...
......
......
6
+ E
NTE
RP
RIS
E...
......
......
......
....7
FOR
EIG
N IN
VE
STM
EN
T...
......
...8
39.
Wha
t is
th
e fu
ll na
me
and
addr
ess
of
the
esta
blis
hmen
t w
here
yo
u di
d th
e ab
ove-
men
tione
d w
ork?
(S
PE
CIF
Y)
(S
PE
CIF
Y)
(S
PE
CIF
Y)
(S
PE
CIF
Y)

12
N
AM
E A
ND
OR
DER
NO
. Q
UES
TIO
NS
____
____
____
____
____
___
____
____
____
____
____
___
____
____
____
____
____
__
____
____
____
____
____
___
40.
Wha
t w
as t
he m
ain
activ
ity o
r m
ajor
typ
e of
pro
duct
/ser
vice
of
the
esta
blish
men
t whe
re y
ou d
id th
e ab
ove-
men
tione
d w
ork?
REM
AR
K:
FOR
TH
E
HO
US
EH
OLD
O
F A
GR
ICU
LTU
RE
-FO
RE
STR
Y–F
ISH
ER
Y/IN
DIV
IDU
AL,
CO
MB
INE
WIT
H Q
37
TO R
EC
OR
D C
OD
E O
F IN
DU
STR
Y
(S
PE
CIF
Y)
(S
PE
CIF
Y)
(S
PE
CIF
Y)
(S
PE
CIF
Y)
41.
Doe
s th
e es
tabl
ishm
ent
whe
re
you
wor
ked
have
the
follo
win
g:
a. B
usin
ess
regi
stra
tion?
b.
Tax
cod
e re
gist
ratio
n?
c. S
ocia
l ins
uran
ce re
gist
ratio
n?
d. W
ritte
n ac
coun
ts?
YE
S
N
O
BU
SIN
ES
S R
EG
ISTR
......
1...
......
2
TAX
CO
DE
RE
GIS
TR...
...1
......
...2
SO
CIA
L IN
SU
RA
NC
E...
...1
......
...2
WR
ITTE
N A
CC
OU
NTS
....1
......
...2
YE
S
N
O
BU
SIN
ES
S R
EG
ISTR
......
1...
......
2
TAX
CO
DE
RE
GIS
TR...
...1
......
...2
SO
CIA
L IN
SU
RA
NC
E...
...1
......
...2
WR
ITTE
N A
CC
OU
NTS
....1
......
...2
YE
S
N
O
BU
SIN
ES
S R
EG
ISTR
......
1...
......
2
TAX
CO
DE
RE
GIS
TR...
...1
......
...2
SO
CIA
L IN
SU
RA
NC
E...
...1
......
...2
WR
ITTE
N A
CC
OU
NTS
....1
......
...2
YE
S
N
O
BU
SIN
ES
S R
EG
ISTR
......
1....
.....
2
TAX
CO
DE
RE
GIS
TR...
...1.
......
..2
SO
CIA
L IN
SU
RA
NC
E...
...1.
......
..2
WR
ITTE
N A
CC
OU
NTS
...1.
......
..2
42. H
ow m
any
pers
ons
usua
lly w
ork
at
the
esta
blis
hmen
t w
here
yo
u w
orke
d?
1 - 2
0 P
ER
SO
NS
......
1
21 -
99 P
ER
SO
NS
....
......
......
......
2
100
- 299
PE
RS
ON
S .
......
......
.....
3
300
PE
RS
ON
S A
ND
OV
ER
......
...4
1 - 2
0 P
ER
SO
NS
......
.1
21 -
99 P
ER
SO
NS
.....
......
......
......
2
100
- 299
PE
RS
ON
S .
......
......
.....
3
300
PE
RS
ON
S A
ND
OV
ER
......
...4
1 - 2
0 P
ER
SO
NS
......
1
21 -
99 P
ER
SO
NS
....
......
......
......
2
100
- 299
PE
RS
ON
S .
......
......
.....
3
300
PE
RS
ON
S A
ND
OV
ER
......
...4
1 - 2
0 P
ER
SO
NS
......
1
21 -
99 P
ER
SO
NS
....
......
......
......
2
100
- 299
PE
RS
ON
S .
......
......
.....
3
300
PE
RS
ON
S A
ND
OV
ER
......
...4
43. W
ith a
bove
wor
k, w
ere
you:
- E
mpl
oyer
(hire
labo
ur)?
- O
wn-
acco
unt w
orke
r (no
t to
hire
la
bour
)?
- Unp
aid
fam
ily w
orke
r?
- Wag
e w
orke
r or
- Mem
ber o
f coo
pera
tive?
EM
PLO
YER
......
......
......
......
......
1
OW
N-A
CC
OU
NT
WO
RK
ER
.....
2
Q46
b
UN
PA
ID F
AM
ILY
WO
RK
ER
.....
3
WA
GE
WO
RK
ER
......
......
......
....4
ME
MB
ER
OF
CO
OP
ER
ATI
VE
.5
EM
PLO
YER
......
......
......
......
......
1
OW
N-A
CC
OU
NT
WO
RK
ER
.....
2
Q46
b
UN
PA
ID F
AM
ILY
WO
RK
ER
......
3
WA
GE
WO
RK
ER
......
......
......
....4
ME
MB
ER
OF
CO
OP
ER
ATI
VE
.5
EM
PLO
YER
......
......
......
......
......
1
OW
N-A
CC
OU
NT
WO
RK
ER
.....
2
Q46
b
UN
PA
ID F
AM
ILY
WO
RK
ER
.....
3
WA
GE
WO
RK
ER
......
......
......
....4
ME
MB
ER
OF
CO
OP
ER
ATI
VE
.5
EM
PLO
YER
......
......
......
......
......
.1
OW
N-A
CC
OU
NT
WO
RK
ER
......
2
Q46
b
UN
PA
ID F
AM
ILY
WO
RK
ER
......
3
WA
GE
WO
RK
ER
......
......
......
.....4
ME
MB
ER
OF
CO
OP
ER
ATI
VE
..5
44.
In t
he a
bove
job
, di
d yo
u ho
ld
cont
ract
of u
nlim
ited
term
, lim
ited
limite
d, v
erba
l ag
reem
ent
or n
o co
ntra
ct?
AB
BR
EVIA
TIO
N:
LB -
LAB
OU
R C
ON
TRA
CT
UN
LIM
ITE
D T
ER
M L
B...
......
......
..1
1 - 3
YE
AR
TE
RM
LB
......
......
......
.2
UN
DE
R 1
YE
AR
LB
……
……
……
….3
VE
RB
AL
AG
RE
EM
EN
T...
......
......
4
NO
NE
......
......
......
......
......
......
......
.5
UN
LIM
ITE
D T
ER
M L
B...
......
......
..1
1 - 3
YE
AR
TE
RM
LB
......
......
......
.2
UN
DE
R 1
YE
AR
LB
……
……
……
….3
VE
RB
AL
AG
RE
EM
EN
T...
......
......
4
NO
NE
......
......
......
......
......
......
......
.5
UN
LIM
ITE
D T
ER
M L
B...
......
......
..1
1 - 3
YE
AR
TE
RM
LB
......
......
......
.2
UN
DE
R 1
YE
AR
LB
……
……
……
….3
VE
RB
AL
AG
RE
EM
EN
T...
......
......
4
NO
NE
......
......
......
......
......
......
......
.5
UN
LIM
ITE
D T
ER
M L
B...
......
......
..1
1 - 3
YE
AR
TE
RM
LB
......
......
......
2
UN
DE
R 1
YE
AR
LB
……
……
……
….3
VE
RB
AL
AG
RE
EM
EN
T...
......
......
4
NO
NE
......
......
......
......
......
......
......
.5

13
HO
US
EH
OLD
NO
. :.
NA
ME
AN
D O
RD
ER N
O.
QU
ESTI
ON
S
____
____
____
____
____
___
____
____
____
____
____
___
____
____
____
____
____
__
____
____
____
____
____
___
45.
In w
hat
man
ner
did
you
rece
ive
your
pa
ymen
t in
th
e ab
ove-
men
tione
d jo
b?
FIX
ED
SA
LAR
Y...
......
......
......
......
1
PE
R W
OR
KE
D D
AY/
HO
UR
......
...2
PA
ID P
ER
PIE
CE
......
......
......
......
.3
ON
CO
MM
ISS
ION
......
......
......
.....
4
INTE
RE
ST
......
......
......
......
......
.....
5
IN K
IND
......
......
......
......
......
......
....6
UN
PA
ID...
......
......
......
......
......
......
.7
Q
46b
FIX
ED
SA
LAR
Y...
......
......
......
......
.1
PE
R W
OR
KE
D D
AY/
HO
UR
......
...2
PA
ID P
ER
PIE
CE
......
......
......
......
.3
ON
CO
MM
ISS
ION
......
......
......
.....
4
INTE
RE
ST.
......
......
......
......
......
.....
5
IN K
IND
......
......
......
......
......
......
....6
UN
PA
ID...
......
......
......
......
......
......
.7
Q46
b
FIX
ED
SA
LAR
Y...
......
......
......
......
1
PE
R W
OR
KE
D D
AY/
HO
UR
......
...2
PA
ID P
ER
PIE
CE
......
......
......
......
.3
ON
CO
MM
ISS
ION
......
......
......
.....
4
INTE
RE
ST
......
......
......
......
......
.....
5
IN K
IND
......
......
......
......
......
......
....6
UN
PA
ID...
......
......
......
......
......
......
.7
Q
46b
FIX
ED
SA
LAR
Y...
......
......
......
......
1
PE
R W
OR
KE
D D
AY/
HO
UR
......
..2
PA
ID P
ER
PIE
CE
......
......
......
......
3
ON
CO
MM
ISS
ION
......
......
......
.....
4
INTE
RE
ST
......
......
......
......
......
.....
5
IN K
IND
......
......
......
......
......
......
....6
UN
PA
ID...
......
......
......
......
......
......
7
Q
46b
46.
With
the
abo
ve-m
entio
ned
job,
di
d yo
u re
ceiv
e th
e fo
llow
ing:
a.
Pai
d pu
blic
hol
iday
s/le
aves
? b.
Hea
lth in
sura
nce
card
? c.
Soc
ial i
nsur
ance
?
YE
S
N
O
HO
LID
AYS
/LE
AV
ES
......
..1
......
...2
HE
ALT
H C
AR
D...
......
......
.1...
......
2
SO
CIA
L IN
SU
RA
NC
E...
...1
......
...2
YE
S
N
O
HO
LID
AYS
/LE
AV
ES
......
..1...
......
2
HE
ALT
H C
AR
D...
......
......
.1...
......
2
SO
CIA
L IN
SU
RA
NC
E...
...1
......
...2
YE
S
N
O
HO
LID
AYS
/LE
AV
ES
......
..1...
......
2
HE
ALT
H C
AR
D...
......
......
.1...
......
2
SO
CIA
L IN
SU
RA
NC
E...
...1
......
...2
YE
S
N
O
HO
LID
AYS
/LE
AV
ES
......
..1.
......
..2
HE
ALT
H C
AR
D...
......
......
.1...
......
2
SO
CIA
L IN
SU
RA
NC
E...
...1.
......
..2
47.
Is t
he v
enue
whe
re y
ou w
orke
d in
a fi
xed
offic
e, a
t hom
e/ho
me
of
clie
nt,
mar
ket/t
rade
ce
nter
, an
ou
tdoo
r fix
ed
plac
e or
m
obile
pl
ace?
FIX
ED
OFF
ICE
......
......
......
......
....1
HO
ME
/HO
ME
OF
CLI
EN
T...
......
..2
MA
RK
ET/
TRA
DE
CE
NTE
R...
......
3
OU
TDO
OR
FIX
ED
PLA
CE
......
....4
MO
BIL
E...
......
......
......
......
......
......
.5
FIX
ED
OFF
ICE
......
......
......
......
.....
1
HO
ME
/HO
ME
OF
CLI
EN
T...
......
..2
MA
RK
ET/
TRA
DE
CE
NTE
R...
......
3
OU
TDO
OR
FIX
ED
PLA
CE
......
....4
MO
BIL
E...
......
......
......
......
......
......
.5
FIX
ED
OFF
ICE
......
......
......
......
....1
HO
ME
/HO
ME
OF
CLI
EN
T...
......
..2
MA
RK
ET/
TRA
DE
CE
NTE
R...
......
3
OU
TDO
OR
FIX
ED
PLA
CE
......
....4
MO
BIL
E...
......
......
......
......
......
......
.5
FIX
ED
OFF
ICE
......
......
......
......
....1
HO
ME
/HO
ME
OF
CLI
EN
T....
......
.2
MA
RK
ET/
TRA
DE
CE
NTE
R...
......
3
OU
TDO
OR
FIX
ED
PLA
CE
......
....4
MO
BIL
E...
......
......
......
......
......
......
5
48. H
ow lo
ng h
ave
you
wor
ked
in
this
job?
U
ND
ER
1 Y
EA
R...
......
......
......
......
1
1 –
UN
DE
R 5
YE
AR
S...
......
......
...2
5 –
UN
DE
R 1
0 Y
EA
RS
......
......
....3
10 Y
EA
RS
AN
D O
VE
R...
......
......
.4
UN
DE
R 1
YE
AR
......
......
......
......
...1
1 –
UN
DE
R 5
YE
AR
S...
......
......
...2
5 –
UN
DE
R 1
0 Y
EA
RS
......
......
....3
10 Y
EA
RS
AN
D O
VE
R...
......
......
.4
UN
DE
R 1
YE
AR
......
......
......
......
...1
1 –
UN
DE
R 5
YE
AR
S...
......
......
...2
5 –
UN
DE
R 1
0 Y
EA
RS
......
......
....3
10 Y
EA
RS
AN
D O
VE
R...
......
......
.4
UN
DE
R 1
YE
AR
......
......
......
......
..1
1 –
UN
DE
R 5
YE
AR
S...
......
......
...2
5 –
UN
DE
R 1
0 Y
EA
RS
......
......
....3
10 Y
EA
RS
AN
D O
VE
R...
......
......
.4
49. C
HE
CK
Q43
: IF
Q43
= 4
Q50
; O
THE
RW
ISE
Q
53

14
N
AM
E A
ND
OR
DER
NO
. Q
UES
TIO
NS
____
____
____
____
____
___
____
____
____
____
____
___
____
____
____
____
____
__
____
____
____
____
____
___
50. I
n th
e ab
ove-
men
tione
d jo
b, h
ow
muc
h sa
lary
/wag
e di
d yo
u re
ceiv
e du
ring
the
last
mon
th?
(TH
OU
SA
ND
VN
D)
(TH
OU
SA
ND
VN
D)
(TH
OU
SA
ND
VN
D)
(TH
OU
SA
ND
VN
D)
51.
Apa
rt fro
m s
alar
y/w
age,
dur
ing
the
last
mon
th,
did
you
rece
ive
the
follo
win
gs:
a. O
verti
me
paym
ent?
b.
Pre
miu
m?
c.
Oth
er
wel
fare
pa
ymen
t (o
ccup
atio
n al
low
ance
, tra
vel,
clot
hes,
lunc
h, ..
.)?
Y
ES
NO
OV
ER
TIM
E...
......
......
......
.1...
......
2
PR
EM
IUM
......
......
......
......
1...
......
2
OTH
ER
WE
LFA
RE
......
....1
......
...2
Y
ES
NO
OV
ER
TIM
E...
......
......
......
..1...
......
2
PR
EM
IUM
......
......
......
......
1...
......
2
OTH
ER
WE
LFA
RE
......
....1
......
...2
Y
ES
NO
OV
ER
TIM
E...
......
......
......
.1...
......
2
PR
EM
IUM
......
......
......
......
1...
......
2
OTH
ER
WE
LFA
RE
......
....1
......
...2
Y
ES
NO
OV
ER
TIM
E...
......
......
......
.1...
......
2
PR
EM
IUM
......
......
......
......
1....
.....
2
OTH
ER
WE
LFA
RE
......
....1
......
...2
52.
How
m
uch
did
you
rece
ive
paym
ent
of o
verti
me,
pre
miu
m,
occu
patio
n al
low
ance
and
oth
er
wel
fare
dur
ing
the
last
mon
th?
(TH
OU
SA
ND
VN
D)
(TH
OU
SA
ND
VN
D)
(TH
OU
SA
ND
VN
D)
(TH
OU
SA
ND
VN
D)
Now
, I w
ould
like
to a
sk a
bout
num
ber o
f wor
ked
hour
s th
at y
ou w
orke
d du
ring
last
7 d
ays/
7 da
ys b
efor
e te
mpo
raril
y st
oppi
ng w
ork
53.
Not
in
clud
ing
leav
e tim
e bu
t in
clud
ing
over
time,
ho
w
man
y ho
urs
did
you
actu
ally
wor
k fo
r th
e m
ain
abov
e-m
entio
ned
wor
k,
durin
g la
st 7
day
s/7
days
bef
ore
tem
pora
rily
stop
ping
wor
k?
AC
TUA
L W
OR
KE
D H
OU
RS
FOR
MA
IN J
OB
PE
R W
EE
K...
......
..
AC
TUA
L W
OR
KE
D H
OU
RS
FOR
MA
IN J
OB
PE
R W
EE
K...
......
..
AC
TUA
L W
OR
KE
D H
OU
RS
FOR
MA
IN J
OB
PE
R W
EE
K...
......
..
AC
TUA
L W
OR
KE
D H
OU
RS
FOR
MA
IN J
OB
PE
R W
EE
K...
......
..
54.
Not
inc
ludi
ng l
eave
tim
e, h
ow
man
y ho
urs
did
you
regu
larly
w
ork
for
the
mai
n ab
ove-
men
tione
d w
ork
per w
eek?
RE
GU
LAR
WO
RK
ED
HO
UR
S
FOR
MA
IN J
OB
PE
R W
EE
K...
......
..
RE
GU
LAR
WO
RK
ED
HO
UR
S
FOR
MA
IN J
OB
PE
R W
EE
K...
......
..
RE
GU
LAR
WO
RK
ED
HO
UR
S
FOR
MA
IN J
OB
PE
R W
EE
K...
......
..
RE
GU
LAR
WO
RK
ED
HO
UR
S
FOR
MA
IN J
OB
PE
R W
EE
K...
......
..
55. C
HE
CK
Q53
AN
D Q
54:
IF Q
53 <
Q54
Q56
; O
THE
RW
ISE
Q57
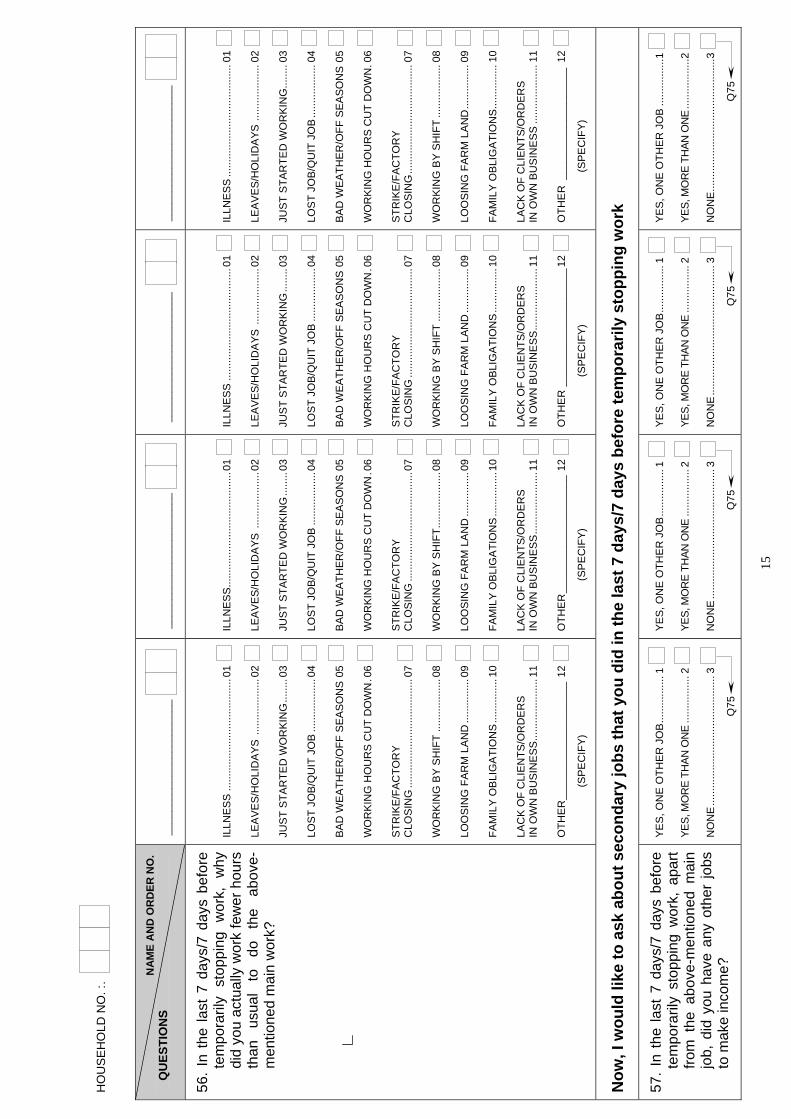
15
HO
US
EH
OLD
NO
. :.
NA
ME
AN
D O
RD
ER N
O.
QU
ESTI
ON
S
____
____
____
____
____
___
____
____
____
____
____
___
____
____
____
____
____
__
____
____
____
____
____
___
56.
In t
he la
st 7
day
s/7
days
bef
ore
tem
pora
rily
stop
ping
wor
k, w
hy
did
you
actu
ally
wor
k fe
wer
hou
rs
than
us
ual
to
do
the
abov
e-m
entio
ned
mai
n w
ork?
ILLN
ES
S...
......
......
......
......
......
.....
01
LEA
VE
S/H
OLI
DA
YS .
......
......
......
02
JUS
T S
TAR
TED
WO
RK
ING
......
..03
LOS
T JO
B/Q
UIT
JO
B...
......
......
...04
BA
D W
EA
THE
R/O
FF S
EA
SO
NS
05
WO
RK
ING
HO
UR
S C
UT
DO
WN
.06
STR
IKE
/FA
CTO
RY
C
LOS
ING
......
......
......
......
......
......
.07
WO
RK
ING
BY
SH
IFT
......
......
......
08
LOO
SIN
G F
AR
M L
AN
D...
......
......
09
FAM
ILY
OB
LIG
ATI
ON
S...
......
......
10
LAC
K O
F C
LIE
NTS
/OR
DE
RS
IN
OW
N B
US
INE
SS
......
......
......
...11
OTH
ER
____
____
____
____
____
12
(
SP
EC
IFY)
ILLN
ES
S...
......
......
......
......
......
......
01
LEA
VE
S/H
OLI
DA
YS .
......
......
......
02
JUS
T S
TAR
TED
WO
RK
ING
......
..03
LOS
T JO
B/Q
UIT
JO
B...
......
......
...04
BA
D W
EA
THE
R/O
FF S
EA
SO
NS
05
WO
RK
ING
HO
UR
S C
UT
DO
WN
.06
STR
IKE
/FA
CTO
RY
C
LOS
ING
......
......
......
......
......
......
.07
WO
RK
ING
BY
SH
IFT.
......
......
......
08
LOO
SIN
G F
AR
M L
AN
D...
......
......
09
FAM
ILY
OB
LIG
ATI
ON
S...
......
......
10
LAC
K O
F C
LIE
NTS
/OR
DE
RS
IN
OW
N B
US
INE
SS
......
......
......
...11
OTH
ER
____
____
____
____
____
12
(
SP
EC
IFY)
ILLN
ES
S...
......
......
......
......
......
.....
01
LEA
VE
S/H
OLI
DA
YS .
......
......
......
02
JUS
T S
TAR
TED
WO
RK
ING
......
..03
LOS
T JO
B/Q
UIT
JO
B...
......
......
...04
BA
D W
EA
THE
R/O
FF S
EA
SO
NS
05
WO
RK
ING
HO
UR
S C
UT
DO
WN
.06
STR
IKE
/FA
CTO
RY
C
LOS
ING
......
......
......
......
......
......
.07
WO
RK
ING
BY
SH
IFT
......
......
......
08
LOO
SIN
G F
AR
M L
AN
D...
......
......
09
FAM
ILY
OB
LIG
ATI
ON
S...
......
......
10
LAC
K O
F C
LIE
NTS
/OR
DE
RS
IN
OW
N B
US
INE
SS
......
......
......
...11
OTH
ER
____
____
____
____
____
12
(
SP
EC
IFY)
ILLN
ES
S...
......
......
......
......
......
.....
01
LEA
VE
S/H
OLI
DA
YS ..
......
......
.....
02
JUS
T S
TAR
TED
WO
RK
ING
......
..03
LOS
T JO
B/Q
UIT
JO
B...
......
......
...04
BA
D W
EA
THE
R/O
FF S
EA
SO
NS
05
WO
RK
ING
HO
UR
S C
UT
DO
WN
.06
STR
IKE
/FA
CTO
RY
C
LOS
ING
......
......
......
......
......
......
.07
WO
RK
ING
BY
SH
IFT
......
......
......
08
LOO
SIN
G F
AR
M L
AN
D...
......
......
09
FAM
ILY
OB
LIG
ATI
ON
S...
......
......
10
LAC
K O
F C
LIE
NTS
/OR
DE
RS
IN O
WN
BU
SIN
ES
S...
......
......
.....
11
OTH
ER
____
____
____
____
___
12
(
SP
EC
IFY)
Now
, I w
ould
like
to a
sk a
bout
sec
onda
ry jo
bs th
at y
ou d
id in
the
last
7 d
ays/
7 da
ys b
efor
e te
mpo
raril
y st
oppi
ng w
ork
57.
In t
he la
st 7
day
s/7
days
bef
ore
tem
pora
rily
stop
ping
wor
k, a
part
from
the
abo
ve-m
entio
ned
mai
n jo
b, d
id y
ou h
ave
any
othe
r jo
bs
to m
ake
inco
me?
YES
, ON
E O
THE
R J
OB
......
......
....1
YES,
MO
RE
THAN
ON
E...
......
......
.2
NO
NE
......
......
......
......
......
......
......
..3
Q
75
YES
, ON
E O
THE
R J
OB
......
......
....1
YES,
MO
RE
THAN
ON
E...
......
......
.2
NO
NE
......
......
......
......
......
......
......
..3
Q
75
YES
, ON
E O
THE
R J
OB
......
......
....1
YES,
MO
RE
THAN
ON
E...
......
......
.2
NO
NE
......
......
......
......
......
......
......
..3
Q
75
YES
, ON
E O
THE
R J
OB
......
......
....1
YES,
MO
RE
THAN
ON
E...
......
......
..2
NO
NE
......
......
......
......
......
......
......
...3
Q
75
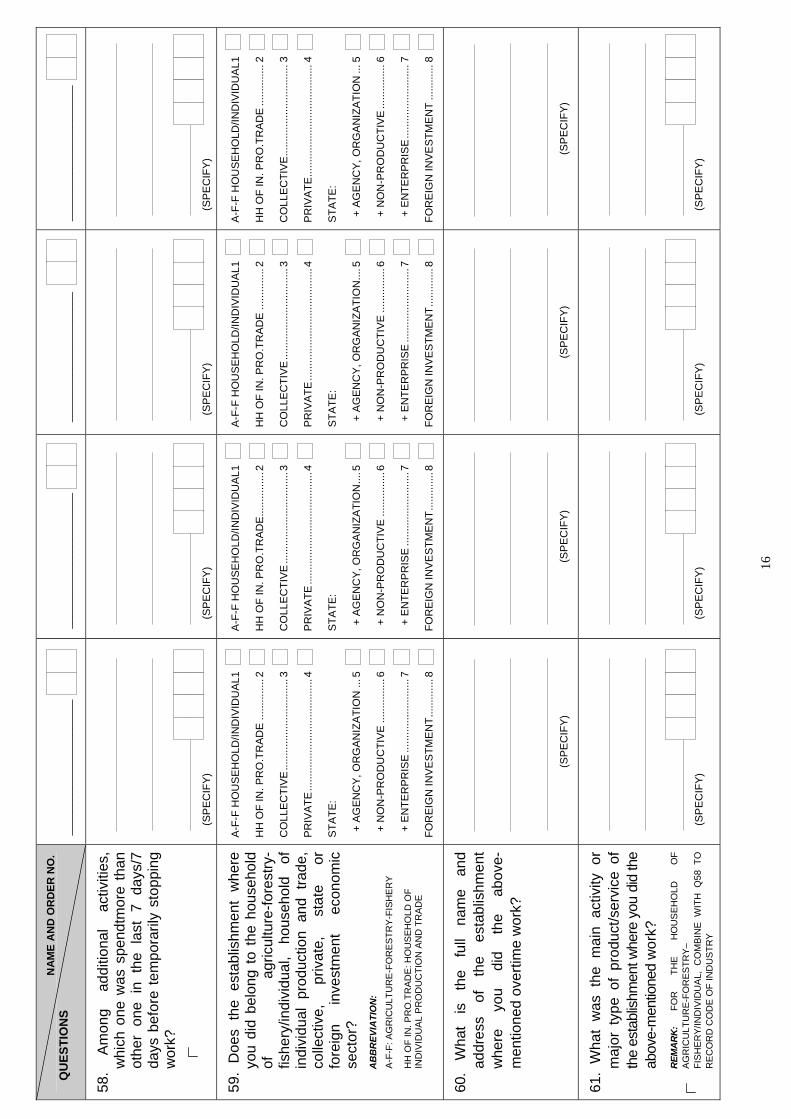
16
N
AM
E A
ND
OR
DER
NO
. Q
UES
TIO
NS
____
____
____
____
____
___
____
____
____
____
____
___
____
____
____
____
____
__
____
____
____
____
____
___
58.
Am
ong
addi
tiona
l ac
tiviti
es,
whi
ch o
ne w
as s
pend
tmor
e th
an
othe
r on
e in
the
las
t 7
days
/7
days
bef
ore
tem
pora
rily
stop
ping
w
ork?
(S
PE
CIF
Y)
(S
PE
CIF
Y)
(S
PE
CIF
Y)
(S
PE
CIF
Y)
59.
Doe
s th
e es
tabl
ishm
ent
whe
re
you
did
belo
ng t
o th
e ho
useh
old
of
agric
ultu
re-fo
rest
ry-
fishe
ry/in
divi
dual
, ho
useh
old
of
indi
vidu
al p
rodu
ctio
n an
d tra
de,
colle
ctiv
e,
priv
ate,
st
ate
or
fore
ign
inve
stm
ent
econ
omic
se
ctor
?
AB
BR
EVIA
TIO
N:
A-
F-F:
AG
RIC
ULT
UR
E-FO
RES
TRY-
FIS
HER
Y
HH
OF
IN. P
RO
.TR
AD
E: H
OU
SEH
OLD
OF
IN
DIV
IDU
AL P
RO
DU
CTI
ON
AN
D T
RAD
E
A-F
-F H
OU
SE
HO
LD/IN
DIV
IDU
AL1
HH
OF
IN. P
RO
.TR
AD
E...
......
.....
2
CO
LLE
CTI
VE
......
......
......
......
......
.3
PR
IVA
TE...
......
......
......
......
......
.....
4
STA
TE:
+ A
GE
NC
Y, O
RG
AN
IZA
TIO
N...
5
+ N
ON
-PR
OD
UC
TIV
E...
......
......
6
+ E
NTE
RP
RIS
E...
......
......
......
....7
FOR
EIG
N IN
VE
STM
EN
T....
......
...8
A-F
-F H
OU
SE
HO
LD/IN
DIV
IDU
AL1
HH
OF
IN. P
RO
.TR
AD
E...
......
......
2
CO
LLE
CTI
VE
......
......
......
......
......
.3
PR
IVA
TE...
......
......
......
......
......
.....
4
STA
TE:
+ A
GE
NC
Y, O
RG
AN
IZA
TIO
N...
.5
+ N
ON
-PR
OD
UC
TIV
E...
......
......
6
+ E
NTE
RP
RIS
E...
......
......
......
....7
FOR
EIG
N IN
VE
STM
EN
T...
......
....8
A-F
-F H
OU
SE
HO
LD/IN
DIV
IDU
AL1
HH
OF
IN. P
RO
.TR
AD
E...
......
.....
2
CO
LLE
CTI
VE
......
......
......
......
......
.3
PR
IVA
TE...
......
......
......
......
......
.....
4
STA
TE:
+ A
GE
NC
Y, O
RG
AN
IZA
TIO
N...
.5
+ N
ON
-PR
OD
UC
TIV
E...
......
......
6
+ E
NTE
RP
RIS
E...
......
......
......
....7
FOR
EIG
N IN
VE
STM
EN
T....
......
...8
A-F
-F H
OU
SE
HO
LD/IN
DIV
IDU
AL1
HH
OF
IN. P
RO
.TR
AD
E...
......
.....
2
CO
LLE
CTI
VE
......
......
......
......
......
.3
PR
IVA
TE...
......
......
......
......
......
.....
4
STA
TE:
+ A
GE
NC
Y, O
RG
AN
IZA
TIO
N...
5
+ N
ON
-PR
OD
UC
TIV
E...
......
......
6
+ E
NTE
RP
RIS
E...
......
......
......
....7
FOR
EIG
N IN
VE
STM
EN
T...
......
...8
60.
Wha
t is
th
e fu
ll na
me
and
addr
ess
of
the
esta
blis
hmen
t w
here
yo
u di
d th
e ab
ove-
men
tione
d ov
ertim
e w
ork?
(S
PE
CIF
Y)
(S
PE
CIF
Y)
(S
PE
CIF
Y)
(S
PE
CIF
Y)
61.
Wha
t w
as t
he m
ain
activ
ity o
r m
ajor
typ
e of
pro
duct
/ser
vice
of
the
esta
blish
men
t whe
re y
ou d
id th
e ab
ove-
men
tione
d w
ork?
REM
AR
K:
FOR
TH
E H
OU
SEH
OLD
O
F AG
RIC
ULT
UR
E-FO
RES
TRY–
FIS
HE
RY/
IND
IVID
UA
L, C
OM
BIN
E W
ITH
Q58
TO
R
ECO
RD
CO
DE
OF
IND
UST
RY
(S
PE
CIF
Y)
(S
PE
CIF
Y)
(S
PE
CIF
Y)
(S
PE
CIF
Y)
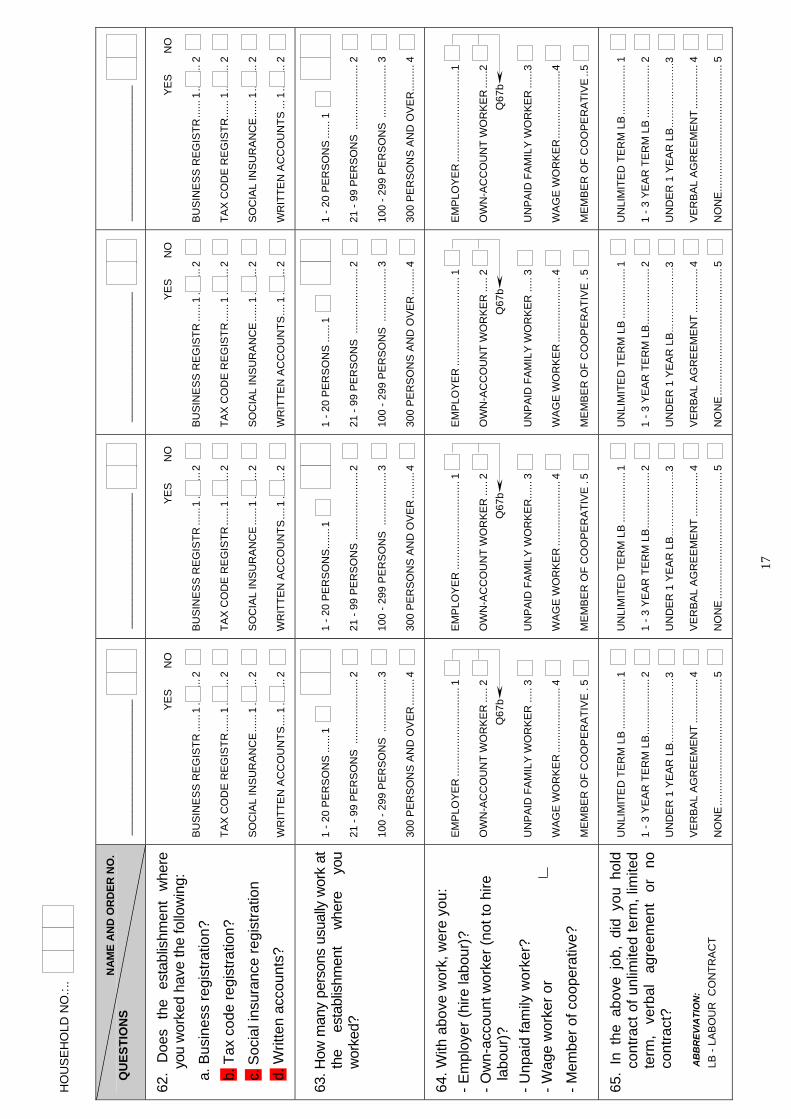
17
HO
US
EH
OLD
NO
.:..
NA
ME
AN
D O
RD
ER N
O.
QU
ESTI
ON
S
____
____
____
____
____
___
____
____
____
____
____
___
____
____
____
____
____
__
____
____
____
____
____
___
62.
Doe
s th
e es
tabl
ishm
ent
whe
re
you
wor
ked
have
the
follo
win
g:
a. B
usin
ess
regi
stra
tion?
b. T
ax c
ode
regi
stra
tion?
c. S
ocia
l ins
uran
ce re
gist
ratio
n
d. W
ritte
n ac
coun
ts?
YE
S
N
O
BU
SIN
ES
S R
EG
ISTR
......
1...
......
2
TAX
CO
DE
RE
GIS
TR...
...1
......
...2
SO
CIA
L IN
SU
RA
NC
E...
...1
......
...2
WR
ITTE
N A
CC
OU
NTS
....1
......
...2
YE
S
N
O
BU
SIN
ES
S R
EG
ISTR
......
1...
......
2
TAX
CO
DE
RE
GIS
TR...
...1
......
...2
SO
CIA
L IN
SU
RA
NC
E...
...1
......
...2
WR
ITTE
N A
CC
OU
NTS
....1
......
...2
YE
S
N
O
BU
SIN
ES
S R
EG
ISTR
......
1...
......
2
TAX
CO
DE
RE
GIS
TR...
...1
......
...2
SO
CIA
L IN
SU
RA
NC
E...
...1
......
...2
WR
ITTE
N A
CC
OU
NTS
....1
......
...2
YE
S
N
O
BU
SIN
ES
S R
EG
ISTR
......
1....
.....
2
TAX
CO
DE
RE
GIS
TR...
...1.
......
..2
SO
CIA
L IN
SU
RA
NC
E...
...1.
......
..2
WR
ITTE
N A
CC
OU
NTS
...1.
......
..2
63. H
ow m
any
pers
ons
usua
lly w
ork
at
the
esta
blis
hmen
t w
here
yo
u w
orke
d?
1 - 2
0 P
ER
SO
NS
......
1
21 -
99 P
ER
SO
NS
....
......
......
......
2
100
- 299
PE
RS
ON
S .
......
......
.....
3
300
PE
RS
ON
S A
ND
OV
ER
......
...4
1 - 2
0 P
ER
SO
NS
......
.1
21 -
99 P
ER
SO
NS
.....
......
......
......
2
100
- 299
PE
RS
ON
S .
......
......
.....
3
300
PE
RS
ON
S A
ND
OV
ER
......
...4
1 - 2
0 P
ER
SO
NS
......
1
21 -
99 P
ER
SO
NS
....
......
......
......
2
100
- 299
PE
RS
ON
S .
......
......
.....
3
300
PE
RS
ON
S A
ND
OV
ER
......
...4
1 - 2
0 P
ER
SO
NS
......
1
21 -
99 P
ER
SO
NS
....
......
......
......
2
100
- 299
PE
RS
ON
S .
......
......
.....
3
300
PE
RS
ON
S A
ND
OV
ER
......
...4
64. W
ith a
bove
wor
k, w
ere
you:
- E
mpl
oyer
(hire
labo
ur)?
- O
wn-
acco
unt w
orke
r (no
t to
hire
la
bour
)?
- Unp
aid
fam
ily w
orke
r?
- Wag
e w
orke
r or
- Mem
ber o
f coo
pera
tive?
EM
PLO
YER
......
......
......
......
......
1
OW
N-A
CC
OU
NT
WO
RK
ER
.....
2
Q
67b
UN
PA
ID F
AM
ILY
WO
RK
ER
.....
3
WA
GE
WO
RK
ER
......
......
......
....4
ME
MB
ER
OF
CO
OP
ER
ATI
VE
.5
EM
PLO
YER
......
......
......
......
......
1
OW
N-A
CC
OU
NT
WO
RK
ER
.....
2
Q
67b
UN
PA
ID F
AM
ILY
WO
RK
ER
......
3
WA
GE
WO
RK
ER
......
......
......
....4
ME
MB
ER
OF
CO
OP
ER
ATI
VE
.5
EM
PLO
YER
......
......
......
......
......
1
OW
N-A
CC
OU
NT
WO
RK
ER
.....
2
Q
67b
UN
PA
ID F
AM
ILY
WO
RK
ER
.....
3
WA
GE
WO
RK
ER
......
......
......
....4
ME
MB
ER
OF
CO
OP
ER
ATI
VE
.5
EM
PLO
YER
......
......
......
......
......
.1
OW
N-A
CC
OU
NT
WO
RK
ER
......
2
Q
67b
UN
PA
ID F
AM
ILY
WO
RK
ER
......
3
WA
GE
WO
RK
ER
......
......
......
.....4
ME
MB
ER
OF
CO
OP
ER
ATI
VE
..5
65.
In t
he a
bove
job
, di
d yo
u ho
ld
cont
ract
of u
nlim
ited
term
, lim
ited
te
rm,
verb
al
agre
emen
t or
no
co
ntra
ct?
AB
BR
EVIA
TIO
N:
LB -
LAB
OU
R C
ON
TRA
CT
UN
LIM
ITE
D T
ER
M L
B...
......
......
..1
1 - 3
YE
AR
TE
RM
LB
......
......
......
.2
UN
DE
R 1
YE
AR
LB
……
……
……
…3
VE
RB
AL
AG
RE
EM
EN
T...
......
......
4
NO
NE
......
......
......
......
......
......
......
.5
UN
LIM
ITE
D T
ER
M L
B...
......
......
..1
1 - 3
YE
AR
TE
RM
LB
......
......
......
.2
UN
DE
R 1
YE
AR
LB
……
……
……
…3
VE
RB
AL
AG
RE
EM
EN
T...
......
......
4
NO
NE
......
......
......
......
......
......
......
.5
UN
LIM
ITE
D T
ER
M L
B...
......
......
..1
1 - 3
YE
AR
TE
RM
LB
......
......
......
.2
UN
DE
R 1
YE
AR
LB
……
……
……
…3
VE
RB
AL
AG
RE
EM
EN
T...
......
......
4
NO
NE
......
......
......
......
......
......
......
.5
UN
LIM
ITE
D T
ER
M L
B...
......
......
..1
1 - 3
YE
AR
TE
RM
LB
......
......
......
2
UN
DE
R 1
YE
AR
LB
……
……
……
…3
VE
RB
AL
AG
RE
EM
EN
T...
......
......
4
NO
NE
......
......
......
......
......
......
......
.5

18
N
AM
E A
ND
OR
DER
NO
. Q
UES
TIO
NS
____
____
____
____
____
___
____
____
____
____
____
___
____
____
____
____
____
__
____
____
____
____
____
___
66.
In w
hat
man
ner
did
you
rece
ive
your
pa
ymen
t in
th
e ab
ove-
men
tione
d ov
ertim
e jo
b?
FIX
ED
SA
LAR
Y...
......
......
......
......
1
PE
R W
OR
KE
D D
AY/
HO
UR
......
...2
PA
ID P
ER
PIE
CE
......
......
......
......
.3
ON
CO
MM
ISS
ION
......
......
......
.....
4
INTE
RE
ST
......
......
......
......
......
.....
5
IN K
IND
......
......
......
......
......
......
....6
UN
PA
ID...
......
......
......
......
......
......
.7
Q
67b
FIX
ED
SA
LAR
Y...
......
......
......
......
.1
PE
R W
OR
KE
D D
AY/
HO
UR
......
...2
PA
ID P
ER
PIE
CE
......
......
......
......
.3
ON
CO
MM
ISS
ION
......
......
......
.....
4
INTE
RE
ST.
......
......
......
......
......
.....
5
IN K
IND
......
......
......
......
......
......
....6
UN
PA
ID...
......
......
......
......
......
......
.7
Q67
b
FIX
ED
SA
LAR
Y...
......
......
......
......
1
PE
R W
OR
KE
D D
AY/
HO
UR
......
...2
PA
ID P
ER
PIE
CE
......
......
......
......
.3
ON
CO
MM
ISS
ION
......
......
......
.....
4
INTE
RE
ST
......
......
......
......
......
.....
5
IN K
IND
......
......
......
......
......
......
....6
UN
PA
ID...
......
......
......
......
......
......
.7
Q67
b
FIX
ED
SA
LAR
Y...
......
......
......
......
1
PE
R W
OR
KE
D D
AY/
HO
UR
......
..2
PA
ID P
ER
PIE
CE
......
......
......
......
3
ON
CO
MM
ISS
ION
......
......
......
.....
4
INTE
RE
ST
......
......
......
......
......
.....
5
IN K
IND
......
......
......
......
......
......
....6
UN
PA
ID...
......
......
......
......
......
......
7
Q
67b
67.
With
the
abo
ve-m
entio
ned
job,
di
d yo
u re
ceiv
e th
e fo
llow
ing:
a.
Pai
d pu
blic
hol
iday
s/le
aves
? b.
Hea
lth in
sura
nce
card
?
c. S
ocia
l ins
uran
ce?
YE
S
N
O
HO
LID
AYS
/LE
AV
ES
......
..1
......
...2
HE
ALT
H C
AR
D...
......
......
.1...
......
2
SO
CIA
L IN
SU
RA
NC
E...
...1
......
...2
YE
S
N
O
HO
LID
AYS
/LE
AV
ES
......
..1...
......
2
HE
ALT
H C
AR
D...
......
......
.1...
......
2
SO
CIA
L IN
SU
RA
NC
E...
...1
......
...2
YE
S
N
O
HO
LID
AYS
/LE
AV
ES
......
..1...
......
2
HE
ALT
H C
AR
D...
......
......
.1...
......
2
SO
CIA
L IN
SU
RA
NC
E...
...1
......
...2
YE
S
N
O
HO
LID
AYS
/LE
AV
ES
......
..1.
......
..2
HE
ALT
H C
AR
D...
......
......
.1...
......
2
SO
CIA
L IN
SU
RA
NC
E...
...1.
......
..2
68.
Is t
he v
enue
whe
re y
ou w
orke
d in
a fi
xed
offic
e, a
t hom
e/ho
me
of
clie
nt,
mar
ket/t
rade
ce
nter
an
ou
tdoo
r fix
ed
plac
e or
m
obile
pl
ace?
FIX
ED
OFF
ICE
......
......
......
......
....1
HO
ME
/HO
ME
OF
CLI
EN
T...
......
..2
MA
RK
ET/
TRA
DE
CE
NTE
R...
......
3
OU
TDO
OR
FIX
ED
PLA
CE
......
....4
MO
BIL
E...
......
......
......
......
......
......
.5
FIX
ED
OFF
ICE
......
......
......
......
.....
1
HO
ME
/ H
OM
E O
F C
LIE
NT
......
...2
MA
RK
ET
/ TR
AD
E C
EN
TER
......
.3
OU
TDO
OR
FIX
ED
PLA
CE
......
....4
MO
BIL
E...
......
......
......
......
......
......
.5
FIX
ED
OFF
ICE
......
......
......
......
....1
HO
ME
/ H
OM
E O
F C
LIE
NT
......
...2
MA
RK
ET
/ TR
AD
E C
EN
TER
......
.3
OU
TDO
OR
FIX
ED
PLA
CE
......
....4
MO
BIL
E...
......
......
......
......
......
......
.5
FIX
ED
OFF
ICE
......
......
......
......
....1
HO
ME
/ H
OM
E O
F C
LIE
NT.
......
..2
MA
RK
ET
/ TR
AD
E C
EN
TER
......
.3
OU
TDO
OR
FIX
ED
PLA
CE
......
....4
MO
BIL
E...
......
......
......
......
......
......
5
69. C
HE
CK
Q64
: IF
Q64
= 4
Q
70;
OTH
ER
WIS
E
Q
72
70 I
n th
e ab
ove-
men
tione
d ov
ertim
e jo
b, h
ow m
uch
sala
ry/w
age
did
you
rece
ive
durin
g th
e la
st
mon
th?
(TH
OU
SA
ND
VN
D)
(TH
OU
SA
ND
VN
D)
(TH
OU
SA
ND
VN
D)
(TH
OU
SA
ND
VN
D)

19
HO
US
EH
OLD
NO
.:..
NA
ME
AN
D O
RD
ER N
O.
QU
ESTI
ON
S
____
____
____
____
____
___
____
____
____
____
____
___
____
____
____
____
____
__
____
____
____
____
____
___
71.
With
abo
ve-m
entio
ned
job,
how
m
uch
did
you
rece
ive
paym
ent o
f ov
ertim
e,
prem
ium
, oc
cupa
tion
allo
wan
ce
and
othe
r w
elfa
re
durin
g th
e la
st m
onth
?
(TH
OU
SA
ND
VN
D)
(TH
OU
SA
ND
VN
D)
(TH
OU
SA
ND
VN
D)
(TH
OU
SA
ND
VN
D)
72. H
ow m
any
hour
s di
d yo
u ac
tual
ly
wor
k fo
r th
e m
ain
abov
e-m
entio
ned
seco
ndar
y ac
tivity
du
ring
last
7 d
ays?
AC
TUA
L W
OR
KE
D H
OU
RS
FOR
TH
E S
EC
ON
DA
RY
JOB
PE
R W
EE
K .
......
......
......
......
.....
AC
TUA
L W
OR
KE
D H
OU
RS
FOR
TH
E S
EC
ON
DA
RY
JOB
PE
R W
EE
K ..
......
......
......
......
.....
AC
TUA
L W
OR
KE
D H
OU
RS
FOR
TH
E S
EC
ON
DA
RY
JOB
PE
R W
EE
K .
......
......
......
......
.....
AC
TUA
L W
OR
KE
D H
OU
RS
FOR
TH
E S
EC
ON
DA
RY
JOB
PE
R W
EE
K ..
......
......
......
......
.....
73. C
HE
CK
Q57
: IF
Q57
= 2
Q74
; O
THE
RW
ISE
Q75
74. H
ow m
any
hour
s di
d yo
u ac
tual
ly
do
all
of
othe
r re
mai
ning
ac
tiviti
es
(not
in
clud
ing
the
mai
n jo
b an
d th
e m
ain
seco
ndar
y jo
b)
durin
g la
st
7 da
ys?
AC
TUA
L W
OR
KE
D H
OU
RS
FO
R A
LL O
F O
THE
R
RE
MA
ININ
G A
CTI
VIT
IES
P
ER
WE
EK
....
......
......
......
......
......
.....
AC
TUA
L W
OR
KE
D H
OU
RS
FO
R A
LL O
F O
THE
R
RE
MA
ININ
G A
CTI
VIT
IES
P
ER
WE
EK
.....
......
......
......
......
......
.....
AC
TUA
L W
OR
KE
D H
OU
RS
FO
R A
LL O
F O
THE
R
RE
MA
ININ
G A
CTI
VIT
IES
P
ER
WE
EK
....
......
......
......
......
......
.....
AC
TUA
L W
OR
KE
D H
OU
RS
FO
R A
LL O
F O
THE
R
RE
MA
ININ
G A
CTI
VIT
IES
P
ER
WE
EK
.....
......
......
......
......
......
.....
75.
TOTA
L O
F A
CTU
AL
WO
RK
ED
HO
UR
S FO
R A
LL O
F TH
E J
OB
S D
UR
ING
TH
E L
AS
T 7
DA
YS
REM
AR
K:
SU
M
RE
SU
LTS
IN
Q
53,
Q72
A
ND
Q74
AC
TUA
L W
OR
KE
D H
OU
RS
P
ER
WE
EK
....
......
......
......
......
......
.....
AC
TUA
L W
OR
KE
D H
OU
RS
P
ER
WE
EK
.....
......
......
......
......
......
.....
AC
TUA
L W
OR
KE
D H
OU
RS
P
ER
WE
EK
....
......
......
......
......
......
.....
AC
TUA
L W
OR
KE
D H
OU
RS
P
ER
WE
EK
.....
......
......
......
......
......
.....
76. C
HE
CK
Q75
: IF
Q75
< 3
5 H
OU
RS
Q77
; O
THE
RW
ISE
Q80
77.
With
tot
al o
f th
e ab
ove
hour
s ac
tual
ly w
orke
d, w
ould
you
lik
e to
wor
k m
ore
hour
s?
YES
......
......
......
......
......
....1
NO
......
......
......
......
......
......
2
Q
80
YES
......
......
......
......
......
....1
NO
......
......
......
......
......
......
2
Q
80
YES
......
......
......
......
......
....1
NO
......
......
......
......
......
......
2
Q
80
YES
......
......
......
......
......
....1
NO
......
......
......
......
......
......
2
Q
80

20
N
AM
E A
ND
OR
DER
NO
. Q
UES
TIO
NS
____
____
____
____
____
___
____
____
____
____
____
___
____
____
____
____
____
__
____
____
____
____
____
___
78.
You
wou
ld l
ike
to w
ork
mor
e ho
urs,
but
are
you
ava
ilabl
e to
w
ork
mor
e ho
urs?
YES
......
......
......
......
......
....1
NO
......
......
......
......
......
......
2
Q
80
YES
......
......
......
......
......
....1
NO
......
......
......
......
......
......
2
Q
80
YES
......
......
......
......
......
....1
NO
......
......
......
......
......
......
2
Q
80
YES
......
......
......
......
......
....1
NO
......
......
......
......
......
......
2
Q
80
79.
How
man
y ad
ditio
nal h
ours
wou
ld
you
like
to w
ork
per w
eek?
HO
UR
S/W
EE
K ..
......
......
......
.....
HO
UR
S/W
EE
K ..
......
......
......
.....
HO
UR
S/W
EE
K ..
......
......
......
.....
HO
UR
S/W
EE
K .
......
......
......
.....
80.
CH
ECK
: Q
37
HA
S
INFO
RM
ATI
ON
, EM
PLO
YMEN
T IS
IDEN
TIFI
ED.
C
HEC
K: C
21=1
AN
D C
24=1
, OR
C24
=1 A
ND
C
23=4
/5/6
/7/8
/9,
UN
-EM
PLO
YMEN
T IS
ID
ENTI
FIED
.
C
HEC
K:
C78
= 1
, U
ND
ER
-EM
PLO
YMEN
T IS
ID
ENTI
FIED
..
YE
S
N
O
EM
PLO
YED
......
......
......
...1
......
...2
UN
EM
PLO
YED
......
......
....1
......
...2
UN
DE
R-E
MP
LOYE
D...
....1
......
...2
YE
S
N
O
EM
PLO
YED
......
......
......
...1
......
...2
UN
EM
PLO
YED
......
......
....1
......
...2
UN
DE
R-E
MP
LOYE
D...
....1
......
...2
YE
S
N
O
EM
PLO
YED
......
......
......
...1
......
...2
UN
EM
PLO
YED
......
......
....1
......
...2
UN
DE
R-E
MP
LOYE
D...
....1
......
...2
YE
S
N
O
EM
PLO
YED
......
......
......
...1.
......
..2
UN
EM
PLO
YED
......
......
....1
......
...2
UN
DE
R-E
MP
LOYE
D...
....1
......
...2
81: C
HECK
Q7:
IF T
HERE
AR
E RE
MAI
N RE
SPO
NDEN
TS F
OR
INTE
RVIE
W O
F “P
ART
2: IN
DIVI
DUAL
QUE
STIO
NNAI
RE”,
ASK
THE
NEX
T; O
THER
WIS
E, F
INIS
H IN
TERV
IEW
.