Embed Size (px)
Citation preview
Santos, DN; Assis, AM; Bastos, AC; Santos, LM; Santos, CA; St-rina, A; Prado, MS; Almeida-Filho, NM; Rodrigues, LC; Barreto,ML (2008) Determinants of cognitive function in childhood: a cohortstudy in a middle income context. BMC Public Health, 8 (1). p.202. ISSN 1471-2458 DOI: 10.1186/1471-2458-8-202
Downloaded from: http://researchonline.lshtm.ac.uk/7526/
DOI: 10.1186/1471-2458-8-202
Usage Guidelines
Please refer to usage guidelines at http://researchonline.lshtm.ac.uk/policies.html or alterna-tively contact [email protected].
Available under license: http://creativecommons.org/licenses/by/2.5/
BioMed Central
Page 1 of 15(page number not for citation purposes)
BMC Public Health
Open AccessResearch articleDeterminants of cognitive function in childhood: A cohort study in a middle income contextDarci N Santos*1, Ana Marlúcia O Assis2, Ana Cecília S Bastos3, Letícia M Santos1, Carlos Antonio ST Santos1, Agostino Strina1, Matildes S Prado1, Naomar M Almeida-Filho1, Laura C Rodrigues4 and Mauricio L Barreto1
Address: 1Department of Collective Health, Institute of Collective Health, Federal University of Bahia, Salvador, Brazil, 2Department of of Nutritional Science, School of Nutrition, Federal University of Bahia, Salvador, Brazil, 3Department of Psychology, School of Philosophy and Human Sciences, Federal University of Bahia, Salvador, Brazil and 4Department of Infectious and Tropical Diseases – London School of Hygiene & Tropical Medicine, London, UK
Email: Darci N Santos* - [email protected]; Ana Marlúcia O Assis - [email protected]; Ana Cecília S Bastos - [email protected]; Letícia M Santos - [email protected]; Carlos Antonio ST Santos - [email protected]; Agostino Strina - [email protected]; Matildes S Prado - [email protected]; Naomar M Almeida-Filho - [email protected]; Laura C Rodrigues - [email protected]; Mauricio L Barreto - [email protected]
* Corresponding author
AbstractBackground: There is evidence that poverty, health and nutrition affect children's cognitivedevelopment. This study aimed to examine the relative contributions of both proximal and distalrisk factors on child cognitive development, by breaking down the possible causal pathways throughwhich poverty affects cognition.
Methods: This cohort study collected data on family socioeconomic status, household andneighbourhood environmental conditions, child health and nutritional status, psychosocialstimulation and nursery school attendance. The effect of these on Wechsler Pre-School andPrimary Scale of Intelligence scores at five years of age was investigated using a multivariablehierarchical analysis, guided by the proposed conceptual framework.
Results: Unfavourable socioeconomic conditions, poorly educated mother, absent father, poorsanitary conditions at home and in the neighbourhood and low birth weight were negativelyassociated with cognitive performance at five years of age, while strong positive associations werefound with high levels of domestic stimulation and nursery school attendance.
Conclusion: Children's cognitive development in urban contexts in developing countries could besubstantially increased by interventions promoting early psychosocial stimulation and preschoolexperience, together with efforts to prevent low birth weight and promote adequate nutritionalstatus.
Published: 6 June 2008
BMC Public Health 2008, 8:202 doi:10.1186/1471-2458-8-202
Received: 27 January 2007Accepted: 6 June 2008
This article is available from: http://www.biomedcentral.com/1471-2458/8/202
© 2008 Santos et al; licensee BioMed Central Ltd. This is an Open Access article distributed under the terms of the Creative Commons Attribution License (http://creativecommons.org/licenses/by/2.0), which permits unrestricted use, distribution, and reproduction in any medium, provided the original work is properly cited.
BMC Public Health 2008, 8:202 http://www.biomedcentral.com/1471-2458/8/202
Page 2 of 15(page number not for citation purposes)
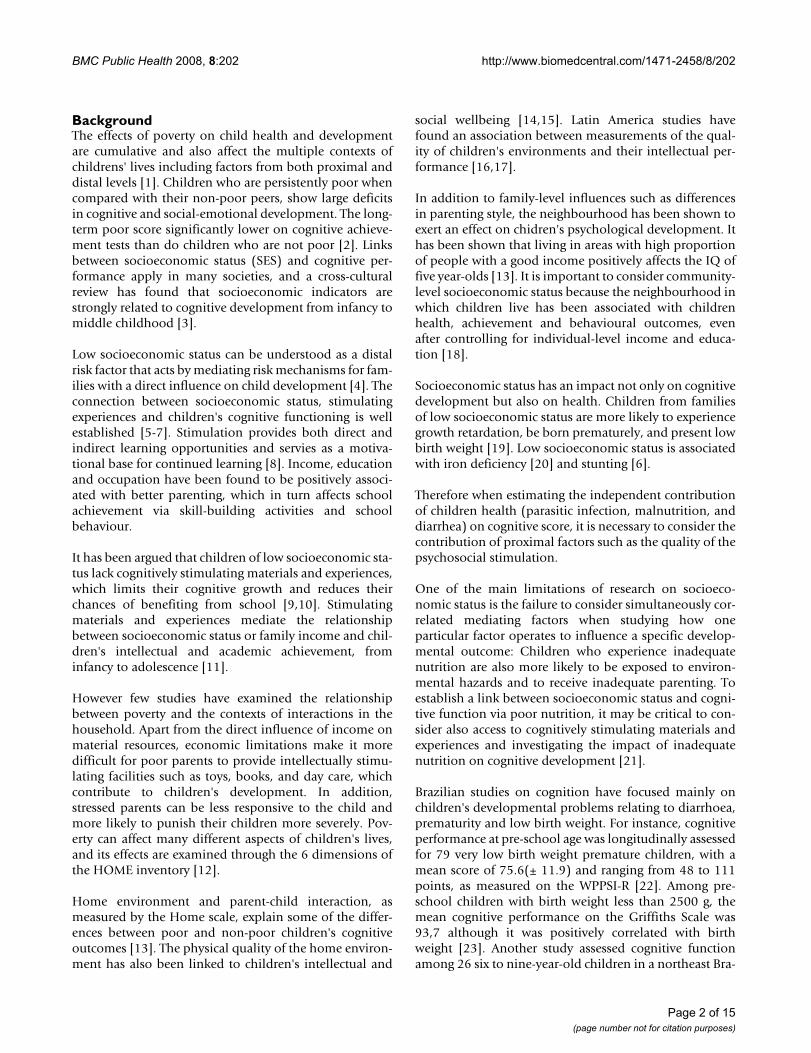
BackgroundThe effects of poverty on child health and developmentare cumulative and also affect the multiple contexts ofchildrens' lives including factors from both proximal anddistal levels [1]. Children who are persistently poor whencompared with their non-poor peers, show large deficitsin cognitive and social-emotional development. The long-term poor score significantly lower on cognitive achieve-ment tests than do children who are not poor [2]. Linksbetween socioeconomic status (SES) and cognitive per-formance apply in many societies, and a cross-culturalreview has found that socioeconomic indicators arestrongly related to cognitive development from infancy tomiddle childhood [3].
Low socioeconomic status can be understood as a distalrisk factor that acts by mediating risk mechanisms for fam-ilies with a direct influence on child development [4]. Theconnection between socioeconomic status, stimulatingexperiences and children's cognitive functioning is wellestablished [5-7]. Stimulation provides both direct andindirect learning opportunities and servies as a motiva-tional base for continued learning [8]. Income, educationand occupation have been found to be positively associ-ated with better parenting, which in turn affects schoolachievement via skill-building activities and schoolbehaviour.
It has been argued that children of low socioeconomic sta-tus lack cognitively stimulating materials and experiences,which limits their cognitive growth and reduces theirchances of benefiting from school [9,10]. Stimulatingmaterials and experiences mediate the relationshipbetween socioeconomic status or family income and chil-dren's intellectual and academic achievement, frominfancy to adolescence [11].
However few studies have examined the relationshipbetween poverty and the contexts of interactions in thehousehold. Apart from the direct influence of income onmaterial resources, economic limitations make it moredifficult for poor parents to provide intellectually stimu-lating facilities such as toys, books, and day care, whichcontribute to children's development. In addition,stressed parents can be less responsive to the child andmore likely to punish their children more severely. Pov-erty can affect many different aspects of children's lives,and its effects are examined through the 6 dimensions ofthe HOME inventory [12].
Home environment and parent-child interaction, asmeasured by the Home scale, explain some of the differ-ences between poor and non-poor children's cognitiveoutcomes [13]. The physical quality of the home environ-ment has also been linked to children's intellectual and
social wellbeing [14,15]. Latin America studies havefound an association between measurements of the qual-ity of children's environments and their intellectual per-formance [16,17].
In addition to family-level influences such as differencesin parenting style, the neighbourhood has been shown toexert an effect on chidren's psychological development. Ithas been shown that living in areas with high proportionof people with a good income positively affects the IQ offive year-olds [13]. It is important to consider community-level socioeconomic status because the neighbourhood inwhich children live has been associated with childrenhealth, achievement and behavioural outcomes, evenafter controlling for individual-level income and educa-tion [18].
Socioeconomic status has an impact not only on cognitivedevelopment but also on health. Children from familiesof low socioeconomic status are more likely to experiencegrowth retardation, be born prematurely, and present lowbirth weight [19]. Low socioeconomic status is associatedwith iron deficiency [20] and stunting [6].
Therefore when estimating the independent contributionof children health (parasitic infection, malnutrition, anddiarrhea) on cognitive score, it is necessary to consider thecontribution of proximal factors such as the quality of thepsychosocial stimulation.
One of the main limitations of research on socioeco-nomic status is the failure to consider simultaneously cor-related mediating factors when studying how oneparticular factor operates to influence a specific develop-mental outcome: Children who experience inadequatenutrition are also more likely to be exposed to environ-mental hazards and to receive inadequate parenting. Toestablish a link between socioeconomic status and cogni-tive function via poor nutrition, it may be critical to con-sider also access to cognitively stimulating materials andexperiences and investigating the impact of inadequatenutrition on cognitive development [21].
Brazilian studies on cognition have focused mainly onchildren's developmental problems relating to diarrhoea,prematurity and low birth weight. For instance, cognitiveperformance at pre-school age was longitudinally assessedfor 79 very low birth weight premature children, with amean score of 75.6(± 11.9) and ranging from 48 to 111points, as measured on the WPPSI-R [22]. Among pre-school children with birth weight less than 2500 g, themean cognitive performance on the Griffiths Scale was93,7 although it was positively correlated with birthweight [23]. Another study assessed cognitive functionamong 26 six to nine-year-old children in a northeast Bra-
BMC Public Health 2008, 8:202 http://www.biomedcentral.com/1471-2458/8/202
Page 3 of 15(page number not for citation purposes)
zilian shantytown who had undergone full surveillancefor diarrhoea over their first two years of life, and found anegative association between diarrhoea burden and threemeasurements of cognitive function [24]. However onequestion to be raised in relation to these and several otherfindings of associations between poor cognitive functionand early health and nutritional status is whether themain association was adequately controlled for con-founders.
The question concerning the possible association betweenearly health and nutritional factors and cognition hasbeen recently addressed by a well designed Peruvian studythat used a complex set of variables and controlled for sev-eral potential confounders. It identified an associationbetween malnutrition and G. lamblia infection on cogni-tive performance [25]. However, even this study did notinclude any variable related with psychosocial stimula-tion, which is a relevant factor related with cognitive per-formance, [26] and consequently an important potentialconfounder of the role of poor nutrition and infection oncognitive performance. Inadequate psychosocial stimula-tion, undernutrition and infections are more commonamong poor children, and psychosocial stimulation,along with the physical quality of the home environment,is recognized as an intermediate level in the determina-tion process, mediating the effect of socioeconomic statuson children's cognitive development [13]. It is thereforelogical to argue that failure to control for psychosocialstimulation could lead to an overestimation of the impactof nutritional deficit and infections on the cognitive defi-cit.
As it is not yet fully known how the various componentsof socioeconomic status interact with other aspects offamily, neighbourhood context and children's individualhealth to affect cognitive performance, we put forward theaim of examining how socioeconomic status operatesthrough multiple factors simultaneously to affect cogni-tive performance. We hypothesised that family materialresources and status would be important determinants ofcognitive outcomes among poor urban Brazilian childrenand that the effects of poverty would be partially mediatedby poor environmental quality (both in the householdand in the neighbourhood) and lower psychosocial stim-ulation and these effects on cognitive score would not befully dependent on children's health and nutritional sta-tus. In order to examine this hypothesis, and attemptingto overcome the short-comings of previous research a richset of data at the individual, household and neighbor-hood levels would be required.
The aim of this study was to examine the impact of pov-erty on cognitive scores at five years of age, by breakingdown the possible causal pathways through which pov-
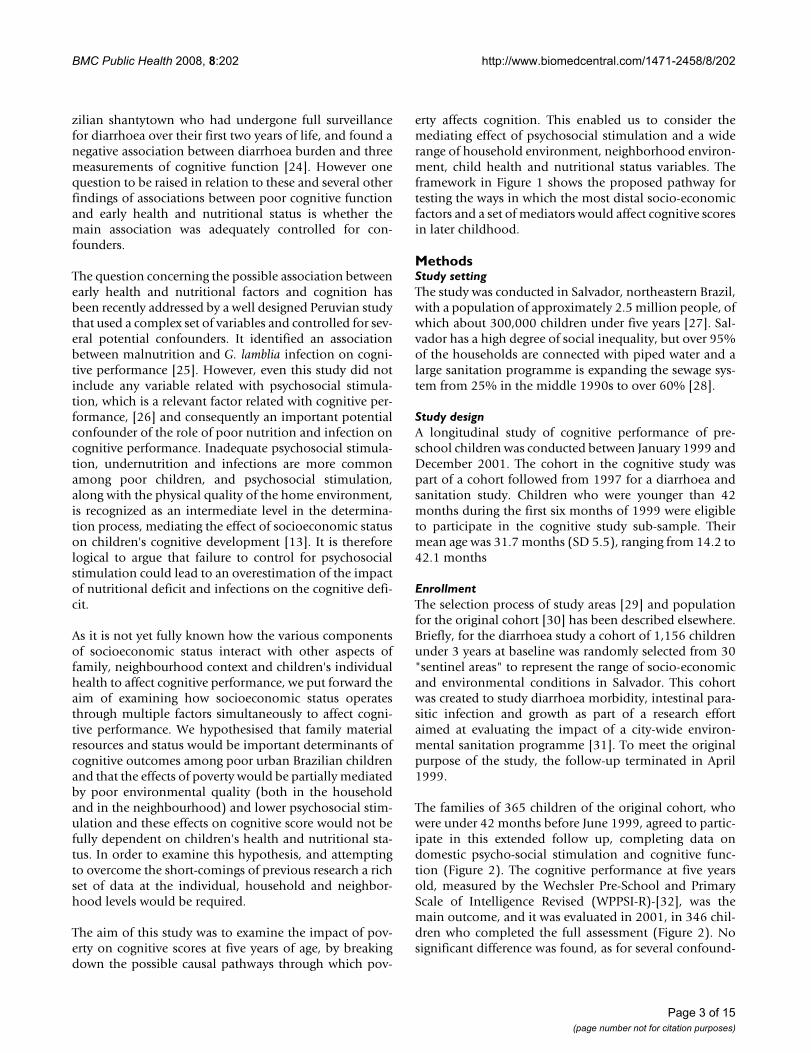
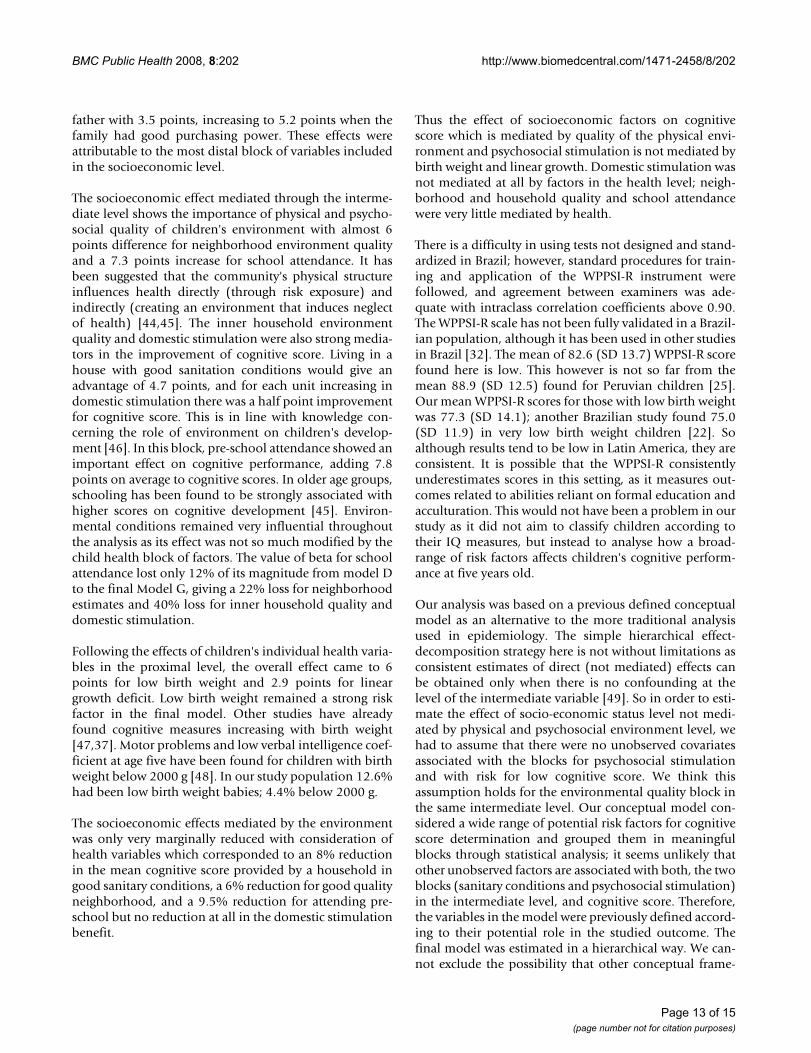
erty affects cognition. This enabled us to consider themediating effect of psychosocial stimulation and a widerange of household environment, neighborhood environ-ment, child health and nutritional status variables. Theframework in Figure 1 shows the proposed pathway fortesting the ways in which the most distal socio-economicfactors and a set of mediators would affect cognitive scoresin later childhood.
MethodsStudy settingThe study was conducted in Salvador, northeastern Brazil,with a population of approximately 2.5 million people, ofwhich about 300,000 children under five years [27]. Sal-vador has a high degree of social inequality, but over 95%of the households are connected with piped water and alarge sanitation programme is expanding the sewage sys-tem from 25% in the middle 1990s to over 60% [28].
Study designA longitudinal study of cognitive performance of pre-school children was conducted between January 1999 andDecember 2001. The cohort in the cognitive study waspart of a cohort followed from 1997 for a diarrhoea andsanitation study. Children who were younger than 42months during the first six months of 1999 were eligibleto participate in the cognitive study sub-sample. Theirmean age was 31.7 months (SD 5.5), ranging from 14.2 to42.1 months
EnrollmentThe selection process of study areas [29] and populationfor the original cohort [30] has been described elsewhere.Briefly, for the diarrhoea study a cohort of 1,156 childrenunder 3 years at baseline was randomly selected from 30"sentinel areas" to represent the range of socio-economicand environmental conditions in Salvador. This cohortwas created to study diarrhoea morbidity, intestinal para-sitic infection and growth as part of a research effortaimed at evaluating the impact of a city-wide environ-mental sanitation programme [31]. To meet the originalpurpose of the study, the follow-up terminated in April1999.
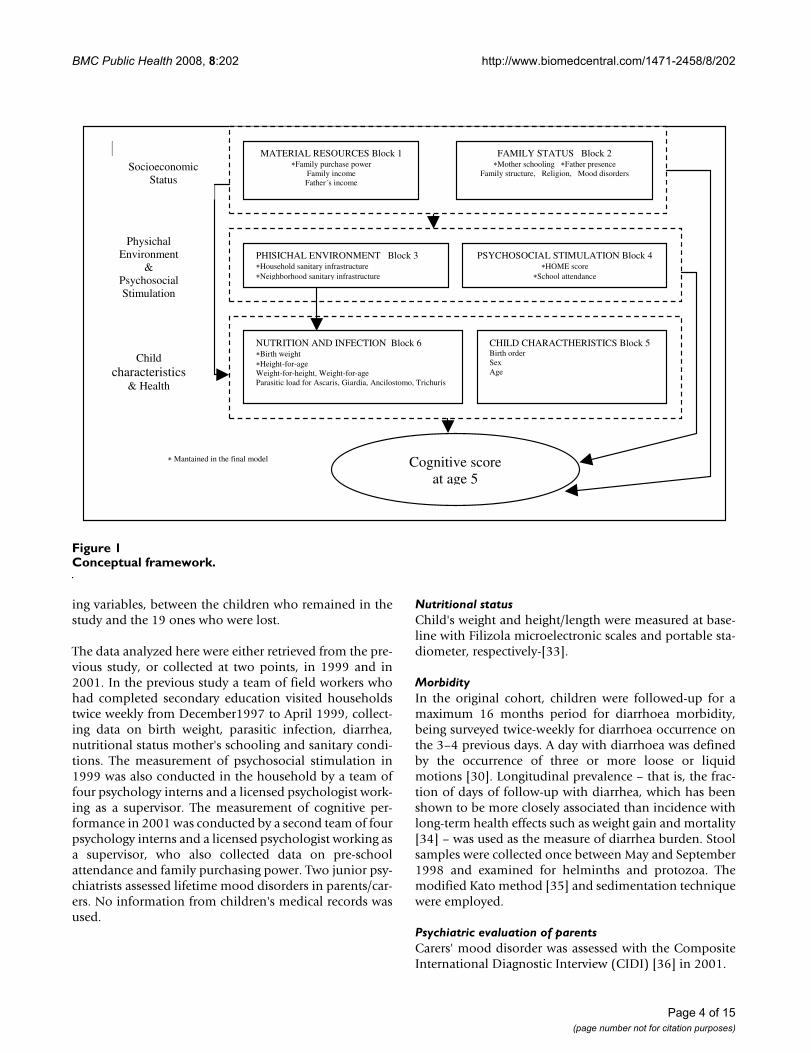
The families of 365 children of the original cohort, whowere under 42 months before June 1999, agreed to partic-ipate in this extended follow up, completing data ondomestic psycho-social stimulation and cognitive func-tion (Figure 2). The cognitive performance at five yearsold, measured by the Wechsler Pre-School and PrimaryScale of Intelligence Revised (WPPSI-R)-[32], was themain outcome, and it was evaluated in 2001, in 346 chil-dren who completed the full assessment (Figure 2). Nosignificant difference was found, as for several confound-
BMC Public Health 2008, 8:202 http://www.biomedcentral.com/1471-2458/8/202
Page 4 of 15(page number not for citation purposes)
ing variables, between the children who remained in thestudy and the 19 ones who were lost.
The data analyzed here were either retrieved from the pre-vious study, or collected at two points, in 1999 and in2001. In the previous study a team of field workers whohad completed secondary education visited householdstwice weekly from December1997 to April 1999, collect-ing data on birth weight, parasitic infection, diarrhea,nutritional status mother's schooling and sanitary condi-tions. The measurement of psychosocial stimulation in1999 was also conducted in the household by a team offour psychology interns and a licensed psychologist work-ing as a supervisor. The measurement of cognitive per-formance in 2001 was conducted by a second team of fourpsychology interns and a licensed psychologist working asa supervisor, who also collected data on pre-schoolattendance and family purchasing power. Two junior psy-chiatrists assessed lifetime mood disorders in parents/car-ers. No information from children's medical records wasused.
Nutritional statusChild's weight and height/length were measured at base-line with Filizola microelectronic scales and portable sta-diometer, respectively-[33].
MorbidityIn the original cohort, children were followed-up for amaximum 16 months period for diarrhoea morbidity,being surveyed twice-weekly for diarrhoea occurrence onthe 3–4 previous days. A day with diarrhoea was definedby the occurrence of three or more loose or liquidmotions [30]. Longitudinal prevalence – that is, the frac-tion of days of follow-up with diarrhea, which has beenshown to be more closely associated than incidence withlong-term health effects such as weight gain and mortality[34] – was used as the measure of diarrhea burden. Stoolsamples were collected once between May and September1998 and examined for helminths and protozoa. Themodified Kato method [35] and sedimentation techniquewere employed.
Psychiatric evaluation of parentsCarers' mood disorder was assessed with the CompositeInternational Diagnostic Interview (CIDI) [36] in 2001.
Conceptual frameworkFigure 1Conceptual framework.
MATERIAL RESOURCES Block 1Family purchase power
Family income Father´s income
FAMILY STATUS Block 2 Mother schooling Father presence
Family structure, Religion, Mood disorders
PHISICHAL ENVIRONMENT Block 3 Household sanitary infrastructure Neighborhood sanitary infrastructure
PSYCHOSOCIAL STIMULATION Block 4HOME score
School attendance
NUTRITION AND INFECTION Block 6 Birth weight Height-for-age
Weight-for-height, Weight-for-age Parasitic load for Ascaris, Giardia, Ancilostomo, Trichuris
CHILD CHARACTHERISTICS Block 5 Birth order Sex Age
Cognitive score at age 5
Mantained in the final model
Child characteristics
& Health
Socioeconomic
Status
Physichal Environment
& Psychosocial Stimulation
BMC Public Health 2008, 8:202 http://www.biomedcentral.com/1471-2458/8/202
Page 5 of 15(page number not for citation purposes)
StimulationThe Home Observation for Measurement of the Environ-ment Inventory (HOME) [37], is an instrument-basedquestionnaire that provides a summary value which esti-mates the quality of psychosocial stimulation a childreceives at home. This is based on characteristics of thehome environment and interactions between mother andchild. It has been translated into Portuguese and used inprevious studies-[38]. In our study the inter-rater reliabil-ity was assessed in a sub-sample of 56 children with a veryhigh intraclass correlation coefficient for the full scale. Anadequate range may vary between 29 and 32 points.
Cognitive performanceCognitive functioning at age 5 was assessed using theWPPSI-R instrument. The full scale intelligence quotienthas a reliability coefficient of 0.96, and a test-retest stabil-ity coefficient of 0.91 [32]. It has been translated into Por-
tuguese and previously applied in Brazil [39]. We assessedinter-observer reliability to verify agreement in the appli-cation of the scale. Intraclass correlation coefficients werevery high: 0.97 (full scale IQ), 0.95 (verbal IQ) and 0.98(performance IQ). The range on this scale may vary from50 to 150 points, and a range of 85 to 115 with an averageperformance of 100 points is considered adequate.
Both rounds of cognitive measurements (1999 and 2001)were conducted by licensed psychologists. Psychiatriststrained in the Brazilian version applied the CIDI [36] tothe carer at home.
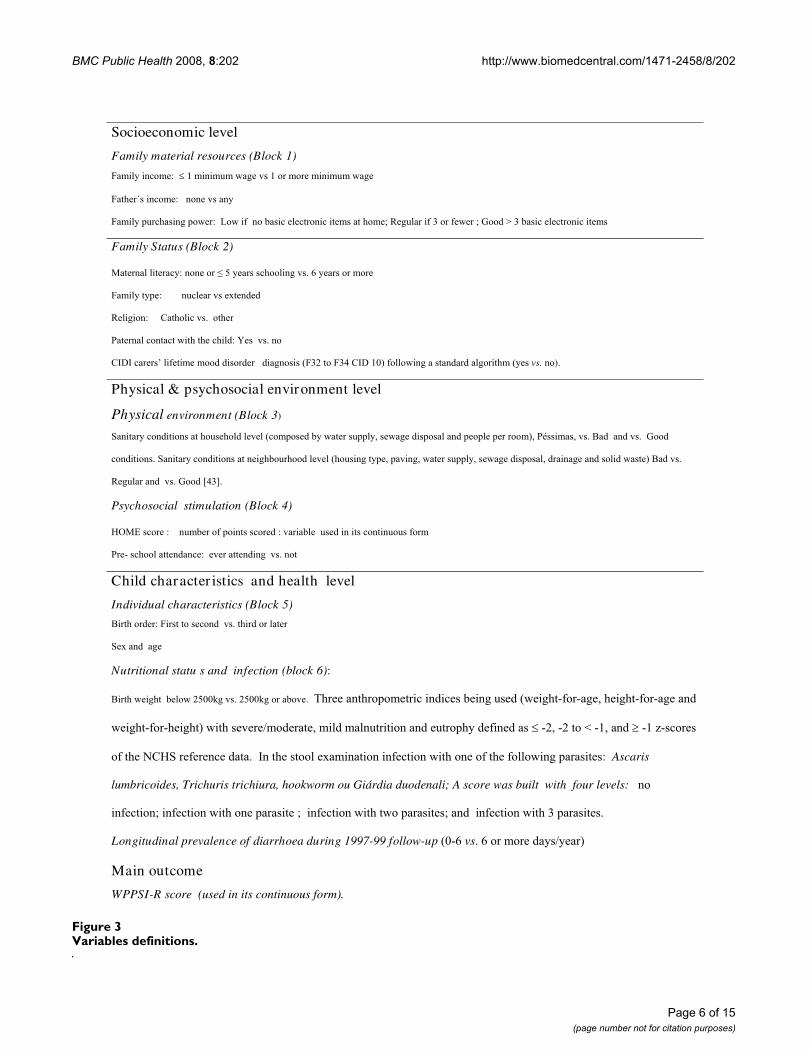
Conceptual model: levels, blocks and variablesVariables were grouped in levels and blocks definedaccording to the proposed causal mechanism expressed bythe conceptual framework (Figure 1) and defined in Fig-ure 3. Three levels were defined, from distal to proximal:
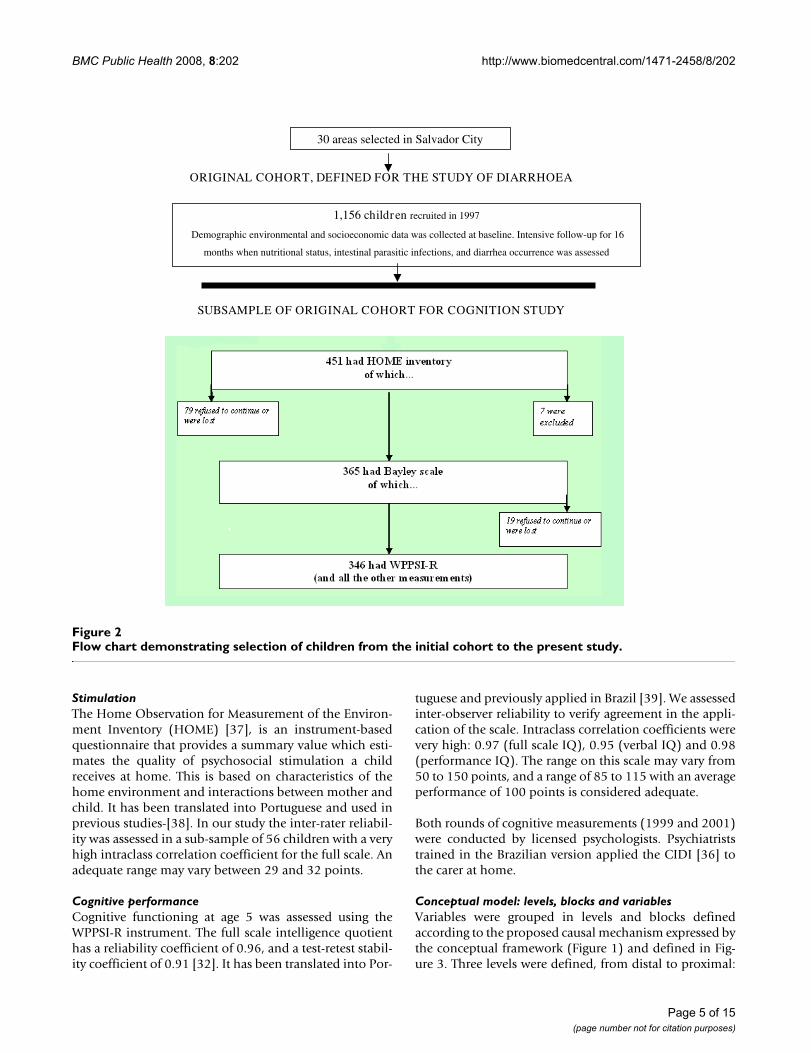
Flow chart demonstrating selection of children from the initial cohort to the present studyFigure 2Flow chart demonstrating selection of children from the initial cohort to the present study.
30 areas selected in Salvador City
ORIGINAL COHORT, DEFINED FOR THE STUDY OF DIARRHOEA
1,156 children recruited in 1997
Demographic environmental and socioeconomic data was collected at baseline. Intensive follow-up for 16
months when nutritional status, intestinal parasitic infections, and diarrhea occurrence was assessed
SUBSAMPLE OF ORIGINAL COHORT FOR COGNITION STUDY
BMC Public Health 2008, 8:202 http://www.biomedcentral.com/1471-2458/8/202
Page 6 of 15(page number not for citation purposes)
Variables definitionsFigure 3Variables definitions.
Socioeconomic level
Family material resources (Block 1) ����������� � ����������������������������������������
������������� ������������
��������������������� ������������������������������������������������������������������� �!����������������������
Family Status (Block 2)
"�������������� ������� �#�����������������$�%���������������
����������� ������������������&�� � ��������������������������
������� �����'���������$���������
(������������������������ �)������$���
'*+*������,������������� � ���� ����� ��������-��.������/�'*+��01��������������� �� �����������-����vs.��)$�
Physical & psychosocial environment level
Physical environment (Block 3)
2�������� ����������������� �������-������ ����������������3�������� ��������� ����������������13�(4������3���$�5� ��� ���$����� �
� �����$�2�������� �������������������� �������-�����������3������3�������������3�������� �������3� �������� ����� ������1�5� ���$�
��������� ����$���� �6/�7$�
Psychosocial stimulation (Block 4)
89":������ ����������������������� � �������������� ��������������������
(��;����������� �� ����������� ������$����
Child character istics and health level
Individual characteristics (Block 5)
5������� �� ������������� ����$����� ����������
2�&�� ������
Nutritional statu s and infection (block 6) ��
5�������������������.#00<����$�.#00<����������$��=������������������� ������������ �-������;���;���3�������;���;����� �
������;���;������1������������>�� �����3���� ������������� ���������� ���� ���� �;.3�;.����?�;�3�� � �;��@;������
�������A'82��������� ���$��*������������&������������������������������������������������ ��Ascaris
lumbricoides, Trichuris trichiura, hookworm ou Giárdia duodenali; A score was built with four levels:�����
��������������������������������������������������������������� �������������������������$�
Longitudinal prevalence of diarrhoea during 1997-99 follow-up�-0;%�vs$�%��������� ���>����1�
Main outcome
WPPSI-R score (used in its continuous form).
BMC Public Health 2008, 8:202 http://www.biomedcentral.com/1471-2458/8/202
Page 7 of 15(page number not for citation purposes)
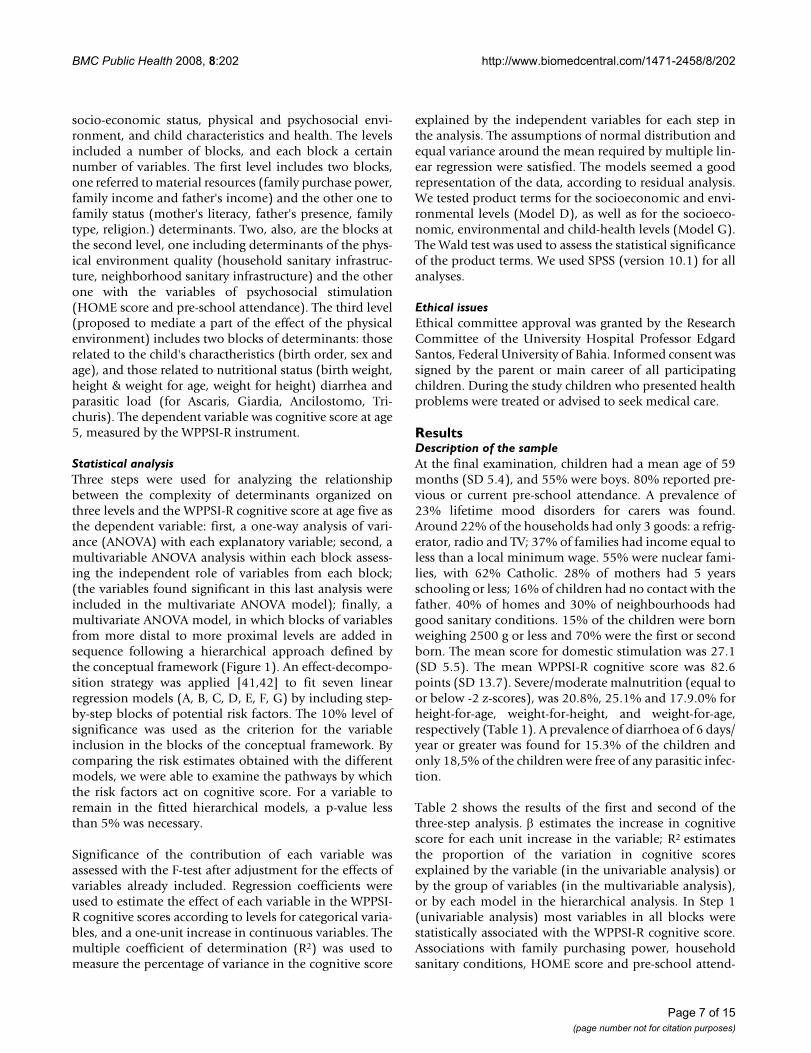
socio-economic status, physical and psychosocial envi-ronment, and child characteristics and health. The levelsincluded a number of blocks, and each block a certainnumber of variables. The first level includes two blocks,one referred to material resources (family purchase power,family income and father's income) and the other one tofamily status (mother's literacy, father's presence, familytype, religion.) determinants. Two, also, are the blocks atthe second level, one including determinants of the phys-ical environment quality (household sanitary infrastruc-ture, neighborhood sanitary infrastructure) and the otherone with the variables of psychosocial stimulation(HOME score and pre-school attendance). The third level(proposed to mediate a part of the effect of the physicalenvironment) includes two blocks of determinants: thoserelated to the child's charactheristics (birth order, sex andage), and those related to nutritional status (birth weight,height & weight for age, weight for height) diarrhea andparasitic load (for Ascaris, Giardia, Ancilostomo, Tri-churis). The dependent variable was cognitive score at age5, measured by the WPPSI-R instrument.
Statistical analysisThree steps were used for analyzing the relationshipbetween the complexity of determinants organized onthree levels and the WPPSI-R cognitive score at age five asthe dependent variable: first, a one-way analysis of vari-ance (ANOVA) with each explanatory variable; second, amultivariable ANOVA analysis within each block assess-ing the independent role of variables from each block;(the variables found significant in this last analysis wereincluded in the multivariate ANOVA model); finally, amultivariate ANOVA model, in which blocks of variablesfrom more distal to more proximal levels are added insequence following a hierarchical approach defined bythe conceptual framework (Figure 1). An effect-decompo-sition strategy was applied [41,42] to fit seven linearregression models (A, B, C, D, E, F, G) by including step-by-step blocks of potential risk factors. The 10% level ofsignificance was used as the criterion for the variableinclusion in the blocks of the conceptual framework. Bycomparing the risk estimates obtained with the differentmodels, we were able to examine the pathways by whichthe risk factors act on cognitive score. For a variable toremain in the fitted hierarchical models, a p-value lessthan 5% was necessary.
Significance of the contribution of each variable wasassessed with the F-test after adjustment for the effects ofvariables already included. Regression coefficients wereused to estimate the effect of each variable in the WPPSI-R cognitive scores according to levels for categorical varia-bles, and a one-unit increase in continuous variables. Themultiple coefficient of determination (R2) was used tomeasure the percentage of variance in the cognitive score
explained by the independent variables for each step inthe analysis. The assumptions of normal distribution andequal variance around the mean required by multiple lin-ear regression were satisfied. The models seemed a goodrepresentation of the data, according to residual analysis.We tested product terms for the socioeconomic and envi-ronmental levels (Model D), as well as for the socioeco-nomic, environmental and child-health levels (Model G).The Wald test was used to assess the statistical significanceof the product terms. We used SPSS (version 10.1) for allanalyses.
Ethical issuesEthical committee approval was granted by the ResearchCommittee of the University Hospital Professor EdgardSantos, Federal University of Bahia. Informed consent wassigned by the parent or main career of all participatingchildren. During the study children who presented healthproblems were treated or advised to seek medical care.
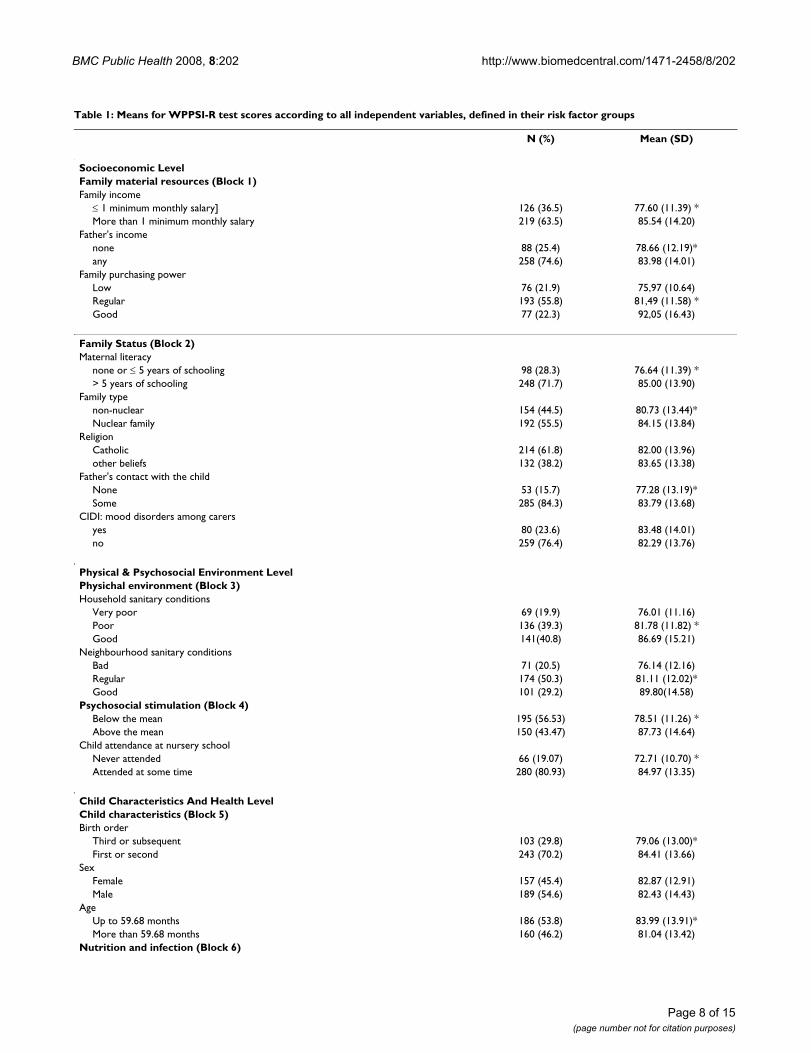
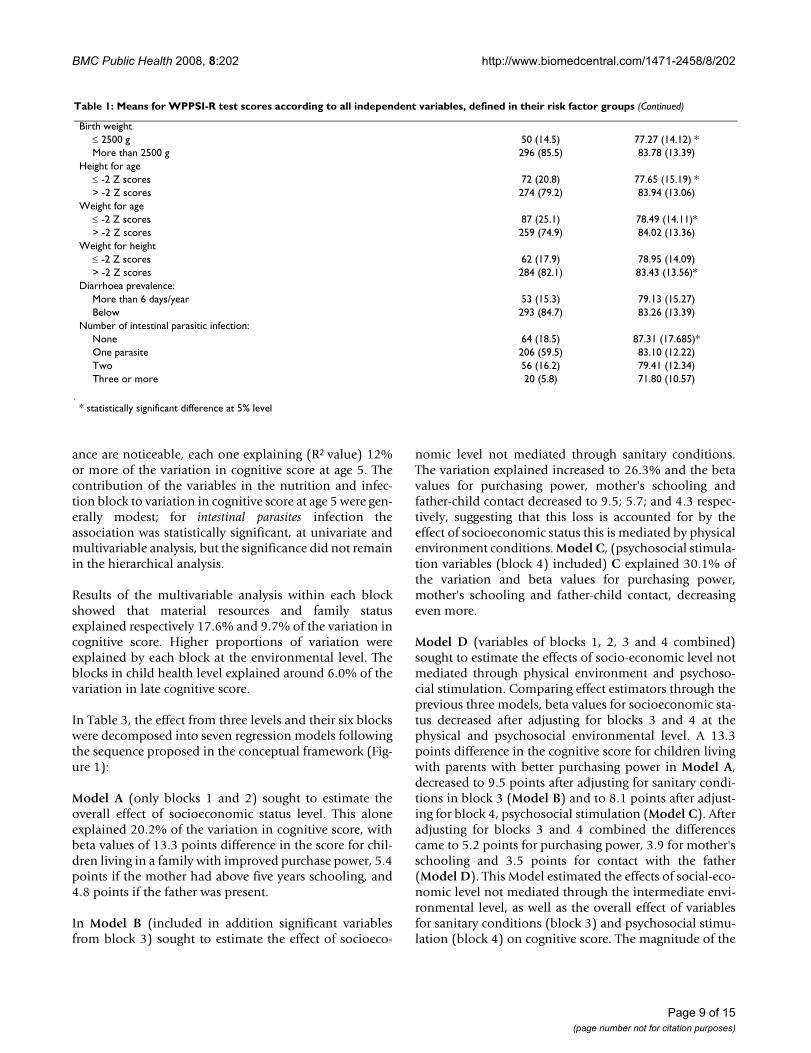
ResultsDescription of the sampleAt the final examination, children had a mean age of 59months (SD 5.4), and 55% were boys. 80% reported pre-vious or current pre-school attendance. A prevalence of23% lifetime mood disorders for carers was found.Around 22% of the households had only 3 goods: a refrig-erator, radio and TV; 37% of families had income equal toless than a local minimum wage. 55% were nuclear fami-lies, with 62% Catholic. 28% of mothers had 5 yearsschooling or less; 16% of children had no contact with thefather. 40% of homes and 30% of neighbourhoods hadgood sanitary conditions. 15% of the children were bornweighing 2500 g or less and 70% were the first or secondborn. The mean score for domestic stimulation was 27.1(SD 5.5). The mean WPPSI-R cognitive score was 82.6points (SD 13.7). Severe/moderate malnutrition (equal toor below -2 z-scores), was 20.8%, 25.1% and 17.9.0% forheight-for-age, weight-for-height, and weight-for-age,respectively (Table 1). A prevalence of diarrhoea of 6 days/year or greater was found for 15.3% of the children andonly 18,5% of the children were free of any parasitic infec-tion.
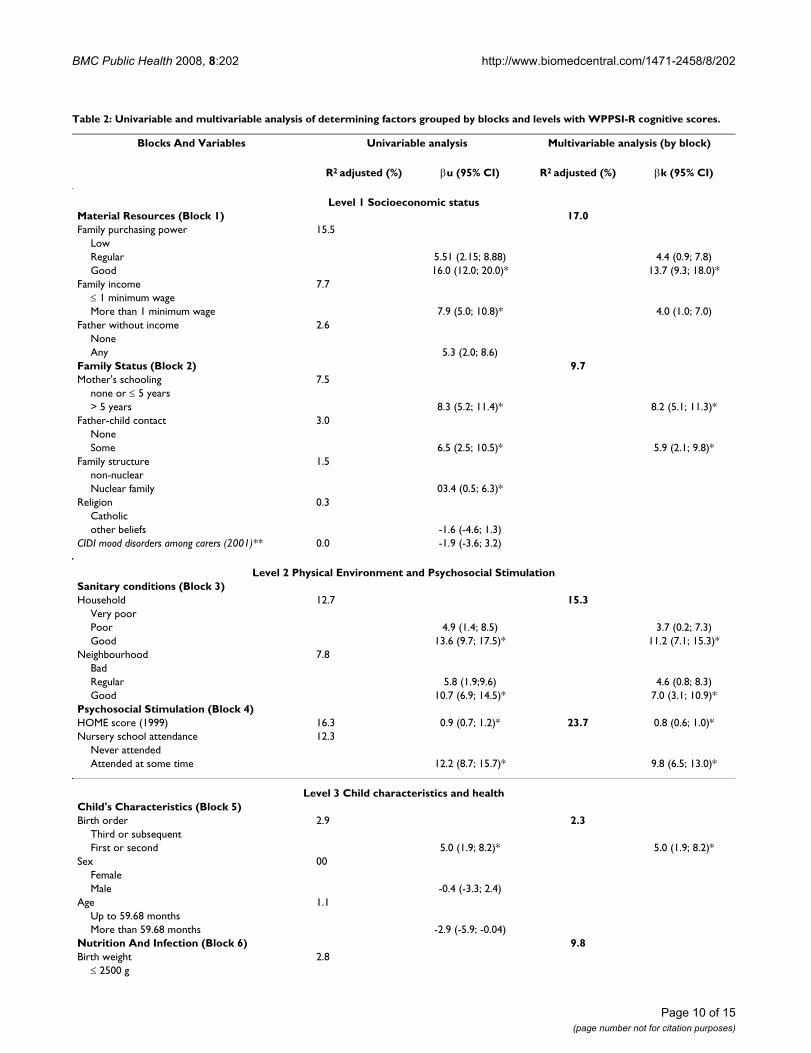
Table 2 shows the results of the first and second of thethree-step analysis. β estimates the increase in cognitivescore for each unit increase in the variable; R2 estimatesthe proportion of the variation in cognitive scoresexplained by the variable (in the univariable analysis) orby the group of variables (in the multivariable analysis),or by each model in the hierarchical analysis. In Step 1(univariable analysis) most variables in all blocks werestatistically associated with the WPPSI-R cognitive score.Associations with family purchasing power, householdsanitary conditions, HOME score and pre-school attend-
BMC Public Health 2008, 8:202 http://www.biomedcentral.com/1471-2458/8/202
Page 8 of 15(page number not for citation purposes)
Table 1: Means for WPPSI-R test scores according to all independent variables, defined in their risk factor groups
N (%) Mean (SD)
Socioeconomic LevelFamily material resources (Block 1)Family income
≤ 1 minimum monthly salary] 126 (36.5) 77.60 (11.39) *More than 1 minimum monthly salary 219 (63.5) 85.54 (14.20)
Father's incomenone 88 (25.4) 78.66 (12.19)*any 258 (74.6) 83.98 (14.01)
Family purchasing powerLow 76 (21.9) 75,97 (10.64)Regular 193 (55.8) 81,49 (11.58) *Good 77 (22.3) 92,05 (16.43)
Family Status (Block 2)Maternal literacy
none or ≤ 5 years of schooling 98 (28.3) 76.64 (11.39) *> 5 years of schooling 248 (71.7) 85.00 (13.90)
Family typenon-nuclear 154 (44.5) 80.73 (13.44)*Nuclear family 192 (55.5) 84.15 (13.84)
ReligionCatholic 214 (61.8) 82.00 (13.96)other beliefs 132 (38.2) 83.65 (13.38)
Father's contact with the childNone 53 (15.7) 77.28 (13.19)*Some 285 (84.3) 83.79 (13.68)
CIDI: mood disorders among carersyes 80 (23.6) 83.48 (14.01)no 259 (76.4) 82.29 (13.76)
Physical & Psychosocial Environment LevelPhysichal environment (Block 3)Household sanitary conditions
Very poor 69 (19.9) 76.01 (11.16)Poor 136 (39.3) 81.78 (11.82) *Good 141(40.8) 86.69 (15.21)
Neighbourhood sanitary conditionsBad 71 (20.5) 76.14 (12.16)Regular 174 (50.3) 81.11 (12.02)*Good 101 (29.2) 89.80(14.58)
Psychosocial stimulation (Block 4)Below the mean 195 (56.53) 78.51 (11.26) *Above the mean 150 (43.47) 87.73 (14.64)
Child attendance at nursery schoolNever attended 66 (19.07) 72.71 (10.70) *Attended at some time 280 (80.93) 84.97 (13.35)
Child Characteristics And Health LevelChild characteristics (Block 5)Birth order
Third or subsequent 103 (29.8) 79.06 (13.00)*First or second 243 (70.2) 84.41 (13.66)
SexFemale 157 (45.4) 82.87 (12.91)Male 189 (54.6) 82.43 (14.43)
AgeUp to 59.68 months 186 (53.8) 83.99 (13.91)*More than 59.68 months 160 (46.2) 81.04 (13.42)
Nutrition and infection (Block 6)
BMC Public Health 2008, 8:202 http://www.biomedcentral.com/1471-2458/8/202
Page 9 of 15(page number not for citation purposes)
Birth weight≤ 2500 g 50 (14.5) 77.27 (14.12) *More than 2500 g 296 (85.5) 83.78 (13.39)
Height for age≤ -2 Z scores 72 (20.8) 77.65 (15.19) *> -2 Z scores 274 (79.2) 83.94 (13.06)
Weight for age≤ -2 Z scores 87 (25.1) 78.49 (14.11)*> -2 Z scores 259 (74.9) 84.02 (13.36)
Weight for height≤ -2 Z scores 62 (17.9) 78.95 (14.09)> -2 Z scores 284 (82.1) 83.43 (13.56)*
Diarrhoea prevalence:More than 6 days/year 53 (15.3) 79.13 (15.27)Below 293 (84.7) 83.26 (13.39)
Number of intestinal parasitic infection:None 64 (18.5) 87.31 (17.685)*One parasite 206 (59.5) 83.10 (12.22)Two 56 (16.2) 79.41 (12.34)Three or more 20 (5.8) 71.80 (10.57)
* statistically significant difference at 5% level
Table 1: Means for WPPSI-R test scores according to all independent variables, defined in their risk factor groups (Continued)
ance are noticeable, each one explaining (R2 value) 12%or more of the variation in cognitive score at age 5. Thecontribution of the variables in the nutrition and infec-tion block to variation in cognitive score at age 5 were gen-erally modest; for intestinal parasites infection theassociation was statistically significant, at univariate andmultivariable analysis, but the significance did not remainin the hierarchical analysis.
Results of the multivariable analysis within each blockshowed that material resources and family statusexplained respectively 17.6% and 9.7% of the variation incognitive score. Higher proportions of variation wereexplained by each block at the environmental level. Theblocks in child health level explained around 6.0% of thevariation in late cognitive score.
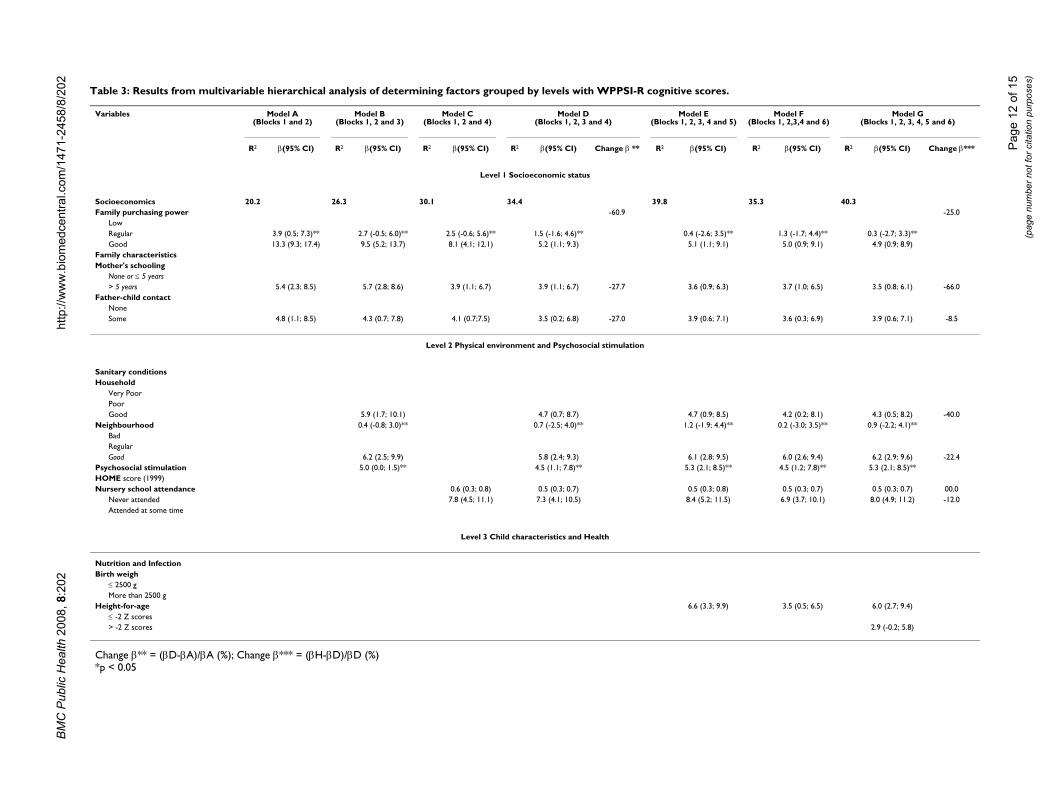
In Table 3, the effect from three levels and their six blockswere decomposed into seven regression models followingthe sequence proposed in the conceptual framework (Fig-ure 1):
Model A (only blocks 1 and 2) sought to estimate theoverall effect of socioeconomic status level. This aloneexplained 20.2% of the variation in cognitive score, withbeta values of 13.3 points difference in the score for chil-dren living in a family with improved purchase power, 5.4points if the mother had above five years schooling, and4.8 points if the father was present.
In Model B (included in addition significant variablesfrom block 3) sought to estimate the effect of socioeco-
nomic level not mediated through sanitary conditions.The variation explained increased to 26.3% and the betavalues for purchasing power, mother's schooling andfather-child contact decreased to 9.5; 5.7; and 4.3 respec-tively, suggesting that this loss is accounted for by theeffect of socioeconomic status this is mediated by physicalenvironment conditions. Model C, (psychosocial stimula-tion variables (block 4) included) C explained 30.1% ofthe variation and beta values for purchasing power,mother's schooling and father-child contact, decreasingeven more.
Model D (variables of blocks 1, 2, 3 and 4 combined)sought to estimate the effects of socio-economic level notmediated through physical environment and psychoso-cial stimulation. Comparing effect estimators through theprevious three models, beta values for socioeconomic sta-tus decreased after adjusting for blocks 3 and 4 at thephysical and psychosocial environmental level. A 13.3points difference in the cognitive score for children livingwith parents with better purchasing power in Model A,decreased to 9.5 points after adjusting for sanitary condi-tions in block 3 (Model B) and to 8.1 points after adjust-ing for block 4, psychosocial stimulation (Model C). Afteradjusting for blocks 3 and 4 combined the differencescame to 5.2 points for purchasing power, 3.9 for mother'sschooling and 3.5 points for contact with the father(Model D). This Model estimated the effects of social-eco-nomic level not mediated through the intermediate envi-ronmental level, as well as the overall effect of variablesfor sanitary conditions (block 3) and psychosocial stimu-lation (block 4) on cognitive score. The magnitude of the
BMC Public Health 2008, 8:202 http://www.biomedcentral.com/1471-2458/8/202
Page 10 of 15(page number not for citation purposes)
Table 2: Univariable and multivariable analysis of determining factors grouped by blocks and levels with WPPSI-R cognitive scores.
Blocks And Variables Univariable analysis Multivariable analysis (by block)
R2 adjusted (%) βu (95% CI) R2 adjusted (%) βk (95% CI)
Level 1 Socioeconomic statusMaterial Resources (Block 1) 17.0Family purchasing power 15.5
LowRegular 5.51 (2.15; 8.88) 4.4 (0.9; 7.8)Good 16.0 (12.0; 20.0)* 13.7 (9.3; 18.0)*
Family income 7.7≤ 1 minimum wageMore than 1 minimum wage 7.9 (5.0; 10.8)* 4.0 (1.0; 7.0)
Father without income 2.6NoneAny 5.3 (2.0; 8.6)
Family Status (Block 2) 9.7Mother's schooling 7.5
none or ≤ 5 years> 5 years 8.3 (5.2; 11.4)* 8.2 (5.1; 11.3)*
Father-child contact 3.0NoneSome 6.5 (2.5; 10.5)* 5.9 (2.1; 9.8)*
Family structure 1.5non-nuclearNuclear family 03.4 (0.5; 6.3)*
Religion 0.3Catholicother beliefs -1.6 (-4.6; 1.3)
CIDI mood disorders among carers (2001)** 0.0 -1.9 (-3.6; 3.2)
Level 2 Physical Environment and Psychosocial StimulationSanitary conditions (Block 3)Household 12.7 15.3
Very poorPoor 4.9 (1.4; 8.5) 3.7 (0.2; 7.3)Good 13.6 (9.7; 17.5)* 11.2 (7.1; 15.3)*
Neighbourhood 7.8BadRegular 5.8 (1.9;9.6) 4.6 (0.8; 8.3)Good 10.7 (6.9; 14.5)* 7.0 (3.1; 10.9)*
Psychosocial Stimulation (Block 4)HOME score (1999) 16.3 0.9 (0.7; 1.2)* 23.7 0.8 (0.6; 1.0)*Nursery school attendance 12.3
Never attendedAttended at some time 12.2 (8.7; 15.7)* 9.8 (6.5; 13.0)*
Level 3 Child characteristics and healthChild's Characteristics (Block 5)Birth order 2.9 2.3
Third or subsequentFirst or second 5.0 (1.9; 8.2)* 5.0 (1.9; 8.2)*
Sex 00FemaleMale -0.4 (-3.3; 2.4)
Age 1.1Up to 59.68 monthsMore than 59.68 months -2.9 (-5.9; -0.04)
Nutrition And Infection (Block 6) 9.8Birth weight 2.8
≤ 2500 g
BMC Public Health 2008, 8:202 http://www.biomedcentral.com/1471-2458/8/202
Page 11 of 15(page number not for citation purposes)
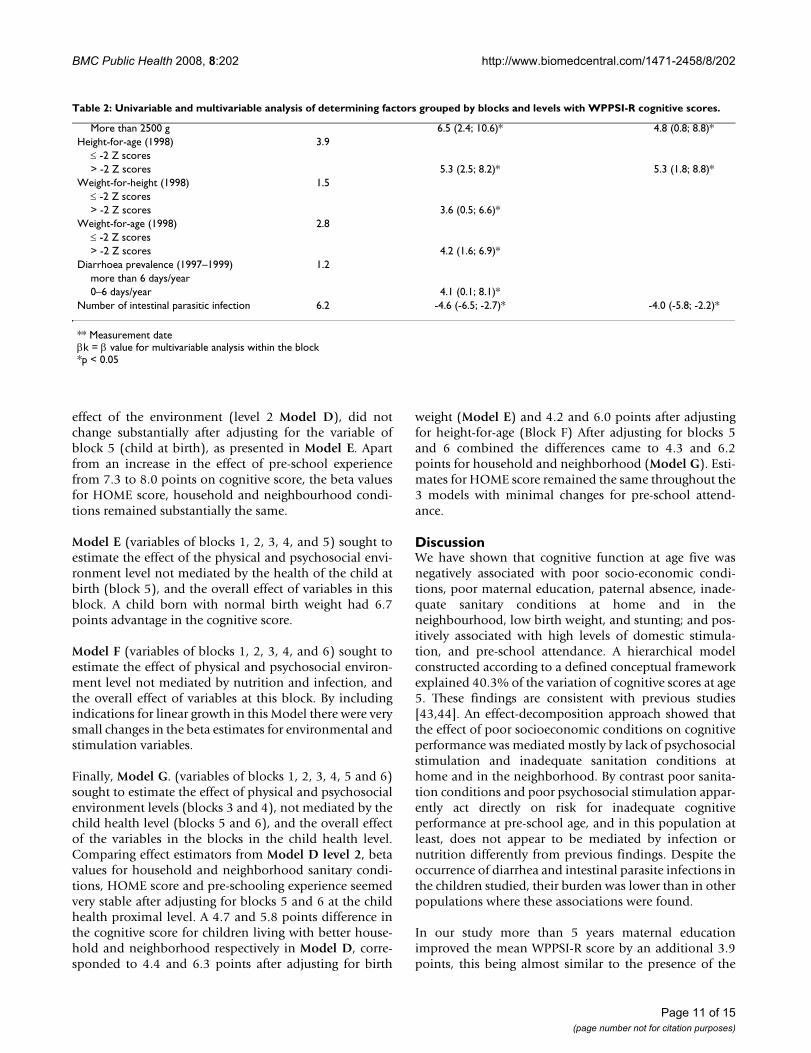
effect of the environment (level 2 Model D), did notchange substantially after adjusting for the variable ofblock 5 (child at birth), as presented in Model E. Apartfrom an increase in the effect of pre-school experiencefrom 7.3 to 8.0 points on cognitive score, the beta valuesfor HOME score, household and neighbourhood condi-tions remained substantially the same.
Model E (variables of blocks 1, 2, 3, 4, and 5) sought toestimate the effect of the physical and psychosocial envi-ronment level not mediated by the health of the child atbirth (block 5), and the overall effect of variables in thisblock. A child born with normal birth weight had 6.7points advantage in the cognitive score.
Model F (variables of blocks 1, 2, 3, 4, and 6) sought toestimate the effect of physical and psychosocial environ-ment level not mediated by nutrition and infection, andthe overall effect of variables at this block. By includingindications for linear growth in this Model there were verysmall changes in the beta estimates for environmental andstimulation variables.
Finally, Model G. (variables of blocks 1, 2, 3, 4, 5 and 6)sought to estimate the effect of physical and psychosocialenvironment levels (blocks 3 and 4), not mediated by thechild health level (blocks 5 and 6), and the overall effectof the variables in the blocks in the child health level.Comparing effect estimators from Model D level 2, betavalues for household and neighborhood sanitary condi-tions, HOME score and pre-schooling experience seemedvery stable after adjusting for blocks 5 and 6 at the childhealth proximal level. A 4.7 and 5.8 points difference inthe cognitive score for children living with better house-hold and neighborhood respectively in Model D, corre-sponded to 4.4 and 6.3 points after adjusting for birth
weight (Model E) and 4.2 and 6.0 points after adjustingfor height-for-age (Block F) After adjusting for blocks 5and 6 combined the differences came to 4.3 and 6.2points for household and neighborhood (Model G). Esti-mates for HOME score remained the same throughout the3 models with minimal changes for pre-school attend-ance.
DiscussionWe have shown that cognitive function at age five wasnegatively associated with poor socio-economic condi-tions, poor maternal education, paternal absence, inade-quate sanitary conditions at home and in theneighbourhood, low birth weight, and stunting; and pos-itively associated with high levels of domestic stimula-tion, and pre-school attendance. A hierarchical modelconstructed according to a defined conceptual frameworkexplained 40.3% of the variation of cognitive scores at age5. These findings are consistent with previous studies[43,44]. An effect-decomposition approach showed thatthe effect of poor socioeconomic conditions on cognitiveperformance was mediated mostly by lack of psychosocialstimulation and inadequate sanitation conditions athome and in the neighborhood. By contrast poor sanita-tion conditions and poor psychosocial stimulation appar-ently act directly on risk for inadequate cognitiveperformance at pre-school age, and in this population atleast, does not appear to be mediated by infection ornutrition differently from previous findings. Despite theoccurrence of diarrhea and intestinal parasite infections inthe children studied, their burden was lower than in otherpopulations where these associations were found.
In our study more than 5 years maternal educationimproved the mean WPPSI-R score by an additional 3.9points, this being almost similar to the presence of the
More than 2500 g 6.5 (2.4; 10.6)* 4.8 (0.8; 8.8)*Height-for-age (1998) 3.9
≤ -2 Z scores> -2 Z scores 5.3 (2.5; 8.2)* 5.3 (1.8; 8.8)*
Weight-for-height (1998) 1.5≤ -2 Z scores> -2 Z scores 3.6 (0.5; 6.6)*
Weight-for-age (1998) 2.8≤ -2 Z scores> -2 Z scores 4.2 (1.6; 6.9)*
Diarrhoea prevalence (1997–1999) 1.2more than 6 days/year0–6 days/year 4.1 (0.1; 8.1)*
Number of intestinal parasitic infection 6.2 -4.6 (-6.5; -2.7)* -4.0 (-5.8; -2.2)*
** Measurement dateβk = β value for multivariable analysis within the block*p < 0.05
Table 2: Univariable and multivariable analysis of determining factors grouped by blocks and levels with WPPSI-R cognitive scores.
BM
C P
ublic
Hea
lth 2
008,
8:2
02ht
tp://
ww
w.b
iom
edce
ntra
l.com
/147
1-24
58/8
/202
Page
12
of 1
5(p
age
num
ber n
ot fo
r cita
tion
purp
oses
)
Table 3: Results from multivariable hierarchical analysis of determining factors grouped by levels with WPPSI-R cognitive scores.
Variables Model A (Blocks 1 and 2)
Model B (Blocks 1, 2 and 3)
Model C (Blocks 1, 2 and 4)
Model D (Blocks 1, 2, 3 and 4)
Model E (Blocks 1, 2, 3, 4 and 5)
Model F (Blocks 1, 2,3,4 and 6)
Model G (Blocks 1, 2, 3, 4, 5 and 6)
R2 β(95% CI) R2 β(95% CI) R2 β(95% CI) R2 β(95% CI) Change β ** R2 β(95% CI) R2 β(95% CI) R2 β(95% CI) Change β***
Level 1 Socioeconomic status
Socioeconomics 20.2 26.3 30.1 34.4 39.8 35.3 40.3Family purchasing power -60.9 -25.0
LowRegular 3.9 (0.5; 7.3)** 2.7 (-0.5; 6.0)** 2.5 (-0.6; 5.6)** 1.5 (-1.6; 4.6)** 0.4 (-2.6; 3.5)** 1.3 (-1.7; 4.4)** 0.3 (-2.7; 3.3)**Good 13.3 (9.3; 17.4) 9.5 (5.2; 13.7) 8.1 (4.1; 12.1) 5.2 (1.1; 9.3) 5.1 (1.1; 9.1) 5.0 (0.9; 9.1) 4.9 (0.9; 8.9)
Family characteristicsMother's schooling
None or ≤ 5 years> 5 years 5.4 (2.3; 8.5) 5.7 (2.8; 8.6) 3.9 (1.1; 6.7) 3.9 (1.1; 6.7) -27.7 3.6 (0.9; 6.3) 3.7 (1.0; 6.5) 3.5 (0.8; 6.1) -66.0
Father-child contactNoneSome 4.8 (1.1; 8.5) 4.3 (0.7; 7.8) 4.1 (0.7;7.5) 3.5 (0.2; 6.8) -27.0 3.9 (0.6; 7.1) 3.6 (0.3; 6.9) 3.9 (0.6; 7.1) -8.5
Level 2 Physical environment and Psychosocial stimulation
Sanitary conditionsHousehold
Very PoorPoorGood 5.9 (1.7; 10.1) 4.7 (0.7; 8.7) 4.7 (0.9; 8.5) 4.2 (0.2; 8.1) 4.3 (0.5; 8.2) -40.0
Neighbourhood 0.4 (-0.8; 3.0)** 0.7 (-2.5; 4.0)** 1.2 (-1.9; 4.4)** 0.2 (-3.0; 3.5)** 0.9 (-2.2; 4.1)**BadRegularGood 6.2 (2.5; 9.9) 5.8 (2.4; 9.3) 6.1 (2.8; 9.5) 6.0 (2.6; 9.4) 6.2 (2.9; 9.6) -22.4
Psychosocial stimulation 5.0 (0.0; 1.5)** 4.5 (1.1; 7.8)** 5.3 (2.1; 8.5)** 4.5 (1.2; 7.8)** 5.3 (2.1; 8.5)**HOME score (1999)Nursery school attendance 0.6 (0.3; 0.8) 0.5 (0.3; 0.7) 0.5 (0.3; 0.8) 0.5 (0.3; 0.7) 0.5 (0.3; 0.7) 00.0
Never attended 7.8 (4.5; 11.1) 7.3 (4.1; 10.5) 8.4 (5.2; 11.5) 6.9 (3.7; 10.1) 8.0 (4.9; 11.2) -12.0Attended at some time
Level 3 Child characteristics and Health
Nutrition and InfectionBirth weigh
≤ 2500 gMore than 2500 g
Height-for-age 6.6 (3.3; 9.9) 3.5 (0.5; 6.5) 6.0 (2.7; 9.4)≤ -2 Z scores> -2 Z scores 2.9 (-0.2; 5.8)
Change β** = (βD-βA)/βA (%); Change β*** = (βH-βD)/βD (%)*p < 0.05
BMC Public Health 2008, 8:202 http://www.biomedcentral.com/1471-2458/8/202
Page 13 of 15(page number not for citation purposes)
father with 3.5 points, increasing to 5.2 points when thefamily had good purchasing power. These effects wereattributable to the most distal block of variables includedin the socioeconomic level.
The socioeconomic effect mediated through the interme-diate level shows the importance of physical and psycho-social quality of children's environment with almost 6points difference for neighborhood environment qualityand a 7.3 points increase for school attendance. It hasbeen suggested that the community's physical structureinfluences health directly (through risk exposure) andindirectly (creating an environment that induces neglectof health) [44,45]. The inner household environmentquality and domestic stimulation were also strong media-tors in the improvement of cognitive score. Living in ahouse with good sanitation conditions would give anadvantage of 4.7 points, and for each unit increasing indomestic stimulation there was a half point improvementfor cognitive score. This is in line with knowledge con-cerning the role of environment on children's develop-ment [46]. In this block, pre-school attendance showed animportant effect on cognitive performance, adding 7.8points on average to cognitive scores. In older age groups,schooling has been found to be strongly associated withhigher scores on cognitive development [45]. Environ-mental conditions remained very influential throughoutthe analysis as its effect was not so much modified by thechild health block of factors. The value of beta for schoolattendance lost only 12% of its magnitude from model Dto the final Model G, giving a 22% loss for neighborhoodestimates and 40% loss for inner household quality anddomestic stimulation.
Following the effects of children's individual health varia-bles in the proximal level, the overall effect came to 6points for low birth weight and 2.9 points for lineargrowth deficit. Low birth weight remained a strong riskfactor in the final model. Other studies have alreadyfound cognitive measures increasing with birth weight[47,37]. Motor problems and low verbal intelligence coef-ficient at age five have been found for children with birthweight below 2000 g [48]. In our study population 12.6%had been low birth weight babies; 4.4% below 2000 g.
The socioeconomic effects mediated by the environmentwas only very marginally reduced with consideration ofhealth variables which corresponded to an 8% reductionin the mean cognitive score provided by a household ingood sanitary conditions, a 6% reduction for good qualityneighborhood, and a 9.5% reduction for attending pre-school but no reduction at all in the domestic stimulationbenefit.
Thus the effect of socioeconomic factors on cognitivescore which is mediated by quality of the physical envi-ronment and psychosocial stimulation is not mediated bybirth weight and linear growth. Domestic stimulation wasnot mediated at all by factors in the health level; neigh-borhood and household quality and school attendancewere very little mediated by health.
There is a difficulty in using tests not designed and stand-ardized in Brazil; however, standard procedures for train-ing and application of the WPPSI-R instrument werefollowed, and agreement between examiners was ade-quate with intraclass correlation coefficients above 0.90.The WPPSI-R scale has not been fully validated in a Brazil-ian population, although it has been used in other studiesin Brazil [32]. The mean of 82.6 (SD 13.7) WPPSI-R scorefound here is low. This however is not so far from themean 88.9 (SD 12.5) found for Peruvian children [25].Our mean WPPSI-R scores for those with low birth weightwas 77.3 (SD 14.1); another Brazilian study found 75.0(SD 11.9) in very low birth weight children [22]. Soalthough results tend to be low in Latin America, they areconsistent. It is possible that the WPPSI-R consistentlyunderestimates scores in this setting, as it measures out-comes related to abilities reliant on formal education andacculturation. This would not have been a problem in ourstudy as it did not aim to classify children according totheir IQ measures, but instead to analyse how a broad-range of risk factors affects children's cognitive perform-ance at five years old.
Our analysis was based on a previous defined conceptualmodel as an alternative to the more traditional analysisused in epidemiology. The simple hierarchical effect-decomposition strategy here is not without limitations asconsistent estimates of direct (not mediated) effects canbe obtained only when there is no confounding at thelevel of the intermediate variable [49]. So in order to esti-mate the effect of socio-economic status level not medi-ated by physical and psychosocial environment level, wehad to assume that there were no unobserved covariatesassociated with the blocks for psychosocial stimulationand with risk for low cognitive score. We think thisassumption holds for the environmental quality block inthe same intermediate level. Our conceptual model con-sidered a wide range of potential risk factors for cognitivescore determination and grouped them in meaningfulblocks through statistical analysis; it seems unlikely thatother unobserved factors are associated with both, the twoblocks (sanitary conditions and psychosocial stimulation)in the intermediate level, and cognitive score. Therefore,the variables in the model were previously defined accord-ing to their potential role in the studied outcome. Thefinal model was estimated in a hierarchical way. We can-not exclude the possibility that other conceptual frame-
BMC Public Health 2008, 8:202 http://www.biomedcentral.com/1471-2458/8/202
Page 14 of 15(page number not for citation purposes)
works or other strategies of inclusion of the independentvariables would change the weight of these variablesregarding the outcome.
ConclusionWe can conclude that cognitive performance, which is animportant aspect of children's development, was affectedby socio-economic status, which itself was mediated bypsychosocial stimulation at home and pre-school, and byphysical environmental conditions at home and in theneighbourhood. While children's early health indicatorssuch as birth weight and linear growth played a role in thecognitive performance, they did not mediate the effect ofsocioeconomic status, physical environment and psycho-social stimulation, as conceived in the original model (fig-ure 1). The remaining effect of the socioeconomic factorsmust therefore act through intermediate factors not meas-ured in this study.
Finally, we must consider the very real limitations of anobservational study and that analysis and interpretationof data following a predefined conceptual framework is acomplex exercise and one in which alternative explana-tions are often possible. The implication is that children'scognitive development in middle income urban contextsof developing countries even when in disadvantaged soci-oeconomic conditions could be substantially increased byinterventions promoting early psychosocial stimulation,pre-school experience and nutritional improvement. Highquality childcare may provide low-income children withopportunities otherwise unavailable in their developmen-tal trajectories [50].
Competing interestsThe authors declare that they have no competing interests.
Authors' contributionsDNS designed the research methods, gathered data, man-aged data entry, devised the analytical framework for thestudy, conducted the statistical analysis and wrote the firstdraft and edited the final version of the manuscript.AMOA designed and was responsible for the nutritionalsurvey, advised on anthropometric measures and inter-pretation of data, reviewed the manuscript. ACSB trainingthe use of HOME, analysis and interpretation of theHOME collected data, review the manuscript. LMS coor-dinated cognitive data collection and carried out assess-ment and interpretation of cognitive data at both points,and reviewed the manuscript. MSP conducted data collec-tion for measures on child health and socio-economicsstatus in the original cohort, and reviewed the manuscript.AS designed and conducted the original cohort andadviced on data interpretation and reviewed the manu-script. CASTS participated in the design, statistical analy-sis, contributed to interpretation of the data and reviewed
the manuscript. NMA–F participated in study design,interpretation, reviewed the manuscript. LCR contributedto the development of the framework, interpretation ofthe data, and to write and edit the manuscript. MLB coor-dinated the overall cohort study and the study design,supervised data collection and interpretation, and con-tributed to write and edit the manuscript. All authors readand approved the final manuscript.
AcknowledgementsThis study was funded by PRONEX, Ministry of Science and Technology (MCT) and the National Council of Scientific and Technological Research (CNPq), Brazil, contract number 661086/1998-4, the Welcome Trust Latin American Centres of Excellence Programme, grant no 072405/Z/03/Z. The first author has held FAPESB research scholarship process number 1431040018268.
References1. Bronfenbrenner U: The ecology of human development. Cam-
bridge, Ma: Harvard Univ. Press; 1979. 2. Aber JL, Bennett NG, Conley DC, Li J: The effects of poverty on
child health and development. Ann Rev Public Health 1997,18:463-83.
3. Bradley RH, Corwyn RF, Whiteside-Mansell L: Life at home: sametime, different places. Early Dev Parent 1996, 5:251-69.
4. Oliveira EA: Modelos de risco para a psicologia do desenvolvi-mento. Psicol Teor Pesq 1998, 14(1):19-25.
5. Bradley RH, Corwyn RF: Parenting. In Child Psychology: AHandbook of contemporary issues. Edited by: Thamis-leMondaC, Balter L. New York: Psychology Press; 1999:339-62.
6. Brooks-Gunn J, Duncan GJ: The effects of poverty on children.Future Child 1997, 7(2):55-71.
7. McLoyd VC: Socioeconomic disadvantage and child develop-ment. Am Psychol 1998, 53:185-204.
8. Saegert S, Winkel GH: Environmental psychology. Ann Rev Psy-chol 1990, 41:441-77.
9. Bloom BS: Stability and change in human characteristics. NewYork;Wiley; 1964.
10. Hunt JM: Intelligence and experience. New York: Ronald; 1961. 11. Bradley RH, Corwyn RF, Burchinal M, McAdoo HP, Garcia Coll C:
The home environments of children in the United states.Part 2: relations with behavioral development through agethirteen. Child Dev 2001, 72(6):1868-86.
12. Bradley RH, Corwyn RF, McAdoo HP, Garcia Coll C: The homeenvironments of children in the United states. Part 1: varia-tions by age, ethnicity and poverty status. Child Dev 2001,72(6):1844-67.
13. Duncan GJ, Brooks-Gunn J, Klebanoy P: Economic deprivationand early childhood development. Child Dev 1994, 85:296-318.
14. Bradley RH, Caldwell BM: The relation of home environment,cognitive competence and IQ among meles and females.Child Dev 1980, 51:1140-48.
15. Guo G, Harris KM: The mechanisms mediating the effects ofpoverty on children's intellectual development. Demography2000, 37:431-47.
16. Andraca I, Pino P, Parra A, Rivera F, Castillo M: Factores de riesgopara el desarrollo psicomotor en lactantes nacidos en ópti-mas condiciones biológicas. 1998, 32:138-147.
17. Laude M: Assessment of nutritional status, cognitive develo-pent, and mother-child interation in Central american refu-gee children. Rev Panam Salud Publica 1999, 6(3):164-71.
18. Leventhal T, Brooks-Gunn J: The neighborhoods they live in: theeffect of neighborhood residence on child and adolescentoutcomes. Psychol Bull 2000, 126:309-37.
19. Bradley RH, Corwyn RF: Socioeconomic status and child devel-opment. Ann Rev Psycol 2002, 53:371-99.
20. US Dep. Health Human Services: Healthy People 2010. Washing-ton, DC:US GPO; 2000.
21. Pollitt E, Golub M, Gorman K, Grantham-McGregor S, Levitsky D,Schürch B, Strupp B, Wachs T: A reconceptualization of theeffects of undernutrition on children's biological, psychoso-
Publish with BioMed Central and every scientist can read your work free of charge
"BioMed Central will be the most significant development for disseminating the results of biomedical research in our lifetime."
Sir Paul Nurse, Cancer Research UK
Your research papers will be:
available free of charge to the entire biomedical community
peer reviewed and published immediately upon acceptance
cited in PubMed and archived on PubMed Central
yours — you keep the copyright
Submit your manuscript here:http://www.biomedcentral.com/info/publishing_adv.asp
BioMedcentral
BMC Public Health 2008, 8:202 http://www.biomedcentral.com/1471-2458/8/202
Page 15 of 15(page number not for citation purposes)
cial and behavioral development. Soc Policy Rep Soc Res Child Dev1996, 10(5):1-24.
22. Meio MDBB, Lopes CS, Morsch DS: Fatores prognósticos para odesenvolvimento cognitivo de prematuros de muito baixopeso. Rev Saude Publica 2003, 37:311-18.
23. Victora MFD: Desenvolvimento mental e psicomotor. In Epide-miologia da desigualdade 2nd edition. Edited by: Victora G, Barros FC,Vaughan JP. São Paulo: Hicitec; 1989:164-77.
24. Guerrant DI, Moore SR, Lima AAM, Patrick PD, Schorling JB, Guer-rant RL: Association of early childhood diarrhoea and crypt-osporidiosis with impaired physical fitness and cognitivefunction four-seven years later in a poor urban community innortheast Brazil. Am J Trop Med Hyg 1999, 5:707-13.
25. Berkman DS, Lescano AG, Gilman RH, Lopez SL, Black MM: Effectsof stunting, diarrhoeal disease, and parasitic infection duringinfancy on cognition in late childhood: a follow-up study. Lan-cet 2002, 359:564-71.
26. Grantham-McGregor S: Linear growth retardation and cogni-tion. Lancet 2002, 359:542-42.
27. Instituto Brasileiro de Geografia e Estatística- IBGE: Crianças e ado-lescentes: Indicadores Sociais. 1995, 5:53-64.
28. Instituto Brasileiro de Geografia e Estatística- IBGE: PesquisaNacional de Saneamento Básico. Ministério do Planejamento. Riode Janeiro 2002.
29. Teixeira MG, Barreto ML, Costa MCN, Strina A, Martins-Junior D,Prado M: Sentinel áreas: a monitoring strategy in publichealth. Cad Saude Publica 2002, 5:1189-95.
30. Strina A, Cairncross S, Prado MS, Teles CAS, Barreto ML: Child-hood diarrhoea symptoms, management and duration:observations from a longitudinal community study. Trans RSoc Trop Med Hyg 2005, 99:407-16.
31. Barreto ML, Genser B, Strina , Teixeira MG, Assis AMO, Rego RF,Teles CA, Prado MS, Matos SMA, Santos DN, Santos LA, CairncrossS: Effect of city-wide sanitation programme on reduction inrate of childhood diarrhoea in northeast Brazil: assessmentby two cohort studies. Lancet 2007, 370:1622-28.
32. Wechsler D: Manual Wechsler Pre-school and Primary Scaleof Inteligence -Revised. (WPPSI-R): The Psychological Corpora-tion Harcourt Brace Jovanovich, Inc USA; 1989.
33. National Center for Health Statistics-NCHS: Growth curves forchildren birth-18 years. Department of Health, Education andWelfare (Vital and Health Statistics, series 11). Washington; 1997.
34. Morris SS, Cousens SN, Kirkwood BR, Arthur P, Ross DA: Is prev-alence of diarrhea a better predictor of subsequent mortal-ity and weight gain than diarrhea incidence? Am J Epidemiol1996, 144:582-88.
35. Katz N, Pellegrino JS: Simple device for quantitative determina-tions of S. mansoni eggs in faeces examined by the thick-smear technique. Rev Inst Med Trop 1972, 14:397-400.
36. World Health Organization: Composite International Diagnos-tic Interview-CIDI. 2.1. WHO Geneva; 1997.
37. Bradley RH, Caldwell BM: Home observation for measurementand environment: A validation study screening efficiency. AmJ Ment Defic 1977, 81:417-20.
38. Bastos AC, Almeida-Filho N: Variables Economicosociales,Ambiente Familiar y Salud Mental Infantil en un áreaUrbana (Bahia), Brasil. Acta Psiq Psycol de América Latina 1990,36:147-54.
39. Meio MDBB, Lopes CS, Schieri R, Morsh DS: Confiabilidade doteste WPPSI-R na avaliação do desenvolvimento cognitivode pré-escolares. Cad Saude Publica 2001, 17:99-105.
40. Milroy CA, Borja PC, Barros FR, Barreto ML: Evaluating sanitaryquality and classifying urban sectors according to environ-mental conditions. Environment & Urbanization 2001, 13:235-55.
41. Genser B, Strina A, Teles CA, Prado MS, Barreto ML: Risk factorsfor childhood diarrhea incidence dynamic analysis of a longi-tudinal study. Epidemiol 2006, 17(6):658-67.
42. Victora CG, Huttly SR, Fuchs SC, Olinto MTA: The role of concep-tual frameworks in epidemiological analysis: a hierarchicalapproach. Int J Epidemiol 1997, 26:224-27.
43. Smith J, Brooks-Gunn J, Klebanov P: Consequences of living inpoverty for young children's cognitive and verbal ability andearly school achievement. In Consequences of growing up poorEdited by: Duncan GJ, Brooks-Gunn J. New york: Russel Sage Foun-dation; 1997:132-89.
44. Lomas J: Social capital and health: implications for publichealth and epidemiology. Soc Sci Med 1998, 47:1181-88.
45. Ceci SJ: How much does schooling influence general intelli-gence and its cognitive component? A reassessment of theevidence. Dev Psychol 1991, 27:703-22.
46. Walker SP, Powell CA, Grantham-MacGregor SM: Dietary intakesand observed activity levels of stunted and non-stunted chil-dren in Kingston, Jamaica, Part I Dietary intakes. Eur J ClinNutr 1990, 44:527-34.
47. Elgen I, Sommerfelt K, Ellertsen B: Cognitive performance in alow birth weight cohort at 5 and 11 years of age. Pediatric Neu-rol 2003, 29:111-16.
48. Aylward GP: Methodological issues in outcome studies of at-risk infants. J Pediat Psychol 2002, 27:37-45.
49. Robins JM, Greenland S: Identifiability and exchangeability fordirect and indirect effects. Epidemiol 1992, 3:143-55.
50. Caughy M, Dipietro J, Strobino D: Day-care participation as aprotective factor in the cognitive development of low-income children. Child Dev 1994, 65:457-71.
Pre-publication historyThe pre-publication history for this paper can be accessedhere:
http://www.biomedcentral.com/1471-2458/8/202/prepub