Embed Size (px)
Citation preview
SÃO PAULO
COTIA
JUQUITIBA
MOGI DAS CRUZES
SALESÓPOLIS
MAIRIPORÃ SANTA ISABEL
GUARULHOS
SUZANO BIRITIBA-MIRIM
GUARAREMAARUJÁ
CAJAMAR
EMBU
EMBU-GUAÇU
ITAPEVI
MAUÁ
CAIEIRAS
SANTANA DE PARNAÍBA
BARUERI
FRANCO DA ROCHA
SÃO BERNARDO DO CAMPO
SANTO ANDRÉ
OSASCO
SÃO LOURENÇO DA SERRA
ITAPECERICA DA SERRA
RIBEIRÃO PIRES
PIRAPORA DO BOM JESUS
ITAQUAQUE-CETUBA
POÁ
DIADEMA
CARAPI-CUÍBA
FRANCISCO MORATO
JANDIRA
RIO GRANDE
DA SERRA
VARGEM GRANDE PAULISTA
FERR
AZ D
E VA
SCON
CELO
S
TABOÃO DA SERRA SÃO CAETANO DO SUL
Baixada Santistametropolitan area
Campinas metropolitan area
0 6 12 18 24Miles
São Paulo metropolitan area profileGlobal Cities Initiative
Key statistics
Top employment sectors, 2012
33% 32%Change, 1990-2012: Change, 1990-2012:
24%
-0.1%Change, 2011-2012:
2.7Emigrants per 1,000 residents:
17%Share with a college degree:
55%Change, 1990-2012:
(34%) (42%) (37%)
(0.5%)
(14%) (11%)
(2.6)
(national values)
0.9%Change, 2011-2012:
97%Literacy rate:
(1.4%)(91%)
SÃO PAULO BRAZIL
JOB SHARE JOB CHANGE, 2011-2012
Migration Education GDP per capita EmploymentPopulationShare born outside the state:
66%Working age share of total:
(63%)
% %
StateGDP
NationalGDP
2010 metro share of
State population
Nationalpopulation
48 62
2010
Municipality Population, 2010
More than 1,000,000500,001 - 1,000,000250,001 - 500,00050,000 - 250,000Less than 50,000
BRAZIL
0 10 20 300 10 20 30 -1 0 1 2 3 4 5-1 0 1 2 3 4 5
20
19
15
3.5
-0.6
-0.218
Manufacturing
Distribution/retail
Public services
Business services
Manufacturing
Distribution/retail
Public services
Business services
12th 217thRank among 13 Brazilian metros: Rank among 300 world metros:
Economic performance, 2011-2012
Overview
20.0 9.5
Population, 2012in millions
Employment, 2010in millions
$23,704 $99.9
GDP per capita, 2012 Exports in billions, 2007-2012
(1st) (1st) (1st)(2nd)
(rank among 13 Brazilian metros)
0.8
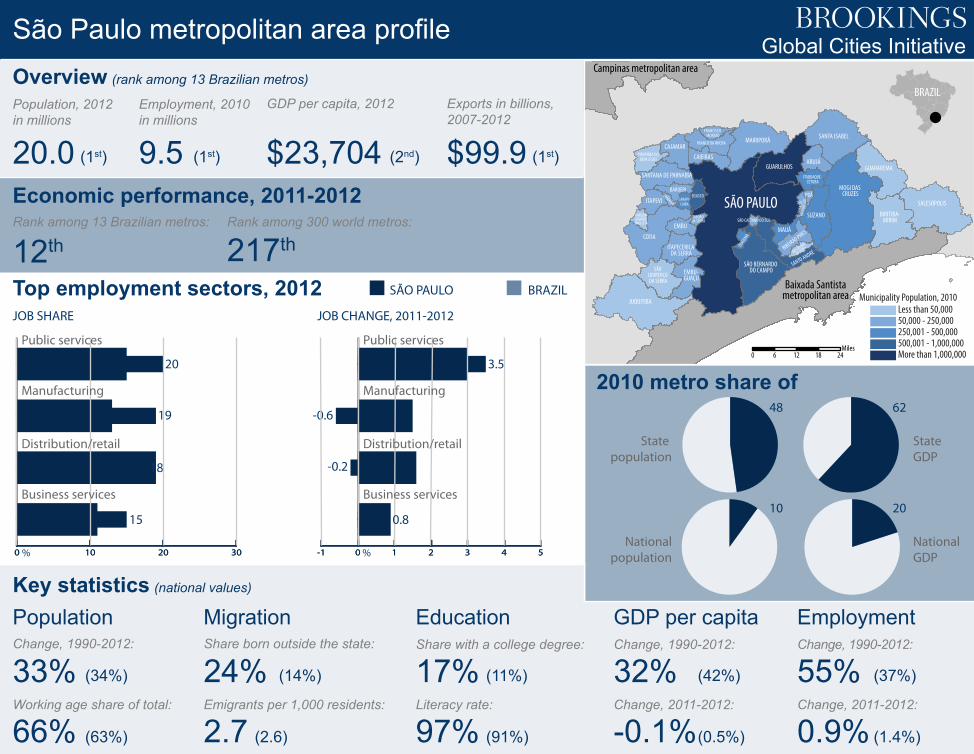
OVERVIEW
São Paulo is the largest metropolitan area in Brazil and the
10th largest in the world. Located in São Paulo state in
southeastern Brazil, about 200 miles southwest of Rio de
Janeiro and 30 miles inland from the Atlantic Ocean, São
Paulo accounts for one-tenth of Brazil’s population, but
one-fifth of its economy. A hub of commerce, its size and
traffic congestion has encouraged it to acquire the highest
number of helicopters per capita in the world.
POPULATION
With almost 20 million people living in the metropolitan area,
São Paulo accounts for nearly half (48 percent) of its state’s
population and has about two million more residents than
metropolitan New York. More than half (57 percent) of the
population lives in the city proper, with the remainder residing
in the 38 other municipalities that make up the metropolitan
area. Eleven (11) percent live in favelas (irregular
settlements), the seventh highest share among the 13 major
Brazilian metro areas.
Colonized in the 16th century as the first permanent
Portuguese settlement in the Americas, São Paulo became an
official city in 1711. Through the 19th century, it was overshad-
owed by Rio de Janeiro. With the rise in importance of coffee
exports in the late 19th century, São Paulo gained in
prominence, and industrialized rapidly in the 20th century,
surpassing Rio de Janeiro in population by the middle of the
century. In recent decades, it has maintained an impressive
rate of population growth, increasing 19 percent in the 1990s,
and ranking fifth among Brazil’s large metro areas. Between
2000 and 2012, its growth slowed to 12 percent, 11th among
large metro areas, but that still represented an increase of 2
million people, or 8 percent of Brazil’s overall population
growth.
São Paulo’s age structure is typical for large metropolitan
areas in Brazil: two-thirds (66 percent) of its population is of
working age, 27 percent are children, and 7 percent are
seniors. São Paulo’s population is relatively well educated.
Ninety-seven (97) percent of its population age ten and older
is literate, the third highest in Brazil. Likewise, it ranks third for
the share of its adults who have completed tertiary education
(17 percent).
São Paulo’s economic vitality draws migrants both domesti-
cally and internationally. Twenty-four (24) percent of its
population was born outside the state, well above the large
metro average of 14 percent. Likewise, it ranks first along with
Baixada Santista for the share of its population that was born
abroad, 1.0 percent. With approximately 193,000 immigrants,
its foreign-born population is more than twice the size of that
in any other major Brazilian metro area. Portuguese make up
one-quarter of immigrants, followed by those from Bolivia (13
percent) and Japan (11 percent). São Paulo ranks eighth
among large metro areas for its rate of emigration with 2.7 per
1,000 residents counted as living abroad in 2010. The United
States (22 percent), Japan (17 percent) and the United
Kingdom (8 percent) are the most popular destinations.
ECONOMY
São Paulo is the largest Brazilian metro area. It is also home
to the largest employment base (9.5 million workers), the
largest GDP ($473 billion makes up 20 percent of the Brazilian
GDP and ranks 11th globally), and the second highest GDP per
capita ($23,704 ranks only behind Brasília).
Despite the impressive size of São Paulo’s economy, its
growth rates rank low among other Brazilian metros. Its
long-term and short-term employment growth rank 11th and
12th, the same is true for its GDP growth, and both measures
of GDP per capita growth rank 10th.
São Paulo’s largest industries are slightly more diverse than
those in other metros. Its largest sector, public services,
makes up only 20 percent of the economy. Manufacturing (19
percent), distribution and retail (18 percent), and business
services (15 percent) are also large contributors. Since 1990,
São Paulo has seen largest growth in its information services
(251 percent) and business services (105 percent). In the last
year, São Paulo experienced larger growth in its information
services (4.2 percent), public services (3.5 percent), hotels
and catering (2.2 percent), and financial services (1.3 percent)
than its total growth (0.9 percent). Eleven (11) percent of all
workers in Brazil work in the São Paulo metropolitan area,
which specializes in financial services.
São Paulo is the largest Brazilian exporter, sending $100
billion of goods abroad in the last five years, including $8.9
billion to the United States. Its major export sectors include
vehicles and parts (18 percent), machinery (11 percent),
sugars (9 percent), oil seeds and fruits (6 percent), and
special operations (6 percent). One third of exports to the
United States are mechanical appliances. The region’s
exports to the United States are much more specialized than
its export profile in general.
Because of its size, São Paulo is considered the economic
powerhouse of Brazil. However, its economic performance
over the last year ranks it 12th among the 13 Brazilian metros
profiled here. This is not to say that São Paulo is not a strong
economy, but rather that São Paulo’s employment and GDP
per capita has not grown as rapidly as that in smaller
metropolitan areas over the past year.
São Paulo metropolitan area profileGlobal Cities Initiative