Embed Size (px)
Citation preview

Slide - 1
LEAG - 2012
SEARCHING FOR WATER ICE PERMAFROST: LEND RESULTS FOR ABOUT THREE YEARS OF OBSERVATIONS
Anton Sanin, Igor Mitrofanov and LEND Team

Slide - 2
LEAG - 2012
Physical basis of the neutron method of studying the prevalence of water
Epithermal neutrondetector
Neutron energy spectrum
Moderation

Slide - 3
LEAG - 2012
+H2OзамедлениеModeration
Physical basis of the neutron method of studying the prevalence of water
Epithermal neutrondetector
Neutron energy spectrum
Slide - 4
LEAG - 2012
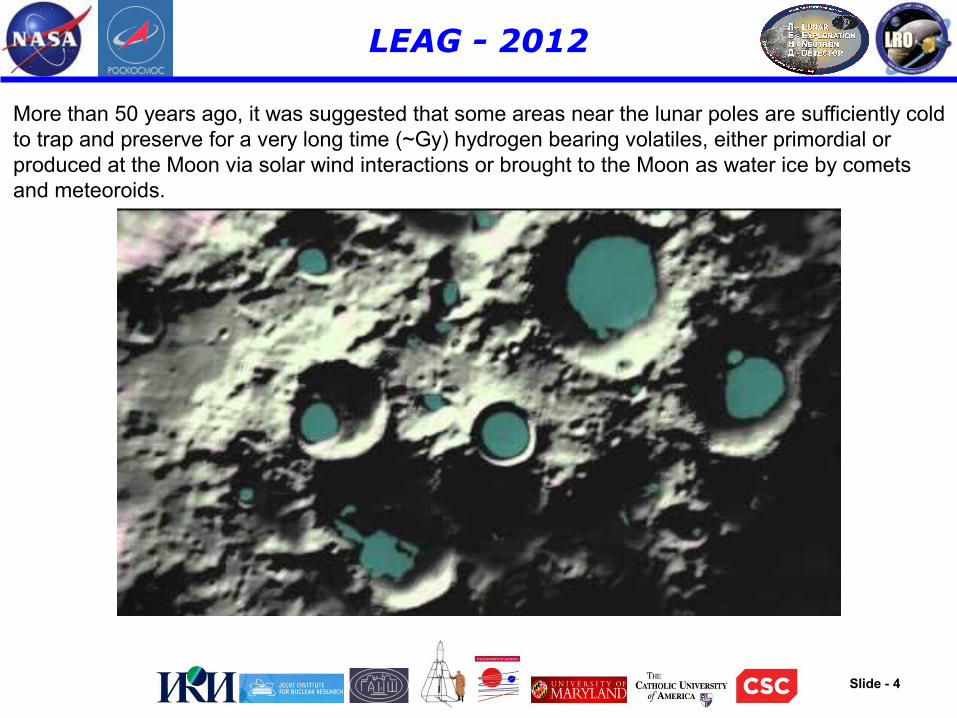
More than 50 years ago, it was suggested that some areas near the lunar poles are sufficiently cold to trap and preserve for a very long time (~Gy) hydrogen bearing volatiles, either primordial or produced at the Moon via solar wind interactions or brought to the Moon as water ice by comets and meteoroids.
Slide - 5
LEAG - 2012
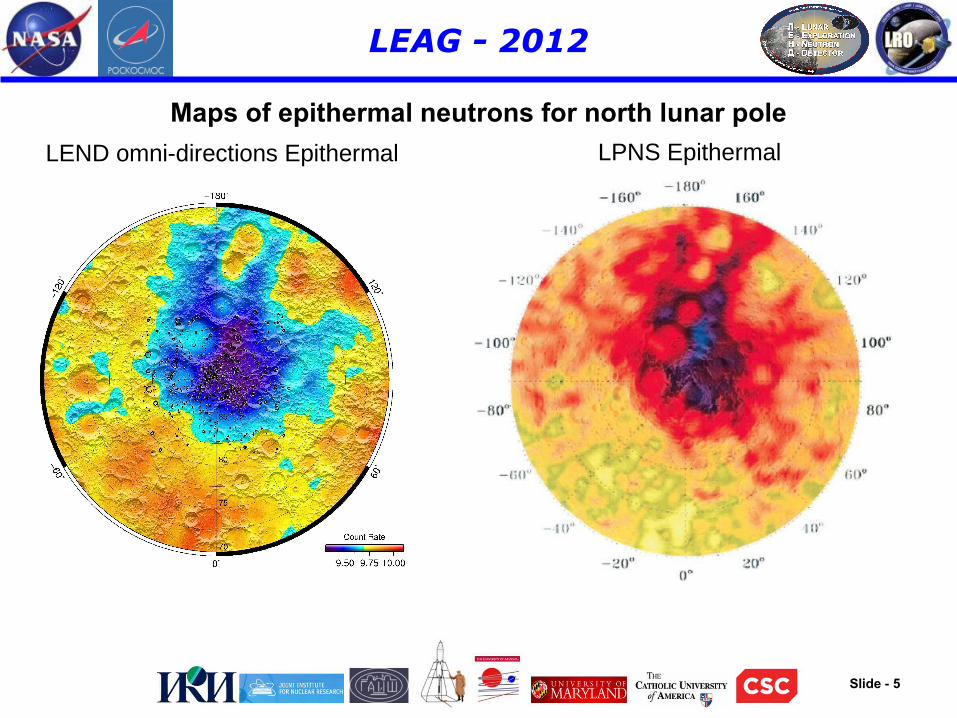
LEND omni-directions Epithermal LPNS Epithermal
Maps of epithermal neutrons for north lunar pole

Slide - 6
LEAG - 2012
LEND omni-directions Epithermal LPNS Epithermal
Maps of epithermal neutrons for south lunar pole

Slide - 7
LEAG - 2012
TASK I (PSRs): To test the hypothesis that water ice deposits exist in cold traps of Permanently Shadowed Regions (PSRs)
Experimental results from LPNS pointed out on the Extended Neutron Suppression
Regions at lunar poles
The original TASK for LEND was to resolve the spots of water ice in PSRs in the
Extended Neutron Suppression Regions
pole pole
BACKGROUND, as a cold regolith with
enhanced content of Habout 100 ppm SIGNALS, as PSRs
with water ice
Model with strong suppression in PSRs

Slide - 8
LEAG - 2012
PSR
60° - 70°reference
latitude belt
LEND
Extended polar
suppression of
epithermal
neutrons
poleto equator to equator
Latitude
SIGNAL from a testing PSR
BACKGROUND is the Extended Neutron Suppression Region
TASK I (PSRs): Null hypothesis is tested with a priori no SIGNAL at PSRs over the BACKGROUND (Δ=0)
PSR contour from LOLA
Tota
l n
eu
tro
n c
ou
nt
rate
Δ
Slide - 9
LEAG - 2012
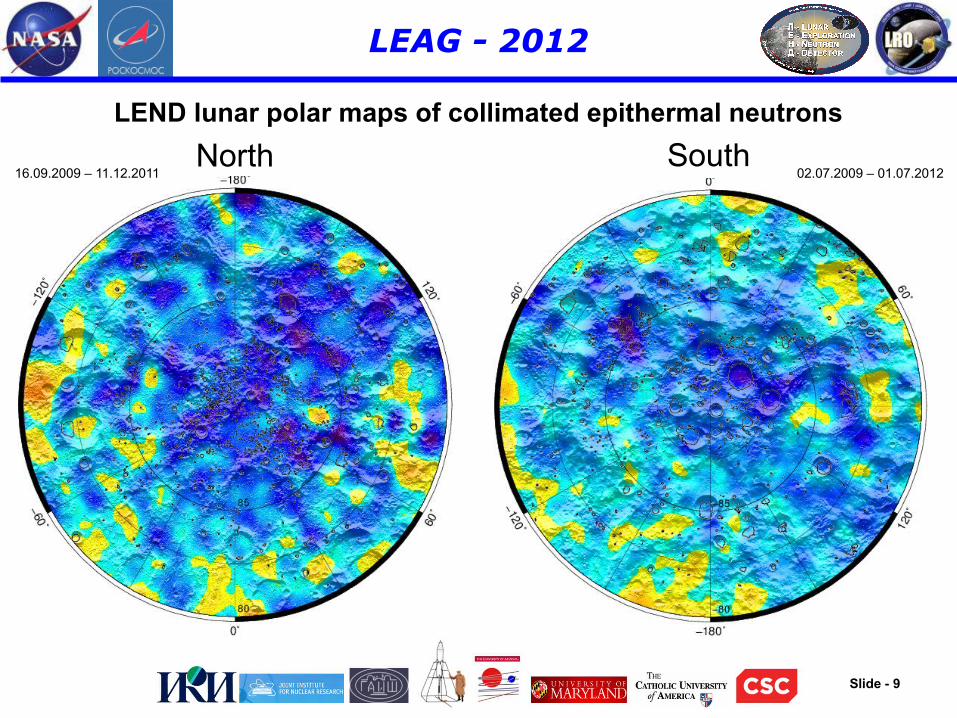
LEND lunar polar maps of collimated epithermal neutrons
North South16.09.2009 – 11.12.2011 02.07.2009 – 01.07.2012

Slide - 10
LEAG - 2012
First method of background subtraction: usage of smooth fit of latitudinal dependence of CSETNs counting rate
Average counting rate vs 2° lat. belts Average counting rate vs 2° lat. belts
This is used for determination of Local suppression #1

Slide - 11
LEAG - 2012
Lunar relief is shown from LOLA altimetry
Second method of background subtraction: usage of CSETNs maps smooth with uniform Gaussian filter with scale
~227 km = 7.5º
This is used for determination of Local suppression #2

Slide - 12
LEAG - 2012
The local neutron suppression parameter is presented in % according to the expression:
where 1.7 is the averaged counting rate in the FOV of LEND collimated detectors outside of extended polar suppression. The value of suppression is proportional to difference Δ between the average counting rate estimated for the PSR and the counting rate measured for the surrounding sunlit areas at same latitude.

Slide - 13
LEAG - 2012
RESULTS of testing SIGNAL (local suppressions) at PSRs: list of largest cases
Name of Crater contained PSR or nearest crater
PSR area, km2
Exposure, secMin Lon,
degMax Lon,
degMin Lat,
degMax Lat,
degLocal
suppression #1Local
suppression #2
Shoemaker 1080.0 30206.1 27.0 63.5 -88.6 -87.4 -3.8% ± 0.9% -8.6% ± 0.9%
Haworth 1019.2 24363.3 -17.3 12.5 -88.1 -86.9 -2.7% ± 1.1% ±-7.2% 1.1%
Faustini 665.2 7978.1 74.1 94.2 -87.6 -86.7 -5.0% ± 1.7% -8.8% ± 1.7%
Sverdrup 550.5 17443.5 -161.0 -123.0 -88.6 -87.8 0.1% ± 1.2% -4.6% ± 1.2%
Amundsen 405.2 1440.8 87.0 95.3 -83.8 -83.0 0.7% ± 4.2% -2.4% ± 4.2%
Rozhdestvenskiy U 390.7 2087.1 148.3 158.1 84.2 85.0 -9.7% ± 3.1% -12.1% ± 3.0%
Cabeus B 382.3 1671.9 -57.4 -51.9 -82.0 -81.3 7.6% ± 3.8% 5.5% ± 3.7%
Lovelace 339.3 1034.3 -112.7 -107.4 81.1 81.8 -1.6% ± 4.7% -2.9% ± 4.7%
Idel'son L 325.9 1713.7 115.2 121.9 -84.2 -83.5 -1.1% ± 3.2% -4.7% ± 3.2%
Sylvester 320.7 523.0 -84.4 -78.6 81.7 82.2 8.1% ± 5.8% 6.2% ± 5.7%
Malapert C (PSR is out of the crater) 306.9 1545.8 8.5 13.4 -82.5 -81.7
2.8% ± 5.7% -3.8% ± 4.1%
Cabeus 283.1 2014.7 -50.4 -42.6 -84.7 -84.1 -13.0% ± 3.2% -15.3% ± 3.2%
Lenard 281.4 1166.7 -113.1 -104.4 84.4 85.1 -3.4% ± 4.0% -6.2% ± 4.1%
de Gerlache 242.5 3132.1 -179.2 179.3 -89.9 -89.4 -0.2% ± 2.4% -3.8% ± 2.4%
Rozhdestvenskiy K 242.5 3488.4 -101.4 -78.0 -88.6 -88.0 -0.2% ± 2.7% -4.7% ± 2.7%
Nansen F 241.2 683.1 -148.2 -143.5 81.3 82.1 -9.5% ± 5.6% -11.2% ± 5.6%
Haworth (PSR is out of the crater) 225.3 1037.1 59.0 66.3 83.9 84.6
6.0% ± 4.8% 3.1% ± 4.7%

Slide - 14
LEAG - 2012
CONCLUSIONS for the TASK I (PSRs):
1. Some large PSRs have enhancement of Hydrogen about 200 – 500 ppm (average in depth) in comparison with their sunlit surrounding. Shoemaker and Cabeus are the best candidates for PSRs with water ice. Water in Cabeus was confirmed by observations by LCROSS
2. There is no statistically significant difference of neutron suppressions for most of largest PSRs in comparison with their local sunlit vicinity.
Based on these results, LEND has focused on another TASK II (NSRs):
To TEST local NEUTRON SUPPRESSION REGIONS (NSRs) based only on the LEND neutron mapping data without any a priory information or hypotheses.

Slide - 15
LEAG - 2012
NSR
60° - 70°reference
latitude belt
LEND
Extended polar
suppression of
epithermal
neutrons
poleto equator to equator
Latitude
SIGNAL from a testing NSR
BACKGROUND is the Extended Neutron Suppression Region
Tota
l n
eu
tro
n c
ou
nts
ra
te

Slide - 16
LEAG - 2012
NSRs were found, as statistically significant decreases of epithermal neutronemission by 2.5% and 5.0% from the level of Extended Suppression

Slide - 17
LEAG - 2012
Testing detected Neutron Suppression Regions (NSRs) by local temperature effect
Cabeus Shoemaker
Slide - 18
LEAG - 2012
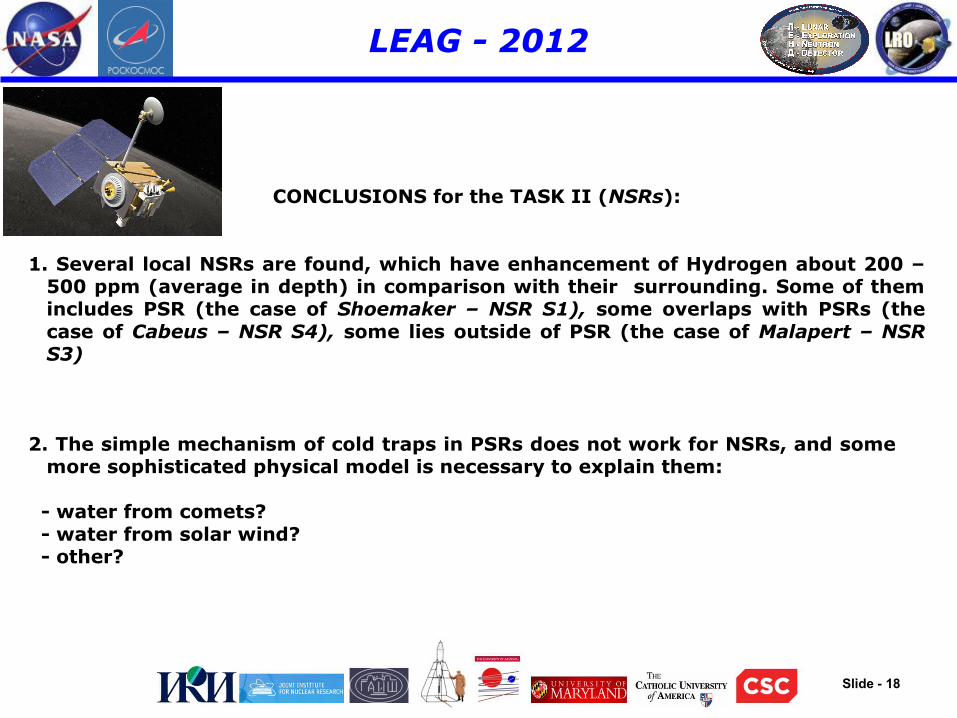
CONCLUSIONS for the TASK II (NSRs):
1. Several local NSRs are found, which have enhancement of Hydrogen about 200 –500 ppm (average in depth) in comparison with their surrounding. Some of them includes PSR (the case of Shoemaker – NSR S1), some overlaps with PSRs (the case of Cabeus – NSR S4), some lies outside of PSR (the case of Malapert – NSR S3)
2. The simple mechanism of cold traps in PSRs does not work for NSRs, and some more sophisticated physical model is necessary to explain them:
- water from comets? - water from solar wind? - other?

Slide - 19
LEAG - 2012
Extended mission