Embed Size (px)
Citation preview
Instructions for use
Title Seasonal Changes of Chemical Components in the Cones from Various Clones of Abies sachalinensis in a SeedOrchard and Germination Test of the Mature Seeds
Author(s) UJIIE, Masao; KATAYOSE, Takashi; KUDOH, Hiromu
Citation 北海道大學農學部 演習林研究報告, 48(1), 157-182
Issue Date 1991-03
Doc URL http://hdl.handle.net/2115/21335
Type bulletin (article)
File Information 48(1)_P157-182.pdf
Hokkaido University Collection of Scholarly and Academic Papers : HUSCAP
Research Bulletins of College Experiment Forests Vol. 48, No.1, 157-182 (1991) 157
Seasonal Changes of Chemical Components in the Cones from Various Clones of Abies sachalinensis in a Seed Orchard
and Germination Test of the Mature Seeds
By
Masao UJIJE*, Takashi KATAYOSE** and Hiromu KUDOU*
~~~~~rr~7Pp-/~*~%~
*Wibl~ c 5G~~T~3£*~~
M**
Abstract
Cones were collected from eight specimens of Abies sachalinensis including six clones monthly from May to September, and the changes of dry cone weight and various chemical components in the cones were traced, using seed and scale separated from cone for the cones collected after July. Variations of mature cones from the 36 trees including eleven clones were also investigated chemically, and the relation between germination rate and each quantity of chemical components per grain of seed was examined. Cone weight inceased from about 160 mg in May to 12,300 mg in September on the average. Although the percentages of nitrogen, total minerals, phosphorus, and potassium in the cones fell rapidly in the course of their growth, these substances taken up in the cones increased remarkably. Calcium content was unexpectedly low, compared with that of magnesium. Average germination rate of mature seeds was 29%, and seeds from the same clone showed similar germination rate as well as weight and the proportions of chemical components. The germination rate had a highly positive relation to the weight and the quantities of chemical components per grain of seed except calcium-especially potassium, nitrogen, and minerals-as indicated by the high values of the coefficients of correlation.
Key words: Abies sachalinensis, Clone, Cone, Chemical component, Germination.
19911j:. 9 )j 29 B ~3I Received September 29, 1990.
• ~ti'laJe:*~~Wl* College Experiment Forests, Hokkaido University .
•• WIl:rIT~ti'laJe:**1f~*i Hokkaido Forest Tree Breeding Institute, Forestry Agency.
158 Research Bulletins of the College Experiment Forests Vol. 48, No.1
Contents
Introduction ........................................................................ 158 Outline of the Seed Orchard ........................................................ 159 Material and Experimentals ........................................................ 160 L Material ........................................................................ 160 2. Experimentals .................................................................. 161 Results and Discussion .............................................................. 161 L Seasonal changes in cone weight ................................................ 161 2. Seasonal changes in carbon and nitrogen contents ................................ 163 3. Seasonal changes in mineral content ............................................ 166 4. Seasonal changes in phosphorus, potassium, magnesium, and calcium contents .... 166 5. Contents of chemical components in mature cones ................................ 172
6. Quantities of chemical components per grain and germination rate ................ 172 Conclusions ........................................................................ 177 Literature .......................................................................... 180 tiffi ~ ......................•................................................... 181
Introduction
Compared with agricultural crops or fruit trees, forest trees are close to wild plants and have highly diverse genetic variations within a certain species. Timber production, for example, may take several decades, during which time the trees often suffer from meteorological disasters and insect and fungal injuries.
Meanwhile, because the timber imports to Japan may be curtailed in the near future, owing to deterioration of the global environment as well as to cutting restrictions designed to preserve tropical rain forests, it is essential to prepare requisite amount of timber in Japanese forests. It is, accordingly, still more important to practice afforestation of good quality trees with steady and healthy growth and well-adapted to regional conditions, in the event of a long forestry depression.
With this view in mind, the Japanese Forestry Agency has been involved in tree breeding since 1956. In Hokkaido national forests, many specimens of Abies sachalinensis, Picea glehnii, and Larix kaempferi, the most popular planting species in Hokkaido, have been selected as elite trees of phenotype by mass selection in natural and artificial forests. The scions of these trees were grafted and the resultant clones had been planted in seed orchards since 1961. In the near future, afforestation can be conducted with the seedlings cultivated from the seeds of the clone trees.
The present study was performed, in order to grasp the growing process of the cones from the clone trees as well as monitor the germination power of the mature seeds. Seasonal changes of cones have hardly been reported to date, except for those of the genera Pinus 1
•5
•6
) and Cryptomeria7). The authors collected cones cross-pollinated
with various clones of Abies sachalinensis in the Hattari Seed Orchard in southern Hokkaido monthly from the first stage to maturity, and recorded the seasonal changes in cone weight and the contents of chemical components in the cones through their
Seasonal Changes of Cones CUJIIE·KATAYOSE·KuDOH) 159
growth. Moreover, the authors collected many kinds of the mature cones and analyzed their chemical components, as well as examined the germination power of the seeds in a nursery field. Parts of this study have been reported in the proceedings of the Meet· ing of the Japanese Forestry Society3.4.8).
The authors thank Mr. Y. KAWAMURA, technical official of the Iwanai District Forest Office for his help in cone collection; Mr. A. SEKIYA, a graduate student of Hokkaido University and currently a technical official of the Forestry Agency, for his help in chemical analysis; and Associate Professor Y. HISHINUMA and Lecturer K. MINATO of Hokkaido University for their useful suggestions on the manuscript of this paper.
Outline of the Seed Orchard2)
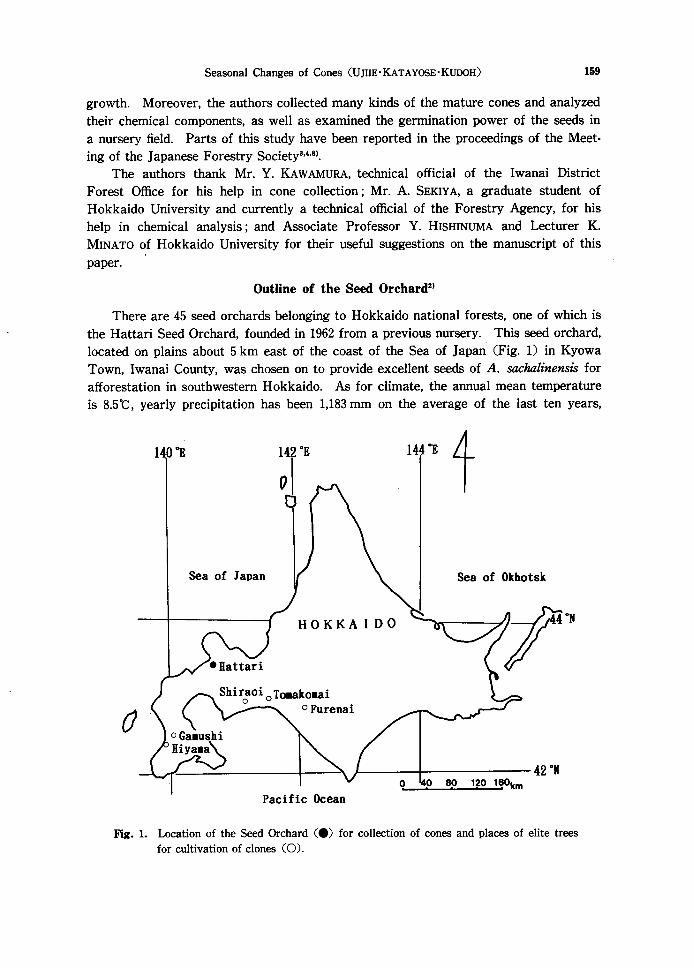
There are 45 seed orchards belonging to Hokkaido national forests, one of which is the Hattari Seed Orchard, founded in 1962 from a previous nursery. This seed orchard, located on plains about 5 km east of the coast of the Sea of Japan (Fig. 1) in Kyowa Town, Iwanai County, was chosen on to provide excellent seeds of A. sachalinensis for afforestation in southwestern Hokkaido. As for climate, the annual mean temperature is 8Se, yearly precipitation has been 1,183 rom on the average of the last ten years,
140 OR lH"E t
Sea of Japan Sea of Okhotsk
HOKKAIDO
rJ
-\.-n'-------t----" }-----f------ 42 OX 8f> 120 160km
Pacific Ocean
Fig. 1. Location of the Seed Orchard Ce) for collection of cones and places of elite trees for cultivation of clones CO).
160 Research Bulletins of the College Experiment Forests Vol. 48, No.1
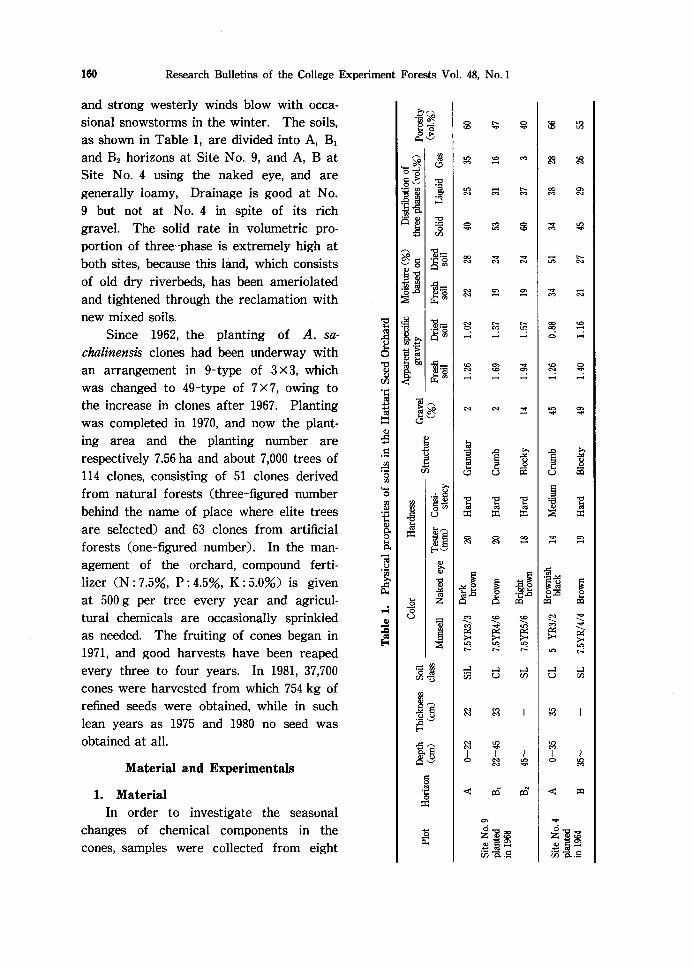
and strong westerly winds blow with occasional snowstorms in the winter. The soils, as shown in Table I, are divided into A, Bl and B2 horizons at Site No.9, and A, B at Site No. 4 using the naked eye, and are generally loamy, Drainage is good at No. 9 but not at No. 4 in spite of its rich gravel. The solid rate in volumetric proportion of three-phase is extremely high at both sites, because this bind, which consists of old dry riverbeds, has been ameriolated and tightened through the reclamation with new mixed soils.
Since 1962, the planting of A. sachalinensis clones had been underway with an arrangement in 9-type of 3 X 3, which was changed to 49-type of 7 X 7, owing to the increase in clones after 1967. Planting was completed in 1970, and now the planting area and the planting number are respectively 7.56 ha and about 7,000 trees of 114 clones, consisting of 51 clones derived from natural forests (three-figured number behind the name of place where elite trees are selected) and 63 clones from artificial forests (one-figured number). In the management of the orchard, compound fertilizer (N: 7.5%, P: 4.5%, K: 5.0%) is given at 500 g per tree every year and agricultural chemicals are occasionally sprinkled as needed. The fruiting of cones began in 1971, and good harvests have been reaped every three to four years. In 1981, 37,700 cones were harvested from which 754 kg of refined seeds were obtained, while in such lean years as 1975 and 1980 no seed was obtained at all.
Material and Experimentals
1. Material In order to investigate the seasonal
changes of chemical components in the cones, samples were collected from eight
00
'" .... '"
.... '"
.... M
""' ....
~ I I ." <=> ....
..... '"
""' ....
I ~
Seasonal Changes of Cones (UJIIE-KATAYOSE-KuOOH) 161
individual A_ sachalinensis trees planted on Site No.9 of the Hattari Seed Orchard in 1968, consisting of six clones (Furenai 102, Gamushi 5, Gamushi 103, Hiyama 9-(1) and ®, Tomakomai 3-(1) and ®, and Tomakomai 4, as shown in Fig. 1). Two or three cones per tree in five growing stages were collected from May (unpollinated strobilus stage) to September (mature cone), in 1983 (on May 6, June 10, July 15, August 9, and September 6). The cones were dried and prepared for weighing and chemical analyses, then separated into seed and scale including axis after the July collection. Meanwhile, mature cones were collected in September 1983 from 36 individual trees consisting of 11 clones, and prepared for weighing, chemical analyses and germination tests of seed. The grade of the cone harvest in 1983 was said to be a lowermedium.
2. Experimentals Weighing and chemical analyses···Average cone weights were determined after
drying in a 105·C oven. The weight of the cones collected from July to September, including 36 kinds of mature cones was calculated by the sum of whole seed and scale weights, in which the seed number per cone was counted and the percentage of seed weight per cone was also calculated. After the cone, seed, and scale were pulverized, carbon and nitrogen were determined with a C-N Corder, while total mineral content was determined by ashing in a 600·e electric furnace. Using the minerals dissolved with 10% hydrochloric acid, phosphorus was determined by the vanado-molybdate method with a spectrophotometer at 440 nm. Potassium, magnesium, calcium, and sodium were determined using the same solution as above with an atomic absorption spectrophotometer. For magnesium and calcium determinations, a strontium solution was added to 1,000 ppm. Those determined were expressed as oxide. The contents of chemical components were calculated in percentages to cone, seed, or scale weights and quantities per cone, whole seed and scale in a cone or grain of seed (dividing whole seed weight by seed number per cone).
Germination test···Refined seeds buried in the field of the Hokkaido Forest Tree Breeding Institute during winter were used for the germination test in April 1984. Each five-gram seed, whose number was obtained with each average grain weight, was sowed on the nursery with three replications. The germination rate was calculated by counting seedlings germinated two months afterward, in which damping-off rarely occurred. The coefficients of correlation were also calculated between the quantities of two chemical components per grain of seed and between germination rate and each of the quantities.
Results and Discussion
1. Seasonal changes in cone weight Seasonal changes in cone weight are shown in Table 2 and Fig. 2. By the first
collection, May 6, the weights had all exceeded 100 mg, and the average of the cones (unpollinated strobili) collected from eight individual trees on May 6 was 157 mg. The maximum of 215 mg, Gamushi 5, was about twice as heavy as the minimum of 118 mg, Hiyama 9-(1). On June 10, the average weight reached 3,360 mg, which was 20 times
162 Research Bulletins of the College Experiment Forests Vol. 48, No.1
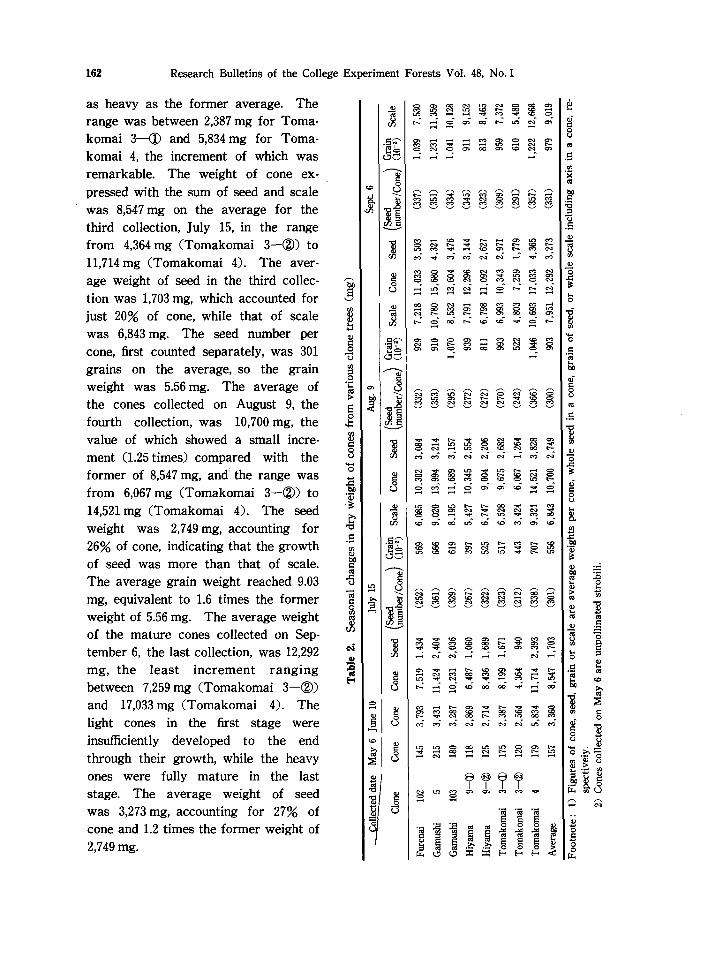
as heavy as the former average. The range was between 2,387 mg for Tomakomai 3--<D and 5,834 mg for Tomakomai 4, the increment of which was remarkable. The weight of cone expressed with the sum of seed and scale was 8,547 mg on the average for the third collection, july 15, in the range from 4,364 mg CTomakomai 3-®) to 11,714 mg CTomakomai 4). The average weight of seed in the third collection was 1,703 mg, which accounted for just 20% of cone, while that of scale was 6,843 mg. The seed number per cone, first counted separately, was 301 grains on the average, so the grain weight was 5.56 mg. The average of the cones collected on August 9, the fourth collection, was 10,700 mg, the value of which showed a small increment C1.25 times) compared with the former of 8,547 mg, and the range was from 6,067 mg CTomakomai 3-®) to 14,521 mg CTomakomai 4). The seed weight was 2,749 mg, accounting for 26% of cone, indicating that the growth of seed was more than that of scale. The average grain weight reached 9.03 mg, equivalent to 1.6 times the former weight of 5.56 mg. The average weight of the mature cones collected on September 6, the last collection, was 12,292 mg, the least increment ranging between 7,259 mg CTomakomai 3-®) and 17,033 mg CTomakomai 4). The light cones in the first stage were insufficiently developed to the end through their growth, while the heavy ones were fully mature in the last stage. The average weight of seed was 3,273 mg, accounting for 27% of cone and 1.2 times the former weight of 2,749 mg.
g o u
~~~~~~~~~ ~ <'oa)OOU-)~<'oMC')tD
~$~~fSl~~~~ i ~
~ ~ ~ 8 ~ \~ ~
Seasonal Changes of Cones (UJIIE·KATAYOSE·KUIX)H)
15000
10000
5000
1000
<>----0 Cone o---~Seed
0-.--0 Scale
layS JunelO July15 Aug. 9 Sept. 6
Collected date
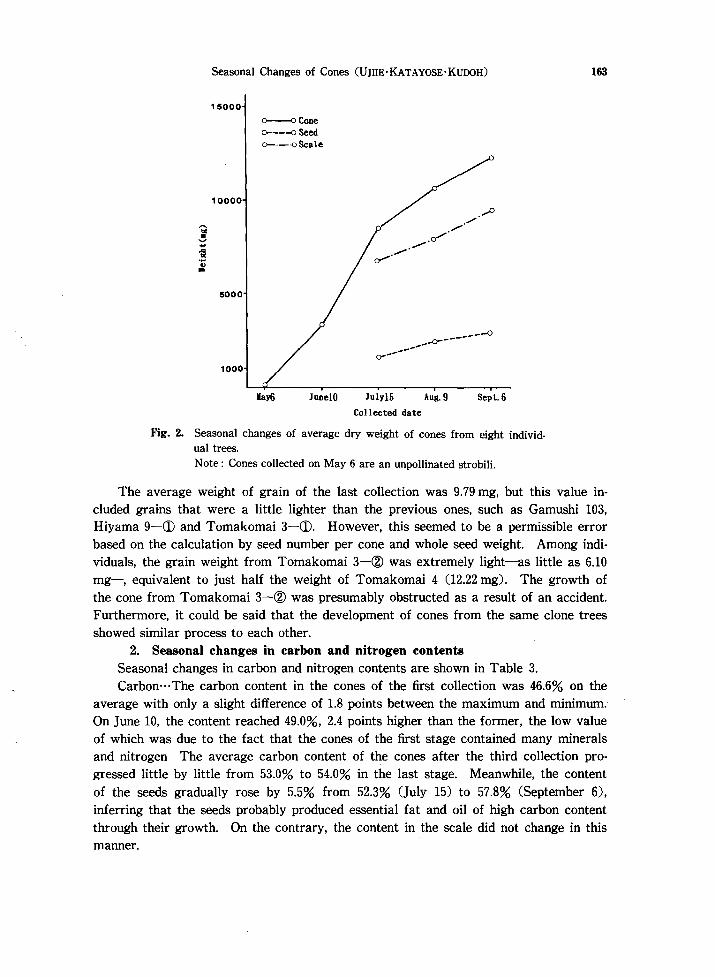
Fig. 2. Seasonal changes of average dry weight of cones from eight individ. ual trees. Note: Cones collected on May 6 are an unpollinated strobili.
163
The average weight of grain of the last collection was 9.79 mg, but this value included grains that were a little lighter than the previous ones, such as Gamushi 103, Hiyama 9-(1) and Tomakomai 3-(1). However, this seemed to be a permissible error based on the calculation by seed number per cone and whole seed weight. Among individuals, the grain weight from Tomakomai 3-@ was extremely light-as little as 6.10 mg-, equivalent to just half the weight of Tomakomai 4 (12.22 mg). The growth of the cone from Tomakomai 3-@ was presumably obstructed as a result of an accident. Furthermore, it could be said that the development of cones from the same clone trees showed similar process to each other.
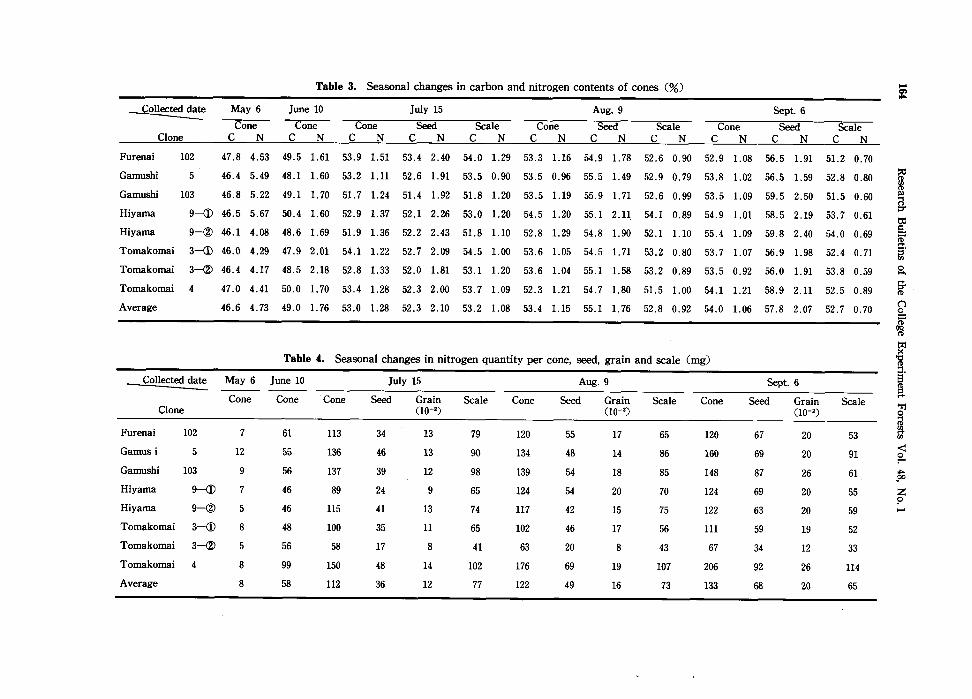
2. Seasonal changes in carbon and nitrogen contents Seasonal changes in carbon and nitrogen contents are shown in Table 3. Carbon···The carbon content in the cones of the first collection was 46.6% on the
average with only a slight difference of 1.8 points between the maximum and minimum. On June 10, the content reached 49.0%, 2.4 points higher than the former, the low value of which was due to the fact that the cones of the first stage contained many minerals and nitrogen The average carbon content of the cones after the third collection progressed little by little from 53.0% to 54.0% in the last stage. Meanwhile, the content of the seeds gradually rose by 5.5% from 52.3% (July 15) to 57.8% (September 6), inferring that the seeds probably produced essential fat and oil of high carbon content through their growth. On the contrary, the content in the scale did not change in this manner.
ColJected date
Clone
May 6
Cone C N
Table 3. Seasonal changes in carbon and nitrogen contents of cones (%)
June 10
Cone C N
Cone C N
July 15
Seed C N
Scale C N
Cone C N
Aug. 9
Seed C N
Scale C N
Cone C N
Sept. 6
Seed C N
Scale C N
Furenai 102 47.8 4.53 49.5 1.61 53.9 1.51 53.4 2.40 54.0 1.29 53.3 1.16 54.9 1.78 52.6 0.90 52.9 1.08 56.5 1.91 51.2 0.70
Gamushi
Gamushi
Hiyama
Hiyama
Tomakomai
Tomakomai
5 46.4 5.49
103 46.8 5.22
9-CD 46.5 5.67
9-@ 46.1 4.08
3-CD 46.0 4.29
3-@ 46.4 4.17
48.1 1.60
49.1 1.70
50.4 1.60
48.6 1.69
47.9 2.01
48.5 2.18
53.2 1.11
51. 7 1.24
52.9 1.37
51.9 1.36
54.1 1.22
52.8 1.33
52.6 1.91
51.4 1.92
52.1 2.26
52.2 2.43
52.7 2.09
52.0 1.81
53.5 0.90
51.8 1.20
53.0 1.20
51.8 1.10
54.5 1.00
53.1 1.20
53.5 0.96
53.5 1.19
54.5 1.20
52.8 1.29
53.6 1.05
53.6 1.04
55.5 1.49
55.9 1.71
55.1 2.11,
54.8 1.90
54.5 1. 71
55.1 1.58
52.9 0.79
52.6 0.99
54.1 0.89
52.1 1.10
53.2 0.80
53.2 0.89
53.8 1.02
53.5 1.09
54.9 1.01
55.4 1.09
53.7 1.07
53.5 0.92
56.5 1.59
59.5 2.50
58.5 2.19
59.8 2.40
56.9 1.98
56.0 1.91
52.8 0.80
51.5 0.60
53.7 0.61
54.0 0.69
52.4 0.71
53.8 0.59
Tomakomai 4
Average
47.0 4.41 50.0 1.70 53.4 1.28 52.3 2.00 53.7 1.09 52.3 1.21 54.7 1.80 51.5 1.00 54.1 1.21 58.9 2.11 52.5 0.89
46.6 4.73 49.0 1.76 53.0 1.28 52.3 2.10 53.2 1.08 53.4 1.15 55.1 1.76 52.8 0.92 54.0 1.06 57.8 2.07 52.7 0.70
ColJected date
Clone
Furenai 102
May 6
Cone
7
Gamus i 5 12
Gamushi
Hiyama
Hiyama
103 9
9-CD 7
9-@ 5
Tomakomai 3-CD 8
5
8
8
Tomakomai 3-@
Tomakomai 4
Average
Table 4. Seasonal changes in nitrogen quantity per cone, seed, grain and scale (mg)
June 10
Cone
61
55
56
46
46
48
56
99
58
Cone
113
136
137
89
115
100
58
150
112
July 15
Seed
34
46
39
24
41
35
17
48
36
Grain ClO-')
13
13
12
9
13
11
8
14
12
Scale
79
90
98
65
74
65
41
102
77
Cone
120
134
139
124
117
102
63
176
122
Aug. 9
Seed
55
48
54
54
42
46
20
69
49
Grain (10-')
17
14
18
20
15
17
8
19
16
Scale
65
86
85
70
75
56
43
107
73
Cone
120
160
148
124
122
111
67
206
133
Sept. 6
Seed Grain (10-')
67 20
69
87
69
63
59
34
92
68
20
26
20
20
19
12
26
20
Scale
53
91
61
55
59
52
33
114
65
~
[ § ~. iil o ..... g-() g.
~
f. i i (f)
<: ~ .... S¥'
z ~ ......
Seasonal Changes of Cones (UJIIE·KATAYOSE·KuooH)
. Cone Iluantl ty x-x
Seed Scale x---x X-o-x
5
Content 0---0 o--~ 0-'-0
4
150
2
50
layS JunelO July15 Aug. 9 Sept. 6
Collected date
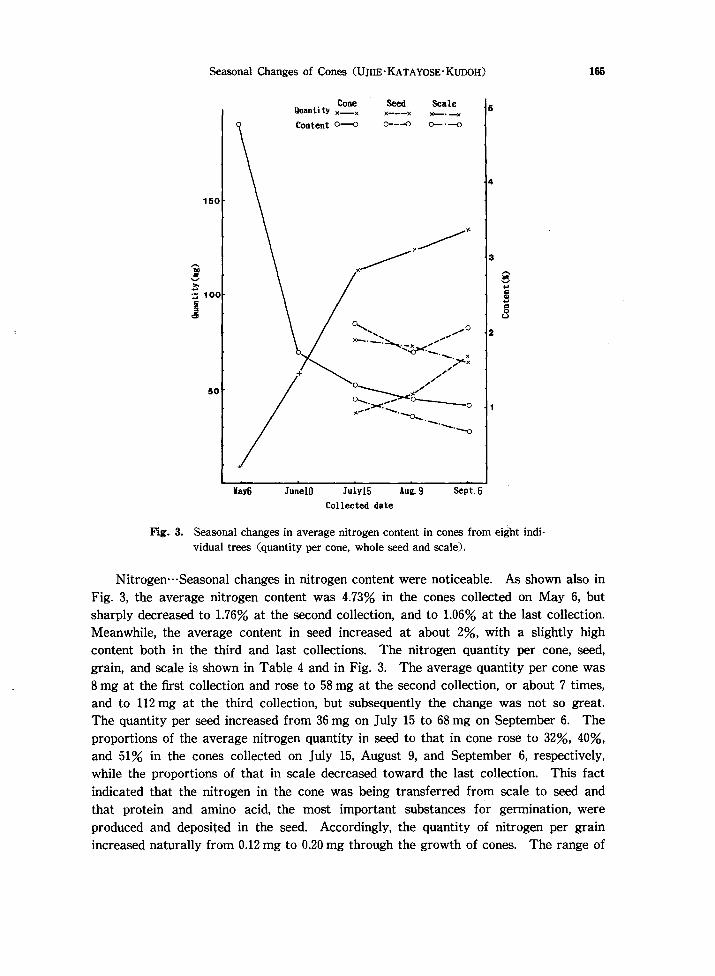
Fig. 3. Seasonal changes in average nitrogen content in cones from eight individual trees (quantity per cone, whole seed and scale).
165
Nitrogen···Seasonal changes in nitrogen content were noticeable. As shown also in Fig. 3, the average nitrogen content was 4.73% in the cones collected on May 6, but sharply decreased to 1.76% at the second collection, and to 1.06% at the last collection. Meanwhile, the average content in seed increased at about 2%, with a slightly high content both in the third and last collections. The nitrogen quantity per cone, seed, grain, and scale is shown in Table 4 and in Fig. 3. The average quantity per cone was 8 mg at the first collection and rose to 58 mg at the second collection, or about 7 times, and to 112 mg at the third collection, but subsequently the change was not so great. The quantity per seed increased from 36 mg on July 15 to 68 mg on September 6. The proportions of the average nitrogen quantity in seed to that in cone rose to 32%, 40%, and 51% in the cones collected on July 15, August 9, and September 6, respectively, while the proportions of that in scale decreased toward the last collection. This fact indicated that the nitrogen in the cone was being transferred from scale to seed and that protein and amino acid, the most important substances for germination, were produced and deposited in the seed. Accordingly, the quantity of nitrogen per grain increased naturally from 0.12 mg to 0.20 mg through the growth of cones. The range of
166 Research Bulletins of the College Experiment Forests Vol. 48, No.1
the quantity per grain in the last stage was between 0.12 mg of Tomakomai 3-@ and 0.26 mg of Gamushi 103 and Tomakomai 4, and the value of the former was extremely low among individuals.
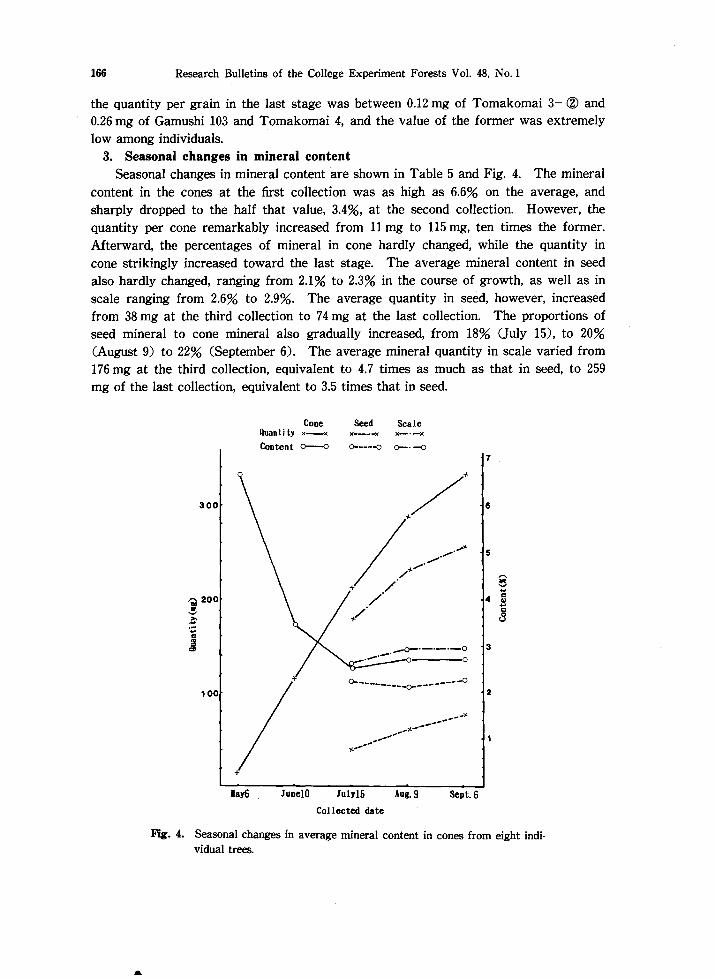
3. Seasonal changes in mineral content Seasonal changes in mineral content are shown in Table 5 and Fig. 4. The mineral
content in the cones at the first collection was as high as 6.6% on the average, and sharply dropped to the half that value, 3.4%, at the second collection. However, the quantity per cone remarkably increased from 11 mg to 115 mg, ten times the former. Afterward, the percentages of mineral in cone hardly changed, while the quantity in cone strikingly increased toward the last stage. The average mineral content in seed also hardly changed, ranging from 2.1% to 2.3% in the course of growth, as well as in scale ranging from 2.6% to 2.9%. The average quantity in seed, however, increased from 38 mg at the third collection to 74 mg at the last collection. The proportions of seed mineral to cone mineral also gradually increased, from 18% (July 15), to 20% (August 9) to 22% (September 6). The average mineral quantity in scale varied from 176 mg at the third collection, equivalent to 4.7 times as much as that in seed, to 259 mg of the last collection, equivalent to 3.5 times that in seed.
&
Cone Seed Scale Quantity x-x x-----x x-·-x
Content 0--0 0-----0 ~.-<>
7 /> 6 /> ~ 5 ..... ....... .....
/' ,.... + ./ e ....
/ 4 c «I ....
300
/ c 0
<.J
j _0-._._.-0 3 . .."",..--' 0
100 0----_____ -0-_-------0
2
)(.--------,.,'1-,..-,,,
"1-''''''----
layS lunelO Julyl5 Aug. 9 Sept. 6
Collected date
Fig. 4. Seasonal changes in average mineral content in cones from eight individual trees.
Seasonal Changes of Cones CUJIIE·KATAYOSE·KUIX)H) 167
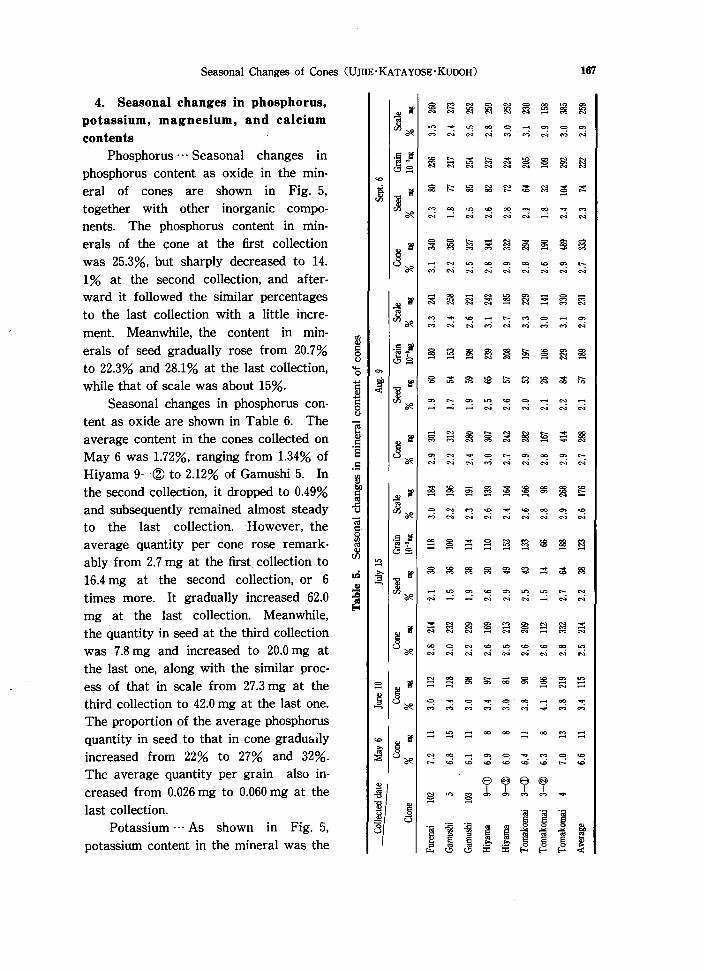
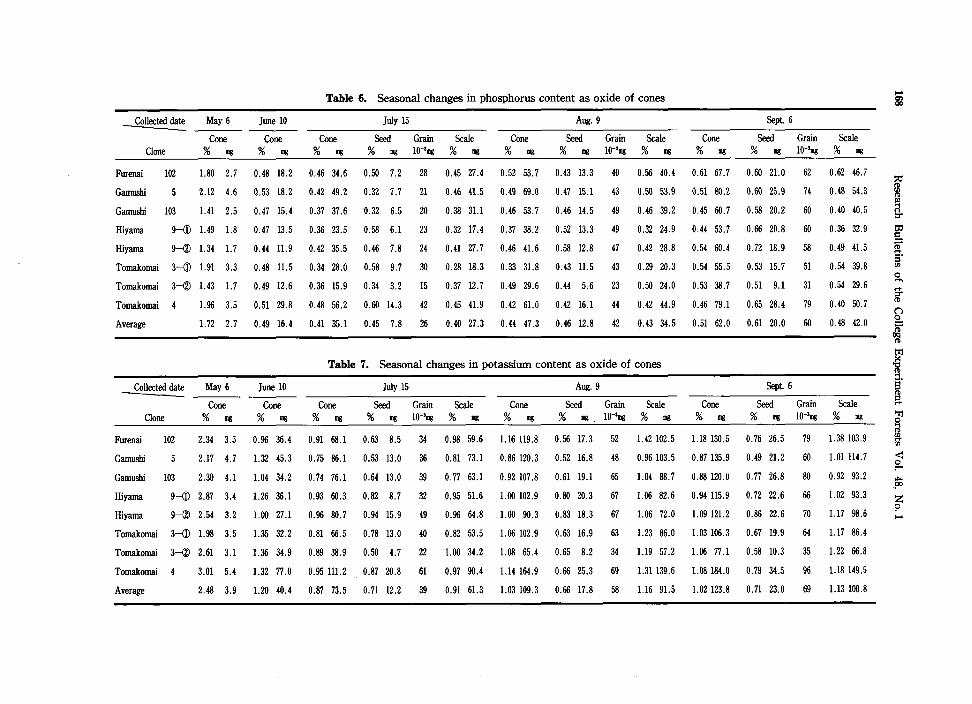
4. Seasonal changes in phosphorus, potassium, magnesium, and calcium contents
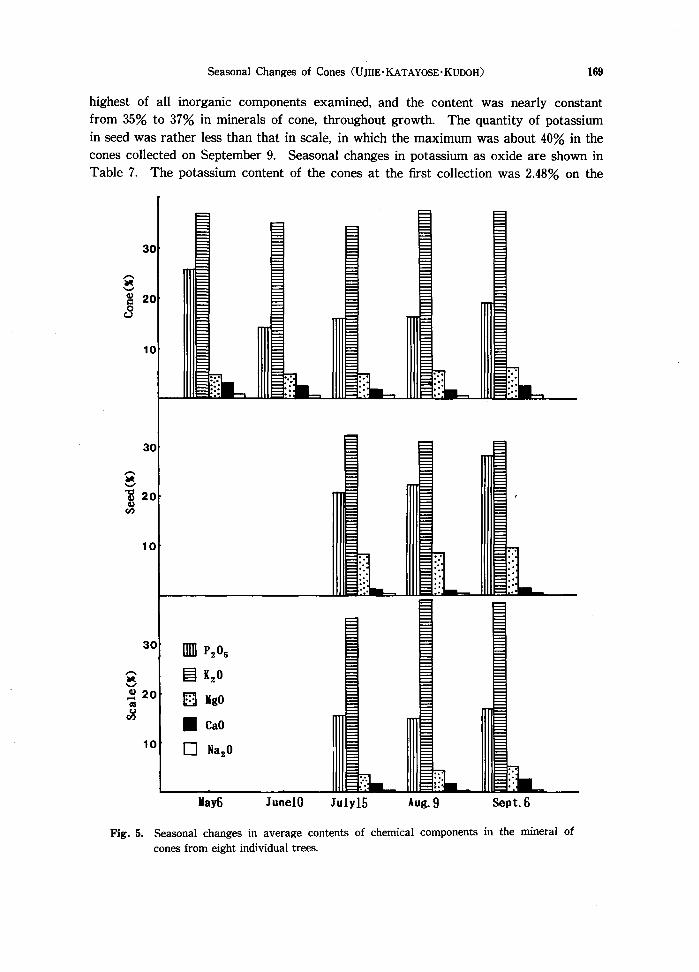
Phosphorus'" Seasonal changes in phosphorus content as oxide in the min· eral of cones are shown in Fig. 5, together with other inorganic components. The phosphorus content in minerals of the cone at the first collection was 25.3%, but sharply decreased to 14. 1% at the second collection, and afterward it followed the similar percentages to the last collection with a little increment. Meanwhile, the content in minerals of seed gradually rose from 20.7% to 22.3% and 28.1% at the last collection, while that of scale was about 15%.
Seasonal changes in phosphorus content as oxide are shown in Table 6. The average content in the cones collected on May 6 was 1.72%, ranging from 1.34% of Hiyama 9-@ to 2.12% of Gamushi 5. In the second collection, it dropped to 0.49% and subsequently remained almost steady to the last collection. However, the average quantity per cone rose remarkably from 2.7 mg at the first collection to 16.4 mg at the second collection, or 6 times more. It gradually increased 62.0 mg at the last collection. Meanwhile, the quantity in seed at the third collection was 7.8 mg and increased to 20.0 mg at the last one, along with the similar process of that in scale from 27.3 mg at the third collection to 42.0 mg at the last one. The proportion of the average phosphorus quantity in seed to that in cone graduaily increased from 22% to 27% and 32%. The average quantity per grain also increased from 0.026 mg to 0.060 mg at the last collection.
Potassium··· As shown in Fig. 5, potassium content in the mineral was the
<uif~~~~~~~~~
]~ ::: ;: ~ ::; : ~ ~ : ~
<u1'~~~~:§~;:!;~~
]~ : ;: ~ ;:; ~ : : ;:; ~
~r~~g§~~~~:;;~
8~ ~ ~ ~ ~ ~ ~ ~ ~ ::
<u1~~~~~::§~~~
]~ ;::; ~ :: ~ ~ ~ : ~ ~
~I~~~~E~~~~ o u~ ~ ~ ~ ::i ~ ~ ~ ~ ~
9!!,lected date May 6
Cone Clone % ~
Furenai
Garnushi
Garnushi
Hiyama
Hiyama
Tomakomai
Tomakomai
Tomakomai
Average
102 1.80 2.7
2.12 4.6
103 1.41 2.5
9-(1) 1.49 1.8
9-@ 1.34 1.7
3-(1) l.91 3.3
3-® 1.43 1.7
1.96 3.5
1.72 2.7
-.follected date May 6
Cone Clone % DIg
Furenai 102 2.34 3.5
June 10
Cone % ~
0.48 18.2
0.53 18.2
0.47 15.4
0.47 13.5
0.44 11.9
0.48 11.5
0.49 12.6
0.51 29.8
0.49 16.4
June 10
Cone % DIg
0.96 36.4
Table 6. Seasonal changes in phosphorus content as oxide of cones
Cone % DIg
0.46 34.6
0.42 49.2
0.37 37.6
0.36 23.5
0.42 35.5
0.34 28.0
0.36 15.9
0.48 56.2
0.41 35.1
July 15
Seed Grain Scale % DIg 10-'111/! % ~
0.50 7.2
0.32 7.7
0.32 6.5
0.58 6.1
0.46 7.8
0.58 9.7
0.34 3.2
0.60 14.3
0.45 7.8
28
21
20
23
24
30
15
42
26
0.45 27.4
0.46 41.5
0.38 31.1
0.32 17.4
0.41 27.7
0.28 18.3
0.37 12.7
0.45 41.9
0.40 27.3
Cone % DIg
0.52 53.7
0.49 69.0
0.46 53.7
0.37 38.2
0.46 41.6
0.33 31.8
0.49 29.6
0.42 61.0
0.44 47.3
Aug. 9
Seed Grain Scale %~10-'111/!%~
0.43 13.3
0.47 15.1
0.46 14.5
0.52 13.3
0.58 12.8
0.43 11.5
0.44 5.6
0.42 16.1
0.46 12.8
40
43
49
49
47
43
23
44
42
0.56 40.4
0.50 53.9
0.46 39.2
0.32 24.9
0.42 28.8
0.29 20.3
0.50 24.0
0.42 44.9
0.43 34.5
Table 7. Seasonal changes in potassium content as oxide of cones
July 15
Cone Seed Grain Scale % DIg % ~ 1O-'mg % ~
Cone % III/!
Aug. 9
Seed Grain Scale % DIg 1O-'~ % DIg
0.91 68.1 0.63 8.5 34 0.98 59.6 1.16 119.8 0.56 17.3 52 1.42 102.5
Cone % III/!
0.61 67.7
0.51 80.2
0.45 60.7
0.44 53.7
0.54 60.4
0.54 55.5
0.53 38.7
0.46 79.1
0.51 62.0
Cone % DIg
1.18 130.5
Sept. 6
Seed Grain Scale % ~ 10-'DIg % III/!
0.60 21.0
0.60 25.9
0.58 20.2
0.66 20.8
0.72 18.9
0.53 15.7
0.51 9.1
0.65 28.4
0.61 20.0
Sept. 6
62
74
60
60
58
51
31
79
60
0.62 46.7
0.48 54.3
0.40 40.5
0.36 32.9
0.49 41.5
0.54 39.8
0.54 29.6
0.40 50.7
0.48 42.0
Seed Grain Scale % ~ 10-'111/! % DIg
0.76 26.5 79 1.38 103.9
Garnushi 2.17 4.7 1.32 45.3 0.75 86.1 0.53 13.0 36 0.81 73.1 0.86120.3 0.52 16.8 48 0.96103.5 0.87135.9 0.49 21.2 60 1.01114.7
Gamushi 103 2.30 4.1 1.04 34.2 0.74 76.1 0.64 13.0 39 0.77 63.1 0.92 107.8 0.61 19.1 65 1.04 88.7 0.88120.0 0.77 26.8 80 0.92 93.2
Hiyama
Hiyama
9-(1) 2.87 3.4 1.26 36.1 0.93 60.3 0.82 8.7 32 0.95 5l.6 1.00 102.9 0.80 20.3 67 1.06 82.6 0.94 115.9 0.72 22.6 66 1.02 93.3
9-® 2.54 3.2 1.00 27.1 0.96 80.7 0.94 15.9 49 0.96 64.8 1.00 90.3 0.83 18.3 67 1.06 72.0 1.09 121.2 0.86 22.6 70 1.17 98.6
Tomakomai 3-(1) 1.98 3.5 1.35 32.2 0.81 66.5 0.78 13.0 40 0.82 53.5 1.06 102.9 0.63 16.9 63 1.23 86.0 1.03 106.3 0.67 19.9 64 1.17 86.4
Tomakomai 3-@ 2.61 3.1 1.36 34.9 0.89 38.9 0.50 4.7 22 1.00 34.2 1.08 65.4 0.65 8.2 34 1.19 57.2 1.06 77.1 0.58 10.3 35 1.22 66.8
Tomakomai 3.01 5.4 1.32 77.0 0.95 1ll.2 0.87 20.8 61 0.97 90.4 1.14 164.9 0.66 25.3 69 1.31139.6 1.08 184.0 0.79 34.5 96 1.18149.5
Average 2.48 3.9 1.20 40.4 0.87 73.5 0.71 12.2 39 0.91 61.3 1.03 109.3 0.66 17.8 58 1.16 91.5 1.02 123.8 0.71 23.0 69 1.13 100.8
i
[ ~ it ~.
g,
if ~ ~
f i f '" <: ~ .... $X'
Z \=> ....
Seasonal Changes of Cones CUJIIE·KATAYOSE·KUIX)H) 169
highest of all inorganic components examined, and the content was nearly constant from 35% to 37% in minerals of cone, throughout growth. The quantity of potassium in seed was rather less than that in scale, in which the maximum was about 40% in the cones collected on September 9. Seasonal changes in potassium as oxide are shown in Table 7. The potassium content of the cones at the first collection was 2.48% on the
30
10
30
10
30 mn P2 05 r.. ~ '2° ~ '-J
~ 20 ~ IgO CIS ...
~ • CaO 10 0 Na20
lay6 JunelO July15 Aug. 9 Sept. 6
Fig. 5. Seasonal changes in average contents of chemical components in the mineral of cones from eight individual trees.
Collected date May 6
Cone Clone % III!
Furenai
Gamushi
Gamushi
Hiyama
Hiyama
Tomakomai
Tomakomai
Tomakomai
Average
102 0.29 0.4
0.35 0.7
103 0.26 0.5
9--Q) 0.28 0.3
9~ 0.24 0.3
3-(D 0.32 0.6
3~ 0.26 0.3
0.32 0.6
0.29 0.5
_Collected date May 6
Cone % DIg Clone
Furenai 102 0.30 0.4
June 10
Cone % DIg
0.18 6.8
0.14 4.8
0.12 U
0.17 4.9
0.15 4.1
0.15 3.6
0.16 4.0
0.17 9.9
0.16 5.3
June 10
Cone % DIg
0.08 3.0
Table 8. Seasonal changes in magnesium content as oxide of cones
Cone % III!
0.11 8.0
0.11 12.1
0.10 9.8
0.13 8.3
0.11 9.1
0.11 8.9
0.09 3.9
0.13 15.5
0.11 9.5
July 15
Seed Grain Scale % mg 10-'DIg % mg
0.13 1.9
0.13 3.1
0.12 2.4
0.27 2.9
0.26 4.4
0.22 3.7
0.10 0.9
0.26 6.2
0.19 3.2
11
14
11
16
10
0.10 6,1
0.10 9.0
0.09 7.4
0.10 5.4
0.07 4.7
0.08 5.2
0.09 3.0
0.10 9.3
0.09 6.3
Cone % III!
0.14 14.0
0.14 19.1
0.13 14.9
0.15 15.2
0.18 16.0
0.11 10.6
0.15 8.6
0.15 21.5
0.14 15.0
:;0::
Aug. 9
Seed Grain Scale % mg lO-'mg % mg
0.15 4.6
0.16 5.1
0.15 4.7
0.23 5.8
0.23 5.1
0.16 4.3
0.17 2.1
0.17 6.5
0.18 4.8
14
15
16
21
19
16
9
18
16
0.13 9.4
0.13 14.0
0.12 10.2
0.12 9.4
0.16 10.9
0.09 6.3
0.14 6.5
0.14 15.0
0.13 10.2
Table 9. Seasonal changes in calcium content as oxide of cones
Cone % DIg
July 15
Seed Grain Scale % DIg lO-'mg % DIg
Cone % mg
Aug. 9
Seed Grain Scale % mg 10-'1II! % IIIg
0.04 3.1 0.02 0.2 0.05 2.9 0.03 3.5 0.02 0.6 18 0.04 2.9
Cone % mg
0.18 20.2
0.15 22.9
0.14 18.8
0.19 23.9
0.18 20.0
0.16 16.7
0.15 10.9
0.18 31.0
0.17 20.6
Cone % mg
0.09 10.2
Sept 6
Seed Grain Scale % mg 10-'1II! % mg
0.22 7.7
0.17 7.3
0.24 8.3
0.22 6.9
0.31 8.1
0.23 6.8
0.15 2.7
0.20 8.7
0.22 7.1
Sept. 6
23
21
25
20
25
22
24
21
0.17 12.5
0.14 15.6
0.10 10.5
0.19 17.0
0.14 11.9
0.14 9.9
0.15 8.2
0.18 22.3
0.15 13.5
Seed Grain Scale % mg 10-'DIg % DIg
0.03 1.1 33 0.12 9.1
Gamushi 0.23 0.5 0.06 2.1 0.04 4.4 0.01 0.3 0.05 4.1 0.05 6.6 0.02 0.5 14 0.06 6.1 0.05 7.6 0.02 0.8 23 0.06 6.8
Gamushi 103 0.16 0.3 0.10 3.3 0.03 2.6 0.02 0.3 0.03 2.3 0.04 4.2 0.02 0.6 20 0.04 3.6 0.07 8.8 0.03 1.0 30 0.08 7.8
Hiyama
Hiyama
9-(D 0.13 0.2 0.07 2.0 0.04 2.8 0.03 0.3 11 0.05 2.5 0.05 5.3 0.02 0.5 17 0.06 4.8 0.07 8.3 0.03 0.8 23 0.08 7.5
9-@ 0.14 0.2 0.06 1.6 0.04 3.1 0.02 0.3 0.04 2.8 0.04 3.4 0.02 0.4 15 0.04 3.0 0.07 7.8 0.04 1.1 34 0.08 6.7
Tomakomai 3-(D 0.26 0.5 0.07 1.7 0.04 2.9 0.03 0.4 12 0.04 2.5 0.04 3.8 0.02 0.4 15 0.05 3.4 0.05 5.1 0.02 0.6 19 0.06 4.4
Tomakomai 3-@ 0.15 0.2 0.05 1.3 0.04 1.8 0.02 0.2 0.05 1.6 0.04 2.3 0.01 0.2 0.05 2.1 0.06 4.2 0.02 0.4 14 0.07 3.8
Tomakomai
Average
0.14 0.3 0.06 3.5 0.05 5.7 0.03 0.6 18 0.06 5.1 0.04 5.9 0.02 0.7 19 0.05 5.2 0.06 9.8 0.02 0.7 20 0.07 9.1
0.19 0.3 0.07 2.3 0.04 3.3 0.02 0.3 11 0.05 3.0 0.04 4.4 0.02 0.5 16 0.05 3.9 0.07 7.7 0.03 0.8 25 0.08 6.9
... C!
w ~ ~ ~. iil o .... ~ (") o
f ~ ~. I i rn
<: ~
~ Z 9 .....
Seasonal Changes of Cones CUJIlE·KATAYOSE·KUI)(>H) 171
average, ranging between 1.98% and 3.01%, while the average quantity per cone was 3. 9 mg. At the second collection, it dropped to 1.20%, less than half the value of the first collection, while the quantity rose to 40.4 mg, over ten times that of the former. Subsequently, the content per cone hardly varied-only 0.87%, 1.03%, and 1.02% at the three collections, respectively-through the growth of cones. However, the quantity of phosphorus in cones rose from 73.5 mg at the third collection to 109.3 mg and 123.8 mg at maturity, in proportion to the increase of cone weight. The phosphorus content in seed was nearly constant from the third collection to the last collection. The quantity in seed from mature cones was 23.0 mg on the average, ranging between 10.3 mg for Tomakomai 3-@ and 34.5 mg for Tomakomai 4. The proportion of the average quantity in seed to that in cone was as low as 16% to 18%. This indicated that the phosphorus content in cones was chiefly based on the quantity in scale.
Magnesium···As shown in Fig. 5, the magnesium content in minerals of cone increased only 4.4% to 6.0% in the course of growth. The content in the mineral of seed (8.2% to 9.5%) was about twice that of scale (3.6% to 5.1%), so that it was inferred that the seed would require much magnesium presumably for its germination.
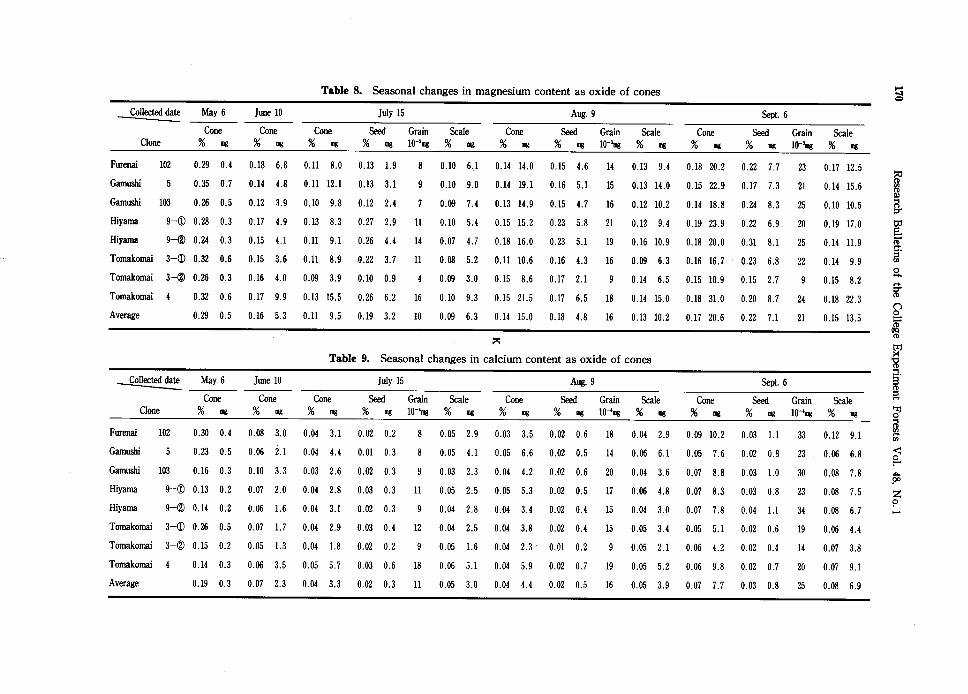
Seasonal changes in magnesium content as oxide are shown in Table 8. The magnesium content in the cones at the first collection was 0.29% on the average, while that at the last collection was 0.17%. The average quantity in cones varied from 0.5 mg at the first collection to 20.6 mg at the last collection. The proportion of the average quantity per seed to that per cone was nearly constant at about 34% through the cone growth. The magnesium quantity per grain from the cones at the last collection was 0.021 mg on the average, in which only the grain of Tomakomai 3-@ contained an extremely small quantity, 0.009 mg, compared with that of other trees.
Calcium···As shown in Fig. 5, the calcium content in the mineral of cone was unexpectedly low, compared with magnsium. The content was about 2%, with a little increment of that in matured cones. The content in the mineral of seed was very low, about 1%, while that of scale 2% or so.
Seasonal changes in calcium content as oxide are shown in Table 9. The average content in the cones collected on May 6, was 0.19%, but dropped to 0.07% at the second collection, and 0.04% at the third collection. Subsequently, the content varied only 0.04% to 0.07%. The quantity of calcium in seed from mature cones was 0.8 mg, and
Tabfe 10. Chemical composition in the mineral of cones from Abies sachalinensis* C%)
Mineral Chemical components as oxide in mineral Sample Collected date
content p.O, K.O MgO CaD Na.O SiD. AI.O, Fe.O, Total
Cone June 18 3.20 23.1 44.3 6.0 3.8 0.3 17.8 3.2 1.4 99.9
Cone July 12 2.93 15.7 42.6 5.1 3.4 0.7 17.7 4.0 4.3 93.5
Cone Sept. 22 2.84 17.9 41.6 9.5 4.6 0.9 12.0 1.5 4.0 92.0
Seed Sept. 22 1.97 31.0 36.1 9.1 4.1 0.7 5.8 3.6 1.6 92.0
• A 45-year-old planted tree having 14.0 m high and 32 cm in DBH. located in the Nayoro Prefectural Forest.
172 Research Bulletins of the College Experiment Forests Vol. 48. No.1
the proportion of the average calcium quantity per seed to that per cone was calculated at only 10%. which inferred that calcium was not so important in the germination of seed. Accordingly, the quantity per grain of the seed from mature cones was only 0.0025 mg on the average.
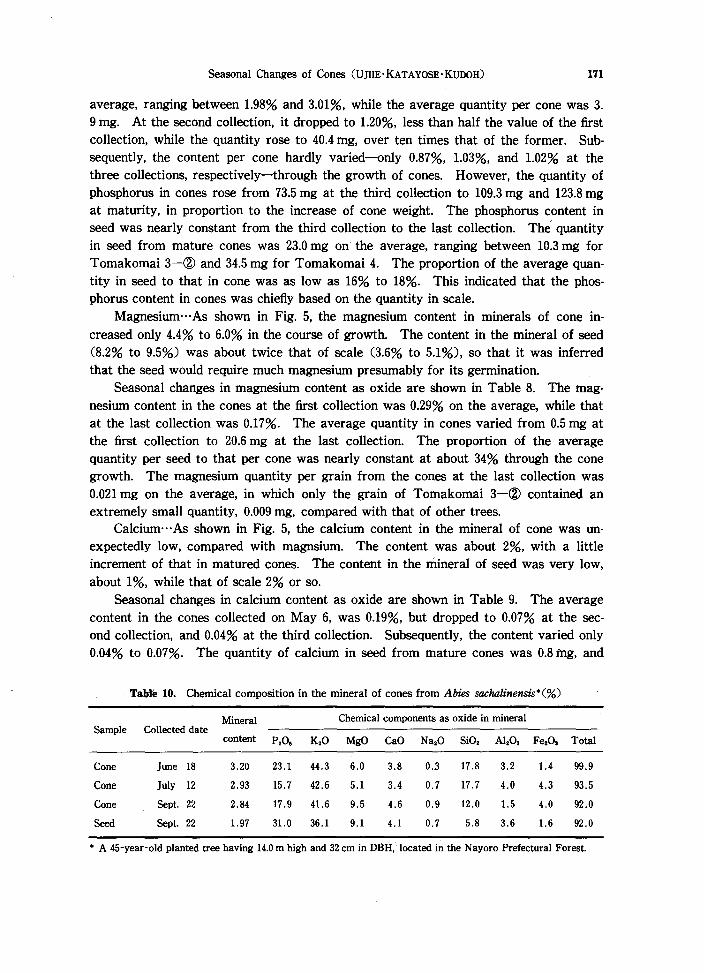
As shown in Fig. 5. sodium content in the mineral was much less than calcium. so that it could be neglected. The rest of inorganic components were presumably such substances as silicon, aluminum, and iron. as shown in Table 10 (previously examined by one of the authors). in which the total amounts covered more than 90% of minerals9
) •
5. Contents of chemical components in mature cones. The contents of chemical components in seed and scale from mature cones are
shown in Table 11. The average carbon content in seed was 57.7%. which was higher than in scale by 4.6 points. The average nitrogen content was 1.8% in the former which was relatively high. equivalent to just three times the latter. Meanwhile. the total mineral content in seed was 1.9%, a little lower than that in scale, but the average contents of phosphorus and magnesium in seed were higher than those in scale, while the contents of potassium and calcium in the former were lower than those in the latter. From this fact, it was inferred that the substances necessary for germination were much present in the seed. Among eleven clones, the seeds of the same clone showed generally similar contents of chemical components.
The weights and quantities of chemical components per cone and seed in mature cones are shown in Table 12. The average cone weight was 12.22 g, in which the seed was 3.00 g on the average, about 25% of cone. The carbon quantity per cone was 6.62 g, equivalent to 54% of cone weight, and the nitrogen and mineral quantities were 106 mg (0.9%) and 284 mg (2.3%), respectively. The highest in minerals of cone was potassium, 104 mg on the average, followed by phosphorus with 41 mg and magnesium with 16 mg. Meanwhile, the average carbon quantity in seed was 1.73 g or 26% of that in cones, and the nitrogen quantity was 55 mg or 55% of that in cones.
6. Quantities of chemical components per grain and germination rate of mature seeds
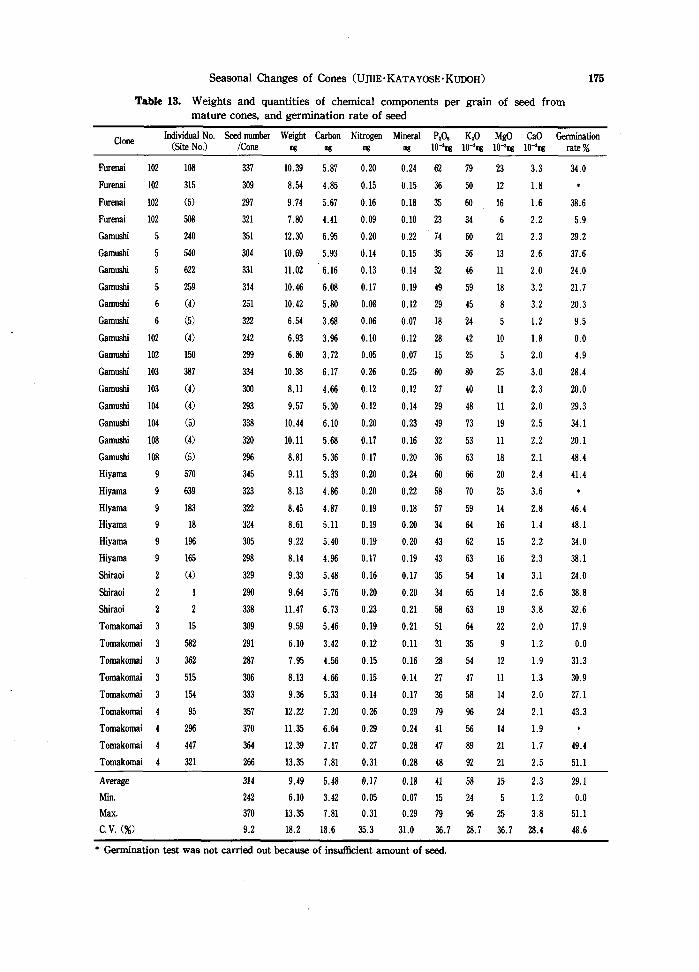
As shown in Table 13, the average seed number per cone was 314 grains, ranging from 242 to 370 grains at only 9.2% of the coefficient of variation. The average weight of grain was 9.49 mg, ranging from 6.10 to 13.35 mg. The quantities of carbon and nitrogen per grain were 5.48 mg and 0.17 mg, respectively, and the coefficients of variation were higher in the latter than the former. The quantity of total minerals was O. 18 mg, showing a similar value to that of nitrogen. The maximum quantity in minerals was potassium, followed by phosphorus and magnesium. The average germination rate was 29.1%, ranging from 0%, non-germination, to 51.1%, so that the coefficient of variation was as high as 48.6%, Among eleven clones, the grains of seed from Gamushi 5 and Tomakomai 4 were generally heavy, substantial, and rich in nutrient substances, while those from Gamushi 102 and Tomakomai 3 were light and poor in nutrients. Accordingly, the former were higher in the germination rate than the latter. Furthermore, it was shown that the germination rate of the seed from the Hiyama 9 clone was
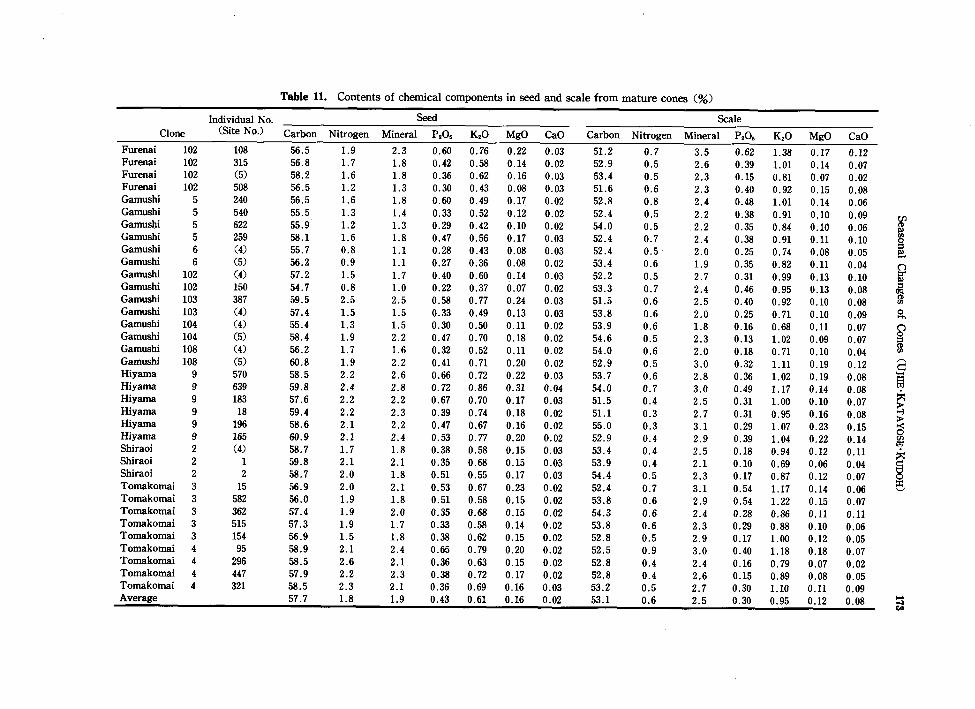
Table 11. Contents of chemical components in seed and scale from mature cones C%)
Individual No. Seed Scale
Clone (Site No.) Carbon Nitrogen Mineral P,O, K,O MgO Cao Carbon Nitrogen Mineral P,O, K,O MgO CaO
Furenai 102 108 56.5 1.9 2.3 0.60 0.76 0.22 0.03 51.2 0.7 3.5 0.62 1.38 0.17 0.12 Furenai 102 315 56.8 1.7 1.8 0.42 0.58 0.14 0.02 52.9 0.5 2.6 0.39 1.01 0.14 0.07 Furenai 102 (5) 58.2 1.6 1.8 0.36 0.62 0.16 0.03 53.4 0.5 2.3 0.15 0.81 0.07 0.02 Furenai 102 508 56.5 1.2 1.3 0.30 0.43 0.08 0.03 51.6 0.6 2.3 0.40 0.92 0.15 0.08 Gamushi 5 240 56.5 1.6 1.8 0.60 0.49 0.17 0.02 52.8 0.8 2.4 0.48 1.01 0.14 0.06 Gamushi 5 540 55.5 1.3 1.4 0.33 0.52 0.12 0.02 52.4 0.5 2.2 0.38 0.91 0.10 0.09 (fJ
Gamusbi 5 622 55.9 1.2 1.3 0.29 0.42 0.10 0.02 54.0 0.5 2.2 0.35 0.84 0.10 0.06 (I) I>l
Gamushi 5 259 58.1 1.6 1.8 0.47 0.56 0.17 0.03 52.4 0.7 2.4 0.38 0.91 0.11 0.10 ~ Gamushi 6 (4) 55.7 0.8 1.1 0.28 0.43 0.08 0.03 52.4 0.5 2.0 0.25 0.74 0.08 0.05
::s e!.
Gamushi 6 (5) 56.2 0.9 1.1 0.27 0.36 0.08 0.02 53.4 0.6 1.9 0.35 0.82 0.11 0.04 (")
Gamushi 102 (4) 57.2 1.5 1.7 0.40 0.60 0.14 0.03 52.2 0.5 2.7 0.31 0.99 0.13 0.10 ::r I>l
Gamushi 102 150 54.7 0.8 1.0 0.22 0.37 0.07 0.02 53.3 0.7 2.4 0.46 0.95 0.13 0.08 ~ Gamushi 103 387 59.5 2.5 2.5 0.58 0.77 0.24 0.03 51.5 0.6 2.5 0.40 0.92 0.10 0.08 Gamushi 103 (4) 57.4 1.5 1.5 0.33 0.49 0.13 0.03 53.8 0.6 2.0 0.25 0.71 0.10 0.09 0 ..... Gamushi 104 (4) 55.4 1.3 1.5 0.30 0.50 0.11 0.02 53.9 0.6 1.8 0.16 0.68 0.11 0.07 (")
Gamushi 104 (5) 58.4 1.9 2.2 0.47 0.70 0.18 0.02 54.6 0.5 2.3 0.13 1.02 0.09 0.07 0
~ Gamushi 108 (4) 56.2 1.7 1.6 0.32 0.52 0.11 0.02 54.0 0.6 2.0 0.18 0.71 0.10 0.04 C/l
Gamushi 108 (5) 60.8 1.9 2.2 0.41 0.71 0.20 0.02 52.9 0.5 3.0 0.32 1.11 0.19 0.12 "-c::: Hiyama 9 570 58.5 2.2 2.6 0.66 0.72 0.22 0.03 53.7 0.6 2.8 0.36 1.02 0.19 0.08 '= Hiyama 9 639 59.8 2.4 2.8 0.72 0.86 0.31 0.04 54.0 0.7 3.0 0.49 1.17 0.14 0.08 t!i Hiyama 9 183 57.6 2.2 2.2 0.67 0.70 0.17 0.03 51.5 0.4 2.5 0.31 1.00 0.10 0.07 ~
~ Hiyama 9 18 59.4 2.2 2.3 0.39 0.74 0.18 0.02 51.1 0.3 2.7 0.31 0.95 0.16 0.08 > Hiyama 9 196 58.6 2.1 2.2 0.47 0.67 0.16 0.02 55.0 0.3 3.1 0.29 1.07 0.23 0.15 Ci Hiyama 9 165 60.9 2.1 2.4 0.53 0.77 0.20 0.02 52.9 0.4 2.9 0.39 1.04 0.22 0.14 en
ttl Shiraoi 2 (4) 58.7 1.7 1.8 0.38 0.58 0.15 0.03 53.4 0.4 2.5 0.18 0.94 0.12 0.11
§ Shiraoi 2 1 59.8 2.1 2.1 0.35 0.68 0.15 0.03 53.9 0.4 2.1 0.10 0.69 0.06 0.04 Shiraoi 2 2 58.7 2.0 1.8 0.51 0.55 0.17 0.03 54.4 0.5 2.3 0.17 0.87 0.12 0.07 Tomakomai 3 15 56.9 2.0 2.1 0.53 0.67 0.23 0.02 52.4 0.7 3.1 0.54 1.17 0.14 0.06 == '-'
Tomakomai 3 582 56.0 1.9 1.8 0.51 0.58 0.15 0.02 53.8 0.6 2.9 0.54 1.22 0.15 0.07 Tomakomai 3 362 57.4 1.9 2.0 0.35 0.68 0.15 0.02 54.3 0.6 2.4 0.28 0.86 0.11 0.11 Tomakomai 3 515 57.3 1.9 1.7 0.33 0.58 0.14 0.02 53.8 0.6 2.3 0.29 0.88 0.10 0.06 Tomakomai 3 154 56.9 1.5 1.8 0.38 0.62 0.15 0.02 52.8 0.5 2.9 0.17 1.00 0.12 0.05 Tomakomai 4 95 58.9 2.1 2.4 0.65 0.79 0.20 0.02 52.5 0.9 3.0 0.40 1.18 0.18 0.07 Tomakomai 4 296 58.5 2.6 2.1 0.36 0.63 0.15 0.02 52.8 0.4 2.4 0.16 0.79 0.07 0.02 Tomakomai 4 447 57.9 2.2 2.3 0.38 0.72 0.17 0.02 52.8 0.4 2.6 0.15 0.89 0.08 0.05 Tomakomai 4 321 58.5 2.3 2.1 0.36 0.69 0.16 0.03 53.2 0.5 2.7 0.30 1.10 0.11 0.09 Average 57.7 1.8 1.9 0.43 0.61 0.16 0.02 53.1 0.6 2.5 0.30 0.95 0.12 0.08 ...
""'I CoO
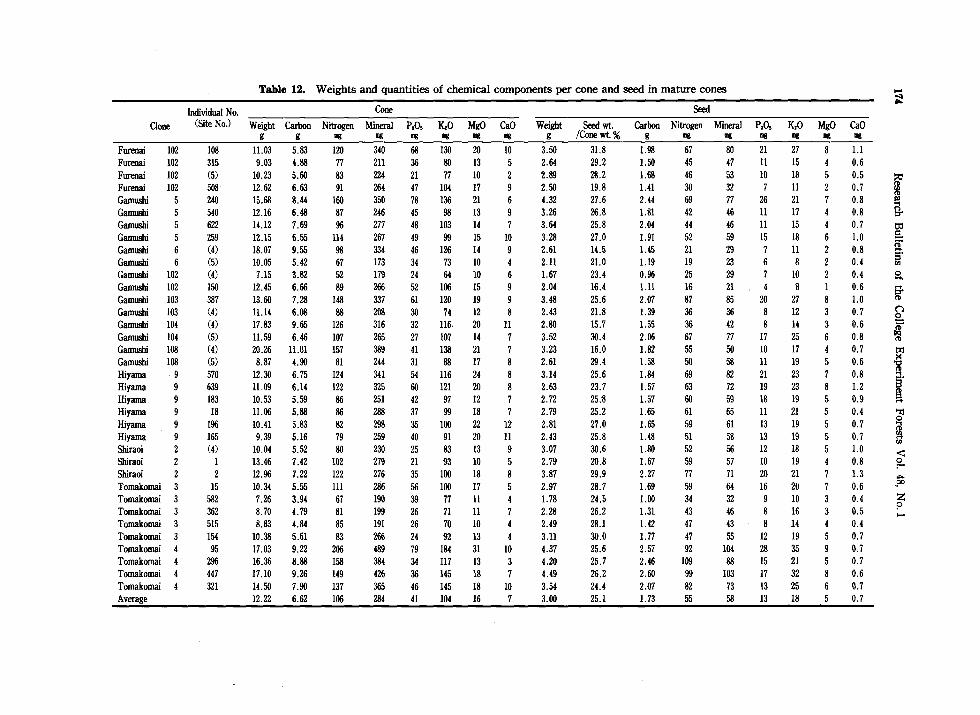
Table 12. Weights and quantities of chemical components per cone and seed in mature cones ... ~
Individual No. Cone Seed
Clone (Site No.) Weight Carbon Nitrogen Mineral P,O. K,O MgO Cao Weight Seed wt. Carbon Nitrogen Mineral P,O, K,O MgO Cao g g ~ III! IIg III! III! III! g lCone wt. % g 11& III! ~ 11& 11& 11&
Furenai 102 108 11.03 5.83 120 340 68 130 20 10 3.50 31.8 1.98 67 80 21 27 1.1 Furenai 102 315 9.03 4.88 77 211 36 80 13 5 2.64 29.2 1.50 45 47 11 15 4 0.6 Furenai 102 (5) 10.23 5.60 83 224 21 77 10 2 2.89 28.2 1.68 46 53 10 18 5 0.5 ~ Furenai 102 508 12.62 6.63 91 264 47 104 17 9 2.50 19.8 1.41 30 32 7 11 2 0.7 l'6 Gamushi 5 240 15.68 8.44 160 350 78 136 21 6 4.32 27.6 2.44 69 77 26 21 7 0.8 II>
Gamushi 5 540 12.16 6.48 87 246 45 98 13 9 3.26 26.8 1.81 42 46 11 17 0.8 t=l ::r Gamushi 5 622 14.12 7.69 96 277 48 103 14 7 3.64 25.8 2.04 44 46 11 15 4 0.7 tJ:! Gamushi 5 259 12.15 6.55 114 267 49 99 15 10 3.28 27.0 1.91 52 59 15 18 6 1.0 E.
(;j' Gamushi 6 (4) 18.07 9.55 98 334 46 126 14 9 2.61 14.5 1.45 21 29 7 11 2 0.8 ..... Gamushi 6 (5) 10.05 5.42 67 173 34 73 10 4 2.11 21.0 1.19 19 23 6 8 2 0.4 5'
rn
Gamushi 102 (4) 7.15 3.82 52 179 24 64 10 6 1.67 23.4 0.96 25 29 7 10 2 0.4 0 ..... Gamushi 102 150 12.45 6.66 89 266 52 106 15 9 2.04 16.4 1.11 16 21 8 1 0.6 So Gamushi 103 387 13.60 7.28 148 337 61 120 19 3.48 25.6 2.07 87 85 20 27 8 1.0 (I)
Gamushi 103 (4) 11.14 6.OS 88 20S 30 74 12 2.43 21.8 1.39 36 36 8 12 3 0.7 ("') 0
Gamushi 104 (4) 17.83 9.65 126 316 32 116 20 11 2.80 15.7 1.55 36 42 8 14 3 0.6 ~ Gamushi 104 (5) 11.59 6.46 107 265 27 107 14 7 3.52 30.4 2.06 67 77 17 25 6 0.8 Gamushi 108 (4) 20.26 11.01 157 389 41 138 21 7 3.23 16.0 1.82 55 50 10 17 4 0.7 ~ Gamushi lOS (5) 8.87 4.90 81 244 31 88 17 8 2.61 29.4 1.58 50 58 11 19 5 0.6 ~ Hiyama . 9 570 12.30 6.75 124 341 54 116 24 8 3.l4 25.6 1.84 69 82 21 23 7 0.8 ::I. Hiyama 9 639 11.09 6.14 122 325 60 121 20 8 2.63 23.7 1.57 63 72 19 23 8 1.2 a Hiyama 9 183 10.53 5.59 86 251 42 97 12 7 2.72 25.8 1.57 60 59 18 19 5 0.9 a Hiyama 9 18 11.06 5.88 86 288 37 99 18 7 2.79 25.2 1.65 61 65 11 21 5 0.4 "l
0 Hiyama 9 196 10.41 5.83 82 298 35 100 22 12 2.81 27.0 1.65 59 61 13 19 5 0.7 ~ Hiyama 9 165 9.39 5.16 79 259 40 91 20 11 2.43 25.8 1.48 51 58 13 19 5 0.7 ~
rn Shiraoi 2 (4) 10.04 5.52 80 230 25 83 13 9 3.07 30.6 1.80 52 56 12 18 5 1.0 <: Shiraoi 2 1 13.46 7.42 102 279 21 93 10 5 2.79 20.8 1.67 59 57 10 19 4 0.8 ~ Shiraoi 2 2 12.96 7.22 122 276 35 100 18 8 3.87 29.9 2.27 77 71 20 21 7 1.3 .... Tomakomai 15 10.34 5.55 111 286 56 100 17 2.97 28.7 1.69 59 64 16 20 7 0.6 • <xl
Tomakomai 582 7.26 3.94 67 190 39 77 11 1.78 24.5 1.00 34 32 9 10 3 0.4 Z 0
Tomakomai 362 8.70 4.79 81 199 26 71 11 2.28 26.2 1.31 43 46 8 16 3 0.5 ...... Tomakomai 515 8.83 4.84 85 191 26 70 10 2.49 28.1 1.42 47 43 8 14 4 0.4 Tomakomai 154 10.38 5.61 83 266 24 92 13 4 3.11 30.0 1.77 47 55 12 19 5 0.7 Tomakomai 95 17.03 9.22 206 489 79 184 31 10 4.37 25.6 2.57 92 104 28 35 9 0.7 Tomakomai 296 16.36 8.88 158 384 34 117 13 3 4.20 25.7 2.46 109 88 15 21 5 0.7 Tomakomai 447 17.10 9.26 149 426 36 145 18 7 4.49 26.2 2.60 99 103 17 32 8 0.6 Tomakomai 321 14.50 7.90 137 365 46 145 18 10 3.54 24.4 2.07 82 73 13 25 6 0.7 Average 12.22 6.62 106 284 41 104 16 7 3.00 25.1 1.73 55 58 13 18 5 0.7
Seasonal Changes of Cones (UJIIE·KATAYOSE·KUIXlH) 175
Table 13. Weights and quantities of chemical components per grain of seed from mature cones, and germination rate of seed
Clone
Furenai 102
Furenai 102
Furenai 102
Furenai 102
Gamushi 5
Gamushi 5
Gamushi
Gamushi
Gamushi
Gamushi
Gamushi 102
Gamushi 102
Gamushi 103
Gamushi 103
Gamushi 104
Gamushi 104
Gamushi 108
Gamushi 108
Hiyama
Hiyama
Hiyama 9
Hiyama
Hiyama
Hiyama
Shiraoi
Shiraoi
Shiraoi
Tomakomai
Tomakomai
Tornakomai
Tomakomai
Tomakomai
Tomakomai
Tomakomai
Tomakomai
Tomakomai
Average
Min.
Max.
C. V. (%)
Individual No. Seed number Weight Carbon Nitrogen Mineral P,o, K,O MgO CaO 10-'mg 10-'mg 10-'mg 10-'mg (Site No.) lCone mg mg mg mg
108
315
(5)
508
240
540
622
259
(4)
(5)
(4)
150
387
(4)
(4)
(5)
(4)
(5)
570
639
183
18
196
165
(4)
15
582
362
515
154
95
296
447
321
337
309
297
321
351
304
331
314
251
322
242
299
334
300
293
338
320
296
345
323
322
324
305
298
329
290
338
309
291
287
306
333
357
370
364
266
314
242
370
9.2
10.39 5.87
8.54 4.85
9.74 5.67
7.80 4.41
12.30 6.95
10.69 5.93
11.02 6.16
10.46 6.08
10.42 5.80
6.54 3.68
6.93 3.96
6.80 3.72
10.38 6.17
8.11 4.66
9.57 5.30
10.44 6.10
10.11 5.68
8.81 5.36
9.11 5.~
8.13 4.86
8.45 4.87
8.61 5.11
9.22 5.40
8.14 4.96
9.33 5.48
9.64 5.76
11.47 6.73
9.59 5.46
6.10 3.42
7.95 4.56
8.13 4.66
9.36 5.33
12.22 7.20
11.35 6.64
12.39 7.17
13.35 7.81
9.49 5.48
6.10 3.42
13.35 7.81
18.2 18.6
0.20
0.15
0.16
0.09
0.20
0.14
0.13
0.17
0.08
0.06
0.10
0.05
0.26
0.12
0.12
0.20
0.17
0.17
0.20
0.20
0.19
0.19
0.19
0.17
0.16
0.20
0.23
0.19
0.12
0.15
0.15
0.14
0.26
0.29
0.27
0.31
0.17
0.05
0.31
35.3
0.24 62
0.15 36
0.18 35
0.10 23
0.22 74
0.15 35
0.14 32
0.19 49
0.12 29
0.07 18
0.12 28
0.07 15
0.25 60
0.12 27
0.14 29
0.23 49
0.16 32
0.20 36
0.24 60
0.22 58
0.18 57
0.20 34
0.20 43
0.19 43
0.17 35
0.20 34
0.21 58
0.21 51
0.11 31
0.16 28
0.14 27
0.17 36
0.29 79
0.24 41
0.28 47
0.28 48
79
50
60
34
60
56
46
59
45
24
42
25
80
40
48
73
53
63
66
70
59
64
62
63
54
65
63
64
35
54
47
58
96
56
89
92
23
12
16
6
21
13
11
18
10
5
25
11
11
19
11
18
20
25
14
16
15
16
14
14
19
22
9
12
11
14
24
14
21
21
3.3
1.8
1.6
2.2
2.3
2.6
2.0
3.2
3.2
1.2
1.8
2.0
3.0
2.3
2.0
2.5
2.2
2.1
2.4
3.6
2.8
1.4
2.2
2.3
3.1
2.6
3.8
2.0
1.2
1.9
1.3
2.0
2.1
1.9
1.7
2.5
l~ 0 58 ~ 2.3
0.07 15 24 1.2
0.29 79 96 25 3.8
31.0 36.7 28.7 36.7 28.4
• Germination test was not carried out because of insufficient amount of seed.
Germination rate %
34.0
38.6
5.9
29.2
37.6
24.0
21.7
20.3
9.5
0.0
4.9
28.4
20.0
29.3
34.1
20.1
48.4
41.4
46.4
48.1
34.0
38.1
24.0
38.8
32.6
17.9
0.0
31.3
30.9
27.1
43.3
49.4
51.1
29.1
0.0
51.1
48.6
176 Research Bulletins of the College Experiment Forests Vol. 48, No.1
60
50
* • •
~
~ 40
~ • • * ... c:: 0 * • . .;:::
'" .S E 30 Q)
" 20 •
10
0.04 0.09 0.14 0.19 0.24 0.29 0.34
Nitrogen content (mg)
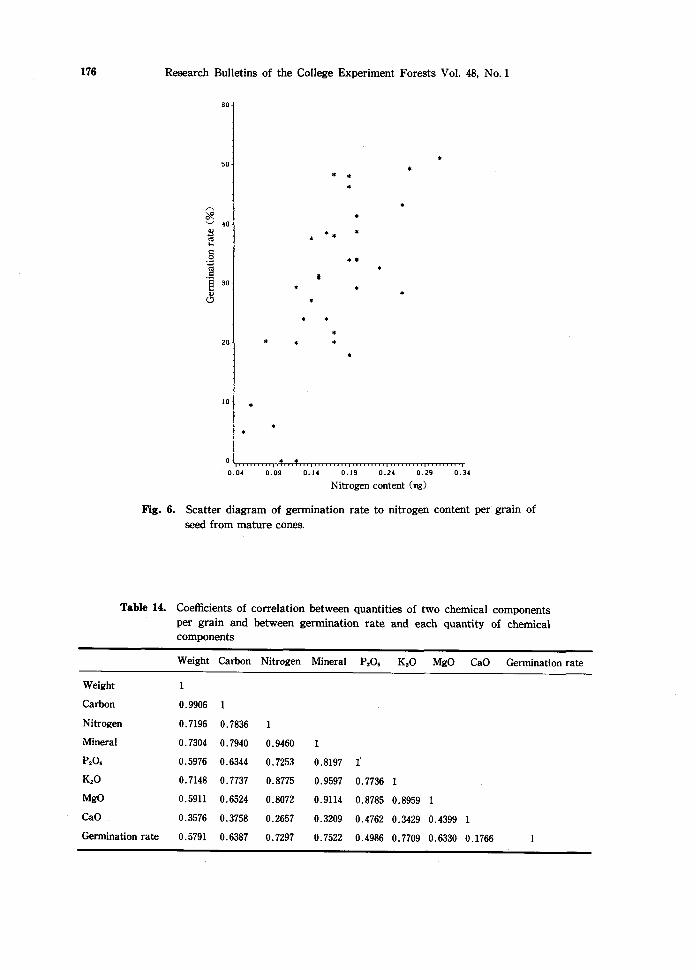
Fig. 6. Scatter diagram of germination rate to nitrogen content per grain of
seed from mature cones.
Table 14. Coefficients of correlation between quantities of two chemical components per grain and between germination rate and each quantity of chemical components
Weight Carbon Nitrogen Mineral pzO. KzO MgO CaO Germination rate
Weight
Carbon 0.9906 1
Nitrogen 0.7196 0.7836
Mineral 0.7304 0.7940 0.9460
PzO, 0.5976 0.6344 0.7253 0.8197 1"
KzO 0.7148 0.7737 0.8775 0.9597 0.7736
MgO 0.5911 0.6524 0.8072 0.9114 0.8785 0.8959
CaO 0.3576 0.3758 0.2657 0.3209 0.4762 0.3429 0.4399
Germination rate 0.5791 0.6387 0.7297 0.7522 0.4986 0.7709 0.6330 0.1766
Seasonal Changes of Cones (UJIIE·KATAYOSE·KUOOH)
60
50
~ 40 '--'
~ • • • ... c: 0 •• '';: CIS • . 8 E
30
Q)
c.!)
20
10 •
• • 0.06 0.11 0.16 0.21 0.26 0.31
Mineral content (rug)
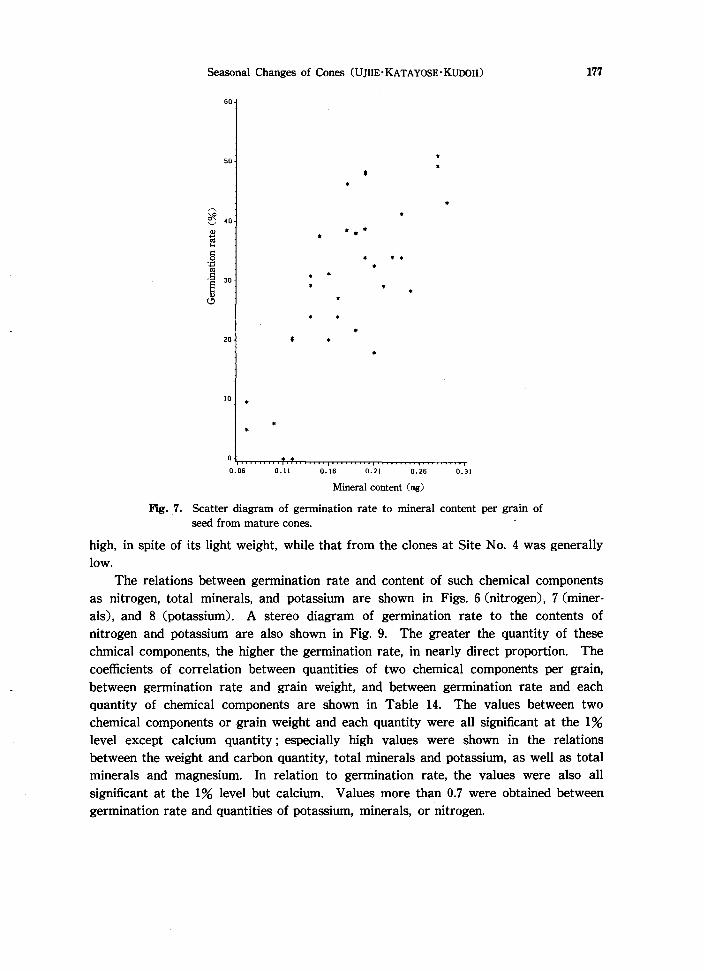
Fig. 7. Scatter diagram of germination rate to mineral content per grain of seed from mature cones.
177
high, in spite of its light weight, while that from the clones at Site No. 4 was generally low.
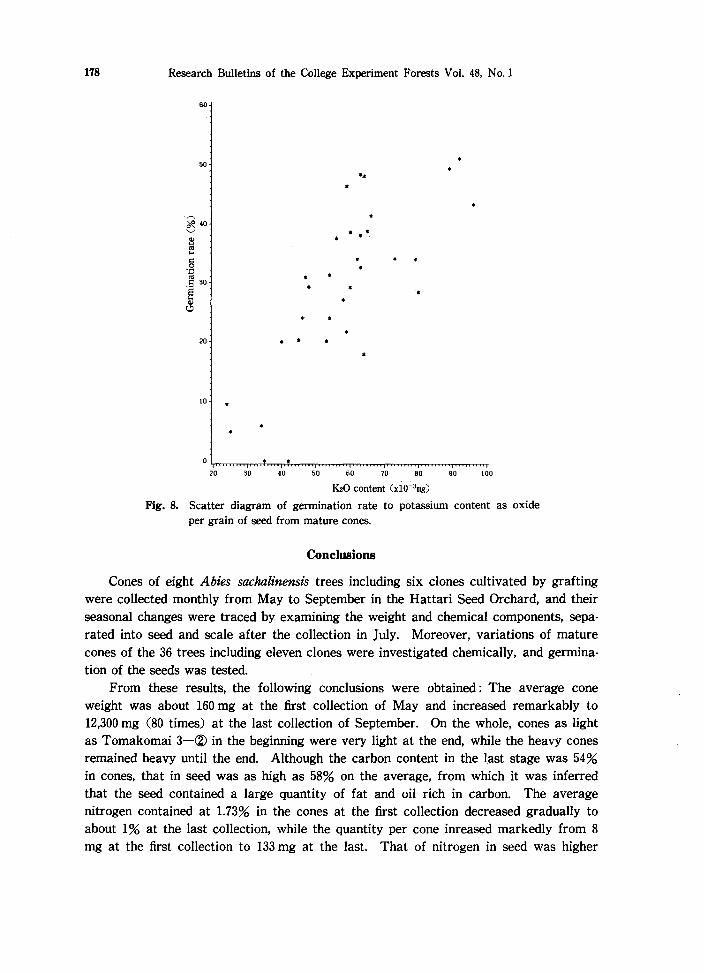
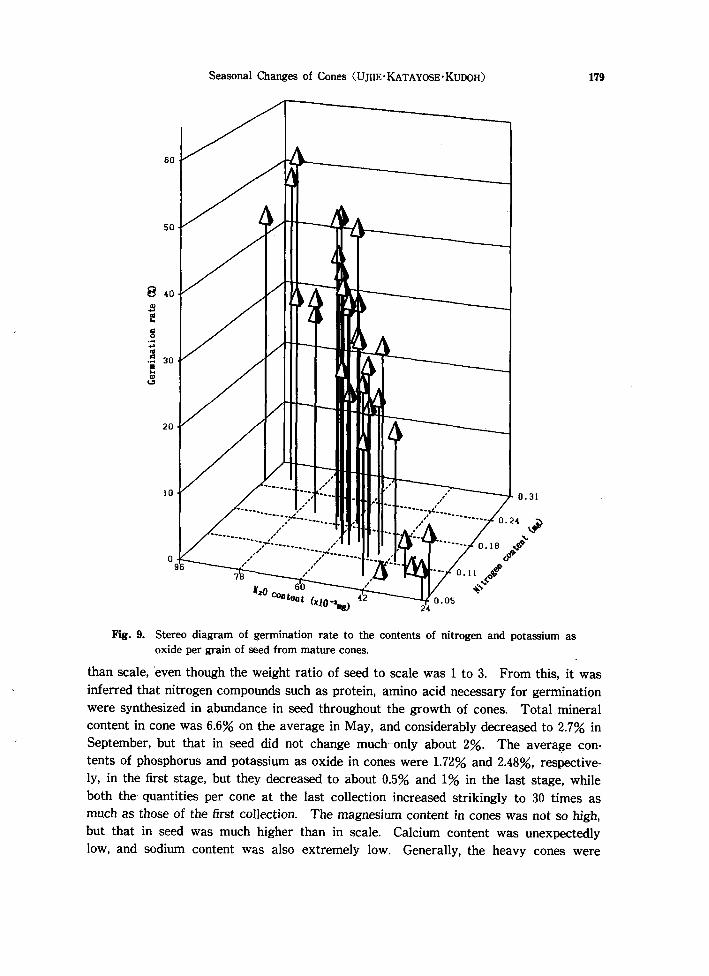
The relations between germination rate and content of such chemical components as nitrogen, total minerals, and potassium are shown in Figs. 6 (nitrogen), 7 (minerals), and 8 (potassium). A stereo diagram of germination rate to the contents of nitrogen and potassium are also shown in Fig. 9. The greater the quantity of these chmical components, the higher the germination rate, in nearly direct proportion. The coefficients of correlation between quantities of two chemical components per grain, between germination rate and grain weight, and between germination rate and each quantity of chemical components are shown in Table 14. The values between two chemical components or grain weight and each quantity were all significant at the 1% level except calcium quantity; especially high values were shown in the relations between the weight and carbon quantity, total minerals and potassium, as well as total minerals and magnesium. In relation to germination rate, the values were also all significant at the 1% level but calcium. Values more than 0.7 were obtained between germination rate and quantities of potassium, minerals, or nitrogen.
178 Research Bulletins of the College Experiment Forests Vol. 48, No.1
60
50
20 • •
10
20 30 40 50
.. '
60
. •
70 80
KzO content (XiO~3mg) 90 100
Fig. 8. Scatter diagram of germination rate to potassium content as oxide per grain of seed from mature cones.
Conclusions
Cones of eight Abies sachalinensis trees including six clones cultivated by grafting were collected monthly from May to September in the Hattari Seed Orchard, and their seasonal changes were traced by examining the weight and chemical components, sepa· rated into seed and scale after the collection in July. Moreover, variations of mature cones of the 36 trees including eleven clones were investigated chemically, and germina· tion of the seeds was tested.
From these results, the following conclusions were obtained: The average cone weight was about 160 mg at the first collection of May and increased remarkably to 12,300 mg (80 times) at the last collection of September. On the whole, cones as light as Tomakomai 3-@ in the beginning were very light at the end, while the heavy cones remained heavy until the end. Although the carbon content in the last stage was 54 % in cones, that in seed was as high as 58% on the average, from which it was inferred that the seed contained a large quantity of fat and oil rich in carbon. The average nitrogen contained at 1.73% in the cones at the first collection decreased gradually to about 1% at the last collection, while the quantity per cone inreased markedly from 8 mg at the first collection to 133 mg at the last. That of nitrogen in seed was higher
60
50
8 40
.s e .. 0 .~ ... .. .. 30 '2 ., <!I
20
10
Seasonal Changes of Cones CU JIIE' KA TA YOSE' KUDOH)
,/ "
/
24
0.31
0.24 .jl
'" ••••••• 0 18 # '",
'" 0.11 0' ..... ~ ~ ..
0.05
Fig. 9. Stereo diagram of germination rate to the contents of nitrogen and potassium as oxide per grain of seed from mature cones.
179
than scale, even though the weight ratio of seed to scale was 1 to 3. From this, it was inferred that nitrogen compounds such as protein, amino acid necessary for germination were synthesized in abundance in seed throughout the growth of cones. Total mineral content in cone was 6.6% on the average in May, and considerably decreased to 2.7% in September, but that in seed did not change much-only about 2%. The average con· tents of phosphorus and potassium as oxide in cones were 1.72% and 2.48%, respective' ly, in the first stage, but they decreased to about 0.5% and 1% in the last stage, while both the quantities per cone at the last collection increased strikingly to 30 times as much as those of the first collection. The magnesium content in cones was not so high, but that in seed was much higher than in scale. Calcium content was unexpectedly low, and sodium content was also extremely low. Generally, the heavy cones were
180 Research Bulletins of the College Experiment Forests Vol. 48, No.1
rich in all the chemical components. In the 36 mature cones, the average contents of carbon, nitrogen, mineral, phospho
rus, potassium, and magnesium in seed were 57.7%, 1.8%, 1.9%, 0.43%, 0.61%, and 0.16%, respectively, while those in scale were 53.1%, 0.6%, 2.5%, 0.30%, 0.95%, and 0.12%. The chemical components which were richer in seed than in scale were carbon, nitrogen, phosphorus, and magnesium. Although the content of potassium important for germination was the highest in total minerals, it was rather higher in scale than in seed. The seed number per cone was 314 grains on the average. Among clones, the grains from Tomakomai 4 and Gamushi 5 were generally heavy and rich in nu~trient substances, while those from Tomakomai 3 and Gamushi 102 were light and poor in these substances. The average germination rate was 29.1%, with a large coefficient of variation ranging from 0% to 51.1%, in which the seeds from Tomakomai 4 and Hiyama 9 showed high germination rates, .but not from Tomakomai 3 and Gamushi 102. Coefficients of correlation between grain weight and each quantity of chemical components or quantities of two chemical components per grain were high and significant at the 1% level except calcium. Furthermore, those between germination rate and quantity of each chemical component were also significant at the 1% level, especially showed high values over 0.7 in the quantities of potassium, minerals and nitrogen per grain.
Hereafter, it is necessary to observe and manage the growth of trees transplanted in mountains from nurseries until their maturity. Although Abies sachalinensis trees are now very popular in Hokkaido, their seedlings are less resistant to frost injury and attack by such fungi as Scleroderris canker, and they generally have wood of low density and often wetwood in the heartwood. Accordingly, clones resistant to climatic damage and of good wood quality must be selected further from the clones now selected by phenotype.
literature
1. DICKMAN, D. I. and T. T. KOULOWSKI: Seasonal variations in reserve and structural components of Pinus resinosa cones. Amer, l. Bot, 56 (5) 515-520, 1969
2. Iwanai Reg .. For. Office: Outline of the Hattari Seed Orchard. 1-12, 1981 3. KATAYOSE, T. and M. UJIIE: Development of cones from various clones of Abies sachalinensis
in a seed orchard (I) Seasonal changes of dry weight, nitrogen, carbon and inorganic mat· ter. 96 th Mtg. lap. For. Soc., 291-292, 1985
4. KATAYOSE, T. and M. UJIIE: Development of cones from various clones of Abies sachalinensis in a seed orchard (III) Correlation among various chemical components and germination. 97 th Mtg. lap. For. Soc., 445-446, 1986
5. KATSUTA, M. and T. SATOO: Cone development in Pinus thunbergii. l. lap. For. Soc. 46 (5) 166-170, 1964
6. KATSUTA, M.: The synthesis of reserve protein in ripening pine seeds. J. lap. For. Soc., 43 (5) 157-161, 1961
7. KIDA, S. and N. OIKAWA: On the nutrient amounts of needles, cones, and seeds of Gryptomeria japonica in the natural stands. J. lap. For. Soc. 60 (7) 262-266, 1978
•
Seasonal Changes of Cones (UJIIE·KATAYOSE·KuOOH) 181
8. UJIIE, M. and T. KATAYOSE: Development of cones from various clones of Abies sachalinensis
in a seed orchard (II) Seasonal changes of inorganic components. Trans. Mtg. Hokkaido Br. Jap. For. Soc., 34, 147-150, 1985
9. UJIIE, M.: unpublished.
Eil1f**t;:::to\,,-c a, -t:-:h-'f:h(})~mt;:::ift L. t..:-t <·:ht..:W~t;:: J: 9 ~**~~ G t..:lsb, ~~III
~~fflt L. -C \" G 0 ~tw:il! (}) 1E1f** -c: f;l:.m;fi:, r r' ~ ')' (Abies sachalinensis MAST.) C 7 jp:.
'/ ~ ')' (Picea glehnii MAST.) :to J: rY j} '7 ~ ')' (Larix kaemPieri CARR.) ~:±. 1* c L. -C AI
** • ~~**J: 9 ~ < (})M~W~~ttL., -t:-(}).*~Jlh,-C"?~*t;::J: 9 !1 P - :/~fF 9, 45 j)
FJT(})~lIl11t;::flU~~:h -C\"Go *~~-c:~t, ~P3m~;fIJlBJt;::.t>G~'@~~II(}) 6!1 P - :/~~
tr 8 M1*(}) r r- ~ ')' ~ Jlh' -C, ~jt!)ft;(})fflt,*t;::ff? ~{t. ~~::i: C {ti!f~fflt:5t(}) jijjj'tJ· ~jH* L. t..:o
~:!iIHt 1983 ~(}) 5 Jj (~:reFit~) tJ· ~ 9 Jj (~~~Tlii:~) '* -C:$Jj .ftM1*$t;:: 2-3111f"?
~~~~ ~~.~.~~~L., .~L.-CM~, ~~, .~. 9:/. j}9~A, ~~*~
~A, j}lv~~A:toJ:rY:T r 9 ~A(})~1f~c, ~*, ~lIT C7 Jj~~tJ·~~TC.Jtt;:::5t
v-rG) C~T~:to J: rY.Jt (*""~~tr) ~t..: 9 (})~1f~~*lsbt..:o ~ ~t;::~~~*t;::"?\,'-C
~t, 36 M1* 11 !1 P - :/t;::,,?\"-Cfi!iJ~(}):5ttff~fi? C C ~ t;::, E!1f.-t:-(})~T~ImI~t;::m:llL.-C~
~~~iJtU~L., :lIT~(})~., fflt:5tc~~~c(})~f*~WIil~t..:o -t:-(})*E*~t, ik(}))M9-c:.t>Go
1. 5 Jj t;::~~ L. t..:~* C5'c~M(})~:re) (}):;p.~~:I:~t, 157 mg -c:.t> ":>f..:tJ~, 9 Jj (})~~
~* -c: f;l:. 12,292 mg c:to J: -t:- 80 m t;:: ~ fflt,* L. -C \" t..:o -t:- ()) 4t -c:, c < t;:: 1; 'N~\( 4 ~~.!!t 5 (}) !1
P - :/(})~*~t~ <, .:.:ht;::%jL. 1;'}/fl( 3 (})-t:-:h~tgtJ·,,? t..:o -fl.Il!:t;:::m:Jtl]t;::~\,,~*~tm:~,*
-c:~ <, ~t;::g\" ~ (})~t •• ,* -c:gtJ·,,? t..:o
2. ~*(})M~~1f~a, 5 Jj lii:Jli(}) 46.6%tJ· ~ikmt;::l::~ L., 9 Jj t;:: 54. 0% t;::)i L. t..:o
':'(})~1f~(})~~~~T(})M~~1f~(})l::~KJ:G~(})-C:,~~:lIT-c:a:toJ:-t:-~%K~)i
L. t..:(}) t;::%j L., .Jt(})-t:-:h~t 52.7% -c:, 7 Jj ~~(})~J<:!)ft;tJ. ~~1f~~t~ c·~{t. L. -C \" t~tJ· "? t..:o
.:. (}).~~tllT4tt;::M~~1f~(})iI1fj\"nBH~mtJ~fl'i't;::~fflt • Ii:fti~:h -c\,' < .:. c ~? tJ·tJ~b-lt
3. ~*(})~~~1f~~t, 5 Jj lii:Jli-c::;p.~ 4.73% c iI1fjtJ·,,? t..:tJ', ~ftrj(})*I~c c ~ t;::TJjl(;:}'
L., 9 Jj t;::~t*91 % c t~ "? t..:o -jj'~*~t..: 9 (})~~~1f:l:~t, 8 mg tJ· ~ 133 mg "" c ~ L. <
~* L. t..:o '* t,,:~T4t(})~~:I:~t.Jt t;:: < ~~-C, -t:-(})~:I:.IttJq: 3 -c:~ G t;:: ~ tJ·tJ·b ~f,
trL.6~<, ~*(})fflt'*c c ~t;::1IT4t(})pr :/B1t~7 ~ /lfit~c(})~~{t.~¥lJtJ;~L. < ~*
L. -C \" < .:. c ~7F L. t..:o
4. ~*4t(})~.~¥lJ~t, 5 Jj (})FitJli-c::;p.~ 6.6%-C:~ "? t..: ~ (})tJ;', 9 Jj t;::~t 2.7% c TJjl(;y
L. t..:tJ~, ~*~t..: 9 (}):;p.~.~¥lJ:i:lt 11 mg tJ· ~ 333 mg c ~:1Ju L. t..:o
182 Research Bulletins of the College Experiment Forests Vol. 48, No.1
5 .•• ~q:rc7)ilt*c7)~(1_H;t, 7J J} ?A-r:~·-;>f.:.o J} :/IItC7J J} ?Ac7)~1f~~i-th-'fh
5 )Hltllic7)-'JZ~ 1. 72% c 2.48%tJ,l?, 9 J3l1\t1lic7)1-o J: -t 0.5% c 1 %"",ci.IR~'L-t.:.o L-tJ, L-~
.c7)a.cc~K~~c~,-tc7)~1f.~~~mK~.L-t.:.o~~q:r""c:c7)J}:/~C7JJ}?Ac7)
~1f~~i, -tc7)rl'l'~t.:.l)~ftL-tJ:tJ'-:>f.:.o -1J"73'*y?A~1f~~i, M"~tc< I?~--C~L-<
-(J£tJ,-:,f.:.tJt, 7e~;OO~-r:~i~Jt J: I) tJ,tJ: I) f.fJiJ'·-:>f.:.o 7J Ivy? A~1f~~i, "73'* y? A J: I)
~ ~ I?tC-(J£ <, -tG --C;OO~c7)-th~i, 7J J} ? A c iPJ~~Jt J: I) ~ trL-6-(J£tJ'·:>f.:.o -r r J} ? A
c7)~1f~~i, .m-r:~ .Q~-(J£tJ'''? t.:.o
6. 7e~~~c7)~*, ~*, ~ •• ~, J} :/~, 7J J} ? A, :10 J: rf"7 3' * y? A c7)-'JZ~~
1f~~i, -t h-'fh 57.7, 1. 8, 1. 9, 0.43, 0.61%1-0 J: rf 0.16% -r: ~ I), -thtc)!';j" L- --C~Jt-r:~i,
-th-'fh 53.1, 0.6, 2.5, 0.3, 0.95%:10 J: rf 0.12%-r:~ "? t.:.o *S!i\J~~~iMJt J: I), ~*,
~*, J} :/~, "7 Y * y? A tJ: c·~~tcM1*tJt~.Q c ,'!tbh.Q~Jftc'S A..,-r:",t.:.o
7. 1 ~.~t.:. I) c7)3jZ~f!i~fl ~i 314 t'l-r:, -t c7)~Ib1*fl ~i 9.2% c {.!£tJ, "? t.:.o
8. f!i~t'l~!/]:I -:/ ~Utc.ltt't-t.Q C, ~/l'~ 41-0 J: a~.!R 5 tJt-~tcm:l:tJ,m <, *_
tclrA..,-r:1-o I), ~/l'~ 3, ~.!R 102 ~ift <, *.~Jfc7)~1ft~:PtJ:tJ'''?t.:.o
9. fi~~~~c7)-'JZ~~i 29.1%-r:, -tc7)~lllHi, 0 %tJ, I? 51.1%-r:~ I), ~tb1*fl~i 48.6%
c ~ tJ, "? t.:.o !/]:I - :/ ~U tc~~~ c7) rei", ~ c7) Ii, ~ /J\~ 4 eft LlJ 9 -r: ~ I), {.!£" ' ~ c7) ~i, ~ ~
m:l:c7)ft"'~/J\~ 3:10 J: rf~.!R 102 -r:~"? t.:.o
10. f!i~t'lc7)mt c .rra?t:1o J: rf 2 a?trl'l'c7)ffJM1*fl~i, 7J Ivy? A~1f.~~" ,--c,,'f
h ~ ~ <, mIc7)m" , ~ c7) ~~ c·, "'fhc7)*.~Jf tc ~ a- A..,-r:",.Q .:. c tJt?ttJ, "? t.:.o
11. ~~~c~~a?tcc7)rMl1*-r:~, 7Jlvy?A~~"'--C, "'fh~ 1%*~-r:1f~-r:~
I), c < tC7J J} ?A, ~ •• ~, ~*cc7)rl'l'c7)ffJrMl1*fl~iO.7 tJ.l:tc~.-t.Qil1Jj"'1iitJt.::tl?h
12. 4-1f~i, !/]:I -:/ ~Utc.:. hl?~**c7)~~~~~~~L-, r r"7 '/ c7)XA\-r:~.Q#J~
~c7)tz#ihmW~, ~j!Wtc)!';j" L- --C~UitM:tJ,~ I), *fJfl¥Jtc ~ -t <oht.:. ~ c7)~, ~ I? tc~tt L
--C", < &:\~tJt~.Qo