Embed Size (px)
Citation preview


MALAYSIA
JABATAN PERANGKAAN MALAYSIA
DEPARTMENT OF STATISTICS, MALAYSIA
PEMBENTUKAN MODAL TETAP KASAR
GROSS FIXED CAPITAL FORMATION


i
KATA PENGANTAR
Penerbitan ini membentangkan perangkaan Pembentukan Modal Tetap Kasar (PMTK)
bagi tempoh 2005 hingga 2013. Data ini adalah penting bagi menunjukkan
potensi pertumbuhan ekonomi Malaysia.
Menyedari kepentingan data ini dalam merangka dasar strategik, PMTK diterbitkan
mengikut jenis aktiviti ekonomi, jenis aset dan sektor awam & swasta. Penyusunan
perangkaan ini adalah berdasarkan saranan Sistem Akaun Negara 1993 dan 2008,
Pertubuhan Bangsa-Bangsa Bersatu.
Ringkasan penemuan dan jadual perangkaan dibentangkan pada bahagian pertama
dan kedua penerbitan ini. Nota teknikal dan sumber data turut disediakan pada
bahagian terakhir bagi memudahkan pemahaman yang lebih mendalam
mengenai perangkaan ini.
Jabatan ingin merakamkan penghargaan atas sokongan dan sumbangan kepada
semua pihak yang terlibat dalam menjayakan penerbitan ini. Sebarang cadangan dan
pandangan ke arah menambah baik penerbitan ini pada masa hadapan amatlah
dihargai.
Datuk Dr. Hj. Abdul Rahman Hasan
Ketua Perangkawan
Malaysia
Jun 2014

ii
PREFACE
This publication presents the statistics of Gross Fixed Capital Formation (GFCF) for the
period of 2005 to 2013. These data are essential to indicate the potential growth of
Malaysia’s economy.
Recognising the importance of these data in formulating strategic policies, GFCF is
published by kind of economic activity, type of assets and public & private sectors. The
compilation of these statistics is based on the recommendations of System of National
Accounts 1993 and 2008, United Nations.
Summary findings and statistical tables are presented in the first and second parts of
this publication. Technical notes and data sources are also provided in the last part to
facilitate greater understanding of the statistics.
The Department wishes to acknowledge the supports and contributions of all parties
concerned in materialising this publication. All comments and suggestions in improving
future publications are greatly appreciated.
Datuk Dr. Hj. Abdul Rahman Hasan
Chief Statistician
Malaysia
June 2014

iii
KANDUNGAN CONTENTS
Kata Pengantar Preface
i
Kandungan Contents
iii
Ringkasan Penemuan Summary Findings
1
Jadual Tables
1A PMTK mengikut Jenis Aktiviti Ekonomi pada Harga Semasa - RM Juta GFCF by Kind of Economic Activity at Current Prices - RM Million
11
1B PMTK mengikut Jenis Aktiviti Ekonomi pada Harga Malar 2005 - RM Juta GFCF by Kind of Economic Activity at Constant 2005 Prices - RM Million
11
1C PMTK mengikut Jenis Aktiviti Ekonomi pada Harga Semasa - Peratus Perubahan Tahunan GFCF by Kind of Economic Activity at Current Prices - Annual Percentage Change
12
1D PMTK mengikut Jenis Aktiviti Ekonomi pada Harga Malar 2005 - Peratus Perubahan Tahunan GFCF by Kind of Economic Activity at Constant 2005 Prices - Annual Percentage Change
12
1E PMTK mengikut Jenis Aktiviti Ekonomi pada Harga Semasa - Pembahagian Peratus kepada Jumlah PMTK GFCF by Kind of Economic Activity at Current Prices - Percentage Share to Total GFCF
13
1F PMTK mengikut Jenis Aktiviti Ekonomi pada Harga Malar 2005 - Pembahagian Peratus kepada Jumlah PMTK GFCF by Kind of Economic Activity at Constant 2005 Prices - Percentage Share to Total GFCF
13
2A PMTK mengikut Jenis Aktiviti Ekonomi dan Jenis Aset pada Harga Semasa - RM Juta GFCF by Kind of Economic Activity and Type of Assets at Current Prices - RM Million
14
2B PMTK mengikut Jenis Aktiviti Ekonomi dan Jenis Aset pada Harga Semasa - Pembahagian Peratus Mengikut Jenis Aset GFCF by Kind of Economic Activity and Type of Assets at Current Prices - Percentage Share by Type of Assets
14
Muka Surat Page

iv
KANDUNGAN CONTENTS
3A PMTK mengikut Jenis Aset pada Harga Semasa - RM Juta
GFCF by Type of Assets at Current Prices - RM Million
15
3B PMTK mengikut Jenis Aset pada Harga Malar 2005 - RM Juta
GFCF by Type of Assets at Constant 2005 Prices - RM Million
15
3C PMTK mengikut Jenis Aset pada Harga Semasa - Peratus Perubahan Tahunan GFCF by Type of Assets at Current Prices - Annual Percentage Change
15
3D PMTK mengikut Jenis Aset pada Harga Malar 2005
- Peratus Perubahan Tahunan
GFCF by Type of Assets at Constant 2005 Prices
- Annual Percentage Change
16
3E PMTK mengikut Jenis Aset pada Harga Semasa
- Pembahagian Peratus kepada Jumlah PMTK
GFCF by Type of Assets at Current Prices
- Percentage Share to Total GFCF
16
3F PMTK mengikut Jenis Aset pada Harga Malar 2005
- Pembahagian Peratus kepada Jumlah PMTK
GFCF by Type of Assets at Constant 2005 Prices
- Percentage Share to Total GFCF
16
4A PMTK mengikut Sektor dan Jenis Aktiviti Ekonomi pada Harga Semasa - RM Juta GFCF by Sector and Kind of Economic Activity at Current Prices - RM Million
17
4B PMTK mengikut Sektor dan Jenis Aktiviti Ekonomi pada Harga Malar 2005 - RM Juta GFCF by Sector and Kind of Economic Activity at Constant 2005 Prices - RM Million
17
4C PMTK mengikut Sektor dan Jenis Aktiviti Ekonomi pada Harga Semasa - Peratus Perubahan Tahunan GFCF by Sector and Kind of Economic Activity at Current Prices - Annual Percentage Change
18
4D PMTK mengikut Sektor dan Jenis Aktiviti Ekonomi pada Harga Malar 2005 - Peratus Perubahan Tahunan GFCF by Sector and Kind of Economic Activity at Constant 2005 Prices - Annual Percentage Change
18
4E PMTK mengikut Sektor dan Jenis Aktiviti Ekonomi pada Harga Semasa - Pembahagian Peratus kepada Jumlah PMTK GFCF by Sector and Kind of Economic Activity at Current Prices - Percentage Share to total GFCF
19
Muka Surat Page
Jadual Tables

v
KANDUNGAN CONTENTS
4F PMTK mengikut Sektor dan Jenis Aktiviti Ekonomi pada Harga Malar 2005 - Pembahagian Peratus kepada Jumlah PMTK GFCF by Sector and Kind of Economic Activity at Constant 2005 Prices - Percentage Share to Total GFCF
19
4G PMTK mengikut Jenis Aktiviti Ekonomi dan Sektor pada Harga Semasa - Pembahagian Peratus kepada Jenis Aktiviti Ekonomi
GFCF by Kind of Economic Activity and Sector at Current Prices
- Percentage Share to Kind of Economic Activity
20
4H PMTK mengikut Jenis Aktiviti Ekonomi dan Sektor pada Harga Malar 2005 - Pembahagian Peratus kepada Jenis Aktiviti Ekonomi GFCF by Kind of Economic Activity and Sector at Constant 2005 Prices - Percentage Share to Kind of Economic Activity
20
5A PMTK Sektor Swasta mengikut Jenis Aktiviti Ekonomi dan Jenis Aset pada
Harga Semasa - RM Juta
Private Sector GFCF by Kind of Economic Activity and Type of Assets at
Current Prices - RM Million
21
5B PMTK Sektor Awam mengikut Jenis Aktiviti Ekonomi dan Jenis Aset pada Harga Semasa - RM Juta Public Sector GFCF by Kind of Economic Activity and Type of Assets at Current Prices - RM Million
21
5C PMTK Sektor Swasta mengikut Jenis Aktiviti Ekonomi dan Jenis Aset pada Harga Semasa - Pembahagian Peratus mengikut Jenis Aset Private Sector GFCF by Kind of Economic Activity and Type of Assets at Current Prices - Percentage Share by Type of Assets
22
5D PMTK Sektor Awam mengikut Jenis Aktiviti Ekonomi dan Jenis Aset pada
Harga Semasa - Pembahagian Peratus Mengikut Jenis Aset
Public Sector GFCF by Kind of Economic Activity and Type of Assets at
Current Prices - Percentage Share by Type of Assets
22
Nota Teknikal Technical Notes
23
Sumber Data Data Sources
41
Muka Surat Page
Jadual Tables

vi
Muka surat ini sengaja dibiarkan kosong
This page is deliberately left blank

PMTK 2005-2013 GFCF 2005-2013
RINGKASAN PENEMUAN
SUMMARY FINDINGS


Pembentukan Modal Tetap Kasar 2005–2013 1 Jabatan Perangkaan Malaysia
RINGKASAN PENEMUAN
Pelaburan ke atas aset tetap adalah penting dalam memacu
pembangunan ekonomi. Oleh itu, laporan ini memberi
maklumat yang komprehensif mengenai Pembentukan
Modal Tetap Kasar (PMTK) di Malaysia mengikut jenis
aktiviti ekonomi, jenis aset dan sektor awam & swasta bagi
tahun 2005 hingga 2013.
PENGENALAN
PRESTASI PMTK PMTK Malaysia terdiri daripada pelaburan awam dan
swasta telah mencatatkan nilai RM265.0 bilion pada harga
semasa (Carta 1) dan pada harga malar PMTK meningkat
kepada RM217.9 bilion bagi tahun 2013. Ini mencatatkan
sumbangan PMTK kepada KDNK 27.7 peratus berbanding
26.7 peratus (harga malar) pada tahun sebelumnya.
Pada 2013, momentum PMTK yang menggalakkan pada
8.5 peratus telah didorong oleh aktiviti Perkhidmatan,
Perlombongan & Pengkuarian dan Pembuatan.
Pertumbuhan ini adalah hasil daripada tren positif yang
berterusan dalam projek pemangkin yang dilaksanakan
dalam ekonomi seperti infrastruktur, pengangkutan dan
tenaga.
Carta 1: KDNK dan PMTK pada Harga Semasa, 2005-2013

2 Pembentukan Modal Tetap Kasar 2005–2013 Jabatan Perangkaan Malaysia
RINGKASAN PENEMUAN
PMTK MENGIKUT
JENIS AKTIVITI
EKONOMI
Jadual 1 menunjukkan pertumbuhan dan sumbangan PMTK
mengikut jenis aktiviti ekonomi pada harga malar 2005 bagi
tahun 2012 dan 2013. Aliran positif dalam perolehan aset
tetap telah dipacu oleh semua aktiviti ekonomi, namun lebih
ketara dalam Perkhidmatan, Perlombongan & Pengkuarian
dan Pembuatan.
Pelaburan modal bagi Perkhidmatan meningkat kukuh
kepada 10.8 peratus pada 2013. Kewangan, Insurans,
Hartanah & Perkhidmatan Perniagaan terus menjadi
penggerak utama yang berkembang dengan signifikan
kepada pertumbuhan dua digit 20.0 peratus. Perbelanjaan
pelaburan yang rancak dalam aktiviti carigali mineral dan
projek pembinaan kediaman telah merangsang aktiviti
tersebut terutamanya dalam Perkhidmatan Perniagaan dan
Hartanah. Pengangkutan, Penyimpanan & Komunikasi
meningkat kepada 16.6 peratus disokong oleh pelaburan
yang tinggi dalam industri tenaga, pengangkutan udara dan
infrastruktur awam (rujuk kepada Jadual 1D).
Dari segi sumbangan kepada PMTK, Perkhidmatan menjana
sumbangan sebanyak 57.5 peratus berbanding 56.3 peratus
pada tahun sebelumnya.
Jadual 1: PMTK pada Harga Malar 2005, 2012 dan 2013
2012 2013 2012 2013
Pertanian 3.1 3.0 9.2 6.2
Perlombongan dan
Pengkuarian19.9 19.4 52.2 5.6
Pembuatan 18.9 18.3 8.1 5.2
Pembinaan 1.8 1.8 16.8 8.6
Perkhidmatan 56.3 57.5 15.0 10.8
JUMLAH PMTK 100.0 100.0 19.2 8.5
Aktiviti EkonomiSumbangan (%) Perubahan Tahunan (%)

Pembentukan Modal Tetap Kasar 2005–2013 3 Jabatan Perangkaan Malaysia
RINGKASAN PENEMUAN
Perlombongan & Pengkuarian mencatatkan pertumbuhan
5.6 peratus walaupun pada kadar yang lebih perlahan
berbanding tahun lepas. Aktiviti ini terus memacu PMTK
dengan sumbangan 19.4 peratus pada 2013.
Pembuatan meningkat kepada 5.2 peratus dan merupakan
penyumbang ketiga terbesar dalam PMTK. Pengembangan
ini sebahagian besarnya didorong oleh pemulihan ketara
dalam produk Elektrik & Elektronik dan Peralatan
Pengangkutan yang mencatatkan pertumbuhan 7.6 peratus
berbanding penurunan sebanyak 5.9 peratus pada 2012.
Tambahan pula, kenaikan signifikan sebanyak 16.8 peratus
dalam Makanan, Minuman & Tembakau dan pemulihan
kepada 5.7 peratus dalam Produk Mineral Bukan Logam,
Logam Asas & Produk Logam yang Direka telah menyokong
PMTK bagi aktiviti ini (rujuk kepada Jadual 1D).
PMTK bagi Pertanian tumbuh 6.2 peratus dan Pembinaan
meningkat kepada 8.6 peratus. Kedua-dua aktiviti ini
menyumbang sebanyak 4.8 peratus kepada PMTK.
PMTK MENGIKUT
JENIS ASET
Pada 2013, PMTK mencatatkan momentum positif bagi
semua jenis aset. Struktur berkembang pada 11.0 peratus
dan kekal sebagai jenis aset yang utama dengan
sumbangan sebanyak 48.2 peratus (Carta 2). Peralatan
Pengangkutan mencatatkan pertumbuhan dua digit
13.5 peratus yang sebahagiannya disokong oleh
perbelanjaan ke atas pengangkutan udara dan darat.
Aset Lain yang merangkumi carigali mineral dan
penyelidikan & pembangunan turut mempengaruhi
keseluruhan PMTK dengan mencatatkan pengembangan
19.3 peratus, pemulihan ketara daripada negatif 6.1 peratus
pada tahun sebelumnya.

4 Pembentukan Modal Tetap Kasar 2005–2013 Jabatan Perangkaan Malaysia
RINGKASAN PENEMUAN
39.6%
60.4%
2013
Public Sector Private Sector
PMTK MENGIKUT
SEKTOR
Sektor Swasta kekal sebagai penggerak bagi pelaburan di
Malaysia dengan sumbangan sebanyak 60.4 peratus,
peningkatan 2.4 peratus daripada 2012. Manakala, sektor
Awam terus menyokong pelaburan dengan menyumbang
39.6 peratus pada 2013 (Carta 3).
Carta 3: PMTK mengikut Sektor pada Harga Malar 2005, 2012 dan 2013
2012 2013
Sektor Swasta
Carta 2: PMTK mengikut Jenis Aset pada Harga Malar 2005, 2012 dan 2013
2012 2013
42.0%
58.0%
2012
Public Sector Private Sector
39.6%
60.4%
2013
Public Sector Private SectorSektor Awam
39.6%
60.4%
2013
Public Sector Private Sector
Struktur47.1%
Peralatan Pengangkutan
13.5%
Peralatan ICT dan Jentera & peralatan lain
27.0%
Sumber Biologi Dipupuk
1.5%
Produk Harta Intelek9.2%
Aset Lain1.6%
2012
Struktur48.2%
Peralatan Pengangkutan
14.1%
Peralatan ICT dan Jentera & peralatan lain
25.2%
Sumber Biologi Dipupuk
1.4%
Produk Harta Intelek9.2%
Aset Lain1.8%
2013
RM200.8 bilion RM217.9 bilion

Pembentukan Modal Tetap Kasar 2005–2013 5 Jabatan Perangkaan Malaysia
RINGKASAN PENEMUAN
9.3
10.1
14.1
13.6
15.0
13.6
13.4
16.5
16.4
40.1
38.6
27.7
33.3
23.1
30.7
31.6
28.1
26.3
2.5
2.5
3.1
2.6
1.9
2.8
3.0
2.9
2.8
42.6
43.4
49.6
44.5
53.6
47.2
46.2
47.4
49.7
5.5
5.5
5.5
6.1
6.3
5.6
5.8
5.2
4.8
SEKTOR SWASTA
0.3
0.2
0.2
0.2
0.2
0.2
0.2
0.2
0.2
83.6
82.5
79.8
76.4
75.4
76.0
74.1
68.7
69.4
0.4
0.4
0.4
0.3
0.3
0.3
0.3
0.3
0.3
6.8
6.3
5.8
5.9
5.4
6.4
7.0
6.3
6.2
9.0
10.5
13.8
17.1
18.7
17.1
18.4
24.6
23.9
SEKTOR AWAM
100
Tahun
2012
2011
2010
2009
2008
2007
2006
2005
50100 50
2013
Sektor Swasta Sektor Awam Tahun
9.3
10.1
14.1
13.6
15.0
13.6
13.2
16.6
15.0
40.1
38.6
27.7
33.3
23.1
30.7
32.4
29.2
23.1
2.5
2.5
3.1
2.6
1.9
2.8
3.0
2.9
1.9
42.6
43.4
49.6
44.5
53.6
47.2
45.6
46.1
53.6
5.5
5.5
5.5
6.1
6.3
5.6
5.7
5.2
6.3
SEKTOR SWASTA
Perlombongan & Pengkuarian/ Mining & Quarrying
Pembuatan/ Manufacturing
Pembinaan/ Construction
Perkhidmatan/ Services
Pertanian/ Agriculture
Perlombongan & Pengkuarian
Pembuatan
Pembinaan
Perkhidmatan
Pertanian
Aktiviti Perkhidmatan dan Pembuatan merupakan pemacu
utama dalam PMTK bagi sektor Swasta. Sumbangan
Perkhidmatan meningkat kepada 49.7 peratus berbanding
47.4 peratus pada tahun sebelumnya. Pembuatan kekal
sebagai penyumbang kedua dengan sumbangan
26.3 peratus walaupun pada peratusan lebih rendah
daripada 2012. Aktiviti selebihnya menyumbang
24.0 peratus kepada jumlah keseluruhan PMTK swasta.
Perkhidmatan dan Perlombongan & Pengkuarian terus
menjadi aktiviti utama bagi PMTK sektor Awam.
Perkhidmatan dengan sumbangan 69.4 peratus telah dipacu
sebahagian besarnya oleh pengangkutan dan utiliti.
Berikutan aktiviti carigali minyak dan gas yang berterusan,
Perlombongan & Pengkuarian menyumbang 23.9 peratus
kepada sektor ini.
PMTK MENGIKUT
SEKTOR DAN
JENIS AKTIVITI
EKONOMI
Carta 4: PMTK mengikut Sektor dan Jenis Aktiviti Ekonomi pada Harga Malar 2005, 2005-2013
Peratus (%)

SUMMARY FINDINGS
6 Gross Fixed Capital Formation 2005–2013 Department of Statistics, Malaysia
Investment on fixed assets is essential in driving the
economic development. Hence, this report provides a
comprehensive informat ion on Gross Fixed
Capital Formation (GFCF) of Malaysia by kind of economic
activity, type of assets and public & private sectors for year
2005 to 2013.
INTRODUCTION
PERFORMANCE
OF GFCF
Malaysia’s GFCF comprises of investments from
public and private registered a value of RM265.0 billion at
current prices (Chart 1) and in real terms, GFCF rose to
RM217.9 billion in 2013. This marked the share of GFCF to
GDP at 27.7 per cent against 26.7 per cent (constant prices)
in the preceding year.
During 2013, the sound momentum of GFCF at
8.5 per cent was reinforced by Services, Mining
& Quarrying and Manufacturing activities. The growth was
mirrored by a continuous positive trend in catalytic projects
undertaken in the economy such as infrastructure,
transportation and energy.
Chart 1: GDP and GFCF at Current Prices, 2005-2013

SUMMARY FINDINGS
Gross Fixed Capital Formation 2005–2013 7 Department of Statistics, Malaysia
GFCF BY KIND OF
ECONOMIC
ACTIVITY
The accompanying Table 1 illustrates the growth and
composition of GFCF by kind of economic activity at
constant 2005 prices for year 2012 and 2013. The positive
drive in acquisition of fixed assets extended to all activities in
the economy, more prominently in Services, Mining &
Quarrying and Manufacturing.
Capital investment for Services ascended to a strong
growth of 10.8 per cent in 2013. Finance, Insurance, Real
Estate & Business Services continued to be the prime mover
which augmented significantly to a double-digit growth of
20.0 per cent. The robust investment spending on mineral
exploration and construction of residential projects have
buttressed these activities precisely in Business Services
and Real Estate. Transport, Storage & Communication
boosted to a growth of 16.6 per cent backed by substantial
investment from energy industries, air transport and public
infrastructure (refer to Table 1D).
In terms of contribution to GFCF, Services generated a
share of 57.5 per cent as compared to 56.3 per cent in the
preceding year.
Table 1: GFCF at Constant 2005 Prices, 2012 and 2013
2012 2013 2012 2013
Agriculture 3.1 3.0 9.2 6.2
Mining and Quarrying 19.9 19.4 52.2 5.6
Manufacturing 18.9 18.3 8.1 5.2
Construction 1.8 1.8 16.8 8.6
Services 56.3 57.5 15.0 10.8
TOTAL GFCF 100.0 100.0 19.2 8.5
Economic ActivityShare (%) Annual Percentage Change (%)
SUMMARY FINDINGS
8 Gross Fixed Capital Formation 2005–2013 Department of Statistics, Malaysia
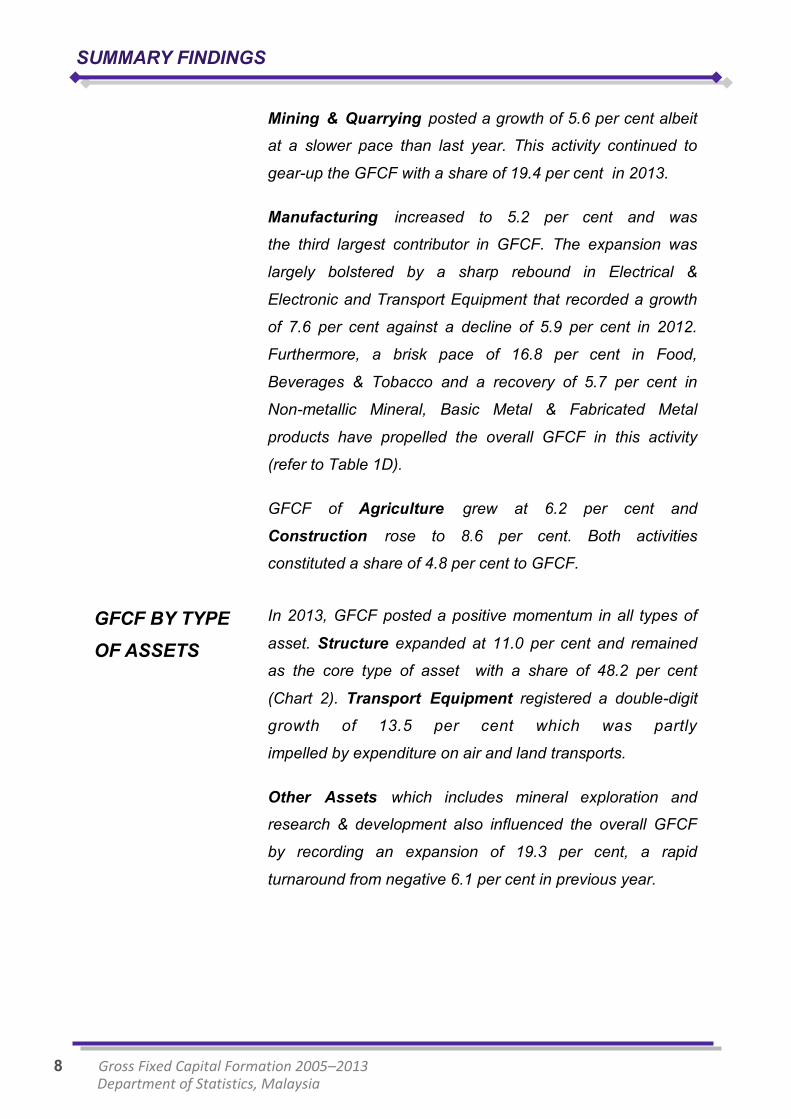
Mining & Quarrying posted a growth of 5.6 per cent albeit
at a slower pace than last year. This activity continued to
gear-up the GFCF with a share of 19.4 per cent in 2013.
Manufacturing increased to 5.2 per cent and was
the third largest contributor in GFCF. The expansion was
largely bolstered by a sharp rebound in Electrical &
Electronic and Transport Equipment that recorded a growth
of 7.6 per cent against a decline of 5.9 per cent in 2012.
Furthermore, a brisk pace of 16.8 per cent in Food,
Beverages & Tobacco and a recovery of 5.7 per cent in
Non-metallic Mineral, Basic Metal & Fabricated Metal
products have propelled the overall GFCF in this activity
(refer to Table 1D).
GFCF of Agriculture grew at 6.2 per cent and
Construction rose to 8.6 per cent. Both activities
constituted a share of 4.8 per cent to GFCF.
GFCF BY TYPE
OF ASSETS
In 2013, GFCF posted a positive momentum in all types of
asset. Structure expanded at 11.0 per cent and remained
as the core type of asset with a share of 48.2 per cent
(Chart 2). Transport Equipment registered a double-digit
growth of 13.5 per cent which was partly
impelled by expenditure on air and land transports.
Other Assets which includes mineral exploration and
research & development also influenced the overall GFCF
by recording an expansion of 19.3 per cent, a rapid
turnaround from negative 6.1 per cent in previous year.

SUMMARY FINDINGS
Gross Fixed Capital Formation 2005–2013 9 Department of Statistics, Malaysia
39.6%
60.4%
2013
Public Sector Private Sector
39.6%
60.4%
2013
Public Sector Private Sector
GFCF BY SECTOR Private sector sustained as the driving force of Malaysia’s
investment with a share of 60.4 per cent, an increase of
2.4 per cent from 2012. Meanwhile, Public sector continued
to complement the investment by contributing 39.6 per cent
in 2013 (Chart 3).
Chart 3: GFCF by Sector at Constant 2005 Prices, 2012 and 2013
Public Sector Private Sector
Chart 2: GFCF by Type of Assets at Constant 2005 Prices, 2012 and 2013
2012 2013
2012 2013
42.0%
58.0%
2012
Public Sector Private Sector
39.6%
60.4%
2013
Public Sector Private Sector
Structure48.2%
Transport Equipment
14.1%
ICT Equipment and Other
Machinery & Equipment
25.2%
Cultivated Biological Resources
1.4%
Intellectual Property Products
9.2%
Other Assets1.8%
2013
Structure47.1%
Transport Equipment
13.5%
ICT Equipment and Other
Machinery & Equipment
27.0%
Cultivated Biological Resources
1.5%
Intellectual Property Products
9.2%
Other Assets1.6%
2012
RM200.8 billion RM217.9 billion

10 Gross Fixed Capital Formation 2005–2013 Department of Statistics, Malaysia
SUMMARY FINDINGS
9.3
10.1
14.1
13.6
15.0
13.6
13.4
16.5
16.4
40.1
38.6
27.7
33.3
23.1
30.7
31.6
28.1
26.3
2.5
2.5
3.1
2.6
1.9
2.8
3.0
2.9
2.8
42.6
43.4
49.6
44.5
53.6
47.2
46.2
47.4
49.7
5.5
5.5
5.5
6.1
6.3
5.6
5.8
5.2
4.8
SEKTOR SWASTA
0.3
0.2
0.2
0.2
0.2
0.2
0.2
0.2
0.2
83.6
82.5
79.8
76.4
75.4
76.0
74.1
68.7
69.4
0.4
0.4
0.4
0.3
0.3
0.3
0.3
0.3
0.3
6.8
6.3
5.8
5.9
5.4
6.4
7.0
6.3
6.2
9.0
10.5
13.8
17.1
18.7
17.1
18.4
24.6
23.9
SEKTOR AWAM
100
Tahun
2012
2011
2010
2009
2008
2007
2006
2005
50100 50
2013
9.3
10.1
14.1
13.6
15.0
13.6
13.2
16.6
15.0
40.1
38.6
27.7
33.3
23.1
30.7
32.4
29.2
23.1
2.5
2.5
3.1
2.6
1.9
2.8
3.0
2.9
1.9
42.6
43.4
49.6
44.5
53.6
47.2
45.6
46.1
53.6
5.5
5.5
5.5
6.1
6.3
5.6
5.7
5.2
6.3
SEKTOR SWASTA
Perlombongan & Pengkuarian/ Mining & Quarrying
Pembuatan/ Manufacturing
Pembinaan/ Construction
Perkhidmatan/ Services
Pertanian/ Agriculture
Private Sector Public Sector Year
Chart 4: GFCF by Sector and Kind of Economic Activity at Constant 2005 Prices, 2005–2013
Services and Manufacturing activities were the main impetus
in GFCF of Private sector. The share of Services stepped-up
to 49.7 per cent as against 47.4 per cent in the previous
year. Manufacturing retained as the second contributor with
a share of 26.3 per cent amidst at a lower percentage than
2012. The remaining activities made-up 24.0 per cent of the
total private GFCF.
For GFCF of Public sector, Services and Mining & Quarrying
continued to be the prominent activities. Services which
accounted for 69.4 per cent was largely driven by transport
and utilities. Following the continuous oil and gas
exploration activity, Mining & Quarrying contributed
23.9 per cent of share to this sector.
GFCF BY SECTOR
AND KIND OF
ECONOMIC
ACTIVITY
Mining & Quarrying
Manufacturing
Construction
Services
Agriculture
9.3
10.1
14.1
13.6
15.0
13.6
13.2
16.6
15.0
40.1
38.6
27.7
33.3
23.1
30.7
32.4
29.2
23.1
2.5
2.5
3.1
2.6
1.9
2.8
3.0
2.9
1.9
42.6
43.4
49.6
44.5
53.6
47.2
45.6
46.1
53.6
5.5
5.5
5.5
6.1
6.3
5.6
5.7
5.2
6.3
SEKTOR SWASTA
Perlombongan & Pengkuarian/ Mining & Quarrying
Pembuatan/ Manufacturing
Pembinaan/ Construction
Perkhidmatan/ Services
Pertanian/ Agriculture
Percentage (%)

PMTK 2005-2013 GFCF 2005-2013
JADUAL
TABLES


JADUAL TABLES
Gross Fixed Capital Formation 2005–2013 11 Department of Statistics, Malaysia
2005 2006 2007 2008 2009 2010 2011 2012e
2013p
Pertanian 3,777 4,033 4,876 5,577 5,566 6,214 7,504 8,273 8,608 Agriculture
Getah & kelapa sawit 2,312 2,453 3,124 3,339 3,596 4,115 4,998 5,584 5,643 Rubber & oil palm
Ternakan & perikanan 908 957 1,047 1,456 1,256 1,358 1,618 1,729 1,963 Livestock & fishing
Pertanian lain 557 622 705 782 713 740 888 960 1,003 Other agriculture
Perlombongan dan pengkuarian 11,099 13,492 21,082 24,756 26,942 28,091 31,849 49,817 53,339 Mining and quarrying
Pembuatan 30,287 30,932 26,398 31,995 21,950 33,942 39,089 42,878 45,565 Manufacturing
Makanan, minuman & tembakau 2,638 2,168 2,314 3,265 3,062 3,201 4,166 4,898 5,771 Food, beverages & tobacco
Produk tekstil & kayu 3,086 2,425 2,483 2,814 1,910 2,165 2,783 3,187 2,892 Textiles & wood products
Produk petroleum, kimia, getah
& plastik5,840 7,000 7,917 9,331 4,814 9,184 9,950 14,463 14,858 Petroleum, chemical, rubber
& plastic products
Produk mineral bukan logam, logam
asas & produk logam yang direka3,684 2,375 2,195 4,428 2,936 5,034 5,246 4,164 4,456 Non-metallic mineral, basic metal
& fabricated metal products
Elektrik & elektronik dan peralatan
pengangkutan15,039 16,964 11,489 12,157 9,228 14,358 16,945 16,166 17,588 Electrical & electronic and transport
equipment
Pembinaan 1,877 1,962 2,735 2,401 1,707 2,823 3,314 3,914 4,290 Construction
Perkhidmatan 74,197 80,604 93,973 93,652 100,495 108,723 115,659 136,681 153,211 Services
Perdagangan borong & runcit 4,905 5,261 6,197 7,465 7,604 8,534 9,894 11,418 12,184 Wholesale & retail trade
Restoran & penginapan 1,314 1,364 1,766 1,761 1,735 1,633 1,942 2,300 2,637 Restaurants & accommodation
Pengangkutan, penyimpanan
& komunikasi14,617 17,573 22,451 17,487 23,825 26,917 28,022 35,741 42,091 Transport, storage
& communication
Kewangan, insurans, hartanah
& perkhidmatan perniagaan16,988 17,000 18,971 19,835 19,880 21,700 25,935 33,746 40,958 Finance, insurance, real estate
& business services
Perkhidmatan lain 36,372 39,406 44,589 47,103 47,452 49,938 49,867 53,477 55,341 Other services
Jumlah 121,237 131,024 149,064 158,381 156,660 179,793 197,415 241,562 265,013
Jenis aktiviti ekonomi Kind of economic activityTahun / Year
Jadual 1A: PMTK mengikut Jenis Aktiviti Ekonomi pada Harga Semasa - RM Juta
Table 1A: GFCF by Kind of Economic Activity at Current Prices - RM Million
Total
2005 2006 2007 2008 2009 2010 2011 2012e
2013p
Pertanian 3,777 3,965 4,453 4,927 4,778 5,011 5,642 6,161 6,543 Agriculture
Getah & kelapa sawit 2,312 2,362 2,726 2,830 2,935 3,066 3,494 3,798 3,978 Rubber & oil palm
Ternakan & perikanan 908 987 1,038 1,375 1,176 1,260 1,361 1,544 1,717 Livestock & fishing
Pertanian lain 557 616 690 723 667 685 787 819 849 Other agriculture
Perlombongan dan pengkuarian 11,099 13,291 19,880 22,127 23,810 24,097 26,248 39,944 42,175 Mining and quarrying
Pembuatan 30,287 30,600 25,596 30,252 20,555 31,197 35,138 37,996 39,958 Manufacturing
Makanan, minuman & tembakau 2,638 2,147 2,281 3,127 2,930 3,031 3,845 4,482 5,234 Food, beverages & tobacco
Produk tekstil & kayu 3,086 2,405 2,446 2,738 1,818 2,033 2,569 2,893 2,600 Textiles & wood products
Produk petroleum, kimia, getah
& plastik5,840 6,923 7,656 8,770 4,470 8,471 8,902 12,726 12,936 Petroleum, chemical, rubber
& plastic products
Produk mineral bukan logam, logam
asas & produk logam yang direka3,684 2,349 2,116 4,183 2,737 4,602 4,693 3,659 3,868 Non-metallic mineral, basic metal
& fabricated metal products
Elektrik & elektronik dan peralatan
pengangkutan15,039 16,776 11,097 11,433 8,601 13,059 15,129 14,235 15,321 Electrical & electronic and transport
equipment
Pembinaan 1,877 1,946 2,691 2,302 1,631 2,676 3,085 3,602 3,911 Construction
Perkhidmatan 74,197 79,030 89,559 85,918 90,810 95,416 98,280 113,070 125,291 Services
Perdagangan borong & runcit 4,905 5,182 6,010 6,915 6,976 7,619 8,518 9,606 10,106 Wholesale & retail trade
Restoran & penginapan 1,314 1,345 1,725 1,693 1,654 1,520 1,760 2,041 2,306 Restaurants & accommodation
Pengangkutan, penyimpanan
& komunikasi14,617 17,449 22,226 17,217 23,064 25,764 26,301 32,833 38,288 Transport, storage
& communication
Kewangan, insurans, hartanah
& perkhidmatan perniagaan16,988 16,531 17,538 17,525 16,983 17,915 20,374 25,415 30,503 Finance, insurance, real estate
& business services
Perkhidmatan lain 36,372 38,524 42,060 42,568 42,133 42,597 41,327 43,177 44,088 Other services
Jumlah 121,237 128,832 142,178 145,525 141,584 158,397 168,393 200,773 217,879
Jenis aktiviti ekonomi Kind of economic activityTahun / Year
Total
Jadual 1B: PMTK mengikut Jenis Aktiviti Ekonomi pada Harga Malar 2005 - RM Juta
Table 1B: GFCF by Kind of Economic Activity at Constant 2005 Prices - RM Million

JADUAL TABLES
12 Pembentukan Modal Tetap Kasar 2005–2013 Jabatan Perangkaan Malaysia
2006 2007 2008 2009 2010 2011 2012e
2013p
Pertanian 6.8 20.9 14.4 -0.2 11.6 20.8 10.2 4.1 Agriculture
Getah & kelapa sawit 6.1 27.3 6.9 7.7 14.4 21.4 11.7 1.1 Rubber & oil palm
Ternakan & perikanan 5.4 9.4 39.1 -13.7 8.1 19.2 6.9 13.5 Livestock & fishing
Pertanian lain 11.7 13.3 10.9 -8.8 3.8 19.9 8.1 4.5 Other agriculture
Perlombongan dan pengkuarian 21.6 56.3 17.4 8.8 4.3 13.4 56.4 7.1 Mining and quarrying
Pembuatan 2.1 -14.7 21.2 -31.4 54.6 15.2 9.7 6.3 Manufacturing
Makanan, minuman & tembakau -17.8 6.8 41.1 -6.2 4.5 30.2 17.6 17.8 Food, beverages & tobacco
Produk tekstil & kayu -21.4 2.4 13.3 -32.1 13.4 28.6 14.5 -9.2 Textiles & wood products
Produk petroleum, kimia, getah
& plastik19.9 13.1 17.9 -48.4 90.8 8.3 45.4 2.7 Petroleum, chemical, rubber
& plastic products
Produk mineral bukan logam, logam
asas & produk logam yang direka-35.5 -7.6 101.8 -33.7 71.5 4.2 -20.6 7.0 Non-metallic mineral, basic metal
& fabricated metal products
Elektrik & elektronik dan peralatan
pengangkutan12.8 -32.3 5.8 -24.1 55.6 18.0 -4.6 8.8 Electrical & electronic and transport
equipment
Pembinaan 4.5 39.4 -12.2 -28.9 65.4 17.4 18.1 9.6 Construction
Perkhidmatan 8.6 16.6 -0.3 7.3 8.2 6.4 18.2 12.1 Services
Perdagangan borong & runcit 7.3 17.8 20.5 1.9 12.2 15.9 15.4 6.7 Wholesale & retail trade
Restoran & penginapan 3.8 29.5 -0.3 -1.5 -5.9 18.9 18.4 14.7 Restaurants & accommodation
Pengangkutan, penyimpanan
& komunikasi20.2 27.8 -22.1 36.2 13.0 4.1 27.5 17.8 Transport, storage
& communication
Kewangan, insurans, hartanah
& perkhidmatan perniagaan0.1 11.6 4.6 0.2 9.2 19.5 30.1 21.4 Finance, insurance, real estate
& business services
Perkhidmatan lain 8.3 13.2 5.6 0.7 5.2 -0.1 7.2 3.5 Other services
Jumlah 8.1 13.8 6.3 -1.1 14.8 9.8 22.4 9.7
Jadual 1C: PMTK mengikut Jenis Aktiviti Ekonomi pada Harga Semasa - Peratus Perubahan Tahunan
Table 1C: GFCF by Kind of Economic Activity at Current Prices - Annual Percentage Change
Jenis aktiviti ekonomiTahun / Year
Kind of economic activity
Total
2006 2007 2008 2009 2010 2011 2012e
2013p
Pertanian 5.0 12.3 10.6 -3.0 4.9 12.6 9.2 6.2 Agriculture
Getah & kelapa sawit 2.1 15.4 3.8 3.7 4.5 14.0 8.7 4.7 Rubber & oil palm
Ternakan & perikanan 8.8 5.1 32.5 -14.4 7.1 8.0 13.4 11.2 Livestock & fishing
Pertanian lain 10.6 12.0 4.8 -7.7 2.7 14.8 4.0 3.7 Other agriculture
Perlombongan dan pengkuarian 19.7 49.6 11.3 7.6 1.2 8.9 52.2 5.6 Mining and quarrying
Pembuatan 1.0 -16.4 18.2 -32.1 51.8 12.6 8.1 5.2 Manufacturing
Makanan, minuman & tembakau -18.6 6.2 37.1 -6.3 3.4 26.8 16.6 16.8 Food, beverages & tobacco
Produk tekstil & kayu -22.1 1.7 12.0 -33.6 11.8 26.4 12.6 -10.1 Textiles & wood products
Produk petroleum, kimia, getah
& plastik18.5 10.6 14.5 -49.0 89.5 5.1 43.0 1.6 Petroleum, chemical, rubber
& plastic products
Produk mineral bukan logam, logam
asas & produk logam yang direka-36.2 -9.9 97.7 -34.6 68.1 2.0 -22.0 5.7 Non-metallic mineral, basic metal
& fabricated metal products
Elektrik & elektronik dan peralatan
pengangkutan11.5 -33.8 3.0 -24.8 51.8 15.8 -5.9 7.6 Electrical & electronic and transport
equipment
Pembinaan 3.7 38.2 -14.5 -29.1 64.1 15.3 16.8 8.6 Construction
Perkhidmatan 6.5 13.3 -4.1 5.7 5.1 3.0 15.0 10.8 Services
Perdagangan borong & runcit 5.6 16.0 15.0 0.9 9.2 11.8 12.8 5.2 Wholesale & retail trade
Restoran & penginapan 2.4 28.2 -1.9 -2.3 -8.1 15.8 15.9 13.0 Restaurants & accommodation
Pengangkutan, penyimpanan
& komunikasi19.4 27.4 -22.5 34.0 11.7 2.1 24.8 16.6 Transport, storage
& communication
Kewangan, insurans, hartanah
& perkhidmatan perniagaan-2.7 6.1 -0.1 -3.1 5.5 13.7 24.7 20.0 Finance, insurance, real estate
& business services
Perkhidmatan lain 5.9 9.2 1.2 -1.0 1.1 -3.0 4.5 2.1 Other services
Jumlah 6.3 10.4 2.4 -2.7 11.9 6.3 19.2 8.5
Jadual 1D: PMTK mengikut Jenis Aktiviti Ekonomi pada Harga Malar 2005 - Peratus Perubahan Tahunan
Table 1D: GFCF by Kind of Economic Activity at Constant 2005 Prices - Annual Percentage Change
Jenis aktiviti ekonomiTahun / Year
Kind of economic activity
Total

JADUAL TABLES
Gross Fixed Capital Formation 2005–2013 13 Department of Statistics, Malaysia
2005 2006 2007 2008 2009 2010 2011 2012e
2013p
Pertanian 3.1 3.1 3.3 3.5 3.6 3.5 3.8 3.4 3.2 Agriculture
Getah & kelapa sawit 1.9 1.9 2.1 2.1 2.3 2.3 2.5 2.3 2.1 Rubber & oil palm
Ternakan & perikanan 0.7 0.7 0.7 0.9 0.8 0.8 0.8 0.7 0.7 Livestock & fishing
Pertanian lain 0.5 0.5 0.5 0.5 0.5 0.4 0.4 0.4 0.4 Other agriculture
Perlombongan dan pengkuarian 9.2 10.3 14.1 15.6 17.2 15.6 16.1 20.6 20.1 Mining and quarrying
Pembuatan 25.0 23.6 17.7 20.2 14.0 18.9 19.8 17.8 17.2 Manufacturing
Makanan, minuman & tembakau 2.2 1.7 1.6 2.1 2.0 1.8 2.1 2.0 2.2 Food, beverages & tobacco
Produk tekstil & kayu 2.5 1.9 1.7 1.8 1.2 1.2 1.4 1.3 1.1 Textiles & wood products
Produk petroleum, kimia, getah
& plastik4.8 5.3 5.3 5.9 3.1 5.1 5.0 6.0 5.6 Petroleum, chemical, rubber
& plastic products
Produk mineral bukan logam, logam
asas & produk logam yang direka3.0 1.8 1.5 2.8 1.9 2.8 2.7 1.7 1.7 Non-metallic mineral, basic metal
& fabricated metal products
Elektrik & elektronik dan peralatan
pengangkutan12.4 12.9 7.7 7.7 5.9 8.0 8.6 6.7 6.6 Electrical & electronic and transport
equipment
Pembinaan 1.5 1.5 1.8 1.5 1.1 1.6 1.7 1.6 1.6 Construction
Perkhidmatan 61.2 61.5 63.0 59.1 64.1 60.5 58.6 56.6 57.8 Services
Perdagangan borong & runcit 4.0 4.0 4.2 4.7 4.9 4.7 5.0 4.7 4.6 Wholesale & retail trade
Restoran & penginapan 1.1 1.0 1.2 1.1 1.1 0.9 1.0 1.0 1.0 Restaurants & accommodation
Pengangkutan, penyimpanan
& komunikasi12.1 13.4 15.1 11.0 15.2 15.0 14.2 14.8 15.9 Transport, storage
& communication
Kewangan, insurans, hartanah
& perkhidmatan perniagaan14.0 13.0 12.7 12.5 12.7 12.1 13.1 14.0 15.5 Finance, insurance, real estate
& business services
Perkhidmatan lain 30.0 30.1 29.9 29.7 30.3 27.8 25.3 22.1 20.9 Other services
Jumlah 100.0 100.0 100.0 100.0 100.0 100.0 100.0 100.0 100.0
Jenis aktiviti ekonomi Kind of economic activityTahun / Year
Total
Jadual 1E: PMTK mengikut Jenis Aktiviti Ekonomi pada Harga Semasa - Pembahagian Peratus kepada Jumlah PMTK
Table 1E: GFCF by Kind of Economic Activity at Current Prices - Percentage Share to Total GFCF
2005 2006 2007 2008 2009 2010 2011 2012e
2013p
Pertanian 3.1 3.1 3.1 3.4 3.4 3.2 3.4 3.1 3.0 Agriculture
Getah & kelapa sawit 1.9 1.8 1.9 1.9 2.1 1.9 2.1 1.9 1.8 Rubber & oil palm
Ternakan & perikanan 0.7 0.8 0.7 0.9 0.8 0.8 0.8 0.8 0.8 Livestock & fishing
Pertanian lain 0.5 0.5 0.5 0.5 0.5 0.4 0.5 0.4 0.4 Other agriculture
Perlombongan dan pengkuarian 9.2 10.3 14.0 15.2 16.8 15.2 15.6 19.9 19.4 Mining and quarrying
Pembuatan 25.0 23.8 18.0 20.8 14.5 19.7 20.9 18.9 18.3 Manufacturing
Makanan, minuman & tembakau 2.2 1.7 1.6 2.1 2.1 1.9 2.3 2.2 2.4 Food, beverages & tobacco
Produk tekstil & kayu 2.5 1.9 1.7 1.9 1.3 1.3 1.5 1.4 1.2 Textiles & wood products
Produk petroleum, kimia, getah
& plastik4.8 5.4 5.4 6.0 3.2 5.3 5.3 6.3 5.9 Petroleum, chemical, rubber
& plastic products
Produk mineral bukan logam, logam
asas & produk logam yang direka3.0 1.8 1.5 2.9 1.9 2.9 2.8 1.8 1.8 Non-metallic mineral, basic metal
& fabricated metal products
Elektrik & elektronik dan peralatan
pengangkutan12.4 13.0 7.8 7.9 6.1 8.2 9.0 7.1 7.0 Electrical & electronic and transport
equipment
Pembinaan 1.5 1.5 1.9 1.6 1.2 1.7 1.8 1.8 1.8 Construction
Perkhidmatan 61.2 61.3 63.0 59.0 64.1 60.2 58.4 56.3 57.5 Services
Perdagangan borong & runcit 4.0 4.0 4.2 4.8 4.9 4.8 5.1 4.8 4.6 Wholesale & retail trade
Restoran & penginapan 1.1 1.0 1.2 1.2 1.2 1.0 1.0 1.0 1.1 Restaurants & accommodation
Pengangkutan, penyimpanan
& komunikasi12.1 13.5 15.6 11.8 16.3 16.3 15.6 16.4 17.6 Transport, storage
& communication
Kewangan, insurans, hartanah
& perkhidmatan perniagaan14.0 12.8 12.3 12.0 12.0 11.3 12.1 12.7 14.0 Finance, insurance, real estate
& business services
Perkhidmatan lain 30.0 29.9 29.6 29.3 29.8 26.9 24.5 21.5 20.2 Other services
Jumlah 100.0 100.0 100.0 100.0 100.0 100.0 100.0 100.0 100.0
Jenis aktiviti ekonomi Kind of economic activityTahun / Year
Total
Jadual 1F: PMTK mengikut Jenis Aktiviti Ekonomi pada Harga Malar 2005 - Pembahagian Peratus kepada Jumlah PMTK
Table 1F: GFCF by Kind of Economic Activity at Constant 2005 Prices - Percentage Share to Total GFCF

JADUAL TABLES
14 Pembentukan Modal Tetap Kasar 2005–2013 Jabatan Perangkaan Malaysia
2005 2006 2007 2008 2009 2010 2011 2012e
2013p
Struktur 860 691 736 801 825 1,074 1,495 1,729 2,007 Structure
Jentera dan peralatan 986 1,097 1,336 1,407 1,479 1,481 1,595 1,808 2,064 Machinery and equipment
Aset lain 1,931 2,245 2,804 3,369 3,262 3,659 4,414 4,736 4,537 Other assets
Struktur 6,846 10,376 16,058 17,801 17,860 16,354 18,604 30,482 34,297 Structure
Jentera dan peralatan 1,730 563 2,311 4,648 6,289 9,190 8,989 13,442 12,335 Machinery and equipment
Aset lain 2,523 2,553 2,713 2,307 2,793 2,548 4,256 5,892 6,706 Other assets
Struktur 5,518 4,873 4,828 6,461 3,928 7,243 10,284 11,068 12,048 Structure
Jentera dan peralatan 22,412 23,516 18,627 22,286 15,142 22,241 24,274 27,215 28,693 Machinery and equipment
Aset lain 2,358 2,544 2,943 3,249 2,880 4,458 4,532 4,594 4,824 Other assets
Struktur 1,090 396 608 585 -33 509 706 884 951 Structure
Jentera dan peralatan 768 1,543 2,086 1,763 1,703 2,258 2,540 2,955 3,257 Machinery and equipment
Aset lain 18 23 41 53 37 57 68 75 82 Other assets
Struktur 37,940 40,790 44,832 49,732 56,719 63,876 67,256 82,880 93,990 Structure
Jentera dan peralatan 31,267 34,875 43,380 38,079 39,138 40,538 42,274 47,388 52,029 Machinery and equipment
Aset lain 4,990 4,940 5,762 5,840 4,638 4,308 6,130 6,413 7,191 Other assets
Struktur 52,255 57,126 67,062 75,380 79,300 89,056 98,345 127,043 143,293 Structure
Jentera dan peralatan 57,162 61,593 67,740 68,184 63,751 75,707 79,670 92,809 98,379 Machinery and equipment
Aset lain 11,821 12,305 14,263 14,818 13,610 15,029 19,400 21,711 23,341 Other assets
121,237 131,024 149,064 158,381 156,660 179,793 197,415 241,562 265,013
Pe
rta
nia
nA
gric
ultu
re
Jadual 2A: PMTK mengikut Jenis Aktiviti Ekonomi dan Jenis Aset pada Harga Semasa - RM Juta
Table 2A: GFCF by Kind of Economic Activity and Type of Assets at Current Prices - RM Million
Jenis aktiviti ekonomi
dan jenis aset
Kind of economic activity
and type of assets
Tahun / Year
Pe
rkh
idm
ata
nS
erv
ice
sJ
um
lah T
ota
l
Jumlah Total
Pe
rlo
mb
on
ga
n
da
n
pe
ng
ku
ari
an
Min
ing
an
d
qu
arry
ing
Pe
mb
ua
tan
Ma
nu
fac
turin
gP
em
bin
aa
nC
on
stru
ctio
n
2005 2006 2007 2008 2009 2010 2011 2012e
2013p
Struktur 22.8 17.1 15.1 14.4 14.8 17.3 19.9 20.9 23.3 Structure
Jentera dan peralatan 26.1 27.2 27.4 25.2 26.6 23.8 21.3 21.8 24.0 Machinery and equipment
Aset lain 51.1 55.7 57.5 60.4 58.6 58.9 58.8 57.3 52.7 Other assets
Struktur 61.7 76.9 76.2 71.9 66.3 58.2 58.4 61.2 64.3 Structure
Jentera dan peralatan 15.6 4.2 11.0 18.8 23.3 32.7 28.2 27.0 23.1 Machinery and equipment
Aset lain 22.7 18.9 12.9 9.3 10.4 9.1 13.4 11.8 12.6 Other assets
Struktur 18.2 15.8 18.3 20.2 17.9 21.3 26.3 25.8 26.4 Structure
Jentera dan peralatan 74.0 76.0 70.6 69.7 69.0 65.5 62.1 63.5 63.0 Machinery and equipment
Aset lain 7.8 8.2 11.1 10.2 13.1 13.1 11.6 10.7 10.6 Other assets
Struktur 58.1 20.2 22.2 24.4 -1.9 18.0 21.3 22.6 22.2 Structure
Jentera dan peralatan 40.9 78.6 76.3 73.4 99.7 80.0 76.6 75.5 75.9 Machinery and equipment
Aset lain 1.0 1.2 1.5 2.2 2.2 2.0 2.1 1.9 1.9 Other assets
Struktur 51.1 50.6 47.7 53.1 56.4 58.8 58.1 60.6 61.3 Structure
Jentera dan peralatan 42.1 43.3 46.2 40.7 38.9 37.3 36.6 34.7 34.0 Machinery and equipment
Aset lain 6.7 6.1 6.1 6.2 4.6 4.0 5.3 4.7 4.7 Other assets
Struktur 43.1 43.6 45.0 47.6 50.6 49.5 49.8 52.6 54.1 Structure
Jentera dan peralatan 47.1 47.0 45.4 43.1 40.7 42.1 40.4 38.4 37.1 Machinery and equipment
Aset lain 9.8 9.4 9.6 9.4 8.7 8.4 9.8 9.0 8.8 Other assets
Jadual 2B: PMTK mengikut Jenis Aktiviti Ekonomi dan Jenis Aset pada Harga Semasa - Pembahagian Peratus mengikut Jenis Aset
Table 2B: GFCF by Kind of Economic Activity and Type of Assets at Current Prices - Percentage Share by Type of Assets
Jenis aktiviti ekonomi
dan jenis aset
Kind of economic activity
and type of assets
Tahun / Year
Pe
mb
ua
tan
Ma
nu
fac
turin
gP
em
bin
aa
nC
on
stru
ctio
nP
erk
hid
ma
tan
Se
rvic
es
Pe
rta
nia
nA
gric
ultu
re
Pe
rlo
mb
on
ga
n
da
n
pe
ng
ku
ari
an
Min
ing
an
d
qu
arry
ing
Ju
mla
h To
tal

JADUAL TABLES
Gross Fixed Capital Formation 2005–2013 15 Department of Statistics, Malaysia
2005 2006 2007 2008 2009 2010 2011 2012e
2013p
Struktur 52,255 57,126 67,062 75,380 79,300 89,056 98,345 127,043 143,293 Structure
Peralatan pengangkutan 11,322 16,201 18,942 16,934 16,837 22,646 22,197 27,815 31,597 Transport equipment
41,940 41,202 43,021 44,689 39,587 45,229 48,901 55,645 56,430
Sumber biologi dipupuk 1,888 2,089 2,622 3,159 3,077 3,616 4,285 4,566 4,351 Cultivated biological resources
Produk harta intelek 9,682 10,691 13,197 14,598 15,626 17,281 19,958 22,905 25,057 Intellectual property products
Aset lain 4,150 3,715 4,220 3,621 2,234 1,965 3,729 3,589 4,286 Other assets
121,237 131,024 149,064 158,381 156,660 179,793 197,415 241,562 265,013
Tahun / YearJenis aset Type of assets
Jumlah Total
Peralatan ICT dan lain-lain jentera
& peralatan
ICT equipment and other
machinery & equipment
Jadual 3A: PMTK mengikut Jenis Aset pada Harga Semasa - RM Juta
Table 3A: GFCF by Type of Assets at Current Prices - RM Million
2005 2006 2007 2008 2009 2010 2011 2012e
2013p
Struktur 52,255 55,519 61,717 65,055 67,010 71,842 75,697 94,608 105,059 Structure
Peralatan pengangkutan 11,322 16,145 18,870 16,916 16,808 22,558 21,718 27,150 30,808 Transport equipment
41,940 40,924 42,735 44,321 39,169 44,541 48,125 54,260 55,008
Sumber biologi dipupuk 1,888 2,057 2,282 2,660 2,468 2,649 2,840 2,981 3,000 Cultivated biological resources
Produk harta intelek 9,682 10,487 12,383 13,014 13,954 14,940 16,519 18,491 20,089 Intellectual property products
Aset lain 4,150 3,700 4,191 3,559 2,176 1,867 3,494 3,283 3,916 Other assets
121,237 128,832 142,178 145,525 141,584 158,397 168,393 200,773 217,879
Jenis asetTahun / Year
Type of assets
Jumlah Total
Peralatan ICT dan lain-lain jentera
& peralatan
ICT equipment and other
machinery & equipment
Jadual 3B: PMTK mengikut Jenis Aset pada Harga Malar 2005 - RM Juta
Table 3B: GFCF by Type of Assets at Constant 2005 Prices - RM Million
2006 2007 2008 2009 2010 2011 2012e
2013p
Struktur 9.3 17.4 12.4 5.2 12.3 10.4 29.2 12.8 Structure
Peralatan pengangkutan 43.1 16.9 -10.6 -0.6 34.5 -2.0 25.3 13.6 Transport equipment
-1.8 4.4 3.9 -11.4 14.3 8.1 13.8 1.4
Sumber biologi dipupuk 10.6 25.5 20.5 -2.6 17.5 18.5 6.6 -4.7 Cultivated biological resources
Produk harta intelek 10.4 23.4 10.6 7.0 10.6 15.5 14.8 9.4 Intellectual property products
Aset lain -10.5 13.6 -14.2 -38.3 -12.0 89.8 -3.8 19.4 Other assets
8.1 13.8 6.3 -1.1 14.8 9.8 22.4 9.7Jumlah Total
Jadual 3C: PMTK mengikut Jenis Aset pada Harga Semasa - Peratus Perubahan Tahunan
Table 3C: GFCF by Type of Assets at Current Prices - Annual Percentage Change
Jenis asetTahun / Year
Type of assets
Peralatan ICT dan lain-lain jentera
& peralatan
ICT equipment and other
machinery & equipment

JADUAL TABLES
16 Pembentukan Modal Tetap Kasar 2005–2013 Jabatan Perangkaan Malaysia
2005 2006 2007 2008 2009 2010 2011 2012e
2013p
Struktur 43.1 43.6 45.0 47.6 50.6 49.5 49.8 52.6 54.1 Structure
Peralatan pengangkutan 9.3 12.4 12.7 10.7 10.7 12.6 11.2 11.5 11.9 Transport equipment
34.6 31.4 28.9 28.2 25.3 25.2 24.8 23.0 21.3
Sumber biologi dipupuk 1.6 1.6 1.8 2.0 2.0 2.0 2.2 1.9 1.6 Cultivated biological resources
Produk harta intelek 8.0 8.2 8.9 9.2 10.0 9.6 10.1 9.5 9.5 Intellectual property products
Aset lain 3.4 2.8 2.8 2.3 1.4 1.1 1.9 1.5 1.6 Other assets
100.0 100.0 100.0 100.0 100.0 100.0 100.0 100.0 100.0
Peralatan ICT dan lain-lain jentera
& peralatan
ICT equipment and other
machinery & equipment
Jumlah Total
Jenis asetTahun / Year
Type of assets
Jadual 3E: PMTK mengikut Jenis Aset pada Harga Semasa - Pembahagian Peratus kepada Jumlah PMTK
Table 3E: GFCF by Type of Assets at Current Prices - Percentage Share to Total GFCF
2005 2006 2007 2008 2009 2010 2011 2012e
2013p
Struktur 43.1 43.1 43.4 44.7 47.3 45.4 45.0 47.1 48.2 Structure
Peralatan pengangkutan 9.3 12.5 13.3 11.6 11.9 14.2 12.9 13.5 14.1 Transport equipment
34.6 31.8 30.1 30.5 27.7 28.1 28.6 27.0 25.2
Sumber biologi dipupuk 1.6 1.6 1.6 1.8 1.7 1.7 1.7 1.5 1.4 Cultivated biological resources
Produk harta intelek 8.0 8.1 8.7 8.9 9.9 9.4 9.8 9.2 9.2 Intellectual property products
Aset lain 3.4 2.9 2.9 2.4 1.5 1.2 2.1 1.6 1.8 Other assets
100.0 100.0 100.0 100.0 100.0 100.0 100.0 100.0 100.0
Peralatan ICT dan lain-lain jentera
& peralatan
ICT equipment and other
machinery & equipment
Jumlah Total
Jadual 3F: PMTK mengikut Jenis Aset pada Harga Malar 2005 - Pembahagian Peratus kepada Jumlah PMTK
Table 3F: GFCF by Type of Assets at Constant 2005 Prices - Percentage Share to Total GFCF
Jenis asetTahun / Year
Type of assets
2006 2007 2008 2009 2010 2011 2012e
2013p
Struktur 6.2 11.2 5.4 3.0 7.2 5.4 25.0 11.0 Structure
Peralatan pengangkutan 42.6 16.9 -10.4 -0.6 34.2 -3.7 25.0 13.5 Transport equipment
-2.4 4.4 3.7 -11.6 13.7 8.0 12.7 1.4
Sumber biologi dipupuk 8.9 11.0 16.6 -7.2 7.3 7.2 5.0 0.6 Cultivated biological resources
Produk harta intelek 8.3 18.1 5.1 7.2 7.1 10.6 11.9 8.6 Intellectual property products
Aset lain -10.8 13.3 -15.1 -38.9 -14.2 87.2 -6.1 19.3 Other assets
6.3 10.4 2.4 -2.7 11.9 6.3 19.2 8.5
Peralatan ICT dan lain-lain jentera
& peralatan
ICT equipment and other
machinery & equipment
Jumlah Total
Jadual 3D: PMTK mengikut Jenis Aset pada Harga Malar 2005 - Peratus Perubahan Tahunan
Table 3D: GFCF by Type of Assets at Constant 2005 Prices - Annual Percentage Change
Jenis asetTahun / Year
Type of assets

JADUAL TABLES
Gross Fixed Capital Formation 2005–2013 17 Department of Statistics, Malaysia
2005 2006 2007 2008 2009 2010 2011 2012e
2013p
Sektor swasta Private sector
Pertanian 3,627 3,883 4,725 5,424 5,412 6,044 7,313 8,062 8,396 Agriculture
Perlombongan dan pengkuarian 6,154 7,188 12,050 12,176 12,488 13,829 15,414 24,056 27,422 Mining and quarrying
Pembuatan 26,566 27,185 22,671 27,875 18,060 28,988 33,398 36,925 39,492 Manufacturing
Pembinaan 1,651 1,737 2,506 2,172 1,489 2,606 3,079 3,664 4,038 Construction
Perkhidmatan 28,230 30,926 41,385 38,467 43,578 47,088 52,422 67,471 81,113 Services
Jumlah 66,229 70,918 83,337 86,114 81,028 98,555 111,626 140,177 160,461 Total
Sektor awam Public sector
Pertanian 150 150 151 153 154 170 191 211 213 Agriculture
Perlombongan dan pengkuarian 4,945 6,304 9,032 12,580 14,454 14,262 16,434 25,761 25,917 Mining and quarrying
Pembuatan 3,721 3,747 3,726 4,120 3,890 4,954 5,691 5,953 6,073 Manufacturing
Pembinaan 226 226 229 230 218 218 235 250 252 Construction
Perkhidmatan 45,967 49,679 52,588 55,185 56,917 61,635 63,237 69,211 72,097 Services
Jumlah 55,008 60,105 65,727 72,268 75,633 81,238 85,789 101,385 104,552 Total
Tahun / YearSektor dan jenis
aktiviti ekonomi
Sector and kind of
economic activity
Jadual 4A: PMTK mengikut Sektor dan Jenis Aktiviti Ekonomi pada Harga Semasa - RM Juta
Table 4A: GFCF by Sector and Kind of Economic Activity at Current Prices - RM Million
2005 2006 2007 2008 2009 2010 2011 2012e
2013p
Sektor swasta Private sector
Pertanian 3,627 3,818 4,314 4,790 4,646 4,874 5,498 6,003 6,380 Agriculture
Perlombongan dan pengkuarian 6,154 7,046 11,157 10,752 11,003 11,816 12,705 19,242 21,544 Mining and quarrying
Pembuatan 26,566 26,858 21,913 26,309 16,881 26,608 29,977 32,677 34,579 Manufacturing
Pembinaan 1,651 1,721 2,462 2,079 1,421 2,468 2,864 3,371 3,680 Construction
Perkhidmatan 28,230 30,185 39,224 35,181 39,280 40,933 43,765 55,175 65,521 Services
Jumlah 66,229 69,628 79,070 79,111 73,231 86,699 94,809 116,468 131,703 Total
Sektor awam Public sector
Pertanian 150 147 139 136 132 137 144 157 164 Agriculture
Perlombongan dan pengkuarian 4,945 6,244 8,723 11,374 12,806 12,281 13,543 20,702 20,631 Mining and quarrying
Pembuatan 3,721 3,742 3,683 3,943 3,674 4,589 5,161 5,319 5,379 Manufacturing
Pembinaan 226 225 228 223 210 208 220 231 231 Construction
Perkhidmatan 45,967 48,845 50,335 50,737 51,530 54,483 54,515 57,896 59,771 Services
Jumlah 55,008 59,204 63,108 66,414 68,353 71,697 73,584 84,305 86,176 Total
Sektor dan jenis
aktiviti ekonomi
Tahun / Year Sector and kind of
economic activity
Jadual 4B: PMTK mengikut Sektor dan Jenis Aktiviti Ekonomi pada Harga Malar 2005 - RM Juta
Table 4B: GFCF by Sector and Kind of Economic Activity at Constant 2005 Prices - RM Million

JADUAL TABLES
18 Pembentukan Modal Tetap Kasar 2005–2013 Jabatan Perangkaan Malaysia
2006 2007 2008 2009 2010 2011 2012e
2013p
Sektor swasta Private sector
Pertanian 7.1 21.7 14.8 -0.2 11.7 21.0 10.2 4.1 Agriculture
Perlombongan dan pengkuarian 16.8 67.6 1.1 2.6 10.7 11.5 56.1 14.0 Mining and quarrying
Pembuatan 2.3 -16.6 23.0 -35.2 60.5 15.2 10.6 7.0 Manufacturing
Pembinaan 5.2 44.3 -13.3 -31.4 75.0 18.2 19.0 10.2 Construction
Perkhidmatan 9.5 33.8 -7.1 13.3 8.1 11.3 28.7 20.2 Services
Jumlah 7.1 17.5 3.3 -5.9 21.6 13.3 25.6 14.5 Total
Sektor awam Public sector
Pertanian -0.4 1.0 1.3 0.3 10.5 12.4 10.4 0.9 Agriculture
Perlombongan dan pengkuarian 27.5 43.3 39.3 14.9 -1.3 15.2 56.8 0.6 Mining and quarrying
Pembuatan 0.7 -0.6 10.6 -5.6 27.4 14.9 4.6 2.0 Manufacturing
Pembinaan 0.1 1.6 0.3 -4.9 -0.4 8.2 6.0 1.0 Construction
Perkhidmatan 8.1 5.9 4.9 3.1 8.3 2.6 9.4 4.2 Services
Jumlah 9.3 9.4 10.0 4.7 7.4 5.6 18.2 3.1 Total
Jadual 4C: PMTK mengikut Sektor dan Jenis Aktiviti Ekonomi pada Harga Semasa - Peratus Perubahan Tahunan
Table 4C: GFCF by Sector and Kind of Economic Activity at Current Prices - Annual Percentage Change
Sektor dan jenis
aktiviti ekonomi
Tahun / Year Sector and kind of
economic activity
2006 2007 2008 2009 2010 2011 2012e
2013p
Sektor swasta Private sector
Pertanian 5.3 13.0 11.0 -3.0 4.9 12.8 9.2 6.3 Agriculture
Perlombongan dan pengkuarian 14.5 58.3 -3.6 2.3 7.4 7.5 51.5 12.0 Mining and quarrying
Pembuatan 1.1 -18.4 20.1 -35.8 57.6 12.7 9.0 5.8 Manufacturing
Pembinaan 4.2 43.1 -15.6 -31.7 73.7 16.1 17.7 9.2 Construction
Perkhidmatan 6.9 29.9 -10.3 11.7 4.2 6.9 26.1 18.8 Services
Jumlah 5.1 13.6 0.1 -7.4 18.4 9.4 22.8 13.1 Total
Sektor awam Public sector
Pertanian -2.1 -5.5 -1.9 -3.1 3.5 4.9 9.6 4.1 Agriculture
Perlombongan dan pengkuarian 26.3 39.7 30.4 12.6 -4.1 10.3 52.9 -0.3 Mining and quarrying
Pembuatan 0.6 -1.6 7.1 -6.8 24.9 12.5 3.1 1.1 Manufacturing
Pembinaan -0.1 1.2 -2.3 -5.6 -1.2 6.0 4.8 0.3 Construction
Perkhidmatan 6.3 3.0 0.8 1.6 5.7 0.1 6.2 3.2 Services
Jumlah 7.6 6.6 5.2 2.9 4.9 2.6 14.6 2.2 Total
Tahun / Year Sector and kind of
economic activity
Jadual 4D: PMTK mengikut Sektor dan Jenis Aktiviti Ekonomi pada Harga Malar 2005 - Peratus Perubahan Tahunan
Table 4D: GFCF by Sector and Kind of Economic Activity at Constant 2005 Prices - Annual Percentage Change
Sektor dan jenis
aktiviti ekonomi
JADUAL TABLES
Gross Fixed Capital Formation 2005–2013 19 Department of Statistics, Malaysia
2005 2006 2007 2008 2009 2010 2011 2012e
2013p
Sektor swasta Private sector
Pertanian 3.0 3.0 3.2 3.4 3.5 3.4 3.7 3.3 3.2 Agriculture
Perlombongan dan pengkuarian 5.1 5.5 8.1 7.7 8.0 7.7 7.8 10.0 10.3 Mining and quarrying
Pembuatan 21.9 20.7 15.2 17.6 11.5 16.1 16.9 15.3 14.9 Manufacturing
Pembinaan 1.4 1.3 1.7 1.4 1.0 1.4 1.6 1.5 1.5 Construction
Perkhidmatan 23.3 23.6 27.8 24.3 27.8 26.2 26.6 27.9 30.6 Services
Jumlah 54.6 54.1 55.9 54.4 51.7 54.8 56.5 58.0 60.5 Total
Sektor awam Public sector
Pertanian 0.1 0.1 0.1 0.1 0.1 0.1 0.1 0.1 0.1 Agriculture
Perlombongan dan pengkuarian 4.1 4.8 6.1 7.9 9.2 7.9 8.3 10.7 9.8 Mining and quarrying
Pembuatan 3.1 2.9 2.5 2.6 2.5 2.8 2.9 2.5 2.3 Manufacturing
Pembinaan 0.2 0.2 0.2 0.1 0.1 0.1 0.1 0.1 0.1 Construction
Perkhidmatan 37.9 37.9 35.3 34.8 36.3 34.3 32.0 28.7 27.2 Services
Jumlah 45.4 45.9 44.1 45.6 48.3 45.2 43.5 42.0 39.5 Total
Sektor dan jenis
aktiviti ekonomi
Tahun / Year Sector and kind of
economic activity
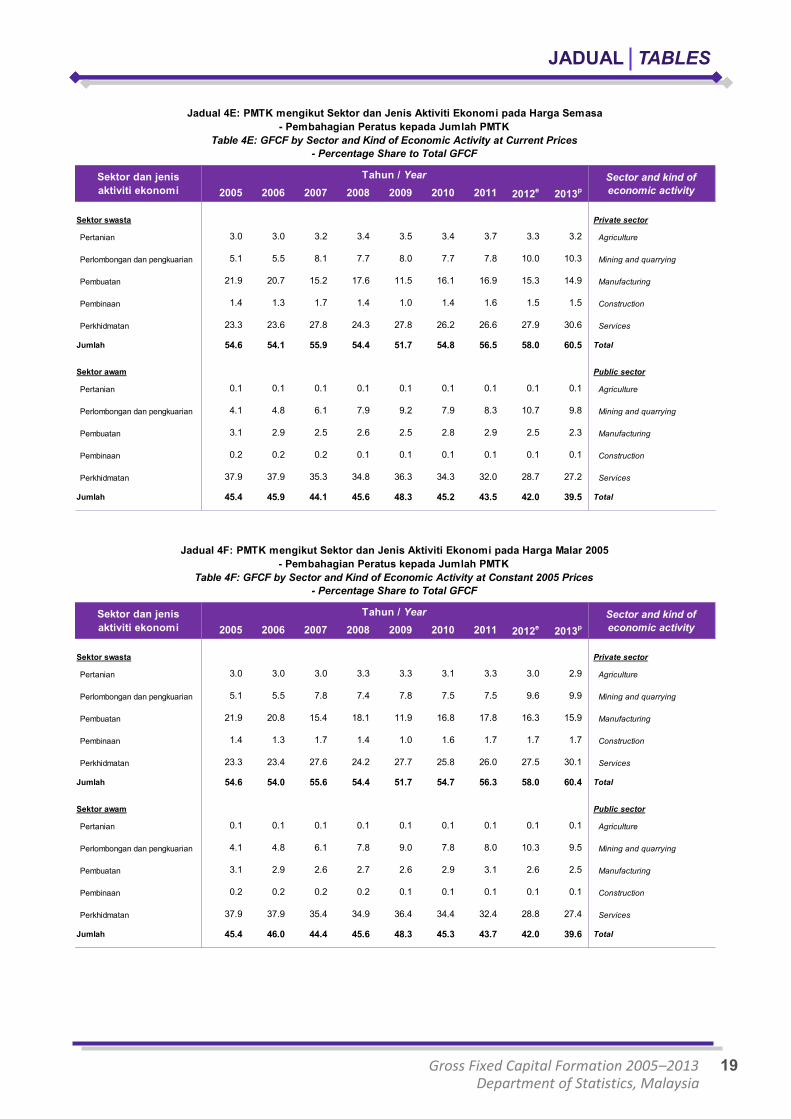
Jadual 4E: PMTK mengikut Sektor dan Jenis Aktiviti Ekonomi pada Harga Semasa
- Pembahagian Peratus kepada Jumlah PMTK
Table 4E: GFCF by Sector and Kind of Economic Activity at Current Prices
- Percentage Share to Total GFCF
2005 2006 2007 2008 2009 2010 2011 2012e
2013p
Sektor swasta Private sector
Pertanian 3.0 3.0 3.0 3.3 3.3 3.1 3.3 3.0 2.9 Agriculture
Perlombongan dan pengkuarian 5.1 5.5 7.8 7.4 7.8 7.5 7.5 9.6 9.9 Mining and quarrying
Pembuatan 21.9 20.8 15.4 18.1 11.9 16.8 17.8 16.3 15.9 Manufacturing
Pembinaan 1.4 1.3 1.7 1.4 1.0 1.6 1.7 1.7 1.7 Construction
Perkhidmatan 23.3 23.4 27.6 24.2 27.7 25.8 26.0 27.5 30.1 Services
Jumlah 54.6 54.0 55.6 54.4 51.7 54.7 56.3 58.0 60.4 Total
Sektor awam Public sector
Pertanian 0.1 0.1 0.1 0.1 0.1 0.1 0.1 0.1 0.1 Agriculture
Perlombongan dan pengkuarian 4.1 4.8 6.1 7.8 9.0 7.8 8.0 10.3 9.5 Mining and quarrying
Pembuatan 3.1 2.9 2.6 2.7 2.6 2.9 3.1 2.6 2.5 Manufacturing
Pembinaan 0.2 0.2 0.2 0.2 0.1 0.1 0.1 0.1 0.1 Construction
Perkhidmatan 37.9 37.9 35.4 34.9 36.4 34.4 32.4 28.8 27.4 Services
Jumlah 45.4 46.0 44.4 45.6 48.3 45.3 43.7 42.0 39.6 Total
Sektor dan jenis
aktiviti ekonomi
Tahun / Year Sector and kind of
economic activity
Jadual 4F: PMTK mengikut Sektor dan Jenis Aktiviti Ekonomi pada Harga Malar 2005
- Pembahagian Peratus kepada Jumlah PMTK
Table 4F: GFCF by Sector and Kind of Economic Activity at Constant 2005 Prices
- Percentage Share to Total GFCF

JADUAL TABLES
20 Pembentukan Modal Tetap Kasar 2005–2013 Jabatan Perangkaan Malaysia
2005 2006 2007 2008 2009 2010 2011 2012e
2013p
Sektor Swasta 96.0 96.3 96.9 97.2 97.2 97.3 97.5 97.4 97.5 Private Sector
Sektor Awam 4.0 3.7 3.1 2.8 2.8 2.7 2.5 2.6 2.5 Public Sector
Sektor Swasta 55.4 53.0 56.1 48.6 46.2 49.0 48.4 48.2 51.1 Private Sector
Sektor Awam 44.6 47.0 43.9 51.4 53.8 51.0 51.6 51.8 48.9 Public Sector
Sektor Swasta 87.7 87.8 85.6 87.0 82.1 85.3 85.3 86.0 86.5 Private Sector
Sektor Awam 12.3 12.2 14.4 13.0 17.9 14.7 14.7 14.0 13.5 Public Sector
Sektor Swasta 88.0 88.4 91.5 90.3 87.1 92.2 92.9 93.6 94.1 Private Sector
Sektor Awam 12.0 11.6 8.5 9.7 12.9 7.8 7.1 6.4 5.9 Public Sector
Sektor Swasta 38.0 38.2 43.8 40.9 43.3 42.9 44.5 48.8 52.3 Private Sector
Sektor Awam 62.0 61.8 56.2 59.1 56.7 57.1 55.5 51.2 47.7 Public Sector
Sektor Swasta 54.6 54.0 55.6 54.4 51.7 54.7 56.3 58.0 60.4 Private Sector
Sektor Awam 45.4 46.0 44.4 45.6 48.3 45.3 43.7 42.0 39.6 Public Sector
Tahun / Year Kind of economic activity
and sector
Pe
rta
nia
nA
gric
ultu
re
Pe
rlo
mb
on
ga
n
da
n
pe
ng
ku
ari
an
Min
ing
an
d
qu
arry
ing
Jadual 4H: PMTK mengikut Jenis Aktiviti Ekonomi dan Sektor pada Harga Malar 2005
- Pembahagian Peratus kepada Jenis Aktiviti Ekonomi
Table 4H: GFCF by Kind of Economic Activity and Sector at Constant 2005 Prices
- Percentage Share to Kind of Economic Activity
Jenis aktiviti ekonomi
dan sektor
Ju
mla
h To
tal
Pe
mb
ua
tan
Ma
nu
fac
turin
gP
em
bin
aa
nC
on
stru
ctio
nP
erk
hid
ma
tan
Se
rvic
es
2005 2006 2007 2008 2009 2010 2011 2012e
2013p
Sektor Swasta 96.0 96.3 96.9 97.3 97.2 97.3 97.5 97.5 97.5 Private Sector
Sektor Awam 4.0 3.7 3.1 2.7 2.8 2.7 2.5 2.5 2.5 Public Sector
Sektor Swasta 55.4 53.3 57.2 49.2 46.4 49.2 48.4 48.3 51.4 Private Sector
Sektor Awam 44.6 46.7 42.8 50.8 53.6 50.8 51.6 51.7 48.6 Public Sector
Sektor Swasta 87.7 87.9 85.9 87.1 82.3 85.4 85.4 86.1 86.7 Private Sector
Sektor Awam 12.3 12.1 14.1 12.9 17.7 14.6 14.6 13.9 13.3 Public Sector
Sektor Swasta 88.0 88.5 91.6 90.4 87.2 92.3 92.9 93.6 94.1 Private Sector
Sektor Awam 12.0 11.5 8.4 9.6 12.8 7.7 7.1 6.4 5.9 Public Sector
Sektor Swasta 38.0 38.4 44.0 41.1 43.4 43.3 45.3 49.4 52.9 Private Sector
Sektor Awam 62.0 61.6 56.0 58.9 56.6 56.7 54.7 50.6 47.1 Public Sector
Sektor Swasta 54.6 54.1 55.9 54.4 51.7 54.8 56.5 58.0 60.5 Private Sector
Sektor Awam 45.4 45.9 44.1 45.6 48.3 45.2 43.5 42.0 39.5 Public Sector
Jadual 4G: PMTK mengikut Jenis Aktiviti Ekonomi dan Sektor pada Harga Semasa
- Pembahagian Peratus kepada Jenis Aktiviti Ekonomi
Table 4G: GFCF by Kind of Economic Activity and Sector at Current Prices
- Percentage Share to Kind of Economic Activity
Pe
rta
nia
nA
gric
ultu
reP
erk
hid
ma
tan
Se
rvic
es
Tahun / YearJenis aktiviti ekonomi
dan sektor
Kind of economic activity
and sector
Pe
rlo
mb
on
ga
n
da
n
pe
ng
ku
ari
an
Min
ing
an
d
qu
arry
ing
Pe
mb
ua
tan
Ma
nu
fac
turin
gP
em
bin
aa
nC
on
stru
ctio
nJ
um
lah T
ota
l

JADUAL TABLES
Gross Fixed Capital Formation 2005–2013 21 Department of Statistics, Malaysia
2005 2006 2007 2008 2009 2010 2011 2012e
2013p
Struktur 824 662 716 784 800 1,044 1,460 1,688 1,955 Structure
Jentera dan peralatan 951 1,059 1,302 1,376 1,439 1,440 1,552 1,759 2,007 Machinery and equipment
Aset lain 1,852 2,161 2,707 3,264 3,173 3,560 4,301 4,615 4,433 Other assets
Struktur 3,855 5,560 9,330 9,039 8,735 8,988 9,649 16,083 19,248 Structure
Jentera dan peralatan 882 232 1,111 1,926 2,348 3,387 3,451 4,619 4,335 Machinery and equipment
Aset lain 1,417 1,396 1,608 1,212 1,405 1,454 2,313 3,144 3,839 Other assets
Struktur 4,992 4,162 4,042 5,254 2,969 6,043 8,633 9,370 10,153 Structure
Jentera dan peralatan 19,615 20,688 15,834 19,588 12,315 18,617 20,365 23,552 24,639 Machinery and equipment
Aset lain 1,959 2,335 2,795 3,032 2,777 4,328 4,400 4,473 4,700 Other assets
Struktur 961 354 564 522 -47 494 687 864 931 Structure
Jentera dan peralatan 676 1,365 1,904 1,603 1,500 2,057 2,325 2,727 3,027 Machinery and equipment
Aset lain 15 18 38 47 36 55 67 73 80 Other assets
Struktur 15,493 16,021 18,114 18,658 23,141 25,769 30,677 41,074 49,434 Structure
Jentera dan peralatan 12,064 13,725 21,883 17,620 18,348 19,039 18,581 22,559 27,444 Machinery and equipment
Aset lain 673 1,180 1,389 2,189 2,090 2,280 3,164 3,578 4,235 Other assets
Struktur 26,125 26,759 32,766 34,256 35,598 42,338 51,106 69,079 81,721 Structure
Jentera dan peralatan 34,188 37,070 42,034 42,113 35,950 44,541 46,274 55,217 61,452 Machinery and equipment
Aset lain 5,916 7,090 8,537 9,745 9,480 11,676 14,245 15,882 17,288 Other assets
66,229 70,918 83,337 86,114 81,028 98,555 111,626 140,177 160,461
Pe
mb
ua
tan
Ma
nu
fac
turin
gP
em
bin
aa
nC
on
stru
ctio
nP
ert
an
ian
Ag
ricu
lture
Pe
rkh
idm
ata
nS
erv
ice
sJ
um
lah T
ota
l
Jumlah Total
Pe
rlo
mb
on
ga
n
da
n
pe
ng
ku
ari
an
Min
ing
an
d
qu
arry
ing
Jadual 5A: PMTK Sektor Swasta mengikut Jenis Aktiviti Ekonomi dan Jenis Aset pada Harga Semasa - RM Juta
Table 5A: Private Sector GFCF by Kind of Economic Activity and Type of Assets at Current Prices - RM Million
Jadual / YearJenis aktiviti ekonomi
dan jenis aset
Kind of economic activity
and type of assets
2005 2006 2007 2008 2009 2010 2011 2012e
2013p
Struktur 36 28 20 17 25 30 36 41 52 Structure
Jentera dan peralatan 35 37 34 31 40 41 43 48 57 Machinery and equipment
Aset lain 80 84 97 105 88 99 113 122 105 Other assets
Struktur 2,991 4,816 6,728 8,762 9,125 7,366 8,954 14,399 15,049 Structure
Jentera dan peralatan 847 331 1,200 2,722 3,941 5,802 5,537 8,823 8,000 Machinery and equipment
Aset lain 1,106 1,157 1,105 1,095 1,388 1,094 1,943 2,749 2,867 Other assets
Struktur 526 711 786 1,206 959 1,201 1,651 1,698 1,895 Structure
Jentera dan peralatan 2,797 2,828 2,793 2,697 2,827 3,623 3,909 3,663 4,054 Machinery and equipment
Aset lain 399 208 148 217 103 130 132 122 124 Other assets
Struktur 129 42 44 63 14 15 19 20 20 Structure
Jentera dan peralatan 93 178 182 160 203 201 215 228 230 Machinery and equipment
Aset lain 3 6 4 6 2 2 2 2 2 Other assets
Struktur 22,448 24,769 26,718 31,075 33,579 38,107 36,579 41,806 44,557 Structure
Jentera dan peralatan 19,202 21,149 21,498 20,460 20,789 21,499 23,693 24,829 24,585 Machinery and equipment
Aset lain 4,317 3,760 4,373 3,650 2,549 2,029 2,966 2,836 2,956 Other assets
Struktur 26,130 30,367 34,296 41,124 43,702 46,718 47,238 57,964 61,572 Structure
Jentera dan peralatan 22,974 24,523 25,705 26,071 27,801 31,167 33,396 37,592 36,926 Machinery and equipment
Aset lain 5,905 5,215 5,726 5,073 4,130 3,353 5,155 5,830 6,053 Other assets
55,008 60,105 65,727 72,268 75,633 81,238 85,789 101,385 104,552 Total
Pe
rlo
mb
on
ga
n
da
n
pe
ng
ku
ari
an
Min
ing
an
d
qu
arry
ing
Pe
mb
ua
tan
Ma
nu
fac
turin
gP
em
bin
aa
nC
on
stru
ctio
n
Jenis aktiviti ekonomi
dan jenis aset
Jadual / Year Kind of economic activity
and type of assets
Pe
rkh
idm
ata
nS
erv
ice
sJ
um
lah T
ota
l
Jumlah
Pe
rta
nia
nA
gric
ultu
re
Jadual 5B: PMTK Sektor Awam mengikut Jenis Aktiviti Ekonomi dan Jenis Aset pada Harga Semasa - RM Juta
Table 5B: Public Sector GFCF by Kind of Economic Activity and Type of Assets at Current Prices - RM Million

JADUAL TABLES
22 Pembentukan Modal Tetap Kasar 2005–2013 Jabatan Perangkaan Malaysia
2005 2006 2007 2008 2009 2010 2011 2012e
2013p
Struktur 22.7 17.1 15.1 14.5 14.8 17.3 20.0 20.9 23.3 Structure
Jentera dan peralatan 26.2 27.3 27.6 25.4 26.6 23.8 21.2 21.8 23.9 Machinery and equipment
Aset lain 51.1 55.7 57.3 60.2 58.6 58.9 58.8 57.2 52.8 Other assets
Struktur 62.6 77.3 77.4 74.2 69.9 65.0 62.6 67.4 70.2 Structure
Jentera dan peralatan 14.3 3.2 9.2 15.8 18.8 24.5 22.4 19.4 15.8 Machinery and equipment
Aset lain 23.0 19.4 13.3 10.0 11.2 10.5 15.0 13.2 14.0 Other assets
Struktur 18.8 15.3 17.8 18.8 16.4 20.8 25.8 25.1 25.7 Structure
Jentera dan peralatan 73.8 76.1 69.8 70.3 68.2 64.2 61.0 63.0 62.4 Machinery and equipment
Aset lain 7.4 8.6 12.3 10.9 15.4 14.9 13.2 12.0 11.9 Other assets
Struktur 58.2 20.4 22.5 24.0 -3.1 18.9 22.3 23.6 23.1 Structure
Jentera dan peralatan 40.9 78.6 76.0 73.8 100.7 78.9 75.5 74.4 75.0 Machinery and equipment
Aset lain 0.9 1.0 1.5 2.2 2.4 2.1 2.2 2.0 2.0 Other assets
Struktur 54.9 51.8 43.8 48.5 53.1 54.7 58.5 61.1 60.9 Structure
Jentera dan peralatan 42.7 44.4 52.9 45.8 42.1 40.4 35.4 33.6 33.8 Machinery and equipment
Aset lain 2.4 3.8 3.4 5.7 4.8 4.8 6.0 5.3 5.2 Other assets
Struktur 39.4 37.7 39.3 39.8 43.9 43.0 45.8 49.3 50.9 Structure
Jentera dan peralatan 51.6 52.3 50.4 48.9 44.4 45.2 41.5 39.4 38.3 Machinery and equipment
Aset lain 8.9 10.0 10.2 11.3 11.7 11.8 12.8 11.3 10.8 Other assets
Jenis aktiviti ekonomi
dan jenis aset
Jadual / Year Kind of economic activity
and type of assets
Pe
rkh
idm
ata
nS
erv
ice
sJ
um
lah T
ota
l
Pe
rlo
mb
on
ga
n
da
n
pe
ng
ku
ari
an
Min
ing
an
d
qu
arry
ing
Pe
rta
nia
nA
gric
ultu
re
Jadual 5C: PMTK Sektor Swasta mengikut Jenis Aktiviti Ekonomi dan Jenis Aset pada Harga Semasa
- Pembahagian Peratus mengikut Jenis Aset
Table 5C: Private Sector GFCF by Kind of Economic Activity and Type of Assets at Current Prices
- Percentage Share by Type of Assets
Pe
mb
ua
tan
Ma
nu
fac
turin
gP
em
bin
aa
nC
on
stru
ctio
n
2005 2006 2007 2008 2009 2010 2011 2012e
2013p
Struktur 23.9 18.9 13.5 11.2 16.2 17.6 18.7 19.4 24.2 Structure
Jentera dan peralatan 23.1 25.0 22.2 20.4 26.3 24.1 22.3 22.9 26.6 Machinery and equipment
Aset lain 52.9 56.2 64.3 68.4 57.5 58.3 59.0 57.7 49.2 Other assets
Struktur 60.5 76.4 74.5 69.7 63.1 51.6 54.5 55.4 58.1 Structure
Jentera dan peralatan 17.1 5.2 13.3 21.6 27.3 40.7 33.7 34.0 30.9 Machinery and equipment
Aset lain 22.4 18.4 12.2 8.7 9.6 7.7 11.8 10.6 11.1 Other assets
Struktur 14.1 19.0 21.1 29.3 24.7 24.2 29.0 31.0 31.2 Structure
Jentera dan peralatan 75.2 75.5 74.9 65.5 72.7 73.1 68.7 66.8 66.8 Machinery and equipment
Aset lain 10.7 5.6 4.0 5.3 2.6 2.6 2.3 2.2 2.0 Other assets
Struktur 57.3 18.5 19.0 27.5 6.5 6.8 8.0 8.0 7.9 Structure
Jentera dan peralatan 41.2 79.0 79.3 69.8 92.8 92.4 91.2 91.2 91.3 Machinery and equipment
Aset lain 1.5 2.5 1.6 2.7 0.7 0.8 0.8 0.8 0.8 Other assets
Struktur 48.8 49.9 50.8 56.3 59.0 61.8 57.8 60.2 61.8 Structure
Jentera dan peralatan 41.8 42.6 40.9 37.1 36.5 34.9 37.5 35.7 34.1 Machinery and equipment
Aset lain 9.4 7.6 8.3 6.6 4.5 3.3 4.7 4.1 4.1 Other assets
Struktur 47.5 50.5 52.2 56.9 57.8 57.5 55.1 57.2 58.9 Structure
Jentera dan peralatan 41.8 40.8 39.1 36.1 36.8 38.4 38.9 37.1 35.3 Machinery and equipment
Aset lain 10.7 8.7 8.7 7.0 5.5 4.1 6.0 5.7 5.8 Other assets
Jenis aktiviti ekonomi
dan jenis aset
Jadual / Year Kind of economic activity
and type of assets
Pe
rlo
mb
on
ga
n
da
n
pe
ng
ku
ari
an
Min
ing
an
d
qu
arry
ing
Pe
mb
ua
tan
Ma
nu
fac
turin
gP
em
bin
aa
nC
on
stru
ctio
nP
ert
an
ian
Ag
ricu
lture
Pe
rkh
idm
ata
nS
erv
ice
sJ
um
lah T
ota
l
Jadual 5D: PMTK Sektor Awam mengikut Jenis Aktiviti Ekonomi dan Jenis Aset pada Harga Semasa
- Pembahagian Peratus mengikut Jenis Aset
Table 5D: Public Sector GFCF by Kind of Economic Activity and Type of Assets at Current Prices
- Percentage Share by Type of Assets

PMTK 2005-2013 GFCF 2005-2013
NOTA TEKNIKAL
TECHNICAL NOTES


NOTA TEKNIKAL
Pembentukan Modal Tetap Kasar 2005–2013 23 Jabatan Perangkaan Malaysia
PENGENALAN Laporan ini memberikan maklumat PMTK mengikut jenis aktiviti
ekonomi, jenis aset dan sektor bagi tahun 2005 hingga 2013.
Statistik ini telah disusun berdasarkan konsep yang
disarankan oleh Sistem Akaun Negara 1993 dan 2008, Pertubuhan
Bangsa-Bangsa Bersatu.
KONSEP DAN DEFINISI PMTK diukur dengan jumlah nilai perolehan aset tetap, ditolak
pelupusan aset tetap oleh residen dalam tempoh perakaunan
yang digunakan secara berulang kali dan berterusan dalam proses
pengeluaran serta perbelanjaan ke atas perkhidmatan yang
menambah nilai kepada aset bukan pengeluaran.
Pelupusan atau Penjualan Aset Tetap
PMTK
Perolehan Aset Tetap
Bina Sendiri Aset Tetap
Penambahbaikan Utama Aset Bukan Pengeluaran
Penambahbaikan Utama Aset Tetap
Kos Pemindahan Pemilikan Aset
Perolehan termasuk pembelian aset (baru atau terpakai) dan
pembinaan aset oleh pengeluar untuk kegunaan mereka sendiri.
Pelupusan termasuk jualan aset untuk skrap serta jualan aset
terpakai yang masih boleh digunakan oleh pengeluar lain. PMTK
juga dikenali sebagai pelaburan dalam aset tetap yang digunakan
berulang kali dalam proses pengeluaran bagi tempoh lebih dari
setahun.

NOTA TEKNIKAL
24 Pembentukan Modal Tetap Kasar 2005–2013 Jabatan Perangkaan Malaysia
Bagi kes isi rumah sebagai pengguna, semua perbelanjaan ke atas
aset tetap seperti peralatan pengangkutan dan jentera & peralatan
tidak dianggap sebagai PMTK tetapi ia merupakan penggunaan
akhir. Walau bagaimanapun, ia adalah satu pengecualian bagi
pembelian tempat kediaman untuk tujuan didiami oleh pemilik kerana
pengeluaran perkhidmatan perumahan oleh pemilik penghuni diambil
kira dalam SNA sebagai pengeluaran akaun sendiri.
PMTK MENGIKUT JENIS
ASET
Bagi tujuan penerbitan ini, PMTK mengikut jenis aset dikelaskan
kepada dua kategori. Kategori pertama terdiri daripada tiga jenis
aset iaitu struktur, jentera & kelengkapan dan aset lain. Kategori
yang seterusnya dibezakan mengikut enam jenis aset yang
dinyatakan seperti berikut:
PEMILIKAN ASET Aset dibahagikan kepada dua jenis pemilikan. Pemilikan sah
adalah unit institusi yang dikenal pasti oleh undang-undang untuk
menuntut faedah yang berkaitan dengan entiti. Pemilikan ekonomi
adalah unit institusi yang berhak menuntut faedah berkaitan dengan
penggunaan entiti dalam aktiviti ekonomi kerana menerima risiko
yang berkaitan.
ASET Aset adalah alat penyimpan nilai yang mewakili faedah atau
beberapa faedah terakru bagi pemilik ekonomi melalui pegangan
atau penggunaan entiti tersebut dalam satu tempoh masa. Ia
merupakan satu cara membawa nilai ke hadapan dari satu tempoh
perakaunan ke tempoh yang lain.
Aset boleh dibezakan pada klasifikasi peringkat pertama
antara aset bukan kewangan dan aset kewangan. Bagi aset
bukan kewangan, ia dibezakan antara aset pengeluaran dan
aset bukan pengeluaran. Aset pengeluaran terdiri daripada struktur,
jentera & kelengkapan dan aset lain.

NOTA TEKNIKAL
Pembentukan Modal Tetap Kasar 2005–2013 25 Jabatan Perangkaan Malaysia
Kategori
Tiga Jenis Aset
Keterangan
Kategori
Enam Jenis Aset
Struktur
Bangunan kediaman
Bangunan bukan kediaman
Struktur
Pembinaan lain
Struktur platform bagi aktiviti minyak dan gas
Jentera &
Peralatan
Pesawat, kapal, kereta api, lokomotif, kenderaan komersil, kereta penumpang dan lain-lain
Peralatan pengangkutan
Lain-lain jentera & peralatan
Peralatan ICT dan Lain-lain Jentera &
Peralatan
Peralatan ICT
Perisian komputer & pangkalan data
Produk Harta
Intelek
Aset Lain
Hiburan, sastera & seni asal
Penyelidikan & pembangunan
Cari gali mineral & penilaian
Ternakan yang menghasilkan pengeluaran berulang kali seperti haiwan yang digunakan untuk tujuan pembiakan, pengangkutan atau hiburan
Sumber Biologi Dipupuk
Pokok, tumbuhan dan sumber tanaman yang menghasilkan pengeluaran berulang kali iaitu kelapa sawit, getah dan pokok buah-buahan
Sistem persenjataan
Aset Lain
Kos pindah hak milik tanah dan lain-lain yang tidak terkelas di tempat lain

NOTA TEKNIKAL
26 Pembentukan Modal Tetap Kasar 2005–2013 Jabatan Perangkaan Malaysia
PMTK MENGIKUT SEKTOR Klasifikasi sektor Awam dan Swasta menyediakan satu standard
untuk penyusunan statistik yang membahagikan ekonomi residen
kepada sektor ekonomi yang luas bergantung sama ada dikawal
oleh kerajaan atau sebaliknya.
Sektor Awam terdiri daripada semua unit kerajaan dan semua unit
institusi dan juga unit institusi notional yang dikawal secara
langsung atau tidak langsung oleh kerajaan iaitu perbadanan awam.
Kriteria yang perlu dipertimbangkan sebagai kawalan adalah seperti
berikut:
Pemilikan majoriti kepentingan mengundi; atau
Kawalan ke atas lembaga atau badan pentadbir lain; atau
Kawalan dari segi pelantikan dan pemecatan jawatan utama;
atau
Kawalan ke atas jawatankuasa utama entiti; atau
Saham kencana dan opsyen; atau
Peraturan dan kawalan; atau
Kawalan oleh pelanggan utama; atau
Kawalan disebabkan pinjaman daripada kerajaan
Sektor Swasta terdiri daripada semua unit residen yang
dikendalikan oleh syarikat swasta kecuali yang dikawal oleh
kerajaan. Contoh sektor Swasta ialah unit institusi isi rumah,
NPISHs dan perbadanan swasta. Jadual 2 membezakan sektor
Awam dan Swasta mengikut unit institusi.
Perbadanan Bukan
Kewangan
Perbadanan Kewangan
Kerajan Am NPISHs Isi Rumah
Awam Awam Awam Swasta Swasta
Swasta Swasta
Jadual 2: Sektor Awam dan Swasta mengikut Unit Institusi
NOTA TEKNIKAL
Pembentukan Modal Tetap Kasar 2005–2013 27 Jabatan Perangkaan Malaysia
PMTK MENGIKUT JENIS
AKTIVITI EKONOMI
Penentuan PMTK mengikut sektor merujuk kepada pemilikan aset
tetap. Dalam kebanyakan kes, penentuan pemilikan aset tetap
adalah jelas; satu unit tunggal yang memperoleh aset untuk
digunakan dalam pengeluaran. Bagi industri huluan minyak dan
gas, ciri-ciri perniagaan adalah berbeza daripada yang lain di mana
pengeluar berkongsi risiko dan ganjaran aset di antara unit yang
berbeza pada satu masa. Bagi kes seperti ini, SNA 2008
menyarankan untuk merekodkan aset yang dikongsi di antara unit
perlu berkadaran dengan pemilikan syer.
Jenis aktiviti ekonomi merujuk kepada kumpulan pertubuhan yang
terlibat dalam aktiviti utama yang sama. Aktiviti utama pertubuhan
adalah kumpulan dalam industri berdasarkan kepada Piawaian
Klasifikasi Industri Malaysia 2000 yang selari dengan Piawaian
Klasifikasi Industri Antarabangsa bagi Semua Aktiviti
Ekonomi Semakan 3. Bagi penyusunan ini, semua unit
kerajaan disusun di bawah aktiviti Perkhidmatan. Jadual 3
menunjukkan lima aktiviti utama ekonomi mengikut sub aktiviti.

NOTA TEKNIKAL
28 Pembentukan Modal Tetap Kasar 2005–2013 Jabatan Perangkaan Malaysia
Jadual 3: Aktiviti Utama Ekonomi mengikut Sub aktiviti
Jenis Aktiviti Ekonomi
Keterangan
PERTANIAN
Getah & Kelapa
Sawit
Getah Kelapa Sawit
Ternakan &
Perikanan
Ternakan ayam dan itik Lembu dan kerbau Ternakan lain Perikanan laut Akuakultur
Pertanian Lain Perhutanan & pembalakan Padi Sayur-sayuran Buah-buahan Tanaman makanan Lain-lain
PERLOMBONGAN DAN PENGKUARIAN
Perlombongan dan
Pengkuarian
Minyak mentah & kondensat
Gas asli Perlombongan lain & pengkuarian
PEMBUATAN
Makanan, Minuman
& Tembakau
Minyak dan lemak daripada sayuran &
haiwan
Prosesan makanan Minuman Produk tembakau

NOTA TEKNIKAL
Pembentukan Modal Tetap Kasar 2005–2013 29 Jabatan Perangkaan Malaysia
Jenis Aktiviti Ekonomi
Keterangan
Produk Tekstil &
Kayu
Tekstil & pakaian Kulit & kasut Keluaran kayu Kertas & produk kertas Penerb i tan, percetakan &
pengeluaran semula media
rakaman Perabot
Produk Petroleum,
Kimia, Getah &
Plastik
Produk petroleum bertapis Bahan kimia & produk kimia Produk getah Produk plastik
Produk Mineral
Bukan Logam,
Logam Asas &
Produk Logam Yang
Direka
Produk mineral bukan logam
Logam asas Produk logam yang direka
Elektrik &
Elektronik dan
Peralatan
Pengangkutan
Jentera & peralatan Pembuatan mesin pejabat,
perakaunan & pengkomputeran Jentera elektrik dan perkakasan Pembuatan radio, televisyen dan
peralatan komunikasi dan
perkakasan
Pembuatan peralatan perubatan,
ketepatan dan optik, jam tangan
dan jam
Kenderaan bermotor dan peralatan
pengangkutan
Pembuatan lain

NOTA TEKNIKAL
30 Pembentukan Modal Tetap Kasar 2005–2013 Jabatan Perangkaan Malaysia
Jenis Aktiviti Ekonomi
Keterangan
PEMBINAAN
Pembinaan Bangunan kediaman Bangunan bukan kediaman Kejuruteraan awam Pertukangan khas
PERKHIDMATAN
Perdagangan
Borong & Runcit
Borong Runcit Kenderaan bermotor
Restoran &
Penginapan
Restoran Penginapan
Pengangkutan,
Penyimpanan &
Komunikasi
Pengangkutan darat Pengangkutan air Pengangkutan udara Pelabuhan dan operasi lapangan
terbang
Operasi lebuhraya Lain-lain pengangkutan Pos dan kurier Telekomunikasi
Kewangan, Insurans,
Hartanah &
Perkhidmatan
Perniagaan
Pengantara kewangan Lain-lain pengantara kewangan dan
aktiviti sokongan kewangan Insurans dan tabung pencen Aktiviti sokongan insurans Hartanah

NOTA TEKNIKAL
Pembentukan Modal Tetap Kasar 2005–2013 31 Jabatan Perangkaan Malaysia
Jenis Aktiviti Ekonomi
Keterangan
Profesional Perkhidmatan komputer Lain-lain perkhidmatan perniagaan
Kediaman yang dimiliki
Perkhidmatan Lain
Elektrik dan gas Air Perkhidmatan kesihatan swasta Perkhidmatan pendidikan swasta Perkhidmatan swasta lain Perkhidmatan kerajaan Institusi bukan keuntungan yang
berkhidmat kepada isi rumah
Perkhidmatan domestik bagi isi
rumah

TECHNICAL NOTES
32 Gross Fixed Capital Formation 2005–2013 Department of Statistics, Malaysia
INTRODUCTION This report provides information on GFCF by kind of economic
activity, type of assets and sector for year 2005 to 2013. The
statistics were compiled based on the concepts recommended by
System of National Accounts 1993 and 2008, United Nations.
CONCEPTS AND
DEFINITIONS
GFCF is measured by the total value acquired, less disposal of fixed
assets by the residents during the accounting period which are used
repeatedly or continuously for production plus expenditure on
services that adds value to the non-produced assets.
GFCF
Acquisition of Fixed Assets
Built Own Fixed Assets
Major Improvements of Non-produced Assets
Major Improvements of Fixed Assets
Cost of Ownership Transfer of Assets
Disposal or Selling of Fixed Assets
Acquisition includes both purchases of assets (new or used) and the
construction of assets by producers for their own use. Disposals
include sales of assets for scrap as well as sales of used assets in a
working condition to other producers. GFCF is also known as
investment in fixed assets that used repeatedly in the process of
production for more than one year.
TECHNICAL NOTES
Gross Fixed Capital Formation 2005–2013 33 Department of Statistics, Malaysia
In the case of households as consumers, all expenditure on fixed
assets such as transport equipment and machinery & equipment are
not considered as GFCF but final consumption. However, it
is an exception for purchase on dwellings for residential purpose
since the production of housing services by owner-occupiers is
considered in SNA as own account production.
GFCF BY TYPE OF ASSETS For the purpose of this publication, GFCF by type of assets are
classified in two categories. The first category consists of
three type of assets i.e. structure, machinery & equipment and other
assets. The latter is distinguished by six type of assets expressed as
follows:
OWNERSHIP OF ASSET Asset is divided into two types of ownership. Legal ownership is the
institutional unit identified by law to claim the benefits associated
with the entities. Economic ownership is the institutional unit
entitled to claim the benefits associated with the use of the entity in
the course of an economic activity by virtue of accepting the
associated risks.
ASSET An asset is a store of value representing a benefit or
series of benefits accruing to the economic owner by holding or
using the entity over a period of time. It is a means of carrying
forward value from one accounting period to another.
Asset is distinguished at the first level of the classification
between non-financial asset and financial asset. Within
non-financial asset, it is distinguished between produced and
non-produced asset. Produced asset consists of structure,
machinery & equipment and other assets.

TECHNICAL NOTES
34 Gross Fixed Capital Formation 2005–2013 Department of Statistics, Malaysia
Category by Three Type of Assets
Description
Category by Six Type of Assets
Structure
Residential building
Non-residential building
Structure
Other construction
Floating structure for oil and gas activities
Machinery & Equipment
Aircraft, ship, train, locomotive, commercial vehicle, passenger car, etc.
Transport Equipment
Other machinery & equipment
ICT equipment and Other Machinery &
Equipment
ICT equipment
Computer software & database
Intellectual Property
Products
Other Assets
Entertainment, literary & artistic original
Research & development
Mineral exploration & evaluation
Livestock yields repeated production such as animal purposely used for breeding, transportation or entertainment
Cultivated Biological Resources
Trees, crops and planted resources yields repeated production i.e. oil palm, rubber and fruit trees
Weapons systems
Other Assets
Cost of ownership transfer for land and others that are not elsewhere classified

TECHNICAL NOTES
Gross Fixed Capital Formation 2005–2013 35 Department of Statistics, Malaysia
Ownership of the majority of the voting interest; or
Control of the board or other governing body; or
Control of the appointment and removal of key personnel;
or
Control of key committees of the entity; or
Golden shares and options; or
Regulation and control; or
Control by a dominant customer; or
Control attached to borrow from the government
Private sector comprises all resident units operated by private
enterprises except those controlled by government. Example of
Private sector are household institution units, NPISHs and private
corporations. Table 2 distinguishes Public and Private sectors by
institutional units.
GFCF BY SECTOR The Public and Private sectors classification provides a standard
for the compilation of statistics that divide the resident economy into
broad economic sector depending whether or not they are controlled
by government.
The Public sector comprises all government units and all institutional
units and also notional institutional units controlled directly or
indirectly by government i.e. public corporation. The criteria to be
considered as control are as follows:
Table 2: Public and Private Sectors by Institutional Units
Non-financial
Corporation
Financial Corporation
General Government
NPISHs Households
Public Public Public Private Private
Private Private

TECHNICAL NOTES
36 Gross Fixed Capital Formation 2005–2013 Department of Statistics, Malaysia
GFCF BY KIND OF
ECONOMIC
ACTIVITY
The determination of GFCF by sector refers to the ownership of
fixed assets. In most cases, the ownership of fixed assets is
straightforward; a single unit that acquires the asset for use in
production. For oil and gas upstream industry, the nature of
business is different from others whereby the producers share the
risks and rewards of an asset between different units at a point of
time. In such cases, 2008 SNA recommends to record the assets
shared between the units in proportionate to their ownership shares.
Kind of economic activity refers to the group of establishments
engaged in the same or similar principal activity. The principal
activity of establishments are grouped into industries according to
the Malaysia Standard Industrial Classification 2000 (MSIC 2000)
which is aligned with the International Standard Industrial
Classification of All Economic Activities (ISIC) Revision 3. In this
compilation, all government units are grouped under Services
activity. Table 3 shows the five main economic activities by
sub-activities.
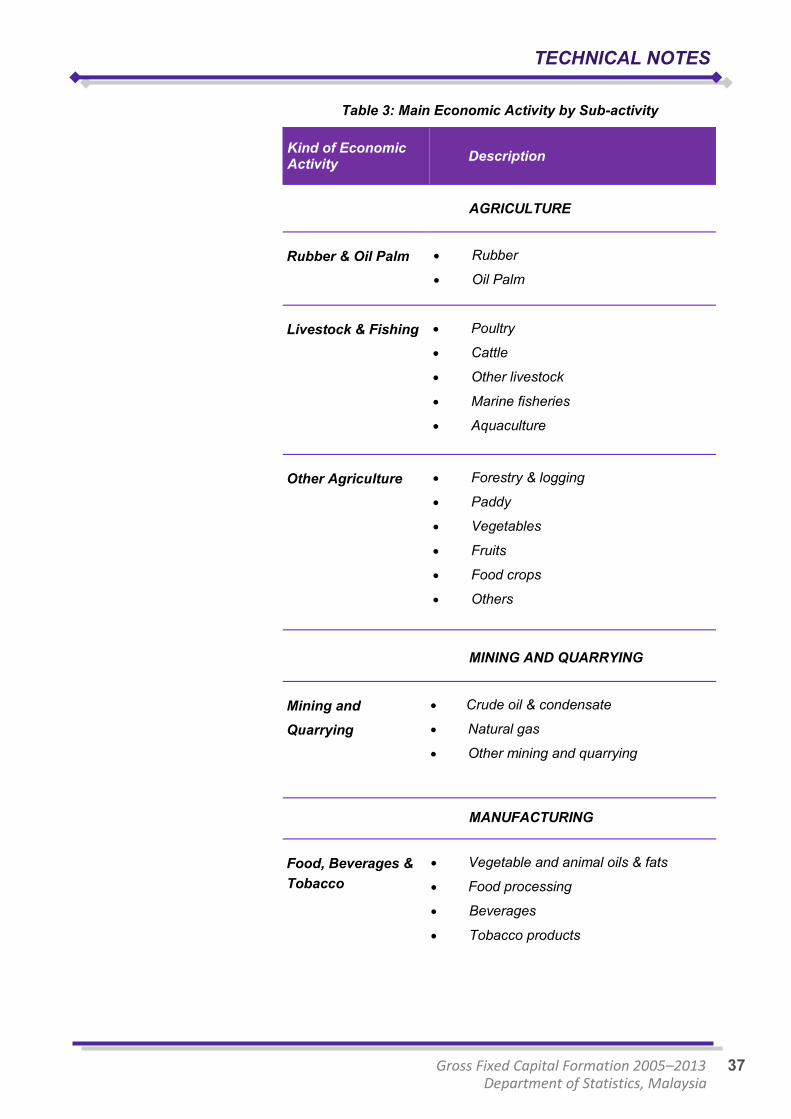
TECHNICAL NOTES
Gross Fixed Capital Formation 2005–2013 37 Department of Statistics, Malaysia
Table 3: Main Economic Activity by Sub-activity
Kind of Economic Activity
Description
AGRICULTURE
Rubber & Oil Palm Rubber Oil Palm
Livestock & Fishing Poultry Cattle Other livestock Marine fisheries Aquaculture
Other Agriculture Forestry & logging Paddy Vegetables Fruits Food crops Others
MINING AND QUARRYING
Mining and
Quarrying
Crude oil & condensate Natural gas Other mining and quarrying
MANUFACTURING
Food, Beverages &
Tobacco
Vegetable and animal oils & fats
Food processing Beverages Tobacco products

TECHNICAL NOTES
38 Gross Fixed Capital Formation 2005–2013 Department of Statistics, Malaysia
Kind of Economic Activity
Description
Textiles & Wood
Products
Textiles & wearing apparel Leather & footwear Wood products Paper & paper products Publishing, printing & reproduction
of recorded media
Furniture
Petroleum, Chemical,
Rubber & Plastic
Products
Refined petroleum products Chemicals & chemical products Rubber products Plastic products
Non-metallic Mineral
Products, Basic
Metal & Fabricated
Metal Products
Non-metallic mineral products Basic metals Fabricated metal products
Electrical &
Electronic and
Transport
Equipment
Machinery & equipment Manufacture of office, accounting &
computing machinery
Electrical machinery and apparatus Manufacture of radio, television and
communication equipment and
apparatus Manufacture of medical, precision
and optical instruments, watches
and clocks Motor vehicles and transport
equipment Other manufactures
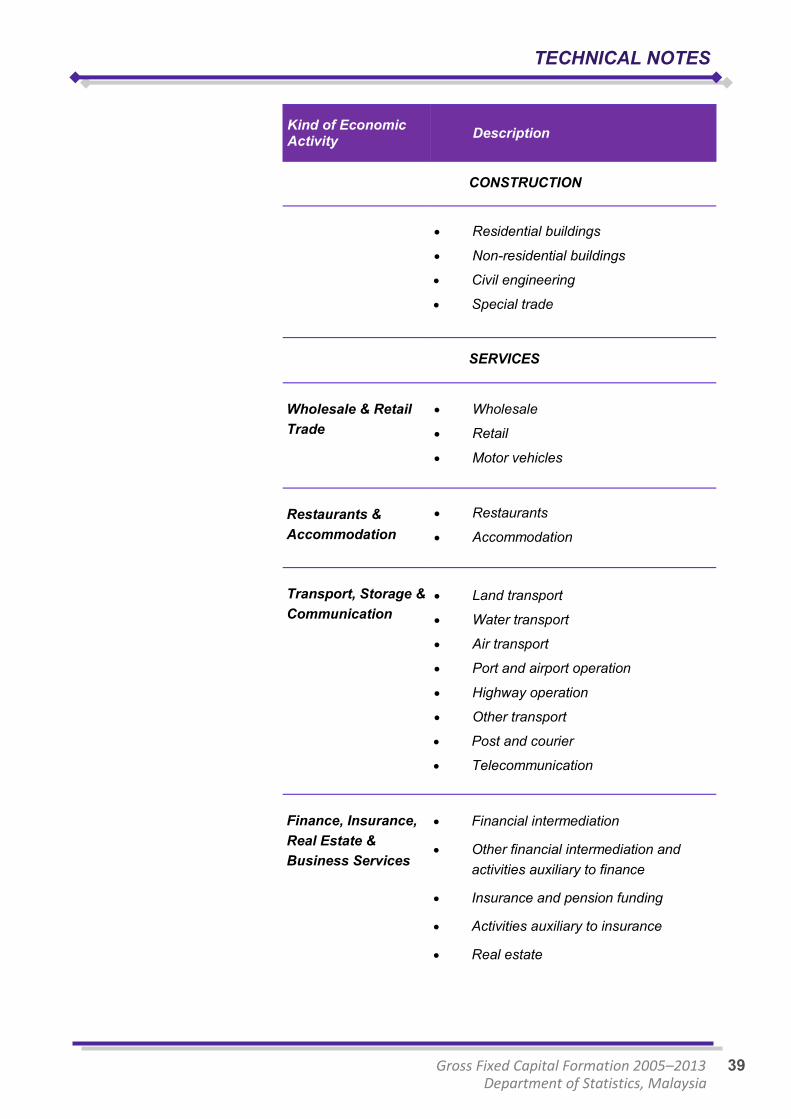
TECHNICAL NOTES
Gross Fixed Capital Formation 2005–2013 39 Department of Statistics, Malaysia
Kind of Economic Activity
Description
CONSTRUCTION
Residential buildings Non-residential buildings Civil engineering Special trade
SERVICES
Wholesale & Retail
Trade
Wholesale Retail Motor vehicles
Restaurants &
Accommodation
Restaurants Accommodation
Transport, Storage &
Communication
Land transport Water transport Air transport Port and airport operation Highway operation Other transport Post and courier Telecommunication
Finance, Insurance,
Real Estate &
Business Services
Financial intermediation Other financial intermediation and
activities auxiliary to finance Insurance and pension funding Activities auxiliary to insurance Real estate

TECHNICAL NOTES
40 Gross Fixed Capital Formation 2005–2013 Department of Statistics, Malaysia
Kind of Economic Activity
Description
Professional Computer services Other business services Ownership of dwellings
Other Services
Electricity and gas Water
Private health services
Private education services Other private services Government services Non-profit institution serving
households Domestic services of households

PMTK 2005-2013 GFCF 2005-2013
SUMBER DATA
DATA SOURCES


SUMBER DATA
Pembentukan Modal Tetap Kasar 2005–2013 41 Jabatan Perangkaan Malaysia
Jenis Aktiviti Ekonomi
Sumber Data
PERTANIAN
Jadual Penawaran dan Penggunaan 2005 Banci Ekonomi dan Penyiasatan Tahunan Penyiasatan Perbelanjaan Modal Pertubuhan Awam Lembaga Minyak Sawit Malaysia Lembaga Getah Malaysia Lembaga Perindustrian Nanas, Malaysia Lembaga Koko Malaysia Lembaga Lada Malaysia Jabatan Pertanian Malaysia Kementerian Pertanian & Industri Asas Tani, Malaysia Jabatan Perkhidmatan Veterinar, Semenanjung Malaysia . Jabatan Perkhidmatan Veterinar, Sabah Jabatan Perkhidmatan Veterinar, Sarawak
PERLOMBONGAN
DAN PENGKUARIAN
Jadual Penawaran dan Penggunaan 2005 Banci Ekonomi Perlombongan dan Pengkuarian Perangkaan Petroleum dan Gas Asli Penyiasatan Perbelanjaan Modal Pertubuhan Awam Maklumat pelaburan Minyak & Gas
PEMBUATAN Jadual Penawaran dan Penggunaan 2005 Banci Ekonomi Pembuatan Penyiasatan Industri Pembuatan Tahunan Penyiasatan Perbelanjaan Modal Pertubuhan Awam
PEMBINAAN
Jadual Penawaran dan Penggunaan 2005 Banci Ekonomi Industri Pembinaan Penyiasatan Pembinaan Tahunan Statistik Pembinaan Suku Tahunan

SUMBER DATA
42 Pembentukan Modal Tetap Kasar 2005–2013 Jabatan Perangkaan Malaysia
Jenis Aktiviti Ekonomi
Sumber Data
PERKHIDMATAN
Jadual Penawaran dan Penggunaan 2005 Banci Ekonomi dan Penyiasatan Tahunan
Penyata Kewangan Kerajaan Persekutuan, Kerajaan Negeri, Pihak Berkuasa Tempatan dan Badan-badan Berkanun
Penyiasatan Perbelanjaan Modal Pertubuhan Awam
Perbadanan Kemajuan Filem Nasional Malaysia Persatuan Industri Rakaman Malaysia Penyata Kewangan Syarikat
SEMAKAN
Semakan anggaran tahunan bagi tahun 2011 dan 2012 adalah berdasarkan banci/ penyiasatan
terkini bagi industri terpilih dan sumber lain.
SIMBOL & SINGKATAN
Simbol & singkatan berikut telah digunakan dalam keseluruhan penerbitan:
e anggaran
p permulaan
RM Ringgit Malaysia
NPISHs Institusi Bukan Keuntungan yang Berkhidmat kepada Isi Rumah
KDNK Keluaran Dalam Negeri Kasar
SNA System of National Accounts
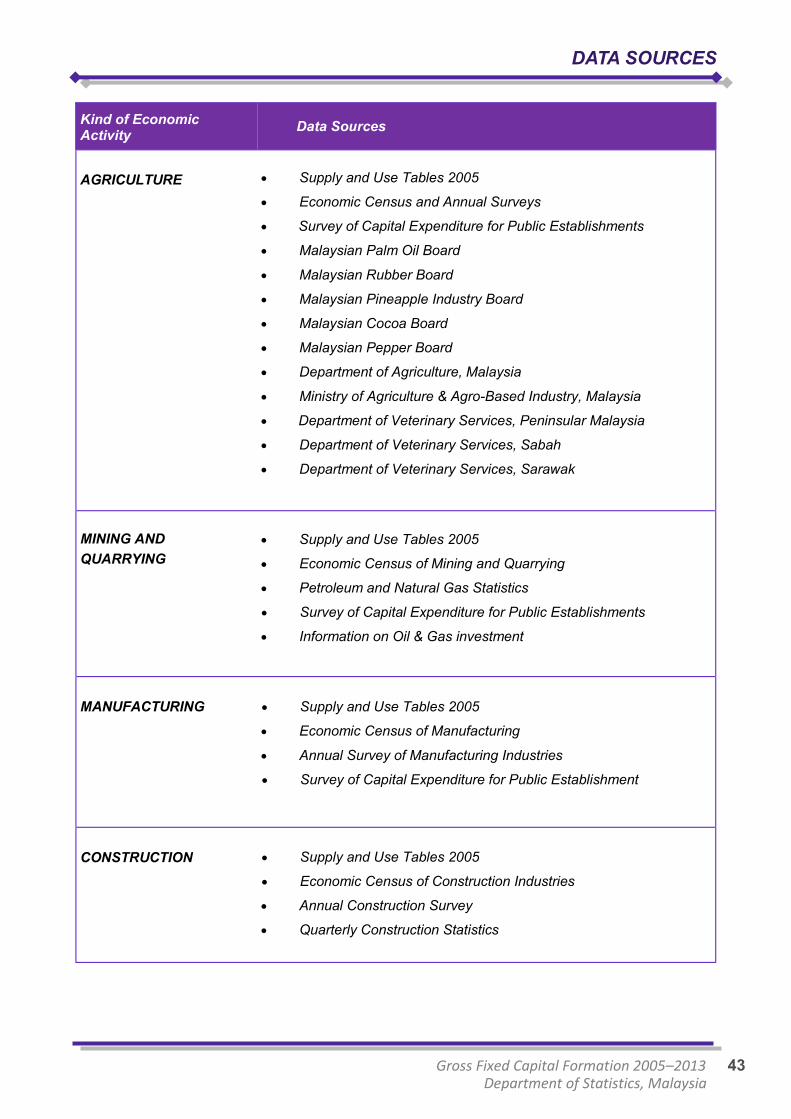
DATA SOURCES
Gross Fixed Capital Formation 2005–2013 43 Department of Statistics, Malaysia
Kind of Economic Activity
Data Sources
AGRICULTURE Supply and Use Tables 2005 Economic Census and Annual Surveys
Survey of Capital Expenditure for Public Establishments Malaysian Palm Oil Board Malaysian Rubber Board Malaysian Pineapple Industry Board Malaysian Cocoa Board Malaysian Pepper Board Department of Agriculture, Malaysia Ministry of Agriculture & Agro-Based Industry, Malaysia Department of Veterinary Services, Peninsular Malaysia Department of Veterinary Services, Sabah Department of Veterinary Services, Sarawak
MINING AND
QUARRYING
Supply and Use Tables 2005 Economic Census of Mining and Quarrying Petroleum and Natural Gas Statistics Survey of Capital Expenditure for Public Establishments Information on Oil & Gas investment
MANUFACTURING Supply and Use Tables 2005 Economic Census of Manufacturing Annual Survey of Manufacturing Industries Survey of Capital Expenditure for Public Establishment
CONSTRUCTION
Supply and Use Tables 2005 Economic Census of Construction Industries Annual Construction Survey Quarterly Construction Statistics

DATA SOURCES
44 Gross Fixed Capital Formation 2005–2013 Department of Statistics, Malaysia
Revisions of annual estimates for year 2011 and 2012 were based on latest
census/ surveys for selected industries and other sources.
Kind of Economic Activity
Data Sources
SERVICES
Supply and Use Tables 2005 Economic Census and Annual Surveys Financial Statement of Federal Government, State
Government, Local Authorities and Statutory Bodies Survey of Capital Expenditure for Public Establishments National Film Development Corporation Malaysia (FINAS) Recording Industry Association of Malaysia (RIM)
Financial Statement from Companies
REVISIONS
SYMBOLS & ABBREVIATIONS
The following symbols & abbreviations have been used throughout the publication:
e estimates
p preliminary
RM Ringgit Malaysia
i.e. that is
etc and others
NPISHs Non-profit Institution Serving Households
GDP Gross Domestic Product
SNA System of National Accounts