Embed Size (px)
Citation preview
%
Z. Gcomorph. N. F. Suppl. Bd. 29 1 9 1 2 0 6 Berlin • Stuttgart September 1978
Sediment budget for a small catchment in mountainous terrain
by
WILLIAM E. DIETKICH and THOMAS DUNNE, Seattle (USA)
with 6 figures and 3 tables
Z u s a m m e n f a s s u n g . Geomorphologische Prozcsse sind ott schr verandcrlich in Zcit und Raum. Angaben von kurzfristigen Messungen an wenigen Orten konncn nicht cinfach cxtra-poliert werden, um die Sedimentbilanz fiir ein AbfluBgebiet aufzustellen. Bevor das Nctzwcrk der Mclipunktc eingerichtct wird, um die Komponenten der Sedimentbilanz zu messen, kann eine annahernde Bilanz durch Kartierung, Experimente im Labor, Gestcinsanaiysc und I'rozcfJ-datcn von ahnlichcn Abflufigcbictcn aufgestellt werden. Bcsondcrs solltcn die Gclandcbcob-achtungen der Bezichungen zwischen dem Transport und der Ablagcrung der Sedimcntc, sow ic die Vcranderung der Partikcl bctont werden. VC'ir haben eine annahernde Sedimentbilanz fur ein klcines AbfluBgcbict bcrcchnet. Losung vcrursacht 60% der Denudation; die durchschnitt-lichc Ycrweildaucr des Bodcns an den Hangen ist 20000 Jahrc, und die Bodcncigenschaftcn andcrn sich systematisch wahrend der Bcwcgung hangabwnrts. Die geschatzten Geschwindig-kcitcn des Bodcnkricchcns und die FIuRfracht sind ausbilanziert. Die Halftc der Bodenmassc, die die Abfiuftrinncn crrcicht, wird als Schwcbfracht weggctragen, wahrend der Rest in den Zufliissen, in Schwcmmfachcrn und in der Talaue vorubergchend abgclagcrt wird. Die Ruhc-zeit der Durchgangsaufschiittungcn nimmt fluGabwarts von Jahrzchntcn auf ctwa 10000 Jahrc zu. Wahrend des Transports vcrkleincm Vcrwittcrung und Abschlcifung K0"„ der Bodcnfracht zu Schwcbfracht.
S u m m a r y . Geom"rphic processes arc often slow and highly variab'c i-. time and spare Data from short-term monitbrinc at a few localities are not easily extrapolated to compute the sediment budget for a catchment. Before designing a monitoring network to measure components of the sediment balance, the investigator can construct an approximate budget from data that can be obtained quickly through tield mapping, laboratory experiment, petro-graphic studies, and measurements in similar catchments. Emphasis should be placed on field recognition of the linkages between processes of sediment transfer and storage, as well as the changes which particles undergo. Vx'e have computed an approxima*c sediment buduct for a small catchment. Dissolution is responsible for 60",, of the dcnudati ' in; the average residence time of soil on hillsides is 20,000 vrs; and the soil characteristic* change systematically a* the soil moves downhill. The estimated rates of soil creep and sediment discharge from the b.;*ir> arc in balance. One half of the soil discharged to channels is carried away as suspended load while the remainder is stored temporarily in t r ibutar ies , debris fans, and the floodplain. The residence times of sediment in these storage elements increase downvallcy from decades to about 10,000 yrs. During the migration, weathering and attrition alter 80% of the bedload to suspended load sizes.
192 W. II. D I E T R I C H and T. D U N N E
R e s u m e . Certains processus gcomorphologiqucs sont souvcut lenis cl ils varicnt bcaucoup clans 1c temps ct dans I'cspacc. Done, il est dillicilc d'extrapolcr les rcsultats des mesurages courts dc quclqucs cn<lroits pour calculcr Ic bilan scdimcntologiquc d 'un liassin versant. Avant qu'il fassc Ic plan d'un rescau pour mesurer les composantcs du bilan, Ic gcomorphuloguc pent £tab!ir un bilan approximatif a partir dc donntes <|u'il pent vitc obicnir en faisant tine carle gcomorphologiquc, par des experiences en laboratoirc, par des etudes petrographiqucs ct par • 'utilisation dc mesurcs dans des bassins analogues. On devrait insistcr sur I'idcntificaiion faitcs dans Ic terrain concernant Ics liens cntrc les processus dc transfcrt ct dc conservation dc sediment, ainsi que les changements subis par les parccllcs pendant lc transfcrt. Nous axons ctabli un bilan approximatif dc sediments dans un petit bassin. I.a dissolution cause 60% dc la denudat ion; en moyenne, une parccllc dc sol rcste sur unc pente pendant 20,000 ans; ct les caractc-ristiqucs pcdologiqucs se modifiers; alors que Ic sol glissc. Les taux estimes du glisscment du sol ct dc 1'apport scdimcntologiquc du bassin sont cgaux. Unc moitic du sol dcvcrscc dans lc lit fluvial est entrainee en suspension ct lc rcste est mis temporaircment dans Ics tribulaircs, les cones d'alluvions ct Ics plaincs alluvionnaircs. I.a durcc de scjour du sediment dans ccs accumulations augmente graducllcmcnt lc long dc la vallcc ct passe dc quclqucs dcccnnics a 10,000 ans. Pendant lc transfcrt, la decomposition ct l'usurc rcduiscnt 80% dc la charge dc fond en dimension dc charge dc suspension.
Statement of the problem
To make a sediment budget for a drainage basin, one must quantity and relate the major processes responsible for the generation and transport of sediment. This task is difficult because the processes are often slow and highly variable in space and time. Data from short-term monitoring at a few localities are not easily extrapolated to compute average values for large areas. We have compiled a sediment budget for the various denudation processes in a small catchment on the basis of field mapping of sediment accumulations and from data available in the geomorphic literature. Our estimates can be checked against measured sediment yields from nearby basins. The computed sediment budget suggests the design for a set of measurements to refine our knowledge of the rates at which sediment is generated, moved and stored intermittently through the catchment, and is modified as it travels. We present a qualitative description of the sediment production and transport processes and a quantitative sediment budget. The results are then used to make predictions about sediment transport and soil formation processes.
The catchment
Rock Creek basin in the Coast Range of Oregon is a deeply dissected, 16.2 km2
catchment developed in porphyritic basaltic lavas that are intruded by dikes of aphanitic basalt. Under the wet (3400 mm of precipitation per year), temperate climate of the region, this rock weathers to a 0.8 m thick reddish-brown gravelly sandy loam with poorly developed structure and horizons. The hillslopes of the basin are convex with narrow ridgetops, long 20—30 ' slopes and no concave footslopes. The drainage density is 4.0 km k m 2 and the average main channel gradient is 0.067. The drainage basin is mantled by a uniform cover of old-growth Douglas fir (Pscudotsuga menziesii) and hemlock (Tsiiga hctcrophylla).
During storms, rainwater infiltrates and flows through the soil, returning
° I
.VilmRiit Inulmi lur .1 sm.ill c.iK'limcnt in m<miit.iiii<His terrain 193
to tlie ground surtace in the lower parts ot hollows or on the vallcv Moor as saturation overland flow (DUNNT, in press). Hrosion processes, therefore, are dominated bv mass wasting.
li 'ci///>cr/i/^ and hillilnfK /'/';,< s.us
Two sets ot processes cause weathering in the Coast Range ot Oregon. Chemical weathering by the voluminous throughHow ot dilute groundwater leaches the rocks and leaves a residue which is densclv fractured and laced with alteration /ones. The weathered residue is then disrupted bv roots, burrowing animals and expansii >n during hydration to torm a soil.
Water penetrates fractures, vesicles, cleavage planes and microfractures and reacts with the iron-rich glassy matrix ot the basalts to form kaolinite, geothite and amorphous oxides aloni; a network of closelv spaced alteration zones. The greyish brown rock residue can be easily crumbled bv hand. It contains clasts that vary in size from clay to gravel, but the relict textural and structural features
.of the rock such as bedding and phenocryst lineations are still discernible. Bedrock weathered to this condition is called saprolite and typically has a low bulk density (averaging 1.0 g/cc in this case) due to extensive leaching and expansion of minerals. Aphanitic dike rocks which lack significant pathways for water penetration tend to resist weathering and survive as coarse gravel in the soils.
Weathered rock and saprolite are mixed to produce a soil by a variety of physical and biological processes. There is overturning and mixing during wetting and drying and during slow plastic deformation ot the base of the soil under shear. Root-growth and animal boring are also important, but the most important process of soil formation from the weathered substrate seems to be tree fall. On steep hillsides with thin soils, tree roots penetrate to the weathered bedrock or saprolite and when the tree falls substantial amounts of these materials are torn loose and mixed into the soil column. Measurements of the depths of roots on trees in the basin indicate that the primary structural support roots of even young trees grow on or into the underlying weathered rock.
The soils are mineralogically similar to saprolite but disruption lowers the bulk density and destroys any residual cohesion from the bedrock (as shown by shear strength measurements that we have made on similar material from western Washington). These last mentioned changes are important in allowing soil creep and landsliding within the soil, while the saprolite remains immobile.
The intensity of mixing increases downslope with the gradient as shear deformation becomes more intense and tree falls more frequent. Saprolite survives near the ridgetops and is the dominant source material for soil formation there. The saprolite becomes thin or absent, however, on the steeper parts of hillsides, where the mechanical disturbance is great enough to incorporate less weathered bedrock into the soil. The bulk density of weathered bedrock currently being incorporated into the base of the soil profile increases continuously with gradient and distance downslope from 0.8 to 1.2 g cm - 3 in porphyritic vesicular basalt, from 1.0 to 2.3 g cm-3 in breccia, and from 1.1 to 2.1 g cm~3 in aphanitic
194 \V. E. D I E T F e n and T. D I S N E
basalt. This variation is reflected in the soil properties. Ridgctop soils contain about 35% by weight of gravel and have a mean bulk density of 0.8 g cm-3. At the base of hillslopes, gravel comprises 50% of the soil which has a mean bulk density of 0.95 g cm - 3 .
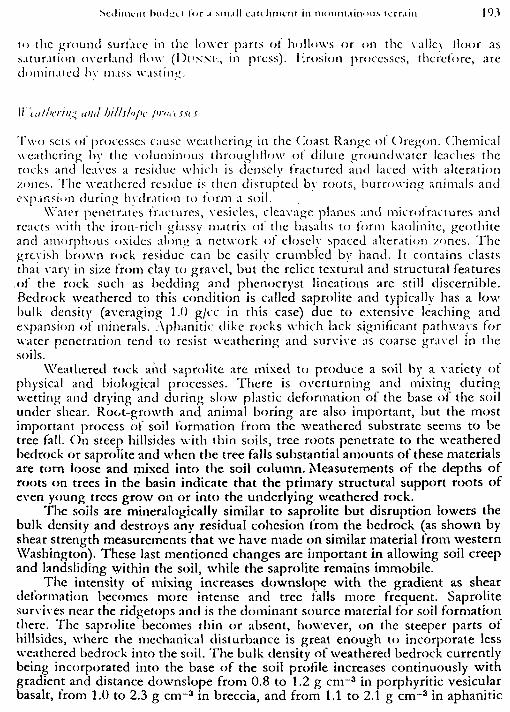
• APHANtTIC BASALT X UNDIFFERENTIATED o PORPHYRITIC BASALT a WEOGES • BRECCIA
Fig. 1. Relationship between local hillslopc gradient and depth for soils in the Rock Creek area. Measurements were made along road cuts. The upper curve separates shallow soils formed by mixing processes from soils referred to here as wedges which arc formed by deposition in old landslide scars. If wedge depth extended below the road cut, an arrow on its symbol indicates that it is a minimum thickness.
The depth of soil also varies systematically as hillslope gradient increases downslope (fig. 1). The depth of soil is controlled by the effective depth and intensity of mixing, and the balance between mixing and downslope transport of soil. Somewhat deeper soils could theoretically remain stable with respect to landsliding because of the high permeability of the soil and the cohesion supplied bv tree roots. Slides on the hillslopes are rare except for shallow footslope failures and debris flows from hollows (discussed later). PIKRSON'S (1977) measurements of pore water pressures in a nearby area support our claim; he showed that the factor of safety is unlikely to approach unity on the main hillsides even in large storms.
Hillslope transport and discharge of soil to channels
In thin soils the jnixing processes of wetting and drying, tree throw and animal burrowing which produce the soil also move it downslope. Because these processes are intense near the surface, the rates of soil creep are typically greatest near the top of the soil column and diminish rapidly with depth (KIRKBY 1967). In thick soils, however, shear deformation predominates (KOJAN 1967) and extends to depths of at least 10 m in parts of the Oregon Coast Range (SWANSTON & SWANSON 1976).
In order to compute the discharge of soil into stream channels by creep it is necessarv to know the distribution of soil thickness and the average velocity ot soil movement. The former, though highly variable, can be obtained quickly by direct observation; field measurements of soil creep require many years of observation. To contruct an approximate sediment budget before the measure-
Sediment budget tor a small catchment in mountainous terrain 195
ments become available, we have used data trom the isomorphic literature to estimate creep rates.
In Rock Creek basin, soils could be separated into two categories: thin soils, the depth of which varied with hillslope gradient; and thick soils, referred to here as wedges, which are generally thicker and coarser than the other soils (fig. 1). The wedges are filled landslide scars whose origin we will discuss in the next section. Transects along road cuts and stream channels revealed that the wedges intersected approximately 10% of the length of first-order channels, 30% of second-order channels and 50% of third and fourth-order channels.
Few measurements of soil creep rates have been made under conditions similar to those of the Oregon Coast Range; i.e. on steep, forested hillslopes with an annual rainfall of 3000 mm. Fortunately, the few measurements are consistent (table 1). We therefore acceptcil averages ot the two sets ot data shown therein as being representative of our shallow and deep soli profiles. These estimates can be refined as our own held measurements become available.
We can now compute separately the sediment discharge trom thin soils and deep wedges, using data trom table 1. The average soil depth in the Rock Creek
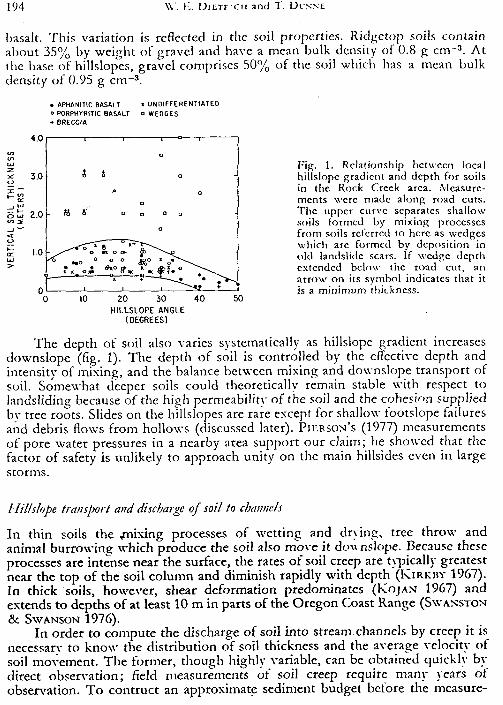
Table 1. Summary ot creep rates and sediment yields trom steep, wet catchments with an undisturbed lorest cover.
Source Total depth Average Gradient Annual of movement soil creep precipitation (m) (mm/yr) (mm/yr)
SWANS TON & 7.3 10.9 0.15 1500-2500 SWANSON (1976) 7.3 10.7 0.20
5.6 7.1 0.15 5.2 11.7 0.30 2.6 10.4 0.30
tallow soils LEWIS (1976) 0.38 2.3 0.35 4500
0.45 1.8 0.32 3050 liYLES & Ho (1970 0.40 3.2 0.18 2540
>urce v Suspended Drainage Runoff Location sediment yield ( t /km'/yr)
area (km*)
(mm/yr)
D U N N E (unpublished 18.3 108 150 Kenya data) 20.0 157 182
22.2 98 278 26.1 62 352
DOUGLAS (1967) 1 - 8 0 " sma l l " 9 0 - 3 0 0 0 Eastern Australia
I.EAI (1966) 4.4** 2.7 300 Colorado 2.6** 1.2 300
FREOERIKSEN (1970) 28.6 0.6 1500-2000 Cascade Mts. , Oregon
* "Old landslide deposi ts" , gradients unpublished (SWANSTON & SWANSON, personal communication). ** Total sediment yield.
196 W. V.. Dnmici i and T. DI'NNE
basin is 0.8 m, the bulk density of soil discharging into the channel is 0.95 t m - 3
and the average annual sediment discharge from shallow soils is (0.8 m) x (0.95 t nr-3) x (0.0025 m" y ') v (119,215 m of hillside 16.2 km 2)
-. 14.0 t km 2 y • Shallow soils discharge into channels primarily bv small failures caused bv undercutt ing ot the hillside. Occasional large tootslopc tailurcs occur. Typically these slides leave scars which are elongate parallel to the channel and rareb•affect more than 30 m of hillside adjacent to the channel.
Wedge soils arc on average about 2 m thick and have a bulk density ot 1.1 t n r 3 . They probably creep at about 0.010 m y _ l (table 1), supplying sediment to channels at the rate of
(2.0 m) x ( h i t n v 3 ) X (0.010 m y ' ) •: (12,640 m 16.2 k m 2 ) -= 17.2 t k m - 2 y - 1
Wedge soils discharge into the channel by Ircqucnt small failures along the base ot the slope and by infrequent but spectacular debris flows which may extend more than 70 m up the hillslope. T h e local acceleration ot soil discharge by debris flow from a wedge is counterbalanced by a long period ot diminished contribution from the slide scarp as the wedge is rctormed bv creep discharge from adjacent hillsides. Dur ing the early stages of filling, some soil is washed into the channel (see later), but with this relatively small exception, the rare debris Hows simply transport material which would otherwise move by deep soil creep and which is included in the last calculation.
T h e total soil discharge into the channel bv creep is 31.2 t km 2 v '. T h e steepness of the basin and the widespread occurrence of bedrock in the vallev floors indicate that there is no long-term aggradat ion ot sediment within the catchment. Therefore , the creep rate should equal the total sediment vield at the mou th of the basin. T h e few measurements we could find from undisturbed forested watersheds, listed in table 1, show that our estimate ot sediment yield is reasonable. In part icular , o u r results compare well with the 35 t km 2 y ' from A N D E R S O N ' S (1954) map of suspended load discharge in this part of western Ore gon and wi th 28.6 t k m - 2 y 1 reported by FRLURIKSI .N (1970) from a small basin in the Cascade Mts . of O r e g o n .
Role of debris flows
In spite of heavy rains and steep slopes, landslides high on valley sides arc rare. Th i s is due in par t to the cohesion provided by the numerous tree roots which penetrate the th in soil co lumn and anchor the soil t o the underlying bedrock (SWANSTON 1970). Also, the coarse textured soils are extremely permeable (Yi:i:. & H A R R 1977) and readily t ransmit water, prevent ing the bui ldup of high pore water pressures on the valley sides. In contrast , small slides are common along the base of slopes where soils are undermined by streams.
Hillslope failures are usually initiated in partially filled hollows border ing the channel . Hol lows occur in the headwaters of all first-order channels and on hillsides a long channels of any order . These unchanneled swales tvpicallv are filled wi th a regoli th 3 m thick. As a result of their subsurface topography, hol lows
>t JiJiH in hi. J L ' i : i< >t .1 sm.ill c . in l . j i . t ; ii t T « in< MIHI.IHU HIS U-I r.iin 1 0 ?
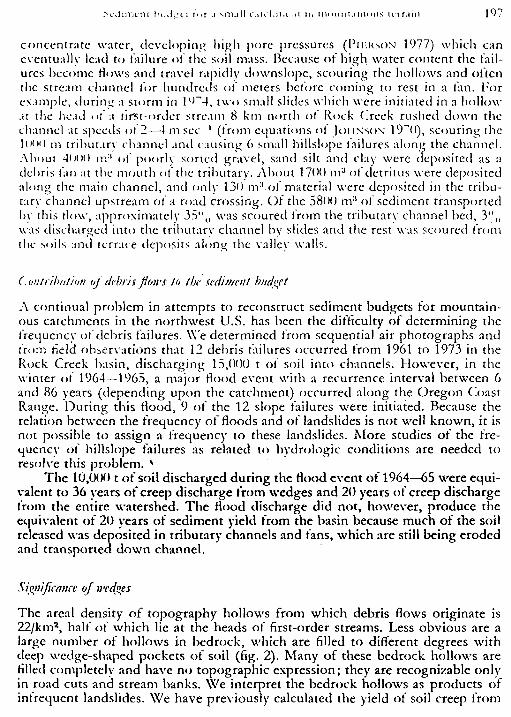
concentrate water, developing high pore pressures (PII-.RSON 1977) which can eventually lead to failure of the soil mass. Because of high water content the failures become flows and travel rapidly downslope, scouring the hollows and often the stream channel for hundreds of meters before coming to rest in a tan. For example, during a storm in 1°~4, two small slides which were initiated in a hollow at the head ot a tirst-order stream 8 km north ot Rock ("reek rushed down the channel at speeds ol 2—1 m sec ' (trom equations ot | o n \ s o x 19^0), scouring the liKiil m tributary channel and causing 6 small hillslope failures along the channel. About 4000 m:l of poorly sorted gravel, sand silt and clay were deposited as a debris fan at the mouth of the tributary. About 1700 ma ot detritus were deposited along the main channel, and only 130 m;l ot material were deposited in the tributary channel upstream of a road crossing. Ot the 5800 m3 of sediment transported In this flow, approximately 35" 0 was scoured trom the tributary channel bed, 3",, was discharged into the tributary channel by slides and the rest was scoured trom I he soils and terrace deposits along the vallev walls.
Contribution ofdebris flows to the sediment budget
A continual problem in attempts to reconstruct sediment budgets for mountainous catchments in the northwest U.S. has been the difficulty of determining the frequency of debris failures. \\"e determined from sequential air photographs and from field observations that 12 debris failures occurred from 1961 to 1973 in the Rock Creek basin, discharging 15,000 t of soil into channels. However, in the winter ot 1964—1965, a major flood event with a recurrence interval between 6 and 86 years (depending upon the catchment) occurred along the Oregon Coast Range. During this flood, 9 of the 12 slope failures were initiated. Because the relation between the frequency of floods and of landslides is not well known, it is not possible to assign a frequency to these landslides. More studies of the frequency of hillslope failures as related to hydrologic conditions are needed to resolve this problem. v
The 10,000 t of soil discharged during the flood event of 1964—65 were equivalent to 36 years of creep discharge from wedges and 20 years of creep discharge from the entire watershed. The flood discharge did not, however, produce the equivalent of 20 years of sediment yield from the basin because much of the soil released was deposited in tributary channels and fans, which are still being eroded and transported down channel.
Significance of »vd»es
The areal density of topography hollows from which debris flows originate is 22/km2, half ot which lie at the heads of first-order streams. Less obvious are a large number of hollows in bedrock, which are filled to different degrees with deep wedge-shaped pockets of soil (fig. 2). Many of these bedrock hollows are filled completely and have no topographic expression; they are recognizable only in road cuts and stream banks. We interpret the bedrock hollows as products of infrequent landslides. We have previously calculated the yield of soil creep from
198 W. E. D I E T R I C H and T. DUNNE;
these wedges, and now will consider their origin and role in the sediment budget of the catchment.
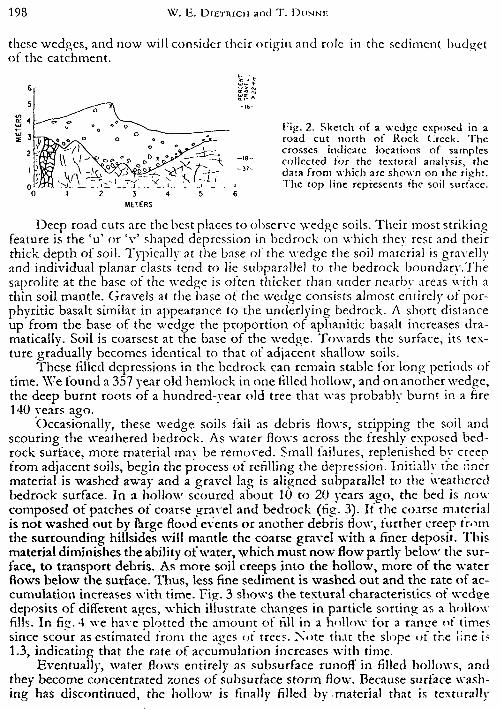
Deep road cuts are the best places to observe wedge soils. Their most striking feature is the 'u' or 'v' shaped depression in bedrock on which thev rest and their thick depth of soil. Typically' at the base of the wedge the soil material is gravelly and individual planar clasts tend to lie subparallel to the bedrock boundary.The saprolite at the base of the wedge is often thicker than under nearby areas with a thin soil mantle. Gravels at the base of the wedge consists almost entirely ot por-phyritic basalt similar in appearance to the underlying bedrock. A short distance up from the base of the wedge the proportion of aphanitic basalt increases dramatically. Soil is coarsest at the base of the wedge. Towards the surface, its texture gradually becomes identical to that of adjacent shallow soils.
These filled depressions in the bedrock can remain stable for long periods of time. We found a 357 year old hemlock in one filled hollow, and on another wedge, the deep burnt roots of a hundred-year old tree that was probably burnt in a fire 140 years ago.
Occasionally, these wedge soils fail as debris flows, stripping the soil and scouring the weathered bedrock. As water flows across the freshly exposed bedrock surface, more material mav be removed. Small failures, replenished by creep from adjacent soils, begin the process of refilling the depression. Initially the nner material is washed away and a gravel lag is aligned subparallel to the weathered bedrock surface. In a hollow scoured about 10 to 20 years ago, the bed is now composed of patches of coarse gravel and bedrock (fig. 3). It the coarse material is not washed out by large flood events or another debris flow, further creep trom the surrounding hillsides will mantle the coarse gravel with a finer deposit. This material diminishes the ability of water, which must now flow partly below the surface, to transport debris. As more soil creeps into the hollow, more of the water flows below the surface. Thus, less fine sediment is washed out and the rate of accumulation increases with time. Fig. 3 shows the textural characteristics of wedee deposits of different ages, which illustrate changes in particle sorting as a hollow fills. In fig- 4 we have plotted the amount of fill in a hollow for a ranee of times since scour as estimated from the ages of trees. Note that the slope ot the line i> 1.3, indicating that the rate of accumulation increases with time.
Eventually, water flows entirely as subsurface runoff in filled hollows, and they become concentrated zones of subsurface storm flow. Because surface washing has discontinued, the hollow is finally filled by material that is texturally
Pig. 2. Sketch of a wedge exposed in a road cut north of Hock Creek. The crosses indicate locations of samples collected for the textural analysis, the data from which are shown on the right. The top line represents the soil surface.
Sediment budget tor a small catchment in nv 'umainous terrain 199
100
1 H B-r-i dk r-m -Th G P S G P S G P S G P S G P S
SAMPLENO 820 -1 B20-5 8 2 0 2 820 -3 821-1
100
r-m n-n rkn FV>, G P S G P S G P S G P S
LOCATION: SOIL DEBRIS F iS
TRIBUTARY MOUTH OF OR FAY ROCK CSiE<
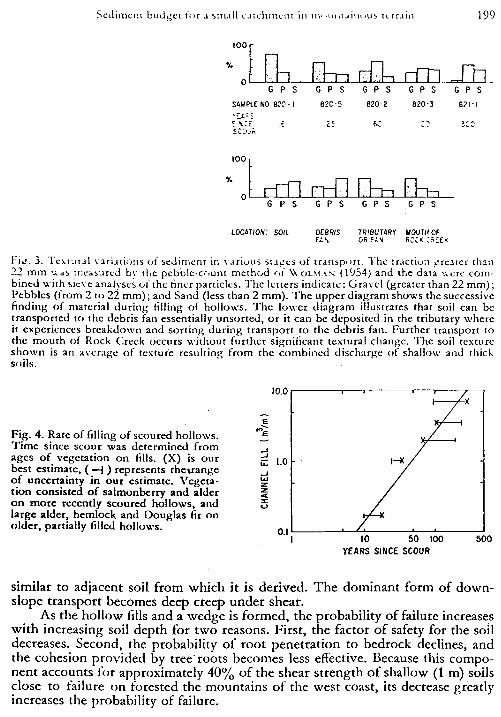
l i t ' . 3. Textur.il variations of sediment in various stages of transport. The fraction jreaier than 22 mm was measured bv the pebble-count method of W ' O L H A S (1954; and the data were combined with sieve analyses of the liner particles. The letters indicate: Gravel (greater than 22 mm); Pebbles (trom 2 to 22 mm) ; and Sand (less than 2 mm). The upper diagram shows the successive finding ot material during filling of hollows. The lower diagram illustrates that soil can be transported to the debris fan essentially unsorted, o r it can be deposited in the tributary where it experiences breakdown and sorting during transport to the debris fan. Further transport to the mouth of Rock Creek occurs without further significant textural change. The soil texture shown is an average of texture resulting from the combined discharge of shallow and thick soils.
Fig. 4. Rate of filling of scoured hollows. Time since scour was determined from ages of vegetation on fills. (X) is our best estimate, ( —| ) represents thevangc of uncertainty in our estimate. Vegetation consisted of salmonberry and alder on more recently scoured hollows, and large alder, hemlock and Douglas fir on older, partially filled hollows.
10.0
£ 1.0
10 50 100 500
YEARS SINCE SCOUR
similar to adjacent soil from which it is derived. The dominant form of down-slope transport becomes deep creep under shear.
As the hollow fills and a wedge is formed, the probability of failure increases with increasing soil depth for two reasons. First, the factor of safety for the soil decreases. Second, the probability of root penetration to bedrock declines, and the cohesion provided by tree roots becomes less effective. Because this component accounts for approximately 40% of the shear strength of shallow (1 m) soils close to failure on forested the mountains of the west coast, its decrease greatly increases the probability of failure.
200 \V. II. Oir.TRic.ii and T. O i \ s r
Whether in the long term a depression grows and becomes a hollow or a channel depends on the credibility of the underlying bedrock and the amount ot subsurface How that it receives. In the catchment a full spectrum ot bedrock depressions exists troni channels to hollows to wedges. It is not clear what eventually determines the number of'permanent' unfilled hollows versus hollows which occasionally tail and then fill.
I'liwial transport
Soil that is discharged into channels may experience immediate sorting when fine material is washed away as suspended or wash load, or it may be carried to a debris fan by a debris torrent and be deposited essentially unsorted. In tig. 3, the average textures of material discharged by soil creep tributary channel sediment, debris fan sediment and floodplain sediment near the mouth ot Rock Creek are compared. Comparison of the texture ot the sediment in the tributary with that of the soil discharged by creep reveals that if few of the particles greater than 22 mm are washed away, about 80" 0 of the original less-than-2-mm si/.c traction must be carried away as suspended load, and about 50% of the 2-to-22 mm size fraction is either carried away as suspended load or quickly breaks down to suspended load size and washes from the channel. The proportions of these two size classes which are thus carried away constitute 50% of the soil that enters the channel.
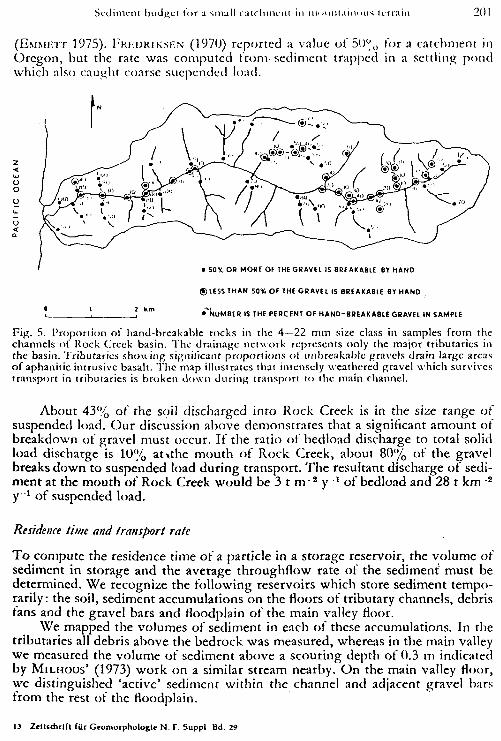
Despite continued transport to the mouth of Rock Creek, channel sediment shows no further textural change because attrition during weathering and transport are approximately balanced by the influx of coarse particles along the stream. There is abundant evidence that attrition is intense. In soils, gravel-size rock fragments are angular, measuring 1.0—1.5 on the POWERS (1953) scale. In tributaries, rounding increases from angular to subangular to subrounded (1.5—2.0). In the main channel rounding increases only slightly from subrounded to rounded (2.5— 3.0). The spatial distribution of gravels of varying degrees of hardness also suggests breakdown of intensly weathered particles. At 68 sites along the channels of the basin, 15 particles ranging in size from 4 to 22 mm were tested for hardness by attempting to break them by hand. A map ot the results (fig. 5) shows that the proportion of hand-breakable gravel generally decreases as drainage increases downstream. Pebble counts of rock tvpes support this observation by showing that although the basin is approximately 80% underlain by porphyritic basalts, 50% of the sediment in the fourth order channel consists of hard aphanitic basalt.
Sand-size sediment in the Rock Creek channel is 86—97% weathered rock fragments and readily breaks down to silt and clay during tumbling experiments, as MOBF.RLY (1968) found for Hawaiian sands. The rate of breakdown of Rock Creek sand in a tumbling mill was 10% reduction of weight in a particular size class in 100 km of'transport ' (DIFTRICH, in preparation) This rate is substantially higher than the value of 0 . 1 % per 100 km reported by KUF.NFN (1960) for quartz and feldspar.
Values typically reported for the ratio of bedload to total solid load discharge are from 5—10% (ROSGF.N, U.S. Forest Service, personal communication on the basts of extensive bedload measurements in the Rocky Mts.) and 10—19%
Sediment budget tor a smal l catchment in ni< HUH.iin< ms terrain 201
(EMMF.IT 1975). FRF.DRIKSP.N (1970) reported a value of 50% for a catchment in Oregon, but the rate was computed from sediment trapped in a settling pond which also caught coarse suepended load.
®IESSTHAN 50% OF THEGRAVEt IS BREAKABtE BTHAND .
, , ' • NUMBER IS THE PERCENT OF HAN0-BREAKA8LE GRAVEL IN SAMPIE
Fig. 5. Proportion of hand-breakable rocks in the 4—22 mm size class in samples from the channels ot" Rock Creek basin. The drainage network represents only the major tributaries in the basin. Tributaries showing significant proport ions ot unbreakable gravels drain large areas of aphanitic intrusive basalt. The map illustrates that intensely weathered gravel which survives transport in tributaries is broken down during transport to the main channel.
About 43% of the soil discharged into Rock Creek is in the size range of suspended load. Our discussion above demonstrates that a significant amount of breakdown of gravel must occur. If the ratio of bedload discharge to total solid load discharge is 10% atxthe mouth of Rock Creek, about 80% of the gravel breaks down to suspended load during transport. The resultant discharge of sediment at the mouth of Rock Creek would be 3 t r r r 2 y~l of bedload and 28 t km 2
y l of suspended load.
Residence time and transport rate
To compute the residence time of a particle in a storage reservoir, the volume of sediment in storage and the average throughflow rate of the sediment must be determined. We recognize the following reservoirs which store sediment temporarily: the soil, sediment accumulations on the floors of tributary channels, debris fans and the gravel bars and floodplain of the main valley floor.
We mapped the volumes of sediment in each of these accumulations. In the tributaries all debris above the bedrock was measured, whereas in the main valley we measured the volume of sediment above a scouring depth of 0.3 m indicated by MILHOUS' (1973) work on a similar stream nearby. On the main valley floor, we distinguished 'active' sediment within the channel and adjacent gravel bars from the rest of the floodplain.
13 Zeitsdulft fur Geumurphulogle N F Suppl Bd 29
202 \V. I'.. O t n R i r n am T. O c v s r
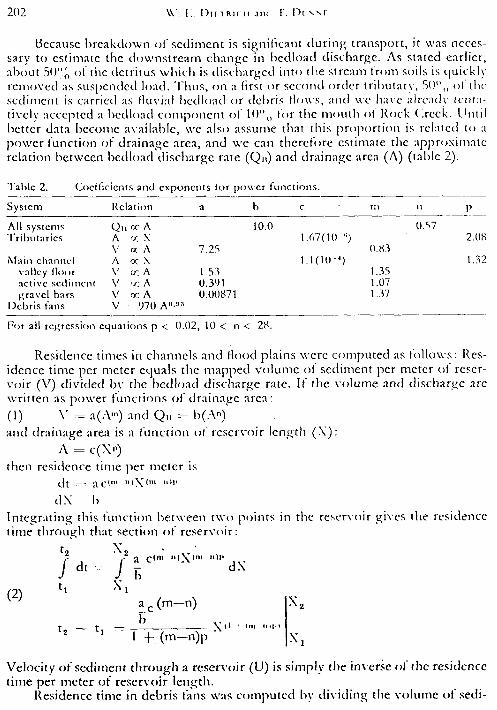
Because breakdown of sediment is significant dur ing transport, it was necessary to estimate the downst ream change in bedload discharge. As stated earlier, about 5 0 % of the detri tus which is discharged into the stream from soils is quickly removed as suspended load. T h u s , on a first or second order tributary, 50",, ot the sediment is carried as fluvial bedload or debris Hows, and we have already tentatively accepted a bedload componen t of 10",, tor the mouth of Rock O c c k . Until better data become available, we also assume that this propor t ion is related to a power function of drainage area, and we can therctore estimate the approximate relation between bedload discharge rate (Qu) and drainage area (A) (table 2).
Tabic 2. Coefficients and exponents tor power (unctions.
System Relation
All systems Qi oc A Tributaries A <* x
V cc A 7.25 Main channel A oz X
valley floor V cr A 1.53 active sediment V <r. A 0.341 gravel bars V cc A 0.00871
Debris tans V 970 A"-9'-'
10.0 0.57 1.67(10 '•)
1.1(10 <) 0.83
1.35 1.07 1.37
2.08
1.32
For all regression equations p < 0.02, 10 < n < 28.
Residence times in channels and Hood plains were computed as follows: Residence time per meter equals the mapped volume ot sediment per meter ot reservoir (V) divided bv the bedload discharge rate. If the volume and discharge are written as power functions of drainage area: (1) V r= a(A'») and Q „ ^ b(A")
and drainage area is a function ot reservoir length ( X ) :
A " = C ( X » )
then residence time per meter is dt :—: aC (m ">X<m "'I1
dX b Integrat ing this function between two points in the reservoir gives the residence time th rough that section of reservoir :
t2 X , ^ ' . ,. o c( , n » l \ ( n l "II" dX
(2) X,
t , — t .
a c ( m - n )
b
I -f (m—n)p X'1
X,
N'i
Velocity of sediment t h r o u g h a reservoir (U) is simply the inverse ot the residence t ime per meter of reservoir length.
Residence time in debris fans was computed by dividing the volume of sedi-
Sediment budget 1 * i r .» sm.ill r.iU I in it nt in m< HIIH.UIII »us terrain 203
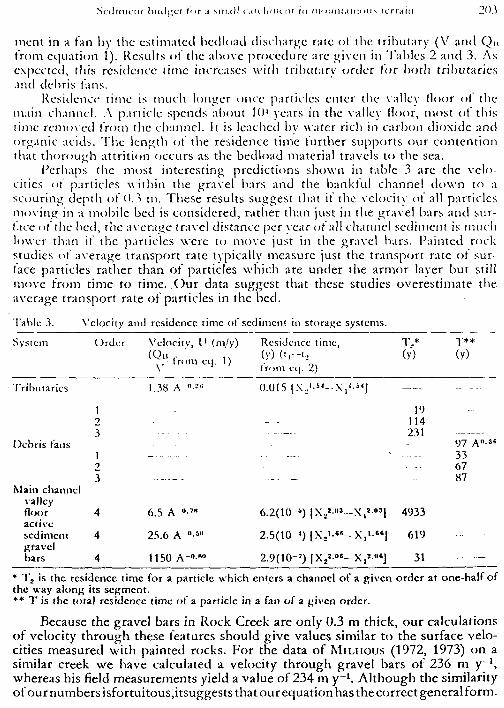
ment in a fan by the estimated bcdload discharge rate ot the tributary (V and QH from equation 1). Results of the above procedure are given in Tallies 2 and 3. As expected, this resilience time increases with tributary order tor both tributaries and debris fans.
Resilience time is much longer once particles enter the valley floor ot the main channel. A particle spends about HI1 years in the valley floor, most ot this time removed from the channel. It is leached bv water rich in carbon dioxide and organic acids. The length of the residence time turther supports our contention that thorough attrition occurs as the bedload material travels to the sea.
Perhaps the most interesting predictions shown in table 3 are the velocities <>t particles within the gravel bars and the banktul channel down to a scouring depth of 0.3 m. These results suggest that it the velocity ot all particles moving in a mobile bed is considered, rather than just in the gravel bars and sur-tace ot the bed, the average travel distance per vear of all channel sediment is much lower than if the particles were to move just in the gravel bars. Painted rock studies of average transport rate typically measure just the transport rate ot surface particles rather than of particles which are under the armor layer but still move from time to time. .Our data suggest that these studies overestimate the average transport rate of particles in the bed.
Tabic 3. Velocity and residence time of sediment in storage systems.
System Order Velocity, V (m/y) Residence time, T„* Y**
(Qi. , ' 1) (y ) ( t , -t. (y) (y)
•-,— Irom ei . 1) V Irom ce|. 2)
Tributaries
1 2 3
1.38 A " - 2 0 0.015 IX^-S ' -X , 1 -" ]
19 114 231
.
Debris lans 97 A"-3f
1 . — 33 2 - .- - .. .. 67 3 . _. _. 87
Main channel valley fl<x>r 4 6.5 A "•'" 6.2(10 h) I X ^ - ^ - X , 1 - 0 1 ! 4933 active sediment 4 25.6 A "•*" 2.5(10 ' J l X . ' - ^ ' - X , ' , « « i 619 ._ . . gravel bars 4 1150 A-°-»" 2.9(10-') [ X j ' - ^ - X , ' .061 31
* T, is the residence time for a particle which enters a channel of a given order at one-half of the way along its segment. ** T is the total residence time of a particle in a fan of a given order.
Because the gravel bars in Rock Creek are only 0.3 m thick, our calculations ot velocity through these features should give values similar to the surface velocities measured with painted rocks. For the data of MILHOUS (1972, 1973) on a similar creek we have calculated a velocity through gravel bars of 236 m y_1, whereas his field measurements yield a value of 234 m y_1. Although the similarity ot our numbers isfortuitous.itsuggests that our equation has the correct general form.
204 W . I-.. D i h i R K ii ami T- D I N N I
Denudation and soil formation
The rate ot lowering in the Rock Creek basin is
di," where \, is tlic lowering rate in m y ', Qs is the solid load discharge in I m 2
and Q D is the dissolved load discharge in t m 2 y -'. The average bedrock density (db) is approximately 2.5 t m 3. The solid load discharge equals the creep discharge of 31.2 t km - 2 y-1 and the measured dissolved load is 52.5 t km - 2 y 1 . The lowering rate of the bedrock is 33.5 mm 10~3 y_1.
We have assumed jhat the processes and products in this basin area arc in approximate equilibrium. Therefore, for a point on the hillside, the soil thickness is constant through time. The total volume of soil in the basin, divided by the discharge rate should indicate the average residence time of soil on the hillsides. For the Rock Creek basin, the erosion rate by creep for an 0.8 m thick soil with a bulk density of 0.8 t m ;l (the average value for the whole soil mantle) is 20,500, equivalent to a soil lowering rate of 39 mm 10~3 y 1 .
The lowering rate for the soil is 16"0 greater than that calculated ior the bedrock. This discrepancy may be within the errors in our procedures, but the rate of soil lowering should exceed that ot the bedrock because of the expansion that takes place when saprolitc and weathered bedrock are torn up by biogenic mixing processes. In Rock Creek basin the average bulk density ot saprolite is 1.0 t m 3 and that of overlying soil is 0.8 t irr3 . Some of this density change is due to dissolution during the 20,500 years the soil is on a hillside, and the rest results from mechanical disruption by tree roots.
Summary
In tig. 6 we summarize the significant processes controlling the sediment budget in Rock Creek basin. The diagram emphasizes the importance ot the linkages that must be identified before one can use information from measurements of individual processes. The definition of the linkages requires intensive held investigation to estimate the frequency of catastrophic processes such as debris flows, to define the magnitude of sediment stores and to recognize subtle features such as hollows filled with wedge soils.
We have developed an approximate sediment budget based upon field mapping and process rates estimated from other studies. This approximation indicates where our emphasis should be placed when installing instruments to monitor various processes.
A good estimate of rates of soil creep is vital in a basin in this region, but transport in the wedge soils is so important that a special effort must he made to monitor deep creep as well as the more widespread and easily measured shallow movement.
Slides and slumps are not widespread, except for the small failures in the stream banks, and warrant less attention. Debris flows, however, are extremely
Sediment budget lor a sni.il! catchment in mountainous terrain 205
H MIXING. |_ *£ATH£RING J
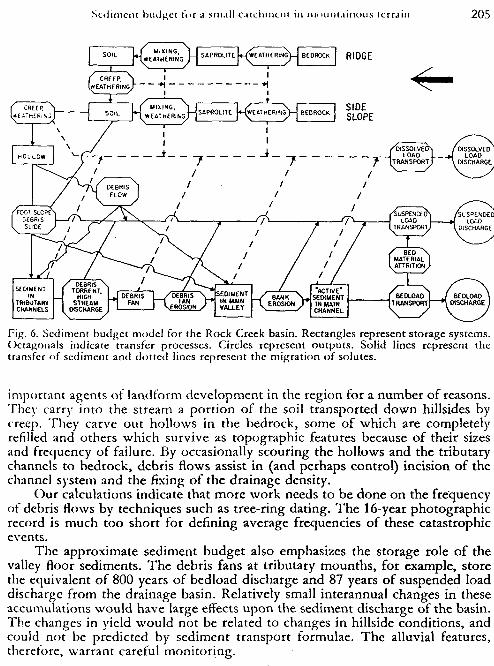
Fig. 6. Sediment budget model for the Rock Creek basin. Rectangles represent storage systems. Octagonals indicate transfer processes. Circles represent outputs . Solid lines represent the transfer of sediment and dotted lines represent the migration of solutes.
important agents of landform development in the region for a number of reasons. They carry into the stream a portion of the soil transported down hillsides by creep. They carve out hollows in the bedrock, some of which are completely refilled and others which survive as topographic features because of their sizes and frequency of failure. By occasionally scouring the hollows and the tributary channels to bedrock, debris flows assist in (and perhaps control) incision of the channel system and the fixing of the drainage density.
Our calculations indicate that more work needs to be done on the frequency of debris flows by techniques such as tree-ring dating. The 16-year photographic record is much too short for defining average frequencies of these catastrophic events.
The approximate sediment budget also emphasizes the storage role of the valley floor sediments. The debris fans at tributary mounths, for example, store the equivalent of 800 years of bedload discharge and 87 years of suspended load discharge from the drainage basin. Relatively small interannual changes in these accumulations would have large effects upon the sediment discharge of the basin. The changes in yield would not be related to changes in hillside conditions, and could not be predicted by sediment transport formulae. The alluvial features, therefore, warrant careful monitoring.
206 W . H. D l l . T R I C I ' . l iui 1 . Dt'N'N'l
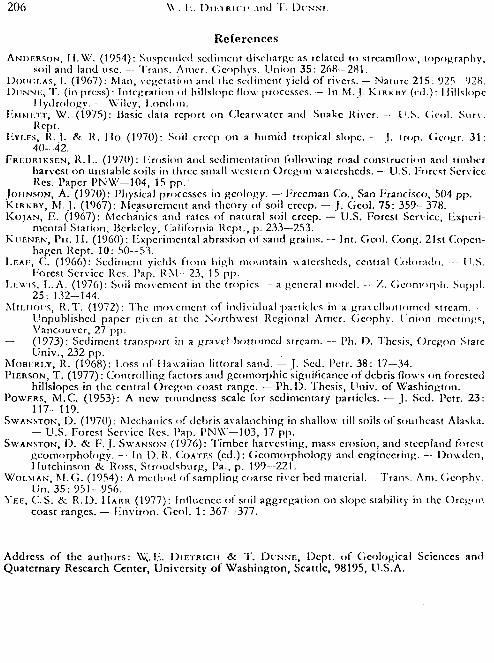
R e f e r e n c e s
AN»F.RSON, M.W. (1954): Suspended sediment discharge as related to strcamllow, topography, soil and land use. — Trans. Artier. Gcophys. Union 35: 268—281.
Donei.AS, I. (1967): Man, vegetation ami the sediment yield of rivers. — Nature 215: 925 928. DUNNK, T. (in press): Integration of hillslopc flow processes. — In M. J. KIRKHY (ed.): 1 lillslopc
Hydrology. — Wiley, London. r .MniiT, W. (1975): basic data report on Clearwater ami Snake River. — U.S. Gcol. Surv.
Kept. F.YLFS, R. 1. & R. 1 lo (1970): Soil creep on a humid tropical slope. - |. Irop. Gcogr. 3 1 :
4 0 - 4 2 . FRI.DRIKSF.N, R.L. (1970): Erosion and sedimentation following road construction and timber
harvest on unstable soils in three small western Oregon watersheds. — U.S. Forest Service Res. Paper P N W - 1 0 4 , 15 pp.
JOHNSON, A. (1970): Physical processes in geology. — Freeman Co., San Francisco, 504 pp. KIRKBY, M.J . (1967): Measurement and theory of soil creep. — J. Gcol. 75: 359—378. K O J A N , 12. (1967): Mechanics and rates of natural soil creep. — U.S. Forest Service, Experi
mental Station, Berkeley, California Kept., p. 233—253. KtiF.NF.N, Pn. 11. (1960): Experimental abrasion of sand grains. — Int. Gcol. Cong. 21st Copen
hagen Rcpt. 10: 50--53. I.F.AI", C. (1966): Sediment yields from high mountain watersheds, central Colorado. - U.S.
Forest Service Res. Pap. R.\l 23, 15 pp. 1.1 wis, I..A. (1976): Soil movement in the tropics - a general model. — /.. Geomorph. Suppl.
25 : 132-144. MiLiioi's, R.T. (1972): The movement of individual particles in a gravelbottomed stream. -
Unpublished paper given at the Northwest Regional Amer. Gcophy. Union meetings, Vancouver, 27 pp.
— (1973): Sediment transport in a gravel-bottomed stream. — Ph. D. Thesis, Oregon State Univ., 232 pp.
MOBF.RLY, R. (1968): Loss of Hawaiian littoral sand. — J. Sed. Petr. 38: 17—34. PIF.RSON, T. (1977): Controlling factors and gcomorphic significance of debris flows on forested
hillslopes in the central Oregon coast range. — P h . D . Thesis, Univ. of Washington. POWERS, M.C. (1953): A new roundness scale for sedimentary particles. — 1. Sed. Pctr. 2 3 :
117-119. SWANSTON, D. (1970): Mechanics of debris avalanching in shallow till soils of southeast Alaska.
— U.S. Forest Service Res. Pap. PNW —103, 17 pp. SWANSTON, D. & F.J . SWANSON (1976): Timber harvesting, mass erosion, and steepland forest
geomorphology. — In D.R. COATES (cd.): Gcomorphology and engineering. — Dowdcn, Ilutchinson & Ross, Stroudsburg, Pa., p . 199—221.
WOLMAN, M.Ci. (1954): A method of sampling coarse river bed material. -Trans. Am. Gcophv. Un. 3 5 : 9 5 1 - 9 5 6 .
Y E E , C.S. & R.D. H A R R (1977): Influence of soil aggregation on slope stability in the Oregon coast ranges. — 12nviron. Gcol. 1: 367—377.
Address of the authors : W. 12. D I E T R I C H &. T. D I ' N N E , Dept. of Geological Sciences and Quaternary Research Center, University of Washington, Seattle, 98195, U.S.A.

![hawaii's rainwater catchment services directory - ctahr directory... · [ Page 1 ] Hawaii’s Rainwater atchment Services Directory HAWAII’S RAINWATER CATCHMENT SERVICES DIRECTORY](https://img.pdfslide.tips/doc/110x75/5a81030c7f8b9a38478ceb57/hawaiis-rainwater-catchment-services-directory-ctahr-directory-page-1-hawaiis.jpg)