Embed Size (px)
Citation preview

SEISMIC DATA PROCESSING REPORT
for
Origin Energy
Survey: 2005 Shearwater 2D Survey & Reprocessing
Location: T/18P, Bass Strait, Offshore Northern Tasmania
Date: July 2007
Fugro Seismic Imaging Pty Ltd69 Outram Street
WEST PERTH WA 6005Tel: +61 (0)8 9322 2490Fax: + 61 (0)8 9481 6721
Email: info@fugrofsi.com.au

Table of Contents
1 Introduction...................................................................................................................................... .............11.1 Personnel............................................................................................................................................. .11.2 Location Map (Shearwater 2D & 3D)..................................................................................... ...............21.3 Location Map (T/18P 2006 Reprocessing)............................................................................................ 31.4 Tape Listing (Shearwater 2D Survey)......................................................................................... ..........41.5 Line Listing (Shearwater 2D Survey)............................................................................... .....................51.6 Line Listing (Reprocessing).......................................................................................... ........................7
2 Acquisition Parameters .................................................................................................................... ............92.1 2005 Shearwater 2D Survey.......................................................................................................... .......92.2 2001 Shelduck 2D Survey.......................................................................................... ........................102.3 1996 Hummock 2D Survey.................................................................................................... .............112.4 1994 Rocky Cape Survey................................................................................................. ..................122.5 1985B Amoco 2D Survey.......................................................................................... ........................132.6 1982 B.M.R. 2D Survey..................................................................................................... .................14
3 Parameter Testing................................................................................................................ ......................154 Processing Sequence Diagram........................................................................................ ..........................165 Processing Description............................................................................................................. ..................17
5.1 Transcription......................................................................................................................... ..............175.2 NavigationSeismic Merge..................................................................................................... .............175.3 Gain Recovery...................................................................................................................... ..............175.4 Bulk Static Shift................................................................................................................................ ...175.5 Low Cut Filter................................................................................................................................... ...175.6 Swell Noise Attenuation.......................................................................................................... ............185.7 Random Spike Attenuation............................................................................................... ..................185.8 Instrument Dephase and Source Designature....................................................................... .............185.9 TauP Linear Noise Removal ..................................................................................................... ........195.10 SRME........................................................................................................................ .......................195.11 Taup Linear Transformation & Predictive Deconvolution........................................................... ......195.12 Receiver Array Simulation and Decimation..................................................................................... ..205.13 CDP Gather................................................................................................................... ...................205.14 First Pass Velocity Analysis................................................................................................ ..............215.15 (High Resolution) Radon Multiple Attenuation............................................................... ...................215.16 Remove Gain Recovery............................................................................................................. .......235.17 Spherical Divergence (Ursin).............................................................................................. ..............235.18 Surface Consistent Amplitude Recovery.......................................................................................... .235.19 PreStack Time Migration (Velocity Analysis)................................................................ ...................245.20 Second Pass Velocity Analysis................................................................................................ .........245.21 Final PreStack Time Migration..................................................................................................... ....255.22 Final Pass Velocity Analysis.......................................................................................... ...................255.23 Radon Multiple Attenuation (Residual Demultiple)........................................................................ ....255.24 NMO Correction...................................................................................................................... ..........275.25 Outer Trace Mute.......................................................................................................................... ....275.26 Angle Mute Stacks.................................................................................................................. ..........28
Processing Report : 20052006 Braveheart 2D Survey

5.27 AVO Attributes................................................................................................................... ...............285.28 Common Depth Point Stack............................................................................................................ ..295.29 Statics................................................................................................................................... ............295.30 FX Deconvolution ..................................................................................................... ......................295.31 Inverse Qfiltering.................................................................................................. ...........................305.32 Band Pass Filter..................................................................................................... ..........................305.33 Scaling.................................................................................................................................. ............315.34 PhaseMatching...................................................................................................................... ..........315.35 SEGY Archive.......................................................................................................................... .........31
6 Polarity Statement........................................................................................................... ...........................327 Archive Listing.................................................................................................................. ..........................338 FarField Signature Listing.................................................................................................................. ........369 SEGY Header Information....................................................................................................... ...................38
9.1 SEGY EBCDIC Line Header Information................................................................................ ............389.2 SEGY Trace Header Definition............................................................................................. ..............39
10 Data Disposition................................................................................................................................... .....4011 Appendix........................................................................................................................................... ........41
11.1 SPCDP Relationships – Shearwater 2D Survey..................................................................... .........4111.2 SPCDP Relationships – 82BMR Reprocessing Vintage.......................................................... .......4211.3 SPCDP Relationships – BHB96 Reprocessing Vintage.................................................................. .4311.4 SPCDP Relationships – ORS01 Reprocessing Vintage................................................ ..................4411.5 SPCDP Relationships – SB94A Reprocessing Vintage............................................................. ......4411.6 SPCDP Relationships – TQH5 Reprocessing Vintage............................................. .......................4511.7 Example Displays (Shearwater 2D Survey)......................................................................... .............4611.8 Example Displays (2D Reprocessing)............................................................................................... 48
Processing Report : 20052006 Shearwater 2D & Reprocessing Page3


1 IntroductionThe Shearwater 2D Seismic Survey was recorded by P.G.S. using the M/V Orient Explorer towing 4 X 4350 m streamers with100 m separation and a single gun array. The 2D data were acquired concurrently with the Shearwater 3D Seismic Survey during November and December 2005. A total of 202.50 km of sail line kilometres was acquired, comprised of 15 lines. The survey is located in Tasmanian permit: T/18P in the Bass Basin, offshore from the north coast of Tasmania.
In addition to the newly acquired data, a total of 1366 kilometres of prestack reprocessing were incorporated into the survey. Data for the prestack reprocessing field data arrived in staggered shipments as it had to be procured from several data repositories. Some prestack data could not be sourced and these lines were deleted from the processing list.
Testing for the Shearwater Survey was comprehensive with attention paid to multiple and noise removal, amplitude preservation, and phasematching of the differing data vintages. All testing results were presented in Powerpoint format and delivered with SEGY files where required. All velocity QC files were copied to DVD media and sent to Origin's office in Brisbane where a MGIVA velocity QC system had been installed by Fugro Seismic Imaging..
Cable 2 data was used for velocity generation and analysis for each of the 2005 2D acquisition lines. The remaining cables were NMO corrected using the picks from the cable 2 inline.
Once production processing commenced the focus was on accurate velocity estimation. Three passes of analyses were performed and the picks checked by Origin Energy.
All processing was undertaken at Fugro Seismic Imaging's office in Perth, Western Australia.
1.1 PersonnelFugro Seismic Imaging Pty LtdSimon Stewart Marine 2D ManagerJohn van Kampen Senior GeophysicistC.K. Ong Senior Geophysicist
Origin EnergyRandall Taylor Chief GeophysicistMike Lonergan Staff GeophysicistDarren Rutley Staff Geophysicist
Processing Report : 20052006 Shearwater 2D & Reprocessing Page1

1.2 Location Map (Shearwater 2D & 3D)
Figure 1: Shearwater 2D and 3D line location map.
Processing Report: 20052006 Shearwater 2D Survey & Reprocessing Page2
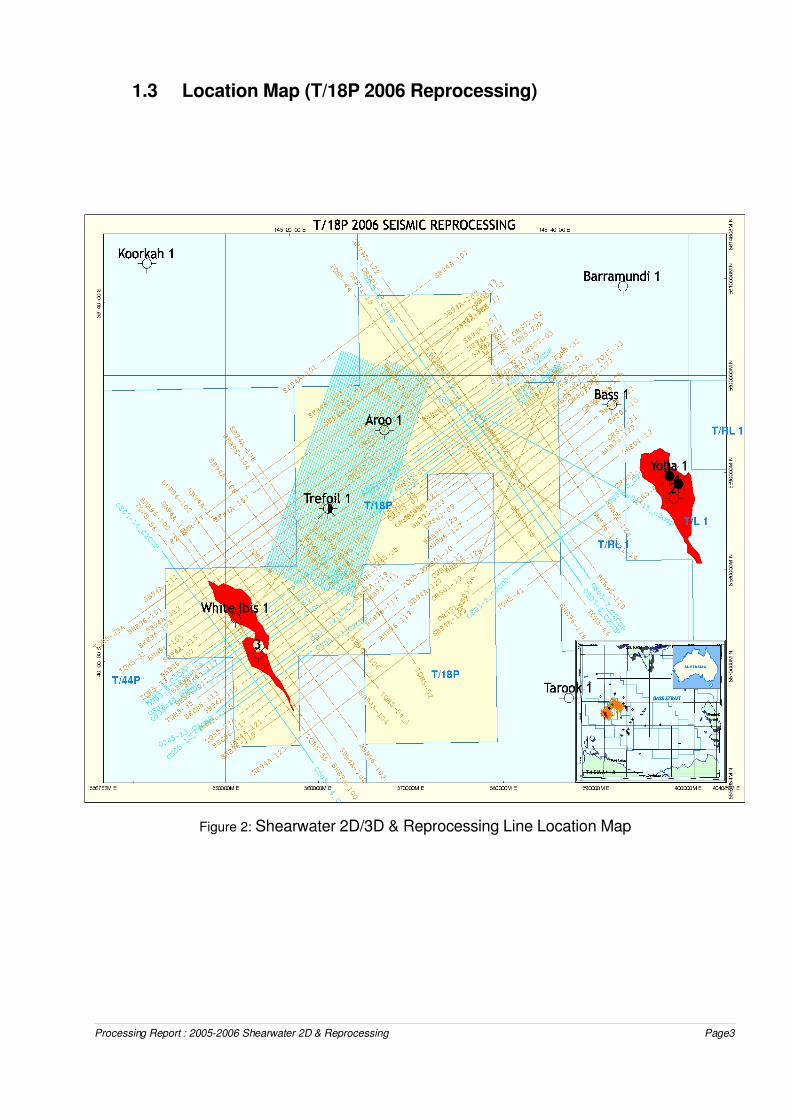
1.3 Location Map (T/18P 2006 Reprocessing)
Figure 2: Shearwater 2D/3D & Reprocessing Line Location Map
Processing Report : 20052006 Shearwater 2D & Reprocessing Page3

1.4 Tape Listing (Shearwater 2D Survey)
Line information has only been listed for the 2D component of the 2005 Shearwater Survey. For information regarding the 3D lines please refer to the separate Seismic Data Reprocessing Report for the 3D Shearwater Survey.
Processing Report: 20052006 Shearwater 2D Survey & Reprocessing Page4
Tape No. Seq FFID FSP FGSP LFID LSP LGSP39732 OS2D2007P1001 1 1 840 840 951 9 1339733 OS2D2015P1002 2 100 100 100 652 631 62739871 OS2D3014P1067 67 2011 1020 1020 2085 946 94639872 OS2D3014P1067 67 2086 945 945 2998 33 3339873 OS2D3014P1067 67 2999 32 32 3018 13 1339874 OS2D3010P1068 68 6000 420 420 529 9 1339875 OS2D3013P1069 69 100 100 100 531 511 50739876 OS2D3009P1070 70 100 420 420 530 9 1339877 OS2D3011P1071 71 100 100 100 531 511 50739898 OS2D2006P1083 83 100 101 101 1012 1000 100039899 OS2D2006P1083 83 1013 1001 1001 1373 1351 134739900 OS2D2005P1084 84 100 100 100 532 511 50739901 OS2D3012P1085 85 101 100 100 532 511 50739902 OS2D2003P1086 86 100 100 100 531 511 50739903 OS2D2001P1087 87 100 420 420 230 300 30039904 OS2D2001P1087 87 232 298 298 530 9 1339905 OS2D2004P1088 88 100 100 100 356 346 34639906 OS2D2004P1088 88 358 348 348 531 511 50739907 OS2D2002P1089 89 100 420 420 531 9 1339908 OS2D3008P1090 90 100 420 420 531 9 13
Line/Seq.No.

1.5 Line Listing (Shearwater 2D Survey)
LINE NAME First SP Last SP Length (Km)
OS2D2001S2c1 420 13 10.200
OS2D2001S2c2 420 13 10.200
OS2D2001S2c3 420 13 10.200
OS2D2001S2c4 420 13 10.200
OS2D2002S2c1 420 13 10.200
OS2D2002S2c2 420 13 10.200
OS2D2002S2c3 420 13 10.200
OS2D2002S2c4 420 13 10.200
OS2D2003S2c1 100 507 10.200
OS2D2003S2c2 100 507 10.200
OS2D2003S2c3 100 507 10.200
OS2D2003S2c4 100 507 10.200
OS2D2004S2c1 100 507 10.200
OS2D2004S2c2 100 507 10.200
OS2D2004S2c3 100 507 10.200
OS2D2004S2c4 100 507 10.200
OS2D2005S2c1 100 507 10.200
OS2D2005S2c2 100 507 10.200
OS2D2005S2c3 100 507 10.200
OS2D2005S2c4 100 507 10.200
OS2D2006S2c1 102 1347 31.150
OS2D2006S2c2 102 1347 31.150
OS2D2006S2c3 102 1347 31.150
OS2D2006S2c4 102 1347 31.150
OS2D2007S2c1 840 13 20.700
OS2D2007S2c2 840 13 20.700
OS2D2007S2c3 840 13 20.700
OS2D2007S2c4 840 13 20.700
OS2D2015S2c1 100 627 13.200
OS2D2015S2c2 100 627 13.200
OS2D2015S2c3 100 627 13.200
OS2D2015S2c4 100 627 13.200
OS2D3008S2c1 420 13 10.200
Processing Report : 20052006 Shearwater 2D & Reprocessing Page5

LINE NAME First SP Last SP Length (Km)
OS2D3008S2c2 420 13 10.200
OS2D3008S2c3 420 13 10.200
OS2D3008S2c4 420 13 10.200
OS2D3009S2c1 420 13 10.200
OS2D3009S2c2 420 13 10.200
OS2D3009S2c3 420 13 10.200
OS2D3009S2c4 420 13 10.200
OS2D3010S2c1 420 13 10.200
OS2D3010S2c2 420 13 10.200
OS2D3010S2c3 420 13 10.200
OS2D3010S2c4 420 13 10.200
OS2D3011S2c1 100 507 10.200
OS2D3011S2c2 100 507 10.200
OS2D3011S2c3 100 507 10.200
OS2D3011S2c4 100 507 10.200
OS2D3012S2c1 100 507 10.200
OS2D3012S2c2 100 507 10.200
OS2D3012S2c3 100 507 10.200
OS2D3012S2c4 100 507 10.200
OS2D3013S2c1 100 507 10.200
OS2D3013S2c2 100 507 10.200
OS2D3013S2c3 100 507 10.200
OS2D3013S2c4 100 507 10.200
OS2D3014S2c1 1020 13 25.200
OS2D3014S2c2 1020 13 25.200
OS2D3014S2c3 1020 13 25.200
OS2D3014S2c4 1020 13 25.200
Total Length: 809.800 km
Processing Report: 20052006 Shearwater 2D Survey & Reprocessing Page6

1.6 Line Listing (Reprocessing)
LINE NAME First SP Last SP Length (Km)
82BMR17 1 460 15.318
BHB96100 1001 2187 27.135
BHB96101 1001 2370 31.318
BHB96102 2105 917 27.181
BHB96103 2713 917 41.079
BHB96104 1250 917 7.635
BHB96105 2710 917 41.011
BHB96107 1000 2792 40.988
BHB96109 1558 917 14.676
BHB96111 1001 1666 15.225
BHB96113 1586 917 15.316
BHB96115 1004 1654 14.882
BHB96117 1503 917 13.419
BHB96118 1171 2219 23.980
BHB96119 1001 1598 13.670
BHB96120 1875 917 21.923
BHB96121 1001 1534 12.207
BHB96122 1001 1610 13.945
BHB96123 1616 917 16.002
BHB96124 1523 917 13.876
BHB96125 1615 917 15.979
BHB96127 1001 1698 15.956
BHB96129 1510 917 13.579
ORS0101 1802 1190 11.494
ORS0102 1450 2144 13.031
ORS0103 1260 2091 15.600
ORS0104 2014 1300 13.406
ORS0105 1150 1984 15.656
ORS0106A 1000 1984 18.469
ORS0107 1150 1985 15.675
ORS0108 1160 1986 15.506
ORS0109 1801 1070 13.725
ORS0110 1828 870 17.981
Processing Report : 20052006 Shearwater 2D & Reprocessing Page7

LINE NAME First SP Last SP Length (Km)
ORS0111 1748 870 16.481
ORS0112 1540 2518 18.356
ORS0113_A 2707 869 34.481
ORS0114 2548 1350 22.481
ORS0115A 1000 2198 22.481
ORS0116 1801 870 17.475
ORS0117 1460 2331 16.350
SB94A101 270 798 13.225
SB94A102 111 1110 25.000
SB94A103 640 200 11.025
SB94A104 1010 170 21.025
SB94A105 310 717 10.200
SB94A106 111 790 17.000
SB94A107 111 1138 25.700
SB94A108 300 31 6.750
SB94A109 670 320 8.775
SB94A111 1494 31 36.600
SB94A113 111 1647 38.425
SB94A115 111 700 14.750
SB94A117 557 31 13.175
SB94A119 554 31 13.100
SB94A121 111 805 17.375
SB94A122 320 988 16.725
SB94A123 720 31 17.250
TQH529A 1 1610 48.300
TQH531 240 1930 50.730
TQH533 600 2400 54.030
TQH535 1060 1760 21.030
TQH537A 930 1593 19.920
TQH541 1000 1400 12.030
TQH544 1500 2800 39.030
TQH552 400 810 12.330
TQH5541 1 450 13.500
TQH556 1650 2447 23.940
Total Length: 1365.89
Processing Report: 20052006 Shearwater 2D Survey & Reprocessing Page8

2 Acquisition Parameters
2.1 2005 Shearwater 2D Survey
DESCRIPTION DETAILSData recorded by: P.G.S.Date recorded: November/December 2005Vessel: Orient Explorer
General:Field CMP Interval 6.25 mNominal Fold 87Recording Format: SEGD 8036
Seismic source:Type Bolt 1500LL / 600B AirgunsVolume 2500 cu.in.Pressure: 1800 psiDepth: 6 mShot interval 2D: 25 mShot interval 3D: 37.5 m flipflop
Recording system:Type: Syntrak / gASRecord length: 5120 msSample interval: 2 msNumber of Channels: 348Near Channel: 1Recording Delay: 120 msLow Cut Filter: 3Hz @ 12 dB/octaveHigh Cut Filter: 206Hz @ 276 dB/octaveGain Setting 12 dB
Receivers:Streamer Type : Syntron / Teledyne LDAStreamer depth: 8 mNumber of Streamers/Groups: 4 x 348Group interval: 12.5 mNominal near group offsets:Cable1/Cable2/Cable3/Cable4 199m/122m/99m/158m
Processing Report : 20052006 Shearwater 2D & Reprocessing Page9

2.2 2001 Shelduck 2D Survey
DESCRIPTION DETAILSData recorded by: Fugro GeoteamDate recorded: June 2001Vessel: Geo Arctic
General:Field CMP Interval 6.25 mNominal Fold 122Recording Format: Demultiplexed, SEGD (3590 media)
Seismic source:Type Airgun ArrayVolume 2660 cu.in.Pressure: 2000 psiNominal Depth: 5 mShot interval: 18.75 m
Recording system:Type: I/O MSXRecord length: 5120 msSample interval: 2 msNumber of Channels: 366Near Channel: 1Recording Delay: 0 msLow Cut Filter: 4 Hz @ 12 dB/octaveHigh Cut Filter: 206Hz @ 264 dB/octavePolarity: First break is negative
Receivers:Centre near group to centre far group: 4587.5 mNominal Streamer depth: 7.5 mNumber of groups: 368Group interval: 12.5 mCentre source to centre near group: 148 mNumber of Streamers: 1
Processing Report: 20052006 Shearwater 2D Survey & Reprocessing Page10

2.3 1996 Hummock 2D Survey
DESCRIPTION DETAILSData recorded by: P.G.S. ExplorationDate recorded: January 1996Vessel: Odin Explorer
General:Field CMP Interval 7.62 mNominal Fold 84Recording Format: SEGD (8015)
Seismic source:Type Airgun ArrayVolume 1330 cu.in.Pressure: 2000 psiDepth: 6 mShot interval: 22.86 mGun Delay 0 ms
Recording system:Type: ?Record length: 6144 msSample interval: 2 msNumber of Channels: 252Near Channel: 252Recording Delay: 81 msLow Cut Filter: 3 Hz @ 6 dB/octaveHigh Cut Filter: 218 Hz @ 484 dB/octavePolarity: First break is negative
Receivers:Centre near group to centre far group: 3932.74 mStreamer depth: 6.5 mNumber of groups: 252Group interval: 15.24 mCentre source to centre near group: 107.50 mNumber of Streamers: 1
Processing Report : 20052006 Shearwater 2D & Reprocessing Page11

2.4 1994 Rocky Cape Survey
DESCRIPTION DETAILSData recorded by: Western GeophysicalDate recorded: 1994Vessel: Western Atlas
General:Field CMP Interval 12.5 mNominal Fold 120Recording Format: SEGD (8048)
Seismic source:Type Airgun ArrayVolume 3305 cu.in.Pressure: 1850 psiDepth: 6.0 mShot interval: 25 mGun Delay 0 ms
Recording system:Type: WG24Record length: 6144 msSample interval: 2 msNumber of Channels: 240Near Channel: 1Low Cut Filter: 6 Hz @ 18 dB/octaveHigh Cut Filter: 196 Hz @ 214 dB/octavePolarity: First break is negative
Receivers:Centre near group to centre far group: 2987.5 mStreamer depth: 10 mNumber of groups: 240Group interval: 12.5 mCentre source to centre near group: 131 mNumber of Streamers: 1
Processing Report: 20052006 Shearwater 2D Survey & Reprocessing Page12

2.5 1985B Amoco 2D Survey
DESCRIPTION DETAILSData recorded by: G.S.I.Date recorded: October 1985Vessel: Eugene McDermott II
General:Field CMP Interval 15 mNominal Fold 60Recording Format: Demultiplexed, SEGD
Seismic source:Type Airgun ArrayVolume 4075 cu.in.Pressure: 1800 psiDepth: 10 mShot interval: 30 mGun Delay 51.2 ms
Recording system:Type: TSR 001Record length: 6000 msSample interval: 2 msNumber of Channels: 240Near Channel: 240Recording Delay: 0 msLow Cut Filter: 8 Hz @ 18 dB/octaveHigh Cut Filter: 128 Hz @ 72 dB/octavePolarity: First break is negative
Receivers:Centre near group to centre far group: 3585 mAverage Streamer depth: 13 mNumber of groups: 240Group interval: 15 mCentre source to centre near group: 396 mNumber of Streamers: 1
Processing Report : 20052006 Shearwater 2D & Reprocessing Page13
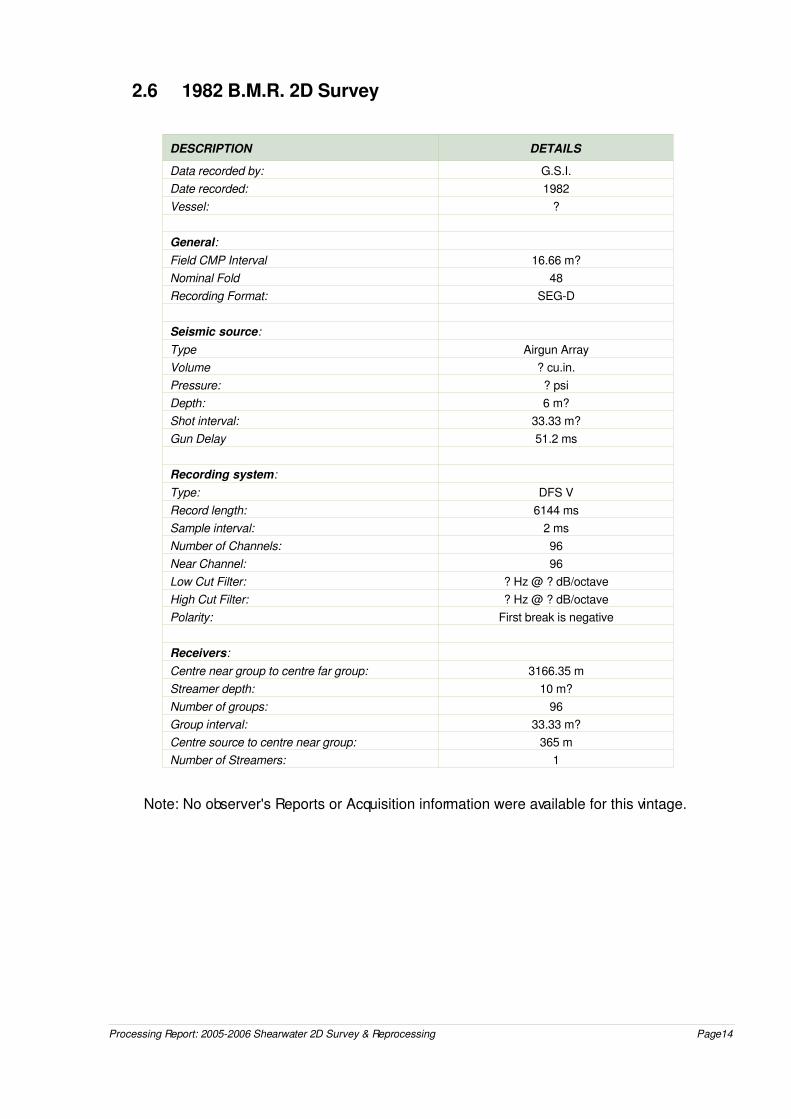
2.6 1982 B.M.R. 2D Survey
DESCRIPTION DETAILSData recorded by: G.S.I.Date recorded: 1982Vessel: ?
General:Field CMP Interval 16.66 m?Nominal Fold 48Recording Format: SEGD
Seismic source:Type Airgun ArrayVolume ? cu.in.Pressure: ? psiDepth: 6 m?Shot interval: 33.33 m?Gun Delay 51.2 ms
Recording system:Type: DFS VRecord length: 6144 msSample interval: 2 msNumber of Channels: 96Near Channel: 96Low Cut Filter: ? Hz @ ? dB/octaveHigh Cut Filter: ? Hz @ ? dB/octavePolarity: First break is negative
Receivers:Centre near group to centre far group: 3166.35 mStreamer depth: 10 m?Number of groups: 96Group interval: 33.33 m?Centre source to centre near group: 365 mNumber of Streamers: 1
Note: No observer's Reports or Acquisition information were available for this vintage.
Processing Report: 20052006 Shearwater 2D Survey & Reprocessing Page14

3 Parameter Testing
The processing flow for the 2D data was based on test results from the 3D survey. These results were applied to a selected line, OS2D2005 (Cable 3), to confirm their validity for the 2D data.
The processing stream for the new acquisition data then became the basis for each of the reprocessing vintages. Again, a line was chosen for each vintage and parameters adjusted for the differing acquisition parameters.
All tests were output into powerpoint format and sent to Origin by email.
The following table summarises tests performed.
Description FormatGain Recovery Shot
Deterministic Designature ShotDespikeSwell Noise Attenuation Shot
Swell Noise Attenuation Shot/Gather/StackTaup Linear Noise Removal 1 Shot/Gather/Stack
SRME Shot/Gather/StackTaup Deconvolution Shot/Gather/StackAdjacent Trace Sum Shot/StackRadon Demultiple Gather/ Stack
Surface Consistent Amplitude Scaling Gather/ StackKirchhoff Prestack migration Gather/ StackResidual Radon Demultiple Gather/ Stack
Mutes Gather/ StackFinal RMS Velocities StackRelative Amplitude Stack
Angle Migrated Stacks Near Stack Mid Stack Far StackAVO Attributes Intercept Stack Gradient Stack Delta Rp Stack
Processing Report : 20052006 Shearwater 2D & Reprocessing Page15

4 Processing Sequence DiagramProcessing stream shown is for the Shearwater 2D data. Reprocessed lines followed this sequence as closely as possible.
Processing Report: 20052006 Shearwater 2D Survey & Reprocessing Page16
Field Tape Transcription
NavigationSeismic Merge
Gain Recovery
Bulk Static Shift
Deterministic Designature(Gun + Receiver Ghost)
Swell Noise Attenuation
Despike
Taup Linear Noise Attenuation
Surface Related Multiple Attenuation
Taup DBS
Sort to CDP gathers
Radon Demultiple
First Pass Kirchhoff PSTM
Gain Removal
Spherical Divergence (Ursin)
SCAMP
Final Kirchhoff PreSTM
Residual Radon Demultiple
NMO Correction
Outer Trace Mute
Second Pass Velocity Analysis
SSD Correction
Final Velocity Analysis
Stack (1/sqrtN compensation)
SSD Correction
ARCHIVE: Demultiple (SCAMP) Gathers
ARCHIVE: Final Filtered & Scaled Stack
Equalisation
Stack (1/sqrtN compensation)
SSD Correction
Band Pass Filter & Dual Window AGC
Output to Segy
Angle Muting(Near, Mid, Far angles)
Stack (1/N compensation)
SSD Correction
Output to Segy
ARCHIVE: Near Stack, Mid Stack, Far Stack
ARCHIVE: PSTM Gathers with NMO
ARCHIVE: Final Relative Amplitude Stack
First Pass Velocity Analysis

5 Processing Description
5.1 TranscriptionThe supplied field tapes were copied directly to disk, without transcription from SEGD format. The practice of preserving a pristine field tape image ensures that the field tapes need only be read once in a processing project. The field tape images are later converted to Fugro Seismic Imaging internal format trace sequential with samples in 32 bit IEEE floating point.
5.2 NavigationSeismic MergeThe seismic trace headers were updated with easting and northing values from the supplied navigation files. The Geodetic Datum as surveyed was GDA94.
Navigation ParametersSpheroid: International (6378137.0, 298.257)
Projection type: 002 UTM SouthProjection Zone: 55S
Longitude of CM: 147 0 0.000E
5.3 Gain RecoveryA gain function was applied to the data to compensate for amplitude decay. The function applied used t2 compensation for spherical divergence losses, (t is two way travel time (twt) in ms).
5.4 Bulk Static ShiftA 120 ms static shift was applied to the Shearwater 2D Survey lines to compensate for the recording system delay.
Recording System Delay
Vintage Static Applied
ORS01 None Applied
BHB96 81 ms
SB94A None Applied
TQH5 52 ms
82BMR 52 ms
5.5 Low Cut FilterA minimum phase lowcut filter ( 3 Hz at 6 dB/Octave) was applied to the shot records.
Reprocessing Vintages:
Processing Report : 20052006 Shearwater 2D & Reprocessing Page17

No minimumphase lowcut filter was applied to any of the reprocessing vintages.
5.6 Swell Noise AttenuationSwell noise attenuation is achieved by shaping the amplitude spectra of selected "swell noise affected" traces.
Analysis and attenuation are performed in the FX domain, processing one source position at a time. For analysis, the amplitude spectra are normalised, considering only the higher frequency range which is less influenced by swell noise. After normalisation the swell noise traces are recognised by their relatively high amplitude, low frequency component. The shallow portion of each shot record is muted before analysis, removing the high amplitude shallow reflections and direct arrivals.
The user nominates a frequency range for analysis, and for spectral scaling. Typically this frequency range is from 0 to 30 Hz. Scalars are calculated to shape the spectra of individual swell noise affected traces to the mean of the non swell noise affected traces. The scalars are fully applied from 0 to one half the defined frequency range, after which the scalars are tapered to zero application at the maximum defined frequency. No modification is made to other traces.
The mechanism of swell noise recognition is not influenced by change in source energy, or by systematic variation in trace amplitude levels. Shots not affected by swell noise will not present any traces for swell noise attenuation.
The swell noise attenuation is monitored by recording the number of channels flagged as being affected by swell noise.
5.7 Random Spike AttenuationDespike was applied to remove any anomalous high energy amplitudes which could be the source of noise in the prestack migration. Amplitudes were measured in a matrix of 45 time windows of 100 ms length. The matrix was composed of seven consecutive time windows across 11 adjacent traces in a shot gather. The amplitude of the centre window is compared to the rest of the matrix and the centre window is defined as containing a spike if the peak to median ratio is greater than 15, or if the centre window median value exhibits more than 8.0 units of standard deviation from the average median. Spike affected windows are scaled to the mean of the matrix.
5.8 Instrument Dephase and Source DesignatureA filter was designed to convert the supplied far field signature to its zero phase equivalent. The effect of applying this filter to the data is to remove the phase effects of the recording instruments, and to collapse the effective source signature. (See Section 8, for the modeled source far field signature and full system response with source and receiver ghost listing).
Processing Report: 20052006 Shearwater 2D Survey & Reprocessing Page18

Reprocessing Vintages:ORS01: AppliedBHB96: AppliedSB94A: Source Signature unavailable. TQH5: Source Signature unavailable. 82BMR: Source Signature unavailable
5.9 TauP Linear Noise Removal Shot records were NMO corrected with 1st pass velocities and then interpolated from 348 traces to 695 traces. After FX interpolation, NMO was removed and the data transformed into the TauP domain using the linear transform. Strong linear noise trains with large dip can be differentiated from primary energy in the linear taup space, and these events are attenuated by a scaling pattern tapering from the primary to noise areas of the transform. The transform was performed with p limits of 2000 ms and 4000 ms, with increments of 8 ms ( reference offset of 4520m).
Reprocessing Vintages:No FX interpolation was applied to the reprocessed data prior to transformation of the datainto the taup domain.
5.10 SRMESRME or Surface Related Multiple Elimination uses the geometry of shot recording to estimate all possible multiples that can be generated by the surface. It was developed by the Delphi Consortium at TUDelft in the Netherlands. One order of surface related multiples is predicted using autoconvolutions of input data. The predicted multiple energy is then removed from the input gathers by a process of cascaded adaptive subtraction.
It was not necessary to interpolate new shots since the recorded shotpoint interval equalled the group interval. The recorded data is extrapolated to zero offset, before constructing the multiple estimate by a series of convolutions and summation.
A mute was applied to the input shot records prior to remove direct arrival energy. Before adaptive subtraction, the modelled multiples were NMO corrected and any energy above the first seafloor multiple removed by muting.
5.11 Taup Linear Transformation & Predictive DeconvolutionShot records were again NMO corrected with 1st pass velocities and then interpolated from 348 traces to 695 traces. After FX interpolation, NMO was removed and data transformed into the TauP domain using the same linear transform described in section 5.9..
The design window for the deconvolution consisted of a single 3500 m/sec window, 332 ms total operator length and a gap length of 32 ms. Application of the deconvolution was to the whole trace
Processing Report : 20052006 Shearwater 2D & Reprocessing Page19

length.
5.12 Receiver Array Simulation and DecimationBefore decimating the shot records from 12.5m to 25.0m group interval, an adjacent trace summation was performed with alignment along NMO curves. The first pass velocity functions were used for this process.
Adjacent Trace Sum ParametersInput traces: 348
Input trace interval: 12.5mOutput traces: 174
Output trace interval: 25 m
Trace Mix Details
Time (ms) Trace Mix Time (ms) Trace Mix
0 1 – 2 1 TMax 1 – 2 1
Reprocessing Vintages:ORS01: Not AppliedBHB96: Not AppliedSB94A: Applied. 240 traces/shot decimated to 120. Output trace interval: 12.5 metres.TQH5: Applied. 240 traces/shot decimated to 120. Output trace interval: 15 metres.82BMR: Not Applied
5.13 CDP GatherThe preprocessed shot records were sorted into common depth point gathers.
CDP Gather ParametersSP interval: 25 m
Group interval: 12.5 mNumber of channels: 174
CDP interval: 12.5 mCDP fold: 87
Reprocessing Vintages:
CDP Gather Parameters - ORS01SP interval: 18.75 m
Group interval: 12.5 mNumber of channels: 366
CDP interval: 6.25 mCDP fold: 122
Processing Report: 20052006 Shearwater 2D Survey & Reprocessing Page20

CDP Gather Parameters - BHB96SP interval: 22.86 m
Group interval: 15.24 mNumber of channels: 252
CDP interval: 7.62 mCDP fold: 84
CDP Gather Parameters - SB94ASP interval: 25 m
Group interval: 25 mNumber of channels: 120
CDP interval: 12.5 mCDP fold: 60
CDP Gather Parameters - TQH5SP interval: 30 m
Group interval: 30 mNumber of channels: 120
CDP interval: 15 mCDP fold: 60
CDP Gather Parameters - 82BMRSP interval: 30 m
Group interval: 30 mNumber of channels: 120
CDP interval: 16.66 mCDP fold: 60
5.14 First Pass Velocity AnalysisFirst pass velocities (1km interval) were determined using the Fugro Seismic Imaging Pty. Ltd. “MGIVA” interactive velocity analysis program. Each velocity analysis comprised a semblance display, a CDP stacked panel repeated 17 times with a suite of velocity functions, and a central CDP gather. The suite of functions were generated using 0%, +/2 %, +/4%, +/6%, +/8 %, +/10%, +/12%, +/ 15%, and +18% increments from a central velocity function. The central function was a water depth based velocity representative for the grid area.
The velocity analysis incorporated a map of all velocity locations, and the semblance display included functions from proximate lines. This enabled the velocities to be picked with knowledge of areal velocity trends. Velocity QC can be performed more effectively when discordant velocities are apparent on the map.
5.15 (High Resolution) Radon Multiple AttenuationAttenuation of multiples was achieved by modelling and subtraction using a least squares, parabolic radon transform. Normal moveout corrections were performed using the first pass velocities, and the CDP gathers transformed into the parabolic TauP domain. The segment of the TauP domain corresponding to primary reflections is muted, leaving the multiple energy to be transformed back into the TX domain and subtracted from the original CDP gather.
Processing Report : 20052006 Shearwater 2D & Reprocessing Page21

The Hiresolution radon option was invoked, where the resolution of the radon transform is improved by adding weighting terms to the least squares solution, thus minimising the residual error. To further reduce the potential for aliasing, the radon transform was performed on 174 fold gathers formed by FX interpolation of new shots in the common offset domain. Following demultiple, the interpolated traces were dropped from the processing stream. A mild tx mute was applied immediately before the radon transform to remove NMO stretch noise from the shallow zone of longer offsets.
Radon Transform Parameters
Reference offset 4500 m
Frequency range 3-100 Hz
Minimum p -1500 (parabolic delta-t, at reference offset)
Maximum p +3000 (parabolic delta-t, at reference offset)
No. of p traces 563
Multiple removal was achieved by subtracting the modelled multiples from the original (NMO corrected) gather. Application of demultiple in the shallow regions was controlled by tapering the amplitudes of the multiple model.
Reprocessing:
ORS01: Fx Interpolation to 366 traces.
Radon Transform Parameters - ORS01
Reference offset 4711 m
Frequency range 4-125 Hz
Minimum p -1500 (parabolic delta-t, at reference offset)
Maximum p +3500 (parabolic delta-t, at reference offset)
No. of p traces 334
BHB96: Fx Interpolation to 252 traces.
Radon Transform Parameters - BHB96
Reference offset 3933 m
Frequency range 4-125 Hz
Minimum p -1500 (parabolic delta-t, at reference offset)
Maximum p +3500 (parabolic delta-t, at reference offset)
No. of p traces 334
SB94A: Fx Interpolation to 120 traces.
Radon Transform Parameters - SB94A
Reference offset 4500 m
Frequency range 3-100 Hz
Processing Report: 20052006 Shearwater 2D Survey & Reprocessing Page22

Minimum p -1500 (parabolic delta-t, at reference offset)
Maximum p +3000 (parabolic delta-t, at reference offset)
No. of p traces 563
TQH5: Fx Interpolation to 120 traces.
Radon Transform Parameters - TQH5
Reference offset 3981 m
Frequency range 4-125 Hz
Minimum p -1500 (parabolic delta-t, at reference offset)
Maximum p +3500 (parabolic delta-t, at reference offset)
No. of p traces 501
Radon Transform Parameters – 8 2BMR
Reference offset 3500 m
Frequency range 3-100 Hz
Minimum p -1500 (parabolic delta-t, at reference offset)
Maximum p +3500 (parabolic delta-t, at reference offset)
No. of p traces 501
5.16 Remove Gain RecoveryThe previously applied t2 gain function (see Section 5.3) was backed off.
5.17 Spherical Divergence (Ursin)With the previously applied t2 gain function removed, an offset and velocity dependent spherical divergence approximation as described by Bjorn Ursin (GEOPHYSICS Vol.55 No.4, pp492496 1990) was now implemented in its place.
Where T0 is the two way travel time, V is the RMS velocity at T0, and V0 is the velocity in the first layer. Although this method is applicable to uncorrected data as a moveout tracking divergence correction, for algorithmic ease it is applied to NMO corrected CDP gathers.
5.18 Surface Consistent Amplitude RecoveryThe amplitude of any trace is affected by various factors, including the shot strength, response and coupling of the receivers, trace offsets and the geology. Surface Consistent Amplitude Recovery
Processing Report : 20052006 Shearwater 2D & Reprocessing Page23

(SCAMP) is designed to analyse amplitudes in a surface consistent manner. It estimates the amplitude variations due to various components and computes weighting levels for each component, using the GaussSeidel iterative method. The components selected to resolve extraneous amplitude variations were the shot strength, channel number (offset) and receiver response (virtual receiver location). The GaussSeidel iterations were performed on all lines simultaneously, providing a survey consistent solution. The inclusion of the offset component produces a solution which balances the mean amplitudes with offset. The scalars were modified by computing a running median, such that only local fluctuations in channel amplitude removed, and the smooth amplitude variation with offset preserved.
5.19 PreStack Time Migration (Velocity Analysis)StraightRay Kirchhoff Migration using smoothed 100% first pass velocities. The number of common offset planes used in the migration was 87 and the CMP interval was 12.5m. The half aperture distance was 7.5 kilometres and 50% antialias protection was used.
To migrate a single trace position the diffraction stack technique sums input data along diffraction curves centred at the output position. The maximum width of these diffraction curves governs the maximum number of traces which must be considered either side of a trace to be migrated. This number is referred to as the aperture or scan width.
For unstacked data, recorded at some common offset x, the diffraction curve is given by:
where X and V are defined above and x is the section offset.
5.20 Second Pass Velocity AnalysisSecond pass velocities (0.5km interval) were determined using the Fugro Seismic Imaging Pty. Ltd. “MGIVA” interactive velocity analysis program. Each velocity analysis comprised a semblance display, a CDP stacked panel repeated 17 times with a suite of velocity functions, and a central CDP gather. The suite of functions were generated using 0%, +/2 %, +/4%, +/6%, +/8 %, +/10%, +/12%, +/15%, and +18% increments from a central velocity function. The central function was the velocity derived from the first pass analysis.
The velocity analysis incorporated a map of all velocity locations, and the semblance display included functions from proximate lines. This enabled the velocities to be picked with knowledge of areal velocity trends. Velocity QC can be performed more effectively when discordant velocities are apparent on the map.
Velocity accuracy was judged by the ‘flatness’ of primary events on the interactive gather.
Processing Report: 20052006 Shearwater 2D Survey & Reprocessing Page24

5.21 Final PreStack Time MigrationStraightRay Kirchhoff Prestack Time Migration using smoothed 100% second pass velocities. The number of common offset planes used in the migration was 87, and the CMP interval was 12.5 m. The aperture distance was 7.5 kilometres, and 50% antialias protection was used. The last 500 ms of data on the section was scaled down prior to migration.
5.22 Final Pass Velocity AnalysisThe third pass velocity analysis was conducted on the final prestack migration data. In addition a residual radon demultiple was also applied to further remove remnant multiples from the gathers. Analysis was performed at 0.25 km intervals using the Fugro Seismic Imaging Pty. Ltd. “MGIVA” interactive velocity analysis program. Each velocity analysis comprised a semblance display, a CDP stacked panel repeated 17 times with a suite of velocity functions, and a central CDP gather. The suite of functions were generated using 0%, +/2%, +/4%, +/6%, +/8%, +/10%, +/12%, +/15%, and +18% increments from a central velocity function. The central function was the velocity derived from the second pass analysis.
These final velocities were archived to CDROM media as ASCII text in Western Geophysical's 2D velocity format.
5.23 Radon Multiple Attenuation (Residual Demultiple)The initial demultiple was performed in a lenient fashion because the preliminary velocity field did not permit fine discrimination between primary and multiple energy. Most seafloor multiple energy was removed, but some interbed multiples and seafloor multiples with residual moveout were remnant in the final migrated gathers. Attenuation of these remnant multiples was achieved by modelling and subtraction using a least squares, parabolic Radon transform.
Normal moveout corrections were performed using the final velocities, and the CDP gathers transformed into the parabolic TauP domain. The segment of the TauP domain corresponding to primary reflections is muted, leaving the multiple energy to be transformed back into the TX domain and subtracted from the original CDP gather.
The Hiresolution radon option was invoked, where the resolution of the radon transform is improved by adding weighting terms to the least squares solution, minimising the residual error. A mild tx mute was applied immediately before the radon transform to remove NMO stretch noise from the shallow zone of longer offsets.
Radon Transform Parameters
Reference offset 4458 m
Frequency range 3-100 Hz
Minimum p -500 (parabolic delta-t, at reference offset)
Processing Report : 20052006 Shearwater 2D & Reprocessing Page25

Maximum p +3000 (parabolic delta-t, at reference offset)
No. of p traces 701
Multiple removal was achieved by subtracting the modelled multiples from the original (NMO corrected) gather. Application of demultiple in the shallow regions was controlled by tapering the amplitudes of the multiple model.
Reprocessing:
Radon Transform Parameters - ORS01
Reference offset 4698 m
Frequency range 3-100 Hz
Minimum p -500 (parabolic delta-t, at reference offset)
Maximum p +3000 (parabolic delta-t, at reference offset)
No. of p traces 701
Radon Transform Parameters - BHB96
Reference offset 4698 m
Frequency range 3-100 Hz
Minimum p -500 (parabolic delta-t, at reference offset)
Maximum p +3000 (parabolic delta-t, at reference offset)
No. of p traces 701
Radon Transform Parameters - SB94A
Reference offset 4458 m
Frequency range 3-100 Hz
Minimum p -500 (parabolic delta-t, at reference offset)
Maximum p +3000 (parabolic delta-t, at reference offset)
No. of p traces 701
Radon Transform Parameters – TQ H5
Reference offset 3966 m
Frequency range 3-80 Hz
Minimum p -4000 (parabolic delta-t, at reference offset)
Maximum p +4000 (parabolic delta-t, at reference offset)
No. of p traces 801
Radon Transform Parameters - 82-BMR
Reference offset 3484m
Frequency range 3-80 Hz
Minimum p -4000 (parabolic delta-t, at reference offset)
Maximum p +4000 (parabolic delta-t, at reference offset)
No. of p traces 801
Processing Report: 20052006 Shearwater 2D Survey & Reprocessing Page26

5.24 NMO CorrectionDix fourth order NMO corrections were applied using the final picked 0.25 kilometre PSTM velocity functions.l
5.25 Outer Trace MuteThis process was applied to the relative amplitude and filtered/scaled stacks only
A post NMO outer trace mute was applied to remove any coherent noise on the outer traces and to reduce contamination from the effect of NMO stretch on the far offsets.
Outer Mute Parameters
Seafloor twt Offset (m) Application times (ms)
100 ms 130 0
210 0
810 500
4720 3000
Reprocessing:
Outer Mute Parameters - ORS01
Seafloor twt Offset (m) Application times (ms)
100 ms 180 0
210 0
810 500
4720 3000
Outer Mute Parameters - BHB96
Seafloor twt Offset (m) Application times (ms)
100 ms 130 0
210 0
810 500
4720 3000
Outer Mute Parameters - SB94A
Seafloor twt Offset (m) Application times (ms)
0 ms 100 0
250 120
4600 3000
Outer Mute Parameters - TQH5
Seafloor twt Offset (m) Application times (ms)
Processing Report : 20052006 Shearwater 2D & Reprocessing Page27

Outer Mute Parameters - TQH5
0 ms 100 0
250 120
4600 3000
Outer Mute Parameters - 82BMR
Seafloor twt Offset (m) Application times (ms)
0 ms 130 0
210 0
810 500
4410 2800
5.26 Angle Mute StacksThis process was applied to the near, mid and far angle stacks only
Angle stacks, stacks generated after restricting input to a portion of the gather corresponding to a particular range of incident angles, were produced for lithology and fluid predictions. The angle of incidence calculations were performed using Walden's method, and considered a smoothed version of the the third pass velocities.
Angle Stack Parameters
Near Stack 0 – 1 5 degrees
Mid Stack 15 – 30 degrees
Far Stack 30 – 45 degrees
5.27 AVO AttributesAVO analysis is applied using the Shuey Approximation. A velocity function is used to calculate the angle of incidence at each layer boundary and then interpolated to produce the angle of incidence at each time sample and offset. A robust linear regression is used to calculate the intercept and gradient of the amplitudes at each time sample (Walden, 1991).
Intercept is the zero offset reflection coefficient and gradient is essentially the change in amplitude with offset at any particular time sample within a CDP gather.
The AVO processing sequence was identical to the regular processing up to, and including, prestack time migration. The subsequent processing was as follows:
Application of 4th Order NMO correction(Mild) Outertrace muteGun and Cable Static CorrectionsAVO analysis – 3 attributes produced:
(1) Intercept Stack; (2) Gradient Stack; (3) Delta Rp Stack
Processing Report: 20052006 Shearwater 2D Survey & Reprocessing Page28

5.28 Common Depth Point StackThe traces within each common depth point gather were summed. The method of fold compensation was varied with the intended use of the resulting stack. The near, mid, and far angle stacks employed 1/(N) stack fold compensation. (where N represents the number of traces contributing to the stack, calculated at each sample). The final structural stack used 1/sqrt(N) stack fold compensation.
5.29 StaticsA static compensation for gun and cable depths was applied. The static value applied was calculated using average gun and cable depths supplied in the observers reports, converted to a time shift using a water velocity of 1500 m/s..
Shot/Receiver Depth Statics
Vintage Static Applied
OS2D +9 ms
ORS01 +8 ms
BHB96 +8 ms
SB94A +10 ms
TQH5 +15 ms
82BMR +14 ms
5.30 FX Deconvolution FX Deconvolution is a process designed to effectively attenuate random noise by prediction of the nonrandom signal content in a seismic trace. Each input trace is transformed into the frequency domain. Groups of traces are used to design filters to predict the Fourier components of adjacent traces. For each frequency in the range specified by the user, (See table below), a complex Wiener filter of 5 traces is generated. This filter is used to predict the amplitude and phase at the next trace. This is done twice in a forward and reverse direction. The output sample for this frequency is the average of the forward and reverse predictions. In this manner, predicted traces are reconstructed in the frequency domain and then transformed back into the time domain. The output derived from the “FXDCN” process may be regarded as trueamplitude.
The FXDCN was applied in a time variant manner as the targeted noise was more apparent in the deeper section. The parameters were as follows:
Processing Report : 20052006 Shearwater 2D & Reprocessing Page29

F-X Deconvolution Random Noise Attenuation ParametersNo of Traces for design of filter 50 traces
Length of Operator 5 tracesFrequency Range
Lower cut-off (Hz) 3 HzLower unity response (Hz) 0 Hz
Higher cut-off (Hz) 125 HzHigher unity response (Hz) 100 Hz
5.31 Inverse QfilteringTwo fundamental properties associated with wave propagation through subsurface materials are: energy dissipation of plane waves with high frequency, and velocity dispersion by which plane waves of high frequency travel faster than ones with low frequency. These effects may be represented mathematically as the earth Qfilter, defined in terms of a specified earth Q model. In seismic data processing where the earth Q model is often assumed to be frequency independent, inverse Qfiltering attempts to compensate recorded seismic signals for these wave propagation effects. A stabilization scheme (only on amplitude) was used.
5.32 Band Pass FilterThis process was applied to the filtered/scaled stacks only
Unwanted noise that lay outside the frequency range of the desired reflection data was attenuated by the application of a series of zero phase time variant filters. These filters employed cosine squared tapers between the limiting frequency pairs.
Bandpass Filter Parameters
Seafloor twt Time(ms) Frequency trapezoid (Hz)
0 ms 100 5/10 – 80\100
1000 4/8 – 7 0\85
2000 4/8 – 55\65
3000 4/8 – 50\60
4000 3/5 – 40\50
5000 3/5 – 30\40
Processing Report: 20052006 Shearwater 2D Survey & Reprocessing Page30

5.33 ScalingThis process was applied to the filtered/scaled stacks only
A dual window, time variant AGC method was used for poststack scaling. The negative effects normally associated with AGC are avoided by employing two different length windows to determine the amplitude model (using the minimum of the two mean amplitudes determined at each sample), then conditioning the model by a weighted mix with the scalar derived from a single window per trace. The initial scalar comparisons were made in 1000 and 400 millisecond windows, then the result combined with 40% of the scalar resulting from a single window. The short window stopped at 4000 ms..
5.34 PhaseMatchingThe reprocessing data sets were matched to the 2005 Shearwater survey.
Tabled below are the static and phase values applied to each of the vintages to match thenew acquisition data:
PhaseMatching to Shearwater 2D & 3D
Vintage Phase Shift Static Shift
ORS01 180 degrees 6 ms
BHB96 0 degrees 0 ms
SB94A 125 degrees 7 ms
TQH5 80 degrees 12 ms
82BMR 90 degrees 17 ms
5.35 SEGY ArchiveSegy archives were produced for both gather and stack data sets. See 10.1 Data Dispostion for a detailed list.
Processing Report : 20052006 Shearwater 2D & Reprocessing Page31

6 Polarity Statement
The final desired polarity was SEG reverse (or SEG negative), where an increase in acoustic impedance is represented by a negative number on tape, and white trough on display.
Processing Report: 20052006 Shearwater 2D Survey & Reprocessing Page32
Figure 6.1 Desired polarity diagram. An acoustic impedance increase is represented by a trough.

7 Archive Listing
Tape Number470AV072DVD (Preliminary)
Media Lines Description
470FM009DVD(Superceded by 470FM041DVD)
DVD OS2D2001 to OS2D2007OS2D3008 to OS2D3014
Filtered and Scaled Final Migrations
470FM010DVD(Superceded by 470FM040DVD) DVD OS2D2001 to OS2D2007
OS2D3008 to OS2D3014 Relative Amplitude Final Migrations
470FV011DVD(Superceded by 470FM038DVD)
DVD OS2D2001 to OS2D2007OS2D3008 to OS2D3014
Final Stacking Velocities
470NG012DVD470NG030DVD DVD OS2D2001 to OS2D2007OS2D3008 to OS2D3014 NMO Corrected PSTM Gathers
470AS031DVD(Superceded by 470AS037DVD)
DVD OS2D2001 to OS2D2007OS2D3008 to OS2D3014
Angle Stacks (Near 015, Mid 1530,Far 3045 and Full 045 Degrees)
470AS037DVD(Replacement of 470AS031DVD) DVD OS2D2001 to OS2D2007, 2015
OS2D3008 to OS2D3014Angle Stacks (Near 015, Mid 1530,Far 3045 and Full 045 Degrees)
470MV038DVD DVD BHB96124, ORS0107 to ORS0111 Final Stacking Velocities
470FV038DVD(Replacement of 470FM011DVD)
DVD OS2D2001 to OS2D2007OS2D3008 to OS2D3014
Final Stacking Velocities
470NG039DVD DVD OS2D2015 NMO Corrected PSTM Gathers
470FM040DVD(Replacement of 470FM010DVD) DVD OS2D2001 to OS2D2007
OS2D3008 to OS2D3014 Relative Amplitude Final Migrations
470FM041DVD(Replacement of 470FM009DVD)
DVD OS2D2001 to OS2D2007, 2015OS2D3008 to OS2D3014
Filtered and Scaled Final Migrations
470MV046CD CD AVO Attributes
470MV050CD (Preliminary) CD 82BMR, TQH5 Final Migrations
470FP054DVD(Superceded by 470FS062DVD DVD SB94A Vintage Final PSTM & Angle Stacks
470FP055DVD DVD BHB96 Vintage Final PSTM & Angle Stacks
470FP056DVD DVD ORS01 Vintage Final PSTM & Angle Stacks
470AA057DVD DVDBHB96, ORS01, OS2D & SB94A Vintages (Doesn't Include OS2D2015)
AVO Attributes
470AA058CD (Preliminary) CD TQH5 Vintage & BMR017 AVO Attributes
470FM059CD(Replaced by 470FM060CD)
CD OS2D2001 to OS2D2007OS2D3008 to OS2D3014
Final Filtered Migrations
470FM060CD(Replacement of 470FM059CD) CD OS2D2001 to OS2D2007, 2015
OS2D3008 to OS2D3014 Final Filtered Migrations
470FS061DVD (Preliminary) DVD BHB96 Vintage Final Filtered and Scaled Stacks
470AS062DVD (Replaced) DVD BHB96 Vintage Angle Stacks
470AS063DVD (Preliminary) DVD BHB96 Vintage Angle Stacks
470AA064DVD (Preliminary) DVD BHB96 Vintage Angle Stacks
470AS064DVD (Preliminary) DVD
470AS065DVD (Preliminary) DVD SB94A – 17 Lines Final PSTM/Angle Stacks
Processing Report : 20052006 Shearwater 2D & Reprocessing Page33

Tape Number470AV072DVD (Preliminary) Media Lines Description
(Replacement of 470FP054DVD)
470AS066DVD (Preliminary) DVD TQH5 Final PSTM/Angle Stacks
470NA067CD (Final) CD 2005 OS2D Survey Lines &Reprocessing Vintages Navigation Data
470AS068DVD (Preliminary) DVD OS2D2001 to OS2D2007, 2015OS2D3008 to OS2D3014 + TQH
Angle Stacks (015°)
470AS068DVD(Replaced by 470FM081DVD) DVD OS2D2001 to OS2D2007, 2015
OS2D3008 to OS2D3014 + TQH5 Angle Stacks (015°, 1530° & 3045°)
470AS069DVD (Preliminary) DVD 82BMR, BHB96 & ORS01 Vintages Angle Stacks (1530°)
470AS069DVD (Final) DVD 82BMR, BHB96 & ORS01 Vintages Angle Stacks (015°, 1530° & 3045°)
470AS070DVD (Preliminary) DVD SB94A & TQH5 Vintages Angle Stacks (3045°)
470AS070DVD (Final) (TQH5 Replaced by 470FS083DVD)
DVD SB94A & TQH5 Vintages Angle Stacks (015°, 1530° & 3045°)
470AA071DVD(Preliminary) DVD OS2D2001 to OS2D2007OS2D3008 to OS2D3014
AVO Attributes (Delta Rp, Intercept & Gradient Stacks)
470AV071DVD (Preliminary)(Replaced by 470FS083DVD)
DVD 2005 OS2D Survey Lines &Reprocessing Vintages
AVO Attributes (Delta Rp, Intercept & Gradient Stacks)
470AA072DVD (Preliminary) DVD 2005 OS2D Survey Lines &Reprocessing Vintages
AVO Attributes (Delta Rp, Intercept & Gradient Stacks)
470AV072DVD (Final) DVD 82BMR,BHB96 & ORS01 Vintages AVO Attributes (Delta Rp, Intercept & Gradient Stacks)
470RA073DVD (Preliminary) DVD SB94A Vintage Relative Amplitude Stacks
470AV073DVD(Replaced by 470FP079CD) DVD SB94A & TQH5 Vintages AVO Attributes
(Delta Rp, Intercept & Gradient Stacks)
470FS074DVD DVD 2005 OS2D Survey Lines &Reprocessing Vintages
Filtered and Scaled Stacks
470RA074DVD(Replaced by 470FM081DVD) DVD OS2D2001 to OS2D2007, 2015
OS2D3008 to OS2D3014 Relative Amplitude Stacks
470FV075CD (Preliminary)(Replaced by 470FP091CD)
CD 2005 OS2D Survey Lines &Reprocessing Vintages
Final Stacking Velocities (Western Format)
470RA076DVD(Replaced by 470FS083DVD) DVD Reprocessing Vintages Relative Amplitude Stacks
470FS077DVD(Replaced by 470FS081DVD)
DVD OS2D2001 to OS2D2007, 2015OS2D3008 to OS2D3014
Filtered and Scaled Stacks
470FS078DVD(Replaced by 470FS083DVD) DVD Reprocessing Vintages Filtered and Scaled Stacks
470FP079CD(Replacement of 470AV073DVD)
CD SB94A107, OS2D3014 Final PSTM & AVO Attributes
470FM080CD CD OS2D3014Final Stack Products (Filtered Stacks,Amplitude Stacks, Angle Stacks, AVO Attributes)
470FM081DVD DVD OS2D3014 + SB94A107Final Stack Products (Filtered Stacks,Amplitude Stacks, Angle Stacks, AVO Attributes)
Processing Report: 20052006 Shearwater 2D Survey & Reprocessing Page34

Tape Number470AV072DVD (Preliminary) Media Lines Description
470PSTMG001DLT to470PSTMG005DLT DLT OS2D, 82BMR, BHB96, ORS01,
SB94A & TQH5 Vintages PrePSTM Gathers
470NMOG001DLT to470NMOG005DLT
DLT OS2D, 82BMR, BHB96, ORS01, SB94A & TQH5 Vintages
Final NMO Gathers
470FS082DVD (Labelled on DVD as 470CG089DVD) DVD 2005 OS2D Survey Lines Final Displays in CGM+ Format
470CG082DVD DVD TQH5 Vintages Final Stack Products (Filtered Stacks,Amplitude Stacks, Angle Stacks, AVO Attributes)
470CG083DVD(Labelled on DVD as 470CG090DVD)
DVD Reprocessing Vintages Final Displays in CGM+ Format
470FS083DVD DVD Copy 2, TQH5 Vintages Final Stack Products (Filtered Stacks,Amplitude Stacks, Angle Stacks, AVO Attributes)
470PR084CD(Replaced by 470PR085CD) CD 2005 OS2D Survey & Reprocessing Final Processing Report (PDF Format)
470CG089DVD (Listed as 470CG082DVD)
DVD 2005 OS2D Survey Lines Final Displays in CGM+ Format
470CG090DVD (Listed as 470CG083DVD) DVD Reprocessing Vintages Final Displays in CGM+ Format
470FS091CD(Replaced by 470FS097CD)
CD 2005 OS2D Survey Lines &Reprocessing Vintages
Final Stacking Velocities in “Western”ASCII Format
470FS097CD(Replacement of 470FP091CD) CD 2005 OS2D Survey Lines &
Reprocessing VintagesFinal Stacking Velocities in “Western”ASCII Format
470PR084CD(Replacement of 470PR084CD)
2005 OS2D Survey & Reprocessing Final Processing Report (PDF Format)
Processing Report : 20052006 Shearwater 2D & Reprocessing Page35

8 FarField Signature ListingFull system response with source and receiver ghost for 2005 Shearwater 2D Survey:
Array name : 2500LB_60_1800_100 Total volume : 2500 cu.in.Source depth : 6.00 mStreamer depth : 8.00 mGroup length : 0.00 mAverage pressure : 1800 psiGhost strength : 1.00Seawater temperature : 20.00 CSeawater velocity : 1521.6 m/sFilter : Lowcut frequency : 8.80 Hz Lowcut slope : 18.00 dB/oct Highcut frequency : 206.00 Hz Highcut slope : 276.00 dB/oct Instrument : S24 g6.25 Time of 1st sample: 56.00 msec i.e. index of time zero = 29.0Sample interval : 2.00 msec resampled from 0.5 ms.Farfield position : Distance : 9000.00 m Azimuth : 0.00 deg Angle of vertical : 0.00 deg Amplitudes are in bar mTime is increasing horizontally
0.000 0.000 0.000 0.002 0.004 0.026 0.006 0.019 0.023 0.051 0.014 0.018 0.069 0.030 0.130 0.039 0.119 0.085 0.218 0.135 0.644 0.624 0.542 0.440 0.468 1.104 2.469 4.496 14.337 36.628 15.120 0.925 20.905 53.746 57.064 26.735 3.662 17.700 46.480 31.486 9.306 5.344 1.223 2.344 1.810 0.727 0.466 0.825 0.266 0.467 0.818 0.504 0.822 0.784 0.575 0.504 0.342 0.188 0.175 0.098 0.098 0.158 0.095 0.168 0.317 0.411 0.687 1.053 1.471 1.885 1.856 1.429 0.833 0.159 0.190 0.174 0.041 0.146 0.047 0.291 0.360 0.130 0.415 1.059 1.214 0.965 0.475 0.138 0.370 0.275 0.103 0.105 0.016 0.366 0.807 1.297 1.534 1.405
Processing Report: 20052006 Shearwater 2D Survey & Reprocessing Page36

1.086 0.469 0.163 0.517 0.714 0.528 0.062 0.329 0.746 0.985 0.928 0.826 0.565 0.255 0.111 0.054 0.117 0.060 0.116 0.119 0.144 0.246 0.183 0.152 0.159 0.021 0.006 0.043 0.028 0.183 0.285 0.324 0.473 0.476 0.437 0.437 0.307 0.208 0.092 0.079 0.091 0.082 0.039 0.139 0.227 0.319 0.425 0.329 0.269 0.224 0.035 0.045 0.120 0.234 0.222 0.331 0.467 0.488 0.615 0.636 0.536 0.490 0.299 0.136 0.087 0.067 0.125 0.129 0.235 0.238 0.265 0.346 0.277 0.262 0.262 0.161 0.176 0.173 0.132 0.184 0.107 0.015 0.009 0.141 0.177 0.122 0.121 0.025 0.020 0.060 0.072 0.158 0.264 0.237 0.231 0.167 0.057 0.053 0.018 0.010 0.030 0.000 0.031
Processing Report : 20052006 Shearwater 2D & Reprocessing Page37

9 SEGY Header Information
9.1 SEGY EBCDIC Line Header Information
Typical SEGY EBCDIC line header (From Final Filtered Stack, Line: OS2D2001s2c3)
C01 COUNTRY : ORIGIN ENERGY SURVEY : SHEARWATER 2D C02 COUNTRY : AUSTRALIA AREA : BASS STRAITC03 PROCESSED BY : FUGRO SEISMIC IMAGING DATE : OCTOBER 2006C04 DATASET : FILTERED & SCALED STACK 2D LINE : OS2D2001S2C3C05 ACQ. YEAR : 2005 CABLE DEPTH : 8.0 m C06 SHOT INTERVAL : 25 m GROUP INTERVAL : 12.5 mC07 SHOT DEPTH : 6.0 m GROUPS PER CABLE : 252C08 MIN OFFSET : 99.0 m MAX OFFSET : 4400 mC09 GEODETIC DATUM : GDA94 PROJECTION : 002 UTM SOUTHC10 ZONE : 55S SAMPLE RATE : 2.0 ms C11 CM : 147 0 0.000E MAX TIME : 5120 msC12 PROCESSING SUMMARYC13 TRANSCRIPTION : SEGD format to internal formatC14 SPHERICAL DIVERGENCE : T-SQUAREDC15 RECORDING FILTER DELAY : 120 MSC16 NAVIGATION MERGE : HEADERS UPDATEDC17 DETERMINISTIC DESIG. : GUN + RECEIVER GHOSTC18 SIGNATURE DEPHASE : OUTPUT TO ZERO-PHASEC19 SWELL NOISE ATTENUATION C20 TAU-P LINEAR NOISE ATTEN.: -2000-4000,751 P-TRACES C21 SRME : MULTIPLE ATTENUATIONC22 TAU-P DECONVOLUTION : 32MSEC GAP/300 MS OPERATOR LENGTHC23 FIRST PASS VA : 1.0 KM SPACINGC24 RADON DEMULTIPLE : HIRESC25 URSIN/SCAMP : AMPLITUDE BALANCINGC26 SECOND PASS VA (PSTM) : 0.5 KM SPACINGC27 PSTM : KIRCHHOFFC28 NMO (THIRD PASS VA) : 4TH ORDER, 0.25 KM SPACINGC29 RESIDUAL DEMULTIPLE : HIRES RADON TRANSFORMC30 EQUALISATION C31 OUTER TRACE MUTE : 100M-0MS,250M-120MS,4600M-3000MS.C32 STACK : 1/rootN C33 GUN + CABLE STATIC : +9.0 MSC34 Q-COMPENSATION : Q=180, GAIN LIMIT=12dBC35 F-X DECONVOLUTION : NOISE ATTENUATIONC36 BANDPASS FILTER & SCALE C37 DATUM = GDA94, ZONE = 55S, CM = 147 0 0.000E C38 SP RANGE: 400 TO 13C39 CDP RANGE: 1 TO 988C40 END OF EBCDIC HEADER
Processing Report: 20052006 Shearwater 2D Survey & Reprocessing Page38

9.2 SEGY Trace Header Definition
Location of strategic values in the SEGY trace header.
DESCRIPTION TYPE BYTE
Trace number within line. I32 14
Trace number within reel. I32 58
SEAFLOOR Two Way Time I32 9 12
Trace number. I32 13 16
Shot point number. I32 17 20
CDP number. I32 21 24
Trace offset (integer). I32 37 40
Scaler to be applied to coordinates I16 71 72
Coordinate units (m/arc) I16 89 90
No. of samples. I16 115116
amp interval in microseconds. I16 117118
Year of recording I16 157158
Julian day number (1366) I16 159160
Hour of day (24 hour clock) I16 161162
Minute of hour I16 162163
Second of minute I16 165166
Easting of CDP. I32 193196
Northing of CDP. I32 197200
Processing Report : 20052006 Shearwater 2D & Reprocessing Page39

10 Data Disposition
Data Date sent Destination
Shearwater 2D and 3D Seismic SurveysBox 1: 30 x 3590 cartridges. Tape # 3973239761Box 2: 30 x 3590 cartridges. Tape # 3976239791Box 3: 30 x 3590 cartridges. Tape # 3979239821Box 4: 30 x 3590 cartridges. Tape # 3982239851Box 5: 30 x 3590 cartridges. Tape # 3985239881Box 6: 28 x 3590 cartridges. Tape # 3988239909Box 7: 8 x 3590 cartridges containing P190 & P294 Navigation.Tape # OS2DP011, OS05P011, OS05P021, OS05P031,OS2DR011, OS05R011, OS05R021, OS05R0311 x 3590 cartridge. Tape # 39853. (This tape is a field tape copy of tape # 29841)2 x 3590 cartridges containing Vessel Location Information.Tape # OS2DV011 & OS05V0111 x 3590 cartridge containing Echo Sounder Positions. Tape # OS05E0111 x 3590 cartridge containing P6/98 Binning Grid1 x CD containing Coverage maps, contour maps, vessel position maps & P6/98. Tape # 7502761.1 x CD containing Acquisition Report. Tape # 75027601 x CD containing data shipment information. Tape # OR112801041A1 x DVD containing P190 Navigation. Tape # 028ND041DVD
17082006
Origin EnergySouth Tower, John Oxley Centre339 Coronation DriveMILTON QLD 4064Attn: Randall Taylor
Rocky Cape Survey, Bass Basin29 x 3590 cartridges. Tape # 40050154005043
01112006Spectrum DataSuite 1, 14 Brodie Hall DriveBENTLEY WA 6102
Shearwater 2D Reprocessing:Please find enclosed the following items:Box 1. 33 x 3590 cartridges containing field data. Tape # 75015217501528, 75019397501955, AU32231001AU32231003, AU32231006, GSA01648, 186FC035C, 186FC037C, 0397332 x DLT tapes containing field data. Tape # SYD0056001 & SYD056002Box 2. 15 x 3590 cartridges containing field data. Tape # 4006951400696522 x exabytes containing field data. Tape # 68656867, 68696873,SO4009A, SO4017, AU33505001 to 0122 x exabytes containing navigation. Tape # 2393, 40331 x CD containing Observers logs for 1985B & Hummock Seismic Surveys1 x CD containing Scanned Observation Logs.1 x CD containing Navigation Data for Rocky Cape1 x CD containing Transcription Report & Listings for AU33505001 to 0121 x CD containing Shelduck Obs Logs, Nav & Processing logs.Tape # 75006111 x CD containing Field data for vintages SB94A, TNK4 & TGH51 x CD containing support information. Tape # SYD0070
19042007
Origin EnergySouth Tower, John Oxley Centre339 Coronation DriveMILTON QLD 4064Attn: Tape Librarian
Processing Report: 20052006 Shearwater 2D Survey & Reprocessing Page40

11 Appendix
11.1 SPCDP Relationships – Shearwater 2D SurveyShot point to CDP relationship, using the source position as reference.
Line First CDP Last CDP First Shotpoint Last Shotpoint
OS2D2001S2c1 1 988 508 14.50
OS2D2001S2c2 1 988 508 14.50
OS2D2001S2c3 1 988 508 14.50
OS2D2001S2c4 1 988 508 14.50
OS2D2002S2c1 1 988 508 14.50
OS2D2002S2c2 1 988 508 14.50
OS2D2002S2c3 1 988 508 14.50
OS2D2002S2c4 1 988 508 14.50
OS2D2003S2c1 1 988 12 505.50
OS2D2003S2c2 1 988 12 505.50
OS2D2003S2c3 1 988 12 505.50
OS2D2003S2c4 1 988 12 505.50
OS2D2004S2c1 1 988 12 505.50
OS2D2004S2c2 1 988 12 505.50
OS2D2004S2c3 1 988 12 505.50
OS2D2004S2c4 1 988 12 505.50
OS2D2005S2c1 1 988 12 505.50
OS2D2005S2c2 1 988 12 505.50
OS2D2005S2c3 1 988 12 505.50
OS2D2005S2c4 1 988 12 505.50
OS2D2006S2c1 1 2664 14 1345.50
OS2D2006S2c2 1 2664 14 1345.50
OS2D2006S2c3 1 2664 14 1345.50
OS2D2006S2c4 1 2664 14 1345.50
OS2D2007S2c1 1 1828 928 14.50
OS2D2007S2c2 1 1828 928 14.50
OS2D2007S2c3 1 1828 928 14.50
OS2D2007S2c4 1 1828 928 14.50
OS2D2015S2c1 1 1228 12 625.50
OS2D2015S2c2 1 1228 12 625.50
OS2D2015S2c3 1 1228 12 625.50
OS2D2015S2c4 1 1228 12 625.50
OS2D3008S2c1 1 988 508 14.50
Processing Report : 20052006 Shearwater 2D & Reprocessing Page41

Line First CDP Last CDP First Shotpoint Last Shotpoint
OS2D3008S2c2 1 988 508 14.50
OS2D3008S2c3 1 988 508 14.50
OS2D3008S2c4 1 988 508 14.50
OS2D3009S2c1 1 988 508 14.50
OS2D3009S2c2 1 988 508 14.50
OS2D3009S2c3 1 988 508 14.50
OS2D3009S2c4 1 988 508 14.50
OS2D3010S2c1 1 988 508 14.50
OS2D3010S2c2 1 988 508 14.50
OS2D3010S2c3 1 988 508 14.50
OS2D3010S2c4 1 988 508 14.50
OS2D3011S2c1 1 988 12 505.50
OS2D3011S2c2 1 988 12 505.50
OS2D3011S2c3 1 988 12 505.50
OS2D3011S2c4 1 988 12 505.50
OS2D3012S2c1 1 988 12 505.50
OS2D3012S2c2 1 988 12 505.50
OS2D3012S2c3 1 988 12 505.50
OS2D3012S2c4 1 988 12 505.50
OS2D3013S2c1 1 988 12 505.50
OS2D3013S2c2 1 988 12 505.50
OS2D3013S2c3 1 988 12 505.50
OS2D3013S2c4 1 988 12 505.50
OS2D3014S2c1 1 2188 1108 14.50
OS2D3014S2c2 1 2188 1108 14.50
OS2D3014S2c3 1 2188 1108 14.50
OS2D3014S2c4 1 2188 1108 14.50
11.2 SPCDP Relationships – 82BMR Reprocessing VintageShot point to CDP relationship, using the source position as reference.
Line First CDP Last CDP First Shotpoint Last Shotpoint
82BMR17 107 1014 1 454.50
Processing Report: 20052006 Shearwater 2D Survey & Reprocessing Page42
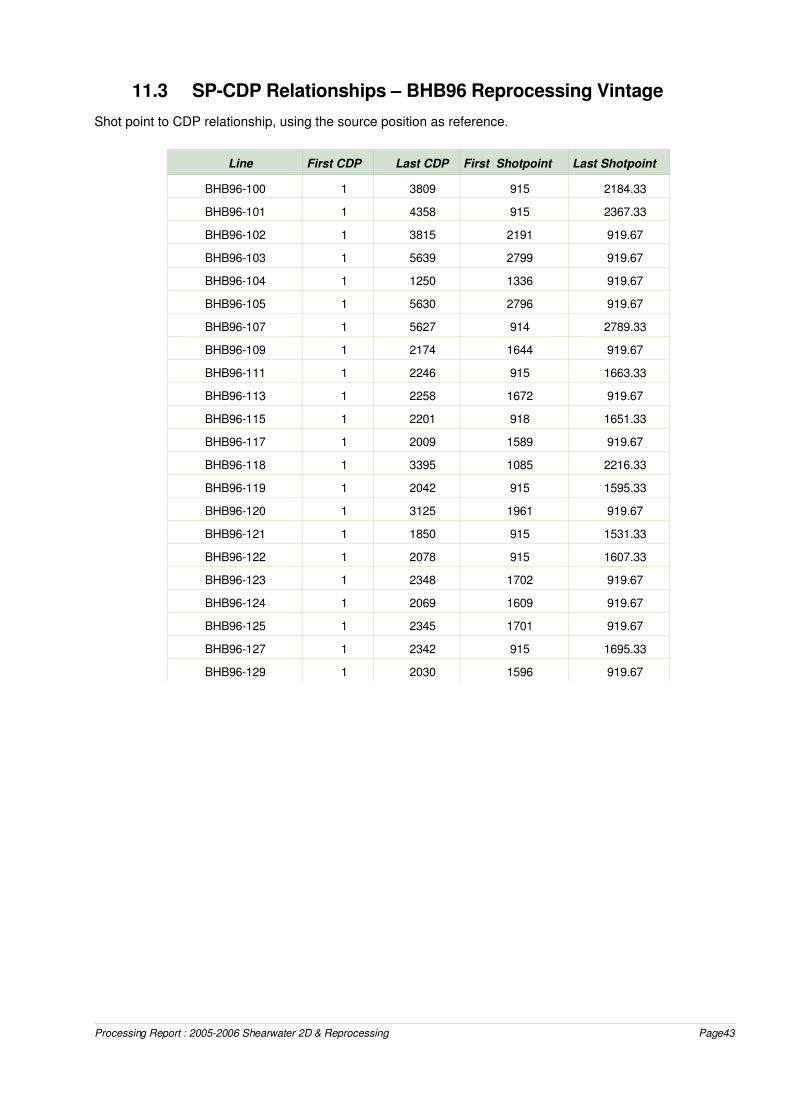
11.3 SPCDP Relationships – BHB96 Reprocessing VintageShot point to CDP relationship, using the source position as reference.
Line First CDP Last CDP First Shotpoint Last Shotpoint
BHB96100 1 3809 915 2184.33
BHB96101 1 4358 915 2367.33
BHB96102 1 3815 2191 919.67
BHB96103 1 5639 2799 919.67
BHB96104 1 1250 1336 919.67
BHB96105 1 5630 2796 919.67
BHB96107 1 5627 914 2789.33
BHB96109 1 2174 1644 919.67
BHB96111 1 2246 915 1663.33
BHB96113 1 2258 1672 919.67
BHB96115 1 2201 918 1651.33
BHB96117 1 2009 1589 919.67
BHB96118 1 3395 1085 2216.33
BHB96119 1 2042 915 1595.33
BHB96120 1 3125 1961 919.67
BHB96121 1 1850 915 1531.33
BHB96122 1 2078 915 1607.33
BHB96123 1 2348 1702 919.67
BHB96124 1 2069 1609 919.67
BHB96125 1 2345 1701 919.67
BHB96127 1 2342 915 1695.33
BHB96129 1 2030 1596 919.67
Processing Report : 20052006 Shearwater 2D & Reprocessing Page43

11.4 SPCDP Relationships – ORS01 Reprocessing VintageShot point to CDP relationship, using the source position as reference.
Line First CDP Last CDP First Shotpoint Last Shotpoint
ORS0101 1 2202 1927.67 1194
ORS0102 1 2448 1324.33 2140
ORS0103 1 2859 1134.33 2087
ORS0104 1 2508 2139.67 1304
ORS0105 1 2868 1024.33 1980
ORS0106A 1 3318 874.33 1980
ORS0107 1 2871 1024.33 1981
ORS0108 1 2844 1034.33 1982
ORS0109 1 2559 1926.67 1074
ORS0110 1 3240 1953.67 874
ORS0111 1 3000 1873.67 874
ORS0112 1 3300 1414.33 2514
ORS0113_A 1 5880 2832.67 873
ORS0114 1 3960 2673.67 873
ORS0115A 1 3960 874.33 2194
ORS0116 1 3159 1926.67 874
ORS0117 1 2979 1334.33 2327
11.5 SPCDP Relationships – SB94A Reprocessing VintageShot point to CDP relationship, using the source position as reference.
Line First CDP Last CDP First Shotpoint Last Shotpoint
SB94A101 125 1176 270 795.5
SB94A102 125 2118 111 1107.5
SB94A103 125 1000 640 202.5
SB94A104 125 1800 1010 172.5
SB94A105 125 934 310 714.5
SB94A106 125 1478 111 787.5
SB94A107 125 2174 111 1135.5
SB94A108 125 658 300 33.5
SB94A109 125 820 670 322.5
SB94A111 125 3046 1494 33.5
SB94A113 125 3192 111 1644.5
SB94A115 125 1298 111 697.5
Processing Report: 20052006 Shearwater 2D Survey & Reprocessing Page44

Line First CDP Last CDP First Shotpoint Last Shotpoint
SB94A117 125 1172 557 33.5
SB94A119 125 1166 554 33.5
SB94A121 125 1508 111 802.5
SB94A122 125 1456 320 985.5
SB94A123 125 1498 720 33.5
11.6 SPCDP Relationships – TQH5 Reprocessing VintageShot point to CDP relationship, using the CDP position as reference.
Line First CDP Last CDP First Shotpoint Last Shotpoint
TQH529A 120 3338 1 1610
TQH531 120 3500 240 1930
TQH533 120 3720 600 2400
TQH535 120 1520 1060 1760
TQH537A 120 1446 930 1593
TQH541 120 920 1000 1400
TQH544 120 2720 1500 2800
TQH552 120 940 400 810
TQH5541 120 1018 1 450
TQH556 120 1714 1650 2447
Processing Report : 20052006 Shearwater 2D & Reprocessing Page45
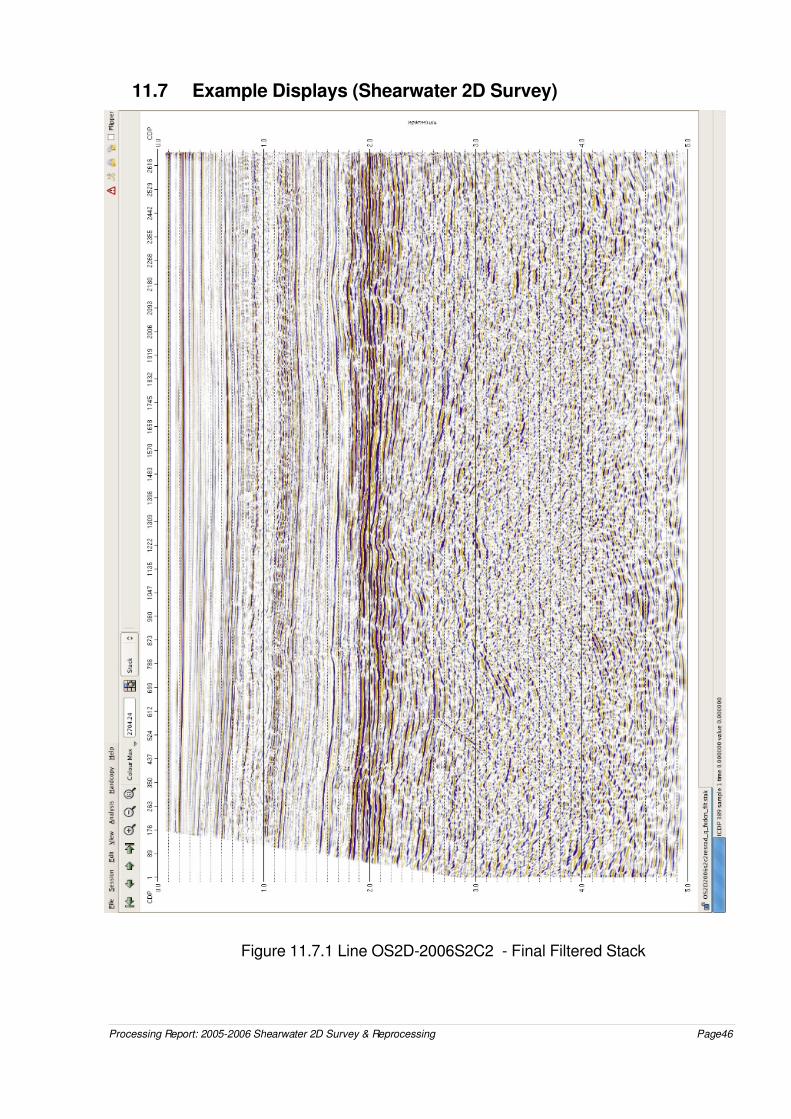
11.7 Example Displays (Shearwater 2D Survey)
Figure 11.7.1 Line OS2D2006S2C2 Final Filtered Stack
Processing Report: 20052006 Shearwater 2D Survey & Reprocessing Page46

Figure 11.7.2 Line OS2D2006S2C2 Final Relative Amplitude Stack
Processing Report : 20052006 Shearwater 2D & Reprocessing Page47

11.8 Example Displays (2D Reprocessing)
BHB96 Reprocessing
Figure 11.81. BHB96100 – Stack Comparison Previous processing (Bottom section) vs Reprocessing (Top section). Note: Image rotated 90 degrees.
Processing Report: 20052006 Shearwater 2D Survey & Reprocessing Page48

ORS01 Reprocessing
Figure 11.82. ORS0113_A – Stack Comparison Previous processing (Bottom section) vs
Reprocessing (Top section). Note: Image rotated 90 degrees.
Processing Report : 20052006 Shearwater 2D & Reprocessing Page49

SB94A Reprocessing
Figure 11.83. SB94A111 – Stack Comparison Previous processing (Bottom section ) vs Reprocessing (Top section). Note: Image rotated 90 degrees.
Processing Report: 20052006 Shearwater 2D Survey & Reprocessing Page50

TQH5 Reprocessing
Figure 11.84. TQH5 – Stack Comparison Previous processing (Bottom section ) vs Reprocessing (Top section). Note: Image rotated 90 degrees.
Processing Report : 20052006 Shearwater 2D & Reprocessing Page51