Embed Size (px)
Citation preview
20
Building Damages
21
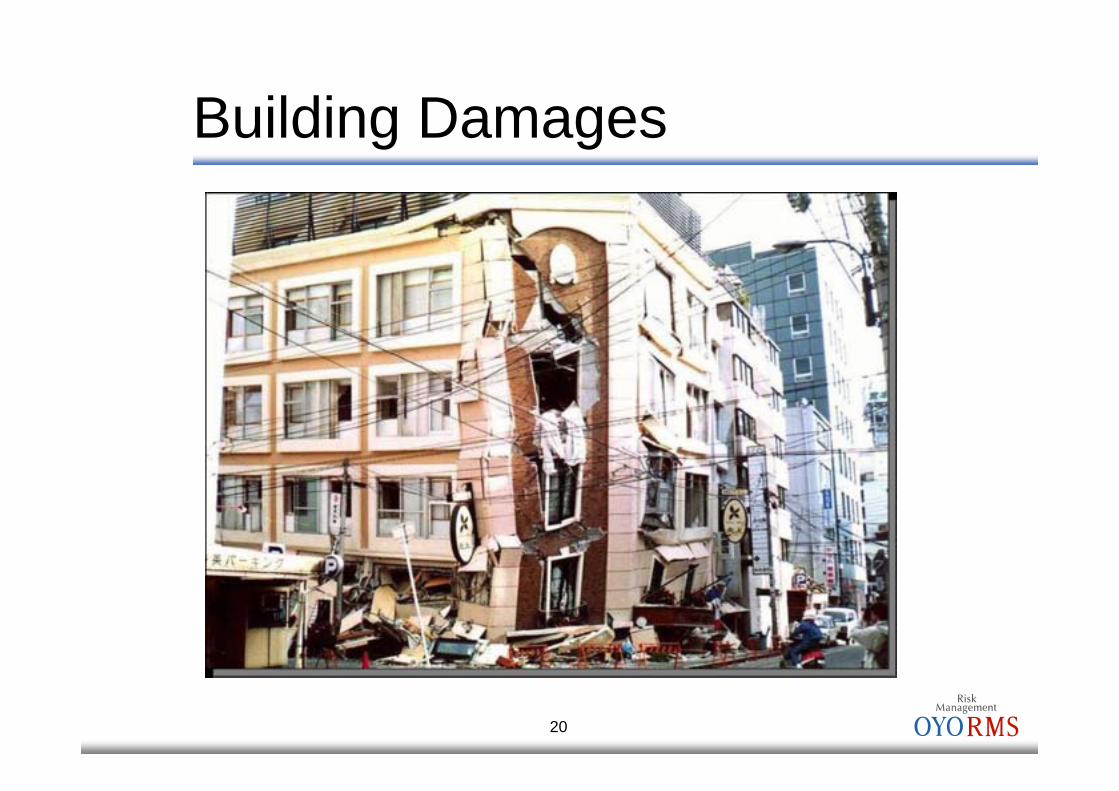
Right Partition Walls Ceilings Outer Walls
Rooftop Advertising Tower
Windows
Floors Doors
Damages of Non-Structural Components
22
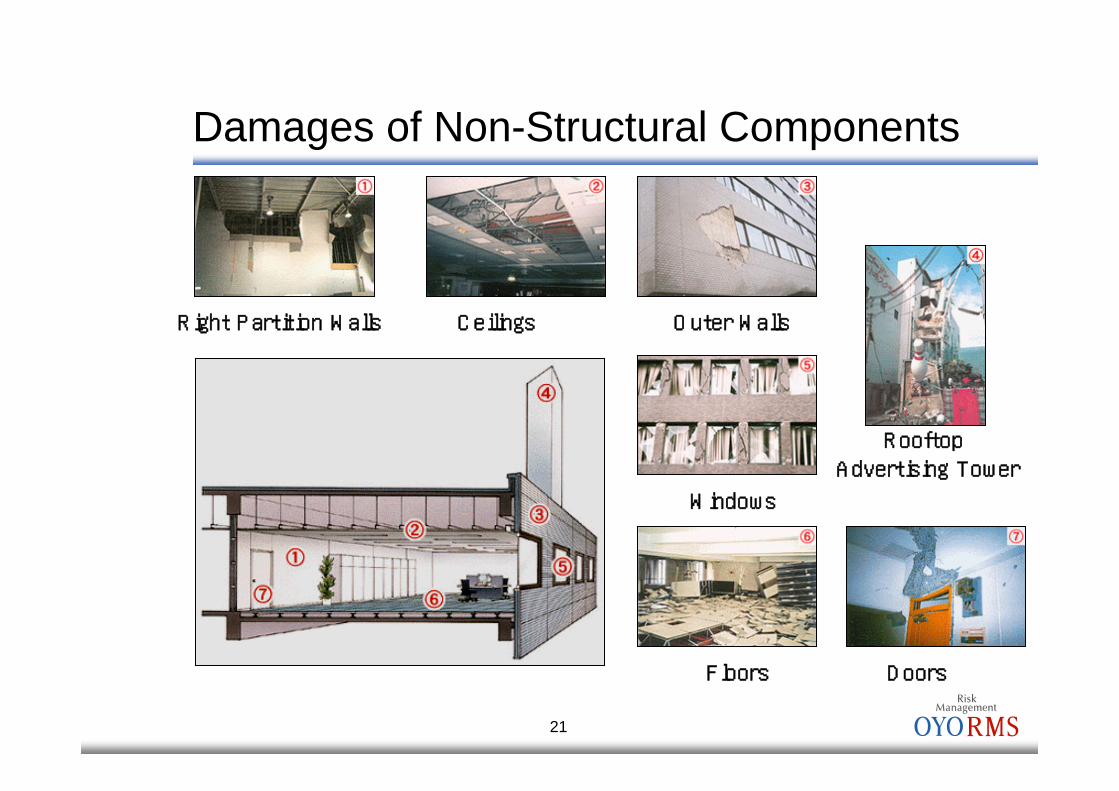
Cooling Tower Ceiling Equipment Elevated Water Tank
Elevator
Boiler/Cooling Machine
Expansion Joint Underground Pipe
Damages of Building Utilities
23
Loss
Rat
io
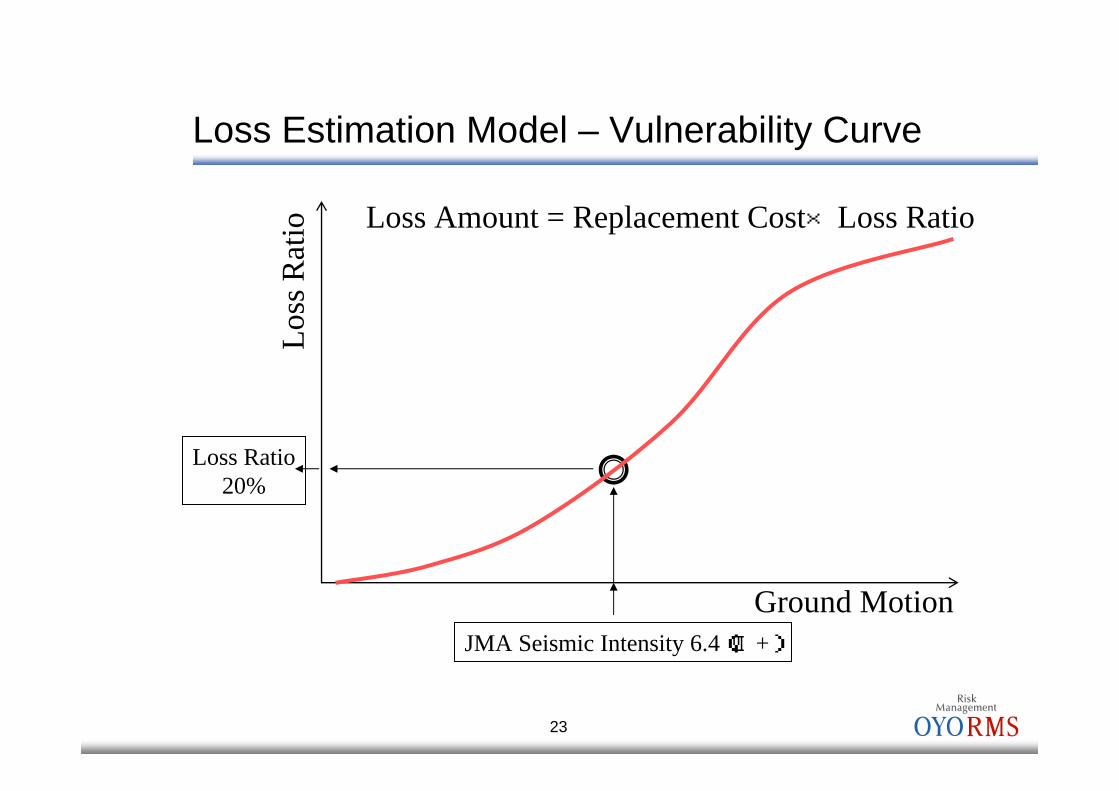
Ground MotionJMA Seismic Intensity 6.4(Ⅵ+)
Loss Ratio20%
Loss Amount = Replacement Cost×Loss Ratio
Loss Estimation Model – Vulnerability Curve

24
Levels of Analysis RigorThree Levels
Level 1 Statistical “desk top” analysisReplacement Value Location Construction ClassYear Build # of Stories Occupancy
Level 2 Enhanced analysis based on engineering review of design drawings and calculations. Yields customized performance modelingLevel 3 Level 2 with inspection to determine “as-built” condition vs. original design. Yields customized performance modeling. Most rigorous, yet cost-effective assessment of risk.
Combination of different levels
25
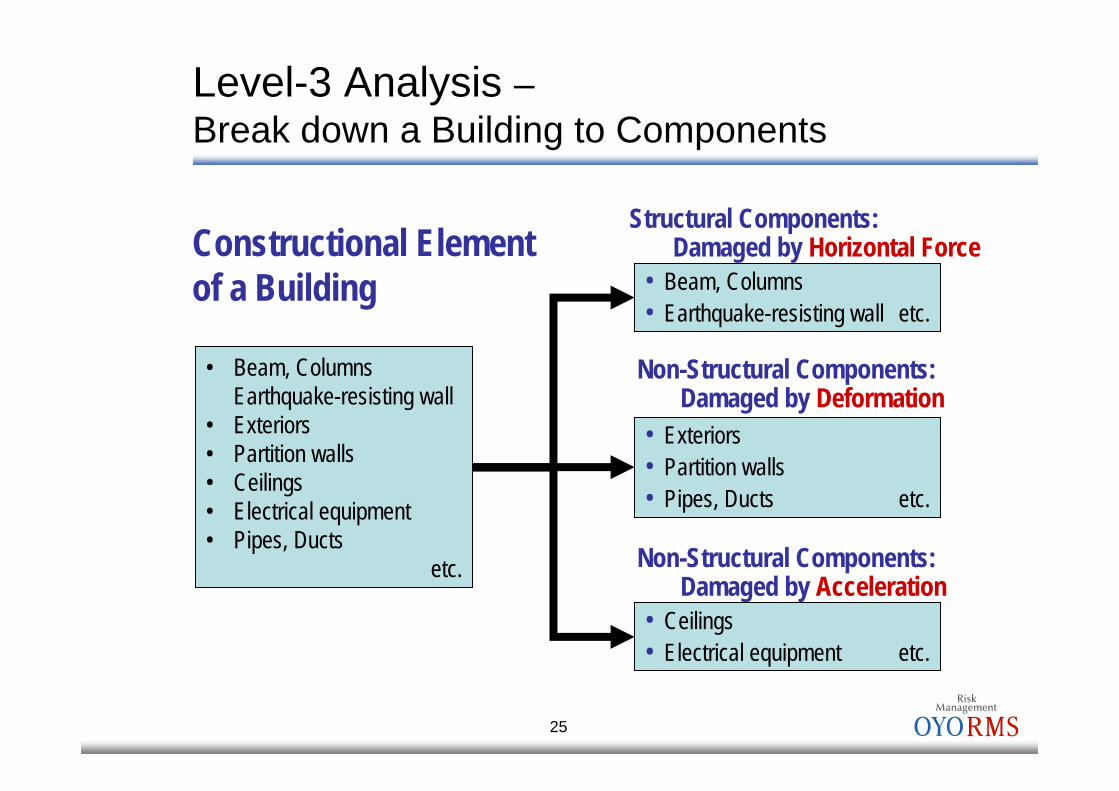
Constructional Element of a Building
Structural Components:Damaged by Horizontal Force
• Beam, Columns• Earthquake-resisting wall etc.
• Ceilings• Electrical equipment etc.
• Exteriors• Partition walls • Pipes, Ducts etc.
• Beam, ColumnsEarthquake-resisting wall
• Exteriors• Partition walls• Ceilings• Electrical equipment• Pipes, Ducts
etc.
Level-3 Analysis –Break down a Building to Components
Non-Structural Components:Damaged by Deformation
Non-Structural Components:Damaged by Acceleration
26
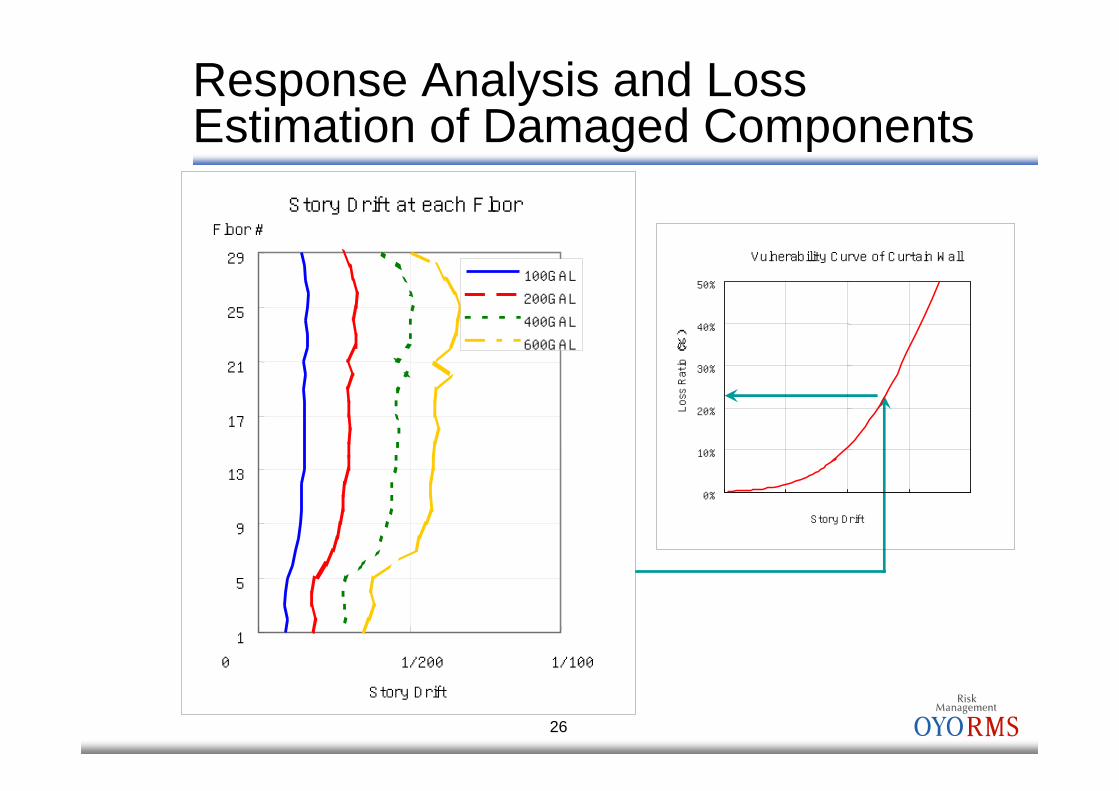
Response Analysis and Loss Estimation of Damaged Components
Story Drift at each Floor
1
5
9
13
17
21
25
29
0 1/200 1/100
Story Drift
Floor #
100GAL
200GAL
400GAL
600GAL
Vulnerability Curve of Curtain Wall
0%
10%
20%
30%
40%
50%
Story Drift
Loss Ratio (%)
27
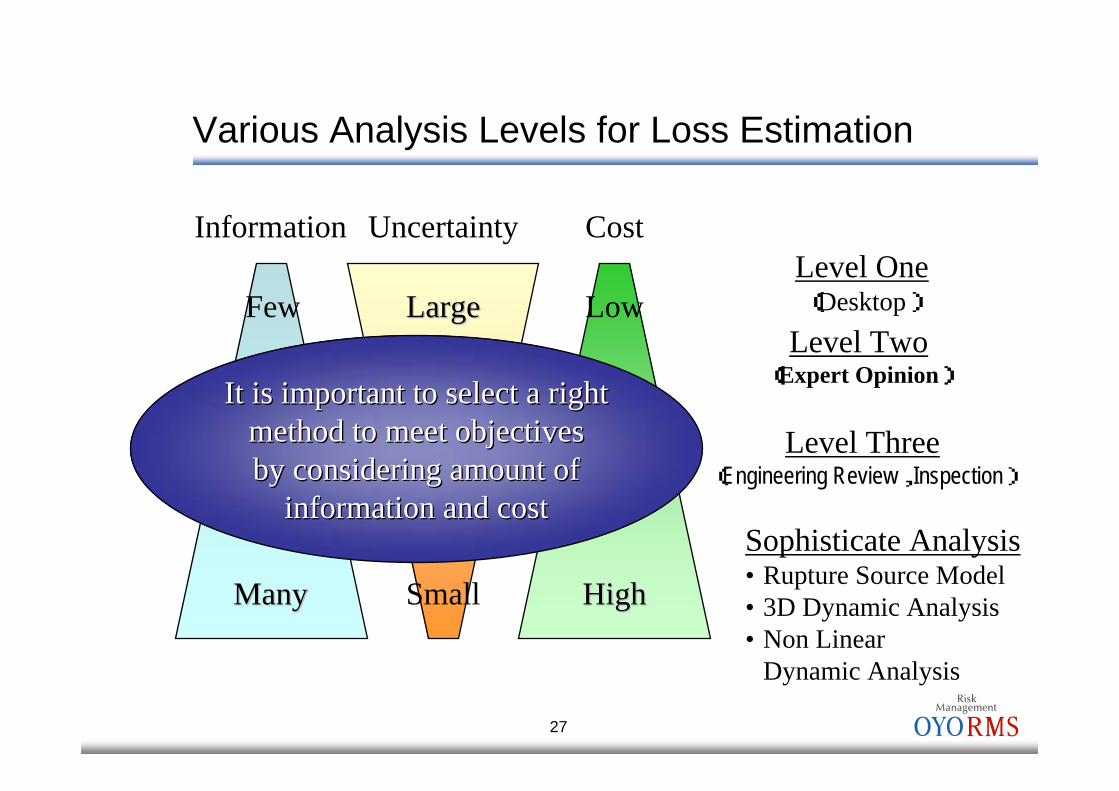
Various Analysis Levels for Loss Estimation
Information
Few
ManyMany
Cost
Low
HighHigh
Uncertainty
Small
LargeLargeLevel One(Desktop)
Level Three(Engineering Review,Inspection)
Sophisticate Analysis• Rupture Source Model• 3D Dynamic Analysis• Non Linear
Dynamic Analysis
It is important to select a right It is important to select a right method to meet objectives method to meet objectives by considering amount of by considering amount of
information and costinformation and cost
Level Two(Expert Opinion)
28
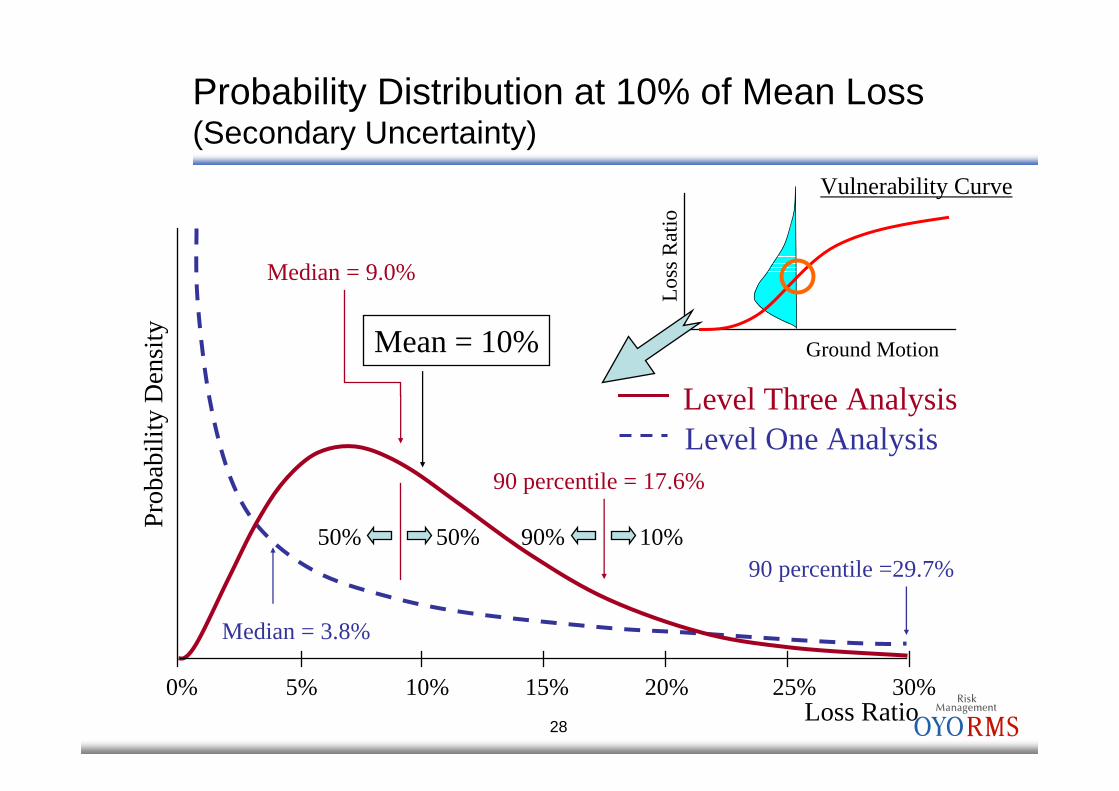
Median = 3.8%
90 percentile = 17.6%
90 percentile =29.7%
Level One Analysis
10%90%50%50%
Median = 9.0%
Mean = 10%
Level Three Analysis
0% 5% 10% 15% 20% 25% 30%Loss Ratio
Prob
abili
ty D
ensi
ty
Ground Motion
Loss
Rat
io
Vulnerability Curve
Probability Distribution at 10% of Mean Loss(Secondary Uncertainty)
29
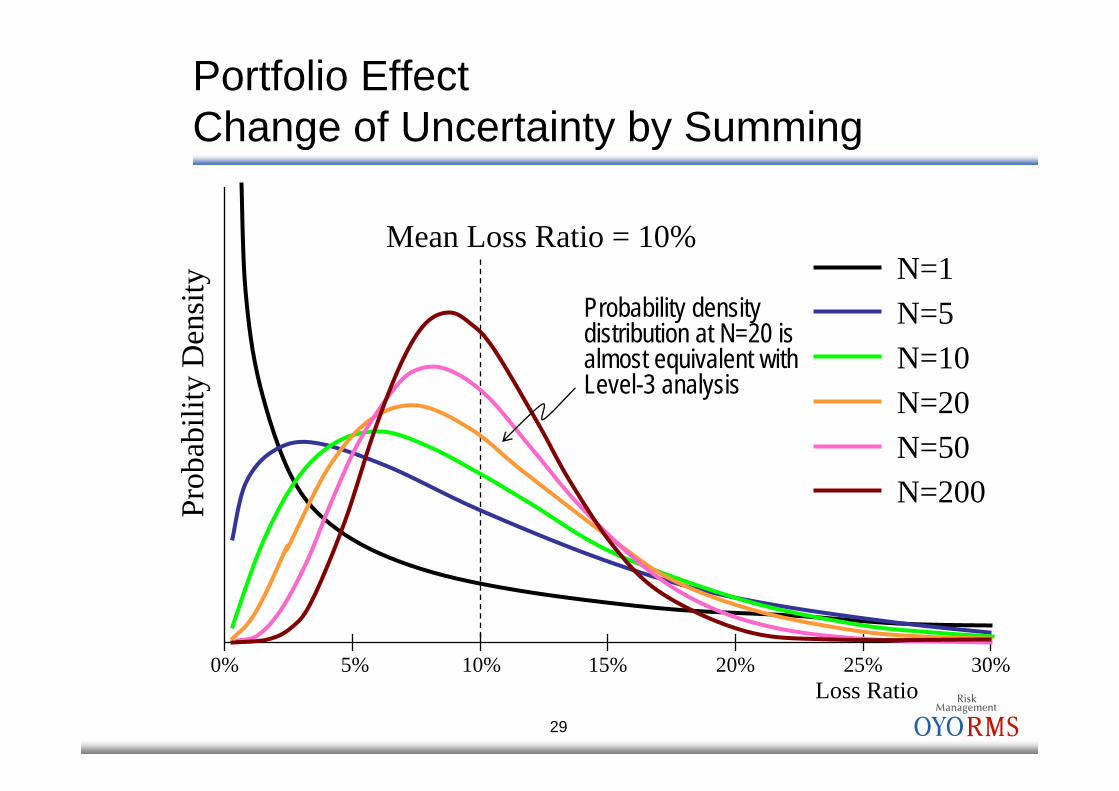
Mean Loss Ratio = 10%N=1N=5N=10N=20N=50N=200
0% 5% 10% 15% 20% 25% 30%Loss Ratio
Prob
abili
ty D
ensi
ty
Probability density distribution at N=20 is almost equivalent with Level-3 analysis
Portfolio EffectChange of Uncertainty by Summing
30
0 %
1 %
2 %
3 %
4 %
5 %
6 %
7 %
8 %
9 %
1 0 %
0 5 1 0 1 5 2 0 2 5 3 0 3 5
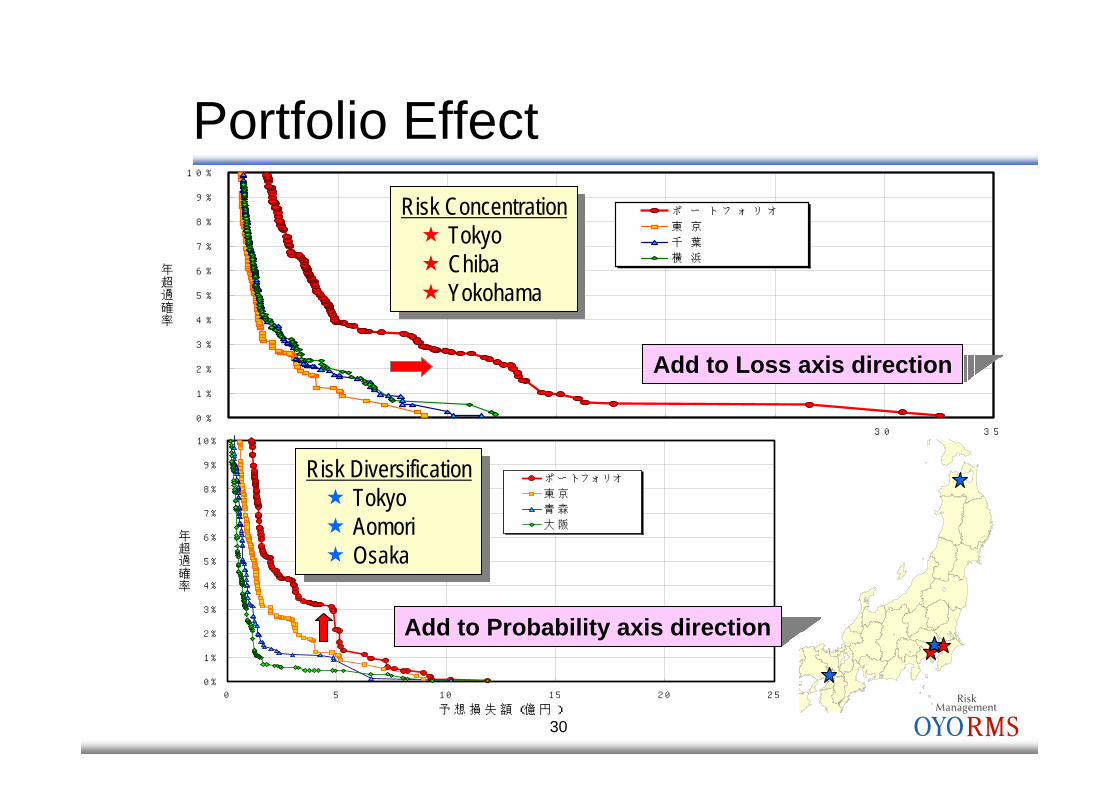
予 想 損 失 額 ( 億 円 )
年超過確率
ポ ー ト フ ォ リ オ
東 京
千 葉
横 浜
Portfolio Effect
0 %
1 %
2 %
3 %
4 %
5 %
6 %
7 %
8 %
9 %
1 0 %
0 5 1 0 1 5 2 0 2 5
予 想 損 失 額 (億 円 )
年超過確率
ポ ー トフ ォ リオ
東 京
青 森
大 阪
Risk ConcentrationTokyoChibaYokohama
Risk ConcentrationTokyoChibaYokohama
Risk DiversificationTokyoAomoriOsaka
Risk DiversificationTokyoAomoriOsaka
Add to Loss axis direction
Add to Probability axis direction
31
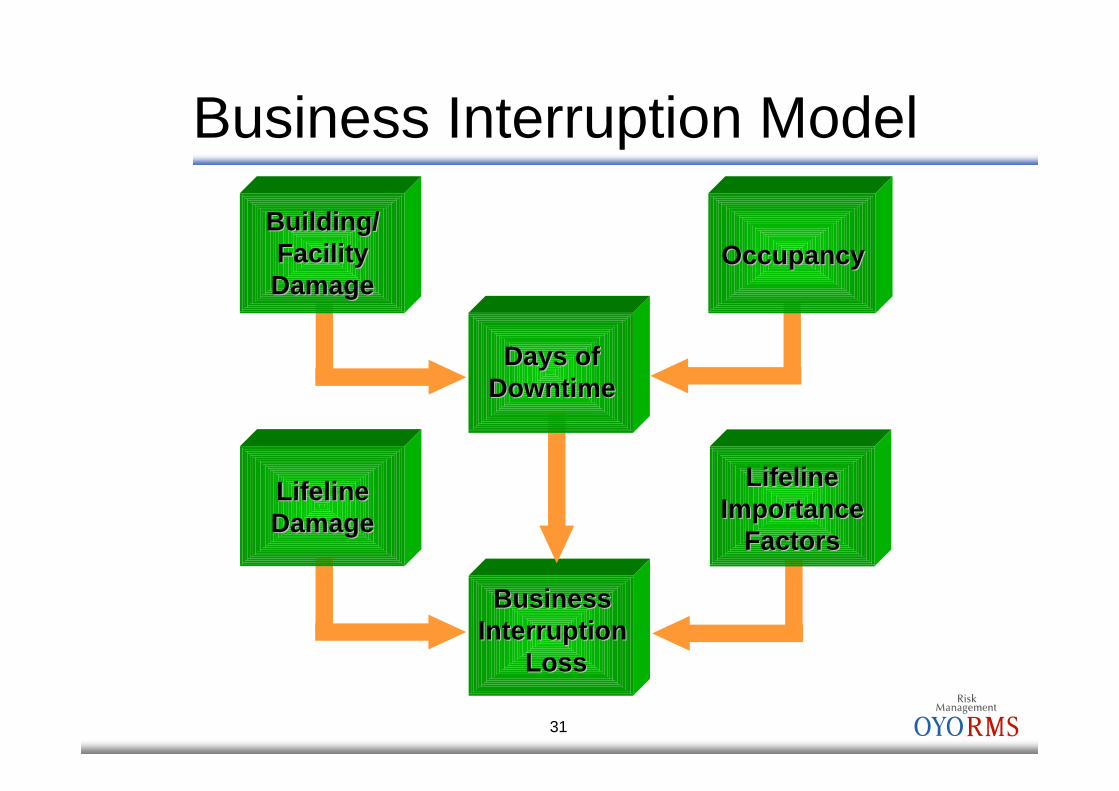
Building/Building/FacilityFacilityDamageDamage
OccupancyOccupancy
LifelineLifelineDamageDamage
LifelineLifelineImportanceImportance
FactorsFactors
BusinessBusinessIInterruptionnterruption
LossLoss
Days ofDays ofDowntimeDowntime
Business Interruption Model

32
0
30
60
100
D30 D60 D100
Res
tore
d Fu
nctio
n (%
)
Days
Total Days ofTotal Days ofDowntimeDowntime
BI Loss= Days of Downtime×Income per Day
Facility Restoration Function – BI Model

33
Facility Restoration Function(Specific Occupancy Class)
0%
10%
20%
30%
40%
50%
60%
70%
80%
90%
100%
0 100 200 300 400 500Days
Restored Function (%)
0-1% 1-10% 10-30% 30-60% 60-100% 100%Loss Ratio

34
Casualty Model
Simulated Simulated Catastrophic Catastrophic
EventsEventsBuilding damage and collapse distributions by building type; Building damage and collapse distributions by building type;
population injured, entrapped, rescued, and injury distributionspopulation injured, entrapped, rescued, and injury distributions
Exposure DataExposure Data
Geographic distribution of people, building type, time of dayGeographic distribution of people, building type, time of day
Casualties & Casualties & Losses by Losses by event forevent for
RiskRisk CCurveurve Permanent Total
Temporary Total
Permanent Partial-Minor
Permanent Partial-Major
Fatal Medical Only
Treatment costsTreatment costsInsurance claims Insurance claims
settlementssettlements

35
Scenario Results
24Fatalities25Fatalities
1Permanent Total
15PP-major
45PP-minor
425
Temporary Total635Serious
ModeledEstimated
Actual
Niigataken-Chuetsu, 10/23/2004, 17:56, M6.8
Kobe, 1/17/1995, 5:46, M7.2
5,3005,500Fatalities
325300Permanent Total
1,1001,000PP-major
2,8002,400PP-minor
12,0008,000Temporary Total
ModeledEstimated Actual

36
0 500 1,000 1,500 2,000 2,500
868-1 相模トラフ(1703年元禄地震) M8.25
877-1 相模トラフ(最大級の関東大地震) M8.10
865-1 相模トラフ(関東大地震再来) M7.90
867-3 相模トラフ(直下型) M7.20
867-4 相模トラフ(直下型) M7.20
867-2 相模トラフ(直下型) M7.20
475-1 関東山地周辺 M6.80
32-1 元荒川断層帯 M7.20
33-1 荒川断層 M7.00
865-5 相模トラフ(関東大地震再来) M7.40
474-1 関東山地周辺 M6.80
867-1 相模トラフ(直下型) M7.20
867-7 相模トラフ(直下型) M7.20
867-6 相模トラフ(直下型) M7.20
867-8 相模トラフ(直下型) M7.20
Estimated Loss (million Yen)
90 percentile lossMean loss
Estimated Loss of each Stochastic Events

37
5
4
3
2
1
・・・
8.5
9.6
11.2
13.0
13.6
Estimated Loss(billion Yen)
0.877%0.172%867-02M7.20
・・・・・・・・・
0.706%0.177%867-03M7.20
0.530%0.290%865-01M7.90
0.241%0.142%877-01M8.10
0.100%0.100%868-01M8.25
Cumulative Annual Probability of Exceedance
Annual Probability of Event OccurrenceEvent #
1
32
4
5
0%
1%
2%
3%
4%
5%
0 2 4 6 8 10 12 14 16
Estimated Loss (billion Yen)
Prob
abili
ty o
f Exc
eedi
ng a
Spe
cific
Los
s Lev
elEvent Curve

38
0%
1%
2%
3%
4%
5%
Worst case scenario¥13.6 billion
At least, ¥8.2 billion is expected within the next 100-year period
12
34
5
Annual Average LossAnnual Average Loss
Annual Average Loss (AAL)=Σ(Estimated Loss×Annual Probability of Occurrence)=Σ(Estimated Loss/Return Period)
⇒ Expected Loss per Year
Interpretation on Event CurvePr
obab
ility
of E
xcee
ding
a S
peci
fic L
oss L
evel
0 2 4 6 8 10 12 14 16
Estimated Loss (billion Yen)

39
Estimated Loss
90 percentile loss
Mean loss
Loss Distribution Reflects Potential Levels of Damage from a Single Event
Ann
ual E
xcee
danc
e Pr
obab
ility

40
Risk CurveExceedance Probability Curve with Secondary Uncertainty
=
Risk CurveRisk CurveExceedance Probability Curve with Secondary Uncertainty
Σ
L
Ann
ual E
xcee
danc
e Pr
obab
ility
Estimated Loss

41
Event Curve vs. Risk Curve
0.0%
0.5%
1.0%
1.5%
2.0%
2.5%
3.0%
3.5%
4.0%
4.5%
5.0%
0 5 10 15 20 25
Estimated Loss (billion Yen)
Event Curve (Mean)
Event Curve (90 percentile)
Risk Curve with 2ndary Uncertainty
Ann
ual E
xcee
danc
e Pr
obab
ility
Substantial Difference on Annual Exceedance Probability
Event Curve: Event OccurrenceRisk Curve: Loss Occurrence
Substantial Difference on Annual Exceedance Probability
Event Curve: Event OccurrenceRisk Curve: Loss Occurrence

42
- 2 0 0 0 - 1 5 0 0 - 1 0 0 0 - 5 0 0 0 5 0 0 1 0 0 0
V a lu e
Aggregated Risk
-200 -100 0 100 200 300
V alu e
Market Risk
-1000 -800 -600 -400 -200 0
V alu e
Credit Risk-300 -200 -100 0 100 200
V alu e
Financial Risk
-600 -400 -200 0 200 400 600
V alue
Operation RiskCorrelationCorrelation
-1000 -800 -600 -400 -200 0
V alue
-1000 -800 -600 -400 -200 0
V alue
AggregationsAggregations
CAT Risk
Non-CAT Risk
Aggregation of Risks

43
Event Curve vs. Risk Curve
0%
1%
2%
3%
4%
5%
0 5 10 15 20 25 30 35 40
Event Curve (Mean)
Risk Curve with Small Uncertainty
Risk Curve with Large Uncertainty
Estimated Loss (billion Yen)
Ann
ual E
xcee
danc
e Pr
obab
ility

44
Estimated Loss (billion Yen)
p
Lp
+
Expected Loss (AAL):Expected Loss (AAL): EpEp
= Ep / p
TCE Cruve
TCE(Tail Conditional Expectation)A
nnua
l Exc
eeda
nce
Prob
abili
ty

45
TCE(Tail Conditional Expectation)
0.0%
0.5%
1.0%
1.5%
2.0%
2.5%
3.0%
3.5%
4.0%
4.5%
5.0%
0 500 1,000 1,500 2,000 2,500 3,000
予想損失額(百万円)
年超過確率
リスクカーブ(二次の不確実性を含む)
イベントカーブ(平均値)
イベントカーブ(90%タイル値)
超過損失リスクを考慮したリスクカーブ
Ann
ual E
xcee
danc
e Pr
obab
ility
Estimated Loss (million Yen)
Risk Curve with 2ndary UncertaintyEvent Curve (Mean)Event Curve (90 percentile)TCE Curve

46
Loss by Physical Damages
Losses byBusiness Interruptions
Damages of Inventory Assets
Losses by facility damages
Drop in Sales/ProfitDepletion of CashDepletion of Earnings
Extraordinary LossDepletion of Liquid Asset
Extraordinary LossDepletion of Fix Assets
AmortizationDepletion of Cash
New Asset(after recovery)
Extraordinary Loss /Non-operating Expense
Depletion of Cash
Income Statement(P/L)
Balance Sheet(Assets Side)
Loss of Booked Values
Restoration Cost excluding the above (Asset Capitalization )
Repairing CostDismantlement Cost, etc.
Estimated Losses and Financial Statements

47
Study on Risk Measures by Using Risk Curve of Equity Capital
5 B Yen Depletion ofEquity Capital
Possible Occurrencewith P% Probability
Risk Curve at Present
P%
P% of probability as the worst case scenario
for the study
7.5 B Yen
Acceptable Limit of Equity Capital Depletion
Require 2.5 billion yen to recover equity capital by insurance or others
Annu
al Ex
ceed
ance
Pro
babil
ity

48
Study on Risk Measures by Using Risk Curve of Equity Capital
P%3 B Yen
Risk Curve after Mitigation
As 3 B Yen is in acceptable range,additional financial measure is not required.
P% of probability as the worst case scenario
for the study
Risk Curve at Present
Acceptable Limit of Equity Capital Depletion
Annu
al Ex
ceed
ance
Pro
babil
ity
Depletion ofEquity Capital5 B Yen
Possible Occurrencewith P% Probability
Possible Occurrencewith P% Probability

49
ConclusionsAssessment technology on Seismic Risk hasalready reached at a certain level of probabilistic approach.Utilizing existing models is more efficient way to build specific risk models for financial institutes
First, a perspective model and then move to a detailed modelImplementing uncertainties adequately is very important for risk modeling.
Losses by earthquake will spread geographically and temporally
Limiting seismic risk to operational risk is an appropriate way?