Embed Size (px)
Citation preview
ECCM’99European Conference on
Computational Mechanics
August 31 – September 3München, Germany
SEISMIC SAFETY OF ROCKFILL DAMS
Konstantin Meskouris, Carsten Könke, Rostislav Chudoba
Lehrstuhl für Baustatik und BaudynamikRheinisch-Westfälische Technische Hochschule Aachen, Germany
e-mail:[email protected]
Volker Bettzieche
Entwicklungsabteilung TalsperrenwesenRuhrverband Essen, Germanye-mail: [email protected]
Key words: Earthquake, Finite Element Simulation, Rockfill Dams
Abstract. Structural stability of concrete or masonry arch dams can be assessed using thestandard Finite Element techniques. The sufficient safety is provided as long as thesuperposed stresses from all relevant loading cases remain smaller than the materialresistance. For earth- and rockfill dams the slope stability has to be proved. Taking intoaccount only the static loads, the method of Krey/Bishop can be used to determine the criticalslope exhibiting the minimum safety. The standard way to determine the slope stability underdynamic loading conditions is by a quasistatic Krey/Bishop method. In this method themaximum acceleration of the dam gravity center is multiplied by the mass and the resultingforce is compared with the restraining forces given by friction and cohesion along one slopecurve. This paper presents an alternative approach, which is based on a full dynamic responsecalculation of the dam structure in the time domain under all relevant loads.
K. Meskouris, C. Könke, R. Chudoba, V. Bettziechee
2
1 Introduction
German authorities require to perform detailed verification about the structural safety ofexisting water reservoir dams regularly. In the framework of this verification scheme, anumber of dams located in the Sauerland region, which are owned and operated by theRuhrverband Essen, have been explored. Following the experiences with the 1992 Roermondearthquake, the surveillance authorities imposed higher requirements on the earthquakeloading scenarios. The applied earthquake loading conditions will be discussed in detail inchapter 2.
Chapter 3 describes the Finite Element discretization and the relevant static loadingconditions, presenting the special problem of hang-up effects which can be observed inrockfill dam structures with a soft clay core and a stiff rock filling.
Structural stability of rockfill dams has to be proven by verification of an adequate slopestability. The standard procedure, taking into account only static loading conditions, has beengiven by Krey/Bishop. This method can not be directly extended to dynamic problems. In afirst approximation a quasistatic Krey/Bishop procedure can be used to determine minimumslope stability under dynamic loading. The basics of this simplified approach, which isusually taken for seismic safety calculations of dam structures, will be explained in chapter 4.
Chapter 5 presents an alternative approach, which is based on a full dynamic responsecalculation in time domain, taking into account all relevant static and dynamic loads.
2 Earthquake Loading
A detailed investigation about the seismic activity in the Sauerland has been performed by theGeological Institute of the University Cologne [1]. The critical load case has been defined, inaccordance with the surveillance authorities, as the safety earthquake with a frequency ofoccurrence to be once every 1000 years. Following current regulations for nuclear powerplants, only this seismic load case has to studied. The following vertical and horizontal peakaccelerations have to be considered for the investigated site (table 1):
peak accelerations [m/s2]
horizontal acceleration vertical acceleration
University of Cologne 0.45 0.25
Surveillance authority 0.56 0.18
Table 1: Peak accelerations in vertical and horizontal direction [m/s2]
ECCM '99, München, Germany
3
The difference in the prescribed peak accelerations can be explained by a reduction factor of80%, which has been applied by the Geological Institute of the University of Cologne, inorder to consider recent measurements. Measurements of the 1992 Roermond earthquakehave been showing that the predicted peak accelerations by the Murphy&O´Brien formula
log( ) , ,a Ih = +0 25 0 25 ah in cm/s2, (1)
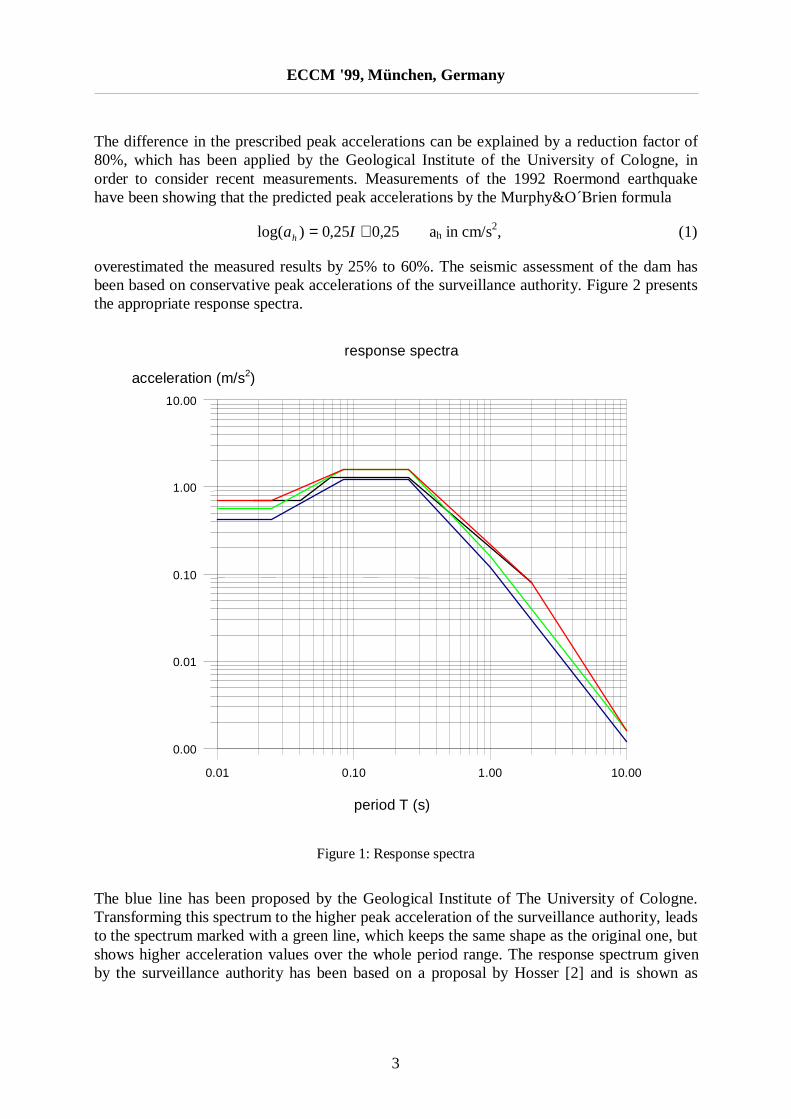
overestimated the measured results by 25% to 60%. The seismic assessment of the dam hasbeen based on conservative peak accelerations of the surveillance authority. Figure 2 presentsthe appropriate response spectra.
Figure 1: Response spectra
The blue line has been proposed by the Geological Institute of The University of Cologne.Transforming this spectrum to the higher peak acceleration of the surveillance authority, leadsto the spectrum marked with a green line, which keeps the same shape as the original one, butshows higher acceleration values over the whole period range. The response spectrum givenby the surveillance authority has been based on a proposal by Hosser [2] and is shown as
0.01 0.10 1.00 10.00
period T (s)
0.00
0.01
0.10
1.00
10.00
response spectra
acceleration (m/s2)
ECCM '99, München, Germany
4
black line in figure 2. As a conservative assumption the envelope of all three proposedspectra, shown as red line in figure 2, has been taken to generate artificial acceleration-timehistories. These acceleration-time histories, describing the free-field response, have beentransferred to the bedrock level by a deconvolution calculation.
3 Finite Element Model
3.1 Geometry and Finite Element Discretization
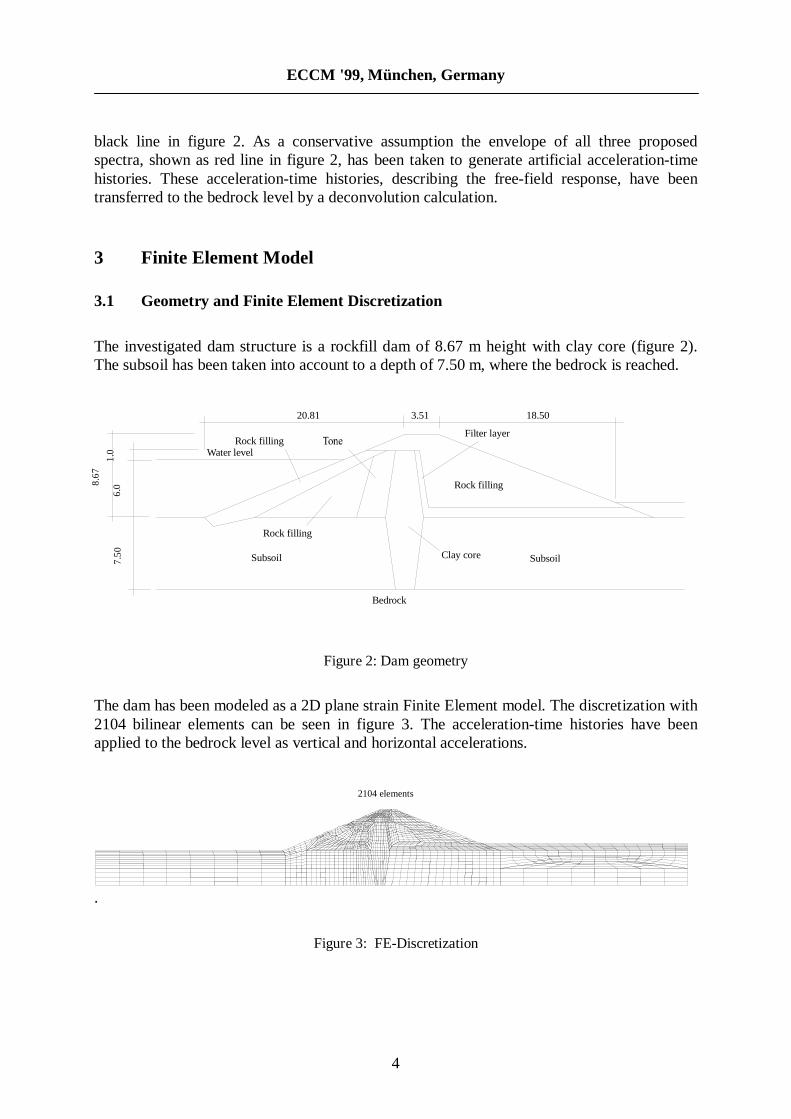
The investigated dam structure is a rockfill dam of 8.67 m height with clay core (figure 2).The subsoil has been taken into account to a depth of 7.50 m, where the bedrock is reached.
Figure 2: Dam geometry
The dam has been modeled as a 2D plane strain Finite Element model. The discretization with2104 bilinear elements can be seen in figure 3. The acceleration-time histories have beenapplied to the bedrock level as vertical and horizontal accelerations.
.
Figure 3: FE-Discretization
20.81 3.51 18.50
7.5
06
.01
.0
8.6
7
Rock fillingWater level
Rock filling
Clay core
Filter layer
Subsoil
Bedrock
Rock filling
Subsoil
2104 elements
ECCM '99, München, Germany
5
3.2 Dead load and hydrostatic water pressure
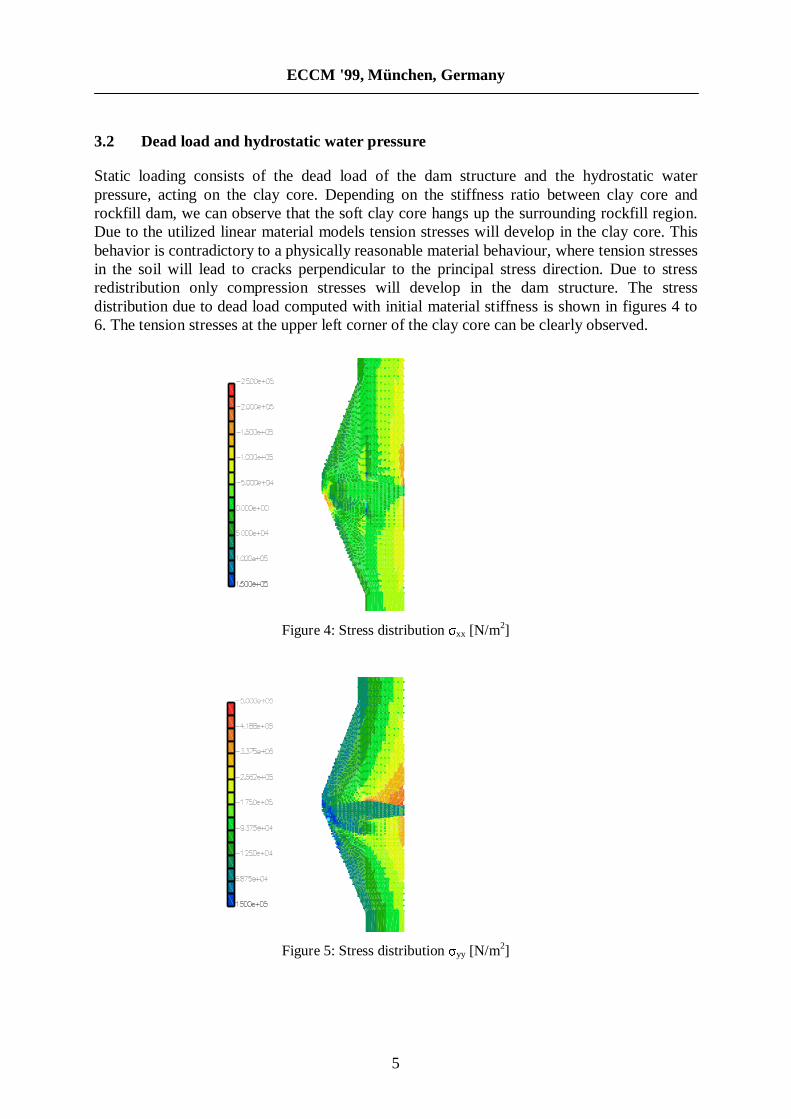
Static loading consists of the dead load of the dam structure and the hydrostatic waterpressure, acting on the clay core. Depending on the stiffness ratio between clay core androckfill dam, we can observe that the soft clay core hangs up the surrounding rockfill region.Due to the utilized linear material models tension stresses will develop in the clay core. Thisbehavior is contradictory to a physically reasonable material behaviour, where tension stressesin the soil will lead to cracks perpendicular to the principal stress direction. Due to stressredistribution only compression stresses will develop in the dam structure. The stressdistribution due to dead load computed with initial material stiffness is shown in figures 4 to6. The tension stresses at the upper left corner of the clay core can be clearly observed.
Figure 4: Stress distributionσxx [N/m2]
Figure 5: Stress distributionσyy [N/m2]
ECCM '99, München, Germany
6
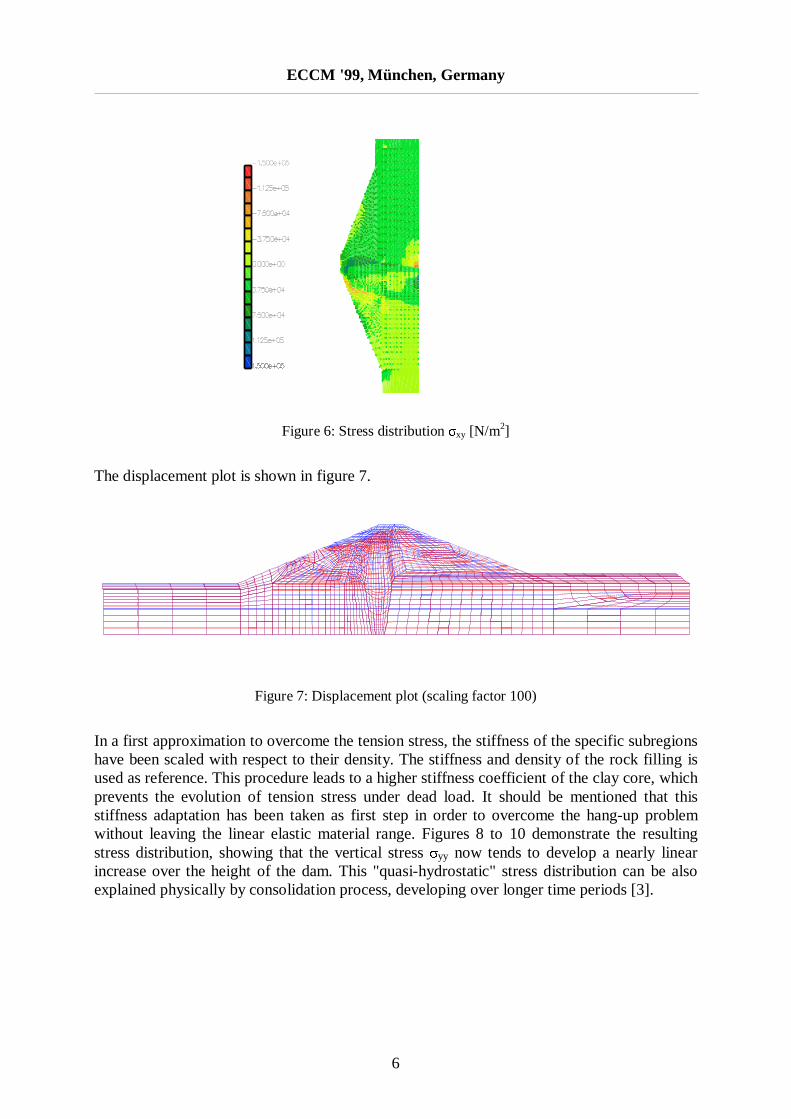
Figure 6: Stress distributionσxy [N/m2]
The displacement plot is shown in figure 7.
Figure 7: Displacement plot (scaling factor 100)
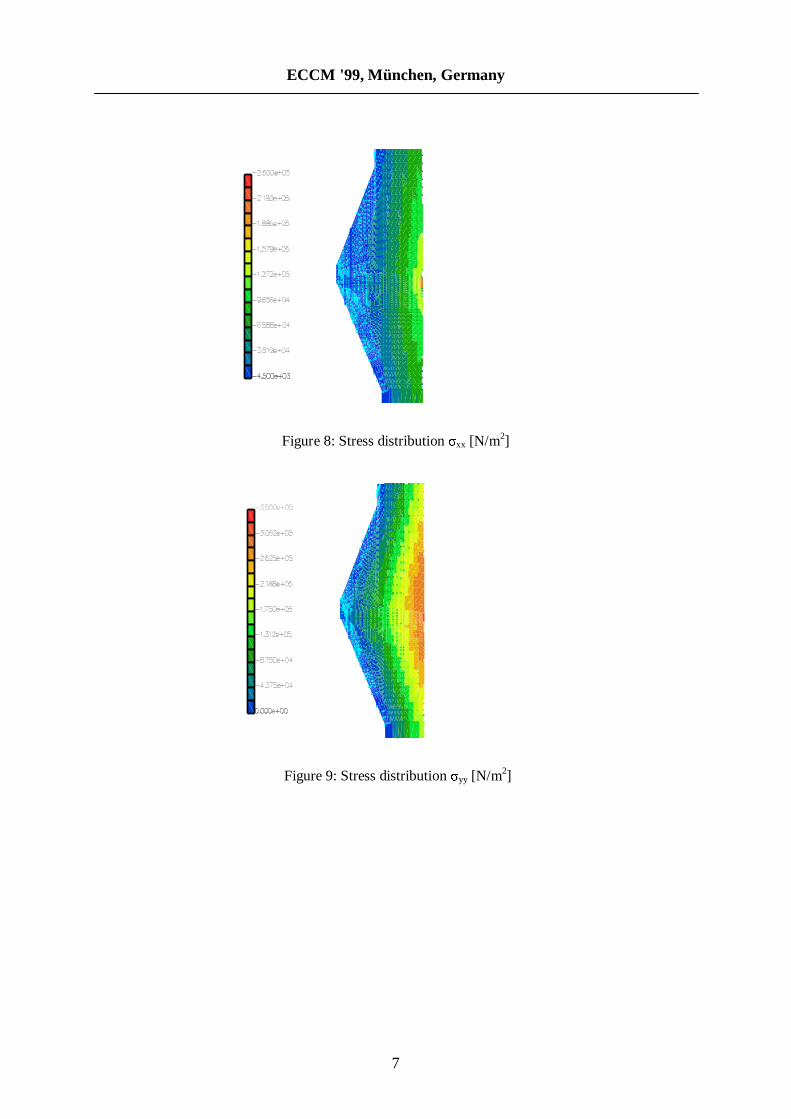
In a first approximation to overcome the tension stress, the stiffness of the specific subregionshave been scaled with respect to their density. The stiffness and density of the rock filling isused as reference. This procedure leads to a higher stiffness coefficient of the clay core, whichprevents the evolution of tension stress under dead load. It should be mentioned that thisstiffness adaptation has been taken as first step in order to overcome the hang-up problemwithout leaving the linear elastic material range. Figures 8 to 10 demonstrate the resultingstress distribution, showing that the vertical stressσyy now tends to develop a nearly linearincrease over the height of the dam. This "quasi-hydrostatic" stress distribution can be alsoexplained physically by consolidation process, developing over longer time periods [3].
ECCM '99, München, Germany
7
Figure 8: Stress distributionσxx [N/m2]
Figure 9: Stress distributionσyy [N/m2]
ECCM '99, München, Germany
8
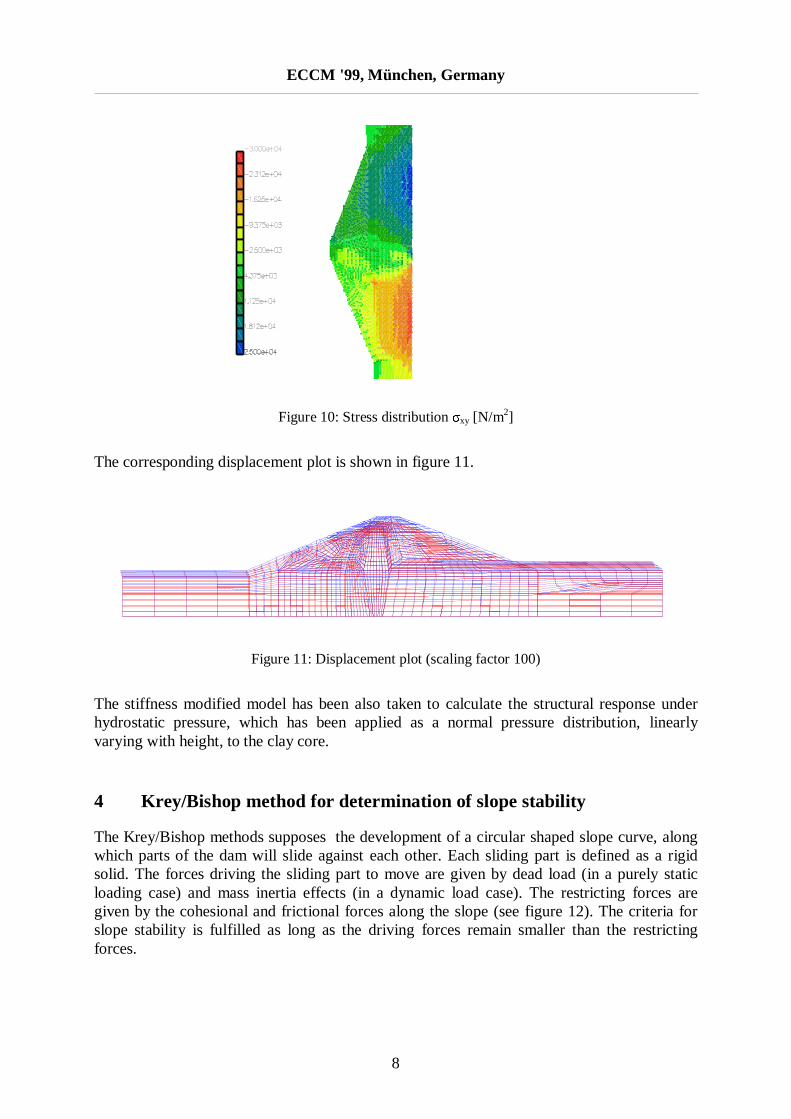
Figure 10: Stress distributionσxy [N/m2]
The corresponding displacement plot is shown in figure 11.
Figure 11: Displacement plot (scaling factor 100)
The stiffness modified model has been also taken to calculate the structural response underhydrostatic pressure, which has been applied as a normal pressure distribution, linearlyvarying with height, to the clay core.
4 Krey/Bishop method for determination of slope stability
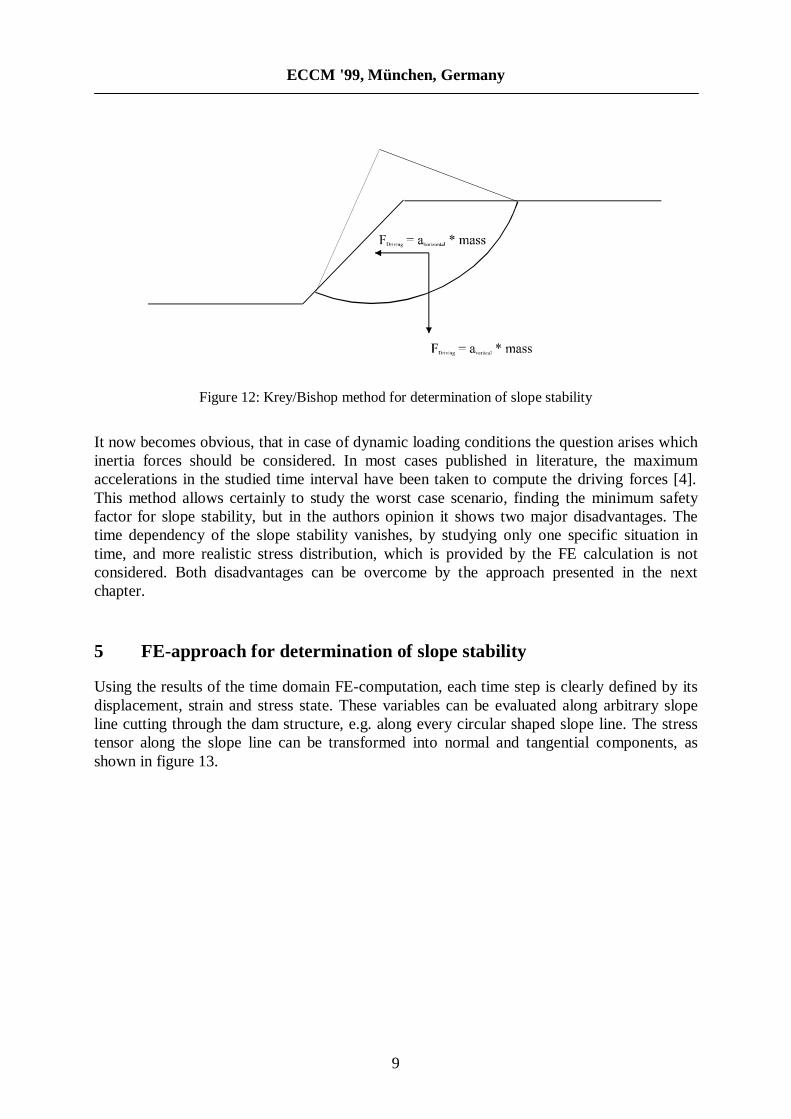
The Krey/Bishop methods supposes the development of a circular shaped slope curve, alongwhich parts of the dam will slide against each other. Each sliding part is defined as a rigidsolid. The forces driving the sliding part to move are given by dead load (in a purely staticloading case) and mass inertia effects (in a dynamic load case). The restricting forces aregiven by the cohesional and frictional forces along the slope (see figure 12). The criteria forslope stability is fulfilled as long as the driving forces remain smaller than the restrictingforces.
ECCM '99, München, Germany
9
Figure 12: Krey/Bishop method for determination of slope stability
It now becomes obvious, that in case of dynamic loading conditions the question arises whichinertia forces should be considered. In most cases published in literature, the maximumaccelerations in the studied time interval have been taken to compute the driving forces [4].This method allows certainly to study the worst case scenario, finding the minimum safetyfactor for slope stability, but in the authors opinion it shows two major disadvantages. Thetime dependency of the slope stability vanishes, by studying only one specific situation intime, and more realistic stress distribution, which is provided by the FE calculation is notconsidered. Both disadvantages can be overcome by the approach presented in the nextchapter.
5 FE-approach for determination of slope stability
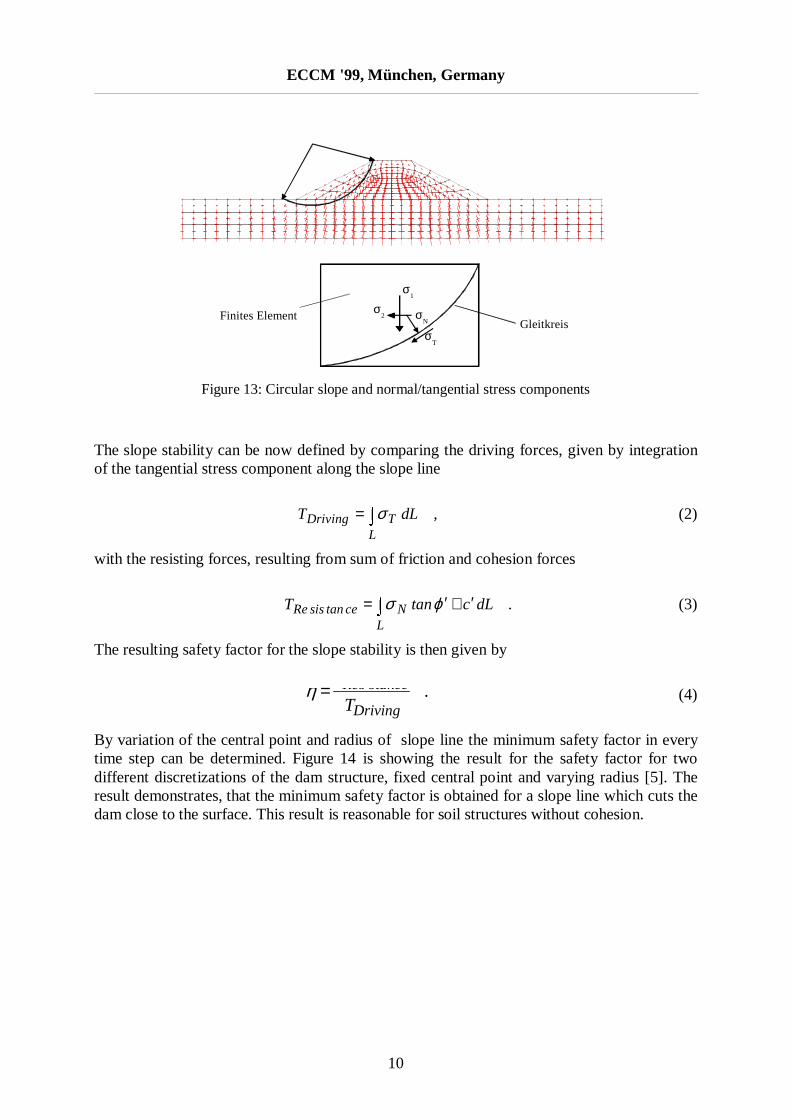
Using the results of the time domain FE-computation, each time step is clearly defined by itsdisplacement, strain and stress state. These variables can be evaluated along arbitrary slopeline cutting through the dam structure, e.g. along every circular shaped slope line. The stresstensor along the slope line can be transformed into normal and tangential components, asshown in figure 13.
ECCM '99, München, Germany
10
Figure 13: Circular slope and normal/tangential stress components
The slope stability can be now defined by comparing the driving forces, given by integrationof the tangential stress component along the slope line
,dLTL
TDriving �= σ (2)
with the resisting forces, resulting from sum of friction and cohesion forces
.dLctanTL
NcetansisRe � ′+′= ϕσ (3)
The resulting safety factor for the slope stability is then given by
.TDriving
cetans sRe=η (4)
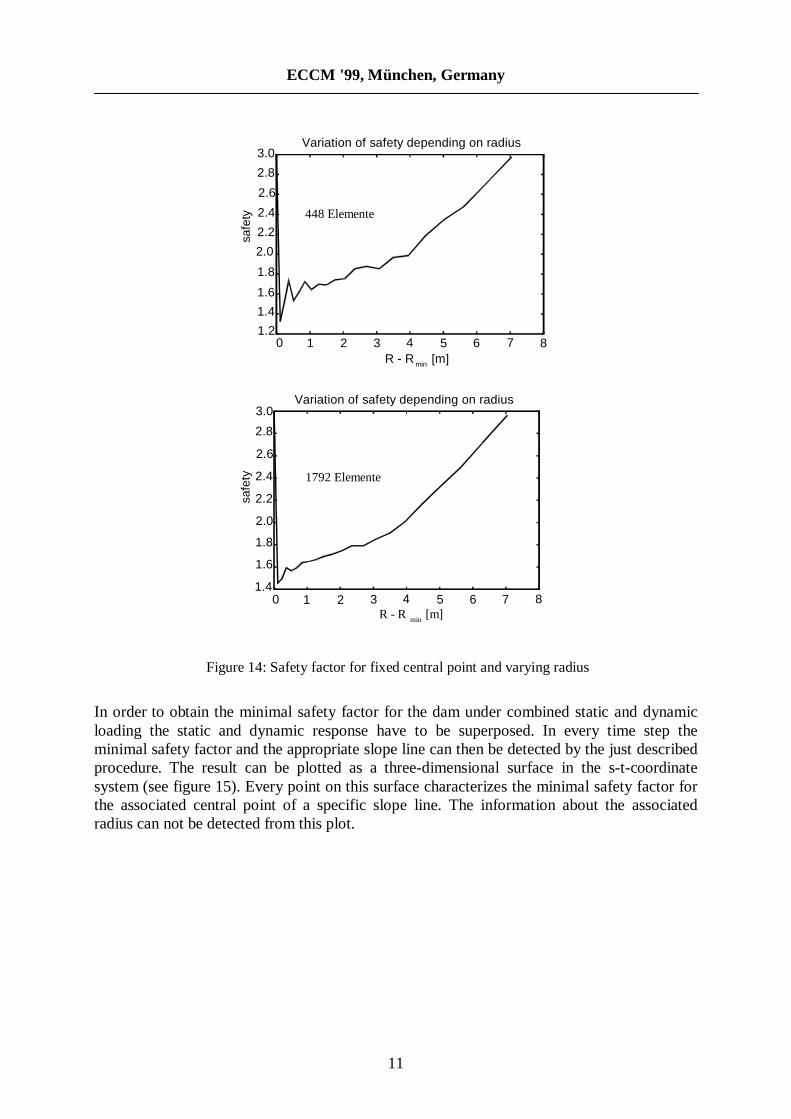
By variation of the central point and radius of slope line the minimum safety factor in everytime step can be determined. Figure 14 is showing the result for the safety factor for twodifferent discretizations of the dam structure, fixed central point and varying radius [5]. Theresult demonstrates, that the minimum safety factor is obtained for a slope line which cuts thedam close to the surface. This result is reasonable for soil structures without cohesion.
σ1
σ2 σ
N
σT
GleitkreisFinites Element
ECCM '99, München, Germany
11
Figure 14: Safety factor for fixed central point and varying radius
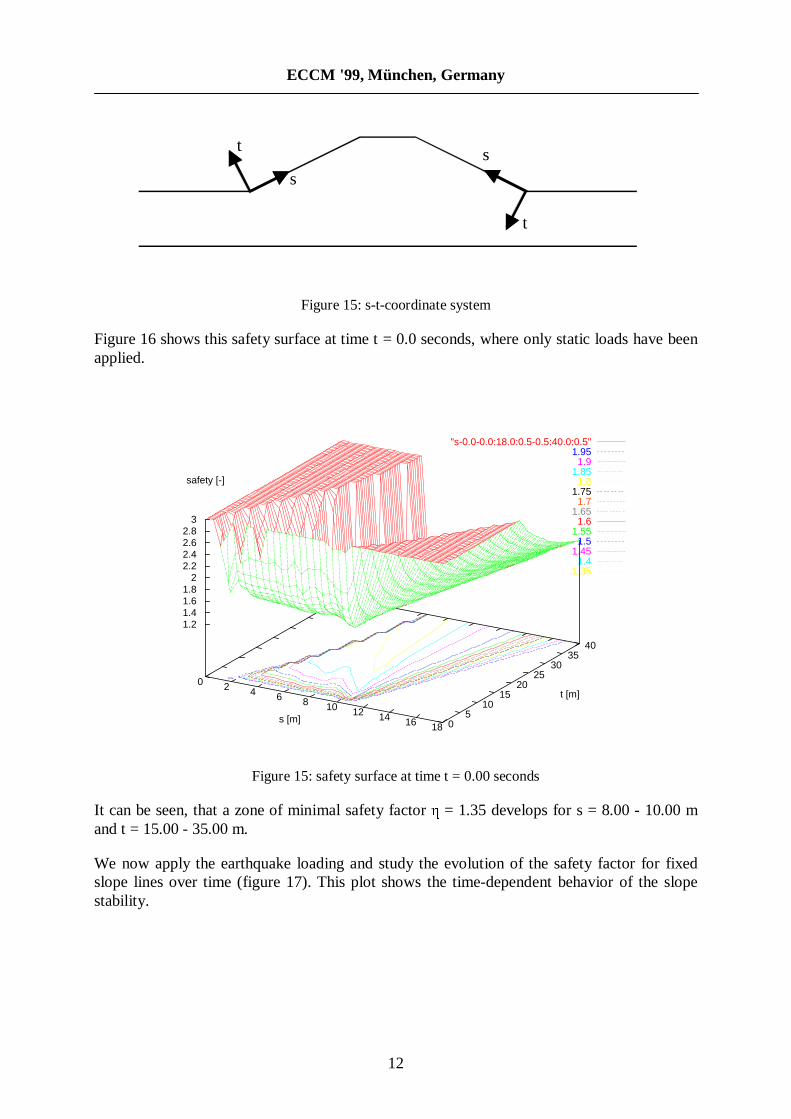
In order to obtain the minimal safety factor for the dam under combined static and dynamicloading the static and dynamic response have to be superposed. In every time step theminimal safety factor and the appropriate slope line can then be detected by the just describedprocedure. The result can be plotted as a three-dimensional surface in the s-t-coordinatesystem (see figure 15). Every point on this surface characterizes the minimal safety factor forthe associated central point of a specific slope line. The information about the associatedradius can not be detected from this plot.
1.2
1.4
1.6
1.8
2.0
2.2
2.4
2.6
2.8
3.0
0 1 2 3 4 5 6 7 8
safe
ty
R - R min [m]
Variation of safety depending on radius
1.4
1.6
1.8
2.0
2.2
2.4
2.6
2.8
3.0
0 1 2 3 4 5 6 7 8
safe
ty
Variation of safety depending on radius
448 Elemente
1792 Elemente
R - R min [m]
ECCM '99, München, Germany
12
Figure 15: s-t-coordinate system
Figure 16 shows this safety surface at time t = 0.0 seconds, where only static loads have beenapplied.
Figure 15: safety surface at time t = 0.00 seconds
It can be seen, that a zone of minimal safety factorη = 1.35 develops for s = 8.00 - 10.00 mand t = 15.00 - 35.00 m.
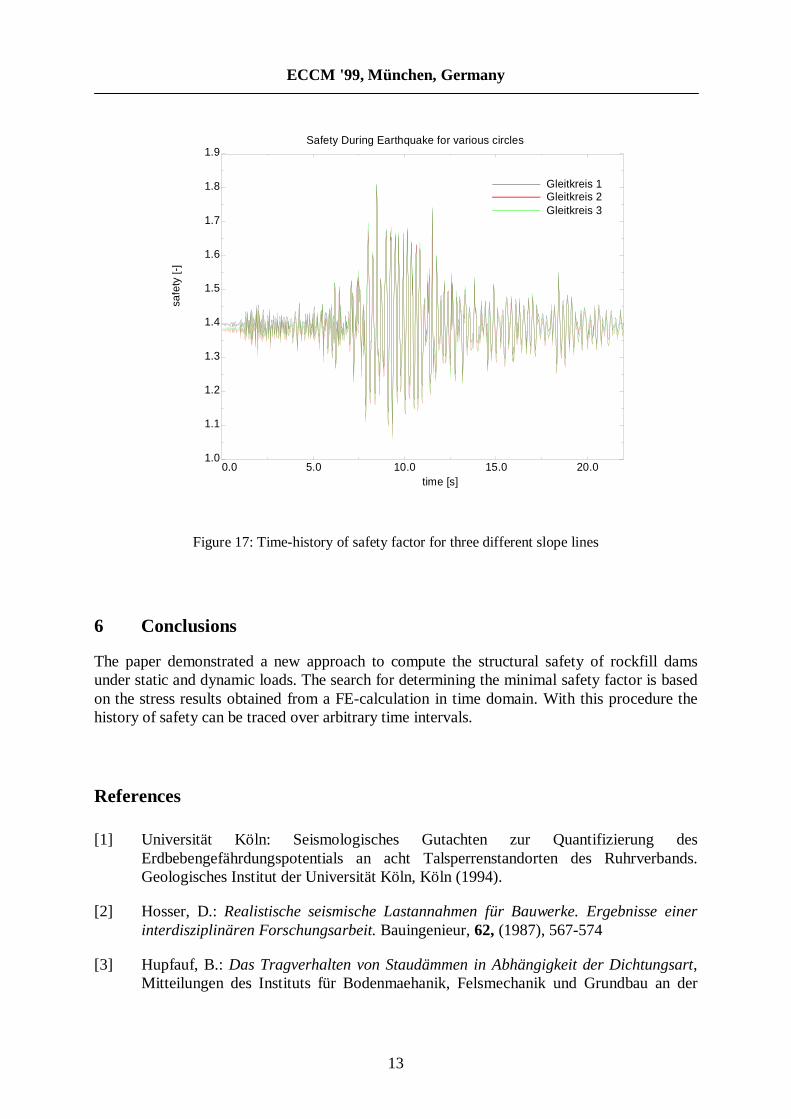
We now apply the earthquake loading and study the evolution of the safety factor for fixedslope lines over time (figure 17). This plot shows the time-dependent behavior of the slopestability.
t
s
s
t
"s-0.0-0.0:18.0:0.5-0.5:40.0:0.5" 1.95 1.9 1.85 1.8 1.75 1.7 1.65 1.6 1.55 1.5 1.45 1.4 1.35
0 2 4 6 8 10 12 14 16 18s [m] 0
510
1520
2530
3540
t [m]
1.21.41.61.8
22.22.42.62.8
3
safety [-]
ECCM '99, München, Germany
13
Figure 17: Time-history of safety factor for three different slope lines
6 Conclusions
The paper demonstrated a new approach to compute the structural safety of rockfill damsunder static and dynamic loads. The search for determining the minimal safety factor is basedon the stress results obtained from a FE-calculation in time domain. With this procedure thehistory of safety can be traced over arbitrary time intervals.
References
[1] Universität Köln: Seismologisches Gutachten zur Quantifizierung desErdbebengefährdungspotentials an acht Talsperrenstandorten des Ruhrverbands.Geologisches Institut der Universität Köln, Köln (1994).
[2] Hosser, D.:Realistische seismische Lastannahmen für Bauwerke. Ergebnisse einerinterdisziplinären Forschungsarbeit.Bauingenieur,62, (1987), 567-574
[3] Hupfauf, B.: Das Tragverhalten von Staudämmen in Abhängigkeit der Dichtungsart,Mitteilungen des Instituts für Bodenmaehanik, Felsmechanik und Grundbau an der
0.0 5.0 10.0 15.0 20.0time [s]
1.0
1.1
1.2
1.3
1.4
1.5
1.6
1.7
1.8
1.9
safe
ty[-
]
Safety During Earthquake for various circles
Gleitkreis 1Gleitkreis 2Gleitkreis 3

ECCM '99, München, Germany
14
Fakultät für Bauingenieurwesen und Architektur der Universität Innsbruck Heft 10,1991
[4] Papakyriakopoulos, P.:Verhalten von Erd- und Steinschüttdämmen unter Erdbeben,Fachbereich für Bauingenieur- und Vermessungswesen der Technischen UniversitätCarolo-Wilhelmina zu Braunschweig, 1982
[5] Grunendahl, A.: Zur Standsicherheit von Staudämmen unter Erdbebenlasten,Diplomarbeit am Lehrstuhl für Baustatik und Baudynamik, RWTH Aachen, 1998