Embed Size (px)
Citation preview
17/04/2015 Socitm | Platform for Research
http://www.socitmbenchmarking.co.uk/results.asp?c=o 1/25
Service Cost Assessment Service
17/04/2015Summary Report
Confidential
Published by the Society of Information Technology Management, 8a Basset Court, Grange Park, Northampton, NN4 5EZ.All rights reserved. This publication and the content of the online system from which it is derived may not be reproduced, stored in a retrieval system ortransmitted in any form or by any means electronic, mechanical, recording or otherwise without prior permission of the publisher.Please direct enquiries about this report or the Socitm Benchmarking ICT service to [email protected] (telephone: 01604 497587).Further information may be found on the Socitm website at www.socitm.net
Copyright 2015Socitm Ltd
17/04/2015 Socitm | Platform for Research
http://www.socitmbenchmarking.co.uk/results.asp?c=o 2/25
Summary ReportThis section examines the results for the following:
ICT Expenditure 2014/15 (£k)ICT Expenditure 2014/15 (£k)Percentage total expenditure spent on ICTICT spend per head of population (£)ICT spend per user (£)ICT total spend per device supported (£)Number of 'workstations' normalized to 100%Number of devices per userNumber of ICT staff (FTEs) employed by work areaNumber of ICT staff (FTEs) employed by work area normalized to 100%Number of users supported per ICT staff memberPercentage Central ICT staff leavingPercentage Central ICT staff joining% net change in staffing levels (Joiners Leavers)Percentage ICT staff turmoilSourcing model high level summarySourcing model detailed summarySharing status: relative frequency of partner type citations as % of grand totalSharing status: relative magnitude (number of sharing events) as % of grand total
Introductory NotesMedian and other quartile valuesOnly charts displaying a single parameter on the vertical axis show calculated 1st, 2nd and 3rd quartile values as coloured horizontal bars. The 2ndquartile value is otherwise known as the median value, i.e. the numerical value below which half of the sample lies and half above.
Median and other quartile values are generally considered to be more representative of a distribution of values than a single simple averagebecause they are not affected by any anomalously high or low outliers.
The median value may be coincidentally the same as the average value – the sum of all the vertical numerical axis values divided by the number ofdata points – but the two are calculated by different methods.
17/04/2015 Socitm | Platform for Research
http://www.socitmbenchmarking.co.uk/results.asp?c=o 3/25
Scope of benchmarkingThe benchmarking exercise covered the following aspects of service:
PROFILING THE SERVICE
Administrative dataICT estate and delivery modelStaffing resourcesFinancial resources
Method of benchmarkingService Cost Assessment participants should be aware that the utility of benchmarking comparisons depends greatly upon assuring that like iscompared with like. Your data is being compared to a selection from last year's submissions by Socitm's Benchmarking ICT Service (BICT)customers. This data set comprises:
2 English counties2 English districts4 English unitaries11 London boroughs3 Metropolitan boroughs12 Scottish unitaries1 Welsh unitary3 Australian councils2 Shared service arrangements1 National charity1 Housing association3 Others
There has been no attempt to assess the quality of match between yourself and the sizes and natures of the organisations in the comparator dataset nor have we worked with you to validate the quality of the data you have submitted. As a consequence of these limitations, the results of thisexercise should be used with due consideration of these facts.
Socitm BICT participants complete a more extensive questionnaire online, supported by a Socitm consultant. There is a launch workshop, anextensive period of data review and validation checking, and (in group exercises) results workshops before consultant and participant annotatedfinal reports are concluded. All participants utilise the same foundation set of questions and definitions of terms, which do evolve over time inconsultation with Socitm members.
17/04/2015 Socitm | Platform for Research
http://www.socitmbenchmarking.co.uk/results.asp?c=o 4/25
How to read this reportYour data is compared to that of others in the following charts. Where it is a simple bar chart, your data is the blue bar. Where it is a stacked barchart, your data is marked with a "Y" character (i.e. "You") on the horizontal axis. Some other charts explicitly label your data "You".
The other participants' data in a given chart has been anonymized by removing identifying axis labels and sorting the data in each chart so that barheights smoothly descend from left to right.
Where calculable, the first, second (median) and third quartile values are shown in the charts as coloured horizontal lines and the numerical valuesalso appear above the chart after the chart key.
17/04/2015 Socitm | Platform for Research
http://www.socitmbenchmarking.co.uk/results.asp?c=o 5/25
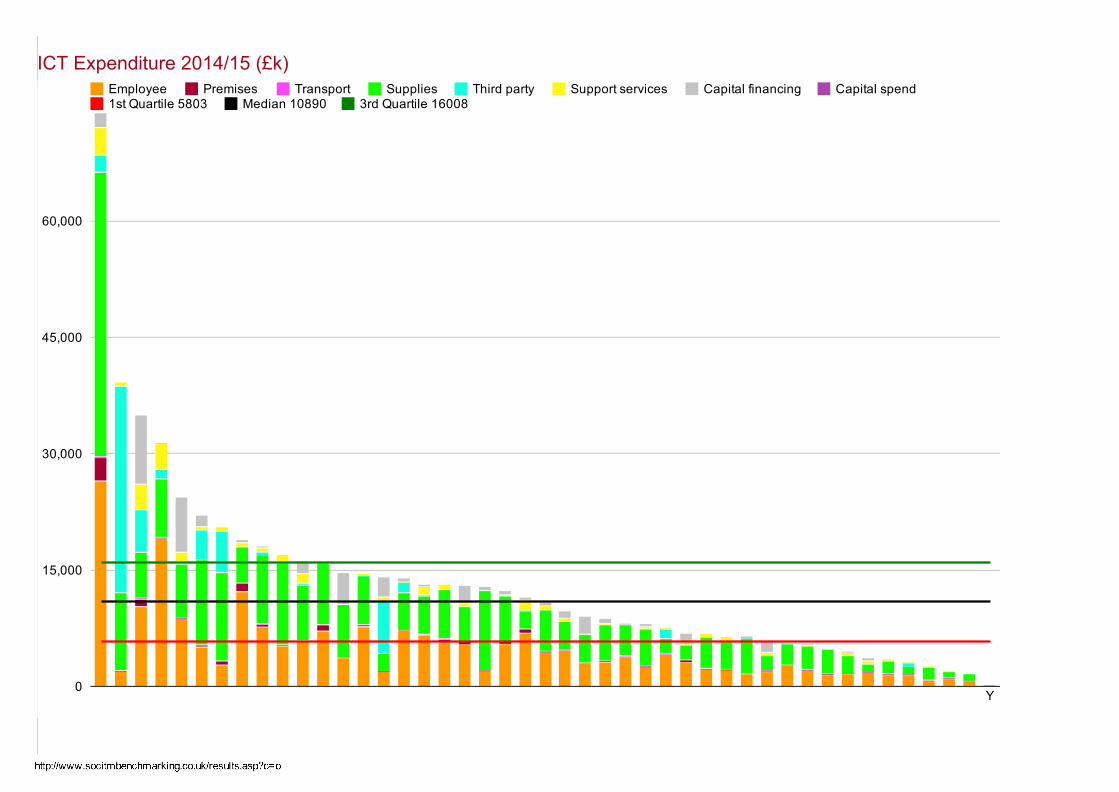
ICT Expenditure 2014/15 (£k)Employee Premises Transport Supplies Third party Support services Capital financing Capital spend1st Quartile 5803 Median 10890 3rd Quartile 16008
Y0
15,000
30,000
45,000
60,000
17/04/2015 Socitm | Platform for Research
http://www.socitmbenchmarking.co.uk/results.asp?c=o 6/25
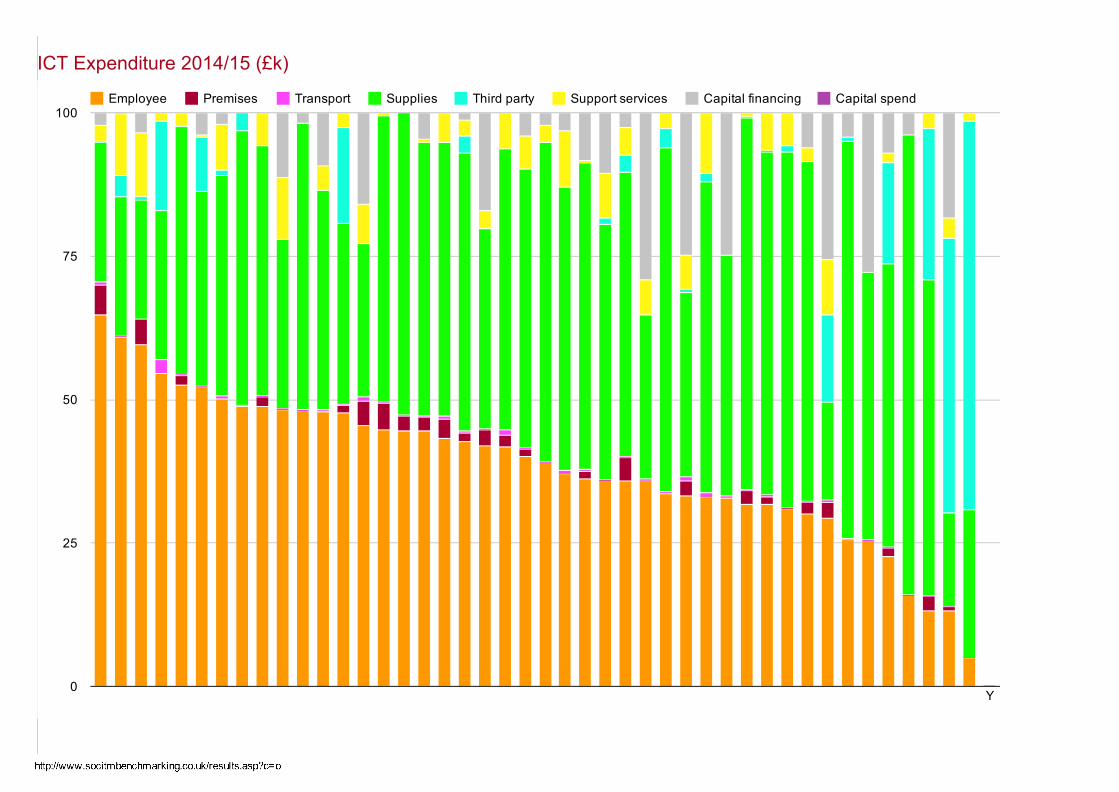
ICT Expenditure 2014/15 (£k)
Employee Premises Transport Supplies Third party Support services Capital financing Capital spend
Y0
25
50
75
100
17/04/2015 Socitm | Platform for Research
http://www.socitmbenchmarking.co.uk/results.asp?c=o 7/25
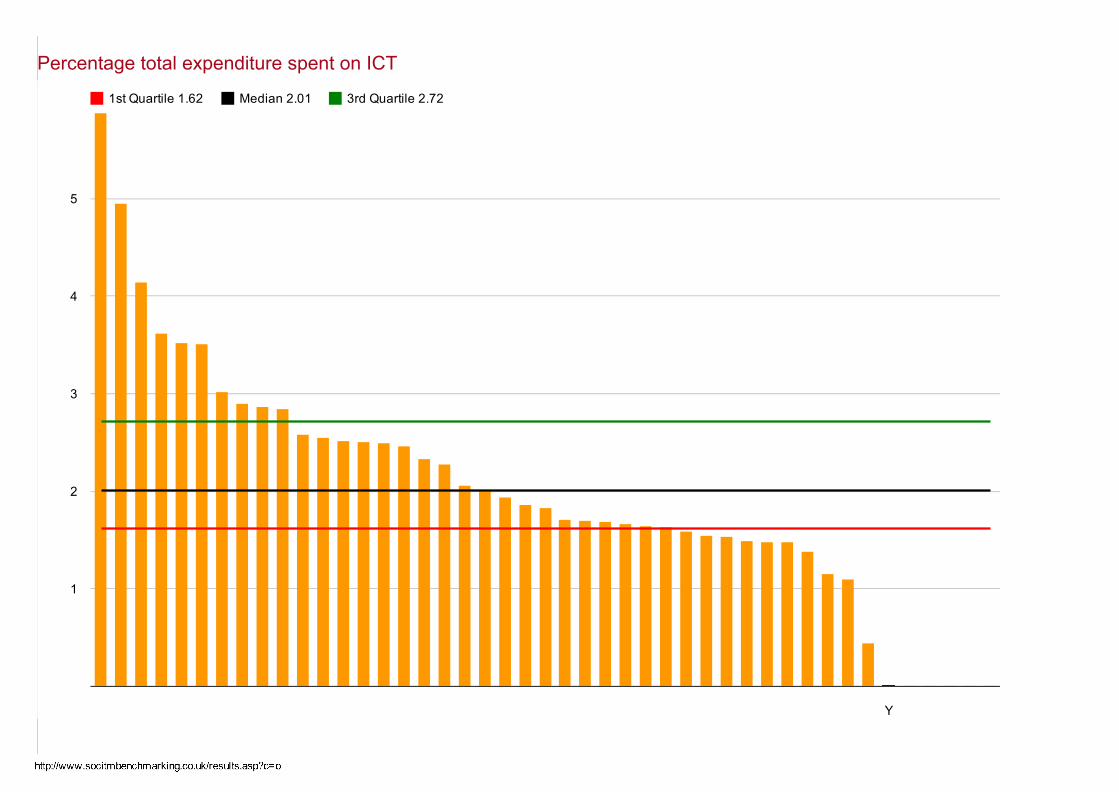
Percentage total expenditure spent on ICT
1st Quartile 1.62 Median 2.01 3rd Quartile 2.72
Y
1
2
3
4
5
17/04/2015 Socitm | Platform for Research
http://www.socitmbenchmarking.co.uk/results.asp?c=o 8/25
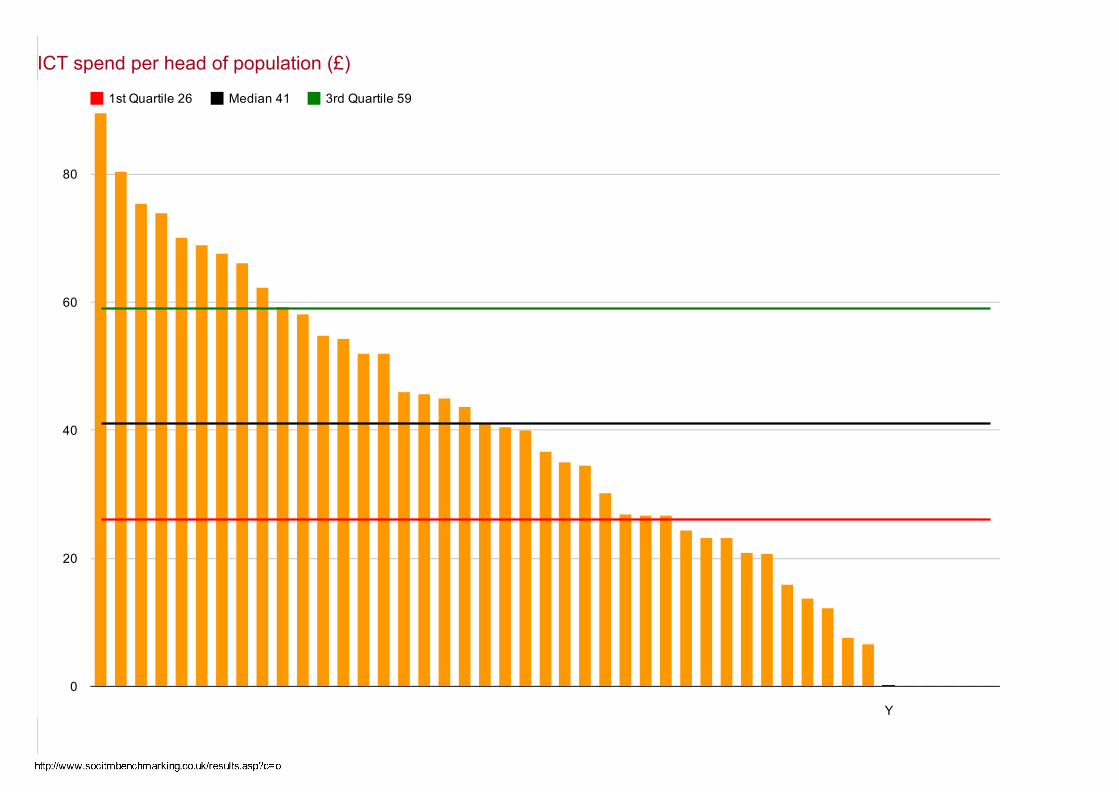
ICT spend per head of population (£)
1st Quartile 26 Median 41 3rd Quartile 59
Y
0
20
40
60
80
17/04/2015 Socitm | Platform for Research
http://www.socitmbenchmarking.co.uk/results.asp?c=o 9/25
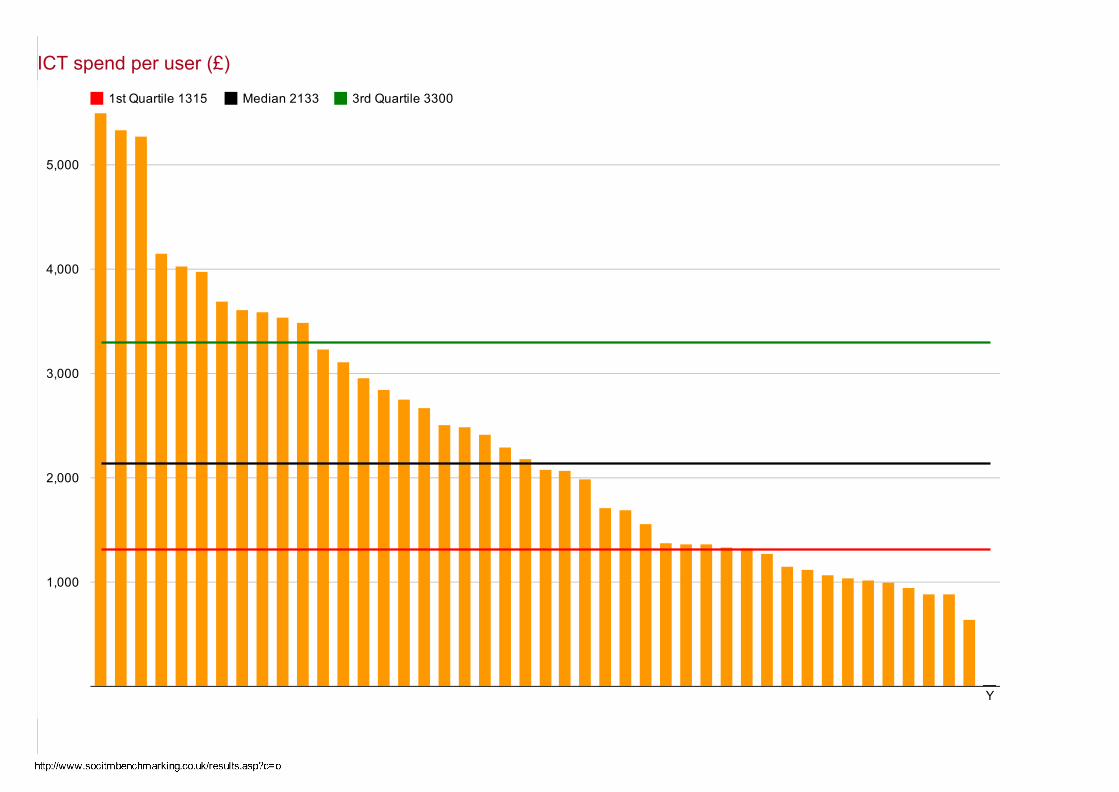
ICT spend per user (£)
1st Quartile 1315 Median 2133 3rd Quartile 3300
Y
1,000
2,000
3,000
4,000
5,000
17/04/2015 Socitm | Platform for Research
http://www.socitmbenchmarking.co.uk/results.asp?c=o 10/25
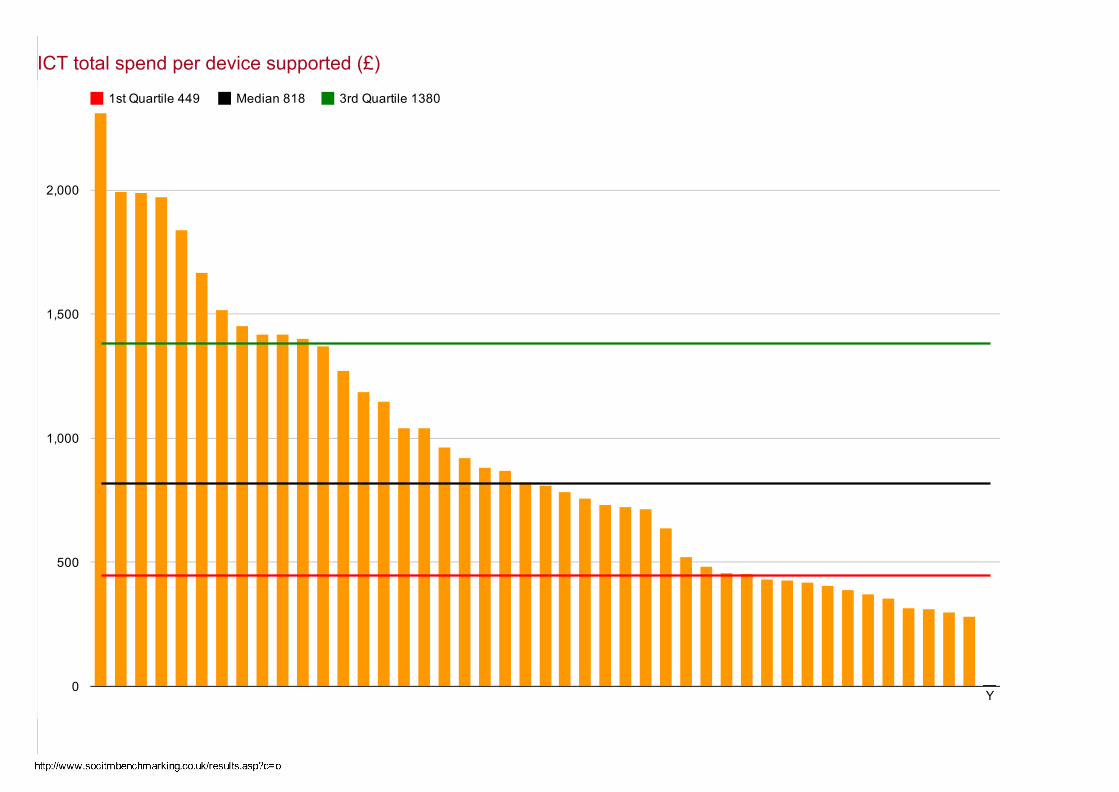
ICT total spend per device supported (£)
1st Quartile 449 Median 818 3rd Quartile 1380
Y0
500
1,000
1,500
2,000
17/04/2015 Socitm | Platform for Research
http://www.socitmbenchmarking.co.uk/results.asp?c=o 11/25
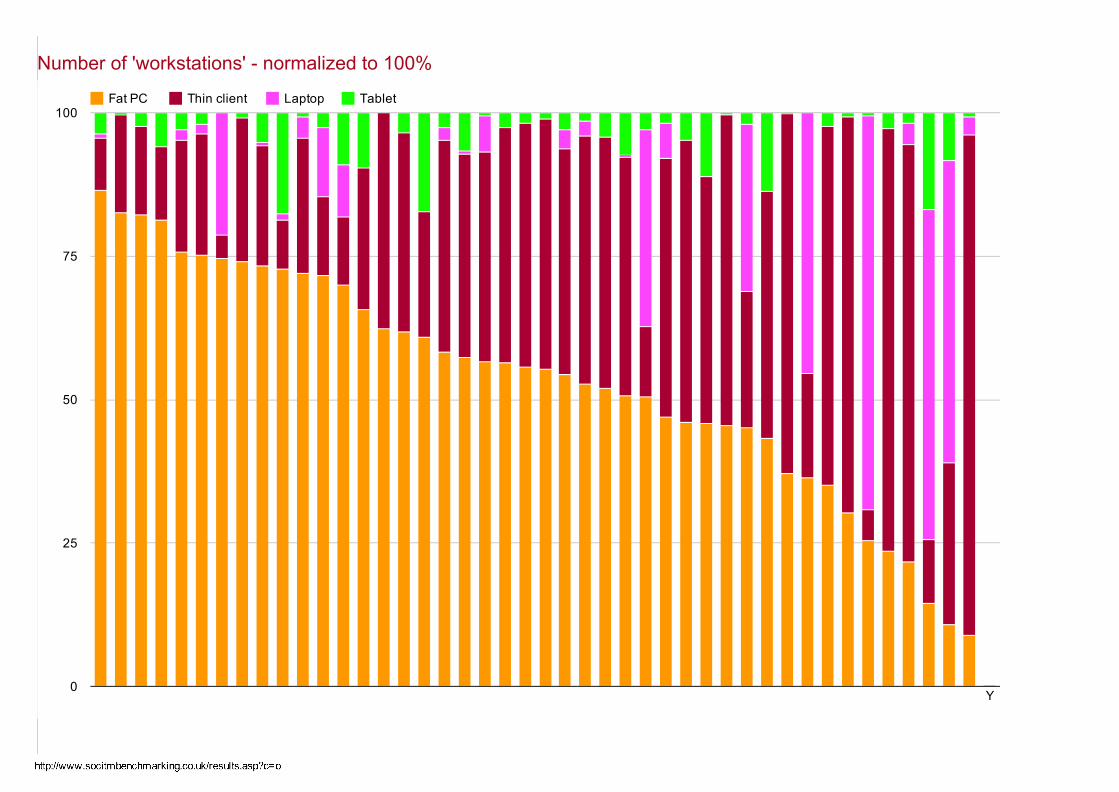
Number of 'workstations' normalized to 100%
Fat PC Thin client Laptop Tablet
Y0
25
50
75
100
17/04/2015 Socitm | Platform for Research
http://www.socitmbenchmarking.co.uk/results.asp?c=o 12/25
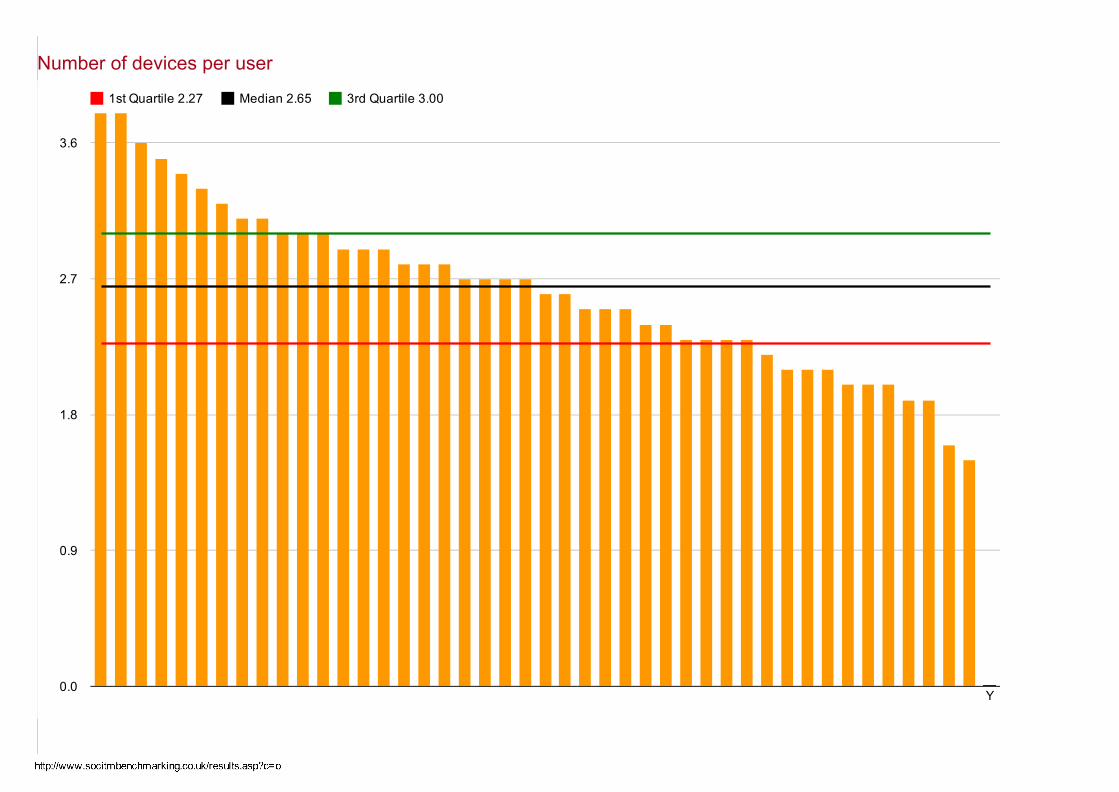
Number of devices per user
1st Quartile 2.27 Median 2.65 3rd Quartile 3.00
Y0.0
0.9
1.8
2.7
3.6
17/04/2015 Socitm | Platform for Research
http://www.socitmbenchmarking.co.uk/results.asp?c=o 13/25
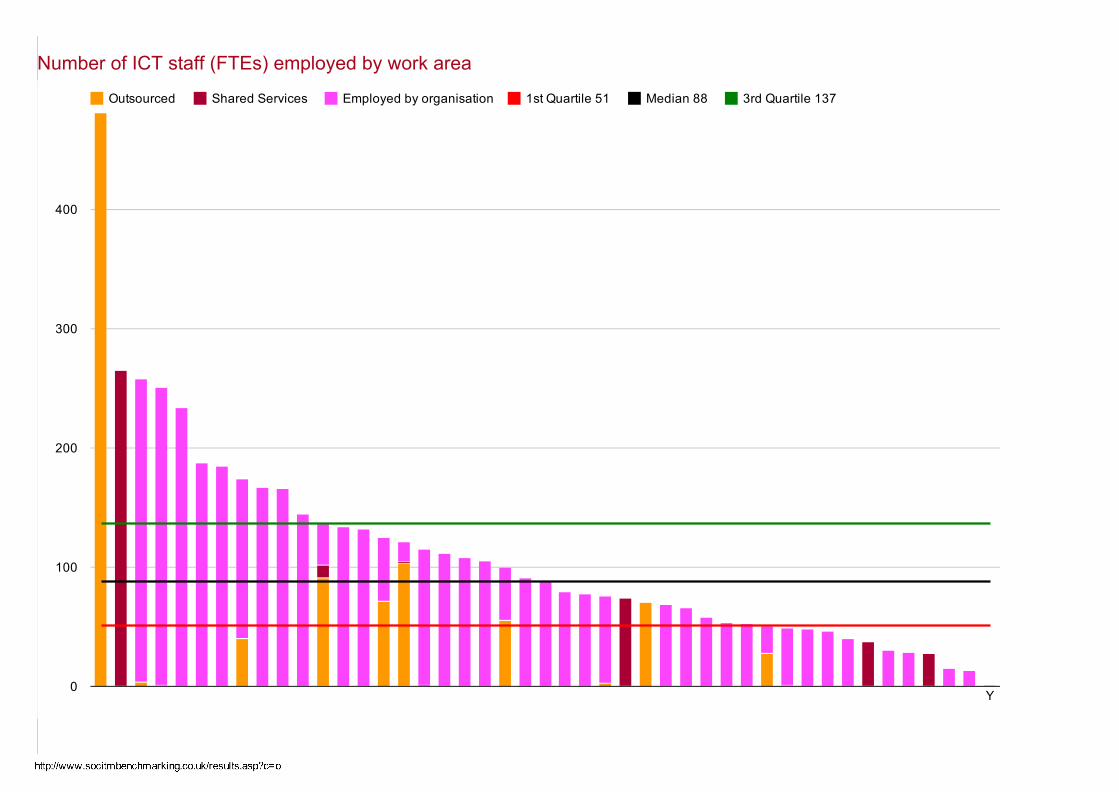
Number of ICT staff (FTEs) employed by work area
Outsourced Shared Services Employed by organisation 1st Quartile 51 Median 88 3rd Quartile 137
Y0
100
200
300
400
17/04/2015 Socitm | Platform for Research
http://www.socitmbenchmarking.co.uk/results.asp?c=o 14/25
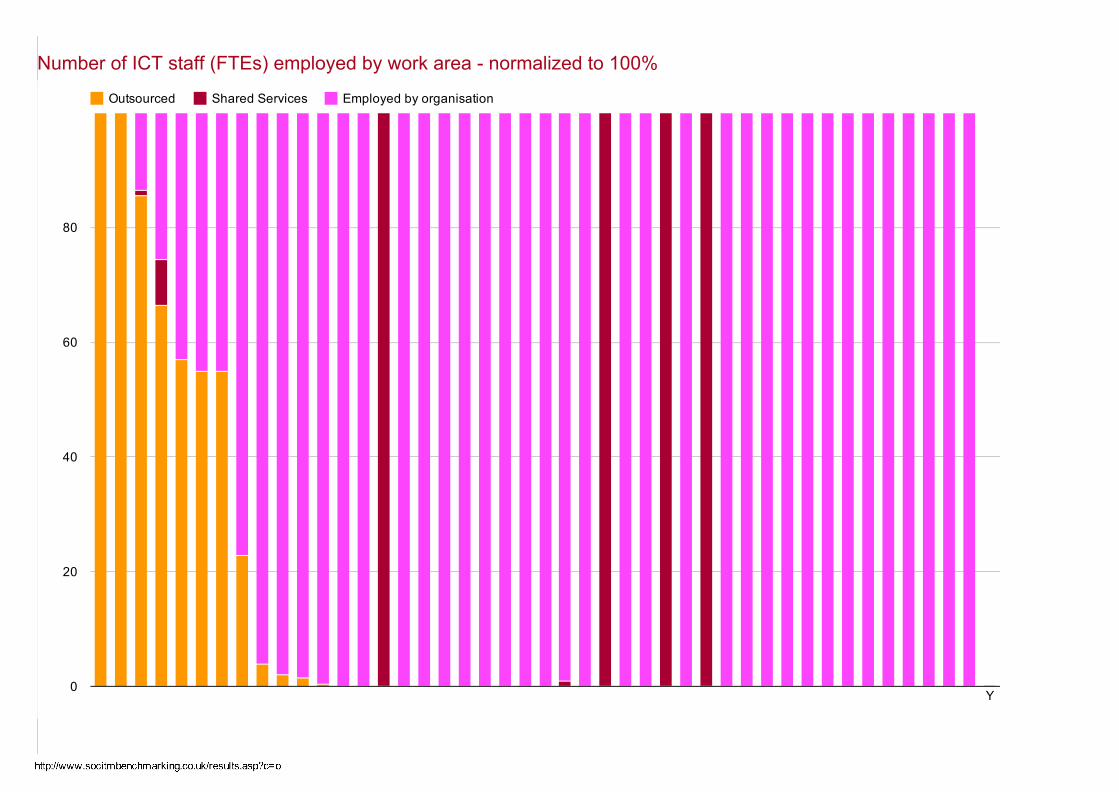
Number of ICT staff (FTEs) employed by work area normalized to 100%
Outsourced Shared Services Employed by organisation
Y0
20
40
60
80
17/04/2015 Socitm | Platform for Research
http://www.socitmbenchmarking.co.uk/results.asp?c=o 15/25
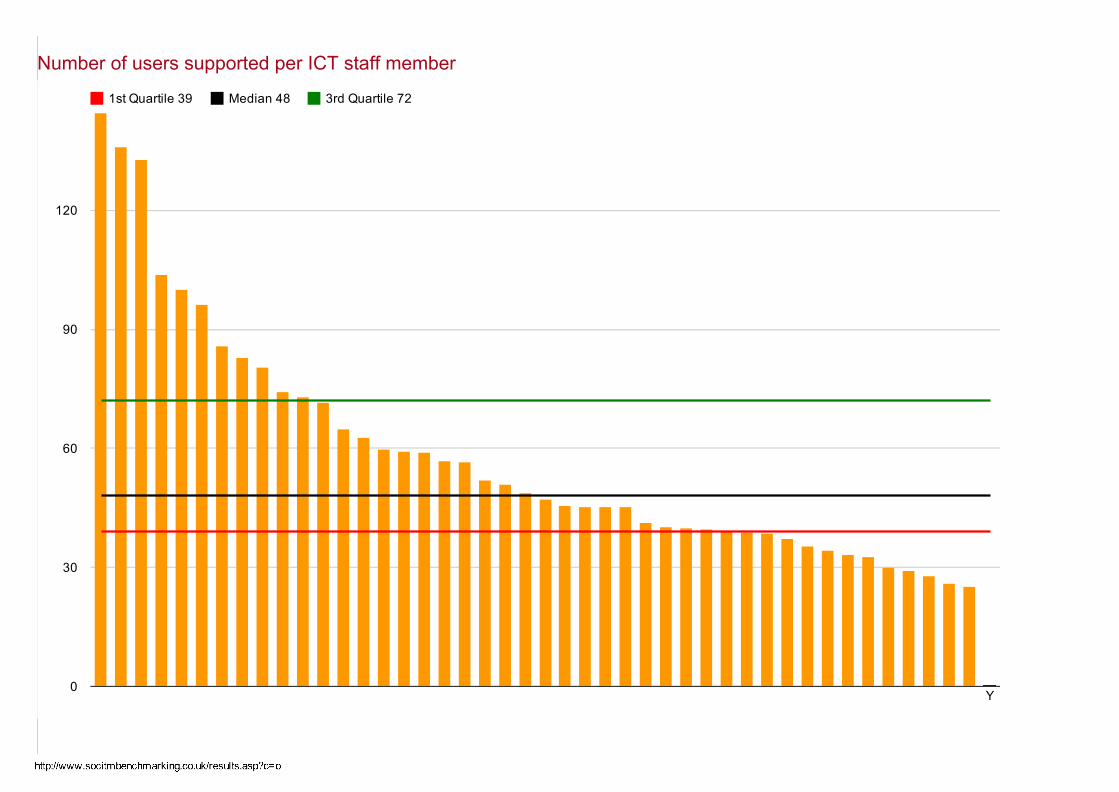
Number of users supported per ICT staff member
1st Quartile 39 Median 48 3rd Quartile 72
Y0
30
60
90
120
17/04/2015 Socitm | Platform for Research
http://www.socitmbenchmarking.co.uk/results.asp?c=o 16/25
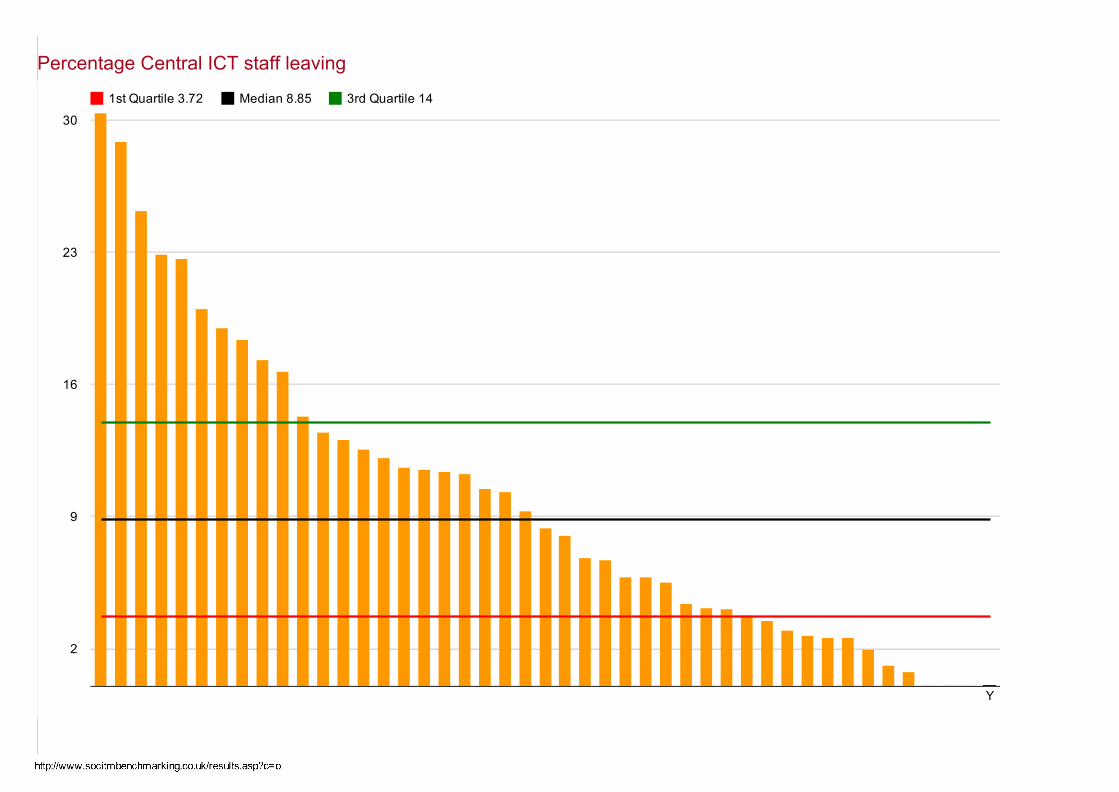
Percentage Central ICT staff leaving
1st Quartile 3.72 Median 8.85 3rd Quartile 14
Y
2
9
16
23
30
17/04/2015 Socitm | Platform for Research
http://www.socitmbenchmarking.co.uk/results.asp?c=o 17/25
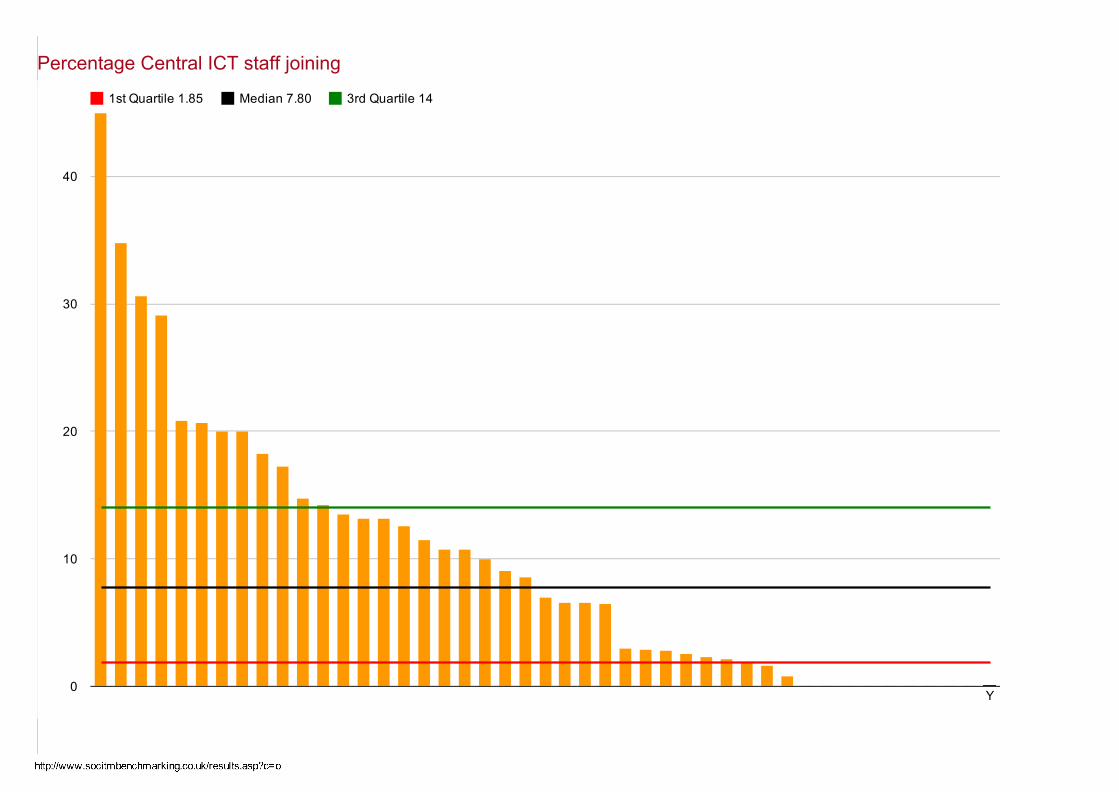
Percentage Central ICT staff joining
1st Quartile 1.85 Median 7.80 3rd Quartile 14
Y0
10
20
30
40
17/04/2015 Socitm | Platform for Research
http://www.socitmbenchmarking.co.uk/results.asp?c=o 18/25
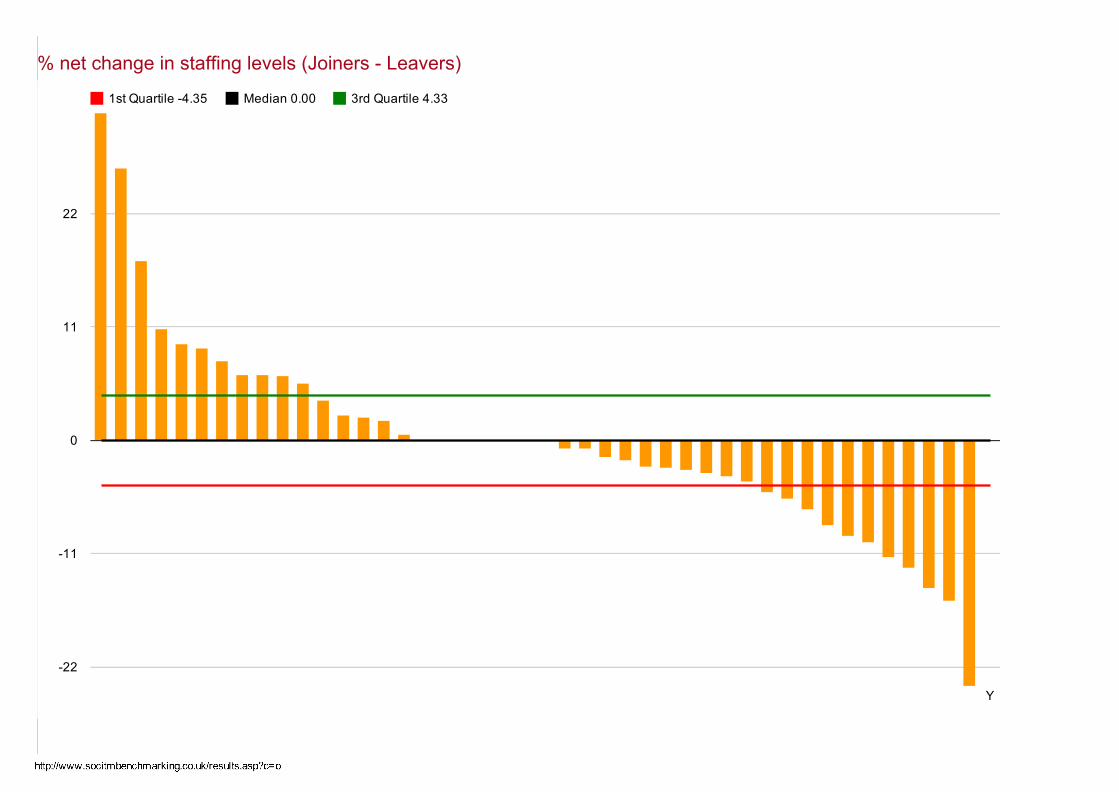
% net change in staffing levels (Joiners Leavers)
1st Quartile 4.35 Median 0.00 3rd Quartile 4.33
Y
22
11
0
11
22
17/04/2015 Socitm | Platform for Research
http://www.socitmbenchmarking.co.uk/results.asp?c=o 19/25
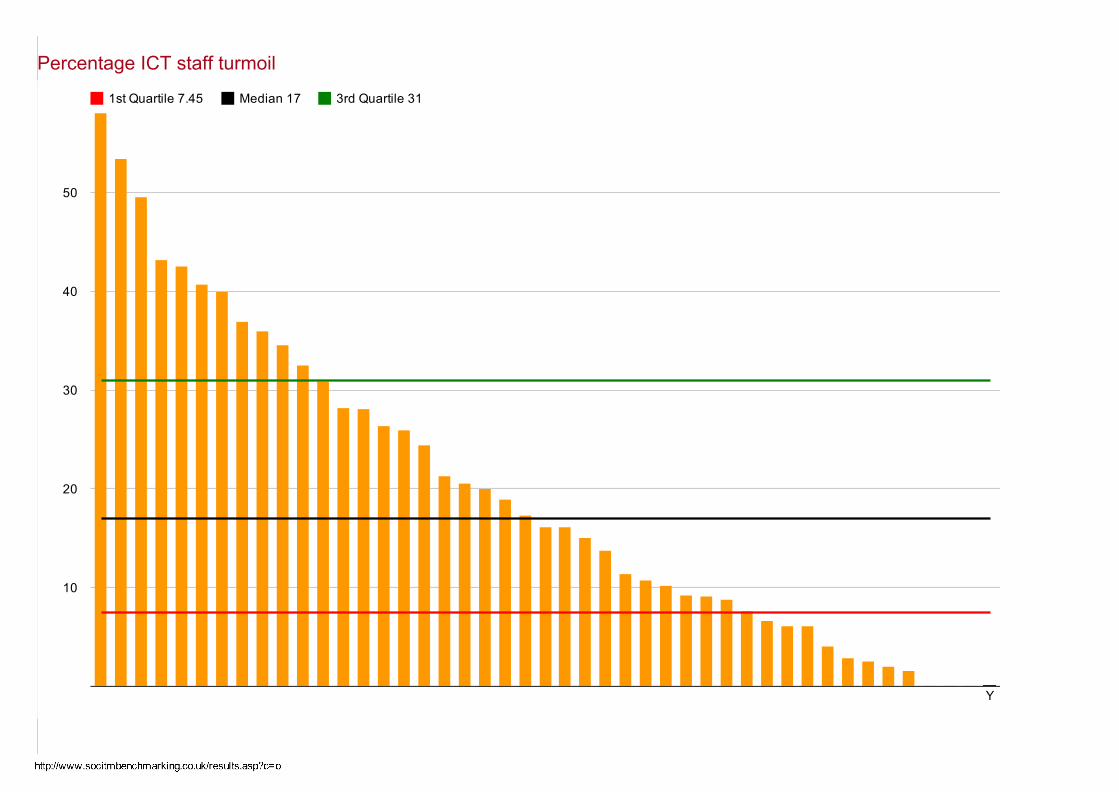
Percentage ICT staff turmoil
1st Quartile 7.45 Median 17 3rd Quartile 31
Y
10
20
30
40
50
17/04/2015 Socitm | Platform for Research
http://www.socitmbenchmarking.co.uk/results.asp?c=o 20/25
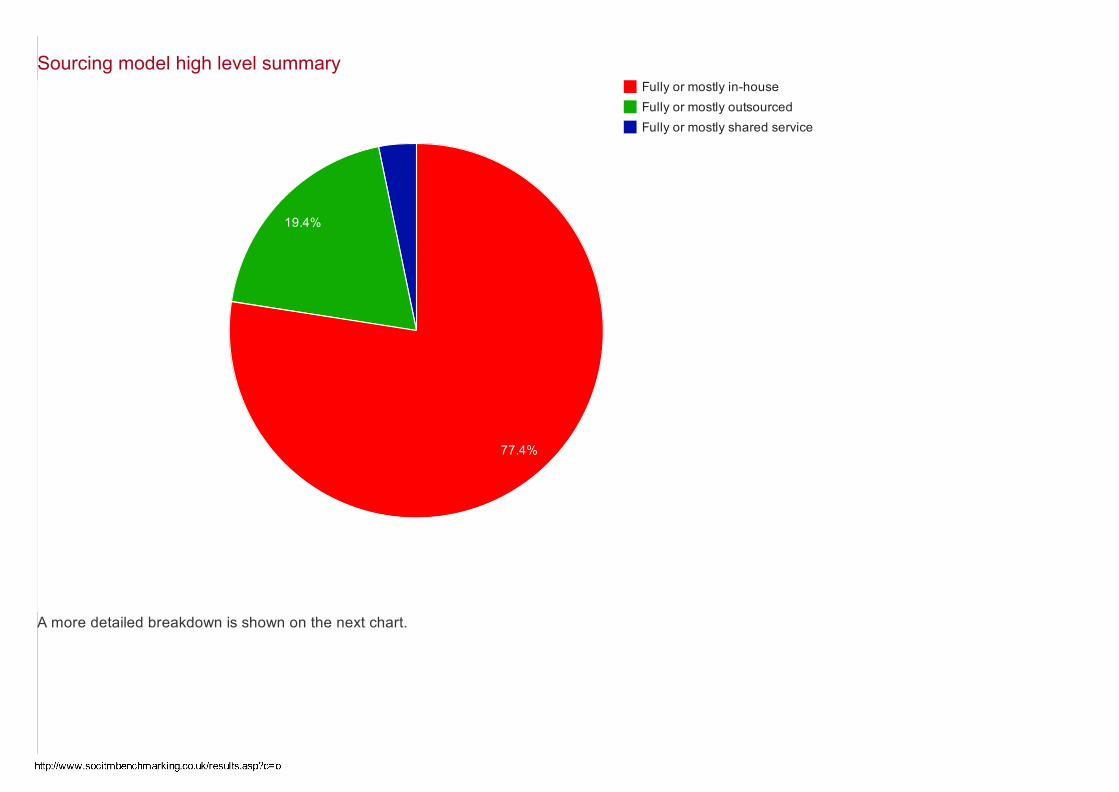
Sourcing model high level summary
A more detailed breakdown is shown on the next chart.
Fully or mostly inhouseFully or mostly outsourcedFully or mostly shared service
19.4%
77.4%
17/04/2015 Socitm | Platform for Research
http://www.socitmbenchmarking.co.uk/results.asp?c=o 21/25
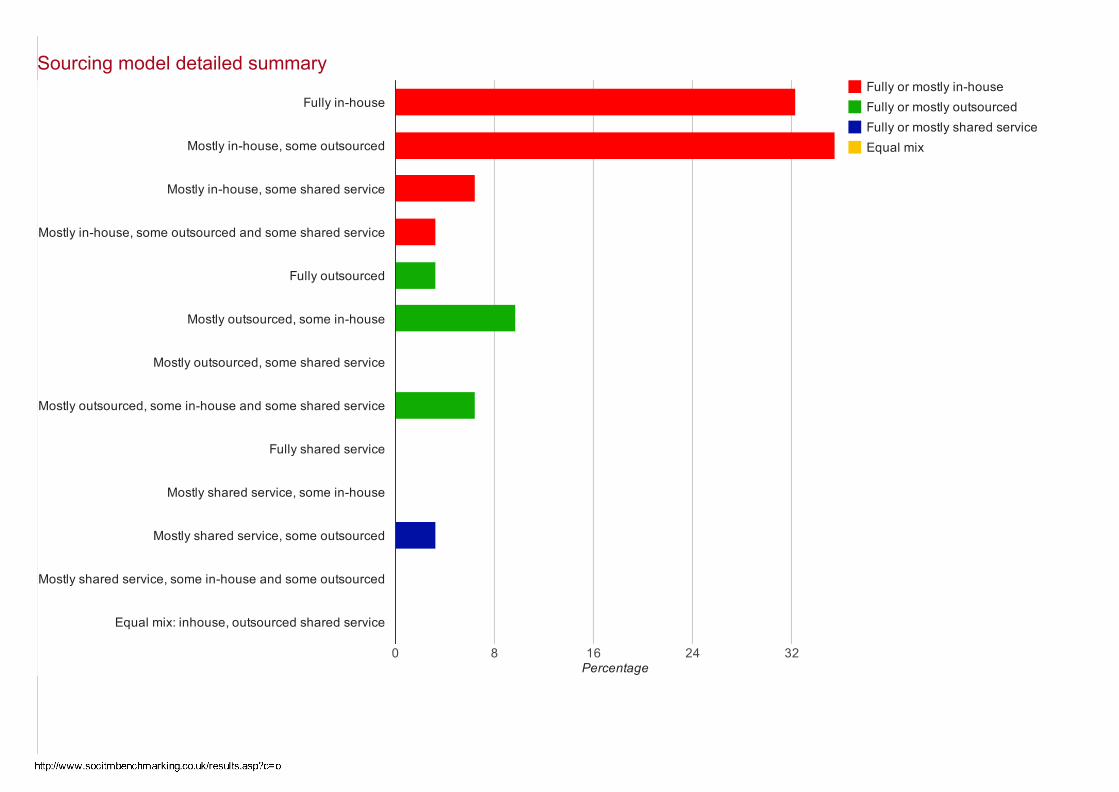
Sourcing model detailed summaryFully or mostly inhouseFully or mostly outsourcedFully or mostly shared serviceEqual mix
0 8 16 24 32
Fully inhouse
Mostly inhouse, some outsourced
Mostly inhouse, some shared service
Mostly inhouse, some outsourced and some shared service
Fully outsourced
Mostly outsourced, some inhouse
Mostly outsourced, some shared service
Mostly outsourced, some inhouse and some shared service
Fully shared service
Mostly shared service, some inhouse
Mostly shared service, some outsourced
Mostly shared service, some inhouse and some outsourced
Equal mix: inhouse, outsourced shared service
Percentage
17/04/2015 Socitm | Platform for Research
http://www.socitmbenchmarking.co.uk/results.asp?c=o 22/25
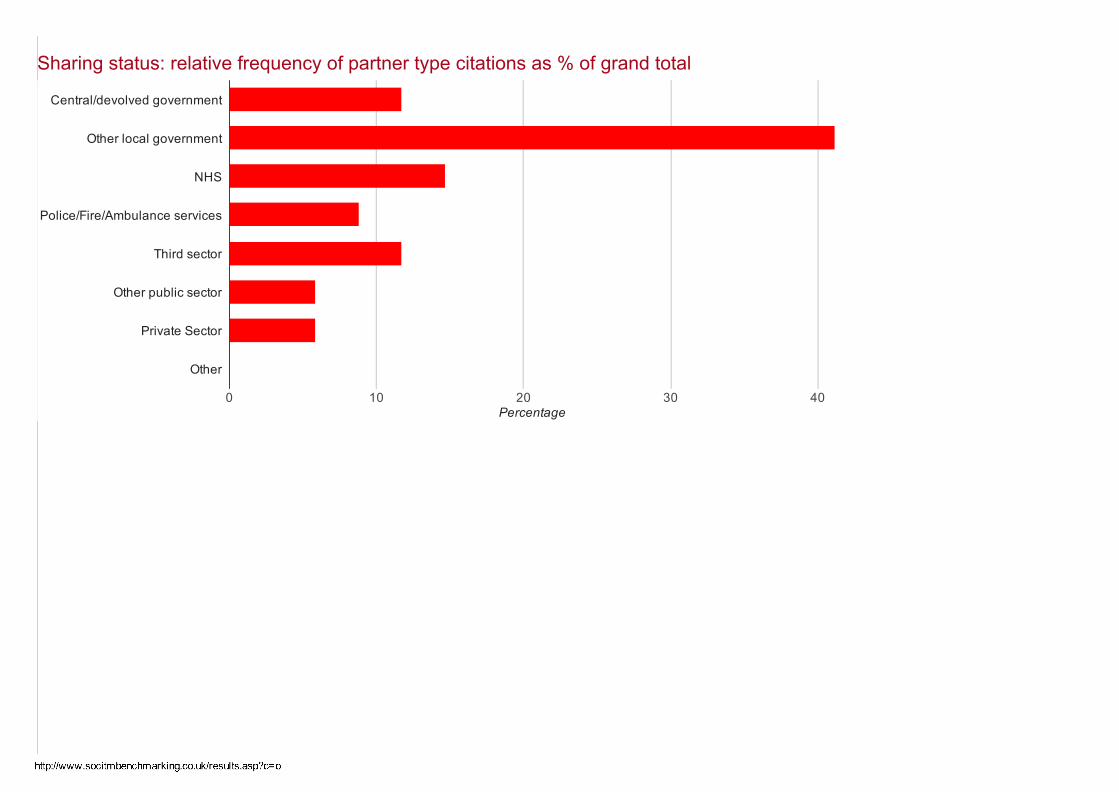
Sharing status: relative frequency of partner type citations as % of grand total
0 10 20 30 40
Central/devolved government
Other local government
NHS
Police/Fire/Ambulance services
Third sector
Other public sector
Private Sector
Other
Percentage
17/04/2015 Socitm | Platform for Research
http://www.socitmbenchmarking.co.uk/results.asp?c=o 23/25
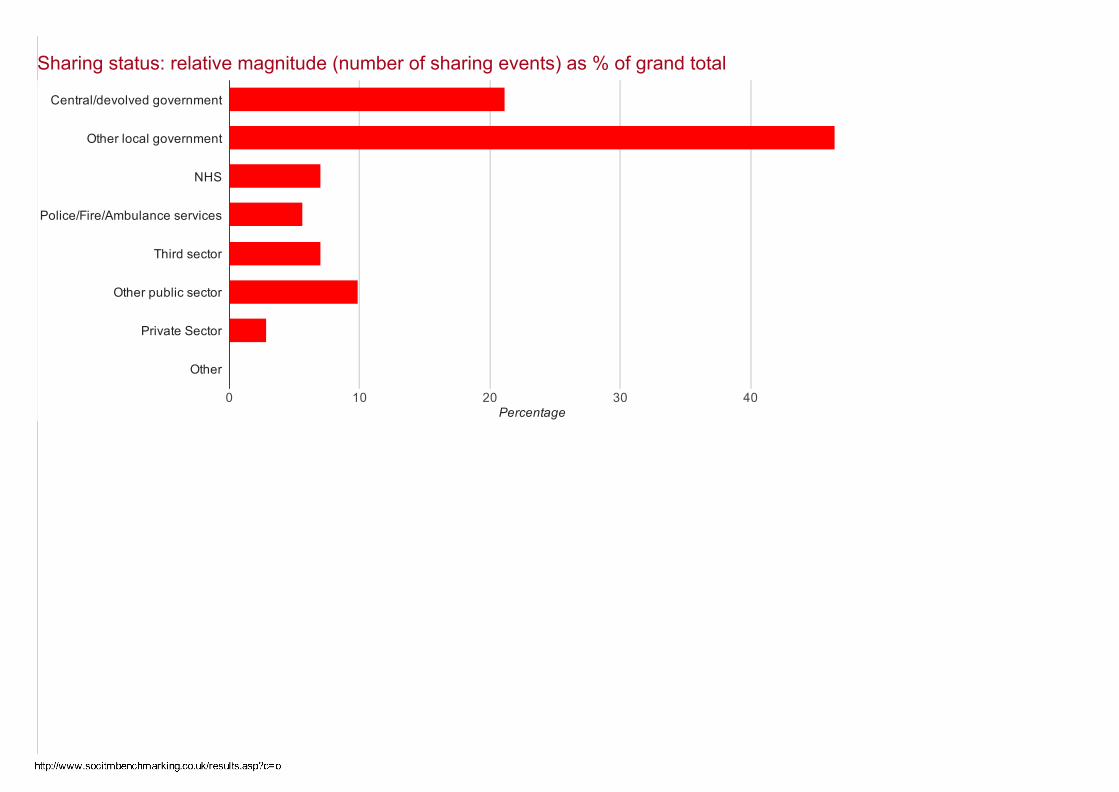
Sharing status: relative magnitude (number of sharing events) as % of grand total
0 10 20 30 40
Central/devolved government
Other local government
NHS
Police/Fire/Ambulance services
Third sector
Other public sector
Private Sector
Other
Percentage
17/04/2015 Socitm | Platform for Research
http://www.socitmbenchmarking.co.uk/results.asp?c=o 24/25
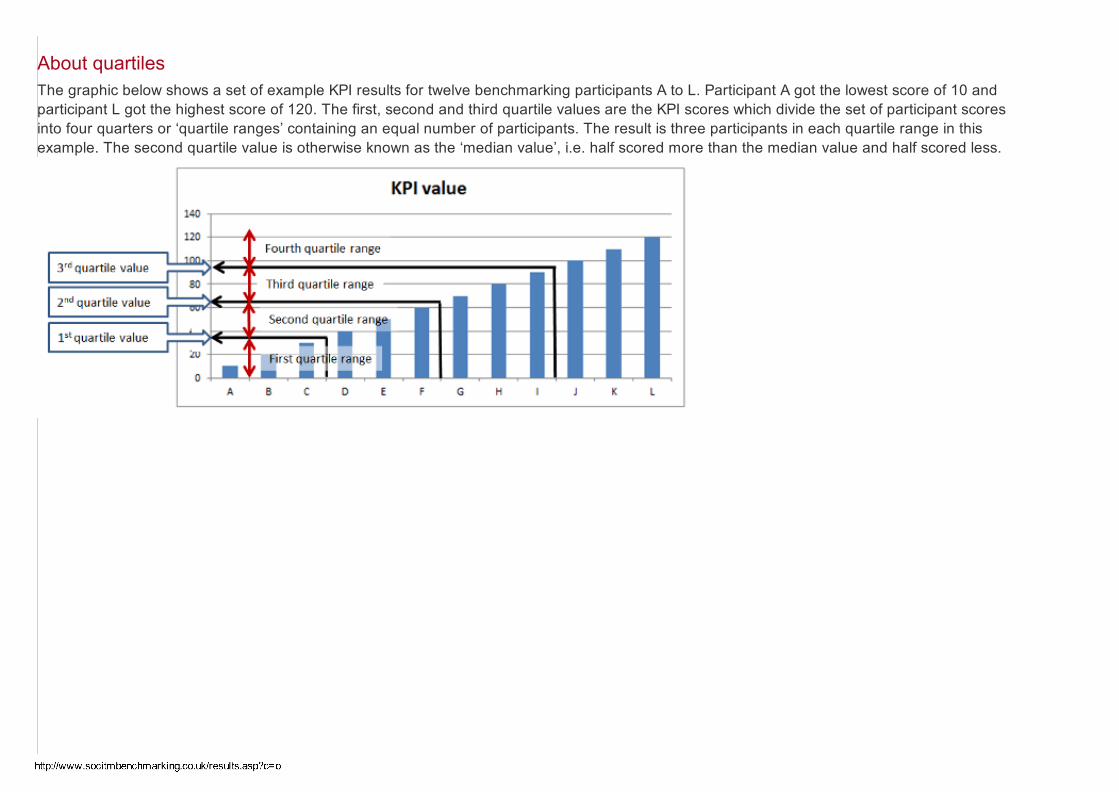
About quartilesThe graphic below shows a set of example KPI results for twelve benchmarking participants A to L. Participant A got the lowest score of 10 andparticipant L got the highest score of 120. The first, second and third quartile values are the KPI scores which divide the set of participant scoresinto four quarters or ‘quartile ranges’ containing an equal number of participants. The result is three participants in each quartile range in thisexample. The second quartile value is otherwise known as the ‘median value’, i.e. half scored more than the median value and half scored less.
17/04/2015 Socitm | Platform for Research
http://www.socitmbenchmarking.co.uk/results.asp?c=o 25/25
Socitm Statement of ResponsibilityThe data used in the preparation of this report was provided by Benchmarking ICT participants. Socitm therefore makes no representations orwarranties with respect to the accuracy of the data and any derived information contained in this report.
Socitm shall not be liable to any client, person or entity for any inaccuracy or inauthenticity of information contained in this report or any errors oromissions in its content, regardless of the cause of such inaccuracy, inauthenticity, error or omission.
Socitm shall not be liable for consequential, incidental or punitive damages to any person or entity in any matter relating to this report.