Embed Size (px)
Citation preview
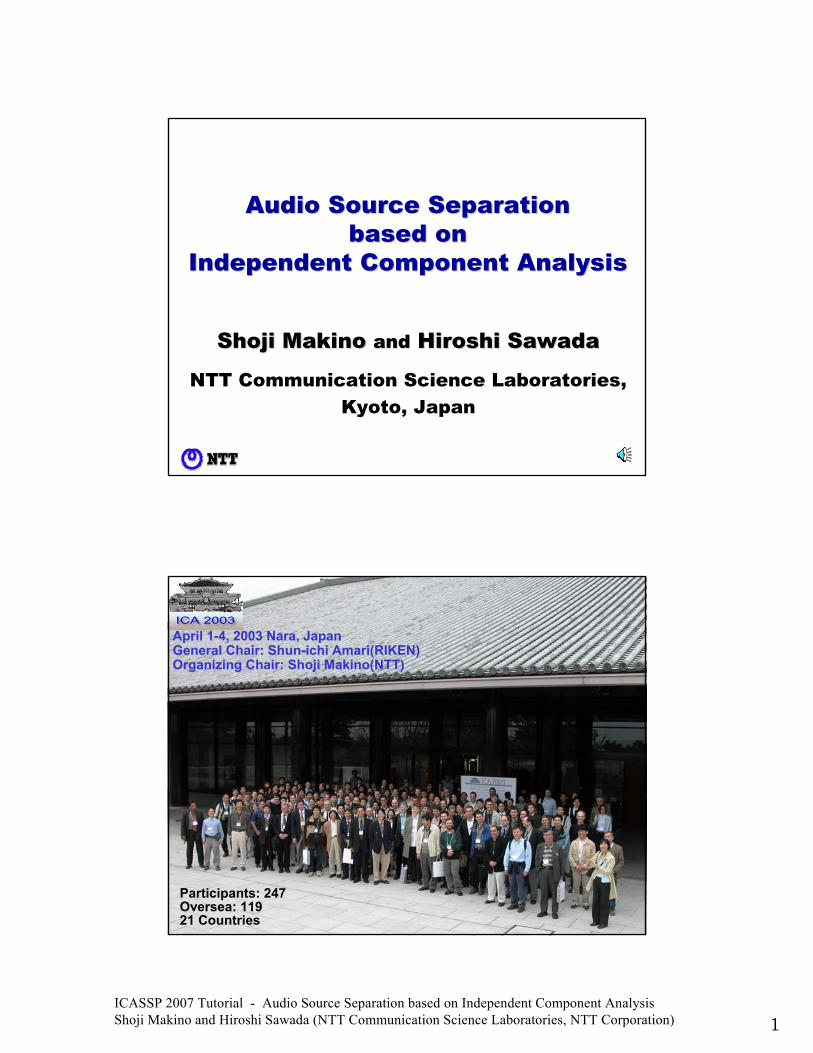
ICASSP 2007 Tutorial - Audio Source Separation based on Independent Component Analysis Shoji Makino and Hiroshi Sawada (NTT Communication Science Laboratories, NTT Corporation) 1
Shoji Makino Shoji Makino andand Hiroshi SawadaHiroshi Sawada
NTT Communication Science Laboratories, Kyoto, Japan
Audio Source Separation Audio Source Separation based on based on
Independent Component AnalysisIndependent Component Analysis
Participants: 247Oversea: 11921 Countries
April 1-4, 2003 Nara, JapanGeneral Chair: Shun-ichi Amari(RIKEN) Organizing Chair: Shoji Makino(NTT)
ICASSP 2007 Tutorial - Audio Source Separation based on Independent Component Analysis Shoji Makino and Hiroshi Sawada (NTT Communication Science Laboratories, NTT Corporation) 2
ICA2003(Fourth International Symposium on
IIndependent CComponent AAnalysis andBBlind SSignal SSeparation)April 1April 1--4, 2003 Nara4, 2003 Nara
General Chair: Shun-ichi Amari(RIKEN)Organizing Chair: Shoji Makino(NTT)Program Chair: Andrzej Cichocki(RIKEN)
Noboru Murata(Waseda)
ShouShou--TokuToku--TaishiTaishi
Could separate ten speeches.
ICASSP 2007 Tutorial - Audio Source Separation based on Independent Component Analysis Shoji Makino and Hiroshi Sawada (NTT Communication Science Laboratories, NTT Corporation) 3
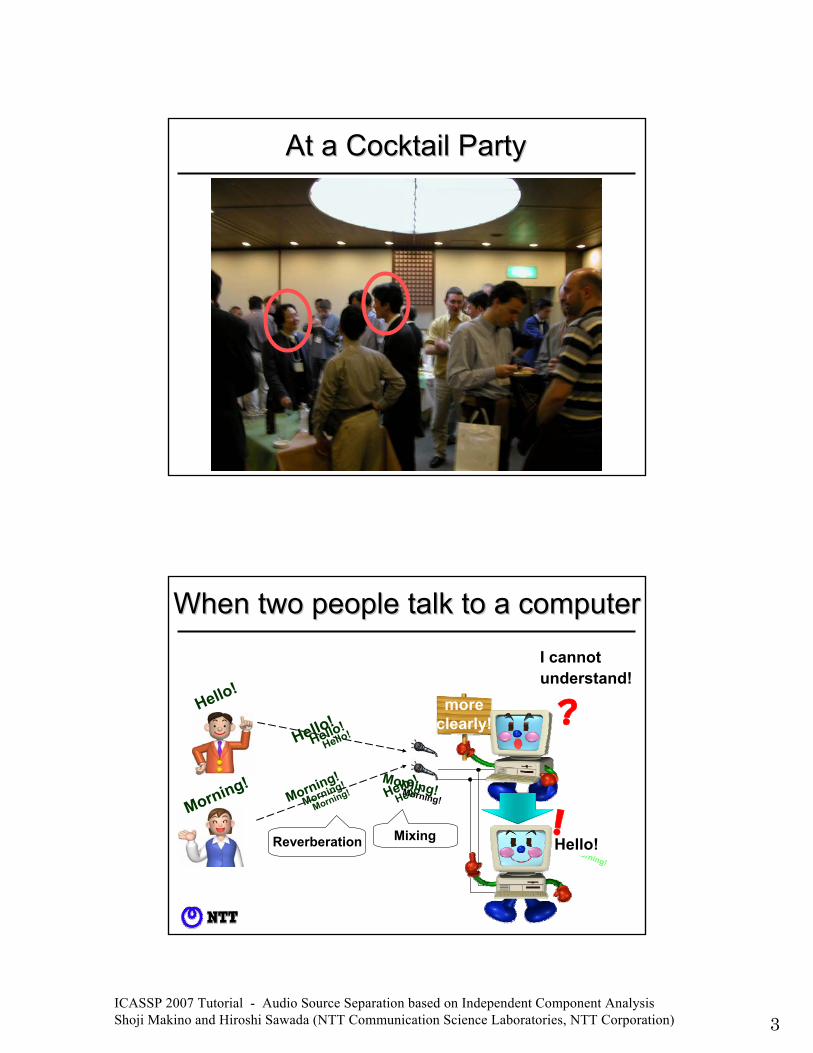
At a Cocktail PartyAt a Cocktail Party
?
Reverberation
moreclearly!
Morning!
Hello!!Mixing
When two people talk to a computerWhen two people talk to a computer
Hello!
Morning!
Hello!Hello!
Hello!
Morning!
Morning!
Morning!Morning!Morning!Hello!
Hello!
I cannot understand!
ICASSP 2007 Tutorial - Audio Source Separation based on Independent Component Analysis Shoji Makino and Hiroshi Sawada (NTT Communication Science Laboratories, NTT Corporation) 4
VIDEOVIDEO
Blind Source Separation in a Real EnvironmentBlind Source Separation in a Real Environment
ICASSP 2007 Tutorial - Audio Source Separation based on Independent Component Analysis Shoji Makino and Hiroshi Sawada (NTT Communication Science Laboratories, NTT Corporation) 5
?
Reverberation
moreclearly!
Morning!
Hello!!
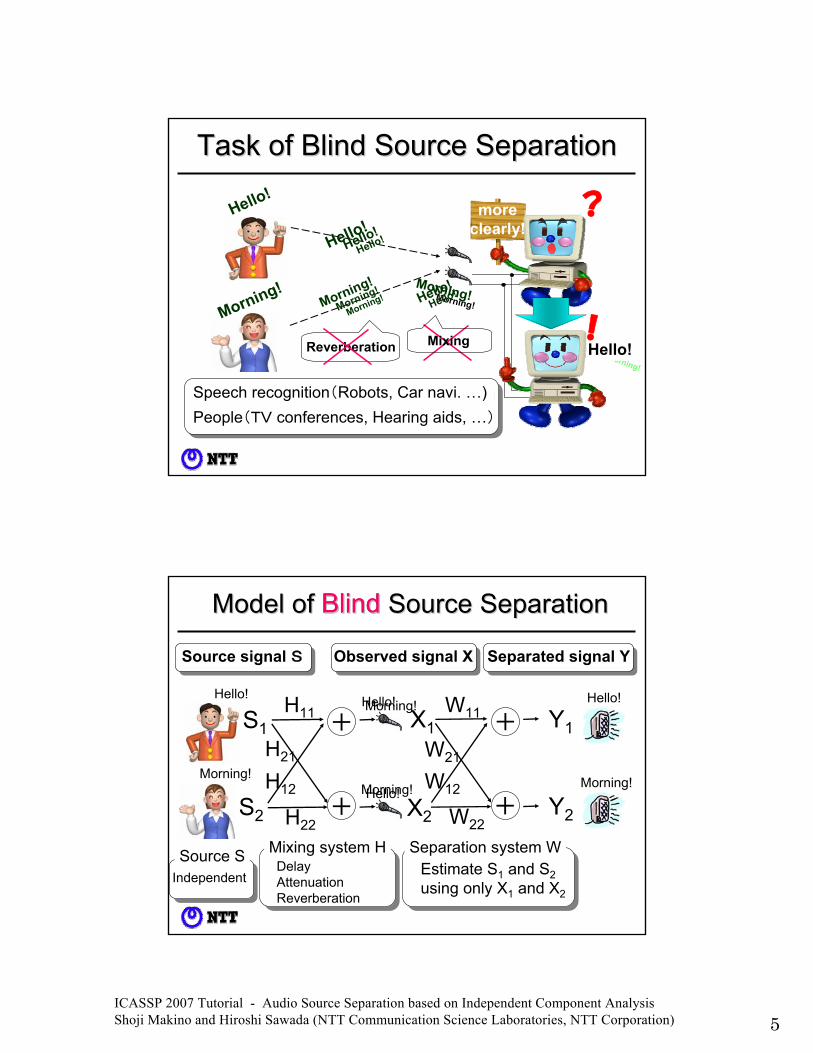
Target signal must be extracted from mixed signals (source separation)
Mixing
Task of Blind Source SeparationTask of Blind Source Separation
Hello!
Morning!
Hello!Hello!
Hello!
Morning!
Morning!
Morning!
Speech recognition(Robots, Car navi. …) People(TV conferences, Hearing aids, …)
Morning!Morning!Hello!Hello!
Observed signal XSource signal S Separated signal Y
+
+
Hello!
Morning!
Separation system WEstimate S1 and S2using only X1 and X2
Y1
Y2
Hello!
+
+
Morning!
S1
S2
H11
H21
H12
H22
Model of Blind Source SeparationModel of Blind Source Separation
Mixing system HDelayAttenuationReverberation
Hello!Morning!
Hello!Morning!
X1
X2
W21
W12
W22
W11
Source SIndependent
BlindBlind
ICASSP 2007 Tutorial - Audio Source Separation based on Independent Component Analysis Shoji Makino and Hiroshi Sawada (NTT Communication Science Laboratories, NTT Corporation) 6
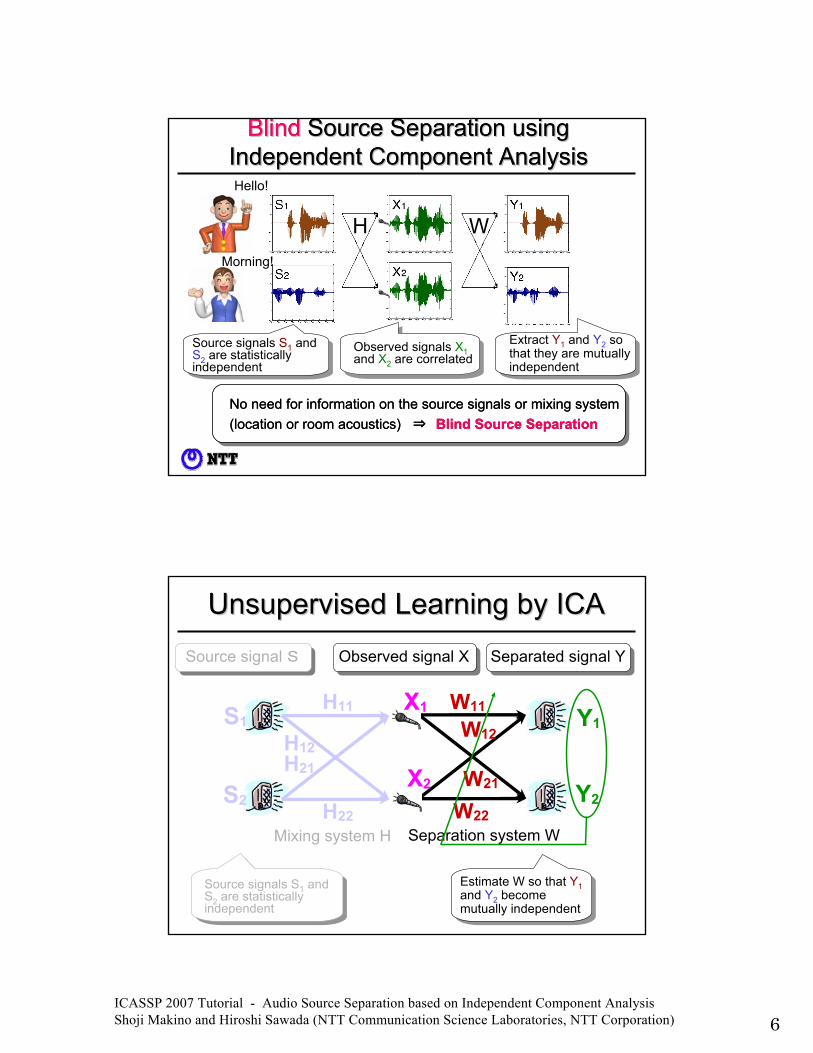
Blind Source Separation using Blind Source Separation using Independent Component AnalysisIndependent Component Analysis
H W
Hello!
Morning!
Observed signals X1and X2 are correlated
Extract Y1 and Y2 so that they are mutually independent
Source signals S1 and S2 are statistically independent
No need for information on the source signals or mixing system(location or room acoustics) ⇒ Blind Source Separation
No need for information on the source signals or mixing system(location or room acoustics) ⇒ Blind Source SeparationNo need for information on the source signals or mixing system(location or room acoustics) ⇒ Blind Source Separation
BlindBlind Source Separation using Source Separation using Independent Component AnalysisIndependent Component Analysis
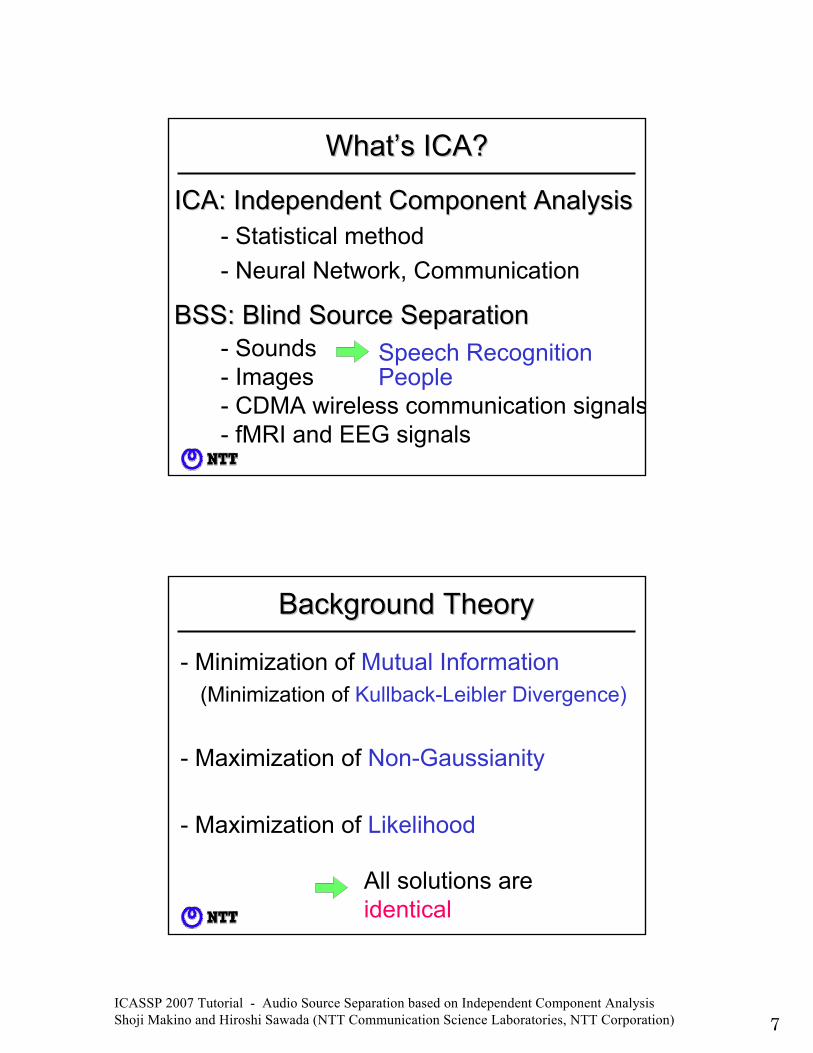
Unsupervised Learning by ICAUnsupervised Learning by ICA
H11
H21
H22
S1
S2
Mixing system H
Y1W11
W12
W21
W22
H12
X1
X2 Y2
Separation system W
Estimate W so that Y1and Y2 become mutually independent
Source signals S1 and S2 are statistically independent
Observed signal XSource signal S Separated signal Y
ICASSP 2007 Tutorial - Audio Source Separation based on Independent Component Analysis Shoji Makino and Hiroshi Sawada (NTT Communication Science Laboratories, NTT Corporation) 7
WhatWhat’’s ICA?s ICA?
ICA: Independent Component AnalysisICA: Independent Component Analysis- Statistical method- Neural Network, Communication
BSS: Blind Source SeparationBSS: Blind Source Separation- Sounds- Images- CDMA wireless communication signals- fMRI and EEG signals
Speech RecognitionPeople
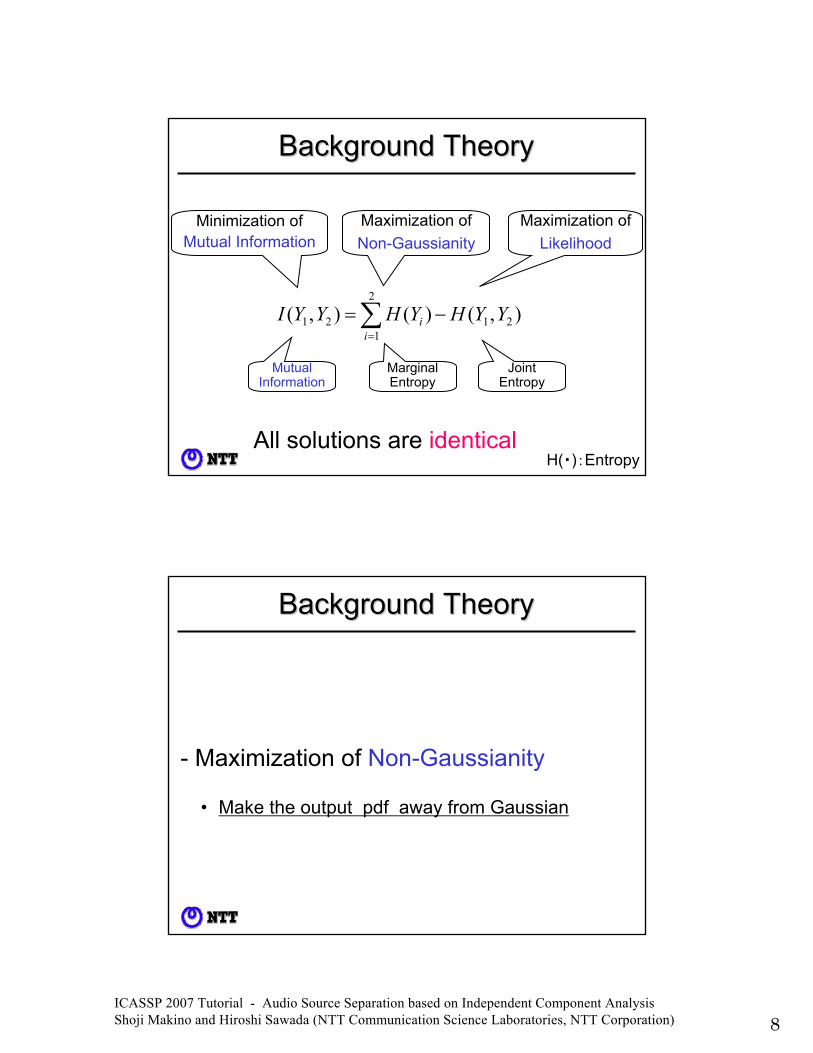
Background TheoryBackground Theory
- Minimization of Mutual Information(Minimization of Kullback-Leibler Divergence)
All solutions areidentical
- Maximization of Non-Gaussianity
- Maximization of Likelihood
ICASSP 2007 Tutorial - Audio Source Separation based on Independent Component Analysis Shoji Makino and Hiroshi Sawada (NTT Communication Science Laboratories, NTT Corporation) 8
Background TheoryBackground Theory
All solutions are identical
),()(),( 21
2
121 YYHYHYYI
ii −=∑
=
Minimization of Mutual Information
Maximization of Non-Gaussianity
Maximization of Likelihood
MarginalEntropy
JointEntropy
MutualInformation
H(・):Entropy
Background TheoryBackground Theory
- Maximization of Non-Gaussianity
• Make the output pdf away from Gaussian
ICASSP 2007 Tutorial - Audio Source Separation based on Independent Component Analysis Shoji Makino and Hiroshi Sawada (NTT Communication Science Laboratories, NTT Corporation) 9
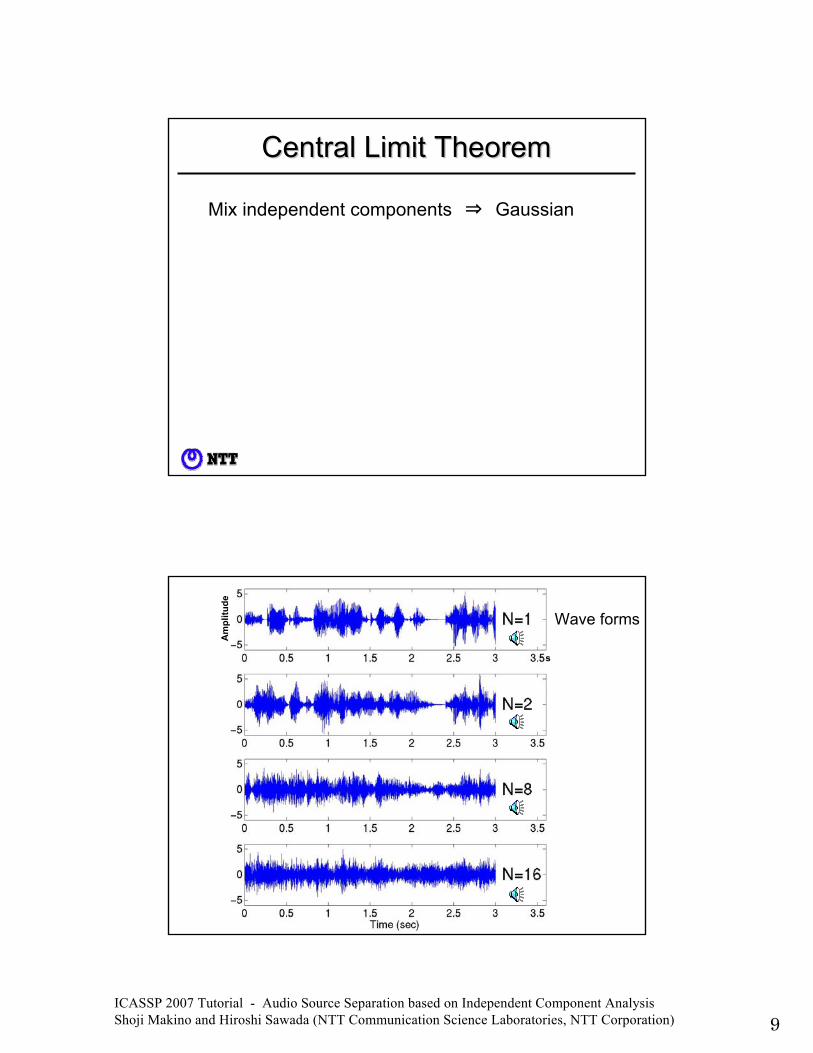
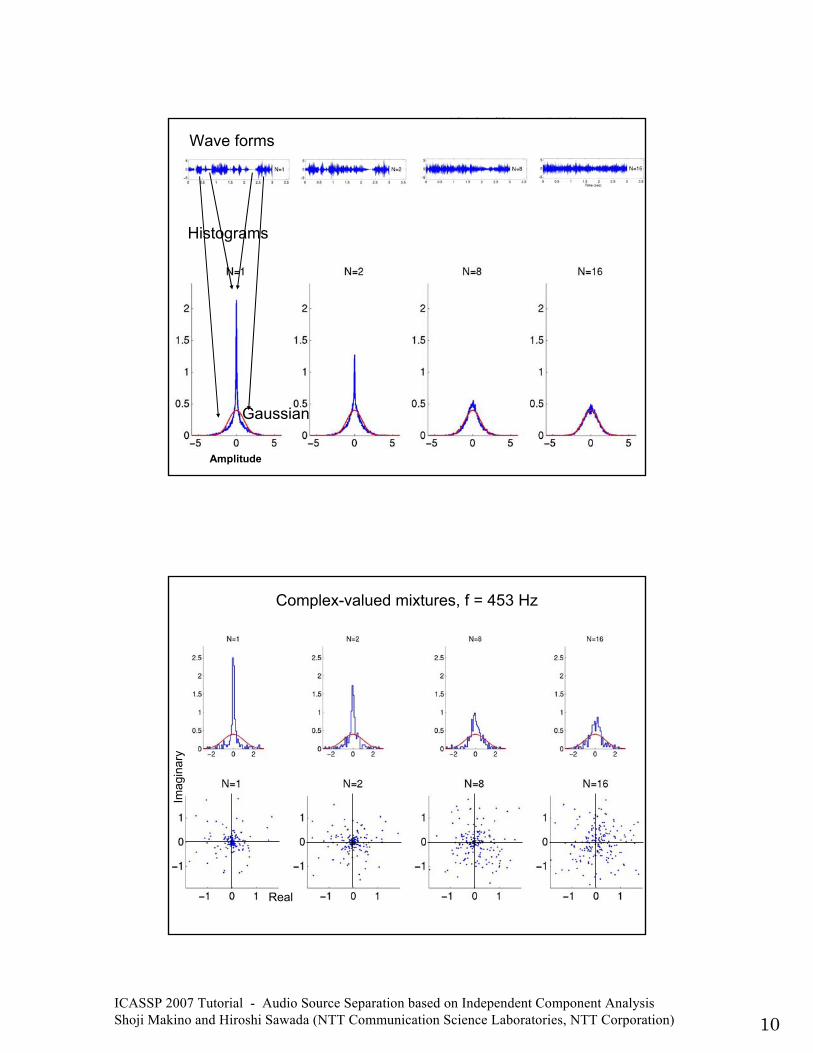
Central Limit TheoremCentral Limit Theorem
Mix independent components ⇒ Gaussian
Find independent component ⇒ Non-Gaussian
maximization of negentropymaximization of |kurtosis|
Wave forms
Am
plitu
de
s
ICASSP 2007 Tutorial - Audio Source Separation based on Independent Component Analysis Shoji Makino and Hiroshi Sawada (NTT Communication Science Laboratories, NTT Corporation) 10
Wave forms
Histograms
Amplitude
Gaussian
Complex-valued mixtures, f = 453 Hz
Imag
inar
y
Real
ICASSP 2007 Tutorial - Audio Source Separation based on Independent Component Analysis Shoji Makino and Hiroshi Sawada (NTT Communication Science Laboratories, NTT Corporation) 11
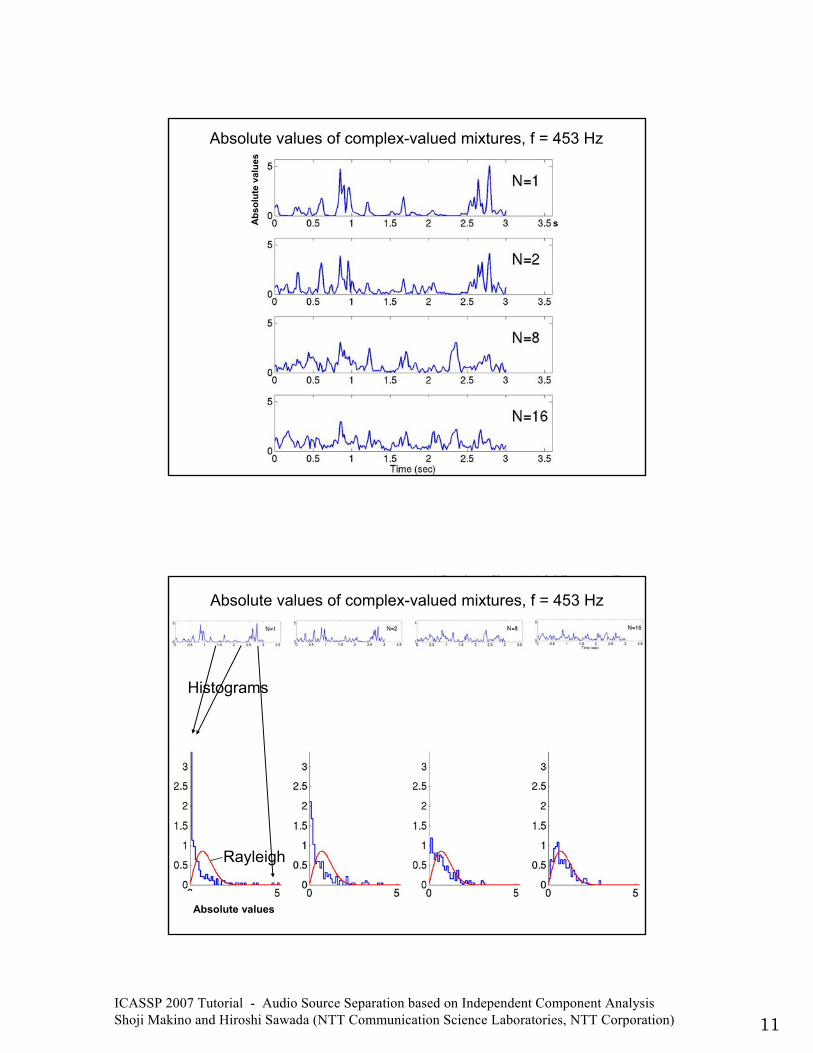
Absolute values of complex-valued mixtures, f = 453 Hz
Abs
olut
e va
lues
s
Histograms
Absolute values of complex-valued mixtures, f = 453 Hz
Rayleigh
Absolute values
ICASSP 2007 Tutorial - Audio Source Separation based on Independent Component Analysis Shoji Makino and Hiroshi Sawada (NTT Communication Science Laboratories, NTT Corporation) 12
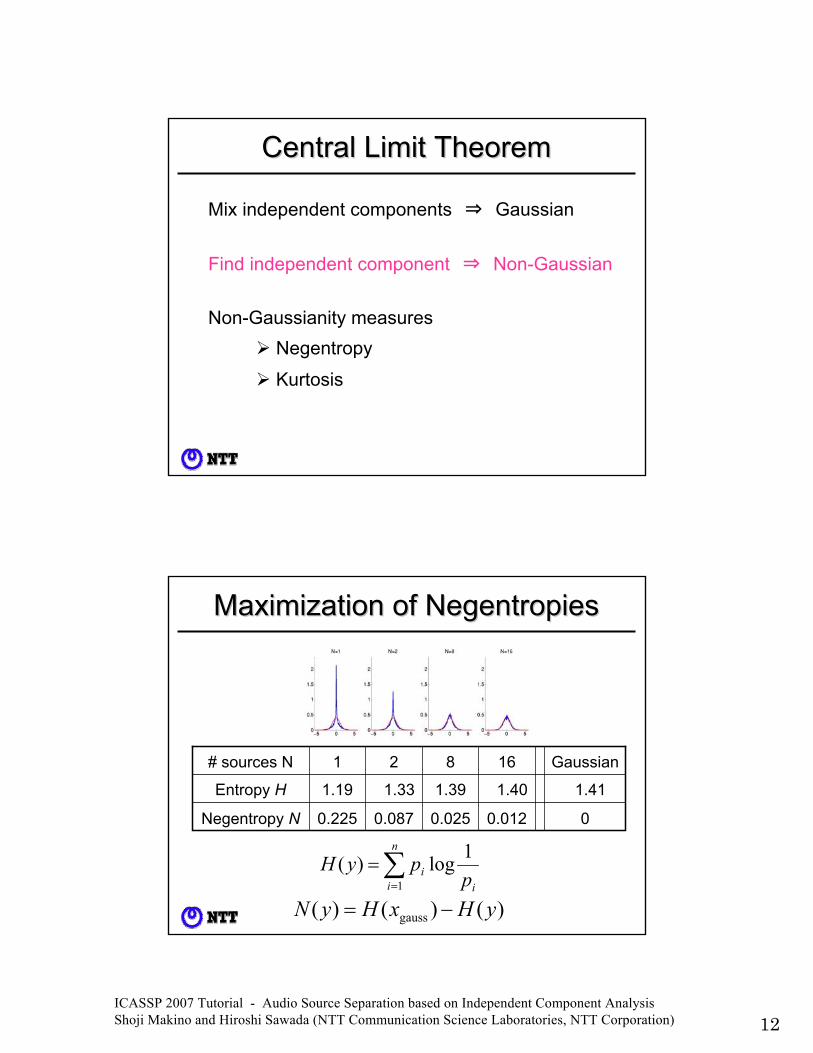
Central Limit TheoremCentral Limit Theorem
Mix independent components ⇒ Gaussian
Find independent component ⇒ Non-Gaussian
Non-Gaussianity measuresNegentropy
Kurtosis
Maximization of NegeMaximization of Negentropiesntropies
00.0120.0250.0870.225Negentropy N
1.411.401.391.331.19Entropy H
Gaussian16821# sources N
)()()( gauss yHxHyN −=
∑=
=n
i ii p
pyH1
1log)(
ICASSP 2007 Tutorial - Audio Source Separation based on Independent Component Analysis Shoji Makino and Hiroshi Sawada (NTT Communication Science Laboratories, NTT Corporation) 13
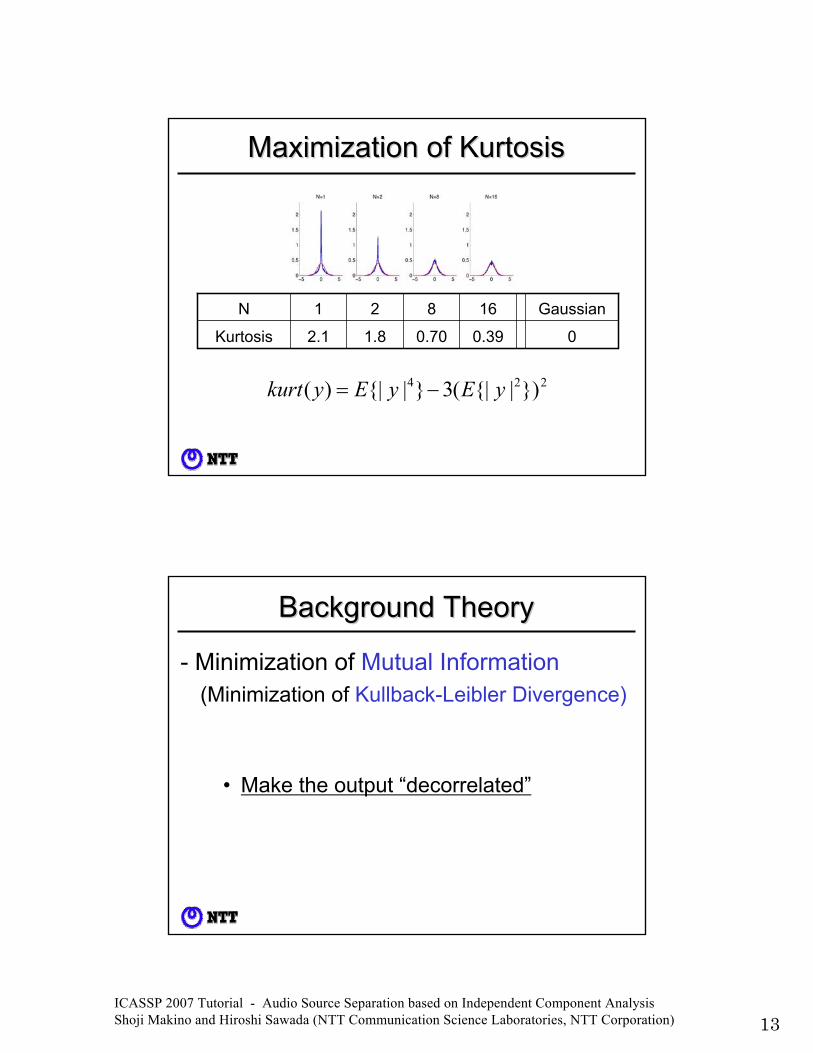
Maximization of KurtosisMaximization of Kurtosis
00.390.701.82.1Kurtosis
Gaussian16821N
224 })|{|(3}|{|)( yEyEykurt −=
Background TheoryBackground Theory
- Minimization of Mutual Information(Minimization of Kullback-Leibler Divergence)
• Make the output “decorrelated”
ICASSP 2007 Tutorial - Audio Source Separation based on Independent Component Analysis Shoji Makino and Hiroshi Sawada (NTT Communication Science Laboratories, NTT Corporation) 14
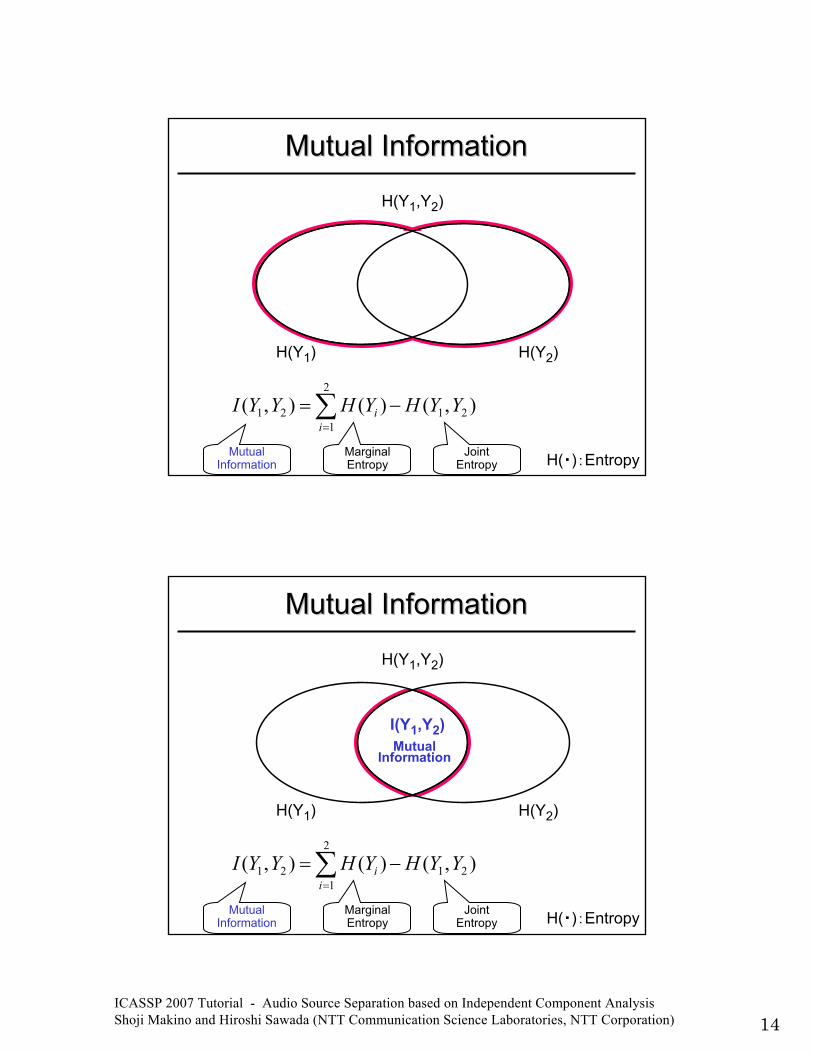
H(Y2)H(Y1)
H(Y1,Y2)
),()(),( 21
2
121 YYHYHYYI
ii −=∑
=
MarginalEntropy
JointEntropy
MutualInformation
Mutual InformationMutual Information
H(・):Entropy
H(Y2)H(Y1)
H(Y1,Y2)
I(Y1,Y2)Mutual
Information
),()(),( 21
2
121 YYHYHYYI
ii −=∑
=
Mutual InformationMutual Information
H(・):EntropyMarginalEntropy
JointEntropy
MutualInformation
ICASSP 2007 Tutorial - Audio Source Separation based on Independent Component Analysis Shoji Makino and Hiroshi Sawada (NTT Communication Science Laboratories, NTT Corporation) 15
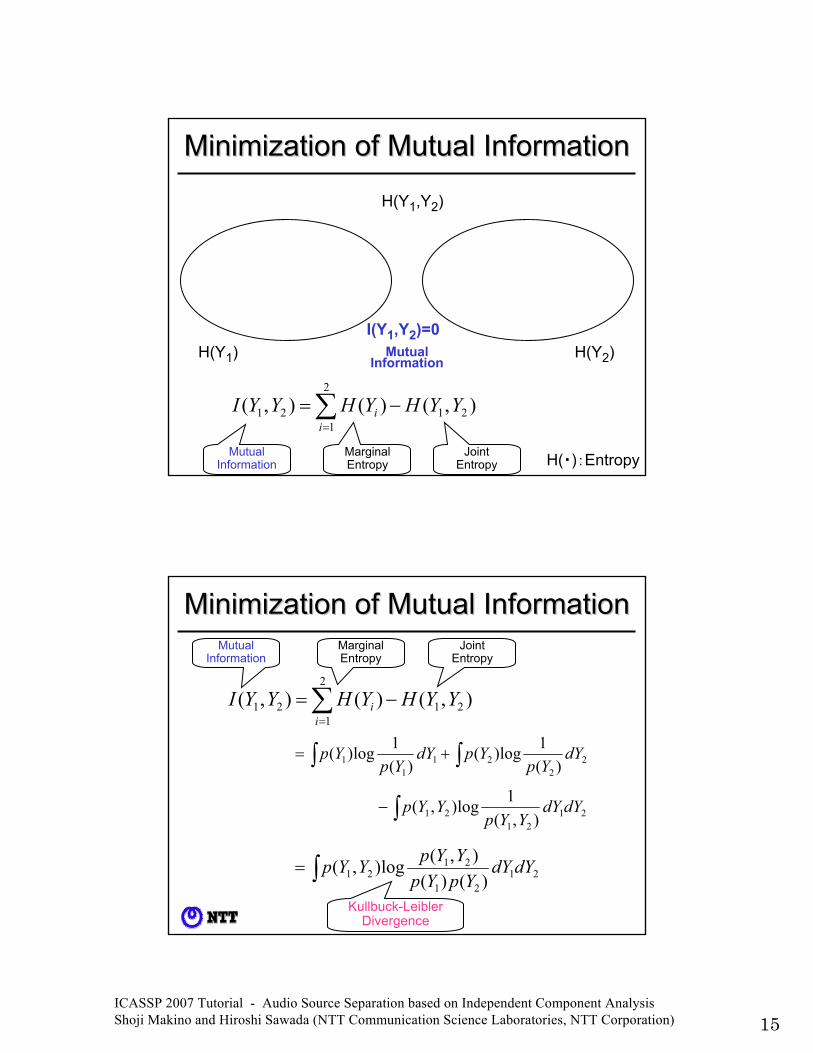
H(Y2)H(Y1)I(Y1,Y2)=0
Mutual Information
),()(),( 21
2
121 YYHYHYYI
ii −=∑
=
H(Y1,Y2)
Minimization of Mutual InformationMinimization of Mutual Information
H(・):EntropyMarginalEntropy
JointEntropy
MutualInformation
),()(),( 21
2
121 YYHYHYYI
ii −=∑
=
MarginalEntropy
JointEntropy
MutualInformation
∫∫ += 22
211
1 )(1log)(
)(1log)( dY
YpYpdY
YpYp
∫− 2121
21 ),(1log),( dYdY
YYpYYp
∫= 2121
2121 )()(
),(log),( dYdYYpYp
YYpYYp
Kullbuck-LeiblerDivergence
Minimization of Mutual InformationMinimization of Mutual Information
ICASSP 2007 Tutorial - Audio Source Separation based on Independent Component Analysis Shoji Makino and Hiroshi Sawada (NTT Communication Science Laboratories, NTT Corporation) 16
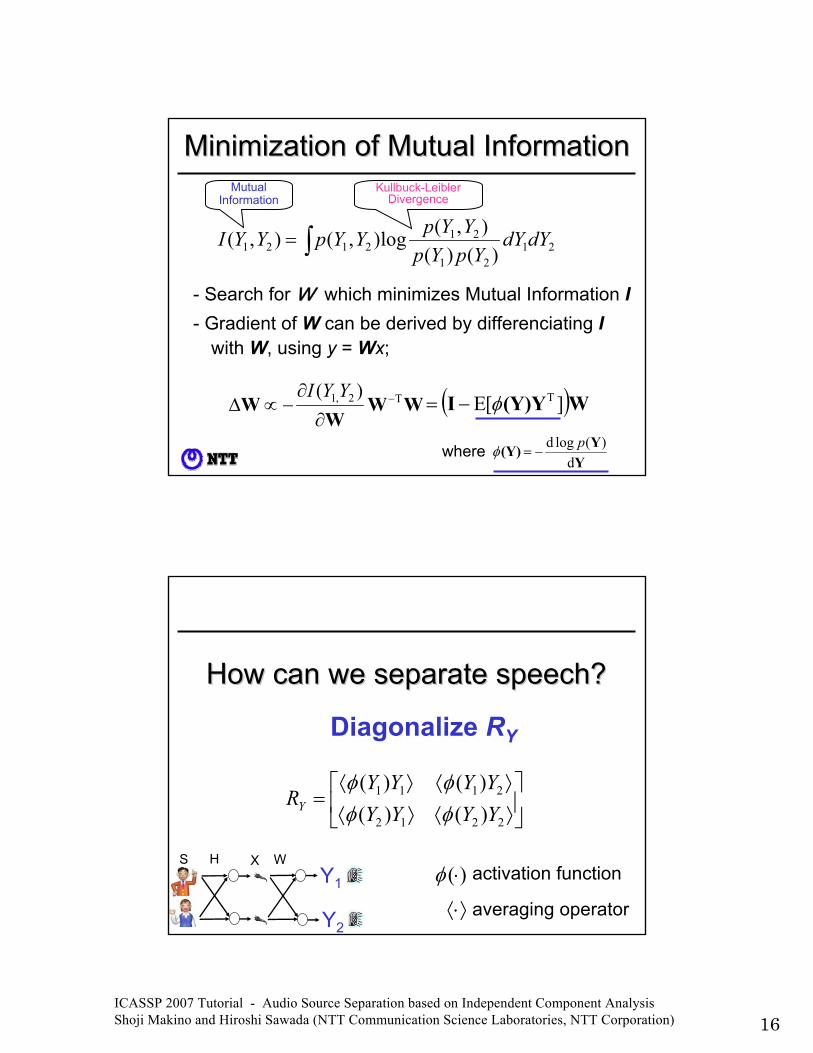
∫= 2121
212121 )()(
),(log),(),( dYdYYpYp
YYpYYpYYI
MutualInformation
Kullbuck-LeiblerDivergence
- Search for W which minimizes Mutual Information I- Gradient of W can be derived by differenciating I
with W, using y = Wx;
WWW
W T2,1 )( −
∂∂
−∝ΔYYI ( )W(Y)YI ][E Tφ−=
YY(Y)
d)(logd p
−=φwhere
Minimization of Mutual InformationMinimization of Mutual Information
How can we separate speech?How can we separate speech?
Diagonalize RY
⎥⎦
⎤⎢⎣
⎡⟩⟨⟩⟨⟩⟨⟩⟨
=2212
2111
)()()()(YYYYYYYY
RY φφφφ
S H X WY1
Y2⟨⋅⟩ averaging operator
)(⋅φ activation function
ICASSP 2007 Tutorial - Audio Source Separation based on Independent Component Analysis Shoji Makino and Hiroshi Sawada (NTT Communication Science Laboratories, NTT Corporation) 17
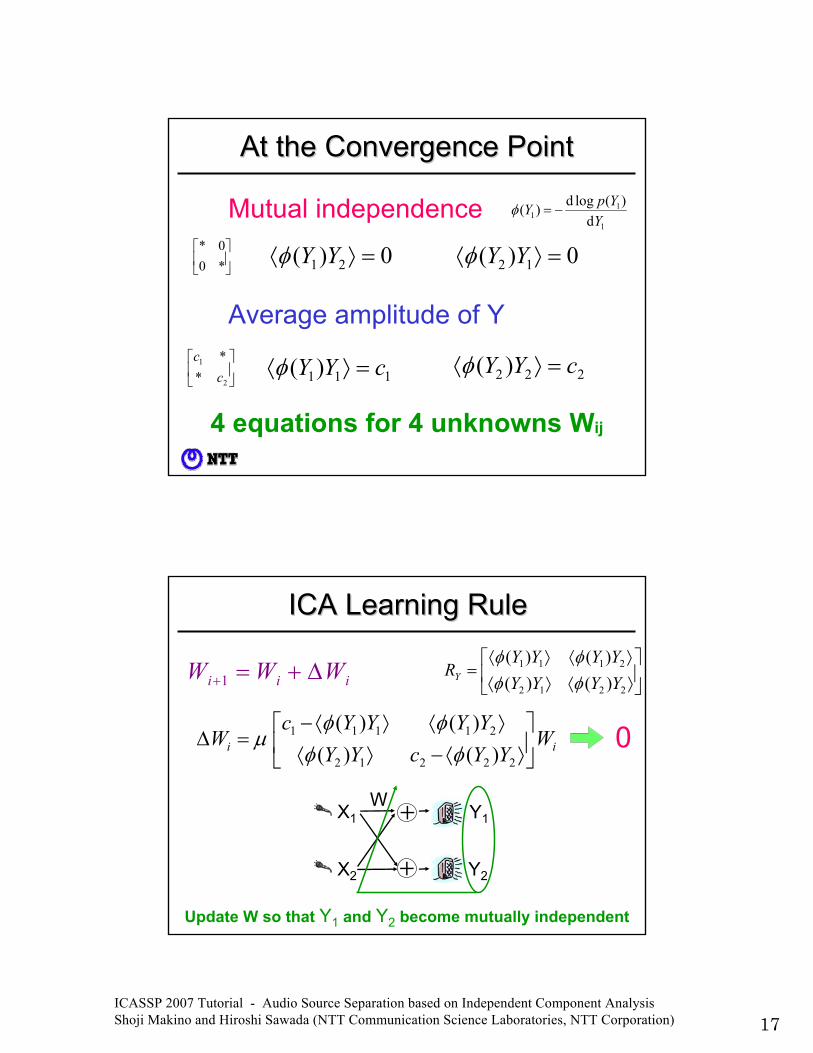
0)( 12 =⟩⟨ YYφ0)( 21 =⟩⟨ YYφ
Mutual independence
At the Convergence PointAt the Convergence Point
⎥⎦
⎤⎢⎣
⎡*00*
Average amplitude of Y
111)( cYY =⟩⟨φ 222 )( cYY =⟩⟨φ⎥⎦
⎤⎢⎣
⎡
2
1
**c
c
4 equations for 4 unknowns Wij
1
11 d
)(logd)(Y
YpY −=φ
iii WWW Δ+=+1
ii WYYcYY
YYYYcW ⎥
⎦
⎤⎢⎣
⎡⟩⟨−⟩⟨
⟩⟨⟩⟨−=Δ
22212
21111
)()()()(
φφφφ
μ 0
⎥⎦
⎤⎢⎣
⎡⟩⟨⟩⟨⟩⟨⟩⟨
=2212
2111
)()()()(YYYYYYYY
RY φφφφ
+
+
Y1
Y2
X1
X2
W
ICA Learning RuleICA Learning Rule
Update W so that Y1 and Y2 become mutually independent
ICASSP 2007 Tutorial - Audio Source Separation based on Independent Component Analysis Shoji Makino and Hiroshi Sawada (NTT Communication Science Laboratories, NTT Corporation) 18
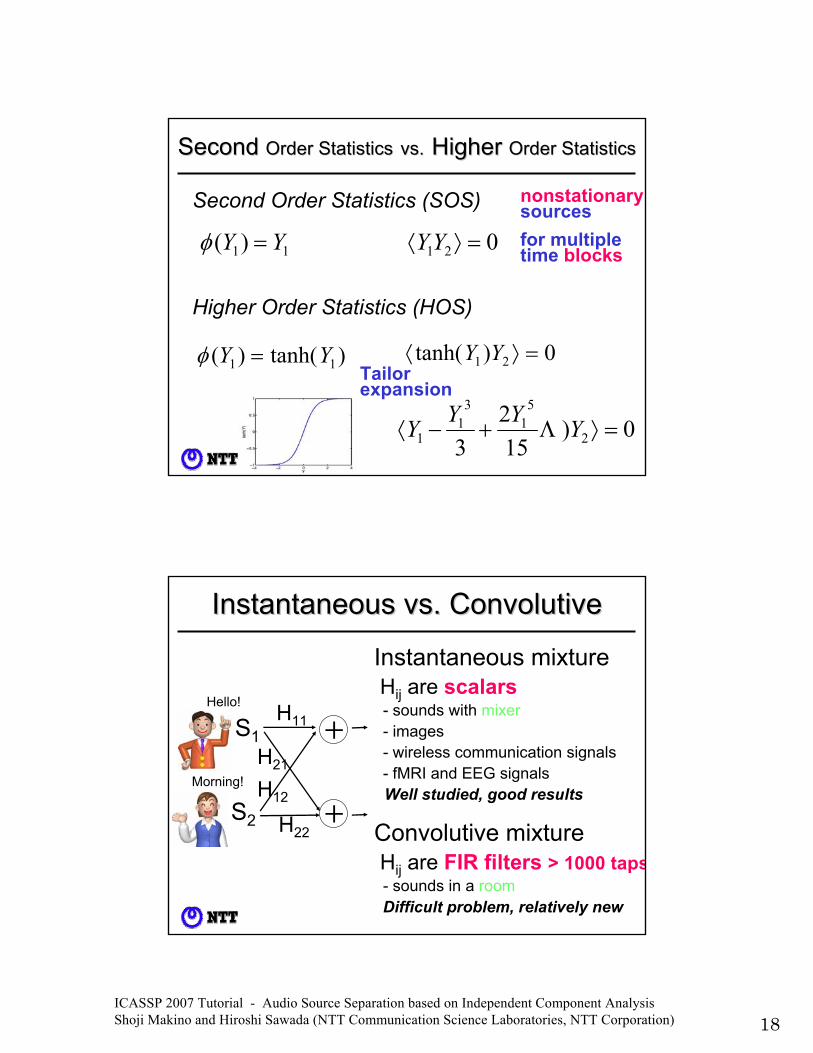
)tanh()( 11 YY =φ
Higher Order Statistics (HOS)
0)( 21 =⟩⟨ YYφ
0)( 21 =⟩⟨ YYφ
Second Second Order StatisticsOrder Statistics vs.vs. Higher Higher Order StatisticsOrder Statistics
Second Order Statistics (SOS)
11)( YY =φ 021 =⟩⟨ YY
0)152
3 2
51
31
1 =⟩+−⟨ YYYY Λ
for multipletime blocks
nonstationarysources
Tailorexpansion
0)tanh( 21 =⟩⟨ YY
Convolutive mixtureHij are FIR filters > 1000 taps- sounds in a room
Instantaneous vs. ConvolutiveInstantaneous vs. Convolutive
Instantaneous mixtureHij are scalars- sounds with mixer- images- wireless communication signals- fMRI and EEG signals
+
+
Hello!
Morning!
S1
S2
H11
H21
H12
H22
Well studied, good results
Difficult problem, relatively new
ICASSP 2007 Tutorial - Audio Source Separation based on Independent Component Analysis Shoji Makino and Hiroshi Sawada (NTT Communication Science Laboratories, NTT Corporation) 19
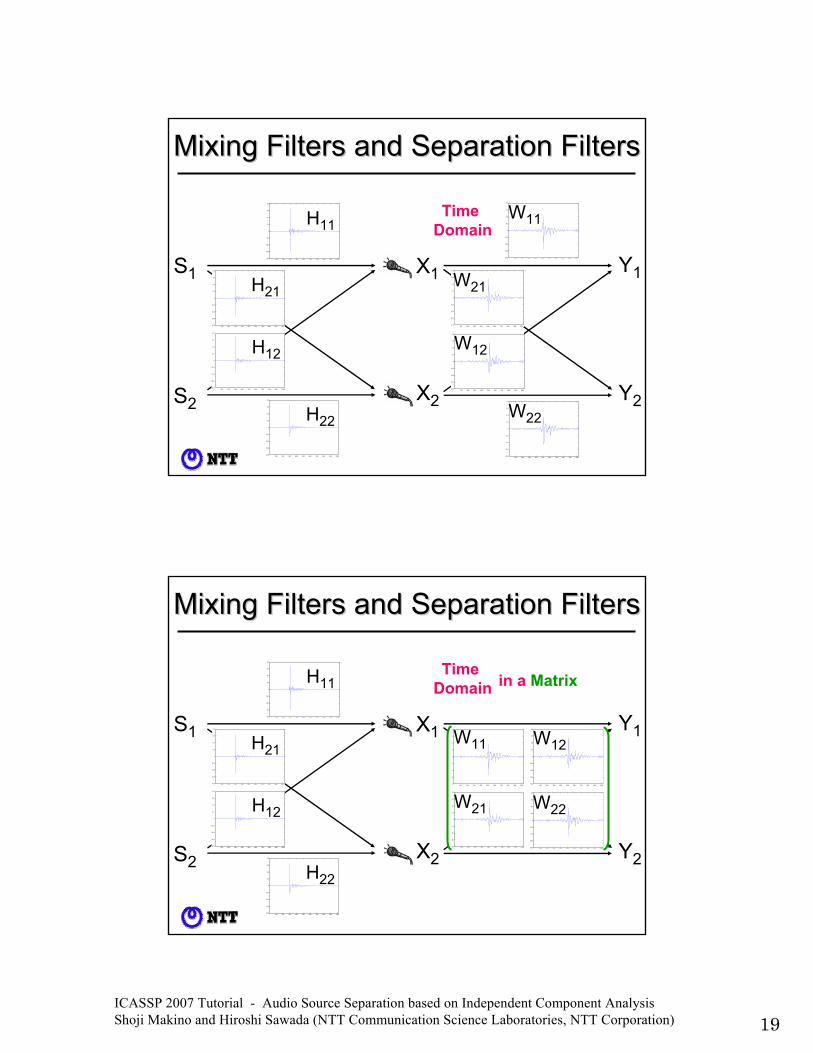
Mixing Filters and Separation FiltersMixing Filters and Separation Filters
Y1
Y2
S1
S2
X1
X2
100 200 300 400 500 600 700 800 900 1000−0.8
−0.6
−0.4
−0.2
0
0.2
0.4
0.6
0.8
H11
100 200 300 400 500 600 700 800 900 1000−0.8
−0.6
−0.4
−0.2
0
0.2
0.4
0.6
0.8
H21
100 200 300 400 500 600 700 800 900 1000−0.8
−0.6
−0.4
−0.2
0
0.2
0.4
0.6
0.8
H12
100 200 300 400 500 600 700 800 900 1000−0.8
−0.6
−0.4
−0.2
0
0.2
0.4
0.6
0.8
H22
100 200 300 400 500 600 700 800 900 1000−0.8
−0.6
−0.4
−0.2
0
0.2
0.4
0.6
0.8
W11
100 200 300 400 500 600 700 800 900 1000−0.8
−0.6
−0.4
−0.2
0
0.2
0.4
0.6
0.8
W22
100 200 300 400 500 600 700 800 900 1000−0.8
−0.6
−0.4
−0.2
0
0.2
0.4
0.6
0.8
W21
100 200 300 400 500 600 700 800 900 1000−0.8
−0.6
−0.4
−0.2
0
0.2
0.4
0.6
0.8
W12
Time Domain
Y1
Y2
S1
S2
X1
X2
100 200 300 400 500 600 700 800 900 1000−0.8
−0.6
−0.4
−0.2
0
0.2
0.4
0.6
0.8
H11
100 200 300 400 500 600 700 800 900 1000−0.8
−0.6
−0.4
−0.2
0
0.2
0.4
0.6
0.8
H21
100 200 300 400 500 600 700 800 900 1000−0.8
−0.6
−0.4
−0.2
0
0.2
0.4
0.6
0.8
H12
100 200 300 400 500 600 700 800 900 1000−0.8
−0.6
−0.4
−0.2
0
0.2
0.4
0.6
0.8
H22
100 200 300 400 500 600 700 800 900 1000−0.8
−0.6
−0.4
−0.2
0
0.2
0.4
0.6
0.8
W21
100 200 300 400 500 600 700 800 900 1000−0.8
−0.6
−0.4
−0.2
0
0.2
0.4
0.6
0.8
W22
100 200 300 400 500 600 700 800 900 1000−0.8
−0.6
−0.4
−0.2
0
0.2
0.4
0.6
0.8
W11
100 200 300 400 500 600 700 800 900 1000−0.8
−0.6
−0.4
−0.2
0
0.2
0.4
0.6
0.8
W12
Mixing Filters and Separation FiltersMixing Filters and Separation Filters
Time Domain in a Matrix
ICASSP 2007 Tutorial - Audio Source Separation based on Independent Component Analysis Shoji Makino and Hiroshi Sawada (NTT Communication Science Laboratories, NTT Corporation) 20
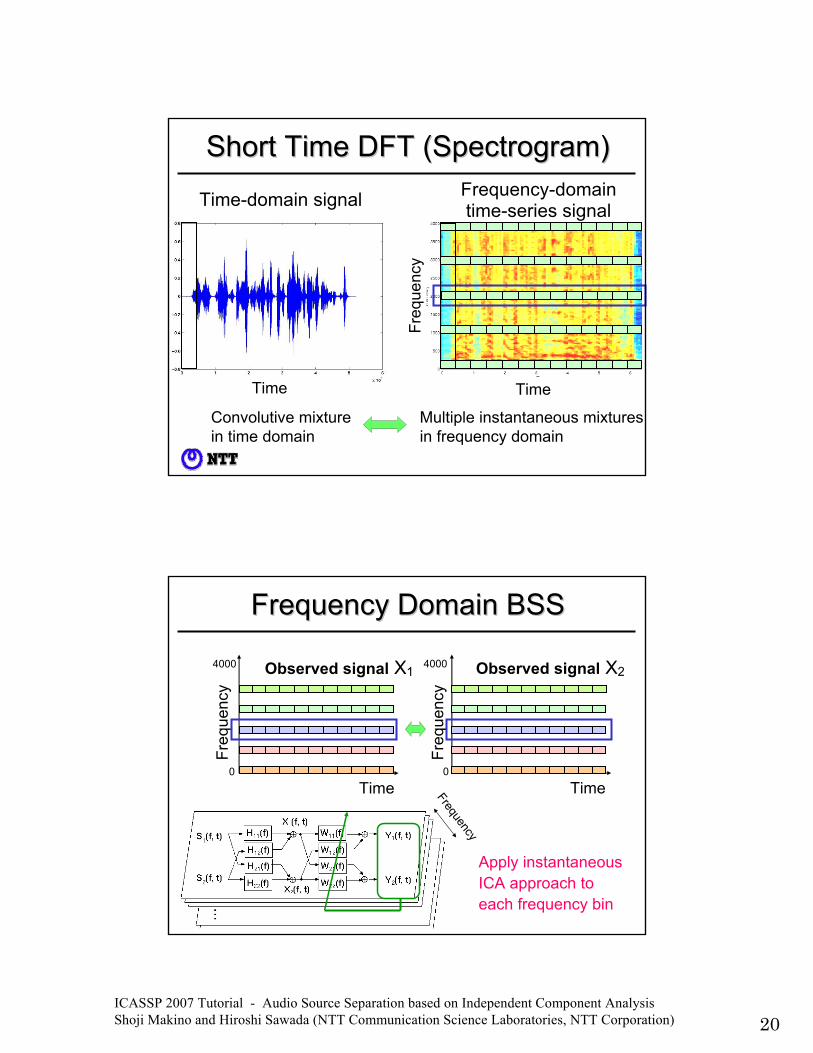
Time
Time-domain signal
TimeFr
eque
ncy
Frequency-domain time-series signal
Short Time DFT (Spectrogram)Short Time DFT (Spectrogram)
Convolutive mixture in time domain
Multiple instantaneous mixtures in frequency domain
Frequency-domain time-series signal
Freq
uenc
y
Time
4000
0
Observed signal X2
Apply instantaneous ICA approach to each frequency bin
4000
0
Freq
uenc
y
Time
Observed signal X1
Frequency
Frequency Domain BSSFrequency Domain BSS
ICASSP 2007 Tutorial - Audio Source Separation based on Independent Component Analysis Shoji Makino and Hiroshi Sawada (NTT Communication Science Laboratories, NTT Corporation) 21
Y1
Y2
S1
S2
X1
X2
100 200 300 400 500 600 700 800 900 1000−0.8
−0.6
−0.4
−0.2
0
0.2
0.4
0.6
0.8
H11
100 200 300 400 500 600 700 800 900 1000−0.8
−0.6
−0.4
−0.2
0
0.2
0.4
0.6
0.8
H21
100 200 300 400 500 600 700 800 900 1000−0.8
−0.6
−0.4
−0.2
0
0.2
0.4
0.6
0.8
H12
100 200 300 400 500 600 700 800 900 1000−0.8
−0.6
−0.4
−0.2
0
0.2
0.4
0.6
0.8
H22
W11(f)W11(f)W11(f)W11(f)W11(f)
W11(f)W11(f)W11(f)W11(f)W21(f)
W11(f)W11(f)W11(f)W11(f)W12(f)
W11(f)W11(f)W11(f)W11(f)W22(f)
Frequency
Frequency
Frequency
Frequency
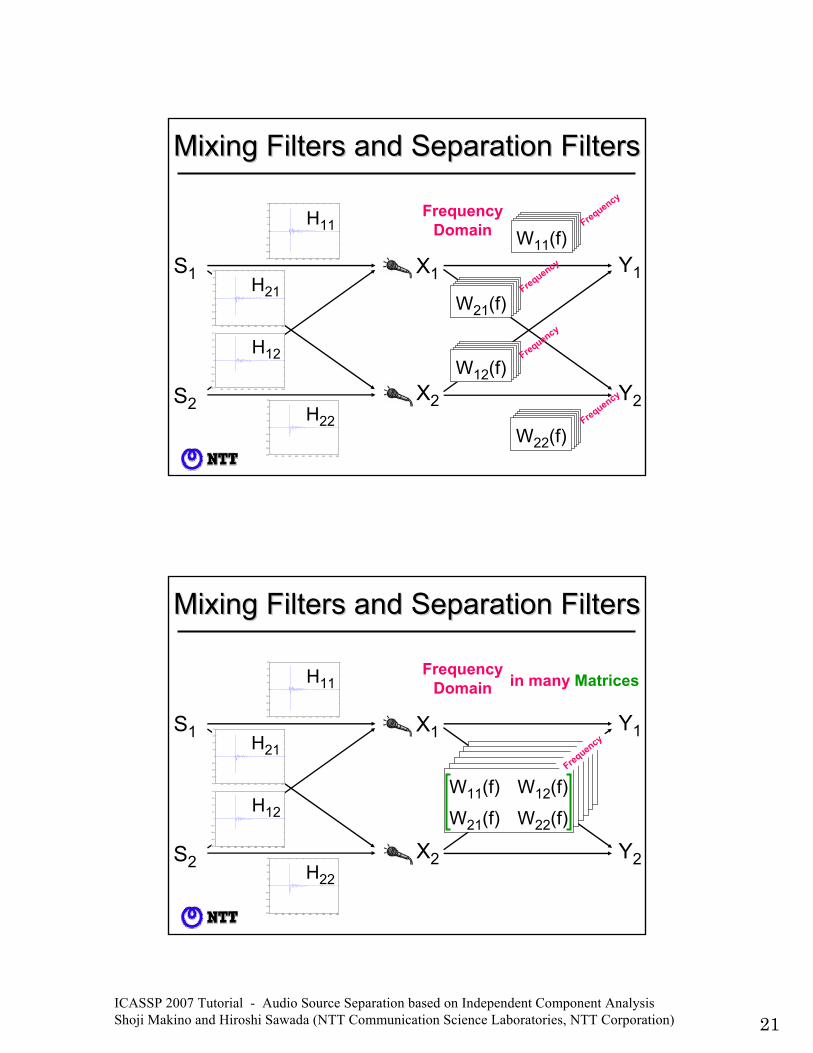
Mixing Filters and Separation FiltersMixing Filters and Separation Filters
FrequencyDomain
Y1
Y2
S1
S2
X1100 200 300 400 500 600 700 800 900 1000
−0.8
−0.6
−0.4
−0.2
0
0.2
0.4
0.6
0.8
H11
100 200 300 400 500 600 700 800 900 1000−0.8
−0.6
−0.4
−0.2
0
0.2
0.4
0.6
0.8
H21
100 200 300 400 500 600 700 800 900 1000−0.8
−0.6
−0.4
−0.2
0
0.2
0.4
0.6
0.8
H12
100 200 300 400 500 600 700 800 900 1000−0.8
−0.6
−0.4
−0.2
0
0.2
0.4
0.6
0.8
H22
W11(f) W12(f)
W21(f) W22(f)W11(f) W12(f)
W21(f) W22(f)W11(f) W12(f)
W21(f) W22(f)W11(f) W12(f)
W21(f) W22(f)W11(f) W12(f)
W21(f) W22(f)W11(f) W12(f)
W21(f) W22(f)
Frequency
X2
Mixing Filters and Separation FiltersMixing Filters and Separation Filters
FrequencyDomain in many Matrices
ICASSP 2007 Tutorial - Audio Source Separation based on Independent Component Analysis Shoji Makino and Hiroshi Sawada (NTT Communication Science Laboratories, NTT Corporation) 22
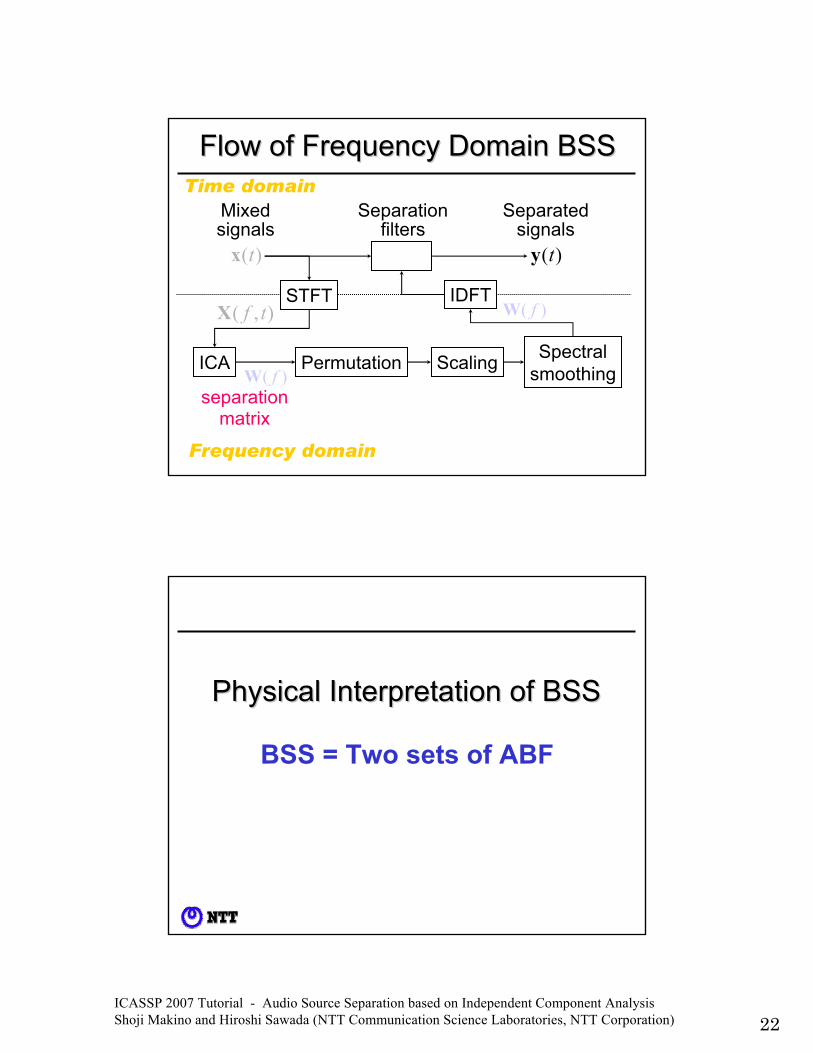
)(ty)(tx
Mixedsignals
Separatedsignals
Separationfilters
Flow of Frequency Domain BSSFlow of Frequency Domain BSSTime domain
ScalingPermutation Spectralsmoothing
Frequency domain
),( tfXSTFT
)( fWICA
separation matrix
)( fWIDFT
)(lw )(lw
Permutation Spectralsmoothing
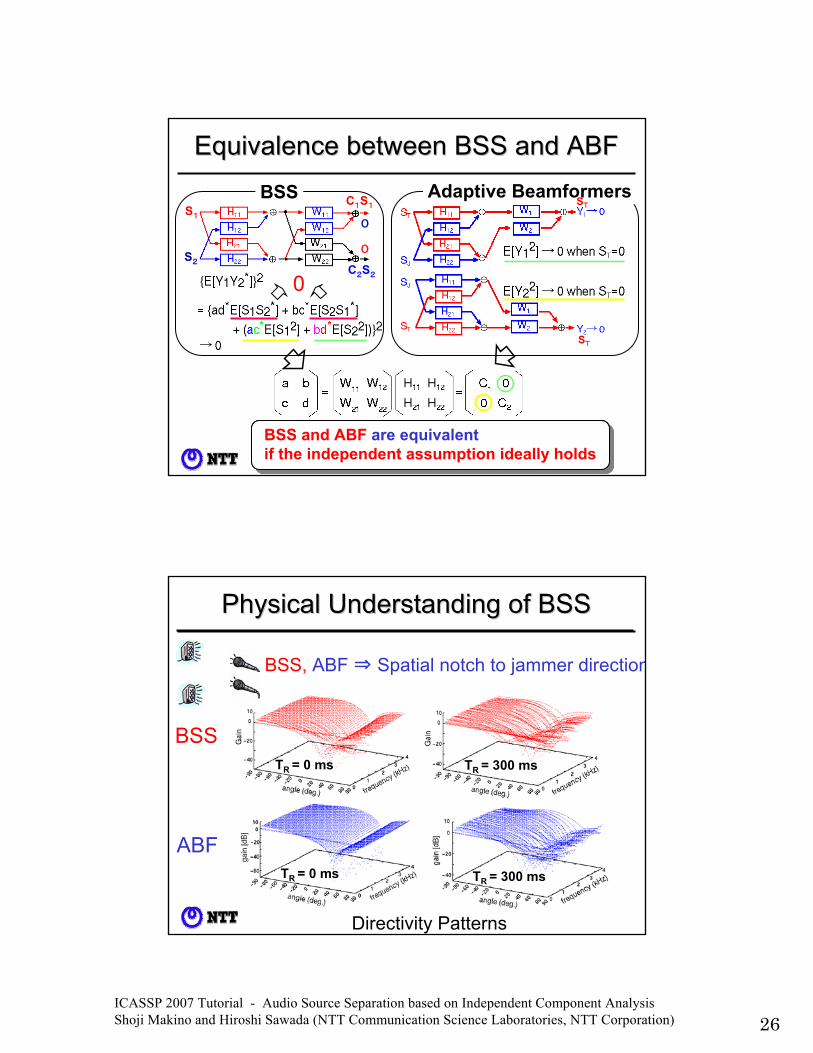
Physical Interpretation of BSSPhysical Interpretation of BSS
BSS = Two sets of ABF
ICASSP 2007 Tutorial - Audio Source Separation based on Independent Component Analysis Shoji Makino and Hiroshi Sawada (NTT Communication Science Laboratories, NTT Corporation) 23
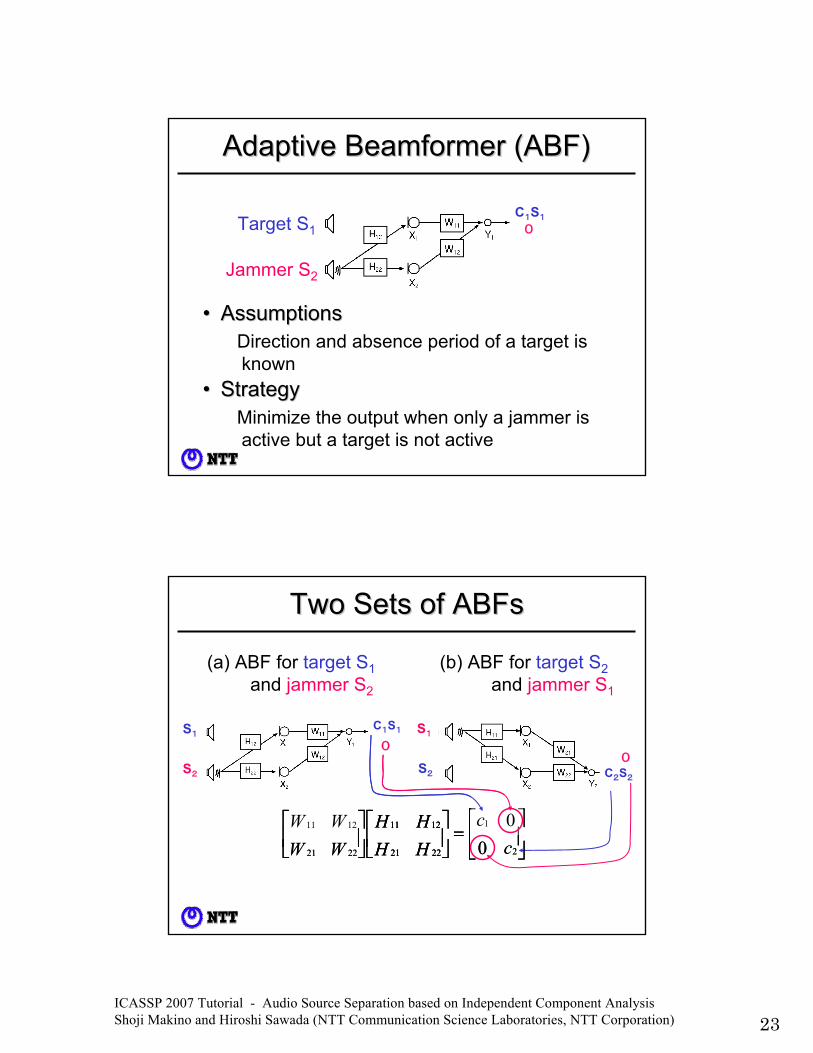
Adaptive Beamformer (ABF)Adaptive Beamformer (ABF)
•• StrategyStrategyMinimize the output when only a jammer is active but a target is not active
(b)
•• AssumptionsAssumptionsDirection and absence period of a target is known
Target S1
Jammer S2
C1S1
0Target S1C1S1
⎥⎦
⎤⎢⎣
⎡=⎥⎦
⎤⎢⎣
⎡⎥⎦
⎤⎢⎣
⎡c
cHHHH
WWWW
2
1
2221
1211
2221
1211
00
Two Sets of ABFsTwo Sets of ABFs
0
C1S1S1
S2
(a) ABF for target S1and jammer S2
C2S2
0
S1
S2
(b) ABF for target S2and jammer S1
⎥⎦
⎤⎢⎣
⎡=⎥⎦
⎤⎢⎣
⎡⎥⎦
⎤⎢⎣
⎡c
cHHHH
WWWW
2
1
2221
1211
2221
1211
00⎥⎦
⎤⎢⎣
⎡=⎥⎦
⎤⎢⎣
⎡⎥⎦
⎤⎢⎣
⎡c
cHHHH
WWWW
2
1
2221
1211
2221
1211
00
ICASSP 2007 Tutorial - Audio Source Separation based on Independent Component Analysis Shoji Makino and Hiroshi Sawada (NTT Communication Science Laboratories, NTT Corporation) 24
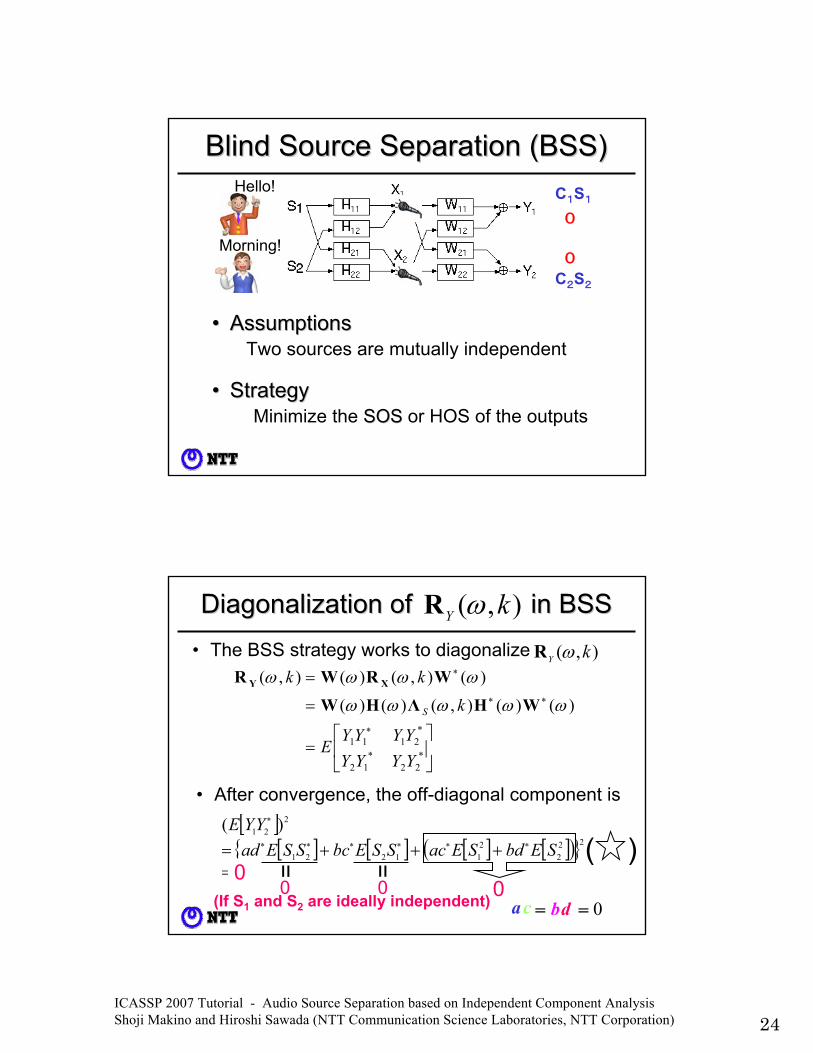
Blind Source Separation (BSS)Blind Source Separation (BSS)
•• StrategyStrategyMinimize the SOSSOS or HOS of the outputs
•• AssumptionsAssumptionsTwo sources are mutually independent
Hello!
Morning!
0
C1S1
0
C2S2
C1S1
C2S2
)()(),()()(
)(),()(),(
*22
*12
*2111⎥⎦
⎤⎢⎣
⎡=
=
=
∗
∗∗
∗
YYYYYYYY
E
k
kk
S ωωωωω
ωωωω
WHΛHW
WRWR XY
[ ][ ] [ ] [ ] [ ]( ){ }
0
)(22
22
11221
221
=+++= ∗∗∗∗∗∗
∗
SEbdSEacSSEbcSSEadYYE
( )
• After convergence, the off-diagonal component is
Diagonalization of in BSSDiagonalization of in BSS
= =
0 0(If S1 and S2 are ideally independent)
),( kY ωR
),( kY ωR• The BSS strategy works to diagonalize
00
dc b 0= = a
ICASSP 2007 Tutorial - Audio Source Separation based on Independent Component Analysis Shoji Makino and Hiroshi Sawada (NTT Communication Science Laboratories, NTT Corporation) 25
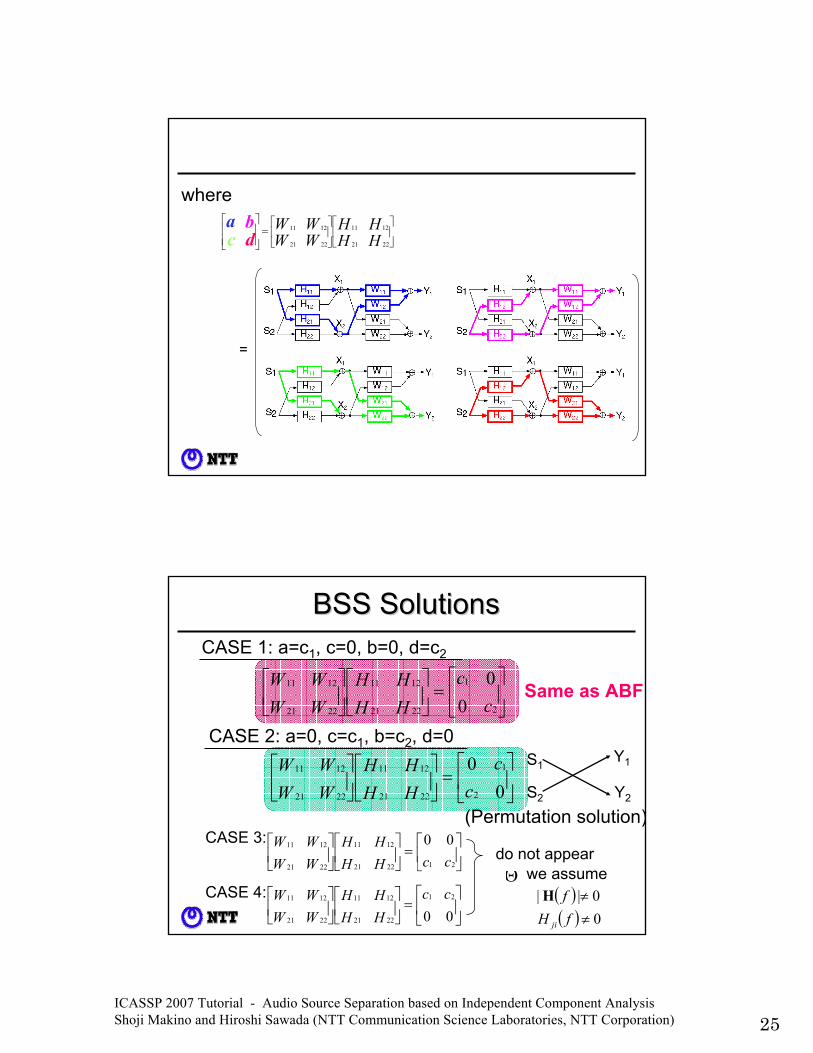
=
where
⎥⎦
⎤⎢⎣
⎡⎥⎦
⎤⎢⎣
⎡=
⎥⎥⎦
⎤
⎢⎢⎣
⎡
HHHH
WWWW
dac
b
2221
1211
2221
1211a bc d
BSS SolutionsBSS Solutions
⎥⎦
⎤⎢⎣
⎡=⎥⎦
⎤⎢⎣
⎡⎥⎦
⎤⎢⎣
⎡c
cHHHH
WWWW
2
1
2221
1211
2221
1211
00
CASE 1: a=c1, c=0, b=0, d=c2
⎥⎦
⎤⎢⎣
⎡=⎥⎦
⎤⎢⎣
⎡⎥⎦
⎤⎢⎣
⎡0
02
1
2221
1211
2221
1211
cc
HHHH
WWWW
CASE 2: a=0, c=c1, b=c2, d=0
(Permutation solution)
⎥⎦
⎤⎢⎣
⎡=⎥⎦
⎤⎢⎣
⎡⎥⎦
⎤⎢⎣
⎡ccHH
HHWWWW
212221
1211
2221
1211 00CASE 3:
⎥⎦
⎤⎢⎣
⎡=⎥⎦
⎤⎢⎣
⎡⎥⎦
⎤⎢⎣
⎡00
21
2221
1211
2221
1211 ccHHHH
WWWWCASE 4: ( ) 0|| ≠fH
( ) 0≠fH ji
do not appearwe assumeΘ
S1
S2
Y1
Y2
Same as ABF
ICASSP 2007 Tutorial - Audio Source Separation based on Independent Component Analysis Shoji Makino and Hiroshi Sawada (NTT Communication Science Laboratories, NTT Corporation) 26
Adaptive Beamformers0
C1S1
S2
S1
0
C2S2
BSS
Equivalence between BSS and ABFEquivalence between BSS and ABF
0
if the independent assumption ideally holdsBSS and ABF are equivalentif the independent assumption ideally holds
ST
ST
Physical Understanding of BSSPhysical Understanding of BSS
Directivity Patterns
TR = 300 ms TR = 0 ms
TR = 300 msTR = 0 ms
BSS
ABF
BSS, ABF ⇒ Spatial notch to jammer direction
ICASSP 2007 Tutorial - Audio Source Separation based on Independent Component Analysis Shoji Makino and Hiroshi Sawada (NTT Communication Science Laboratories, NTT Corporation) 27
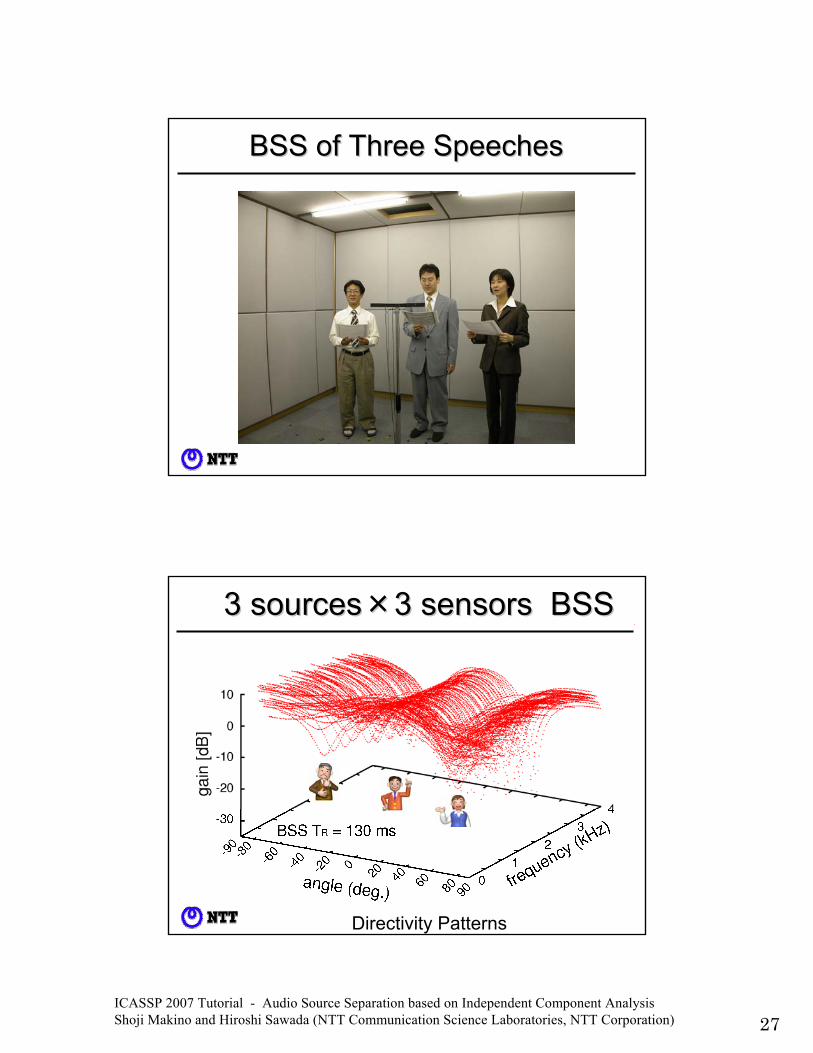
BSS of Three SpeechesBSS of Three Speeches
3 sources3 sources××3 sensors BSS3 sensors BSS
Directivity Patterns
ICASSP 2007 Tutorial - Audio Source Separation based on Independent Component Analysis Shoji Makino and Hiroshi Sawada (NTT Communication Science Laboratories, NTT Corporation) 28
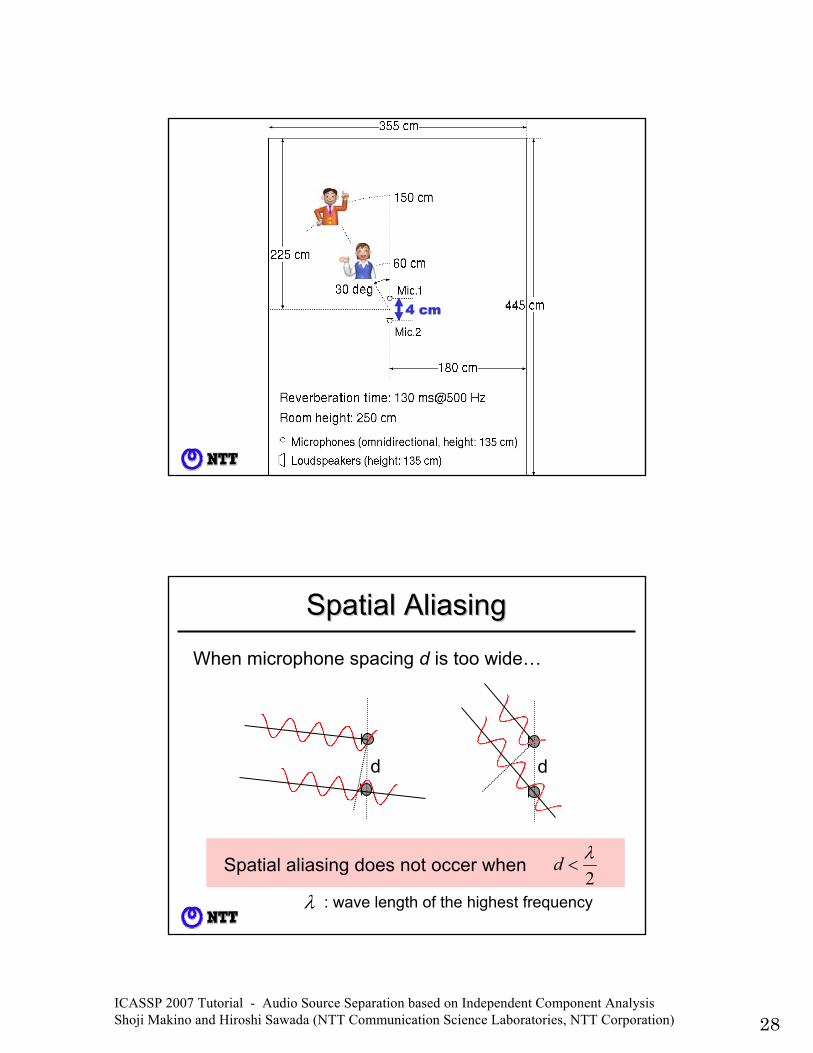
4 cm
Spatial AliasingSpatial Aliasing
2λ
<d
λ : wave length of the highest frequency
When microphone spacing d is too wide…
dd
Spatial aliasing does not occer when
ICASSP 2007 Tutorial - Audio Source Separation based on Independent Component Analysis Shoji Makino and Hiroshi Sawada (NTT Communication Science Laboratories, NTT Corporation) 29
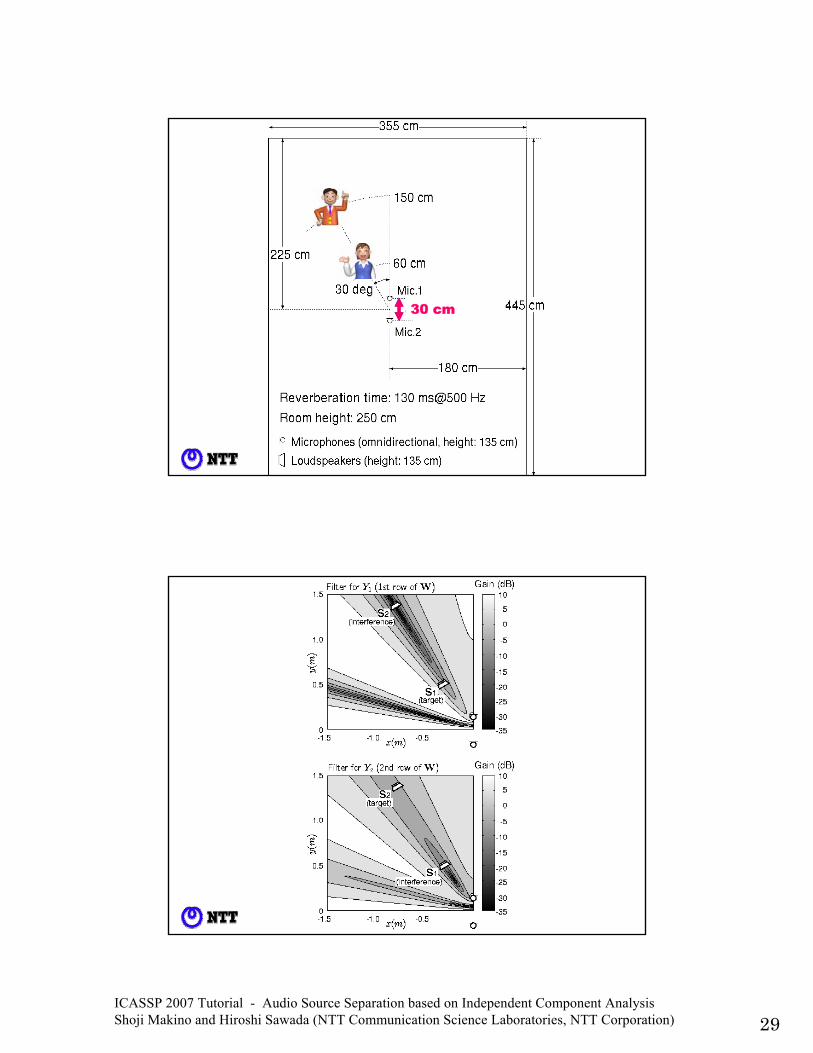
4 cm30 cm
ICASSP 2007 Tutorial - Audio Source Separation based on Independent Component Analysis Shoji Makino and Hiroshi Sawada (NTT Communication Science Laboratories, NTT Corporation) 30
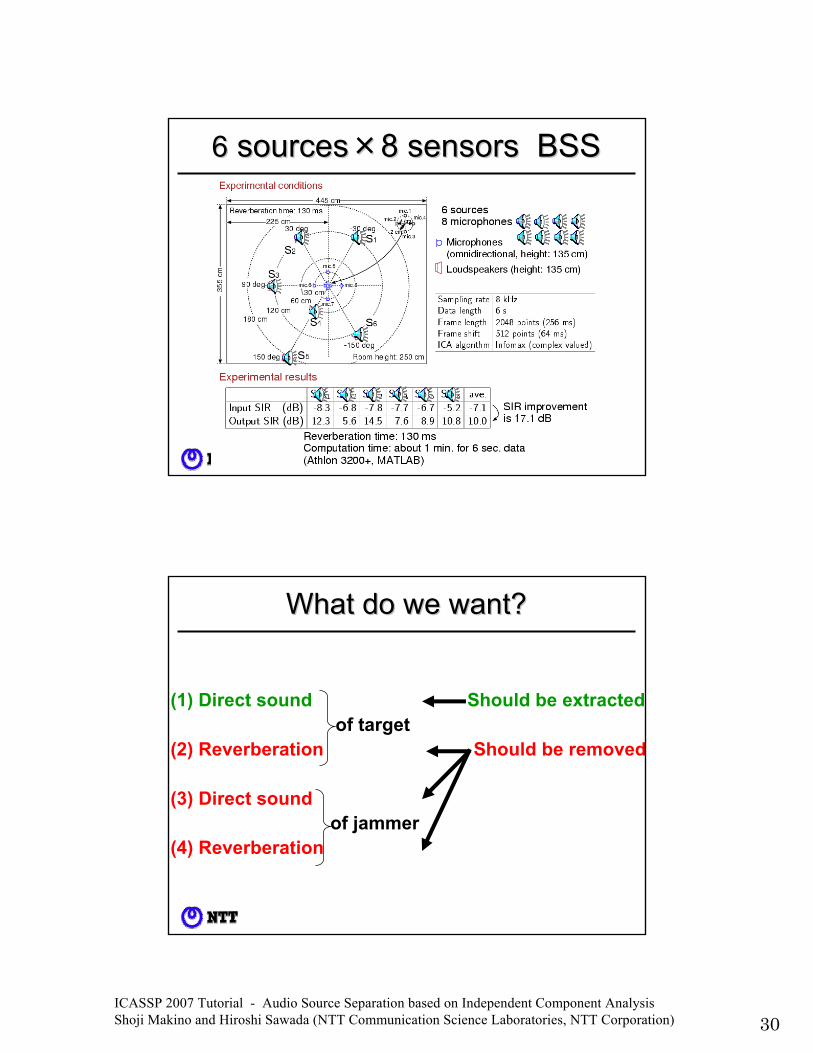
66 sourcessources××8 sensors BSS8 sensors BSS
What do we want?What do we want?
(1) Direct sound Should be extractedof target
(2) Reverberation Should be removed
(3) Direct soundof jammer
(4) Reverberation
ICASSP 2007 Tutorial - Audio Source Separation based on Independent Component Analysis Shoji Makino and Hiroshi Sawada (NTT Communication Science Laboratories, NTT Corporation) 31
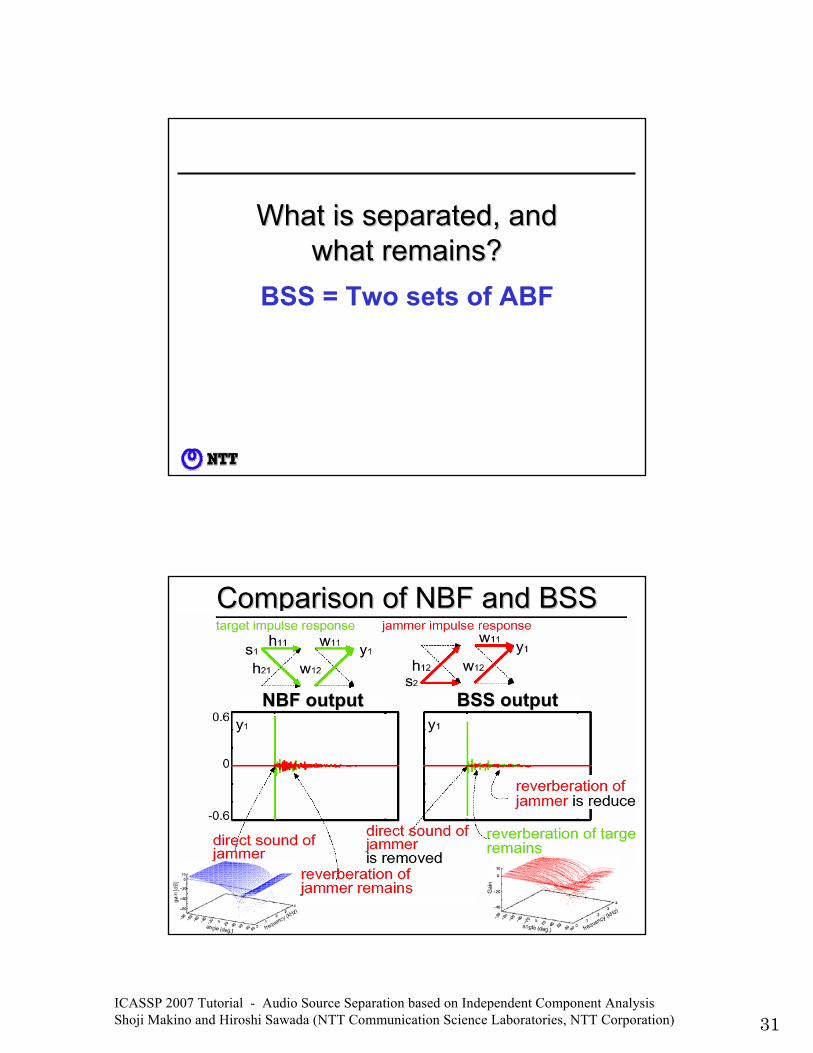
What is separated, and What is separated, and what remains?what remains?
BSS = Two sets of ABF
Comparison of NBF and BSSComparison of NBF and BSS
BSS outputBSS outputNBF outputNBF output
ICASSP 2007 Tutorial - Audio Source Separation based on Independent Component Analysis Shoji Makino and Hiroshi Sawada (NTT Communication Science Laboratories, NTT Corporation) 32
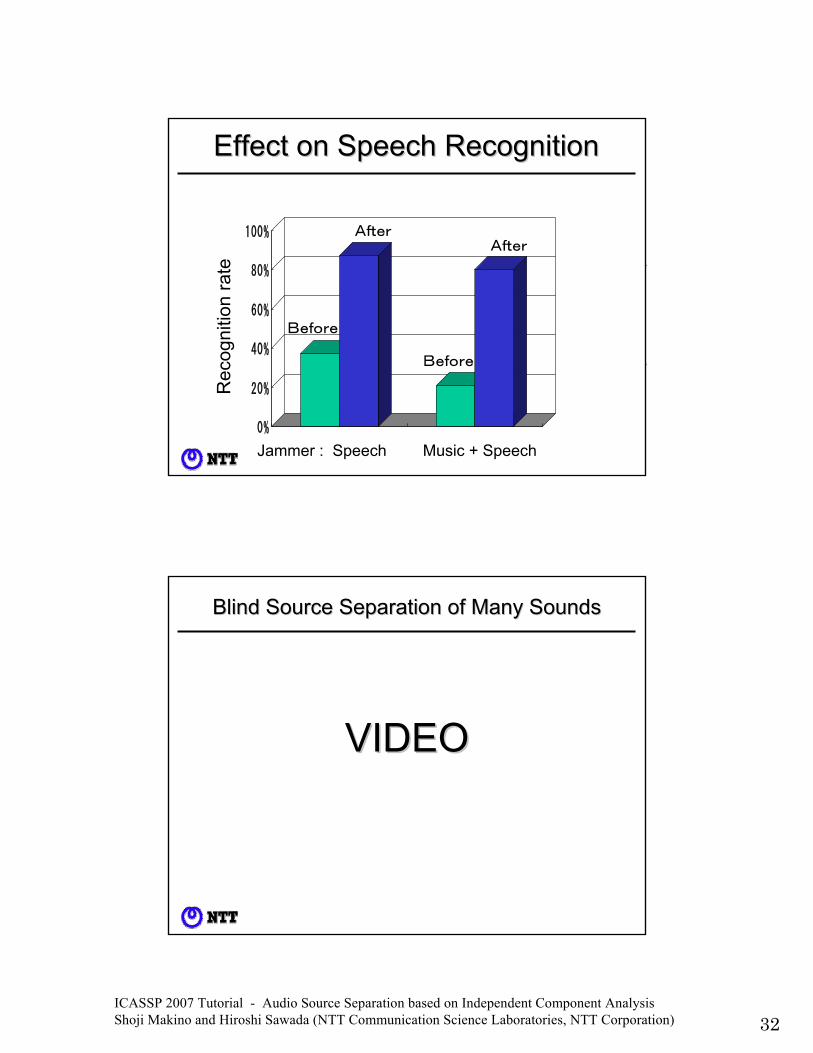
Rec
ogni
tion
rate
0%
20%
40%
60%
80%
100%
妨害音:新聞読み上げ 妨害音:DVD
ブラインド源分離前
ブラインド源分離後
After
Before
Before
After
Jammer : Speech Music + Speech
Effect on Speech RecognitionEffect on Speech Recognition
VIDEOVIDEO
Blind Source Separation of Many SoundsBlind Source Separation of Many Sounds
ICASSP 2007 Tutorial - Audio Source Separation based on Independent Component Analysis Shoji Makino and Hiroshi Sawada (NTT Communication Science Laboratories, NTT Corporation) 33
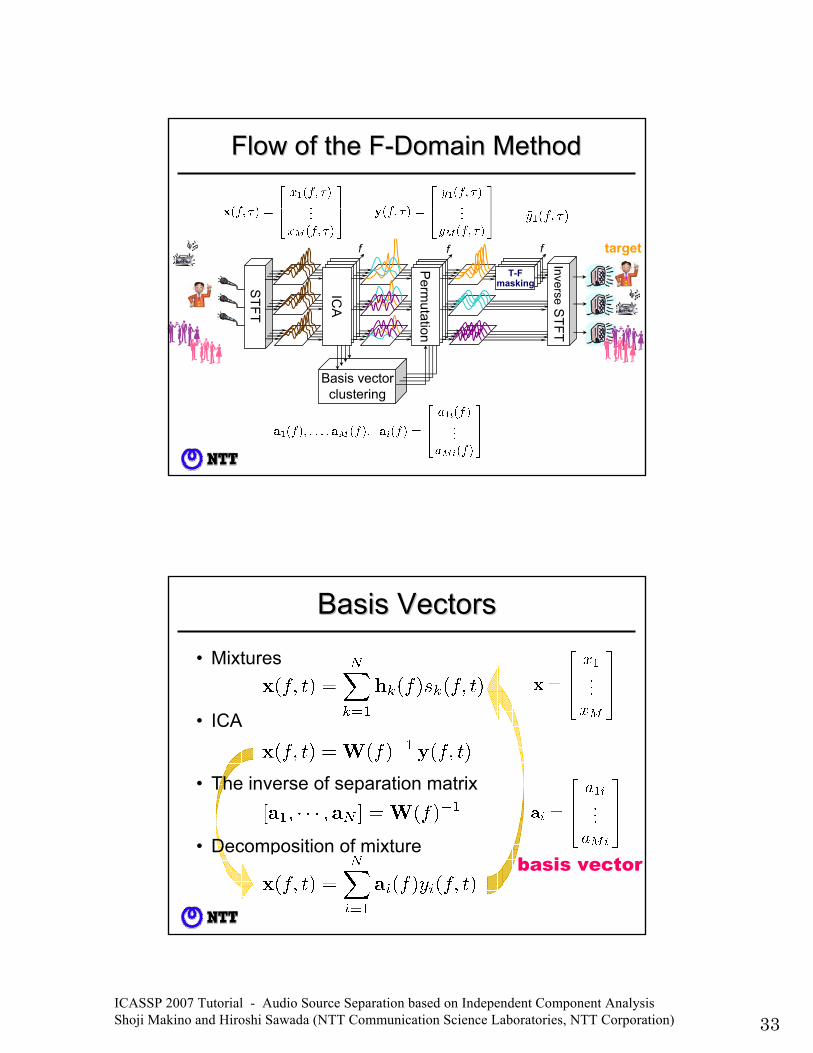
Basis vectorclustering
Flow of the FFlow of the F--Domain MethodDomain Method
ICA
STFT
Perm
utation
T-Fmasking
f f fInverse
STFT
target
• Mixtures
• ICA
• The inverse of separation matrix
• Decomposition of mixture
Basis VectorsBasis Vectors
basis vector
ICASSP 2007 Tutorial - Audio Source Separation based on Independent Component Analysis Shoji Makino and Hiroshi Sawada (NTT Communication Science Laboratories, NTT Corporation) 34
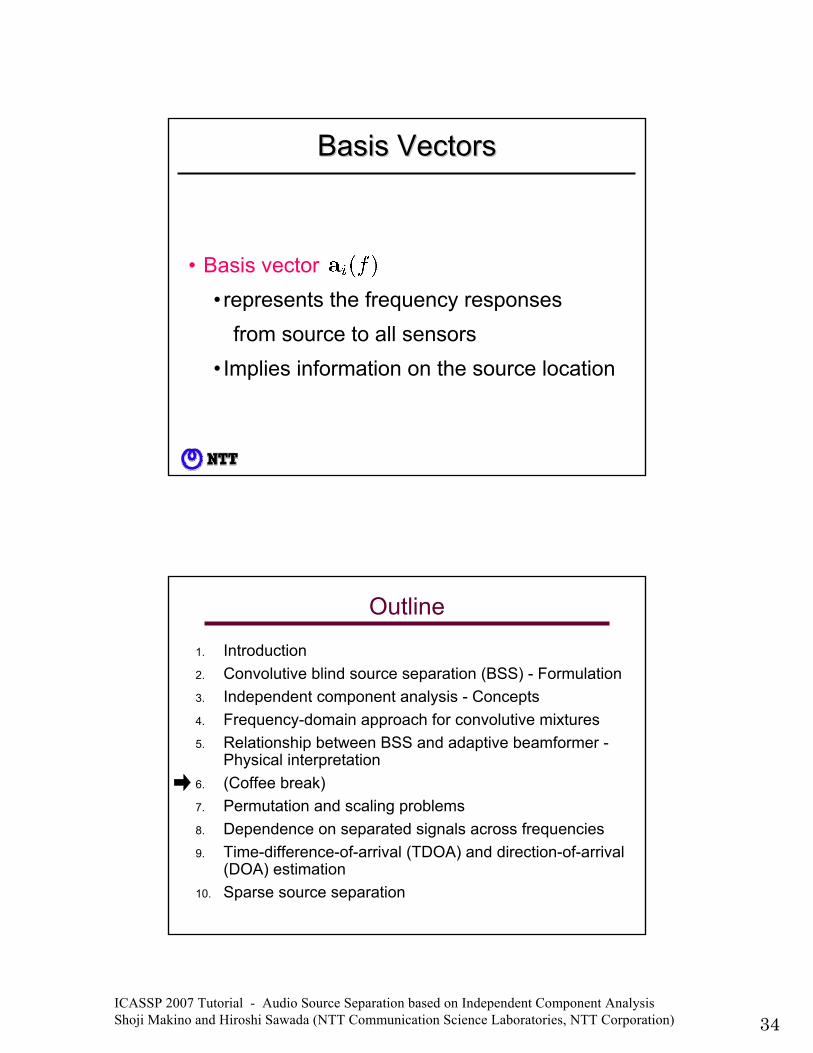
• Basis vector• represents the frequency responses
from source to all sensors• Implies information on the source location
Basis VectorsBasis Vectors
Outline
1. Introduction2. Convolutive blind source separation (BSS) - Formulation3. Independent component analysis - Concepts4. Frequency-domain approach for convolutive mixtures5. Relationship between BSS and adaptive beamformer -
Physical interpretation6. (Coffee break)7. Permutation and scaling problems8. Dependence on separated signals across frequencies9. Time-difference-of-arrival (TDOA) and direction-of-arrival
(DOA) estimation10. Sparse source separation
ICASSP 2007 Tutorial - Audio Source Separation based on Independent Component Analysis Shoji Makino and Hiroshi Sawada (NTT Communication Science Laboratories, NTT Corporation)
1
Audio Source Separation based on Independent Component Analysis
Part II
2
Main topics of first and second parts
Main topic of the first partBasic concepts of BSS and ICAConvolutive BSSFrequency-domain approachBSS and adaptive beamformer
Main topic of the second partDetailed procedure of frequency-domain BSSEspecially, how to solve permutation problemSparse source separation
ICASSP 2007 Tutorial - Audio Source Separation based on Independent Component Analysis Shoji Makino and Hiroshi Sawada (NTT Communication Science Laboratories, NTT Corporation)
3
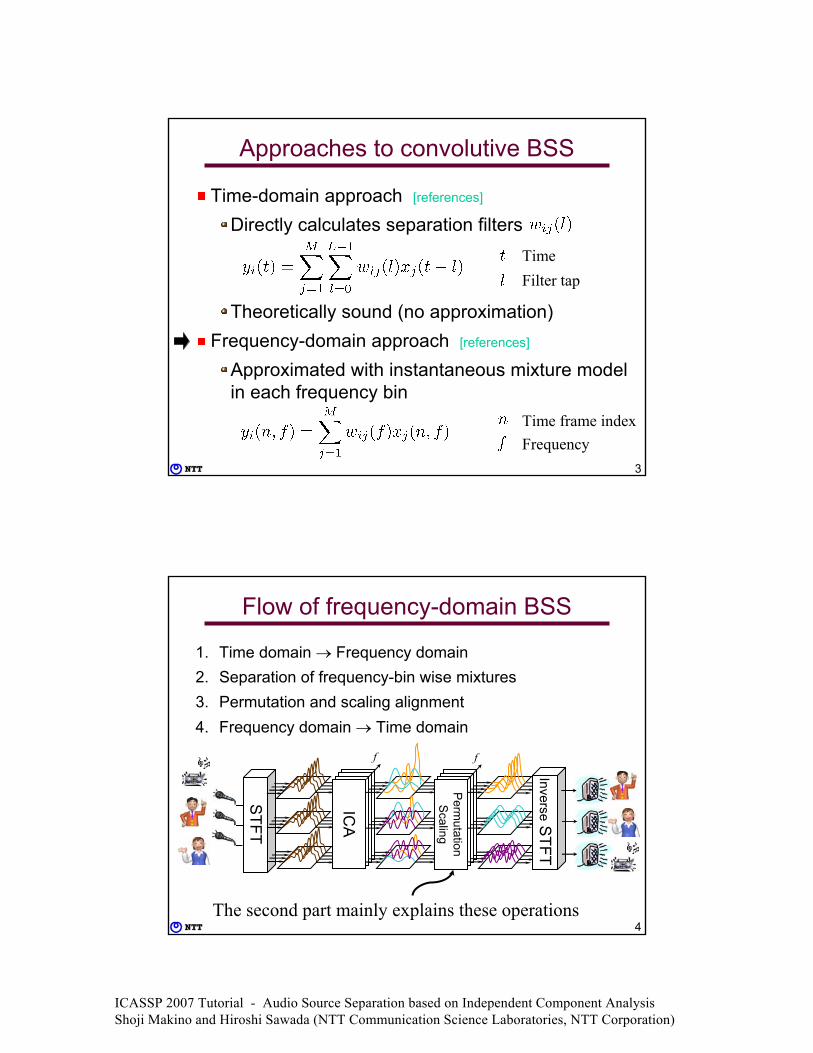
Approaches to convolutive BSS
Time-domain approach [references]
Directly calculates separation filters
Theoretically sound (no approximation)Frequency-domain approach [references]
Approximated with instantaneous mixture model in each frequency bin
TimeFilter tap
Time frame indexFrequency
4
STFT
Flow of frequency-domain BSS
ICA
f
Perm
utationScaling
f
InverseSTFT
The second part mainly explains these operations
1. Time domain → Frequency domain2. Separation of frequency-bin wise mixtures3. Permutation and scaling alignment4. Frequency domain → Time domain
ICASSP 2007 Tutorial - Audio Source Separation based on Independent Component Analysis Shoji Makino and Hiroshi Sawada (NTT Communication Science Laboratories, NTT Corporation)
5
Outline
Part I by Shoji Makino
-------- Coffee break --------
Part II by Hiroshi Sawada
1. Permutation and scaling problems2. Mutual dependence of separated signals
across frequencies3. Time-difference-of-arrival (TDOA) and
direction-of-arrival (DOA) estimation4. Sparse source separation
6
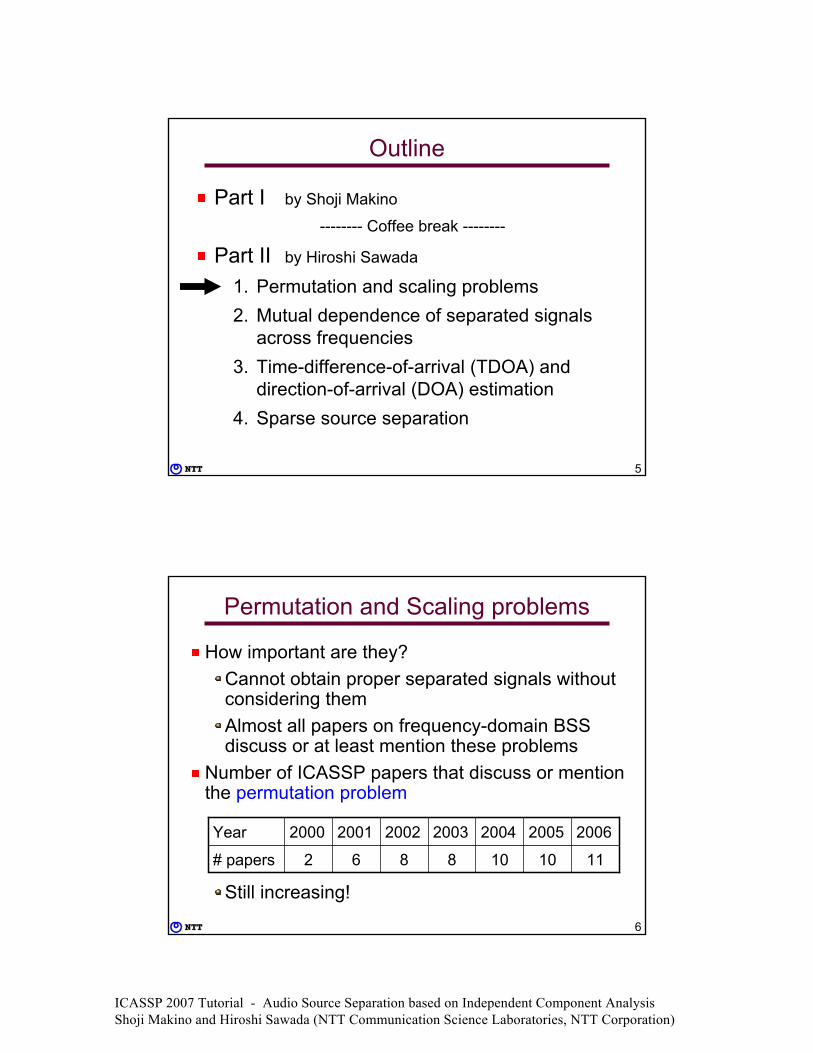
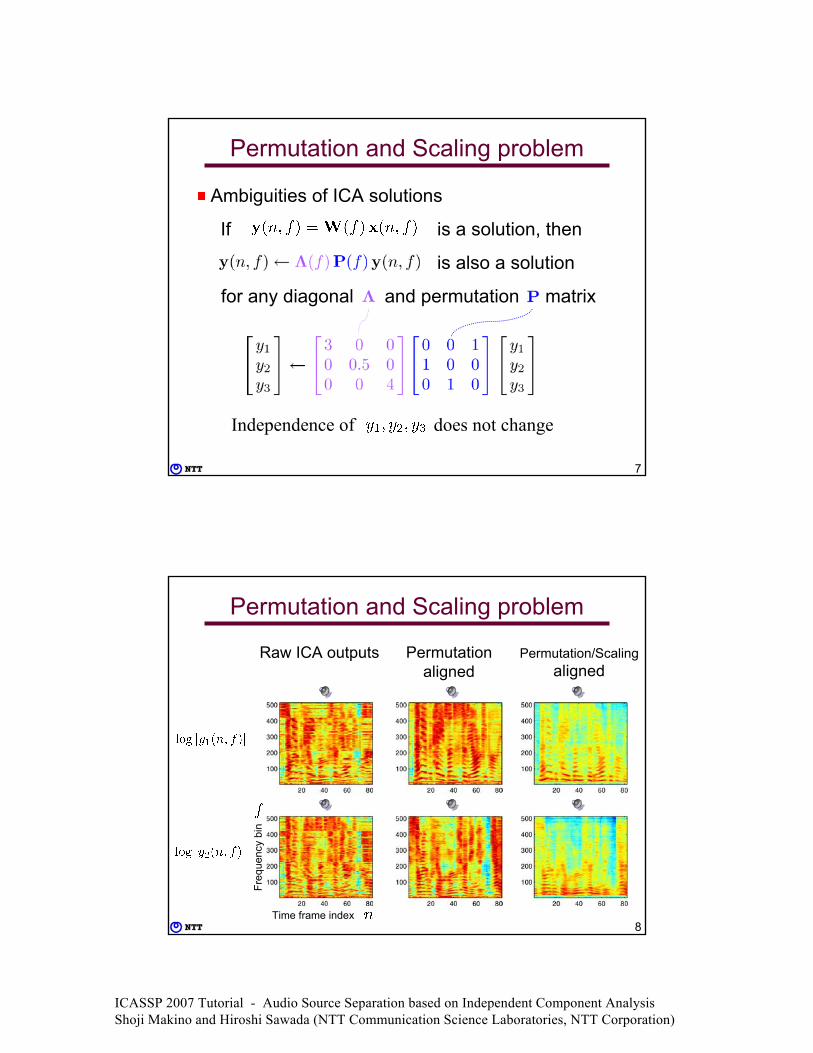
Permutation and Scaling problems
How important are they?Cannot obtain proper separated signals without considering themAlmost all papers on frequency-domain BSS discuss or at least mention these problems
Number of ICASSP papers that discuss or mention the permutation problem
Still increasing!
1110108862# papers
2006200520042003200220012000Year
ICASSP 2007 Tutorial - Audio Source Separation based on Independent Component Analysis Shoji Makino and Hiroshi Sawada (NTT Communication Science Laboratories, NTT Corporation)
7
Permutation and Scaling problem
Ambiguities of ICA solutions
If is a solution, then
is also a solution
for any diagonal and permutation matrix
Independence of does not change
8
Permutation and Scaling problem
Permutation/Scalingaligned
Permutationaligned
Raw ICA outputs
Time frame index
Freq
uenc
y bi
n
ICASSP 2007 Tutorial - Audio Source Separation based on Independent Component Analysis Shoji Makino and Hiroshi Sawada (NTT Communication Science Laboratories, NTT Corporation)
9
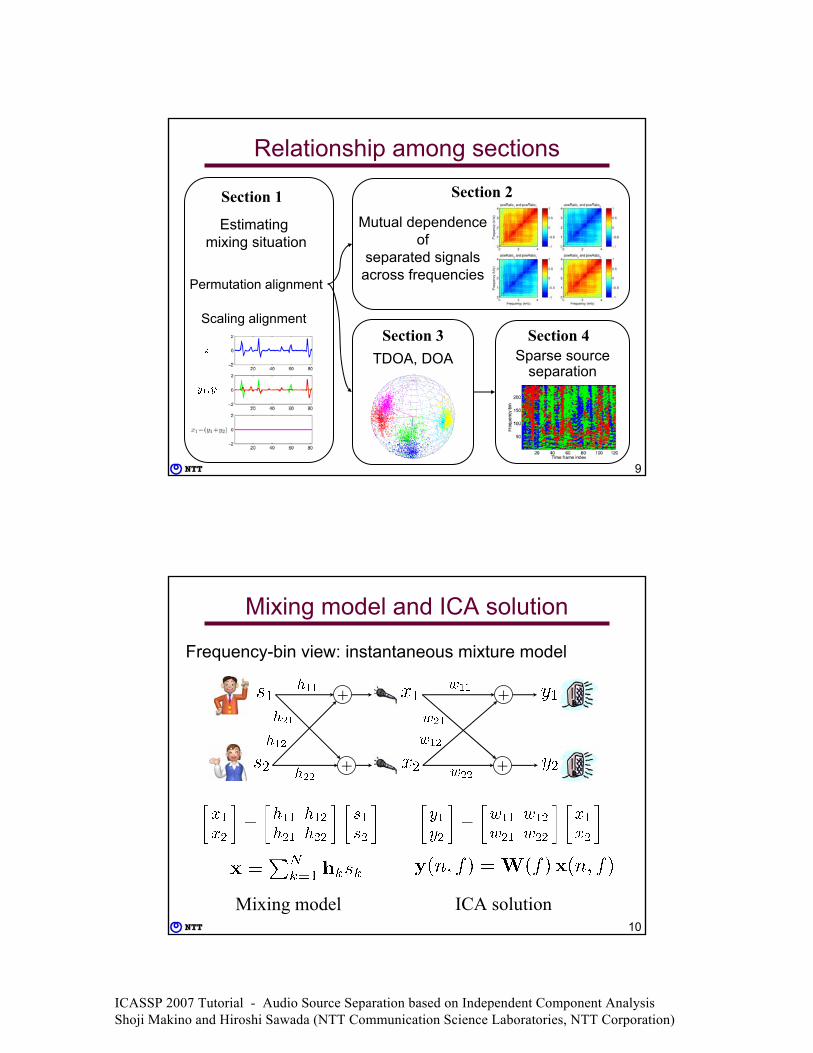
Relationship among sections
Permutation alignment
Scaling alignment
Mutual dependence of
separated signals across frequencies
TDOA, DOA Sparse source separation
Section 1 Section 2
Section 3 Section 4
Estimating mixing situation
10
Mixing model and ICA solution
+
+
+
+
Mixing model ICA solution
Frequency-bin view: instantaneous mixture model
ICASSP 2007 Tutorial - Audio Source Separation based on Independent Component Analysis Shoji Makino and Hiroshi Sawada (NTT Communication Science Laboratories, NTT Corporation)
11
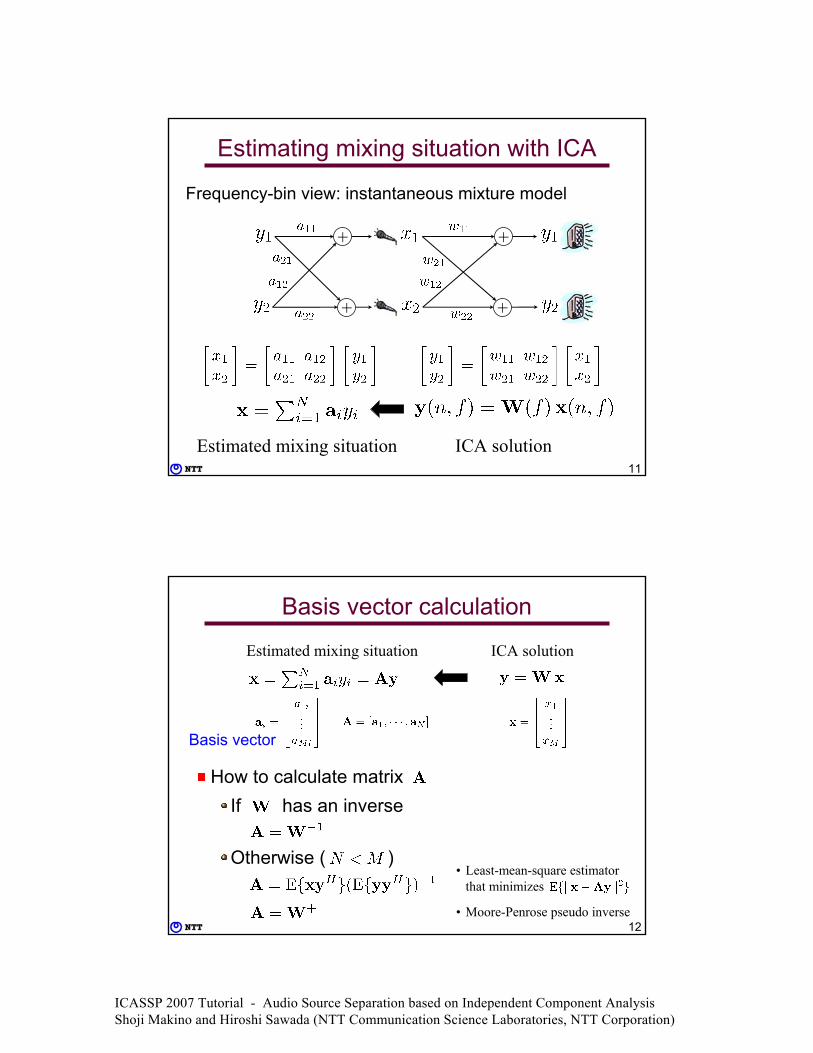
Estimating mixing situation with ICA
+
+
ICA solution
Frequency-bin view: instantaneous mixture model
+
+
Estimated mixing situation
12
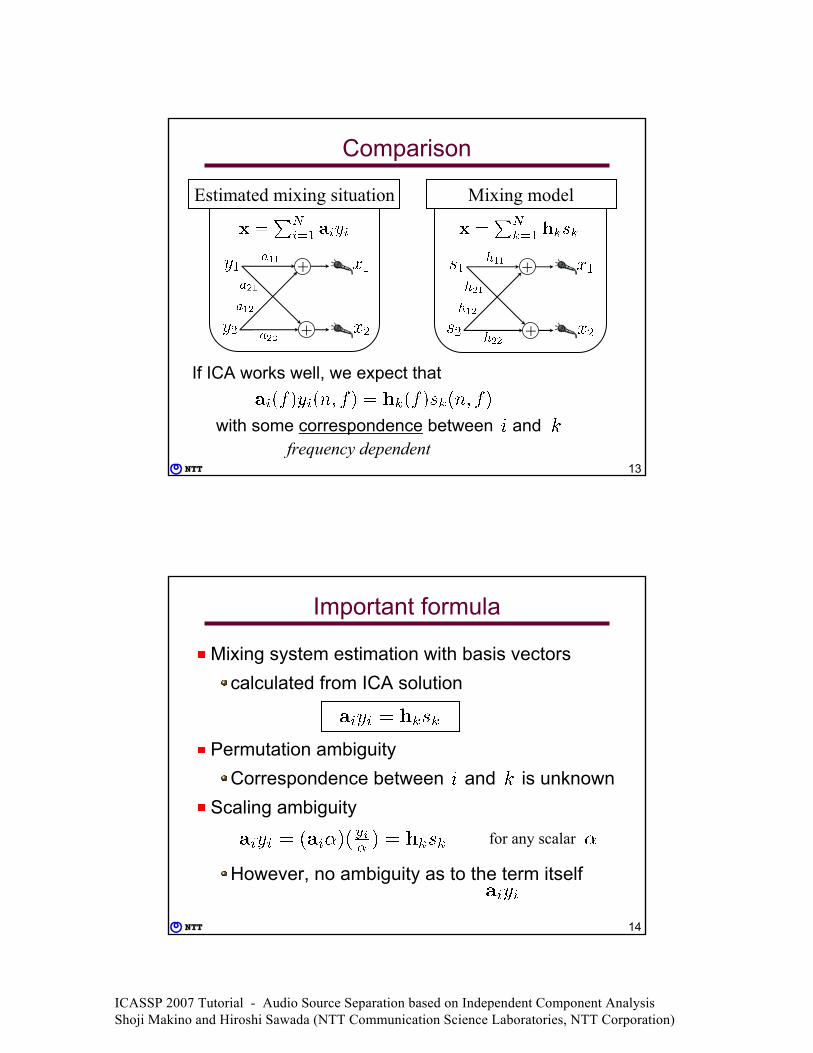
Basis vector calculation
How to calculate matrixIf has an inverse
Otherwise ( )• Least-mean-square estimator
that minimizes
• Moore-Penrose pseudo inverse
Basis vector
ICA solutionEstimated mixing situation
ICASSP 2007 Tutorial - Audio Source Separation based on Independent Component Analysis Shoji Makino and Hiroshi Sawada (NTT Communication Science Laboratories, NTT Corporation)
13
Comparison
If ICA works well, we expect that
with some correspondence between and
+
+
Estimated mixing situation
+
+
Mixing model
frequency dependent
14
Important formula
Mixing system estimation with basis vectorscalculated from ICA solution
Permutation ambiguityCorrespondence between and is unknown
Scaling ambiguity
However, no ambiguity as to the term itself
for any scalar
ICASSP 2007 Tutorial - Audio Source Separation based on Independent Component Analysis Shoji Makino and Hiroshi Sawada (NTT Communication Science Laboratories, NTT Corporation)
15
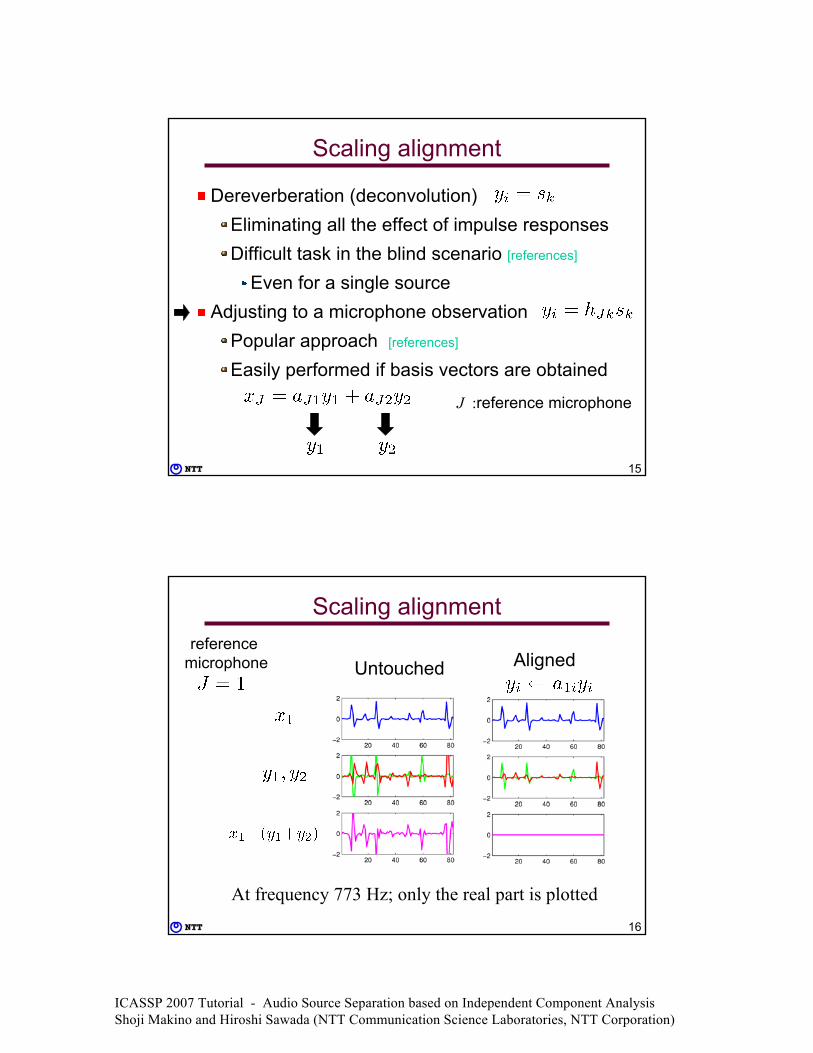
Scaling alignment
Dereverberation (deconvolution)Eliminating all the effect of impulse responsesDifficult task in the blind scenario [references]
Even for a single sourceAdjusting to a microphone observation
Popular approach [references]
Easily performed if basis vectors are obtained
J :reference microphone
16
Scaling alignment
Untouched Aligned
At frequency 773 Hz; only the real part is plotted
reference microphone
ICASSP 2007 Tutorial - Audio Source Separation based on Independent Component Analysis Shoji Makino and Hiroshi Sawada (NTT Communication Science Laboratories, NTT Corporation)
17
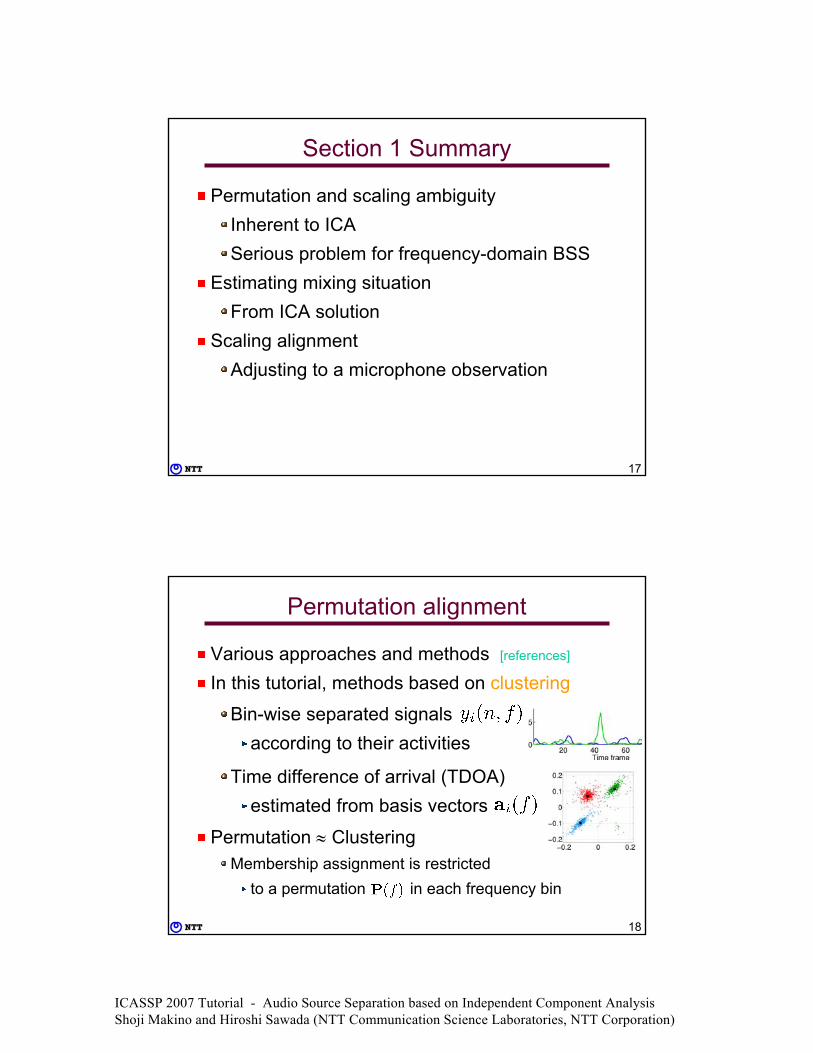
Section 1 Summary
Permutation and scaling ambiguityInherent to ICASerious problem for frequency-domain BSS
Estimating mixing situationFrom ICA solution
Scaling alignmentAdjusting to a microphone observation
18
Permutation alignment
Various approaches and methods [references]
In this tutorial, methods based on clustering
Bin-wise separated signalsaccording to their activities
Time difference of arrival (TDOA)estimated from basis vectors
Permutation ≈ ClusteringMembership assignment is restricted
to a permutation in each frequency bin
ICASSP 2007 Tutorial - Audio Source Separation based on Independent Component Analysis Shoji Makino and Hiroshi Sawada (NTT Communication Science Laboratories, NTT Corporation)
19
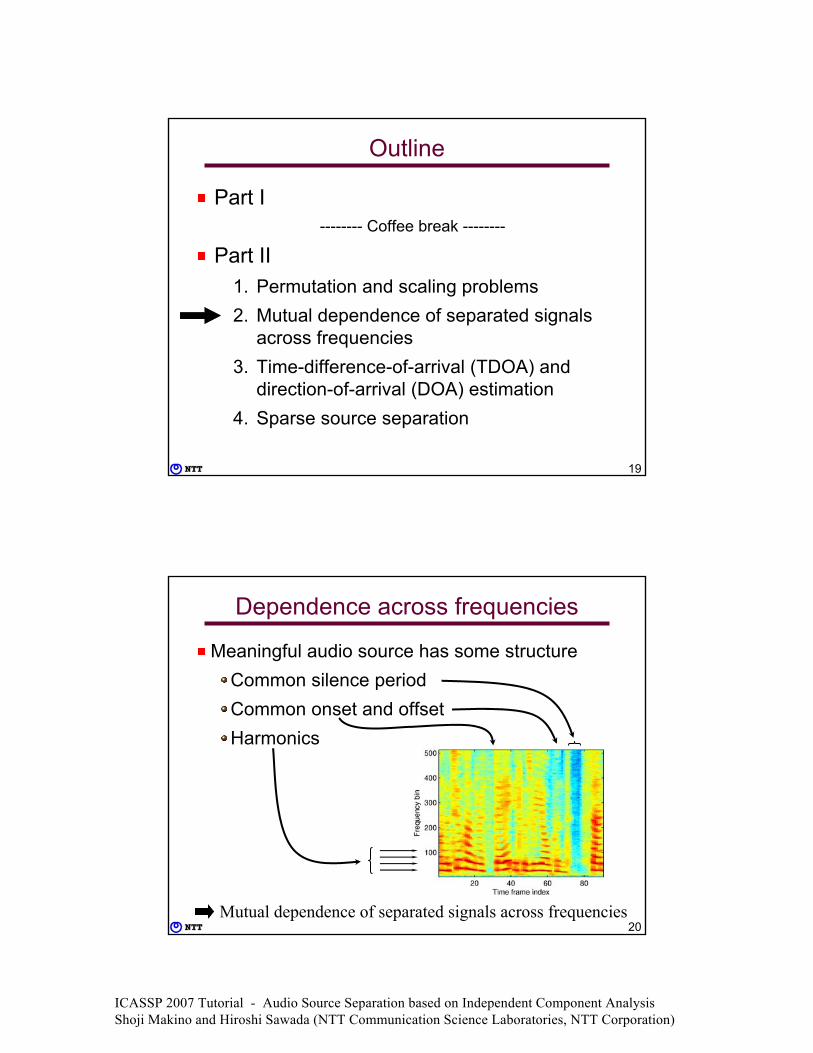
Outline
Part I -------- Coffee break --------
Part II 1. Permutation and scaling problems2. Mutual dependence of separated signals
across frequencies3. Time-difference-of-arrival (TDOA) and
direction-of-arrival (DOA) estimation4. Sparse source separation
20
Dependence across frequencies
Meaningful audio source has some structureCommon silence period Common onset and offsetHarmonics
Mutual dependence of separated signals across frequencies
ICASSP 2007 Tutorial - Audio Source Separation based on Independent Component Analysis Shoji Makino and Hiroshi Sawada (NTT Communication Science Laboratories, NTT Corporation)
21
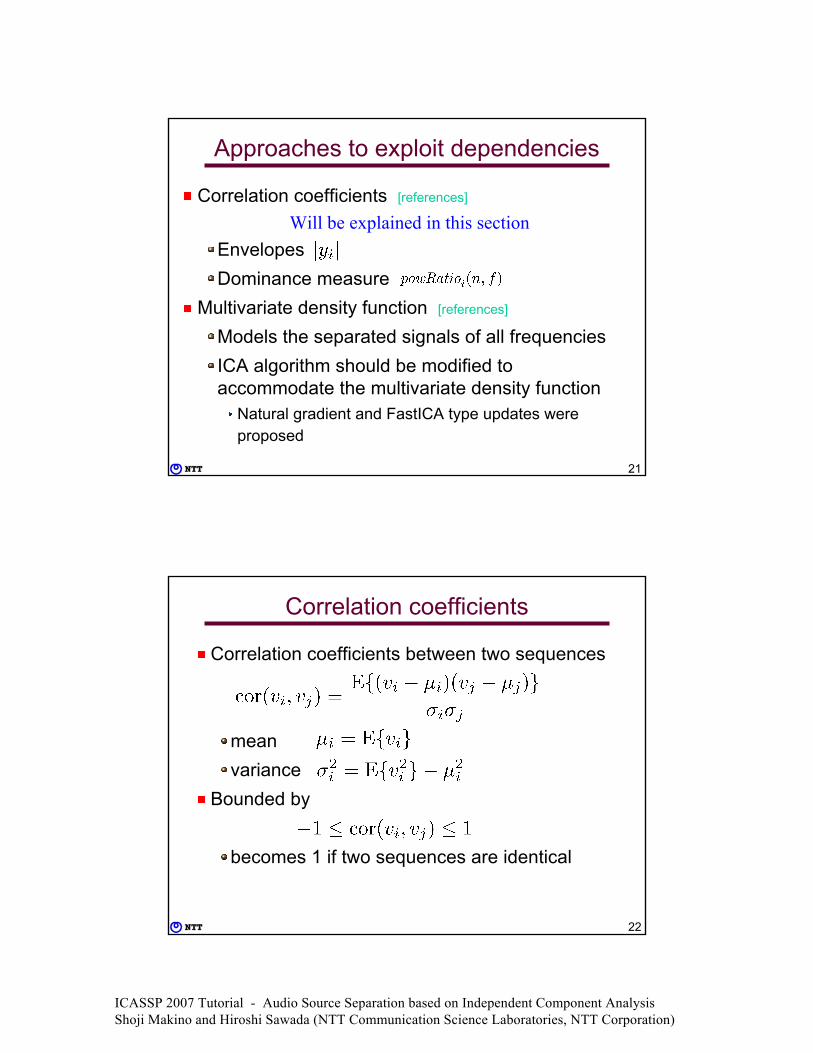
Approaches to exploit dependencies
Correlation coefficients [references]
EnvelopesDominance measure
Multivariate density function [references]
Models the separated signals of all frequenciesICA algorithm should be modified to accommodate the multivariate density function
Natural gradient and FastICA type updates were proposed
Will be explained in this section
22
Correlation coefficients
Correlation coefficients between two sequences
meanvariance
Bounded by
becomes 1 if two sequences are identical
ICASSP 2007 Tutorial - Audio Source Separation based on Independent Component Analysis Shoji Makino and Hiroshi Sawada (NTT Communication Science Laboratories, NTT Corporation)
23
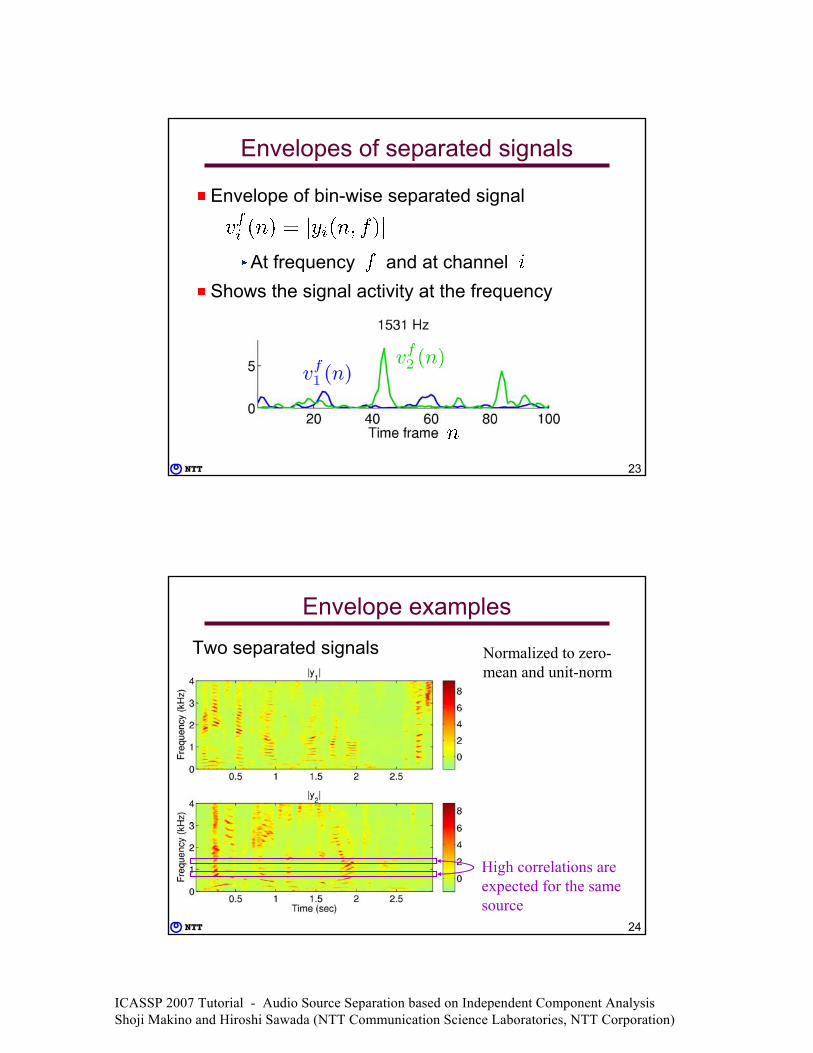
Envelopes of separated signals
Envelope of bin-wise separated signal
At frequency and at channel Shows the signal activity at the frequency
24
Envelope examplesTwo separated signals Normalized to zero-
mean and unit-norm
High correlations are expected for the same source
ICASSP 2007 Tutorial - Audio Source Separation based on Independent Component Analysis Shoji Makino and Hiroshi Sawada (NTT Communication Science Laboratories, NTT Corporation)
25
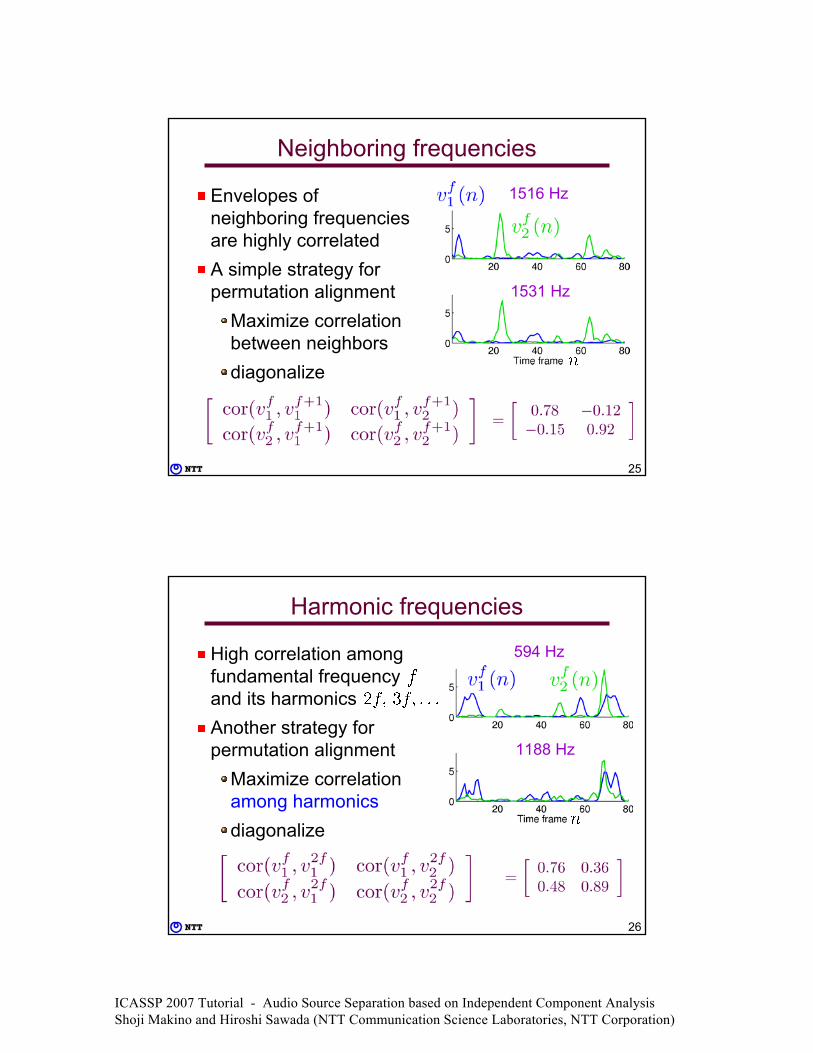
Neighboring frequencies
Envelopes of neighboring frequencies are highly correlatedA simple strategy for permutation alignment
Maximize correlation between neighborsdiagonalize
1516 Hz
1531 Hz
26
Harmonic frequencies
High correlation among fundamental frequency and its harmonicsAnother strategy for permutation alignment
Maximize correlation among harmonicsdiagonalize
594 Hz
1188 Hz
ICASSP 2007 Tutorial - Audio Source Separation based on Independent Component Analysis Shoji Makino and Hiroshi Sawada (NTT Communication Science Laboratories, NTT Corporation)
27
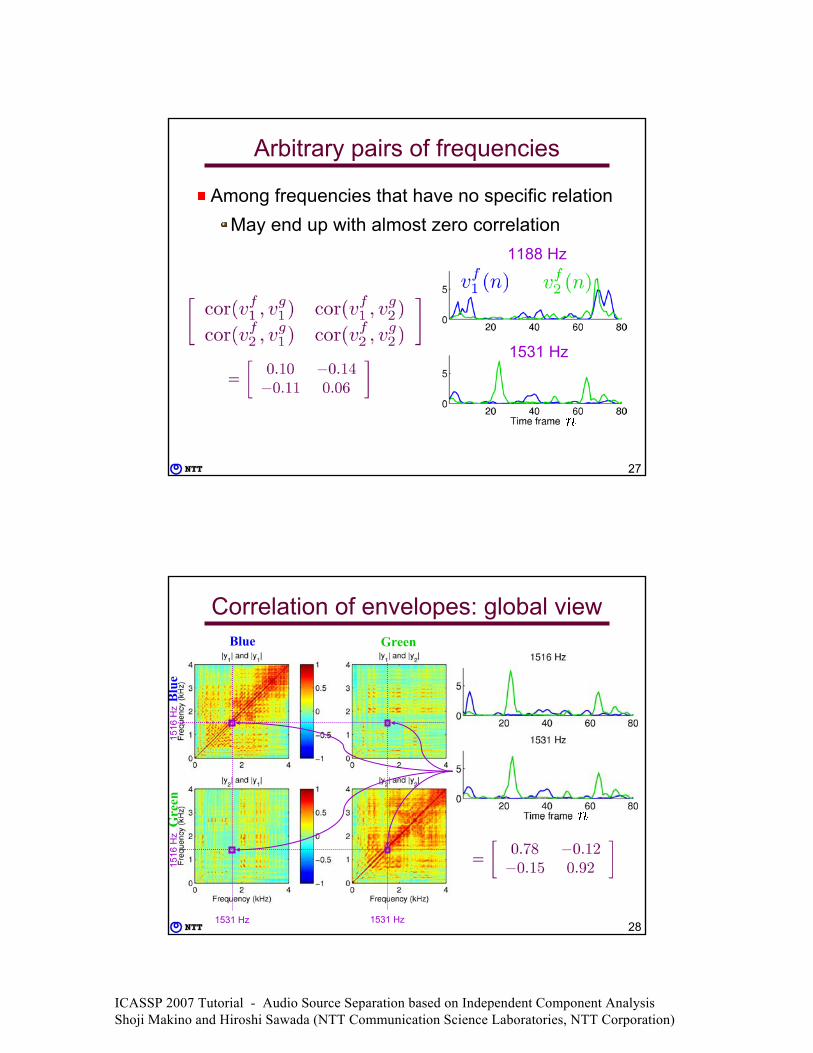
Arbitrary pairs of frequencies
Among frequencies that have no specific relationMay end up with almost zero correlation
1188 Hz
1531 Hz
28
Correlation of envelopes: global viewBlue Green
Blu
eG
reen
1516
Hz
1531 Hz 1531 Hz
1516
Hz
ICASSP 2007 Tutorial - Audio Source Separation based on Independent Component Analysis Shoji Makino and Hiroshi Sawada (NTT Communication Science Laboratories, NTT Corporation)
29
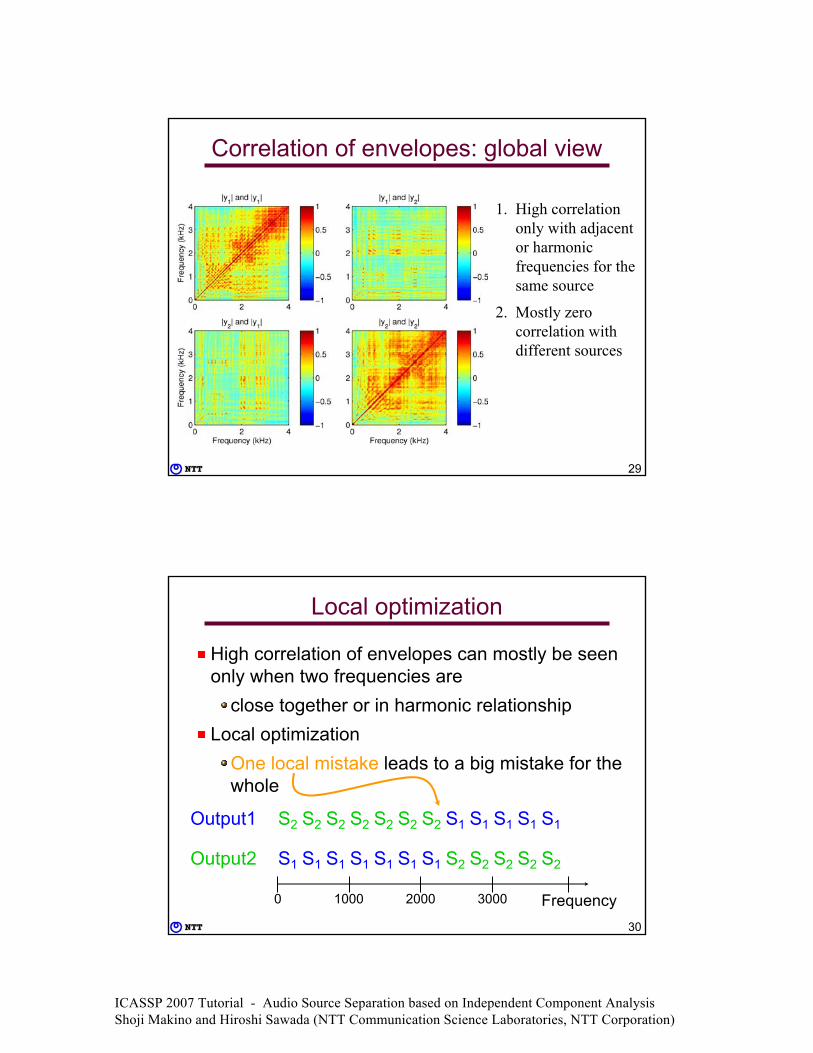
Correlation of envelopes: global view
1. High correlation only with adjacent or harmonic frequencies for the same source
2. Mostly zero correlation with different sources
30
Local optimization
High correlation of envelopes can mostly be seen only when two frequencies are
close together or in harmonic relationshipLocal optimization
One local mistake leads to a big mistake for the whole
S1
S2 S2
S1
S1
S2
S1
S2
S1
S2
S2
S1S1
S2
S1
S2
S1
S2 S1
S2
S1
S2S1
S2Output1
Output2
Frequency0 300020001000
ICASSP 2007 Tutorial - Audio Source Separation based on Independent Component Analysis Shoji Makino and Hiroshi Sawada (NTT Communication Science Laboratories, NTT Corporation)
31
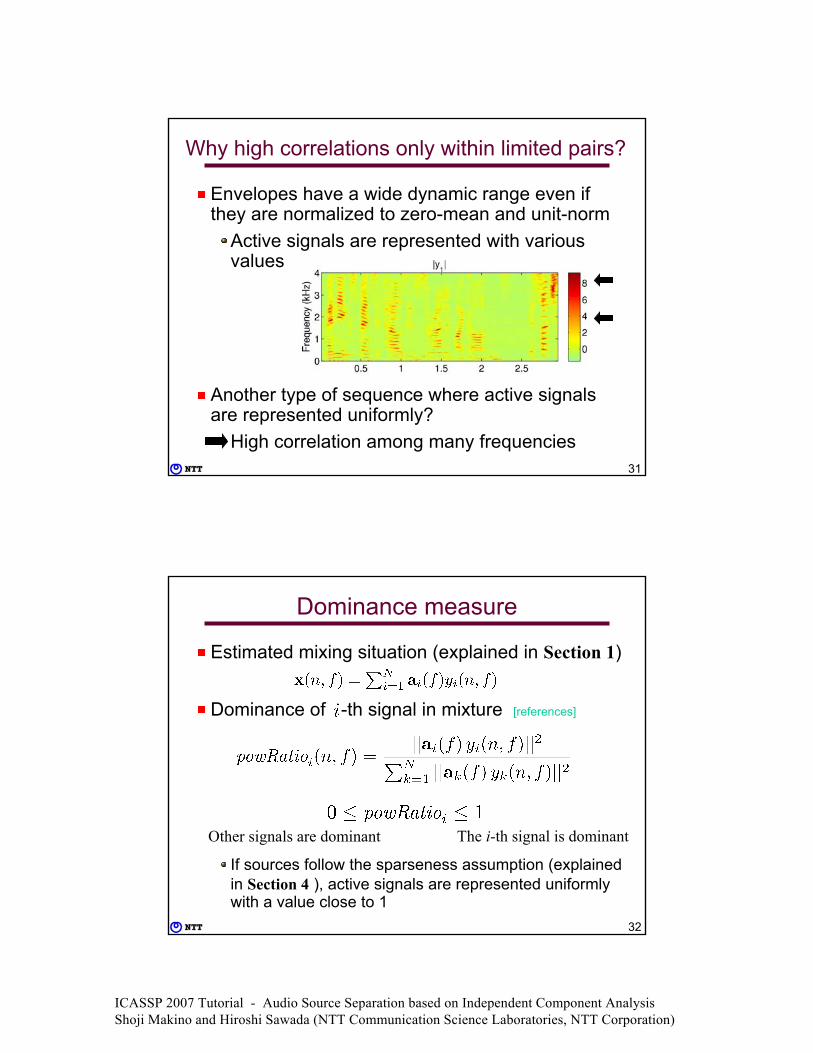
Why high correlations only within limited pairs?
Envelopes have a wide dynamic range even if they are normalized to zero-mean and unit-norm
Active signals are represented with various values
Another type of sequence where active signals are represented uniformly?
High correlation among many frequencies
32
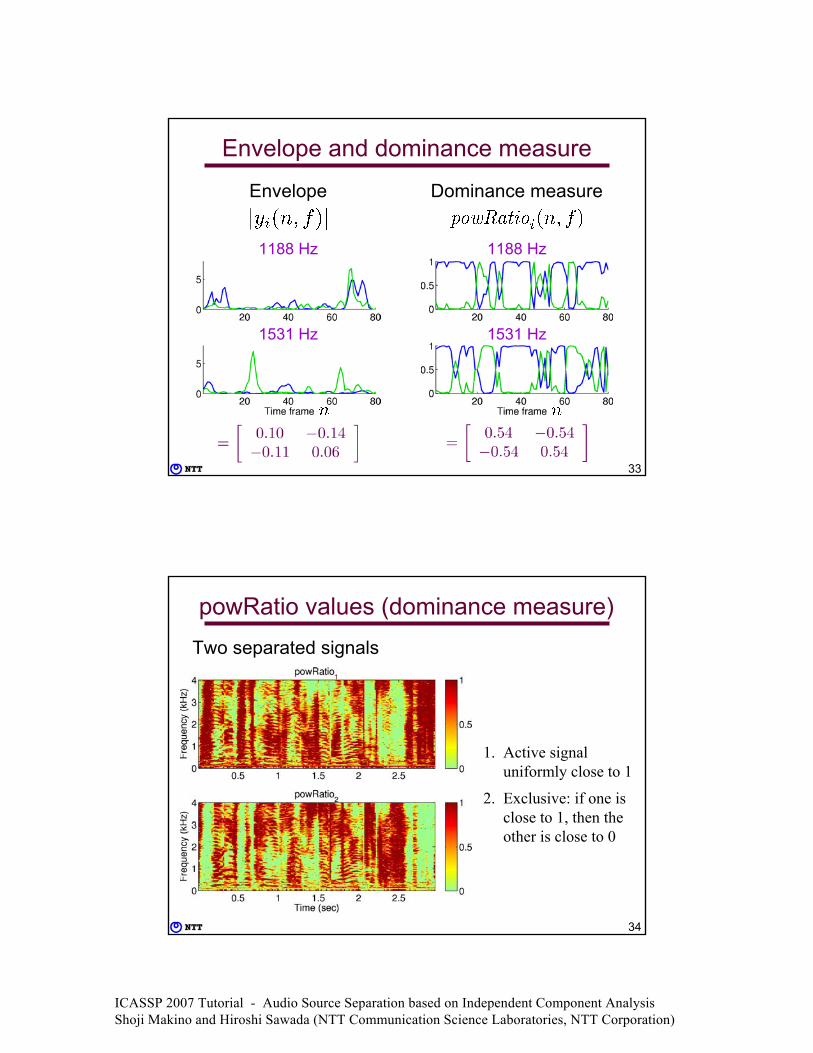
Dominance measure
Estimated mixing situation (explained in Section 1)
Dominance of -th signal in mixture [references]
If sources follow the sparseness assumption (explained in Section 4 ), active signals are represented uniformly with a value close to 1
The i-th signal is dominantOther signals are dominant
ICASSP 2007 Tutorial - Audio Source Separation based on Independent Component Analysis Shoji Makino and Hiroshi Sawada (NTT Communication Science Laboratories, NTT Corporation)
33
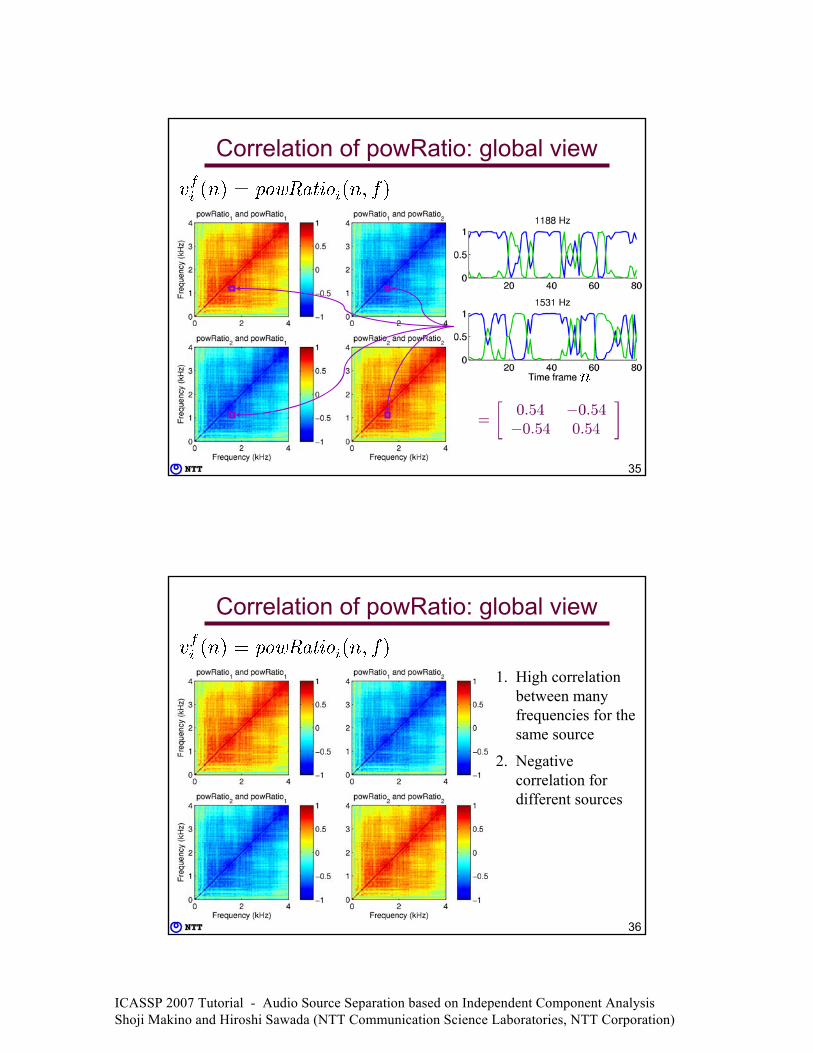
Envelope and dominance measure
1188 Hz
1531 Hz
1188 Hz
1531 Hz
Envelope Dominance measure
34
powRatio values (dominance measure)Two separated signals
1. Active signal uniformly close to 1
2. Exclusive: if one is close to 1, then the other is close to 0
ICASSP 2007 Tutorial - Audio Source Separation based on Independent Component Analysis Shoji Makino and Hiroshi Sawada (NTT Communication Science Laboratories, NTT Corporation)
35
Correlation of powRatio: global view
36
Correlation of powRatio: global view
1. High correlation between many frequencies for the same source
2. Negative correlation for different sources
ICASSP 2007 Tutorial - Audio Source Separation based on Independent Component Analysis Shoji Makino and Hiroshi Sawada (NTT Communication Science Laboratories, NTT Corporation)
37
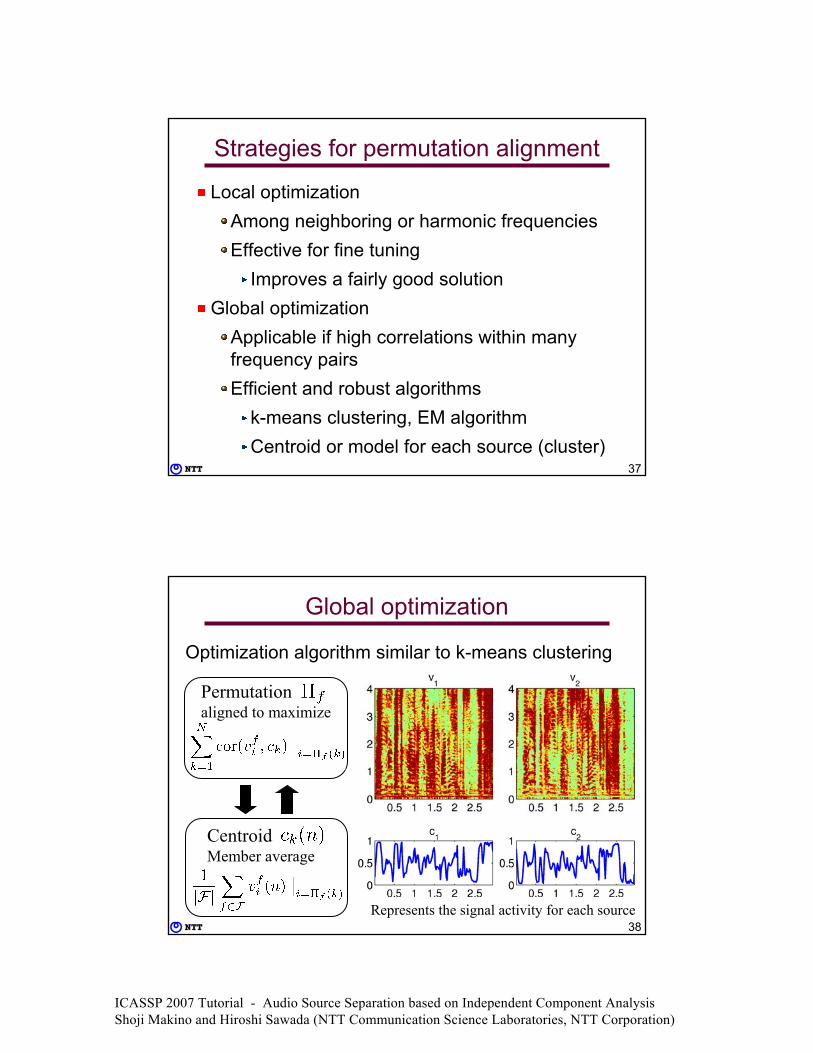
Strategies for permutation alignment
Local optimizationAmong neighboring or harmonic frequenciesEffective for fine tuning
Improves a fairly good solutionGlobal optimization
Applicable if high correlations within many frequency pairsEfficient and robust algorithms
k-means clustering, EM algorithmCentroid or model for each source (cluster)
38
Global optimization
Optimization algorithm similar to k-means clustering
CentroidMember average
Permutationaligned to maximize
Represents the signal activity for each source
ICASSP 2007 Tutorial - Audio Source Separation based on Independent Component Analysis Shoji Makino and Hiroshi Sawada (NTT Communication Science Laboratories, NTT Corporation)
39
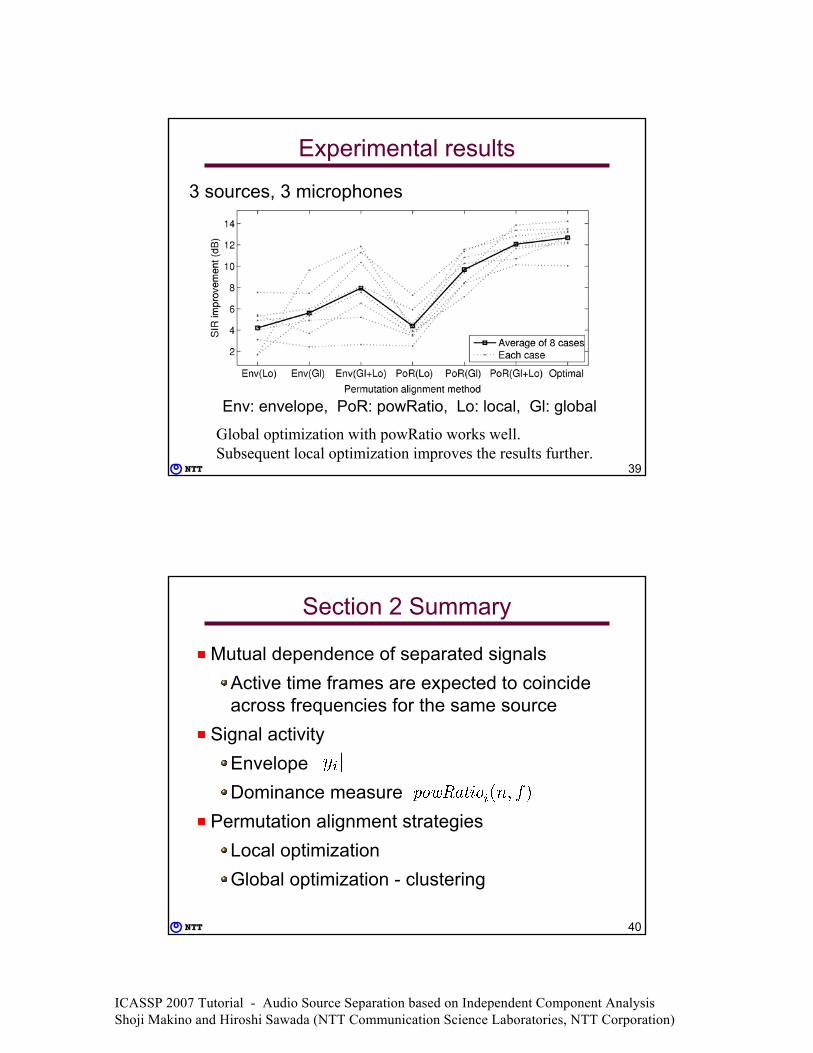
Experimental results
Env: envelope, PoR: powRatio, Lo: local, Gl: global
3 sources, 3 microphones
Global optimization with powRatio works well. Subsequent local optimization improves the results further.
40
Section 2 Summary
Mutual dependence of separated signalsActive time frames are expected to coincide across frequencies for the same source
Signal activityEnvelopeDominance measure
Permutation alignment strategiesLocal optimizationGlobal optimization - clustering
ICASSP 2007 Tutorial - Audio Source Separation based on Independent Component Analysis Shoji Makino and Hiroshi Sawada (NTT Communication Science Laboratories, NTT Corporation)
41
Outline
Part I -------- Coffee break --------
Part II 1. Permutation and scaling problems2. Mutual dependence of separated signals
across frequencies3. Time-difference-of-arrival (TDOA) and
direction-of-arrival (DOA) estimation4. Sparse source separation
42
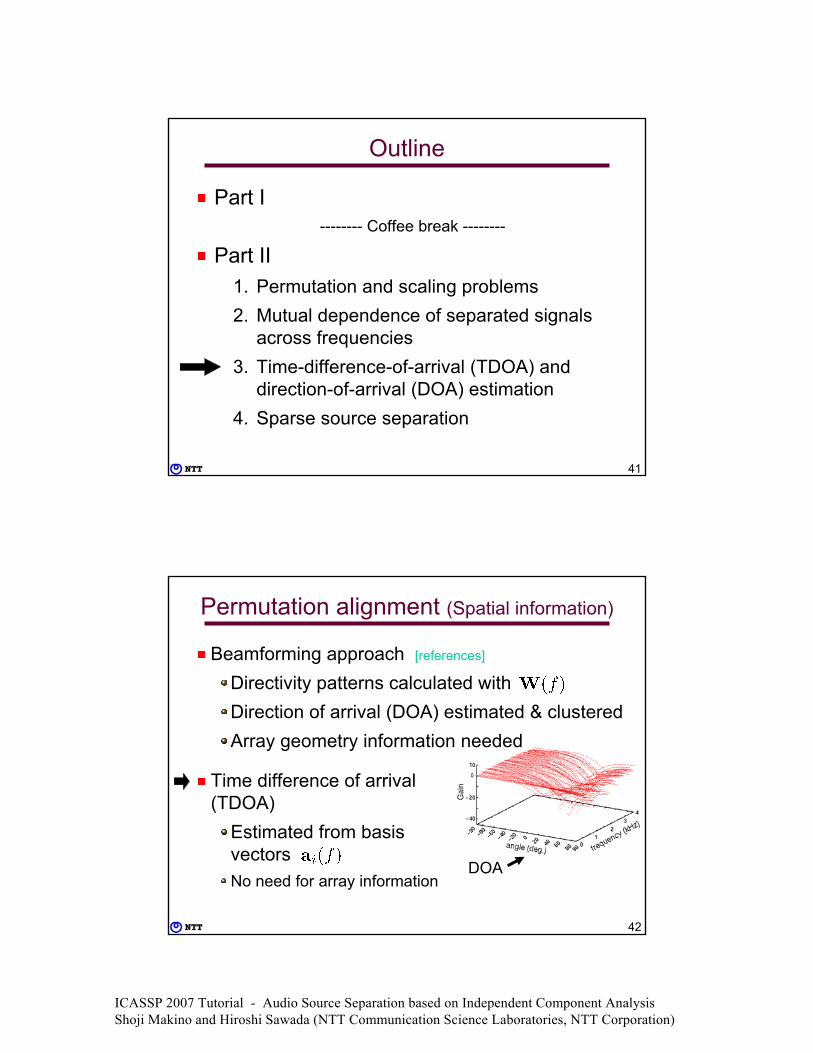
Permutation alignment (Spatial information)
Beamforming approach [references]
Directivity patterns calculated with Direction of arrival (DOA) estimated & clusteredArray geometry information needed
DOA
Time difference of arrival (TDOA)
Estimated from basis vectorsNo need for array information
ICASSP 2007 Tutorial - Audio Source Separation based on Independent Component Analysis Shoji Makino and Hiroshi Sawada (NTT Communication Science Laboratories, NTT Corporation)
43
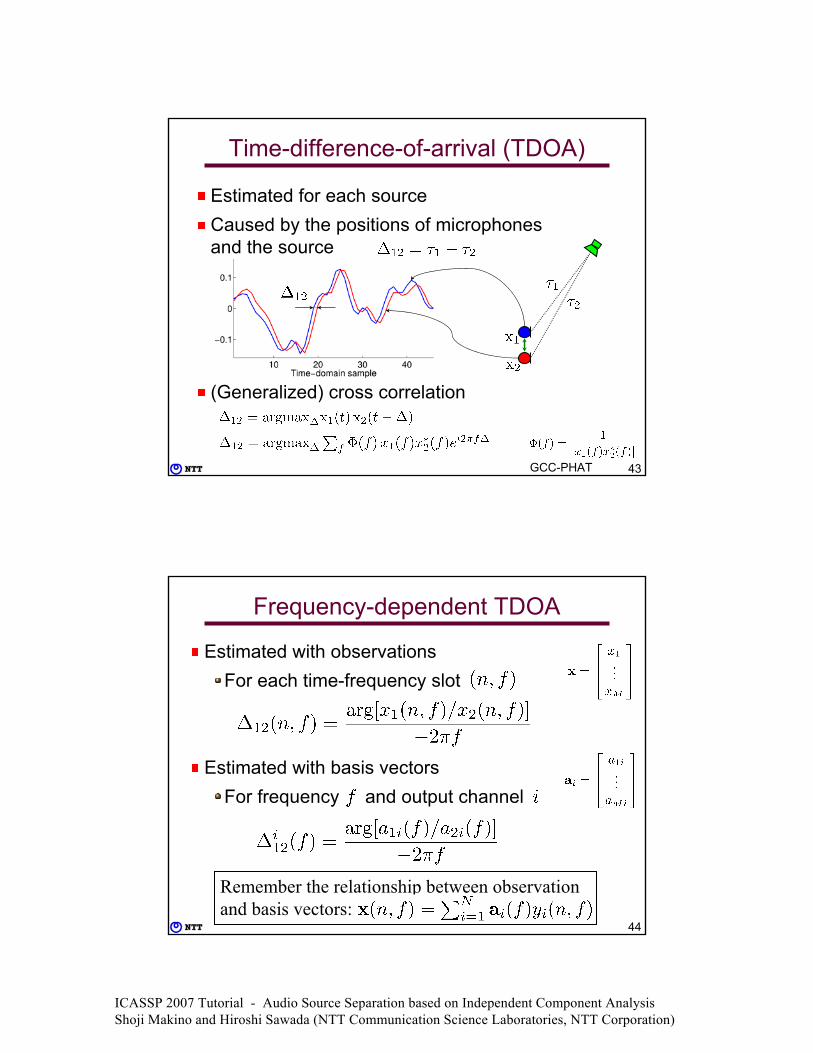
Estimated for each sourceCaused by the positions of microphones and the source
(Generalized) cross correlation
Time-difference-of-arrival (TDOA)
GCC-PHAT
44
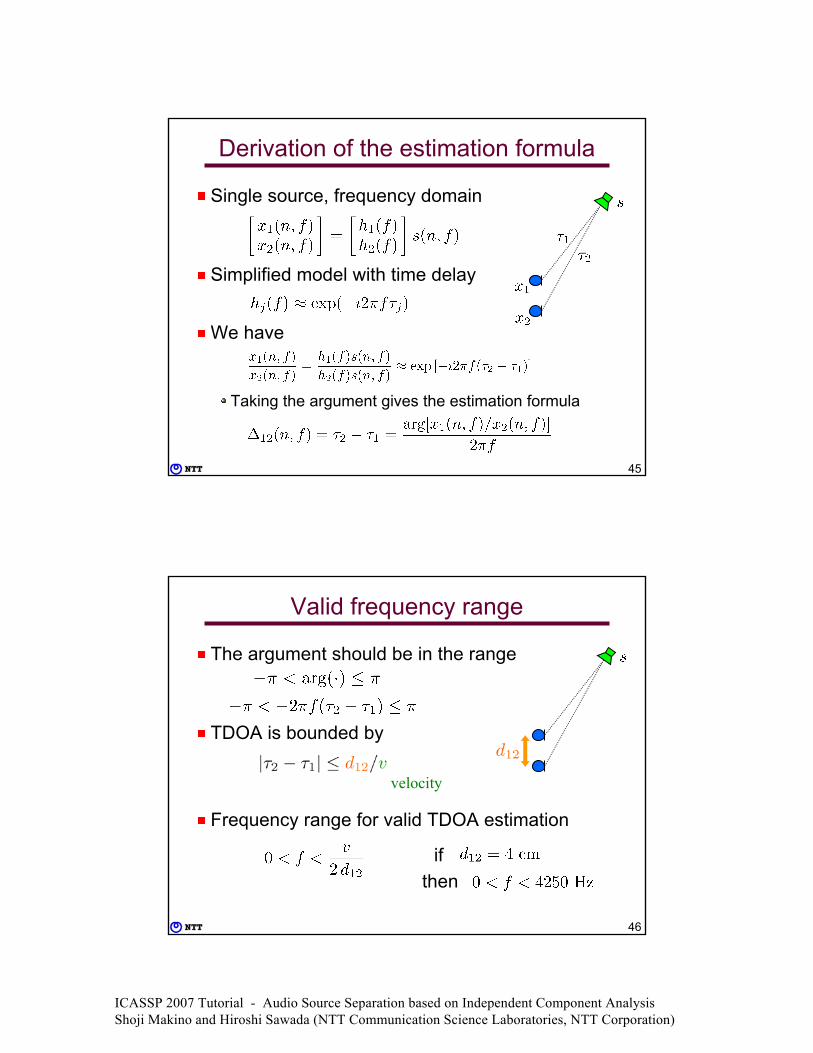
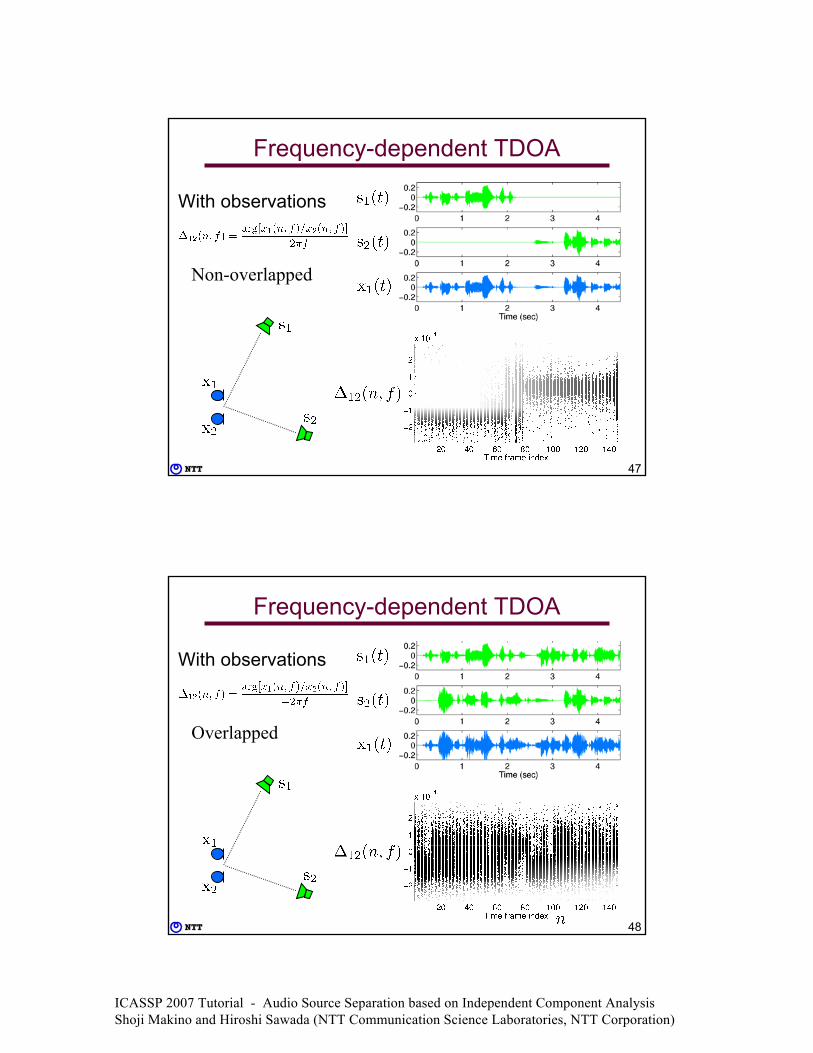
Frequency-dependent TDOA
Estimated with observationsFor each time-frequency slot
Estimated with basis vectorsFor frequency and output channel
Remember the relationship between observation and basis vectors:
ICASSP 2007 Tutorial - Audio Source Separation based on Independent Component Analysis Shoji Makino and Hiroshi Sawada (NTT Communication Science Laboratories, NTT Corporation)
45
Derivation of the estimation formula
Single source, frequency domain
Simplified model with time delay
We have
Taking the argument gives the estimation formula
46
Valid frequency range
The argument should be in the range
TDOA is bounded by
Frequency range for valid TDOA estimation
velocity
ifthen
ICASSP 2007 Tutorial - Audio Source Separation based on Independent Component Analysis Shoji Makino and Hiroshi Sawada (NTT Communication Science Laboratories, NTT Corporation)
47
Frequency-dependent TDOA
With observations
Non-overlapped
48
Frequency-dependent TDOA
With observations
Overlapped
ICASSP 2007 Tutorial - Audio Source Separation based on Independent Component Analysis Shoji Makino and Hiroshi Sawada (NTT Communication Science Laboratories, NTT Corporation)
49
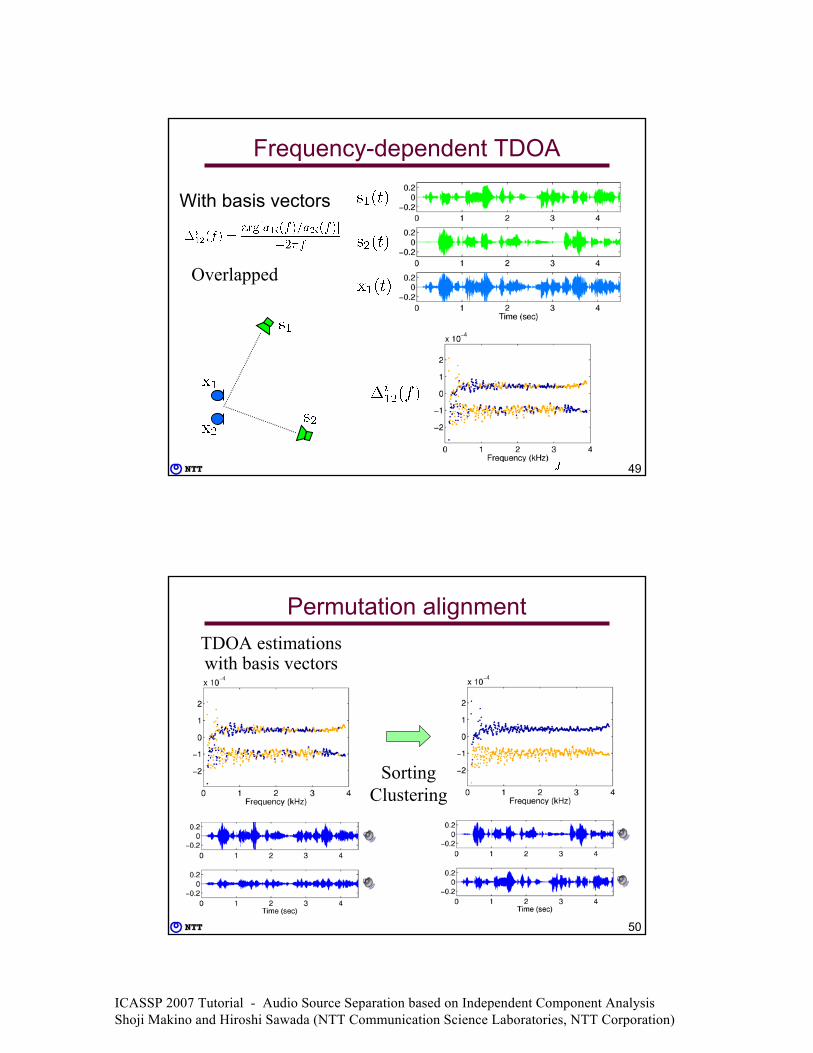
Frequency-dependent TDOA
With basis vectors
Overlapped
50
Permutation alignment
SortingClustering
TDOA estimations with basis vectors
ICASSP 2007 Tutorial - Audio Source Separation based on Independent Component Analysis Shoji Makino and Hiroshi Sawada (NTT Communication Science Laboratories, NTT Corporation)
51
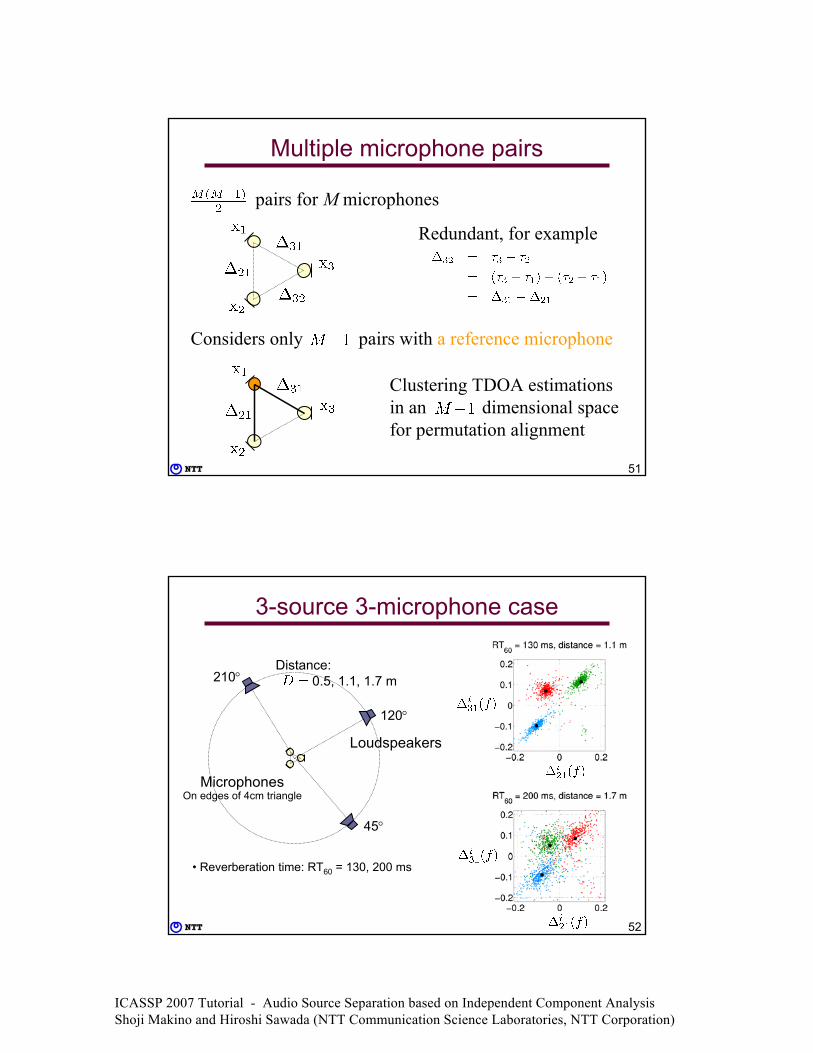
Multiple microphone pairs
pairs for M microphones
Redundant, for example
Considers only pairs with a reference microphone
Clustering TDOA estimations in an dimensional spacefor permutation alignment
52
3-source 3-microphone case
MicrophonesOn edges of 4cm triangle
Loudspeakers
45°
120°
210°Distance:
0.5, 1.1, 1.7 m
• Reverberation time: RT60 = 130, 200 ms
ICASSP 2007 Tutorial - Audio Source Separation based on Independent Component Analysis Shoji Makino and Hiroshi Sawada (NTT Communication Science Laboratories, NTT Corporation)
53
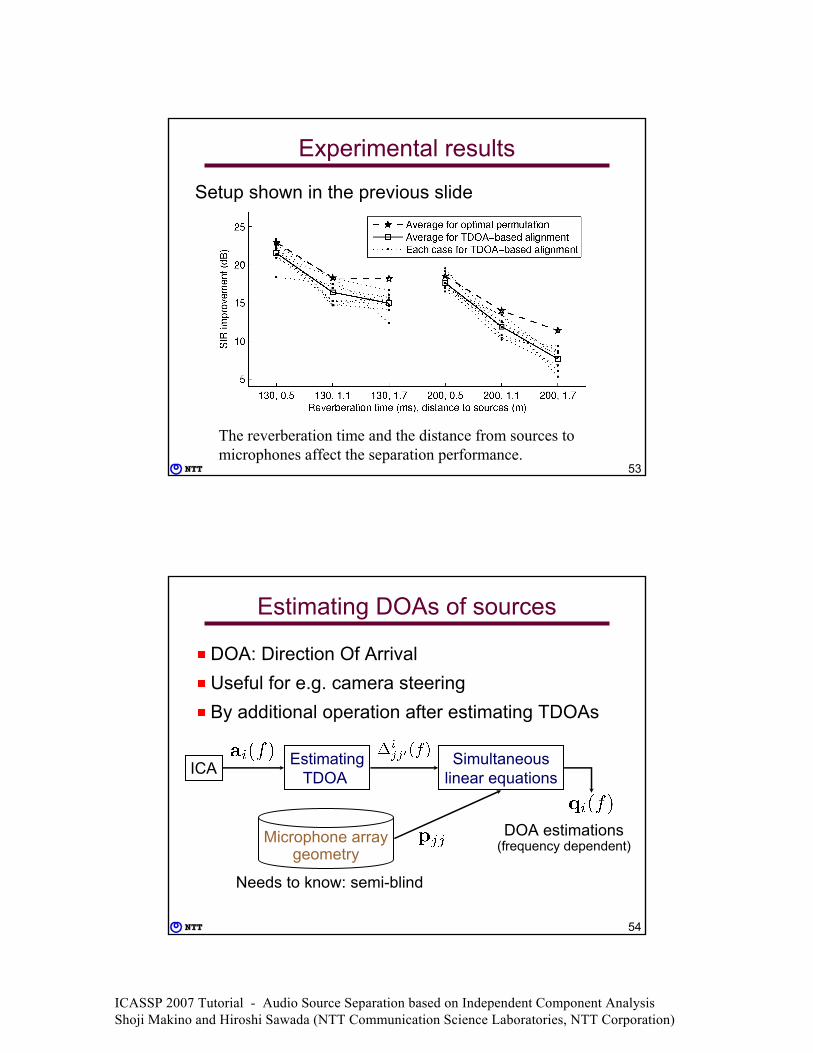
Experimental results
Setup shown in the previous slide
The reverberation time and the distance from sources to microphones affect the separation performance.
54
Estimating DOAs of sources
DOA: Direction Of Arrival Useful for e.g. camera steeringBy additional operation after estimating TDOAs
ICA EstimatingTDOA
Simultaneous linear equations
Microphone arraygeometry
DOA estimations(frequency dependent)
Needs to know: semi-blind
ICASSP 2007 Tutorial - Audio Source Separation based on Independent Component Analysis Shoji Makino and Hiroshi Sawada (NTT Communication Science Laboratories, NTT Corporation)
55
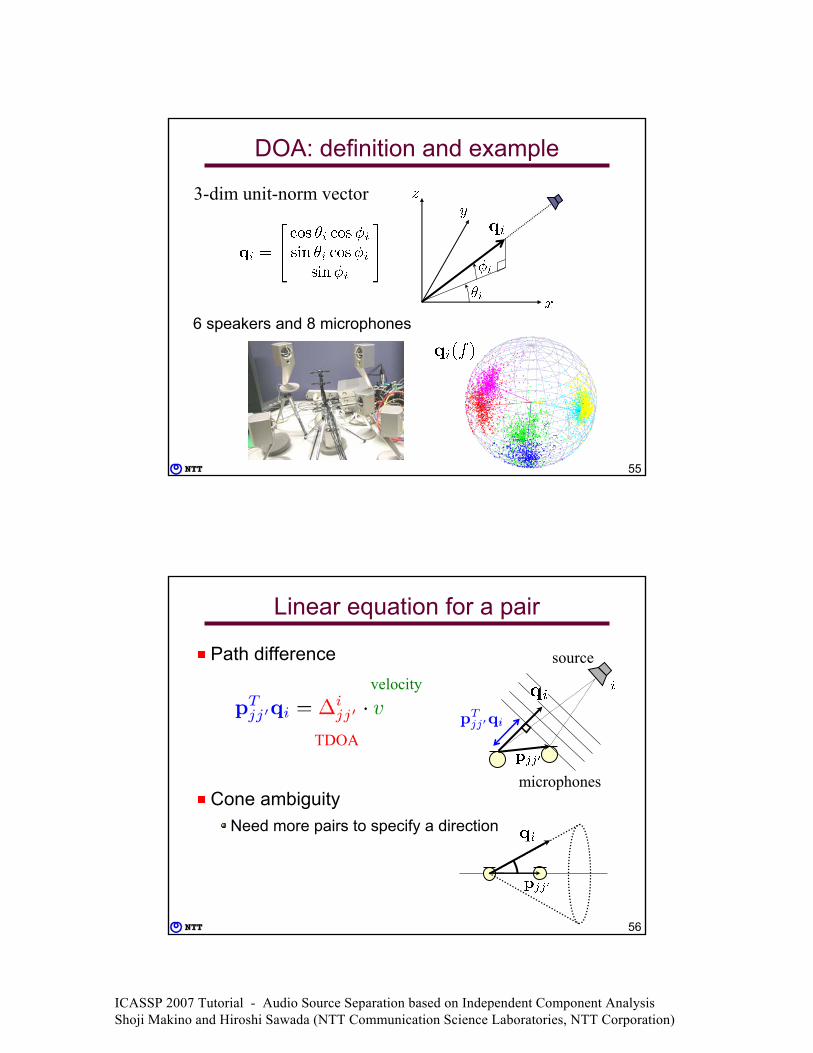
DOA: definition and example
3-dim unit-norm vector
6 speakers and 8 microphones
56
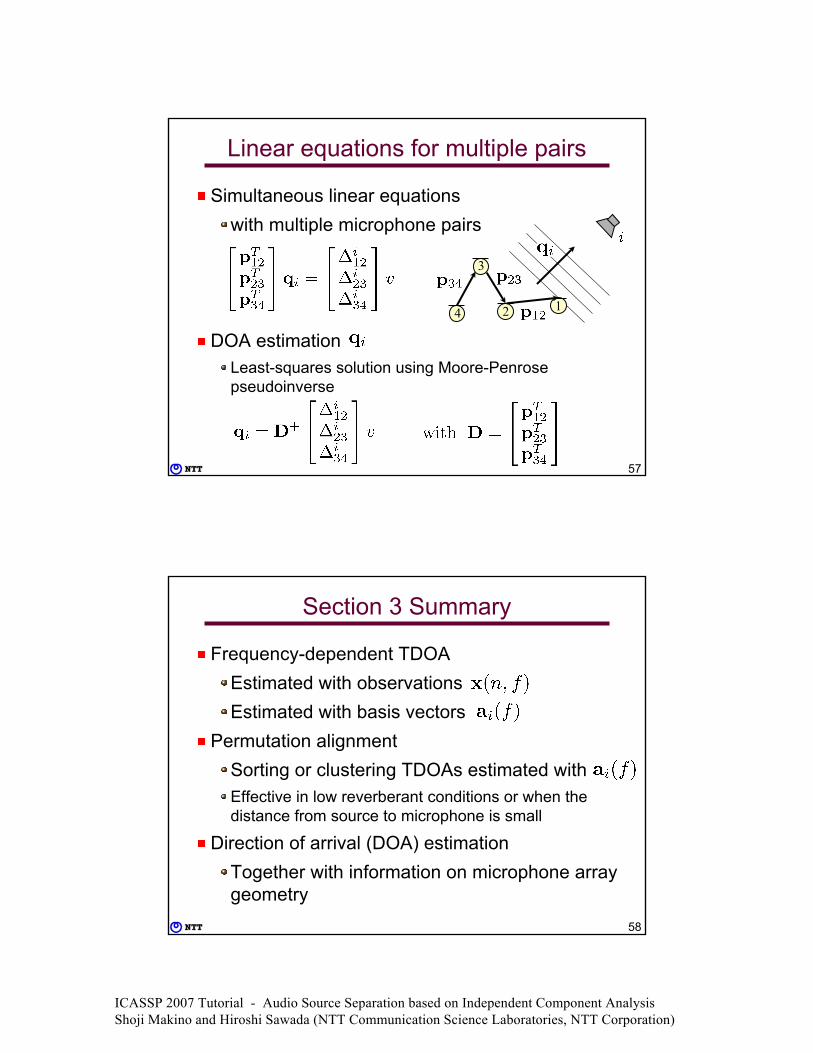
Linear equation for a pair
Path difference
Cone ambiguityNeed more pairs to specify a direction
source
microphones
TDOA
velocity
ICASSP 2007 Tutorial - Audio Source Separation based on Independent Component Analysis Shoji Makino and Hiroshi Sawada (NTT Communication Science Laboratories, NTT Corporation)
57
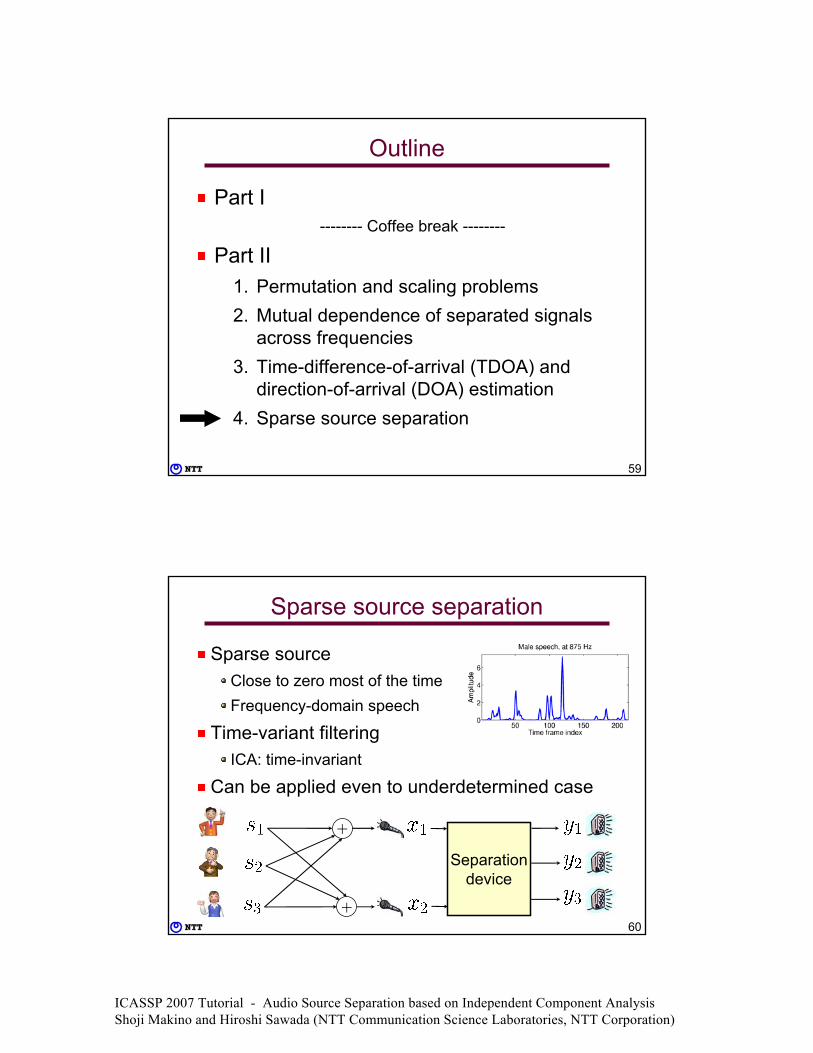
Linear equations for multiple pairs
Simultaneous linear equationswith multiple microphone pairs
DOA estimationLeast-squares solution using Moore-Penrose pseudoinverse
2 1
3
4
58
Section 3 Summary
Frequency-dependent TDOAEstimated with observationsEstimated with basis vectors
Permutation alignmentSorting or clustering TDOAs estimated withEffective in low reverberant conditions or when the distance from source to microphone is small
Direction of arrival (DOA) estimationTogether with information on microphone array geometry
ICASSP 2007 Tutorial - Audio Source Separation based on Independent Component Analysis Shoji Makino and Hiroshi Sawada (NTT Communication Science Laboratories, NTT Corporation)
59
Outline
Part I -------- Coffee break --------
Part II 1. Permutation and scaling problems2. Mutual dependence of separated signals
across frequencies3. Time-difference-of-arrival (TDOA) and
direction-of-arrival (DOA) estimation4. Sparse source separation
60
Sparse source separation
Sparse sourceClose to zero most of the timeFrequency-domain speech
Time-variant filteringICA: time-invariant
Can be applied even to underdetermined case
+
+
Separationdevice
ICASSP 2007 Tutorial - Audio Source Separation based on Independent Component Analysis Shoji Makino and Hiroshi Sawada (NTT Communication Science Laboratories, NTT Corporation)
61
Sparseness
Most samples are close to zero
⇒ ASSUMPTION: At most one source is loud at the same time
62
0
1
2
3
# of
fram
es
0 Frequency (kHz) 4
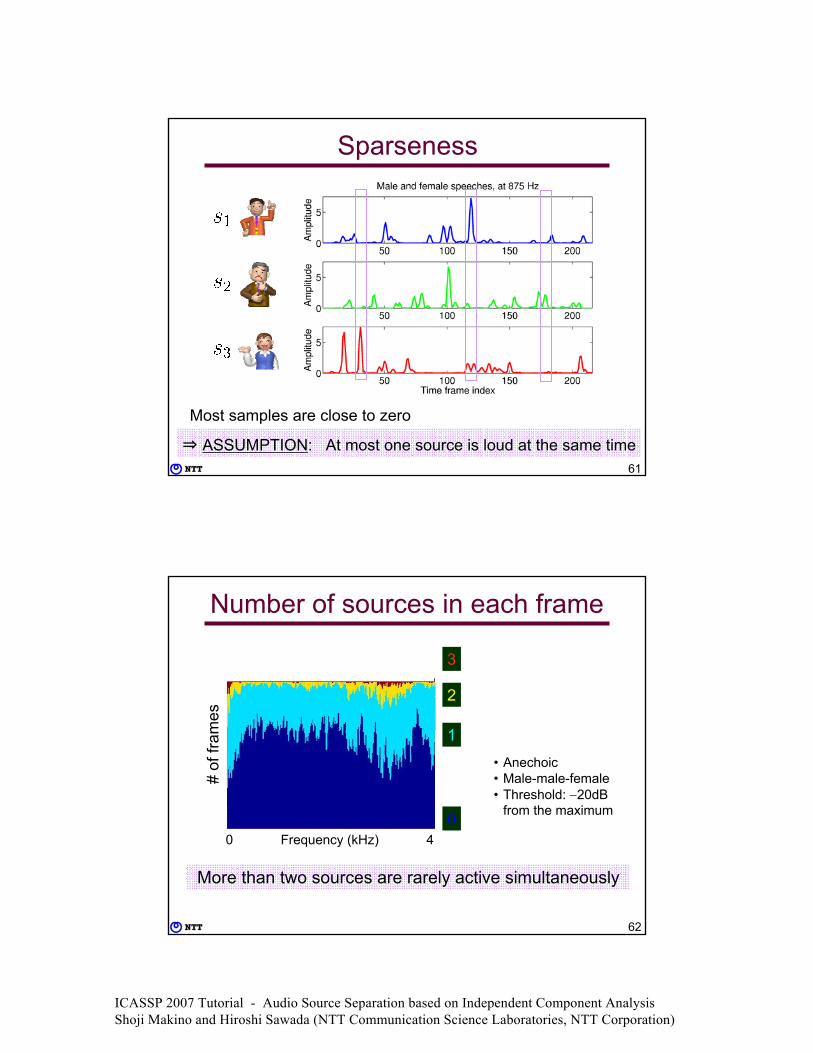
• Anechoic• Male-male-female• Threshold: −20dB
from the maximum
Number of sources in each frame
More than two sources are rarely active simultaneously
ICASSP 2007 Tutorial - Audio Source Separation based on Independent Component Analysis Shoji Makino and Hiroshi Sawada (NTT Communication Science Laboratories, NTT Corporation)
63
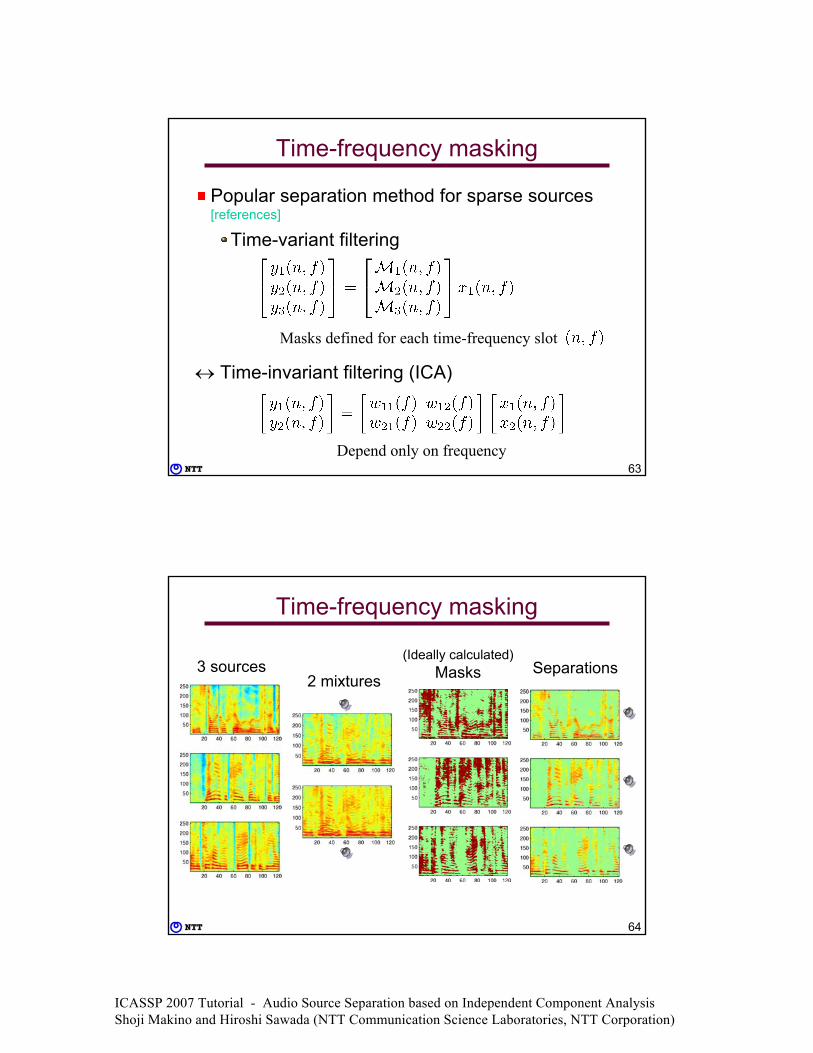
Time-frequency masking
Popular separation method for sparse sources [references]
Time-variant filtering
↔ Time-invariant filtering (ICA)
Masks defined for each time-frequency slot
Depend only on frequency
64
Time-frequency masking
3 sources2 mixtures
Separations(Ideally calculated)
Masks
ICASSP 2007 Tutorial - Audio Source Separation based on Independent Component Analysis Shoji Makino and Hiroshi Sawada (NTT Communication Science Laboratories, NTT Corporation)
65
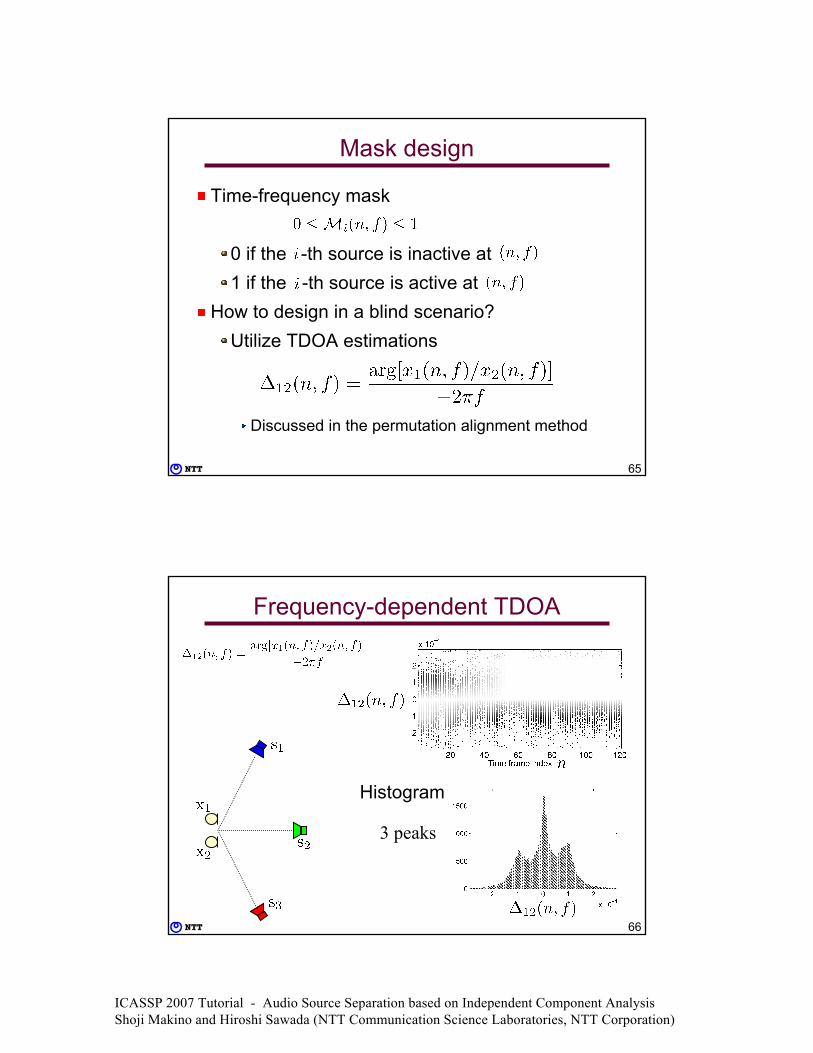
Mask design
Time-frequency mask
0 if the -th source is inactive at 1 if the -th source is active at
How to design in a blind scenario?Utilize TDOA estimations
Discussed in the permutation alignment method
66
Frequency-dependent TDOA
Histogram
3 peaks
ICASSP 2007 Tutorial - Audio Source Separation based on Independent Component Analysis Shoji Makino and Hiroshi Sawada (NTT Communication Science Laboratories, NTT Corporation)
67
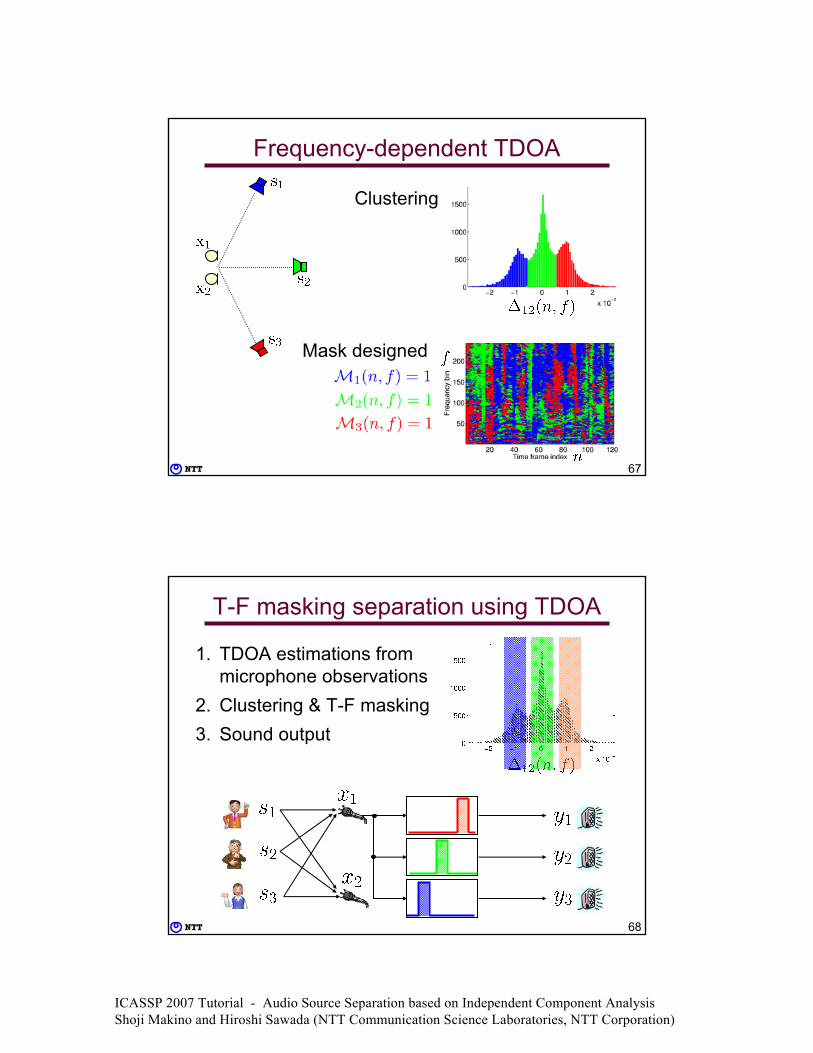
Frequency-dependent TDOA
Clustering
Mask designed
68
T-F masking separation using TDOA
1. TDOA estimations from microphone observations
2. Clustering & T-F masking3. Sound output
ICASSP 2007 Tutorial - Audio Source Separation based on Independent Component Analysis Shoji Makino and Hiroshi Sawada (NTT Communication Science Laboratories, NTT Corporation)
69
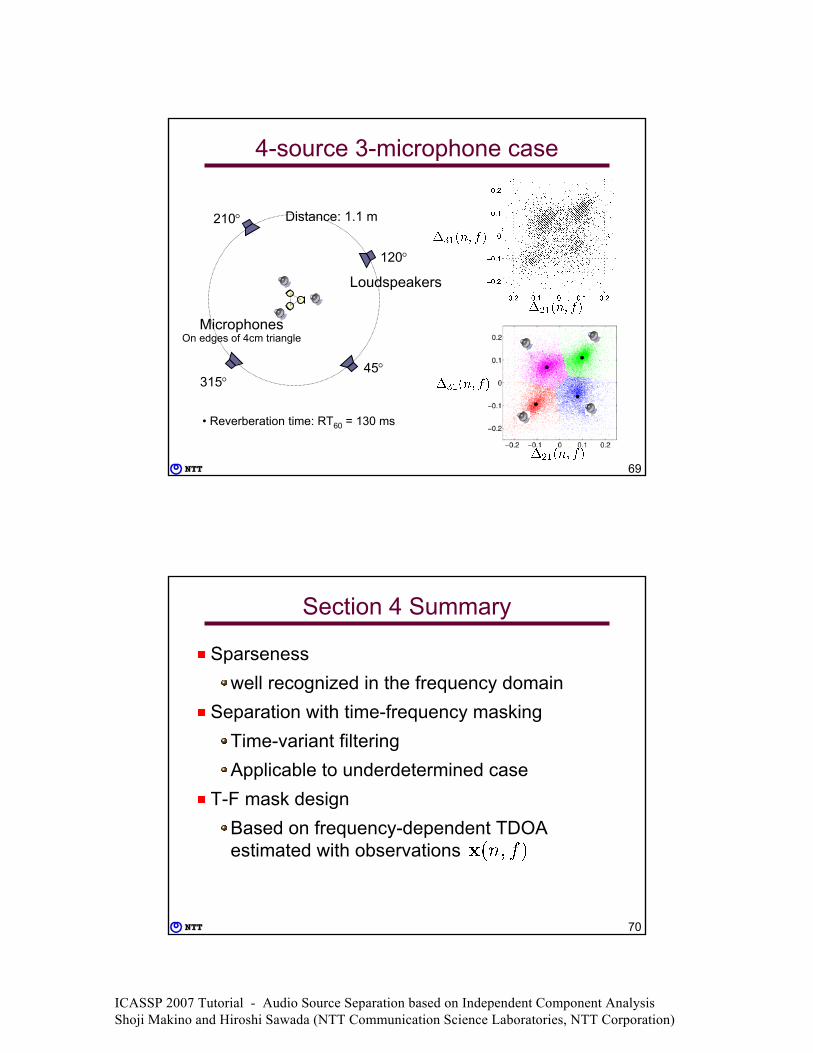
4-source 3-microphone case
MicrophonesOn edges of 4cm triangle
Loudspeakers
45°
120°
210° Distance: 1.1 m
• Reverberation time: RT60 = 130 ms
315°
70
Section 4 Summary
Sparsenesswell recognized in the frequency domain
Separation with time-frequency maskingTime-variant filteringApplicable to underdetermined case
T-F mask designBased on frequency-dependent TDOA estimated with observations
ICASSP 2007 Tutorial - Audio Source Separation based on Independent Component Analysis Shoji Makino and Hiroshi Sawada (NTT Communication Science Laboratories, NTT Corporation)
71
Concluding remarks
Frequency-domain approach for the separation of speech/audio sounds mixed in a real roomIf the situation is properly setup, the source separation task can be performed effectively
Sound sources are mostly active for the observation time periodSource positions are not changed
The real challenge lies in a situation where the above conditions are not satisfied
Short utterance, unknown number of sources, …
ReferencesICA and BSS books
[Lee, 1998], [Haykin, 2000], [Hyvarinen et al., 2001], [Cichocki and Amari, 2002]
ICA algorithms
• Information-maximization approach [Bell and Sejnowski, 1995]• Maximum likelihood (ML) estimation [Cardoso, 1997]• Natural gradient [Amari et al., 1996], [Cichocki and Amari, 2002]• Equivariance property [Cardoso and Laheld, 1996]• FastICA [Hyvarinen et al., 2001]
Time-domain approach to convolutive BSS
[Amari et al., 1997], [Kawamoto et al., 1998], [Matsuoka and Nakashima, 2001],[Douglas and Sun, 2003], [Buchner et al., 2004], [Takatani et al., 2004], [Douglas et al., 2005],[Aichner et al., 2006]
Frequency-domain approach to convolutive BSS
[Smaragdis, 1998], [Parra and Spence, 2000], [Schobben and Sommen, 2002], [Murata et al., 2001],[Anemuller and Kollmeier, 2000], [Mitianoudis and Davies, 2003], [Asano et al., 2003],[Saruwatari et al., 2003], [Ikram and Morgan, 2005], [Sawada et al., 2004], [Mukai et al., 2006],[Sawada et al., 2006], [Hiroe, 2006], [Kim et al., 2007], [Lee et al., 2006], [Sawada et al., 2007]
Approaches to permutation alignment
• Making separation matrices smooth in the frequency domain [Smaragdis, 1998],[Parra and Spence, 2000], [Schobben and Sommen, 2002], [Buchner et al., 2004]
• Beamforming approach and estimating direction-of-arrival (DOA) [Saruwatari et al., 2003],[Ikram and Morgan, 2005], [Sawada et al., 2004], [Mukai et al., 2006], [Sawada et al., 2006]
• Correlation of envelopes [Murata et al., 2001], [Anemuller and Kollmeier, 2000],[Sawada et al., 2004]
• Nonstationary time-varying scale parameter [Mitianoudis and Davies, 2003]• Multivariate density function [Hiroe, 2006], [Kim et al., 2007], [Lee et al., 2006]• Dominance measure [Sawada et al., 2007]
Time-frequency masking approach to BSS
[Aoki et al., 2001], [Rickard et al., 2001], [Bofill, 2003], [Yilmaz and Rickard, 2004],[Roman et al., 2003], [Araki et al., 2004], [Araki et al., 2005], [Kolossa and Orglmeister, 2004],[Sawada et al., 2006]
Blind dereverberation for speech signals
[Nakatani et al., 2007], [Delcroix et al., 2007], [Kinoshita et al., 2006]
Scaling adjustment to microphone observations
[Cardoso, 1998], [Murata et al., 2001], [Matsuoka and Nakashima, 2001], [Takatani et al., 2004]
Linear estimation
[Kailath et al., 2000]
Time difference of arrival (TDOA)
[Knapp and Carter, 1976], [Omologo and Svaizer, 1997], [DiBiase et al., 2001], [Chen et al., 2004]
K-means clustering
[Duda et al., 2000]
REFERENCES
[Aichner et al., 2006] Aichner, R., Buchner, H., Yan, F., and Kellermann, W. (2006). A real-time blind source separationscheme and its application to reverberant and noisy acoustic environments. Signal Process., 86(6):1260–1277.
[Amari et al., 1996] Amari, S., Cichocki, A., and Yang, H. H. (1996). A new learning algorithm for blind signalseparation. In Advances in Neural Information Processing Systems, volume 8, pages 757–763. The MIT Press.
[Amari et al., 1997] Amari, S., Douglas, S., Cichocki, A., and Yang, H. (1997). Multichannel blind deconvolution andequalization using the natural gradient. In Proc. IEEE Workshop on Signal Processing Advances in WirelessCommunications, pages 101–104.
[Anemuller and Kollmeier, 2000] Anemuller, J. and Kollmeier, B. (2000). Amplitude modulation decorrelation forconvolutive blind source separation. In Proc. ICA 2000, pages 215–220.
[Aoki et al., 2001] Aoki, M., Okamoto, M., Aoki, S., Matsui, H., Sakurai, T., and Kaneda, Y. (2001). Sound sourcesegregation based on estimating incident angle of each frequency component of input signals acquired by multiplemicrophones. Acoustical Science and Technology, 22(2):149–157.
[Araki et al., 2004] Araki, S., Makino, S., Blin, A., Mukai, R., and Sawada, H. (2004). Underdetermined blind separationfor speech in real environments with sparseness and ICA. In Proc. ICASSP 2004, volume III, pages 881–884.
[Araki et al., 2005] Araki, S., Makino, S., Sawada, H., and Mukai, R. (2005). Reducing musical noise by a fine-shiftoverlap-add method applied to source separation using a time-frequency mask. In Proc. ICASSP 2005, volume III,pages 81–84.
[Asano et al., 2003] Asano, F., Ikeda, S., Ogawa, M., Asoh, H., and Kitawaki, N. (2003). Combined approach of arrayprocessing and independent component analysis for blind separation of acoustic signals. IEEE Trans. Speech AudioProcessing, 11(3):204–215.
[Bell and Sejnowski, 1995] Bell, A. and Sejnowski, T. (1995). An information-maximization approach to blind separationand blind deconvolution. Neural Computation, 7(6):1129–1159.
[Bofill, 2003] Bofill, P. (2003). Underdetermined blind separation of delayed sound sources in the frequency domain.Neurocomputing, 55:627–641.
[Buchner et al., 2004] Buchner, H., Aichner, R., and Kellermann, W. (2004). Blind source separation for convolutivemixtures: A unified treatment. In Huang, Y. and Benesty, J., editors, Audio Signal Processing for Next-GenerationMultimedia Communication Systems, pages 255–293. Kluwer Academic Publishers.
[Cardoso, 1997] Cardoso, J.-F. (1997). Infomax and maximum likelihood for blind source separation. IEEE SignalProcessing Letters, 4(4):112–114.
[Cardoso, 1998] Cardoso, J.-F. (1998). Multidimensional independent component analysis. In Proc. ICASSP 1998,volume 4, pages 1941–1944.
[Cardoso and Laheld, 1996] Cardoso, J.-F. and Laheld, B. H. (1996). Equivariant adaptive source separation. IEEE Trans.Signal Processing, 44(12):3017–3030.
[Chen et al., 2004] Chen, J., Huang, Y., and Benesty, J. (2004). Time delay estimation. In Huang, Y. and Benesty, J.,editors, Audio Signal Processing, pages 197–227. Kluwer Academic Publishers.
[Cichocki and Amari, 2002] Cichocki, A. and Amari, S. (2002). Adaptive Blind Signal and Image Processing. JohnWiley & Sons.
[Delcroix et al., 2007] Delcroix, M., Hikichi, T., and Miyoshi, M. (2007). Precise dereverberation using multi-channellinear prediction. IEEE Trans. Audio, Speech and Language Processing, 15(2):430–440.
[DiBiase et al., 2001] DiBiase, J. H., Silverman, H. F., and Brandstein, M. S. (2001). Robust localization in reverberantrooms. In Brandstein, M. and Ward, D., editors, Microphone Arrays, pages 157–180. Springer.
[Douglas et al., 2005] Douglas, S. C., Sawada, H., and Makino, S. (2005). A spatio-temporal FastICA algorithm forseparating convolutive mixtures. In Proc. ICASSP 2005, volume V, pages 165–168.
[Douglas and Sun, 2003] Douglas, S. C. and Sun, X. (2003). Convolutive blind separation of speech mixtures using thenatural gradient. Speech Communication, 39:65–78.
[Duda et al., 2000] Duda, R. O., Hart, P. E., and Stork, D. G. (2000). Pattern Classification. Wiley Interscience, 2ndedition.
[Haykin, 2000] Haykin, S., editor (2000). Unsupervised Adaptive Filtering (Volume I: Blind Source Separation). JohnWiley & Sons.
[Hiroe, 2006] Hiroe, A. (2006). Solution of permutation problem in frequency domain ICA using multivariate probabilitydensity functions. In Proc. ICA 2006 (LNCS 3889), pages 601–608. Springer.
[Hyvarinen et al., 2001] Hyvarinen, A., Karhunen, J., and Oja, E. (2001). Independent Component Analysis. John Wiley& Sons.
[Ikram and Morgan, 2005] Ikram, M. Z. and Morgan, D. R. (2005). Permutation inconsistency in blind speech separation:Investigation and solutions. IEEE Trans. Speech Audio Processing, 13(1):1–13.
[Kailath et al., 2000] Kailath, T., Sayed, A. H., and Hassibi, B. (2000). Linear Estimation. Prentice Hall.[Kawamoto et al., 1998] Kawamoto, M., Matsuoka, K., and Ohnishi, N. (1998). A method of blind separation for
convolved non-stationary signals. Neurocomputing, 22:157–171.[Kim et al., 2007] Kim, T., Attias, H. T., Lee, S.-Y., and Lee, T.-W. (2007). Blind source separation exploiting
higher-order frequency dependencies. IEEE Trans. Audio, Speech and Language Processing, pages 70–79.[Kinoshita et al., 2006] Kinoshita, K., Nakatani, T., and Miyoshi, M. (2006). Spectral subtraction steered by multi-step
forward linear prediction for single channel speech dereverberation. In Proc. ICASSP 2006, volume I, pages 817–820.[Knapp and Carter, 1976] Knapp, C. H. and Carter, G. C. (1976). The generalized correlation method for estimation of
time delay. IEEE Trans. Acoustic, Speech and Signal Processing, 24(4):320–327.[Kolossa and Orglmeister, 2004] Kolossa, D. and Orglmeister, R. (2004). Nonlinear postprocessing for blind speech
separation. In Proc. ICA 2004 (LNCS 3195), pages 832–839.[Lee et al., 2006] Lee, I., Kim, T., and Lee, T.-W. (2006). Complex FastIVA: A robust maximum likelihood approach of
MICA for convolutive BSS. In Proc. ICA 2006 (LNCS 3889), pages 625–632. Springer.[Lee, 1998] Lee, T. W. (1998). Independent Component Analysis - Theory and Applications. Kluwer Academic Publishers.[Matsuoka and Nakashima, 2001] Matsuoka, K. and Nakashima, S. (2001). Minimal distortion principle for blind source
separation. In Proc. ICA 2001, pages 722–727.[Mitianoudis and Davies, 2003] Mitianoudis, N. and Davies, M. (2003). Audio source separation of convolutive mixtures.
IEEE Trans. Speech and Audio Processing, 11(5):489–497.[Mukai et al., 2006] Mukai, R., Sawada, H., Araki, S., and Makino, S. (2006). Frequency-domain blind source separation
of many speech signals using near-field and far-field models. EURASIP Journal on Applied Signal Processing,2006:Article ID 83683, 13 pages.
[Murata et al., 2001] Murata, N., Ikeda, S., and Ziehe, A. (2001). An approach to blind source separation based ontemporal structure of speech signals. Neurocomputing, 41(1-4):1–24.
[Nakatani et al., 2007] Nakatani, T., Kinoshita, K., and Miyoshi, M. (2007). Harmonicity-based blind dereverberation forsingle-channel speech signals. IEEE Trans. Audio, Speech and Language Processing, 15(1):80–95.
[Omologo and Svaizer, 1997] Omologo, M. and Svaizer, P. (1997). Use of the crosspower-spectrum phase in acousticevent location. IEEE Trans. Speech Audio Processing, 5(3):288–292.
[Parra and Spence, 2000] Parra, L. and Spence, C. (2000). Convolutive blind separation of non-stationary sources. IEEETrans. Speech Audio Processing, 8(3):320–327.
[Rickard et al., 2001] Rickard, S., Balan, R., and Rosca, J. (2001). Real-time time-frequency based blind sourceseparation. In Proc. ICA2001, pages 651–656.
[Roman et al., 2003] Roman, N., Wang, D., and Brown, G. J. (2003). Speech segregation based on sound localization.Journal of Acousitical Society of America, 114(4):2236–2252.
[Saruwatari et al., 2003] Saruwatari, H., Kurita, S., Takeda, K., Itakura, F., Nishikawa, T., and Shikano, K. (2003). Blindsource separation combining independent component analysis and beamforming. EURASIP Journal on Applied SignalProcessing, 2003(11):1135–1146.
[Sawada et al., 2007] Sawada, H., Araki, S., and Makino, S. (2007). Measuring dependence of bin-wise separated signalsfor permutation alignment in frequency-domain BSS. In Proc. ISCAS 2007. (in press).
[Sawada et al., 2006] Sawada, H., Araki, S., Mukai, R., and Makino, S. (2006). Blind extraction of dominant targetsources using ICA and time-frequency masking. IEEE Trans. Audio, Speech and Language Processing, pages2165–2173.
[Sawada et al., 2004] Sawada, H., Mukai, R., Araki, S., and Makino, S. (2004). A robust and precise method for solvingthe permutation problem of frequency-domain blind source separation. IEEE Trans. Speech Audio Processing,12(5):530–538.
[Schobben and Sommen, 2002] Schobben, L. and Sommen, W. (2002). A frequency domain blind signal separationmethod based on decorrelation. IEEE Trans. Signal Processing, 50(8):1855–1865.
[Smaragdis, 1998] Smaragdis, P. (1998). Blind separation of convolved mixtures in the frequency domain.Neurocomputing, 22:21–34.
[Takatani et al., 2004] Takatani, T., Nishikawa, T., Saruwatari, H., and Shikano, K. (2004). High-fidelity blind separationof acoustic signals using SIMO-model-based independent component analysis. IEICE Trans. Fundamentals,E87-A(8):2063–2072.
[Yilmaz and Rickard, 2004] Yilmaz, O. and Rickard, S. (2004). Blind separation of speech mixtures via time-frequencymasking. IEEE Trans. Signal Processing, 52(7):1830–1847.


![Hybridityöstö · (Makino G5) [5] Viisiakseliseen suurnopeuskoneistuskeskukseen liitetty ainetta lisäävä lasertyöstöpää (la- ... 60-duoblock , viitattu 21.9.2015 [9]](https://img.pdfslide.tips/doc/110x75/5c28fdb509d3f298618c8e45/hybridityoestoe-makino-g5-5-viisiakseliseen-suurnopeuskoneistuskeskukseen.jpg)