Embed Size (px)
Citation preview
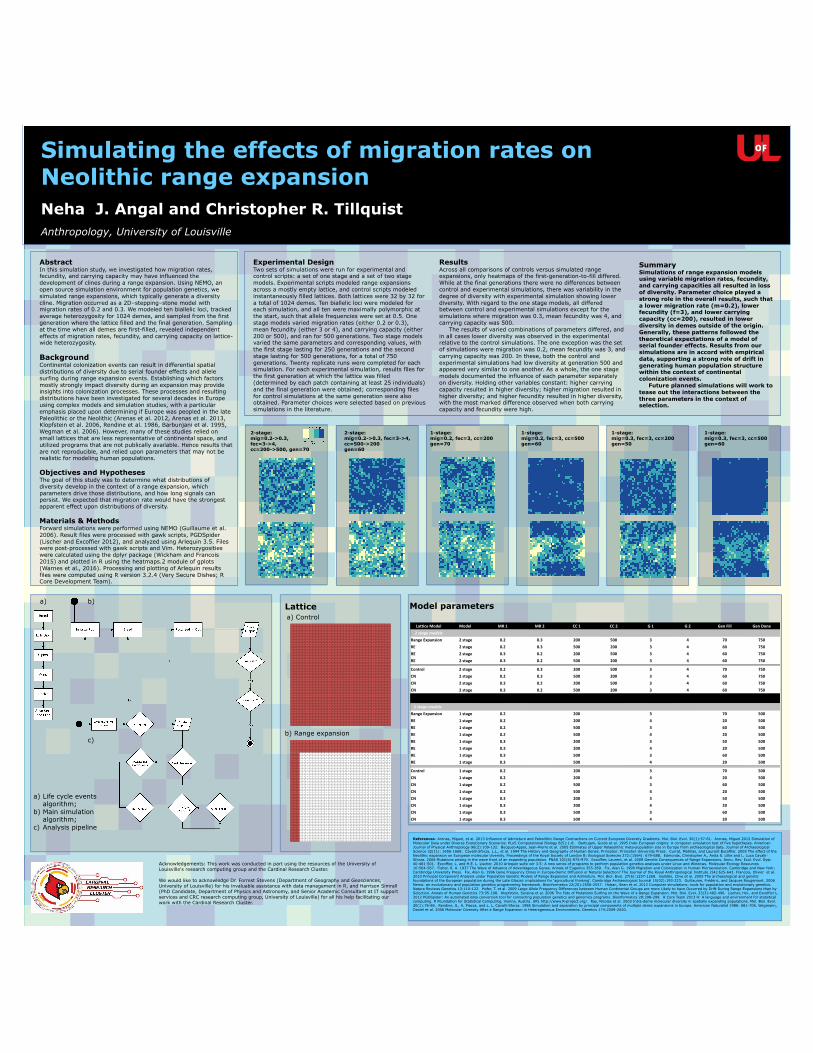
Simulating the effects of migration rates on Neolithic range expansion Neha J. Angal and Christopher R. Tillquist Anthropology, University of Louisville
2-stage: mig=0.2->0.3, fec=3->4, cc=500->200 gen=60
1-stage: mig=0.2, fec=3, cc=200 gen=70
1-stage: mig=0.2, fec=3, cc=500 gen=60
1-stage: mig=0.3, fec=3, cc=200 gen=50
1-stage: mig=0.3, fec=3, cc=500 gen=60
References: Arenas, Miguel, et al. 2013 Influence of Admixture and Paleolithic Range Contractions on Current European Diversity Gradients. Mol. Biol. Evol. 30(1):57-61. Arenas, Miguel 2012 Simulation of Molecular Data under Diverse Evolutionary Scenarios. PLoS Computational Biology 8(5):1-8. Barbujani, Guido et al. 1995 Indo‐European origins: A computer‐simulation test of five hypotheses. American Journal of Physical Anthropology 96(2):109-132. Bocquet-Appel, Jean-Pierre et al. 2005 Estimates of Upper Palaeolithic meta-population size in Europe from archaeological data. Journal of Archaeological Science 32(11): 1656-1668. Cavalli-Sforza, L.L., et al. 1994 The History and Geography of Human Genes. Princeton: Princeton University Press. Currat, Mathias, and Laurent Excoffier. 2005 The effect of the Neolithic expansion on European molecular diversity. Proceedings of the Royal Society of London B: Biological Sciences 272:(1564): 679-688. Edmonds, Christopher A., Anita S. Lillie and L. Luca Cavalli-Sforza. 2004 Mutations arising in the wave front of an expanding population. PNAS 101(4):975-979. Excoffier, Laurent, et al. 2009 Genetic Consequences of Range Expansions. Annu. Rev. Ecol. Evol. Syst. 40:481-501. Excoffier, L. and H.E. L. Lischer. 2010 Arlequin suite ver 3.5: A new series of programs to perform population genetics analyses under Linux and Windows. Molecular Ecology Resources 10:564-567. Fisher, R. A. 1937 The Wave of Advance of Advantageous Genes. Annals of Eugenics 355-369. Fix, Alan G. 1999 Migration and Colonization in Human Microevolution. Cambridge and New York: Cambridge University Press. Fix, Alan G. 1996 Gene Frequency Clines in Europe-Demic Diffusion or Natural Selection? The Journal of the Royal Anthropological Institute 2(4):625-643. Francois, Olivier et al. 2010 Principal Component Analysis under Population Genetic Models of Range Expansion and Admixture. Mol. Biol. Evol. 27(6):1257-1268. Gamble, Clive et al. 2005 The archaeological and genetic foundations of the European population during the Late Glacial: implications for ‘agricultural thinking’. Cambridge Archaeological Journal 15(02):193-223. Guillaume, Frédéric, and Jacques Rougemont. 2006 Nemo: an evolutionary and population genetics programming framework. Bioinformatics 22(20):2556-2557. Hoban, Sean et al. 2012 Computer simulations: tools for population and evolutionary genetics. Nature Reviews Genetics 13:110-122. Hofer, T. et al. 2009 Large Allele Frequency Differences between Human Continental Groups are more Likely to have Occurred by Drift During Range Expansions than by Selection. Annals of Human Genetics 73:95-108. Klopfstein, Seraina et al. 2006 The Fate of Mutations Surfing on the Wave of a Range Expansion. Mol. Biol. Evol. 23(3):482-490. Lischer, Hel., and Excoffier L. 2012 PGDSpider: An automated data conversion tool for connecting population genetics and genomics programs. Bioinformatics 28:298-299. R Core Team 2013 R: A language and environment for statistical computing. R Foundation for Statistical Computing, Vienna, Austria. URL http://www.R-project.org/. Ray, Nicolas et al. 2003 Intra-deme molecular diversity in spatially expanding populations. Mol. Biol. Evol. 20(1):76-86. Rendine, S., A. Piazza, and L. L. Cavalli-Sforza. 1986 Simulation and separation by principal components of multiple demic expansions in Europe. American Naturalist 1986: 681-706. Wegmann, Daniel et al. 2006 Molecular Diversity After a Range Expansion in Heterogeneous Environments. Genetics 174:2009-2020.
a) Life cycle events algorithm;
b) Main simulation algorithm;
c) Analysis pipeline
a) b)
c)
LatticeModel Model MR1 MR2 CC1 CC2 G1 G2 GenFill GenDone2stagemodels
RangeExpansion 2stage 0.2 0.3 200 500 3 4 70 750RE 2stage 0.2 0.3 500 200 3 4 60 750RE 2stage 0.3 0.2 200 500 3 4 60 750RE 2stage 0.3 0.2 500 200 3 4 60 750
Control 2stage 0.2 0.3 200 500 3 4 70 750CN 2stage 0.2 0.3 500 200 3 4 60 750CN 2stage 0.3 0.2 200 500 3 4 60 750CN 2stage 0.3 0.2 500 200 3 4 60 750
4/12/16
1stagemodelsRangeExpansion 1stage 0.2 200 3 70 500RE 1stage 0.2 200 4 20 500RE 1stage 0.2 500 3 60 500RE 1stage 0.2 500 4 20 500RE 1stage 0.3 200 3 50 500RE 1stage 0.3 200 4 20 500RE 1stage 0.3 500 3 60 500RE 1stage 0.3 500 4 20 500
Control 1stage 0.2 200 3 70 500CN 1stage 0.2 200 4 20 500CN 1stage 0.2 500 3 60 500CN 1stage 0.2 500 4 20 500CN 1stage 0.3 200 3 50 500CN 1stage 0.3 200 4 20 500CN 1stage 0.3 500 3 60 500CN 1stage 0.3 500 4 20 500
Model parameters
1 2 3 4 5 6 7 8 9 10 11 12 13 14 15 16 17 18 19 20 21 22 23 24 25 26 27 28 29 30 31 32
33 34 35 36 37 38 39 40 41 42 43 44 45 46 47 48 49 50 51 52 53 54 55 56 57 58 59 60 61 62 63 64
65 66 67 68 69 70 71 72 73 74 75 76 77 78 79 80 81 82 83 84 85 86 87 88 89 90 91 92 93 94 95 96
97 98 99 100 101 102 103 104 105 106 107 108 109 110 111 112 113 114 115 116 117 118 119 120 121 122 123 124 125 126 127 128
129 130 131 132 133 134 135 136 137 138 139 140 141 142 143 144 145 146 147 148 149 150 151 152 153 154 155 156 157 158 159 160
161 162 163 164 165 166 167 168 169 170 171 172 173 174 175 176 177 178 179 180 181 182 183 184 185 186 187 188 189 190 191 192
193 194 195 196 197 198 199 200 201 202 203 204 205 206 207 208 209 210 211 212 213 214 215 216 217 218 219 220 221 222 223 224
225 226 227 228 229 230 231 232 233 234 235 236 237 238 239 240 241 242 243 244 245 246 247 248 249 250 251 252 253 254 255 256
257 258 259 260 261 262 263 264 265 266 267 268 269 270 271 272 273 274 275 276 277 278 279 280 281 282 283 284 285 286 287 288
289 290 291 292 293 294 295 296 297 298 299 300 301 302 303 304 305 306 307 308 309 310 311 312 313 314 315 316 317 318 319 320
321 322 323 324 325 326 327 328 329 330 331 332 333 334 335 336 337 338 339 340 341 342 343 344 345 346 347 348 349 350 351 352
353 354 355 356 357 358 359 360 361 362 363 364 365 366 367 368 369 370 371 372 373 374 375 376 377 378 379 380 381 382 383 384
385 386 387 388 389 390 391 392 393 394 395 396 397 398 399 400 401 402 403 404 405 406 407 408 409 410 411 412 413 414 415 416
417 418 419 420 421 422 423 424 425 426 427 428 429 430 431 432 433 434 435 436 437 438 439 440 441 442 443 444 445 446 447 448
449 450 451 452 453 454 455 456 457 458 459 460 461 462 463 464 465 466 467 468 469 470 471 472 473 474 475 476 477 478 479 480
481 482 483 484 485 486 487 488 489 490 491 492 493 494 495 496 497 498 499 500 501 502 503 504 505 506 507 508 509 510 511 512
513 514 515 516 517 518 519 520 521 522 523 524 525 526 527 528 529 530 531 532 533 534 535 536 537 538 539 540 541 542 543 544
545 546 547 548 549 550 551 552 553 554 555 556 557 558 559 560 561 562 563 564 565 566 567 568 569 570 571 572 573 574 575 576
577 578 579 580 581 582 583 584 585 586 587 588 589 590 591 592 593 594 595 596 597 598 599 600 601 602 603 604 605 606 607 608
609 610 611 612 613 614 615 616 617 618 619 620 621 622 623 624 625 626 627 628 629 630 631 632 633 634 635 636 637 638 639 640
641 642 643 644 645 646 647 648 649 650 651 652 653 654 655 656 657 658 659 660 661 662 663 664 665 666 667 668 669 670 671 672
673 674 675 676 677 678 679 680 681 682 683 684 685 686 687 688 689 690 691 692 693 694 695 696 697 698 699 700 701 702 703 704
705 706 707 708 709 710 711 712 713 714 715 716 717 718 719 720 721 722 723 724 725 726 727 728 729 730 731 732 733 734 735 736
737 738 739 740 741 742 743 744 745 746 747 748 749 750 751 752 753 754 755 756 757 758 759 760 761 762 763 764 765 766 767 768
769 770 771 772 773 774 775 776 777 778 779 780 781 782 783 784 785 786 787 788 789 790 791 792 793 794 795 796 797 798 799 800
801 802 803 804 805 806 807 808 809 810 811 812 813 814 815 816 817 818 819 820 821 822 823 824 825 826 827 828 829 830 831 832
833 834 835 836 837 838 839 840 841 842 843 844 845 846 847 848 849 850 851 852 853 854 855 856 857 858 859 860 861 862 863 864
865 866 867 868 869 870 871 872 873 874 875 876 877 878 879 880 881 882 883 884 885 886 887 888 889 890 891 892 893 894 895 896
897 898 899 900 901 902 903 904 905 906 907 908 909 910 911 912 913 914 915 916 917 918 919 920 921 922 923 924 925 926 927 928
929 930 931 932 933 934 935 936 937 938 939 940 941 942 943 944 945 946 947 948 949 950 951 952 953 954 955 956 957 958 959 960
961 962 963 964 965 966 967 968 969 970 971 972 973 974 975 976 977 978 979 980 981 982 983 984 985 986 987 988 989 990 991 992
993 994 995 996 997 998 999 1000 1001 1002 1003 1004 1005 1006 1007 1008 1009 1010 1011 1012 1013 1014 1015 1016 1017 1018 1019 1020 1021 1022 1023 1024
Lattice
b) Range expansion
a) Control
Acknowledgements: This work was conducted in part using the resources of the University of Louisville's research computing group and the Cardinal Research Cluster. We would like to acknowledge Dr. Forrest Stevens (Department of Geography and Geosciences, University of Louisville) for his invaluable assistance with data management in R, and Harrison Simrall (PhD Candidate, Department of Physics and Astronomy, and Senior Academic Consultant at IT support services and CRC research computing group, University of Louisville) for all his help facilitating our work with the Cardinal Research Cluster.
Abstract In this simulation study, we investigated how migration rates, fecundity, and carrying capacity may have influenced the development of clines during a range expansion. Using NEMO, an open source simulation environment for population genetics, we simulated range expansions, which typically generate a diversity cline. Migration occurred as a 2D–stepping–stone model with migration rates of 0.2 and 0.3. We modeled ten biallelic loci, tracked average heterozygosity for 1024 demes, and sampled from the first generation where the lattice filled and the final generation. Sampling at the time when all demes are first-filled, revealed independent effects of migration rates, fecundity, and carrying capacity on lattice-wide heterozygosity. Background Continental colonization events can result in differential spatial distributions of diversity due to serial founder effects and allele surfing during range expansion events. Establishing which factors mostly strongly impact diversity during an expansion may provide insights into colonization processes. These processes and resulting distributions have been investigated for several decades in Europe using complex models and simulation studies, with a particular emphasis placed upon determining if Europe was peopled in the late Paleolithic or the Neolithic (Arenas et al. 2012, Arenas et al. 2013, Klopfstein et al. 2006, Rendine et al. 1986, Barbunjani et al. 1995, Wegman et al. 2006). However, many of these studies relied on small lattices that are less representative of continental space, and utilized programs that are not publically available. Hence results that are not reproducible, and relied upon parameters that may not be realistic for modeling human populations. Objectives and Hypotheses The goal of this study was to determine what distributions of diversity develop in the context of a range expansion, which parameters drive those distributions, and how long signals can persist. We expected that migration rate would have the strongest apparent effect upon distributions of diversity. Materials & Methods Forward simulations were performed using NEMO (Guillaume et al. 2006). Result files were processed with gawk scripts, PGDSpider (Lischer and Excoffier 2012), and analyzed using Arlequin 3.5. Files were post-processed with gawk scripts and Vim. Heterozygosities were calculated using the dplyr package (Wickham and Francois 2015) and plotted in R using the heatmaps.2 module of gplots (Warnes et al., 2016). Processing and plotting of Arlequin results files were computed using R version 3.2.4 (Very Secure Dishes; R Core Development Team).
Experimental Design Two sets of simulations were run for experimental and control scripts: a set of one stage and a set of two stage models. Experimental scripts modeled range expansions across a mostly empty lattice, and control scripts modeled instantaneously filled lattices. Both lattices were 32 by 32 for a total of 1024 demes. Ten biallelic loci were modeled for each simulation, and all ten were maximally polymorphic at the start, such that allele frequencies were set at 0.5. One stage models varied migration rates (either 0.2 or 0.3), mean fecundity (either 3 or 4), and carrying capacity (either 200 or 500), and ran for 500 generations. Two stage models varied the same parameters and corresponding values, with the first stage lasting for 250 generations and the second stage lasting for 500 generations, for a total of 750 generations. Twenty replicate runs were completed for each simulation. For each experimental simulation, results files for the first generation at which the lattice was filled (determined by each patch containing at least 25 individuals) and the final generation were obtained; corresponding files for control simulations at the same generation were also obtained. Parameter choices were selected based on previous simulations in the literature.
Results Across all comparisons of controls versus simulated range expansions, only heatmaps of the first-generation-to-fill differed. While at the final generations there were no differences between control and experimental simulations, there was variability in the degree of diversity with experimental simulation showing lower diversity. With regard to the one stage models, all differed between control and experimental simulations except for the simulations where migration was 0.3, mean fecundity was 4, and carrying capacity was 500. The results of varied combinations of parameters differed, and in all cases lower diversity was observed in the experimental relative to the control simulations. The one exception was the set of simulations were migration was 0.2, mean fecundity was 3, and carrying capacity was 200. In these, both the control and experimental simulations had low diversity at generation 500 and appeared very similar to one another. As a whole, the one stage models documented the influence of each parameter separately on diversity. Holding other variables constant: higher carrying capacity resulted in higher diversity; higher migration resulted in higher diversity; and higher fecundity resulted in higher diversity, with the most marked difference observed when both carrying capacity and fecundity were high.
Summary Simulations of range expansion models using variable migration rates, fecundity, and carrying capacities all resulted in loss of diversity. Parameter choice played a strong role in the overall results, such that a lower migration rate (m=0.2), lower fecundity (f=3), and lower carrying capacity (cc=200), resulted in lower diversity in demes outside of the origin. Generally, these patterns followed the theoretical expectations of a model of serial founder effects. Results from our simulations are in accord with empirical data, supporting a strong role of drift in generating human population structure within the context of continental colonization events. Future planned simulations will work to tease out the interactions between the three parameters in the context of selection.
2-stage: mig=0.2->0.3, fec=3->4, cc=200->500, gen=70