Embed Size (px)
Citation preview
PolymerChemistry
PAPER
Cite this: Polym. Chem., 2015, 6,4109
Received 10th April 2015,Accepted 21st April 2015
DOI: 10.1039/c5py00534e
www.rsc.org/polymers
Single-molecule imaging reveals topologicalisomer-dependent diffusion by 4-armed starand dicyclic 8-shaped polymers†
Satoshi Habuchi,*a Susumu Fujiwara,b Takuya Yamamotob and Yasuyuki Tezuka*b
Diffusion dynamics of topological isomers of polymer molecules was investigated at the single-molecular
level in the melt state by employing the fluorophore-incorporated 4-armed star and the corresponding
doubly-cyclized, 8-shaped poly(THF) chains. While the single-molecule fluorescence imaging experiment
revealed that the diffusion of the 4-armed star polymer was described by a single Gaussian distribution,
the diffusion of the 8-shaped polymer exhibited a double Gaussian distribution behaviour. We reasoned
that the two 8-shaped polymeric isomers have distinct diffusion modes in the melt state, although
ensemble-averaged experimental methods cannot detect differences in the overall conformational state
of the isomers. The single-molecule experiments suggested that one of the 8-shaped polymeric isomers,
having the horizontally oriented form, causes an efficient threading with the linear matrix chains which
leads to slower diffusion compared with the corresponding 4-armed star polymer, while the other
8-shaped polymeric isomer, having the vertically oriented form, displayed faster diffusion by the suppres-
sion of effective threading with the linear matrix chains due to its contracted chain conformation.
Introduction
Diffusion and relaxation of polymer chains are the key factorsin determining their rheological properties,1 which serve as abasis for the development of polymer materials such as thinfilms and fibres. In contrast to linear polymers whose chaindynamics have been well characterized,2–5 topological poly-mers such as ring and dicyclic polymers often display un-expected static and dynamic behaviours.6 For instance, it wasrecently demonstrated that the thermal and salt stability of themicelles formed from a polymer increased significantly by alinear-to-cyclic conversion.7,8 Such a topology effect shouldarise from the unique inter- and intra-chain interactions ofcyclic polymers which are originated from the absence ofchain ends.9 In addition to the topology dependent chaininteractions, topological polymers often adopt different iso-
meric forms that do not exist in linear and branched polymersbecause of their unique structural configurations. Such topolo-gical isomers often display distinct physical properties such asthe isomer-dependent hydrodynamic volume.10,11 This couldhave significant effects on their diffusive and relaxationdynamics, and thus could contribute to the development ofnew polymer materials through a topological isomer-depen-dent control of the rheological properties. However, molecularmechanisms of topology- and topological isomer-dependentdiffusion and relaxation have not been well understooddespite the extensive theoretical and experimental studies.
While ensemble averaged experimental methods have beenthe primary tools to characterize diffusive and relaxationdynamics of polymers,12–14 recent single-molecule imagingstudies have demonstrated spatiotemporal heterogeneities ofpolymer dynamics.15–21 Importantly, those observationscannot be fully interpreted by the current polymer physicstheory. In particular, given the unusual and complicated chaindynamics and interactions in topological polymers, single-molecule approaches provide a powerful means for investi-gating their dynamics.22 We have recently reported a topologydependent diffusion of individual linear and cyclic polymersin a semidilute solution and in the melt state by employinglinear and cyclic poly(THF)s containing a perylene diimidemoiety as a fluorophore.23–25 The single-molecule imagingexperiments have revealed an unexpected multiple-mode
†Electronic supplementary information (ESI) available: Calculation of the radiusof gyration, cumulative distribution function analysis, and movies of single-molecule diffusion. See DOI: 10.1039/c5py00534e
aBiological and Environmental Sciences and Engineering, King Abdullah University
of Science and Technology, P.O. Box 4700 KAUST, Thuwal 23955-6900, Kingdom of
Saudi Arabia. E-mail: [email protected] of Organic and Polymeric Materials, Tokyo Institute of Technology,
2-12-1 O-okayama, Meguro-ku, Tokyo 152-8552, Japan. E-mail: [email protected]
This journal is © The Royal Society of Chemistry 2015 Polym. Chem., 2015, 6, 4109–4115 | 4109
Publ
ishe
d on
21
Apr
il 20
15. D
ownl
oade
d by
Tok
yo I
nstit
ute
of T
echn
olog
y on
26/
05/2
015
23:5
8:33
.
View Article OnlineView Journal | View Issue
diffusion of the cyclic polymer in the semidilute solution dueto partial threading of the cyclic chains with the linear matrixchains.23 The study clearly demonstrated the topology effecton the diffusion dynamics of polymers that was often hiddenbehind the ensemble averaging in the conventional ensembleexperiments.
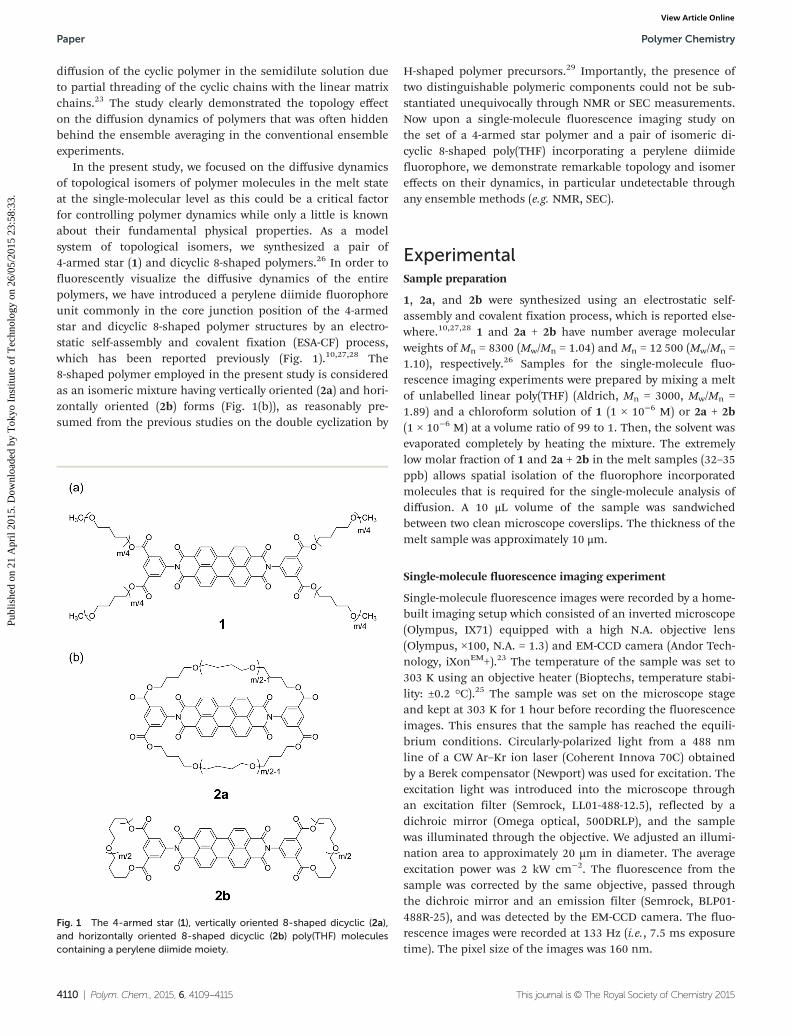
In the present study, we focused on the diffusive dynamicsof topological isomers of polymer molecules in the melt stateat the single-molecular level as this could be a critical factorfor controlling polymer dynamics while only a little is knownabout their fundamental physical properties. As a modelsystem of topological isomers, we synthesized a pair of4-armed star (1) and dicyclic 8-shaped polymers.26 In order tofluorescently visualize the diffusive dynamics of the entirepolymers, we have introduced a perylene diimide fluorophoreunit commonly in the core junction position of the 4-armedstar and dicyclic 8-shaped polymer structures by an electro-static self-assembly and covalent fixation (ESA-CF) process,which has been reported previously (Fig. 1).10,27,28 The8-shaped polymer employed in the present study is consideredas an isomeric mixture having vertically oriented (2a) and hori-zontally oriented (2b) forms (Fig. 1(b)), as reasonably pre-sumed from the previous studies on the double cyclization by
H-shaped polymer precursors.29 Importantly, the presence oftwo distinguishable polymeric components could not be sub-stantiated unequivocally through NMR or SEC measurements.Now upon a single-molecule fluorescence imaging study onthe set of a 4-armed star polymer and a pair of isomeric di-cyclic 8-shaped poly(THF) incorporating a perylene diimidefluorophore, we demonstrate remarkable topology and isomereffects on their dynamics, in particular undetectable throughany ensemble methods (e.g. NMR, SEC).
ExperimentalSample preparation
1, 2a, and 2b were synthesized using an electrostatic self-assembly and covalent fixation process, which is reported else-where.10,27,28 1 and 2a + 2b have number average molecularweights of Mn = 8300 (Mw/Mn = 1.04) and Mn = 12 500 (Mw/Mn =1.10), respectively.26 Samples for the single-molecule fluo-rescence imaging experiments were prepared by mixing a meltof unlabelled linear poly(THF) (Aldrich, Mn = 3000, Mw/Mn =1.89) and a chloroform solution of 1 (1 × 10⁻⁶ M) or 2a + 2b(1 × 10⁻⁶ M) at a volume ratio of 99 to 1. Then, the solvent wasevaporated completely by heating the mixture. The extremelylow molar fraction of 1 and 2a + 2b in the melt samples (32–35ppb) allows spatial isolation of the fluorophore incorporatedmolecules that is required for the single-molecule analysis ofdiffusion. A 10 μL volume of the sample was sandwichedbetween two clean microscope coverslips. The thickness of themelt sample was approximately 10 μm.
Single-molecule fluorescence imaging experiment
Single-molecule fluorescence images were recorded by a home-built imaging setup which consisted of an inverted microscope(Olympus, IX71) equipped with a high N.A. objective lens(Olympus, ×100, N.A. = 1.3) and EM-CCD camera (Andor Tech-nology, iXonEM+).23 The temperature of the sample was set to303 K using an objective heater (Bioptechs, temperature stabi-lity: ±0.2 °C).25 The sample was set on the microscope stageand kept at 303 K for 1 hour before recording the fluorescenceimages. This ensures that the sample has reached the equili-brium conditions. Circularly-polarized light from a 488 nmline of a CW Ar–Kr ion laser (Coherent Innova 70C) obtainedby a Berek compensator (Newport) was used for excitation. Theexcitation light was introduced into the microscope throughan excitation filter (Semrock, LL01-488-12.5), reflected by adichroic mirror (Omega optical, 500DRLP), and the samplewas illuminated through the objective. We adjusted an illumi-nation area to approximately 20 µm in diameter. The averageexcitation power was 2 kW cm−2. The fluorescence from thesample was corrected by the same objective, passed throughthe dichroic mirror and an emission filter (Semrock, BLP01-488R-25), and was detected by the EM-CCD camera. The fluo-rescence images were recorded at 133 Hz (i.e., 7.5 ms exposuretime). The pixel size of the images was 160 nm.
Fig. 1 The 4-armed star (1), vertically oriented 8-shaped dicyclic (2a),and horizontally oriented 8-shaped dicyclic (2b) poly(THF) moleculescontaining a perylene diimide moiety.
Paper Polymer Chemistry
4110 | Polym. Chem., 2015, 6, 4109–4115 This journal is © The Royal Society of Chemistry 2015
Publ
ishe
d on
21
Apr
il 20
15. D
ownl
oade
d by
Tok
yo I
nstit
ute
of T
echn
olog
y on
26/
05/2
015
23:5
8:33
. View Article Online
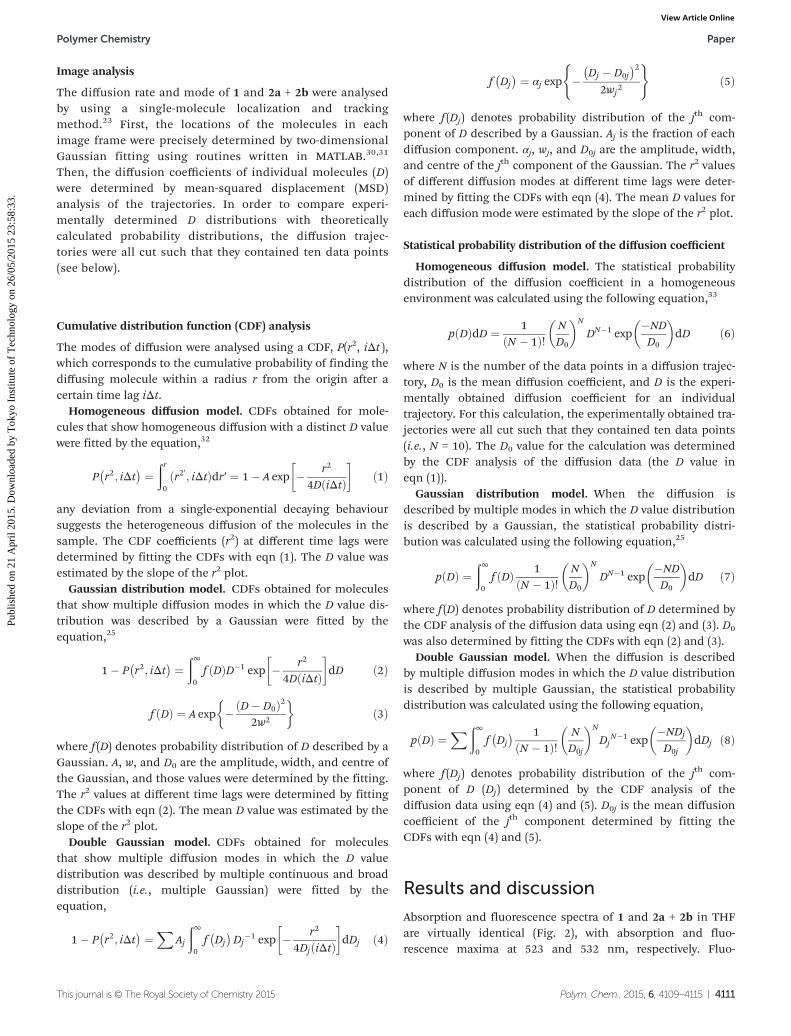
Image analysis
The diffusion rate and mode of 1 and 2a + 2b were analysedby using a single-molecule localization and trackingmethod.23 First, the locations of the molecules in eachimage frame were precisely determined by two-dimensionalGaussian fitting using routines written in MATLAB.30,31
Then, the diffusion coefficients of individual molecules (D)were determined by mean-squared displacement (MSD)analysis of the trajectories. In order to compare experi-mentally determined D distributions with theoreticallycalculated probability distributions, the diffusion trajec-tories were all cut such that they contained ten data points(see below).
Cumulative distribution function (CDF) analysis
The modes of diffusion were analysed using a CDF, P(r2, iΔt ),which corresponds to the cumulative probability of finding thediffusing molecule within a radius r from the origin after acertain time lag iΔt.
Homogeneous diffusion model. CDFs obtained for mole-cules that show homogeneous diffusion with a distinct D valuewere fitted by the equation,32
P r2; iΔt� � ¼ ðr
0ðr2′; iΔtÞdr′ ¼ 1� A exp � r2
4D iΔtð Þ� �
ð1Þ
any deviation from a single-exponential decaying behavioursuggests the heterogeneous diffusion of the molecules in thesample. The CDF coefficients (r2) at different time lags weredetermined by fitting the CDFs with eqn (1). The D value wasestimated by the slope of the r2 plot.
Gaussian distribution model. CDFs obtained for moleculesthat show multiple diffusion modes in which the D value dis-tribution was described by a Gaussian were fitted by theequation,25
1� P r2; iΔt� � ¼ ð1
0f ðDÞD�1 exp � r2
4D iΔtð Þ� �
dD ð2Þ
f Dð Þ ¼ A exp � D� D0ð Þ22w2
� �ð3Þ
where f (D) denotes probability distribution of D described by aGaussian. A, w, and D0 are the amplitude, width, and centre ofthe Gaussian, and those values were determined by the fitting.The r2 values at different time lags were determined by fittingthe CDFs with eqn (2). The mean D value was estimated by theslope of the r2 plot.
Double Gaussian model. CDFs obtained for moleculesthat show multiple diffusion modes in which the D valuedistribution was described by multiple continuous and broaddistribution (i.e., multiple Gaussian) were fitted by theequation,
1� P r2; iΔt� � ¼ X
Aj
ð10f Dj� �
Dj�1 exp � r2
4Dj iΔtð Þ� �
dDj ð4Þ
f Dj� � ¼ αj exp � Dj � D0j
� �22wj
2
( )ð5Þ
where f (Dj) denotes probability distribution of the jth com-ponent of D described by a Gaussian. Aj is the fraction of eachdiffusion component. αj, wj, and D0j are the amplitude, width,and centre of the jth component of the Gaussian. The r2 valuesof different diffusion modes at different time lags were deter-mined by fitting the CDFs with eqn (4). The mean D values foreach diffusion mode were estimated by the slope of the r2 plot.
Statistical probability distribution of the diffusion coefficient
Homogeneous diffusion model. The statistical probabilitydistribution of the diffusion coefficient in a homogeneousenvironment was calculated using the following equation,33
p Dð ÞdD ¼ 1N � 1ð Þ!
ND0
� N
DN�1 exp�NDD0
� dD ð6Þ
where N is the number of the data points in a diffusion trajec-tory, D0 is the mean diffusion coefficient, and D is the experi-mentally obtained diffusion coefficient for an individualtrajectory. For this calculation, the experimentally obtained tra-jectories were all cut such that they contained ten data points(i.e., N = 10). The D0 value for the calculation was determinedby the CDF analysis of the diffusion data (the D value ineqn (1)).
Gaussian distribution model. When the diffusion isdescribed by multiple modes in which the D value distributionis described by a Gaussian, the statistical probability distri-bution was calculated using the following equation,25
p Dð Þ ¼ð10f ðDÞ 1
N � 1ð Þ!ND0
� N
DN�1 exp�NDD0
� dD ð7Þ
where f (D) denotes probability distribution of D determined bythe CDF analysis of the diffusion data using eqn (2) and (3). D0
was also determined by fitting the CDFs with eqn (2) and (3).Double Gaussian model. When the diffusion is described
by multiple diffusion modes in which the D value distributionis described by multiple Gaussian, the statistical probabilitydistribution was calculated using the following equation,
p Dð Þ ¼Xð1
0f Dj� � 1
N � 1ð Þ!ND0j
� N
DjN�1 exp
�NDj
D0j
� dDj ð8Þ
where f (Dj) denotes probability distribution of the jth com-ponent of D (Dj) determined by the CDF analysis of thediffusion data using eqn (4) and (5). D0j is the mean diffusioncoefficient of the jth component determined by fitting theCDFs with eqn (4) and (5).
Results and discussion
Absorption and fluorescence spectra of 1 and 2a + 2b in THFare virtually identical (Fig. 2), with absorption and fluo-rescence maxima at 523 and 532 nm, respectively. Fluo-
Polymer Chemistry Paper
This journal is © The Royal Society of Chemistry 2015 Polym. Chem., 2015, 6, 4109–4115 | 4111
Publ
ishe
d on
21
Apr
il 20
15. D
ownl
oade
d by
Tok
yo I
nstit
ute
of T
echn
olog
y on
26/
05/2
015
23:5
8:33
. View Article Online
rescence quantum yields of 1 (0.46 in THF) and 2a + 2b (0.52in THF) are comparable to that of a precursor perylenediimide derivative (0.54 in ethanol).23 The results confirm thatthe poly(THF) chains have a minimum effect on the fluo-rescence properties of the fluorophore.
Fig. 3 shows single-molecule fluorescence images of 1(Fig. 3(a)) and 2a + 2b (Fig. 3(b)) in the melt of the linear poly-(THF) matrix recorded at 303 K. A bright fluorescence of asingle perylene diimide fluorophore incorporated into thechain was observed which confirmed that the centre-of-massdiffusion of individual polymer molecules in the melt wasdirectly visualized. The spatial locations of the molecule ineach image were determined by fitting the image to a two-dimensional Gaussian function (see the Experimental section).Examples of the diffusion trajectories obtained by the imageanalysis are shown in Fig. 3(a) and (b) in yellow. The diffusioncoefficients of each molecule determined by the MSD analysisof the diffusion trajectories23 are plotted in frequency histo-grams (Fig. 4 grey bars). The D distributions obtained in Fig. 4are much broader than those calculated theoretically for ahomogeneous diffusion of the polymer chains due to the stat-istical error of the analysis of the diffusion trajectories (Fig. 4green lines, see the Experimental section: Statistical prob-
ability distribution of the diffusion coefficient – homogeneousdiffusion model), suggesting heterogeneous diffusion of 1 and2a + 2b in the melt state. Similar heterogeneous diffusion hasbeen observed for a linear and mono-cyclic poly(THF) in themelt state in the previous study.25
The diffusion mode of 1 and 2a + 2b was further analysedby the cumulative distribution functions (CDFs), P (r2, iΔt ).32
A single-exponential and multi-exponential decaying behaviourof CDFs in the form of 1-P corresponds to a single-mode andmulti-mode diffusion, respectively (see the Experimentalsection: Cumulative distribution function analysis). The CDFsobtained for 1 and 2a + 2b show multi-exponential decayingbehaviour (Fig. 5(a) and (b)). The results demonstrate clearlythe heterogeneous diffusion of 1 and 2a + 2b in the melt state.The diffusion of the linear and mono-cyclic poly(THF)s waswell-described by a broad and continuous distribution of thediffusion coefficient of each polymer chain due to the differentnumbers of entanglement in each polymer chain.25 The CDFsobtained for 1 were fitted well by this model (Fig. 5(a), see theExperimental section: Cumulative distribution function analy-sis – Gaussian distribution model). The frequency histogramof the D values obtained from 1 was also reasonably repro-duced by the model (Fig. 4(a) red line, see the Experimentalsection: Statistical probability distribution of diffusion coeffi-cient – Gaussian diffusion model). Furthermore, the D valuedetermined by the CDF coefficients (D = 0.125 μm2 s−1, Fig. 5(c))is in good agreement with the median of the D distributionobtained in the MSD analysis (D = 0.133 μm2 s−1, Fig. 4(a)). Allthese results strongly suggest that the 4-armed star polymer (1)shows broad and continuous distribution of the diffusioncoefficient in the melt state that is described by a Gaussianfunction.
The mean diffusion coefficient of the 4-armed star polymer(1) in the melt state (D = 0.133 μm2 s−1) is slower than that ofthe linear (i.e., 2-armed) polymer (D = 0.224 μm2 s−1) with asimilar arm length reported previously. Although theoreticaldescription of the diffusion behaviour of those polymers basedon the reptation model is not straightforward due to the rela-tively small number of the chain interaction in each arm, thedifference in the mean D values can be interpreted by the arm-number dependent diffusion of branched polymers.5
In contrast to the 4-armed star polymer (1), the diffusionmode of the isomeric dicyclic 8-shaped polymer (2a + 2b)cannot be described by the single Gaussian distributionmodel. Although the CDFs were fitted well by the single Gaus-sian model (see Fig. S1†), the frequency histogram of the Dvalues showed systematic deviation from the D distribution cal-culated theoretically based on the CDF analysis (Fig. 4(b) redline, see the Experimental section: Statistical probability distri-bution of diffusion coefficient – Gaussian diffusion model).Moreover, the D value determined by the CDF coefficients (D =0.089 μm2 s−1, Fig. S1†) is not in good agreement with themedian of the D distribution obtained in the MSD analysis(D = 0.156 μm2 s−1, Fig. 4(b)). These results suggest that thesingle Gaussian distribution model does not properly describethe diffusion of 2a + 2b in the melt state.
Fig. 2 Absorption (solid lines) and fluorescence (broken line) spectra of1 (red lines) and 2a + 2b (blue lines) in THF. The excitation wavelength ofthe fluorescence spectra was 488 nm.
Fig. 3 Single-molecule fluorescence images of (a) 1 and (b) 2a + 2beach mixed with linear poly(THF) melt. The yellow lines show diffusiontrajectories. Scale bar = 0.5 μm.
Paper Polymer Chemistry
4112 | Polym. Chem., 2015, 6, 4109–4115 This journal is © The Royal Society of Chemistry 2015
Publ
ishe
d on
21
Apr
il 20
15. D
ownl
oade
d by
Tok
yo I
nstit
ute
of T
echn
olog
y on
26/
05/2
015
23:5
8:33
. View Article Online
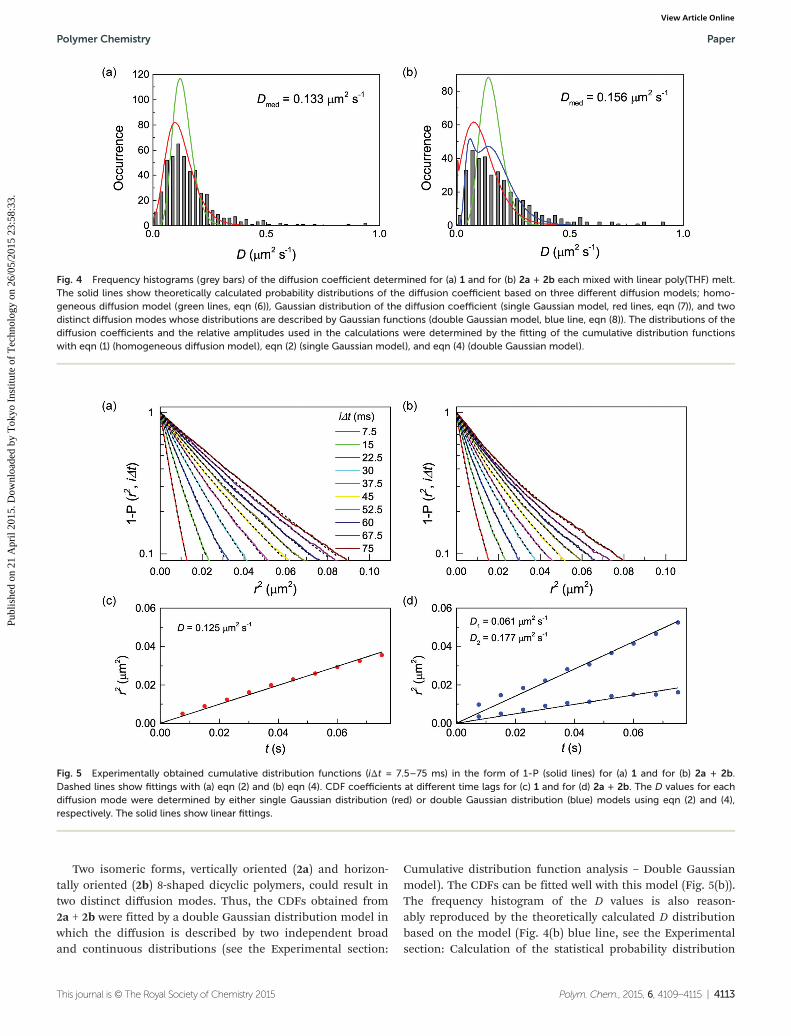
Two isomeric forms, vertically oriented (2a) and horizon-tally oriented (2b) 8-shaped dicyclic polymers, could result intwo distinct diffusion modes. Thus, the CDFs obtained from2a + 2b were fitted by a double Gaussian distribution model inwhich the diffusion is described by two independent broadand continuous distributions (see the Experimental section:
Cumulative distribution function analysis – Double Gaussianmodel). The CDFs can be fitted well with this model (Fig. 5(b)).The frequency histogram of the D values is also reason-ably reproduced by the theoretically calculated D distributionbased on the model (Fig. 4(b) blue line, see the Experimentalsection: Calculation of the statistical probability distribution
Fig. 4 Frequency histograms (grey bars) of the diffusion coefficient determined for (a) 1 and for (b) 2a + 2b each mixed with linear poly(THF) melt.The solid lines show theoretically calculated probability distributions of the diffusion coefficient based on three different diffusion models; homo-geneous diffusion model (green lines, eqn (6)), Gaussian distribution of the diffusion coefficient (single Gaussian model, red lines, eqn (7)), and twodistinct diffusion modes whose distributions are described by Gaussian functions (double Gaussian model, blue line, eqn (8)). The distributions of thediffusion coefficients and the relative amplitudes used in the calculations were determined by the fitting of the cumulative distribution functionswith eqn (1) (homogeneous diffusion model), eqn (2) (single Gaussian model), and eqn (4) (double Gaussian model).
Fig. 5 Experimentally obtained cumulative distribution functions (iΔt = 7.5–75 ms) in the form of 1-P (solid lines) for (a) 1 and for (b) 2a + 2b.Dashed lines show fittings with (a) eqn (2) and (b) eqn (4). CDF coefficients at different time lags for (c) 1 and for (d) 2a + 2b. The D values for eachdiffusion mode were determined by either single Gaussian distribution (red) or double Gaussian distribution (blue) models using eqn (2) and (4),respectively. The solid lines show linear fittings.
Polymer Chemistry Paper
This journal is © The Royal Society of Chemistry 2015 Polym. Chem., 2015, 6, 4109–4115 | 4113
Publ
ishe
d on
21
Apr
il 20
15. D
ownl
oade
d by
Tok
yo I
nstit
ute
of T
echn
olog
y on
26/
05/2
015
23:5
8:33
. View Article Online
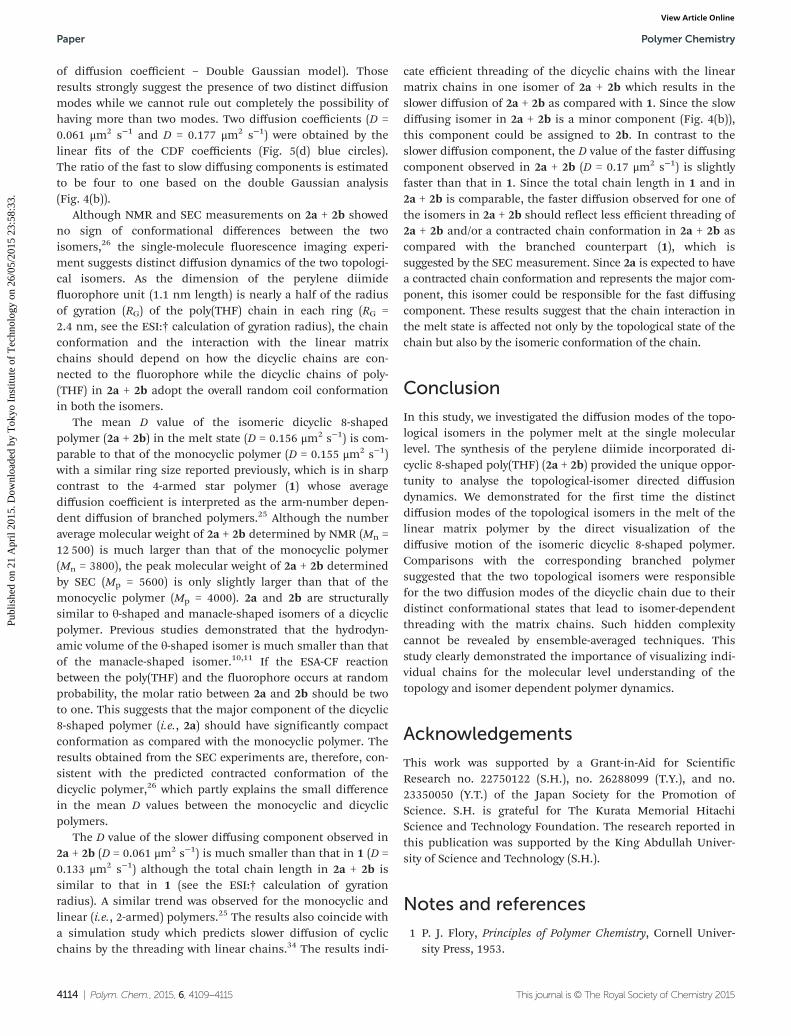
of diffusion coefficient – Double Gaussian model). Thoseresults strongly suggest the presence of two distinct diffusionmodes while we cannot rule out completely the possibility ofhaving more than two modes. Two diffusion coefficients (D =0.061 μm2 s−1 and D = 0.177 μm2 s−1) were obtained by thelinear fits of the CDF coefficients (Fig. 5(d) blue circles).The ratio of the fast to slow diffusing components is estimatedto be four to one based on the double Gaussian analysis(Fig. 4(b)).
Although NMR and SEC measurements on 2a + 2b showedno sign of conformational differences between the twoisomers,26 the single-molecule fluorescence imaging experi-ment suggests distinct diffusion dynamics of the two topologi-cal isomers. As the dimension of the perylene diimidefluorophore unit (1.1 nm length) is nearly a half of the radiusof gyration (RG) of the poly(THF) chain in each ring (RG =2.4 nm, see the ESI:† calculation of gyration radius), the chainconformation and the interaction with the linear matrixchains should depend on how the dicyclic chains are con-nected to the fluorophore while the dicyclic chains of poly-(THF) in 2a + 2b adopt the overall random coil conformationin both the isomers.
The mean D value of the isomeric dicyclic 8-shapedpolymer (2a + 2b) in the melt state (D = 0.156 μm2 s−1) is com-parable to that of the monocyclic polymer (D = 0.155 μm2 s−1)with a similar ring size reported previously, which is in sharpcontrast to the 4-armed star polymer (1) whose averagediffusion coefficient is interpreted as the arm-number depen-dent diffusion of branched polymers.25 Although the numberaverage molecular weight of 2a + 2b determined by NMR (Mn =12 500) is much larger than that of the monocyclic polymer(Mn = 3800), the peak molecular weight of 2a + 2b determinedby SEC (Mp = 5600) is only slightly larger than that of themonocyclic polymer (Mp = 4000). 2a and 2b are structurallysimilar to θ-shaped and manacle-shaped isomers of a dicyclicpolymer. Previous studies demonstrated that the hydrodyn-amic volume of the θ-shaped isomer is much smaller than thatof the manacle-shaped isomer.10,11 If the ESA-CF reactionbetween the poly(THF) and the fluorophore occurs at randomprobability, the molar ratio between 2a and 2b should be twoto one. This suggests that the major component of the dicyclic8-shaped polymer (i.e., 2a) should have significantly compactconformation as compared with the monocyclic polymer. Theresults obtained from the SEC experiments are, therefore, con-sistent with the predicted contracted conformation of thedicyclic polymer,26 which partly explains the small differencein the mean D values between the monocyclic and dicyclicpolymers.
The D value of the slower diffusing component observed in2a + 2b (D = 0.061 μm2 s−1) is much smaller than that in 1 (D =0.133 μm2 s−1) although the total chain length in 2a + 2b issimilar to that in 1 (see the ESI:† calculation of gyrationradius). A similar trend was observed for the monocyclic andlinear (i.e., 2-armed) polymers.25 The results also coincide witha simulation study which predicts slower diffusion of cyclicchains by the threading with linear chains.34 The results indi-
cate efficient threading of the dicyclic chains with the linearmatrix chains in one isomer of 2a + 2b which results in theslower diffusion of 2a + 2b as compared with 1. Since the slowdiffusing isomer in 2a + 2b is a minor component (Fig. 4(b)),this component could be assigned to 2b. In contrast to theslower diffusion component, the D value of the faster diffusingcomponent observed in 2a + 2b (D = 0.17 μm2 s−1) is slightlyfaster than that in 1. Since the total chain length in 1 and in2a + 2b is comparable, the faster diffusion observed for one ofthe isomers in 2a + 2b should reflect less efficient threading of2a + 2b and/or a contracted chain conformation in 2a + 2b ascompared with the branched counterpart (1), which issuggested by the SEC measurement. Since 2a is expected to havea contracted chain conformation and represents the major com-ponent, this isomer could be responsible for the fast diffusingcomponent. These results suggest that the chain interaction inthe melt state is affected not only by the topological state of thechain but also by the isomeric conformation of the chain.
Conclusion
In this study, we investigated the diffusion modes of the topo-logical isomers in the polymer melt at the single molecularlevel. The synthesis of the perylene diimide incorporated di-cyclic 8-shaped poly(THF) (2a + 2b) provided the unique oppor-tunity to analyse the topological-isomer directed diffusiondynamics. We demonstrated for the first time the distinctdiffusion modes of the topological isomers in the melt of thelinear matrix polymer by the direct visualization of thediffusive motion of the isomeric dicyclic 8-shaped polymer.Comparisons with the corresponding branched polymersuggested that the two topological isomers were responsiblefor the two diffusion modes of the dicyclic chain due to theirdistinct conformational states that lead to isomer-dependentthreading with the matrix chains. Such hidden complexitycannot be revealed by ensemble-averaged techniques. Thisstudy clearly demonstrated the importance of visualizing indi-vidual chains for the molecular level understanding of thetopology and isomer dependent polymer dynamics.
Acknowledgements
This work was supported by a Grant-in-Aid for ScientificResearch no. 22750122 (S.H.), no. 26288099 (T.Y.), and no.23350050 (Y.T.) of the Japan Society for the Promotion ofScience. S.H. is grateful for The Kurata Memorial HitachiScience and Technology Foundation. The research reported inthis publication was supported by the King Abdullah Univer-sity of Science and Technology (S.H.).
Notes and references
1 P. J. Flory, Principles of Polymer Chemistry, Cornell Univer-sity Press, 1953.
Paper Polymer Chemistry
4114 | Polym. Chem., 2015, 6, 4109–4115 This journal is © The Royal Society of Chemistry 2015
Publ
ishe
d on
21
Apr
il 20
15. D
ownl
oade
d by
Tok
yo I
nstit
ute
of T
echn
olog
y on
26/
05/2
015
23:5
8:33
. View Article Online
2 P.-G. De Gennes, Scaling Concepts in Polymer Physics,Cornell University Press, 1979.
3 M. Doi and S. F. Edwards, The Theory of Polymer Dynamics,Oxford University Press, 1986.
4 T. C. B. McLeish, Adv. Phys., 2002, 51, 1379–1527.5 M. Rubinstein and R. H. Colby, Polymer Physics, Oxford
University Press, 2003.6 T. McLeish, Science, 2002, 297, 2005–2006.7 S. Honda, T. Yamamoto and Y. Tezuka, J. Am. Chem. Soc.,
2010, 132, 10251–10253.8 S. Honda, T. Yamamoto and Y. Tezuka, Nat. Commun.,
2013, 4, 1574.9 K. Heo, Y. Y. Kim, Y. Kitazawa, M. Kim, K. S. Jin,
T. Yamamoto and M. Ree, ACS Macro Lett., 2014, 3, 233–239.
10 H. Oike, H. Imaizumi, T. Mouri, Y. Yoshioka, A. Uchiboriand Y. Tezuka, J. Am. Chem. Soc., 2000, 122, 9592–9599.
11 Y. Tezuka, A. Tsuchitani, Y. Yoshioka and H. Oike, Macro-molecules, 2003, 36, 65–70.
12 J. Klein, Nature, 1978, 271, 143–145.13 L. Leger, H. Hervet and F. Rondelez, Macromolecules, 1981,
14, 1732–1738.14 E. D. Vonmeerwall, E. J. Amis and J. D. Ferry, Macro-
molecules, 1985, 18, 260–266.15 A. Deres, G. A. Floudas, K. Mullen, M. Van der Auweraer,
F. De Schryver, J. Enderlein, H. Uji-i and J. Hofkens, Macro-molecules, 2011, 44, 9703–9709.
16 S. Habuchi, T. Oba and M. Vacha, Phys. Chem. Chem. Phys.,2011, 13, 6970–6976.
17 H. Aoki, K. Mori and S. Ito, Soft Matter, 2012, 8, 4390–4395.18 B. Stempfle, M. Dill, M. J. Winterhalder, K. Mullen and
D. Woll, Polym. Chem., 2012, 3, 2456–2463.
19 B. M. I. Flier, M. C. Baier, J. Huber, K. Mullen, S. Mecking,A. Zumbusch and D. Woll, J. Am. Chem. Soc., 2012, 134,480–488.
20 C. D. Chapman, S. Shanbhag, D. E. Smith andR. M. Robertson-Anderson, Soft Matter, 2012, 8, 9177–9182.
21 C. Q. Yu, J. Guan, K. J. Chen, S. C. Bae and S. Granick, ACSNano, 2013, 7, 9735–9742.
22 M. F. Serag, M. Abadi and S. Habuchi, Nat. Commun., 2014,5, 5123.
23 S. Habuchi, N. Satoh, T. Yamamoto, Y. Tezuka andM. Vacha, Angew. Chem., Int. Ed., 2010, 49, 1418–1421.
24 S. Habuchi, in Topological Polymer Chemistry: Progress ofCyclic Polymers in Syntheses, Properties and Functions, ed.Y. Tezuka, World Scientific, Singapore, 2013, pp. 265–290.
25 S. Habuchi, S. Fujiwara, T. Yamamoto, M. Vacha andY. Tezuka, Anal. Chem., 2013, 85, 7369–7376.
26 S. Fujiwara, T. Yamamoto, Y. Tezuka and S. Habuchi, React.Funct. Polym., 2014, 80, 3–8.
27 K. Adachi, H. Takasugi and Y. Tezuka, Macromolecules,2006, 39, 5585–5588.
28 T. Yamamoto and Y. Tezuka, Polym. Chem., 2011, 2, 1930–1941.29 Y. Tezuka and F. Ohashi, Macromol. Rapid Commun., 2005,
26, 608–612.30 S. Habuchi, S. Onda and M. Vacha, Chem. Commun., 2009,
4868–4870.31 S. Habuchi, S. Onda and M. Vacha, Phys. Chem. Chem.
Phys., 2011, 13, 1743–1753.32 G. J. Schutz, H. Schindler and T. Schmidt, Biophys. J., 1997,
73, 1073–1080.33 M. Vrljic, S. Y. Nishimura, S. Brasselet, W. E. Moerner and
H. M. McConnell, Biophys. J., 2002, 83, 2681–2692.34 Y. B. Yang, Z. Y. Sun, C. L. Fu, L. J. An and Z. G. Wang,
J. Chem. Phys., 2010, 133, 064901.
Polymer Chemistry Paper
This journal is © The Royal Society of Chemistry 2015 Polym. Chem., 2015, 6, 4109–4115 | 4115
Publ
ishe
d on
21
Apr
il 20
15. D
ownl
oade
d by
Tok
yo I
nstit
ute
of T
echn
olog
y on
26/
05/2
015
23:5
8:33
. View Article Online


![arXiv:1002.0926v1 [cond-mat.soft] 4 Feb 2010arXiv:1002.0926v1 [cond-mat.soft] 4 Feb 2010 Self-diffusion and Cooperative Diffusion in Semidilute Polymer Solutions as measured by Fluorescence](https://img.pdfslide.tips/doc/110x75/5f108bff7e708231d449a514/arxiv10020926v1-cond-matsoft-4-feb-2010-arxiv10020926v1-cond-matsoft-4.jpg)


![Japonês para Brasileiros [Susumu Fukuma]](https://img.pdfslide.tips/doc/110x75/579053771a28ab900c8c5e64/japones-para-brasileiros-susumu-fukuma.jpg)

![ISOMER Auto Saved]](https://img.pdfslide.tips/doc/110x75/5571fe0b49795991699a850d/isomer-auto-saved.jpg)