Embed Size (px)
Citation preview
1
INDIA
Institutional Research
Diversified
Initiating Coverage
Sintex Industries Ltd.
Growth story continues
Initiating Coverage Networth Research is also available on Bloomberg and Thomson
Date: 13th May 2011 Analyst: Jinal Savla [email protected]
Tel No.: 022‐30281684
Monolithic business continues to be robust, estimated to grow
at a CAGR of 31% in FY11‐FY13 period.
Pre‐Fab business poised to grow at a CAGR of 16% in the next
two years shunning the de‐growth of the last two years
With growing synergies from the international acquisitions,
Custom Mouldings to get strong impetus (15% CAGR over the
next two years)
Revenues estimated to grow by 20% in the next two years,
EBIDTA margins to remain intact and profits to surge by 21%
CAGR in the FY11‐13 period
Working capital cycle is estimated to improve leading to positive
operating cash flow
Current Valuations compelling at a P/E multiple of 7.5x FY13E
EPS, SOTP TP of Rs. 217/share, upside of 20%
Building Materials to drive the growth: The continued spend by the government on the social infrastructure augurs well for Sintex industries. Both its segment, Pre Fab (primarily finds application in National Health mission and the Sarva Sikshan Abhiyan along with new applications like agri‐sheds, cold chain) and Monolithic (beneficiated by the Indira Awas Yojana, Slum Rehabilitation Programme and the low cost housing programmes of the government) are poised for significant growth opportunities. The business though tough, Sintex has proved his capabilities and continues to be market leader. It is estimated to continue its dream run in Monolithic business with order book growing strong (current Order book 2* FY11 Revenues) giving good visibility. In Pre‐fab, the decline of BT Shelter business (telecom) impacted growth in the last two years. This is likely to change with approvals from new states (Bihar and North‐East India) providing strong growth opportunities for the company.
Synergies to drive the custom moulding business: The recession is behind for both Wausaukee Composites and Nief plastics as witnessed in the strong growth numbers of FY11. Besides, the synergy has also boosted the business for domestic custom moulding as well as Bright Brothers. FY11 saw significant growth for all the acquired companies of Sintex as the companies shared clients and technology. The same is likely to continue going forward auguring well for the company. Domestic sourcing of work for the international clients (like the deal for Schneider) could be worked out with other foreign clients boosting revenues. We estimated this segment to continue to grow at a CAGR of 15% for the next two years.
Rating Buy Target Price ` 217 CMP 180 Upside 20%
Sensex 18,543
Key Data Bloomberg Code SINT IN Reuters Code SNTX.BO NSE Code SINTEX
Current Share o/s (mn) 271.1 Diluted Share o/s (mn) 271.1 Mkt Cap (`bn/$mn) 49.3/1083.3 52 WK H/L (`) 237.1/131 Daily Vol. (3M NSE Avg) 1734712 Face Value (`) 1 Beta 1.12 1 USD/` 45.5
Shareholding Pattern (%) Promoters 35.0 FII 33.3 Others 31.7
Price Performance (%) 1M 6M 1yr
SINTEX 10.0 11.7 18.0 NIFTY ‐3.2 ‐10.6 14.0
Source: Bloomberg; *As on 12th May, 2011
2 Initiating Coverage
Textiles to remain status quo: Increasingly, the share of textiles in the total revenues of the business is estimated to come down as the company focuses its attention to more growth areas. Textiles is estimated to grow at a CAGR of 7% with margins improving to historical levels of ~24‐25%. Sintex being present in the high end fabric for designer houses, it had been impacted by the fall in luxury spending which is estimated to revive partially.
Working capital cycle improving: Sintex had been marred with increasing working capital cycle impacting operating cash flow which had become negative. Increase in loans and advances as the company had to keep money in the escrow account impacted operating cash flows. However this is likely to change though not significantly as the monolithic business continues to be highly working capital intensive. However loans and advances is likely to come back to its historical levels improving the overall cycle to 105 days.
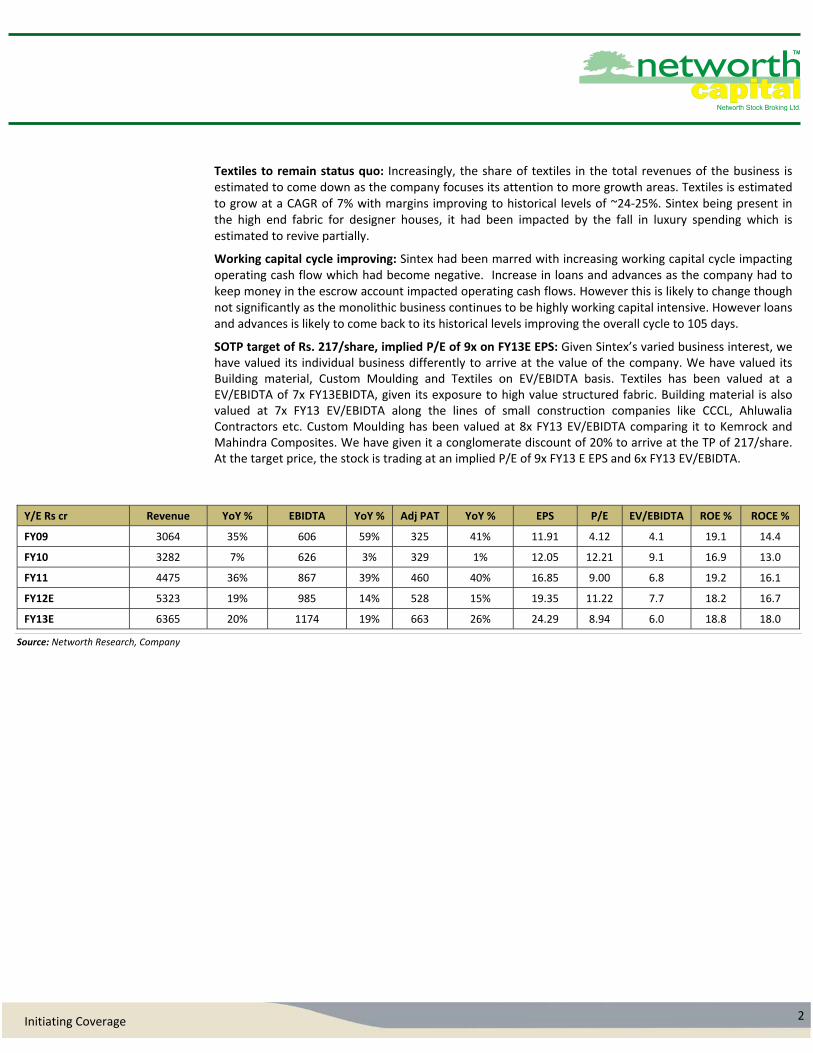
SOTP target of Rs. 217/share, implied P/E of 9x on FY13E EPS: Given Sintex’s varied business interest, we have valued its individual business differently to arrive at the value of the company. We have valued its Building material, Custom Moulding and Textiles on EV/EBIDTA basis. Textiles has been valued at a EV/EBIDTA of 7x FY13EBIDTA, given its exposure to high value structured fabric. Building material is also valued at 7x FY13 EV/EBIDTA along the lines of small construction companies like CCCL, Ahluwalia Contractors etc. Custom Moulding has been valued at 8x FY13 EV/EBIDTA comparing it to Kemrock and Mahindra Composites. We have given it a conglomerate discount of 20% to arrive at the TP of 217/share. At the target price, the stock is trading at an implied P/E of 9x FY13 E EPS and 6x FY13 EV/EBIDTA.
Y/E Rs cr Revenue YoY % EBIDTA YoY % Adj PAT YoY % EPS P/E EV/EBIDTA ROE % ROCE %
FY09 3064 35% 606 59% 325 41% 11.91 4.12 4.1 19.1 14.4
FY10 3282 7% 626 3% 329 1% 12.05 12.21 9.1 16.9 13.0
FY11 4475 36% 867 39% 460 40% 16.85 9.00 6.8 19.2 16.1
FY12E 5323 19% 985 14% 528 15% 19.35 11.22 7.7 18.2 16.7
FY13E 6365 20% 1174 19% 663 26% 24.29 8.94 6.0 18.8 18.0
Source: Networth Research, Company
3 Initiating Coverage
Investment rationale
Building material to drive growth
Pre‐fabrication, Monolithic and water tank constitute Business Materials which has seen steady increase in its share in the total revenues of the company. From being 42% of the total revenues in FY09, it currently stands at 49% of the total revenues and is estimated to grow further. Of the Business materials, Monolithic is the largest segment (60%) and has been registering very strong growth (76% CAGR in FY09‐11 period). Pre Fab constitutes 30% and with the increase in the telecom spend this segment also saw significant growth until FY09. However with the decline in the telecom spend in FY10, this segment saw a significant decline in revenues. However as the company ventured into new states and applications, this segment has seen revival in revenue growth in FY11 (14% growth). Going forward as well, Building material is estimated to be the growth driver for the company.
Both the segments Pre‐fab and Monolithic are beneficiaries of the government’s social infrastructure spend. Government accounts for 70% of the orders in Pre‐fab while the entire Monolithic revenues come from government. Government schemes impacting both the segments
Monolithic:
Urban Housing: JnNURM, Rajiv Awas Yojana (RAY), Integrated Housing and Slum Development
(IHSDP), Sub Mission on Basic Services to Urban Poor (SM‐BSUP)
Rural Housing: Indira Awas Yojana (IAY)
Pre‐Fabrication: Sarva Shiksha Abhiyaan, National Rural Health Mission (NRHM)
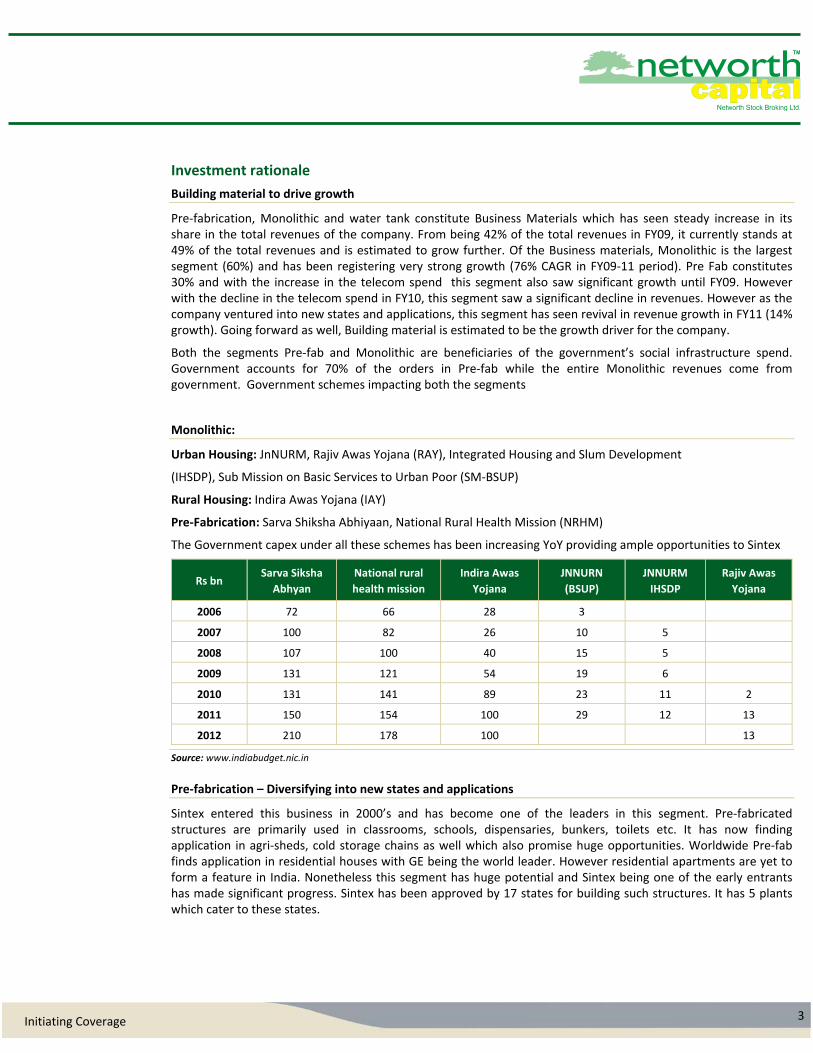
The Government capex under all these schemes has been increasing YoY providing ample opportunities to Sintex
Rs bn Sarva Siksha
Abhyan
National rural
health mission
Indira Awas
Yojana
JNNURN
(BSUP)
JNNURM
IHSDP
Rajiv Awas
Yojana
2006 72 66 28 3
2007 100 82 26 10 5
2008 107 100 40 15 5
2009 131 121 54 19 6
2010 131 141 89 23 11 2
2011 150 154 100 29 12 13
2012 210 178 100 13
Source: www.indiabudget.nic.in
Pre‐fabrication – Diversifying into new states and applications
Sintex entered this business in 2000’s and has become one of the leaders in this segment. Pre‐fabricated structures are primarily used in classrooms, schools, dispensaries, bunkers, toilets etc. It has now finding application in agri‐sheds, cold storage chains as well which also promise huge opportunities. Worldwide Pre‐fab finds application in residential houses with GE being the world leader. However residential apartments are yet to form a feature in India. Nonetheless this segment has huge potential and Sintex being one of the early entrants has made significant progress. Sintex has been approved by 17 states for building such structures. It has 5 plants which cater to these states.
4 Initiating Coverage
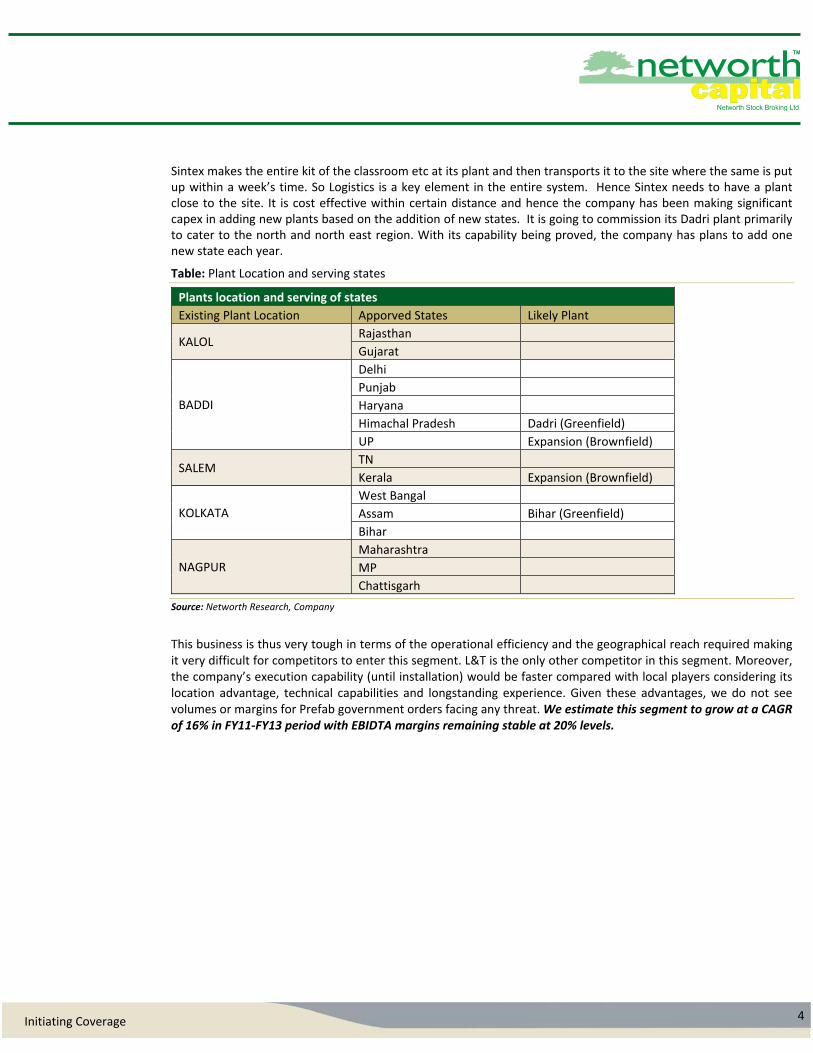
Sintex makes the entire kit of the classroom etc at its plant and then transports it to the site where the same is put up within a week’s time. So Logistics is a key element in the entire system. Hence Sintex needs to have a plant close to the site. It is cost effective within certain distance and hence the company has been making significant capex in adding new plants based on the addition of new states. It is going to commission its Dadri plant primarily to cater to the north and north east region. With its capability being proved, the company has plans to add one new state each year.
Table: Plant Location and serving states
Plants location and serving of states
Existing Plant Location Apporved States Likely Plant
KALOL Rajasthan
Gujarat
BADDI
Delhi
Punjab
Haryana
Himachal Pradesh Dadri (Greenfield)
UP Expansion (Brownfield)
SALEM TN
Kerala Expansion (Brownfield)
KOLKATA
West Bangal
Assam Bihar (Greenfield)
Bihar
NAGPUR
Maharashtra
MP
Chattisgarh
Source: Networth Research, Company
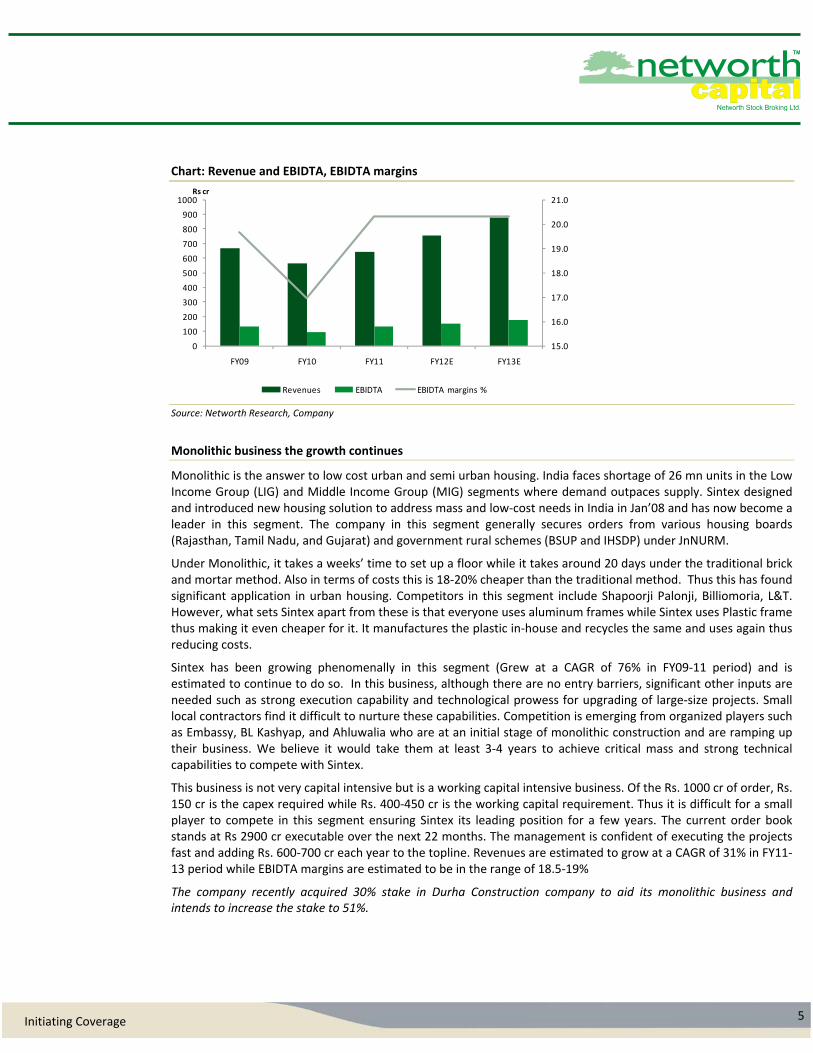
This business is thus very tough in terms of the operational efficiency and the geographical reach required making it very difficult for competitors to enter this segment. L&T is the only other competitor in this segment. Moreover, the company’s execution capability (until installation) would be faster compared with local players considering its location advantage, technical capabilities and longstanding experience. Given these advantages, we do not see volumes or margins for Prefab government orders facing any threat. We estimate this segment to grow at a CAGR of 16% in FY11‐FY13 period with EBIDTA margins remaining stable at 20% levels.
5 Initiating Coverage
Chart: Revenue and EBIDTA, EBIDTA margins
Source: Networth Research, Company
Monolithic business the growth continues
Monolithic is the answer to low cost urban and semi urban housing. India faces shortage of 26 mn units in the Low Income Group (LIG) and Middle Income Group (MIG) segments where demand outpaces supply. Sintex designed and introduced new housing solution to address mass and low‐cost needs in India in Jan’08 and has now become a leader in this segment. The company in this segment generally secures orders from various housing boards (Rajasthan, Tamil Nadu, and Gujarat) and government rural schemes (BSUP and IHSDP) under JnNURM.
Under Monolithic, it takes a weeks’ time to set up a floor while it takes around 20 days under the traditional brick and mortar method. Also in terms of costs this is 18‐20% cheaper than the traditional method. Thus this has found significant application in urban housing. Competitors in this segment include Shapoorji Palonji, Billiomoria, L&T. However, what sets Sintex apart from these is that everyone uses aluminum frames while Sintex uses Plastic frame thus making it even cheaper for it. It manufactures the plastic in‐house and recycles the same and uses again thus reducing costs.
Sintex has been growing phenomenally in this segment (Grew at a CAGR of 76% in FY09‐11 period) and is estimated to continue to do so. In this business, although there are no entry barriers, significant other inputs are needed such as strong execution capability and technological prowess for upgrading of large‐size projects. Small local contractors find it difficult to nurture these capabilities. Competition is emerging from organized players such as Embassy, BL Kashyap, and Ahluwalia who are at an initial stage of monolithic construction and are ramping up their business. We believe it would take them at least 3‐4 years to achieve critical mass and strong technical capabilities to compete with Sintex.
This business is not very capital intensive but is a working capital intensive business. Of the Rs. 1000 cr of order, Rs. 150 cr is the capex required while Rs. 400‐450 cr is the working capital requirement. Thus it is difficult for a small player to compete in this segment ensuring Sintex its leading position for a few years. The current order book stands at Rs 2900 cr executable over the next 22 months. The management is confident of executing the projects fast and adding Rs. 600‐700 cr each year to the topline. Revenues are estimated to grow at a CAGR of 31% in FY11‐13 period while EBIDTA margins are estimated to be in the range of 18.5‐19%
The company recently acquired 30% stake in Durha Construction company to aid its monolithic business and intends to increase the stake to 51%.
15.0
16.0
17.0
18.0
19.0
20.0
21.0
0
100
200
300
400
500
600
700
800
900
1000
FY09 FY10 FY11 FY12E FY13E
Revenues EBIDTA EBIDTA margins %
Rs cr
6 Initiating Coverage
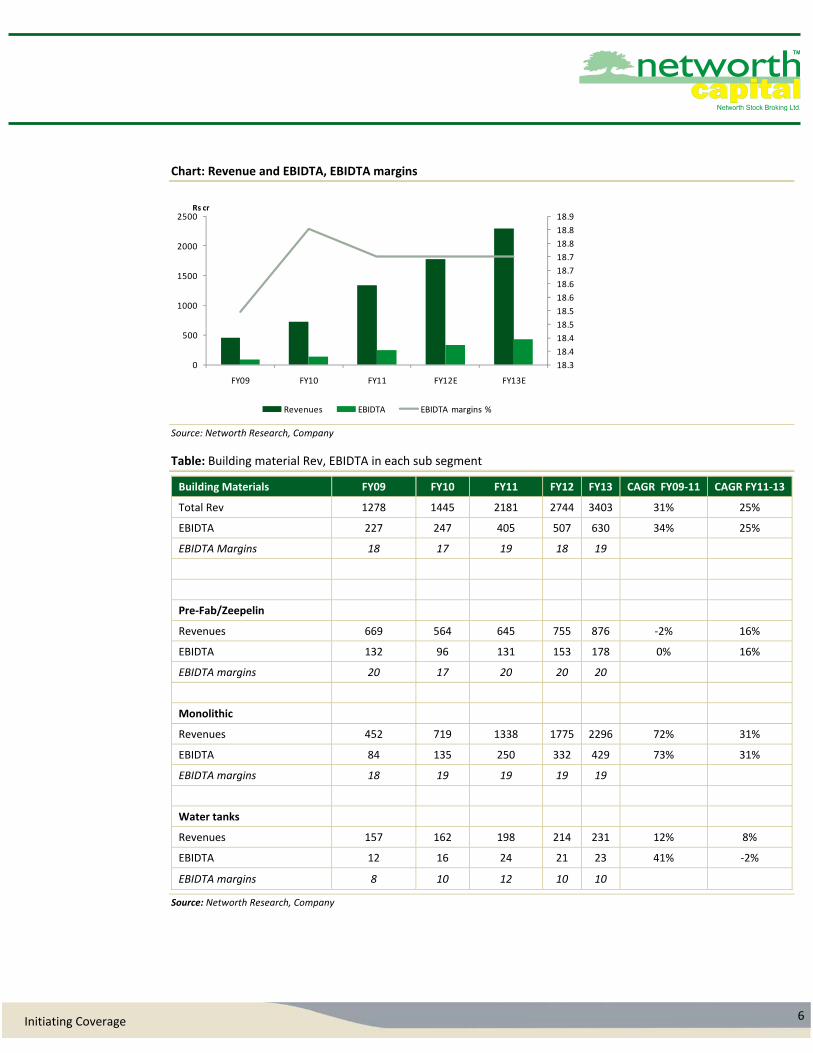
Chart: Revenue and EBIDTA, EBIDTA margins
Source: Networth Research, Company
Table: Building material Rev, EBIDTA in each sub segment
Building Materials FY09 FY10 FY11 FY12 FY13 CAGR FY09‐11 CAGR FY11‐13
Total Rev 1278 1445 2181 2744 3403 31% 25%
EBIDTA 227 247 405 507 630 34% 25%
EBIDTA Margins 18 17 19 18 19
Pre‐Fab/Zeepelin
Revenues 669 564 645 755 876 ‐2% 16%
EBIDTA 132 96 131 153 178 0% 16%
EBIDTA margins 20 17 20 20 20
Monolithic
Revenues 452 719 1338 1775 2296 72% 31%
EBIDTA 84 135 250 332 429 73% 31%
EBIDTA margins 18 19 19 19 19
Water tanks
Revenues 157 162 198 214 231 12% 8%
EBIDTA 12 16 24 21 23 41% ‐2%
EBIDTA margins 8 10 12 10 10
Source: Networth Research, Company
18.3
18.4
18.4
18.5
18.5
18.6
18.6
18.7
18.7
18.8
18.8
18.9
0
500
1000
1500
2000
2500
FY09 FY10 FY11 FY12E FY13E
Revenues EBIDTA EBIDTA margins %
Rs cr
7 Initiating Coverage
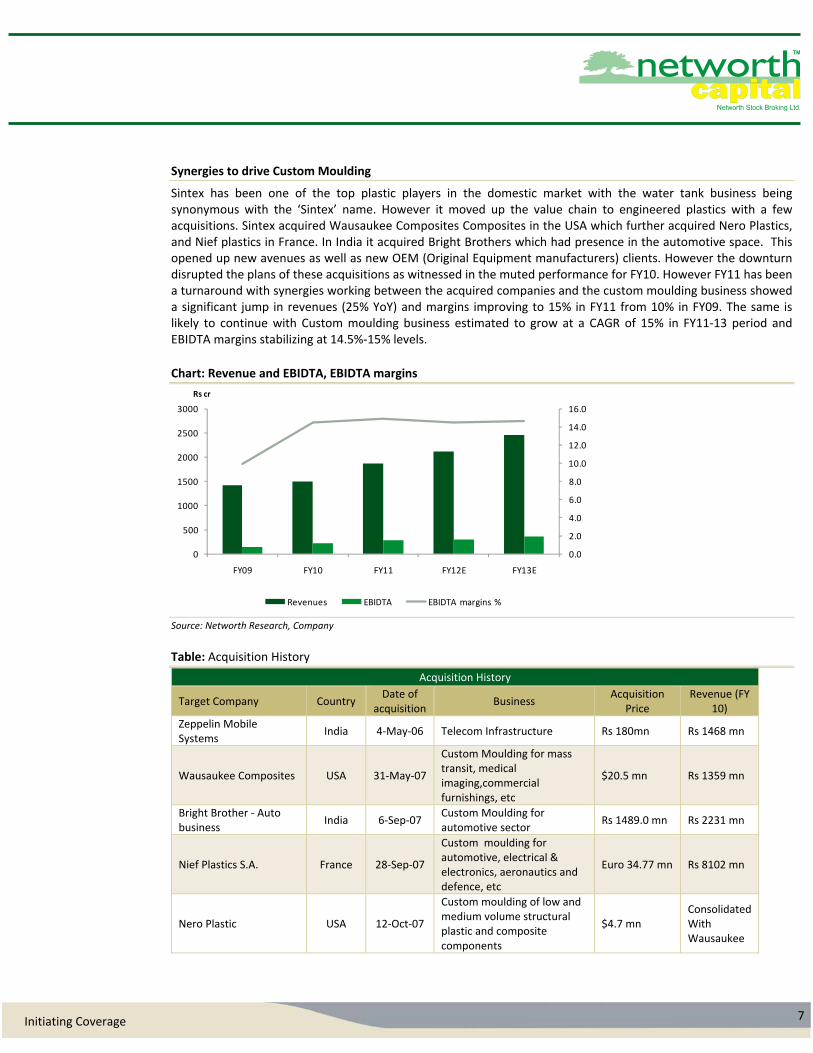
Synergies to drive Custom Moulding
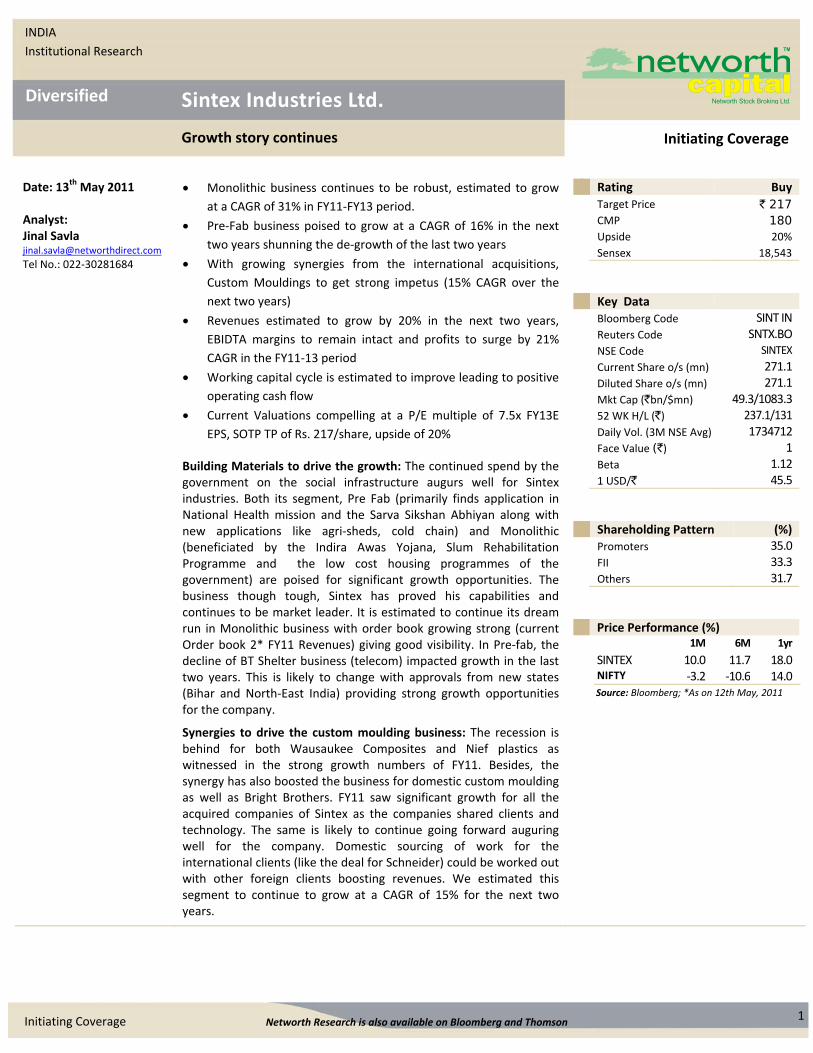
Sintex has been one of the top plastic players in the domestic market with the water tank business being synonymous with the ‘Sintex’ name. However it moved up the value chain to engineered plastics with a few acquisitions. Sintex acquired Wausaukee Composites Composites in the USA which further acquired Nero Plastics, and Nief plastics in France. In India it acquired Bright Brothers which had presence in the automotive space. This opened up new avenues as well as new OEM (Original Equipment manufacturers) clients. However the downturn disrupted the plans of these acquisitions as witnessed in the muted performance for FY10. However FY11 has been a turnaround with synergies working between the acquired companies and the custom moulding business showed a significant jump in revenues (25% YoY) and margins improving to 15% in FY11 from 10% in FY09. The same is likely to continue with Custom moulding business estimated to grow at a CAGR of 15% in FY11‐13 period and EBIDTA margins stabilizing at 14.5%‐15% levels.
Chart: Revenue and EBIDTA, EBIDTA margins
Source: Networth Research, Company Table: Acquisition History
Acquisition History
Target Company Country Date of
acquisition Business
Acquisition Price
Revenue (FY 10)
Zeppelin Mobile Systems
India 4‐May‐06 Telecom Infrastructure Rs 180mn Rs 1468 mn
Wausaukee Composites USA 31‐May‐07
Custom Moulding for mass transit, medical imaging,commercial furnishings, etc
$20.5 mn Rs 1359 mn
Bright Brother ‐ Auto business
India 6‐Sep‐07 Custom Moulding for automotive sector
Rs 1489.0 mn Rs 2231 mn
Nief Plastics S.A. France 28‐Sep‐07
Custom moulding for automotive, electrical & electronics, aeronautics and defence, etc
Euro 34.77 mn Rs 8102 mn
Nero Plastic USA 12‐Oct‐07
Custom moulding of low and medium volume structural plastic and composite components
$4.7 mn Consolidated With Wausaukee
0.0
2.0
4.0
6.0
8.0
10.0
12.0
14.0
16.0
0
500
1000
1500
2000
2500
3000
FY09 FY10 FY11 FY12E FY13E
Revenues EBIDTA EBIDTA margins %
Rs cr
8 Initiating Coverage
Digvijay Group India 16‐Jun‐08 Telecom Support Solutions Rs 645.2 mn Consolidated With Zeppein
Geiger Technik Germany 31‐Jul‐08 Plastic products and solutions for the automotive industry
USD 10mn Written Off
Durha Constructions Pvt Ltd
India 13‐Dec‐10 Construction industry Rs 420 mn
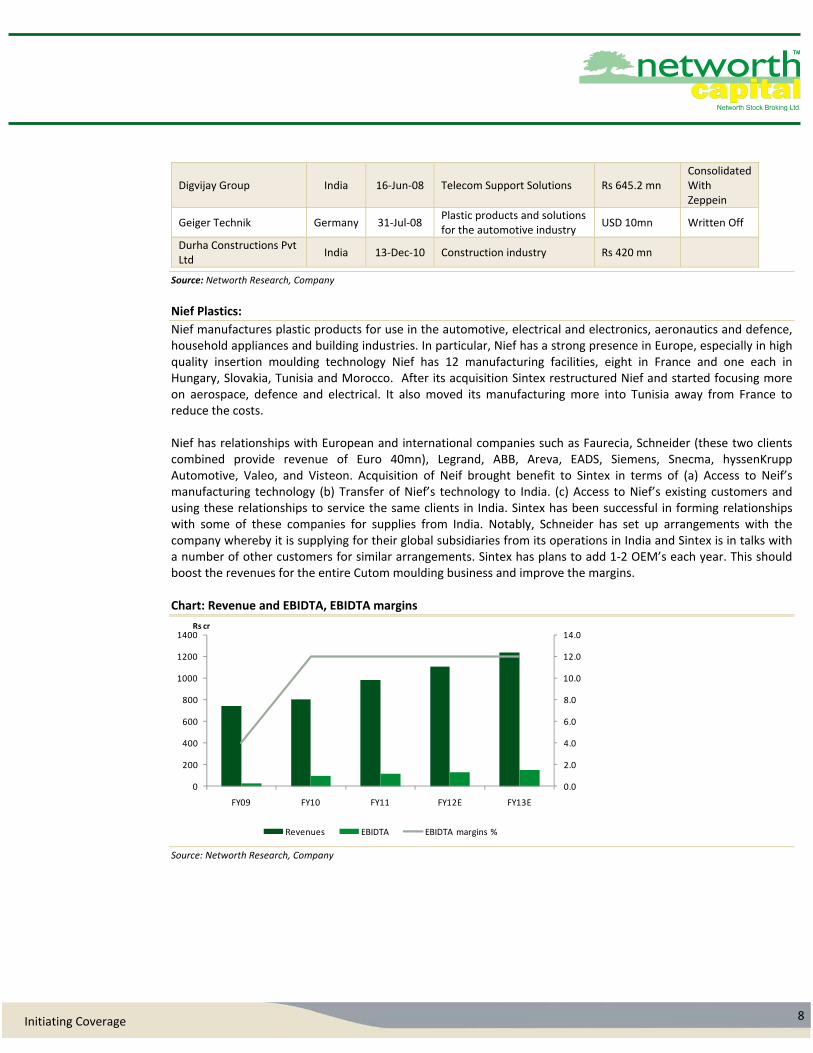
Source: Networth Research, Company Nief Plastics:
Nief manufactures plastic products for use in the automotive, electrical and electronics, aeronautics and defence, household appliances and building industries. In particular, Nief has a strong presence in Europe, especially in high quality insertion moulding technology Nief has 12 manufacturing facilities, eight in France and one each in Hungary, Slovakia, Tunisia and Morocco. After its acquisition Sintex restructured Nief and started focusing more on aerospace, defence and electrical. It also moved its manufacturing more into Tunisia away from France to reduce the costs. Nief has relationships with European and international companies such as Faurecia, Schneider (these two clients combined provide revenue of Euro 40mn), Legrand, ABB, Areva, EADS, Siemens, Snecma, hyssenKrupp Automotive, Valeo, and Visteon. Acquisition of Neif brought benefit to Sintex in terms of (a) Access to Neif’s manufacturing technology (b) Transfer of Nief’s technology to India. (c) Access to Nief’s existing customers and using these relationships to service the same clients in India. Sintex has been successful in forming relationships with some of these companies for supplies from India. Notably, Schneider has set up arrangements with the company whereby it is supplying for their global subsidiaries from its operations in India and Sintex is in talks with a number of other customers for similar arrangements. Sintex has plans to add 1‐2 OEM’s each year. This should boost the revenues for the entire Cutom moulding business and improve the margins. Chart: Revenue and EBIDTA, EBIDTA margins
Source: Networth Research, Company
0.0
2.0
4.0
6.0
8.0
10.0
12.0
14.0
0
200
400
600
800
1000
1200
1400
FY09 FY10 FY11 FY12E FY13E
Revenues EBIDTA EBIDTA margins %
Rs cr
9 Initiating Coverage
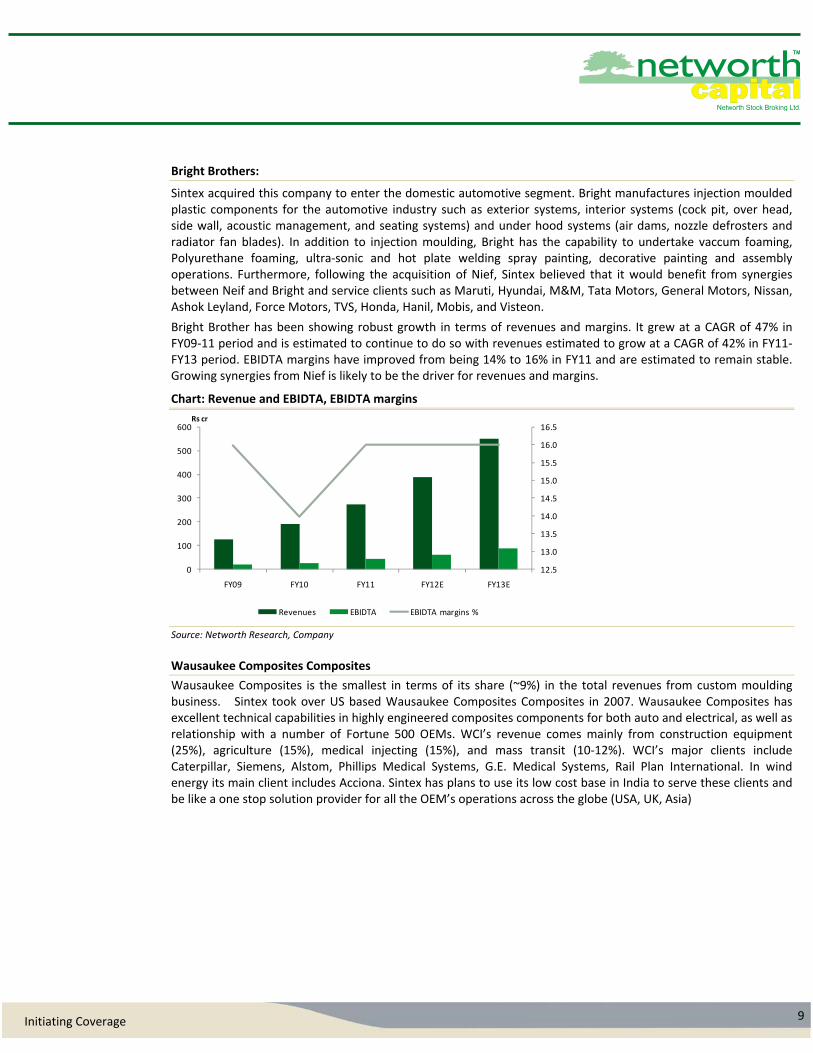
Bright Brothers:
Sintex acquired this company to enter the domestic automotive segment. Bright manufactures injection moulded plastic components for the automotive industry such as exterior systems, interior systems (cock pit, over head, side wall, acoustic management, and seating systems) and under hood systems (air dams, nozzle defrosters and radiator fan blades). In addition to injection moulding, Bright has the capability to undertake vaccum foaming, Polyurethane foaming, ultra‐sonic and hot plate welding spray painting, decorative painting and assembly operations. Furthermore, following the acquisition of Nief, Sintex believed that it would benefit from synergies between Neif and Bright and service clients such as Maruti, Hyundai, M&M, Tata Motors, General Motors, Nissan, Ashok Leyland, Force Motors, TVS, Honda, Hanil, Mobis, and Visteon.
Bright Brother has been showing robust growth in terms of revenues and margins. It grew at a CAGR of 47% in FY09‐11 period and is estimated to continue to do so with revenues estimated to grow at a CAGR of 42% in FY11‐FY13 period. EBIDTA margins have improved from being 14% to 16% in FY11 and are estimated to remain stable. Growing synergies from Nief is likely to be the driver for revenues and margins.
Chart: Revenue and EBIDTA, EBIDTA margins
Source: Networth Research, Company Wausaukee Composites Composites
Wausaukee Composites is the smallest in terms of its share (~9%) in the total revenues from custom moulding business. Sintex took over US based Wausaukee Composites Composites in 2007. Wausaukee Composites has excellent technical capabilities in highly engineered composites components for both auto and electrical, as well as relationship with a number of Fortune 500 OEMs. WCI’s revenue comes mainly from construction equipment (25%), agriculture (15%), medical injecting (15%), and mass transit (10‐12%). WCI’s major clients include Caterpillar, Siemens, Alstom, Phillips Medical Systems, G.E. Medical Systems, Rail Plan International. In wind energy its main client includes Acciona. Sintex has plans to use its low cost base in India to serve these clients and be like a one stop solution provider for all the OEM’s operations across the globe (USA, UK, Asia)
12.5
13.0
13.5
14.0
14.5
15.0
15.5
16.0
16.5
0
100
200
300
400
500
600
FY09 FY10 FY11 FY12E FY13E
Revenues EBIDTA EBIDTA margins %
Rs cr
10 Initiating Coverage
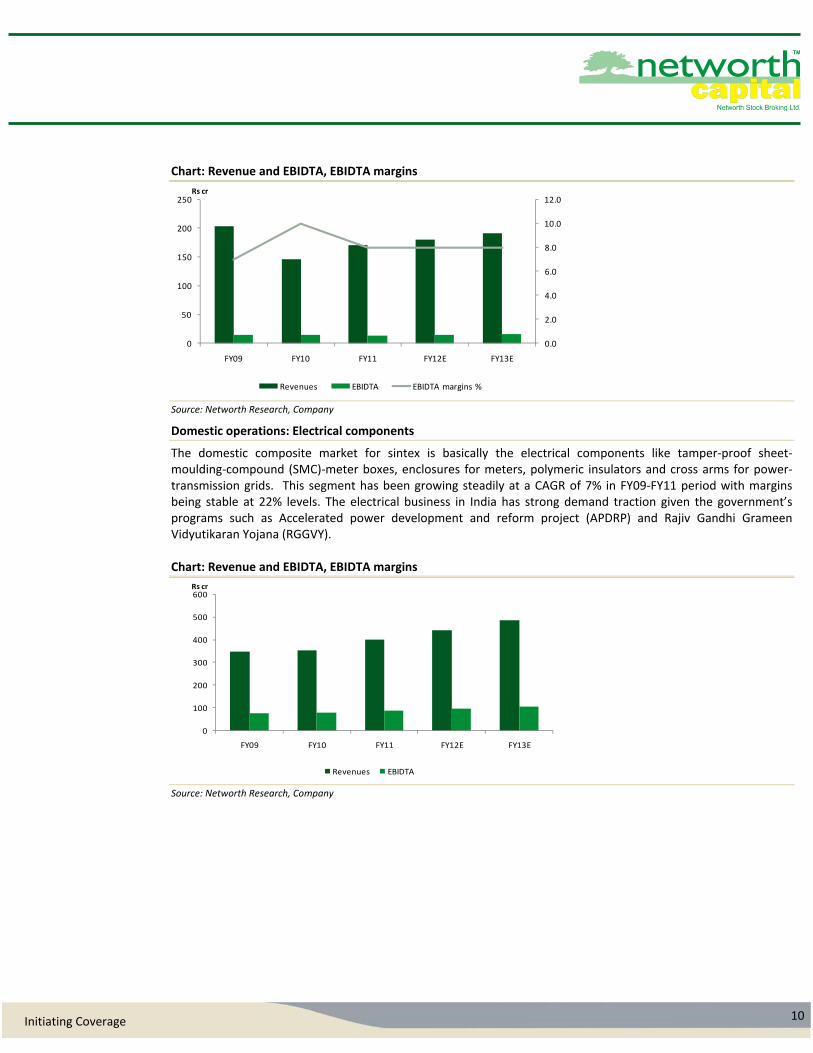
Chart: Revenue and EBIDTA, EBIDTA margins
Source: Networth Research, Company
Domestic operations: Electrical components
The domestic composite market for sintex is basically the electrical components like tamper‐proof sheet‐moulding‐compound (SMC)‐meter boxes, enclosures for meters, polymeric insulators and cross arms for power‐transmission grids. This segment has been growing steadily at a CAGR of 7% in FY09‐FY11 period with margins being stable at 22% levels. The electrical business in India has strong demand traction given the government’s programs such as Accelerated power development and reform project (APDRP) and Rajiv Gandhi Grameen Vidyutikaran Yojana (RGGVY). Chart: Revenue and EBIDTA, EBIDTA margins
Source: Networth Research, Company
0.0
2.0
4.0
6.0
8.0
10.0
12.0
0
50
100
150
200
250
FY09 FY10 FY11 FY12E FY13E
Revenues EBIDTA EBIDTA margins %
Rs cr
0
100
200
300
400
500
600
FY09 FY10 FY11 FY12E FY13E
Revenues EBIDTA
Rs cr
11 Initiating Coverage
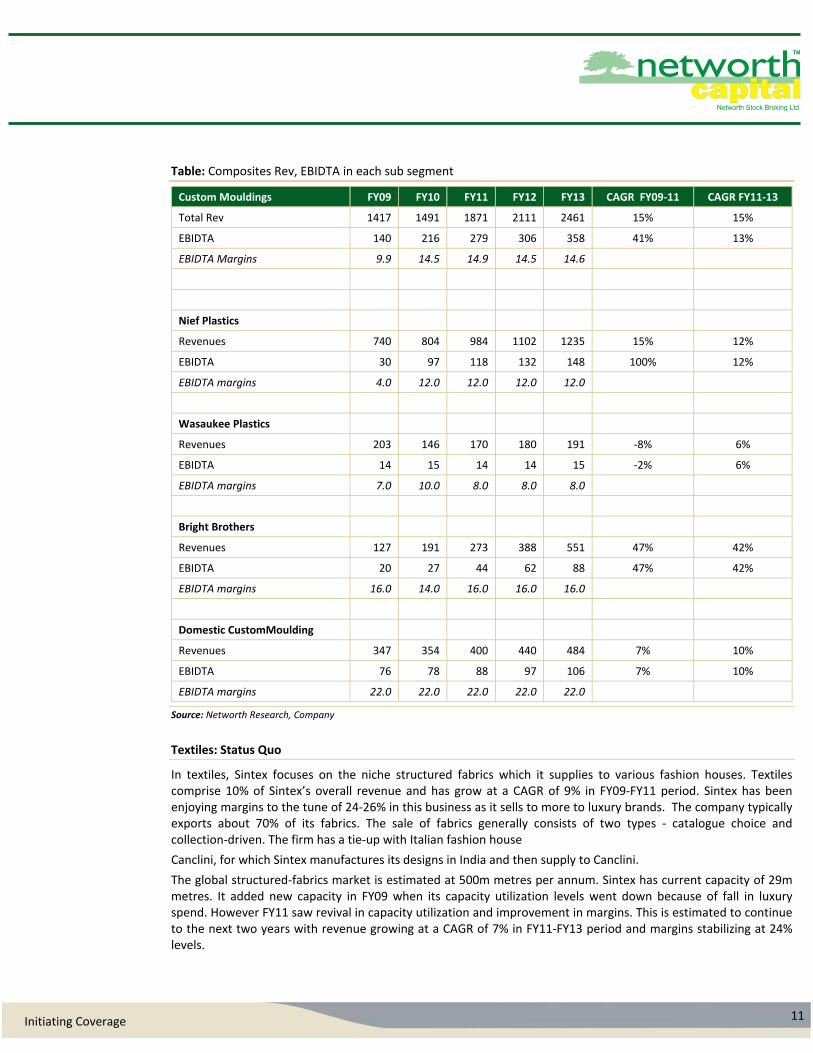
Table: Composites Rev, EBIDTA in each sub segment
Custom Mouldings FY09 FY10 FY11 FY12 FY13 CAGR FY09‐11 CAGR FY11‐13
Total Rev 1417 1491 1871 2111 2461 15% 15%
EBIDTA 140 216 279 306 358 41% 13%
EBIDTA Margins 9.9 14.5 14.9 14.5 14.6
Nief Plastics
Revenues 740 804 984 1102 1235 15% 12%
EBIDTA 30 97 118 132 148 100% 12%
EBIDTA margins 4.0 12.0 12.0 12.0 12.0
Wasaukee Plastics
Revenues 203 146 170 180 191 ‐8% 6%
EBIDTA 14 15 14 14 15 ‐2% 6%
EBIDTA margins 7.0 10.0 8.0 8.0 8.0
Bright Brothers
Revenues 127 191 273 388 551 47% 42%
EBIDTA 20 27 44 62 88 47% 42%
EBIDTA margins 16.0 14.0 16.0 16.0 16.0
Domestic CustomMoulding
Revenues 347 354 400 440 484 7% 10%
EBIDTA 76 78 88 97 106 7% 10%
EBIDTA margins 22.0 22.0 22.0 22.0 22.0
Source: Networth Research, Company
Textiles: Status Quo
In textiles, Sintex focuses on the niche structured fabrics which it supplies to various fashion houses. Textiles comprise 10% of Sintex’s overall revenue and has grow at a CAGR of 9% in FY09‐FY11 period. Sintex has been enjoying margins to the tune of 24‐26% in this business as it sells to more to luxury brands. The company typically exports about 70% of its fabrics. The sale of fabrics generally consists of two types ‐ catalogue choice and collection‐driven. The firm has a tie‐up with Italian fashion house
Canclini, for which Sintex manufactures its designs in India and then supply to Canclini.
The global structured‐fabrics market is estimated at 500m metres per annum. Sintex has current capacity of 29m metres. It added new capacity in FY09 when its capacity utilization levels went down because of fall in luxury spend. However FY11 saw revival in capacity utilization and improvement in margins. This is estimated to continue to the next two years with revenue growing at a CAGR of 7% in FY11‐FY13 period and margins stabilizing at 24% levels.
12 Initiating Coverage
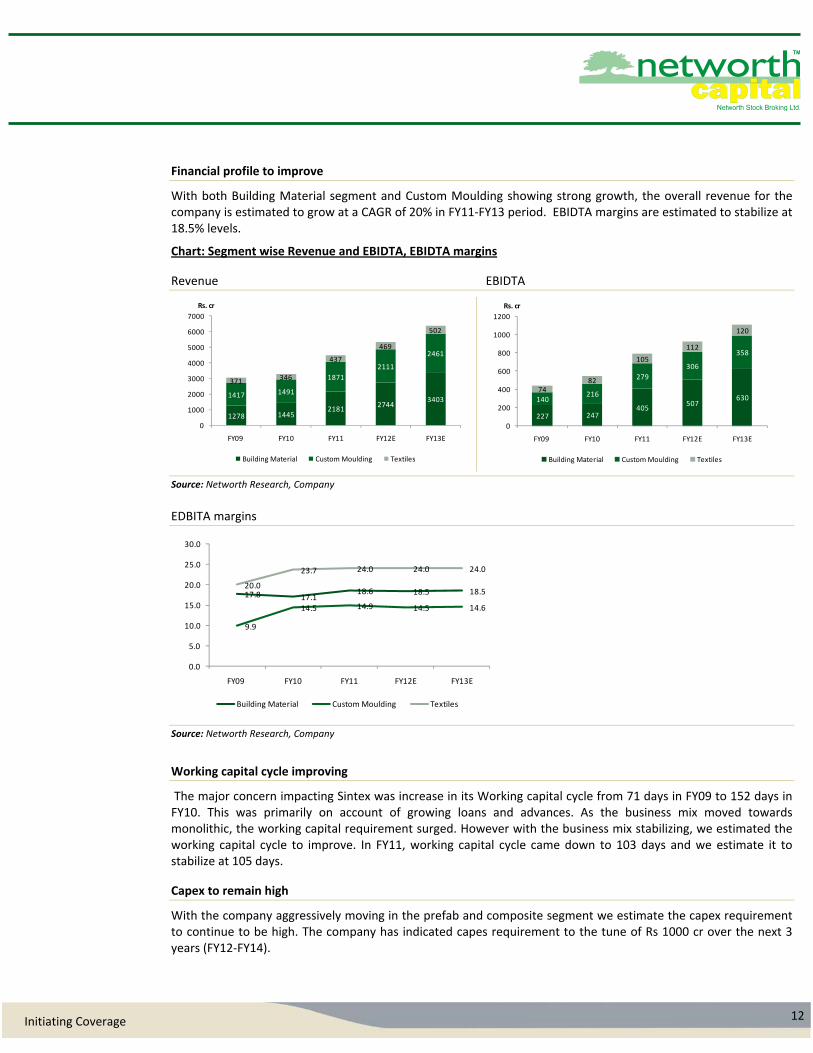
Financial profile to improve
With both Building Material segment and Custom Moulding showing strong growth, the overall revenue for the company is estimated to grow at a CAGR of 20% in FY11‐FY13 period. EBIDTA margins are estimated to stabilize at 18.5% levels.
Chart: Segment wise Revenue and EBIDTA, EBIDTA margins
Revenue EBIDTA
Source: Networth Research, Company
EDBITA margins
Source: Networth Research, Company
Working capital cycle improving
The major concern impacting Sintex was increase in its Working capital cycle from 71 days in FY09 to 152 days in FY10. This was primarily on account of growing loans and advances. As the business mix moved towards monolithic, the working capital requirement surged. However with the business mix stabilizing, we estimated the working capital cycle to improve. In FY11, working capital cycle came down to 103 days and we estimate it to stabilize at 105 days.
Capex to remain high
With the company aggressively moving in the prefab and composite segment we estimate the capex requirement to continue to be high. The company has indicated capes requirement to the tune of Rs 1000 cr over the next 3 years (FY12‐FY14).
1278 14452181
27443403
1417 1491
1871
2111
2461
371 346
437
469
502
0
1000
2000
3000
4000
5000
6000
7000
FY09 FY10 FY11 FY12E FY13E
Rs. cr
Building Material Custom Moulding Textiles
227 247405
507630140
216
279
306
358
7482
105
112
120
0
200
400
600
800
1000
1200
FY09 FY10 FY11 FY12E FY13E
Rs. cr
Building Material Custom Moulding Textiles
17.8 17.118.6 18.5 18.5
9.9
14.5 14.9 14.5 14.6
20.0
23.7 24.0 24.0 24.0
0.0
5.0
10.0
15.0
20.0
25.0
30.0
FY09 FY10 FY11 FY12E FY13E
Building Material Custom Moulding Textiles
13 Initiating Coverage
Debt:Equity to ease
We do not estimate huge debt requirement by Sintex as the casflow from operation is likely to be sufficient to meet its capex requirement. The business is estimated to throw Rs 600‐700 cr of cash in operations. Besides the debt will be more of working capital debt to meet its monolithic business requirement. Hence we see the debt equity to come down to 0.8x
Sintex has USD 225 mn of FCCB’s which the company had issued to meet its acquisition requirement. As of now, USD 165 mn is still left unutilized from the FCCB’s as the company did not conclude one more acquisition. FCCB’s have to be exercised on 31st March 2013 at an exercise price of Rs. 246/share with compulsory conversion at Rs. 315/share. Given the difference in the CMP and the conversion price we do estimate it to be converted. However, given the cash flow position we do not estimate the company to face the problems in repaying the FCCB.
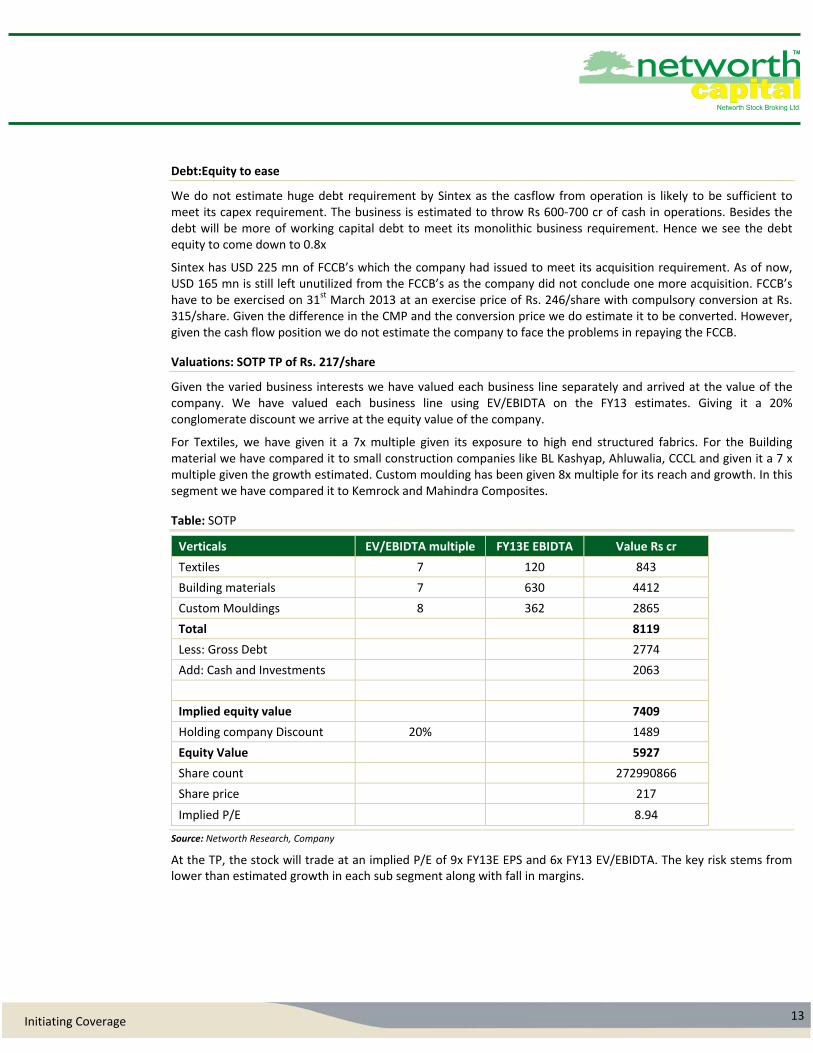
Valuations: SOTP TP of Rs. 217/share
Given the varied business interests we have valued each business line separately and arrived at the value of the company. We have valued each business line using EV/EBIDTA on the FY13 estimates. Giving it a 20% conglomerate discount we arrive at the equity value of the company.
For Textiles, we have given it a 7x multiple given its exposure to high end structured fabrics. For the Building material we have compared it to small construction companies like BL Kashyap, Ahluwalia, CCCL and given it a 7 x multiple given the growth estimated. Custom moulding has been given 8x multiple for its reach and growth. In this segment we have compared it to Kemrock and Mahindra Composites.
Table: SOTP
Verticals EV/EBIDTA multiple FY13E EBIDTA Value Rs cr
Textiles 7 120 843
Building materials 7 630 4412
Custom Mouldings 8 362 2865
Total 8119
Less: Gross Debt 2774
Add: Cash and Investments 2063
Implied equity value 7409
Holding company Discount 20% 1489
Equity Value 5927
Share count 272990866
Share price 217
Implied P/E 8.94
Source: Networth Research, Company
At the TP, the stock will trade at an implied P/E of 9x FY13E EPS and 6x FY13 EV/EBIDTA. The key risk stems from lower than estimated growth in each sub segment along with fall in margins.
14 Initiating Coverage
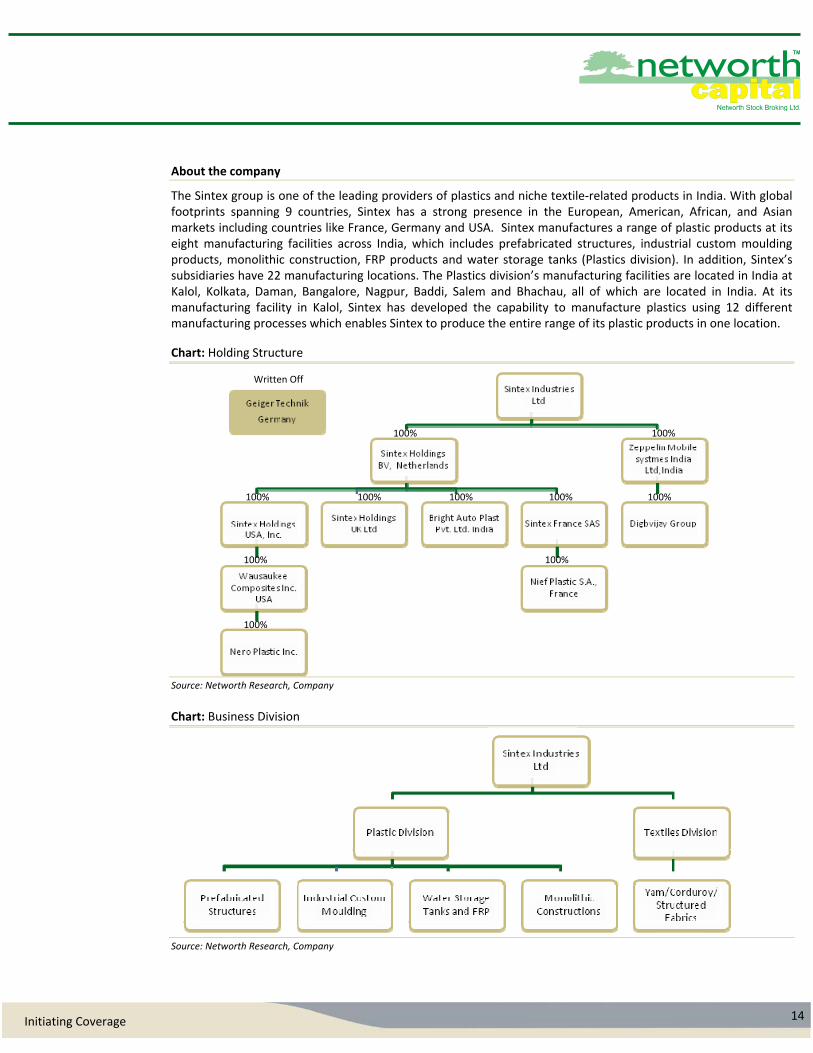
About the company
The Sintex group is one of the leading providers of plastics and niche textile‐related products in India. With global footprints spanning 9 countries, Sintex has a strong presence in the European, American, African, and Asian markets including countries like France, Germany and USA. Sintex manufactures a range of plastic products at its eight manufacturing facilities across India, which includes prefabricated structures, industrial custom moulding products, monolithic construction, FRP products and water storage tanks (Plastics division). In addition, Sintex’s subsidiaries have 22 manufacturing locations. The Plastics division’s manufacturing facilities are located in India at Kalol, Kolkata, Daman, Bangalore, Nagpur, Baddi, Salem and Bhachau, all of which are located in India. At its manufacturing facility in Kalol, Sintex has developed the capability to manufacture plastics using 12 different manufacturing processes which enables Sintex to produce the entire range of its plastic products in one location.
Chart: Holding Structure
Source: Networth Research, Company
Chart: Business Division
Source: Networth Research, Company
100%
Written Off
100%
100%100% 100%100%100%
100%
100%
100%
15 Initiating Coverage
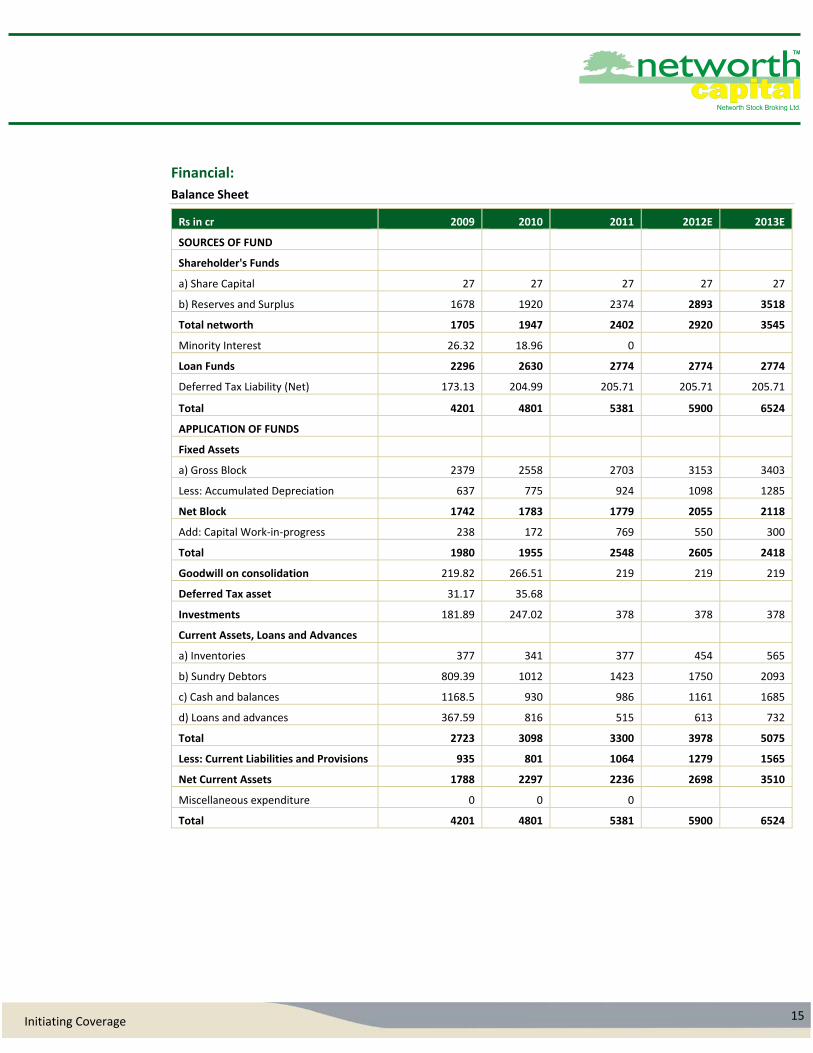
Financial:
Balance Sheet
Rs in cr 2009 2010 2011 2012E 2013E
SOURCES OF FUND
Shareholder's Funds
a) Share Capital 27 27 27 27 27
b) Reserves and Surplus 1678 1920 2374 2893 3518
Total networth 1705 1947 2402 2920 3545
Minority Interest 26.32 18.96 0
Loan Funds 2296 2630 2774 2774 2774
Deferred Tax Liability (Net) 173.13 204.99 205.71 205.71 205.71
Total 4201 4801 5381 5900 6524
APPLICATION OF FUNDS
Fixed Assets
a) Gross Block 2379 2558 2703 3153 3403
Less: Accumulated Depreciation 637 775 924 1098 1285
Net Block 1742 1783 1779 2055 2118
Add: Capital Work‐in‐progress 238 172 769 550 300
Total 1980 1955 2548 2605 2418
Goodwill on consolidation 219.82 266.51 219 219 219
Deferred Tax asset 31.17 35.68
Investments 181.89 247.02 378 378 378
Current Assets, Loans and Advances
a) Inventories 377 341 377 454 565
b) Sundry Debtors 809.39 1012 1423 1750 2093
c) Cash and balances 1168.5 930 986 1161 1685
d) Loans and advances 367.59 816 515 613 732
Total 2723 3098 3300 3978 5075
Less: Current Liabilities and Provisions 935 801 1064 1279 1565
Net Current Assets 1788 2297 2236 2698 3510
Miscellaneous expenditure 0 0 0
Total 4201 4801 5381 5900 6524
16 Initiating Coverage
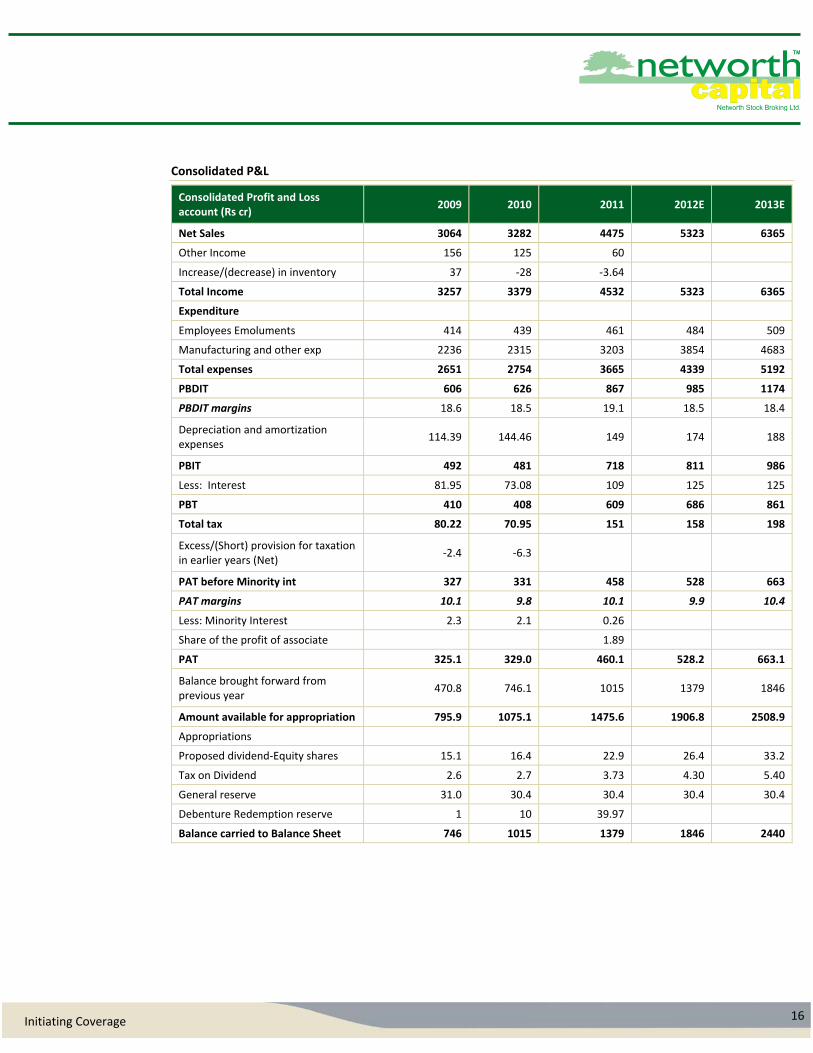
Consolidated P&L
Consolidated Profit and Loss account (Rs cr)
2009 2010 2011 2012E 2013E
Net Sales 3064 3282 4475 5323 6365
Other Income 156 125 60
Increase/(decrease) in inventory 37 ‐28 ‐3.64
Total Income 3257 3379 4532 5323 6365
Expenditure
Employees Emoluments 414 439 461 484 509
Manufacturing and other exp 2236 2315 3203 3854 4683
Total expenses 2651 2754 3665 4339 5192
PBDIT 606 626 867 985 1174
PBDIT margins 18.6 18.5 19.1 18.5 18.4
Depreciation and amortization expenses
114.39 144.46 149 174 188
PBIT 492 481 718 811 986
Less: Interest 81.95 73.08 109 125 125
PBT 410 408 609 686 861
Total tax 80.22 70.95 151 158 198
Excess/(Short) provision for taxation in earlier years (Net)
‐2.4 ‐6.3
PAT before Minority int 327 331 458 528 663
PAT margins 10.1 9.8 10.1 9.9 10.4
Less: Minority Interest 2.3 2.1 0.26
Share of the profit of associate 1.89
PAT 325.1 329.0 460.1 528.2 663.1
Balance brought forward from previous year
470.8 746.1 1015 1379 1846
Amount available for appropriation 795.9 1075.1 1475.6 1906.8 2508.9
Appropriations
Proposed dividend‐Equity shares 15.1 16.4 22.9 26.4 33.2
Tax on Dividend 2.6 2.7 3.73 4.30 5.40
General reserve 31.0 30.4 30.4 30.4 30.4
Debenture Redemption reserve 1 10 39.97
Balance carried to Balance Sheet 746 1015 1379 1846 2440
17 Initiating Coverage
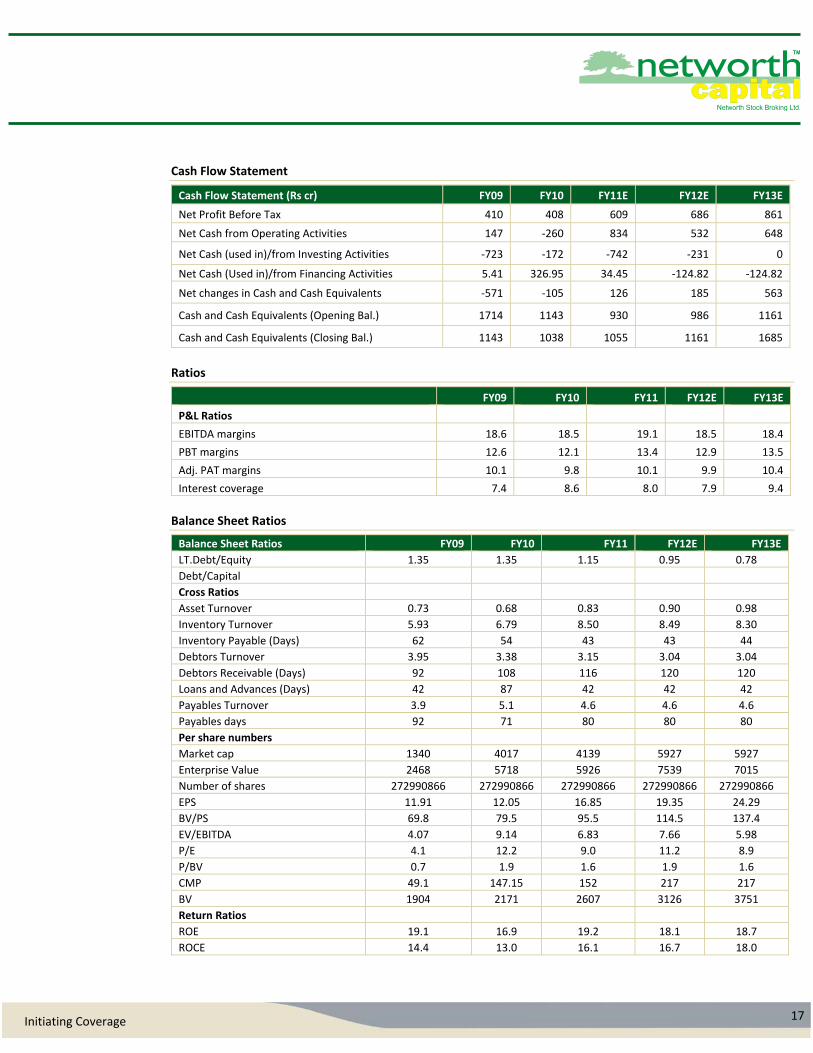
Cash Flow Statement
Cash Flow Statement (Rs cr) FY09 FY10 FY11E FY12E FY13E
Net Profit Before Tax 410 408 609 686 861
Net Cash from Operating Activities 147 ‐260 834 532 648
Net Cash (used in)/from Investing Activities ‐723 ‐172 ‐742 ‐231 0
Net Cash (Used in)/from Financing Activities 5.41 326.95 34.45 ‐124.82 ‐124.82
Net changes in Cash and Cash Equivalents ‐571 ‐105 126 185 563
Cash and Cash Equivalents (Opening Bal.) 1714 1143 930 986 1161
Cash and Cash Equivalents (Closing Bal.) 1143 1038 1055 1161 1685
Ratios
FY09 FY10 FY11 FY12E FY13E
P&L Ratios
EBITDA margins 18.6 18.5 19.1 18.5 18.4
PBT margins 12.6 12.1 13.4 12.9 13.5
Adj. PAT margins 10.1 9.8 10.1 9.9 10.4
Interest coverage 7.4 8.6 8.0 7.9 9.4
Balance Sheet Ratios
Balance Sheet Ratios FY09 FY10 FY11 FY12E FY13E
LT.Debt/Equity 1.35 1.35 1.15 0.95 0.78
Debt/Capital
Cross Ratios
Asset Turnover 0.73 0.68 0.83 0.90 0.98
Inventory Turnover 5.93 6.79 8.50 8.49 8.30
Inventory Payable (Days) 62 54 43 43 44
Debtors Turnover 3.95 3.38 3.15 3.04 3.04
Debtors Receivable (Days) 92 108 116 120 120
Loans and Advances (Days) 42 87 42 42 42
Payables Turnover 3.9 5.1 4.6 4.6 4.6
Payables days 92 71 80 80 80
Per share numbers
Market cap 1340 4017 4139 5927 5927
Enterprise Value 2468 5718 5926 7539 7015
Number of shares 272990866 272990866 272990866 272990866 272990866
EPS 11.91 12.05 16.85 19.35 24.29
BV/PS 69.8 79.5 95.5 114.5 137.4
EV/EBITDA 4.07 9.14 6.83 7.66 5.98
P/E 4.1 12.2 9.0 11.2 8.9
P/BV 0.7 1.9 1.6 1.9 1.6
CMP 49.1 147.15 152 217 217
BV 1904 2171 2607 3126 3751
Return Ratios
ROE 19.1 16.9 19.2 18.1 18.7
ROCE 14.4 13.0 16.1 16.7 18.0
18 Initiating Coverage
Networth Research: E‐mail‐ [email protected]
Jinal Savla Power & Infra. [email protected] 022‐30281684
Minal Dedhia Midcaps [email protected] 011‐47399803
Shruti Raut Power & Infra. (Associate) [email protected] 022‐30281580
Siddharth Deshmukh Telecom (Associate) [email protected] 022‐30281576
Derivatives & Technical Research Akshata Deshmukh AVP Derivatives & Technical’s [email protected] 022‐30286405 Kekin Maru Derivatives Analyst [email protected] 022‐30286406 Akhil Rathi Research Associate ‐ Derivatives [email protected] 022‐30281685
Institution Sales [email protected] Prakash Diwan Head‐ Institutional Business [email protected] 022‐30286408
Viral Malia AVP Institutional Sales [email protected] 022‐30286407
Key to NETWORTH Investment Rankings Buy: Upside by>15, Accumulate: Upside by +5 to 15, Hold: Upside/Downside by ‐5 to +5, Reduce: Downside by 5 to 15, Sell: Downside by>15
Disclaimer: This document has been prepared by Networth Stock Broking Ltd. (NSBL). NSBL is a full service, integrated investment banking, portfolio management and brokerage group. Our research analysts and sales persons provide important input into our investment banking activities. This document does not constitute an offer or solicitation for the purchase or sale of any financial instrument or as an official confirmation of any transaction. The information contained herein is from publicly available data or other sources believed to be reliable, but we do not represent that it is accurate or complete and it should not be relied on as such. NSBL or any of its affiliates shall not be in any way responsible for any loss or damage that may arise to any person from any inadvertent error in the information contained in this report. This document is provided for assistance only and is not intended to be and must not alone be taken as the basis for an investment decision. The user assumes the entire risk of any use made of this information. Each recipient of this document should make such investigation as it deems necessary to arrive at an independent evaluation of an investment in the securities of companies referred to in this document (including the merits and risks involved), and should consult his own advisors to determine the merits and risks of such investment. The investment discussed or views expressed may not be suitable for all investors. We and our affiliates, officers, directors, and employees may: (a) from time to time, have long or short positions in, and buy or sell the securities thereof, of company (ies) mentioned herein or (b) be engaged in any other transaction involving such securities and earn brokerage or other compensation or act as advisor or lender / borrower to such company (ies) or have other potential conflict of interest with respect to any recommendation and related information and opinions. This information is strictly confidential and is being furnished to you solely for your information. This information should not be reproduced or redistributed or passed on directly or indirectly in any form to any other person or published, copied, in whole or in part, for any purpose. This report is not directed or intended for distribution to, or use by, any person or entity who is a citizen or resident of or located in any locality, state, country or other jurisdiction, where such distribution, publication, availability or use would be contrary to law, regulation or which would subject NSBL and affiliates to any registration or licensing requirements within such jurisdiction. The distribution of this document in certain jurisdictions may be restricted by law, and persons in whose possession this document comes, should inform themselves about and observe, any such restrictions. The information given in this document is as of the date of this report and there can be no assurance that future results or events will be consistent with this information. This information is subject to change without any prior notice. NSBL reserves the right to make modifications and alterations to this statement as may be required from time to time. However, NSBL is under no obligation to update or keep the information current. Nevertheless, NSBL is committed to providing independent and transparent recommendation to its client and would be happy to provide any information in response to specific client queries. Neither NSBL nor any of its affiliates, directors, employees, agents or representatives shall be liable for any damages whether direct, indirect, special or consequential including lost revenue or lost profits that may arise from or in connection with the use of the information. The analyst for this report certifies that all of the views expressed in this report accurately reflect his or her personal views about the subject company or companies and its or their securities, and no part of his or her compensation was, is or will be, directly or indirectly related to specific recommendations or views expressed in this report. Analyst holding in stock: no.
Networth Stock Broking Ltd. (www.networthdirect.com)
Regd. Office:‐ 2nd Floor, D. C. Silk Mills Compound, Kondivita Road, Opp J.B. Nagar Market, Andheri (E), Mumbai ‐ 400059. Tel Phone nos.: 022 – 30641600.
Corporate Office: ‐ 4th Floor, B ‐ Block, 430, High Street Phoenix Bldg., Lower Parel, Mumbai ‐ 400013.. Tel no.: 30286390