Embed Size (px)
Citation preview
University of Illinois at Urbana‐Champaign • Metals Processing Simulation Lab • Rui Liu •
ANNUAL REPORT 2012UIUC, August 16, 2012
Slide‐gate Dithering Effects on Transient Flow and Mold Level Fluctuations
R. Liu and B.G. Thomas
Department of Mechanical Science and Engineering ArcelorMittal Global R&DUniversity of Illinois at Urbana‐Champaign at East Chicago
University of Illinois at Urbana-Champaign • Metals Processing Simulation Lab • Rui Liu 2
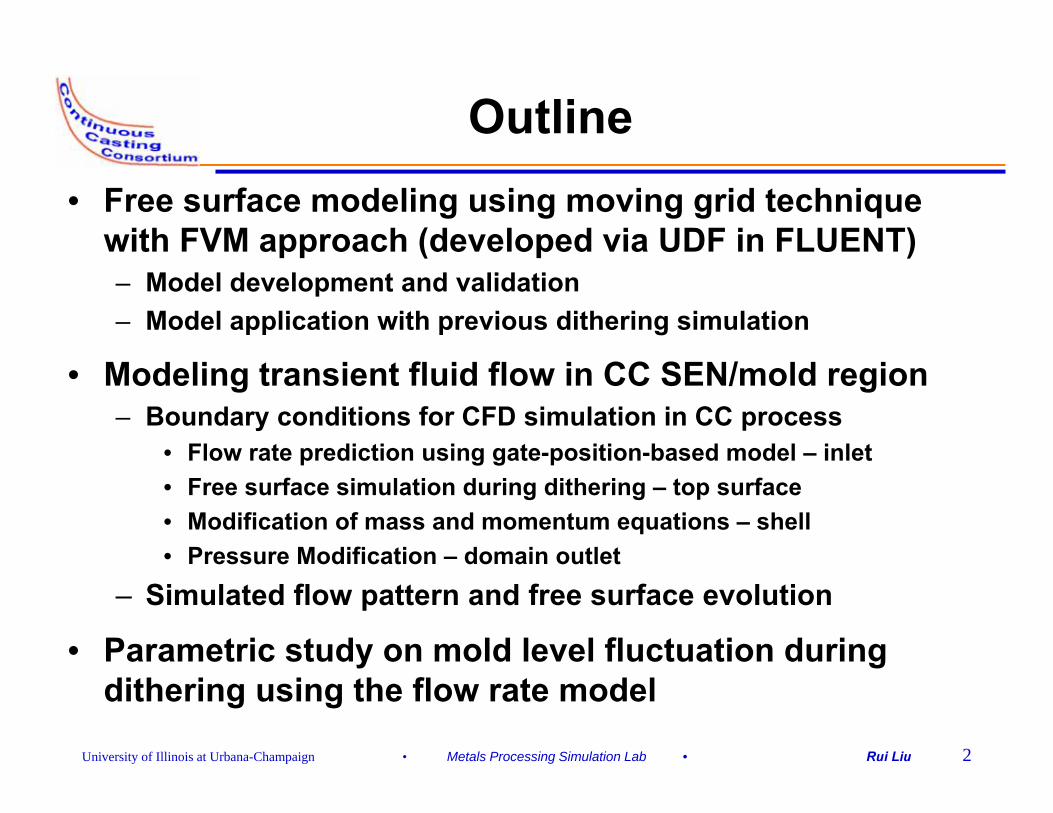
Outline• Free surface modeling using moving grid technique
with FVM approach (developed via UDF in FLUENT)– Model development and validation– Model application with previous dithering simulation
• Modeling transient fluid flow in CC SEN/mold region– Boundary conditions for CFD simulation in CC process
• Flow rate prediction using gate-position-based model – inlet • Free surface simulation during dithering – top surface• Modification of mass and momentum equations – shell • Pressure Modification – domain outlet
– Simulated flow pattern and free surface evolution
• Parametric study on mold level fluctuation during dithering using the flow rate model
University of Illinois at Urbana-Champaign • Metals Processing Simulation Lab • Rui Liu 3
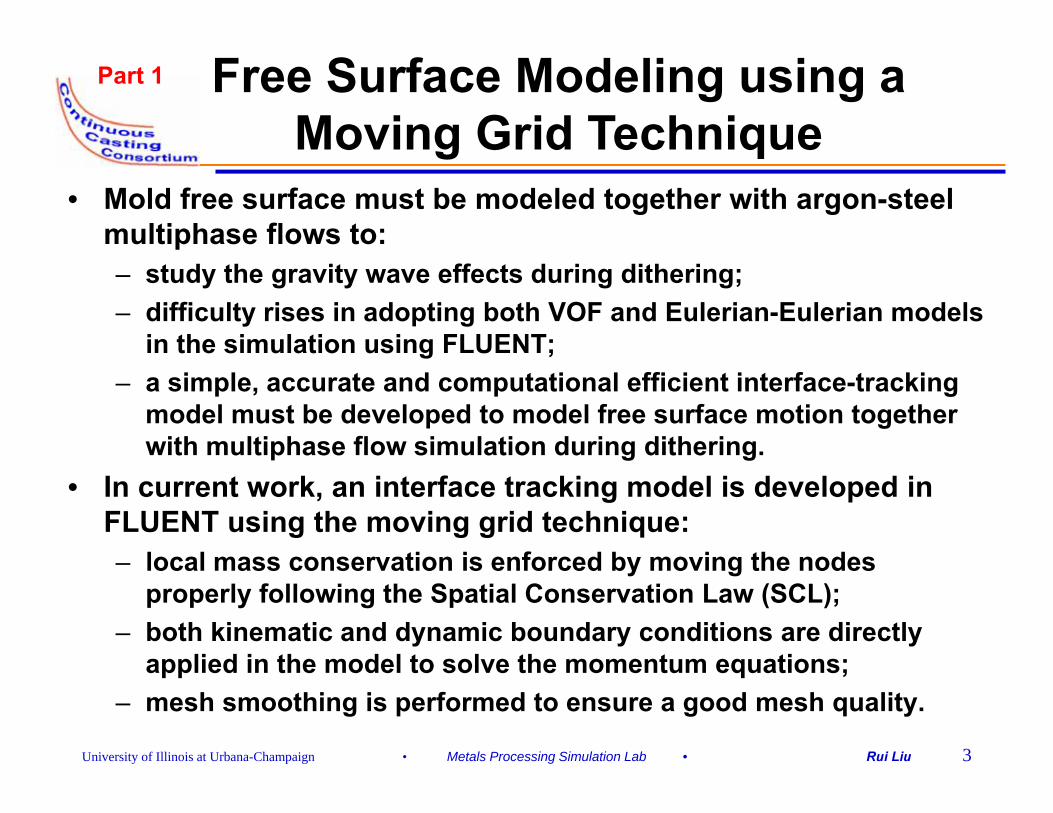
Free Surface Modeling using a Moving Grid Technique
• Mold free surface must be modeled together with argon-steel multiphase flows to:– study the gravity wave effects during dithering;– difficulty rises in adopting both VOF and Eulerian-Eulerian models
in the simulation using FLUENT;– a simple, accurate and computational efficient interface-tracking
model must be developed to model free surface motion together with multiphase flow simulation during dithering.
• In current work, an interface tracking model is developed in FLUENT using the moving grid technique:– local mass conservation is enforced by moving the nodes
properly following the Spatial Conservation Law (SCL);– both kinematic and dynamic boundary conditions are directly
applied in the model to solve the momentum equations;– mesh smoothing is performed to ensure a good mesh quality.
Part 1
University of Illinois at Urbana-Champaign • Metals Processing Simulation Lab • Rui Liu 4
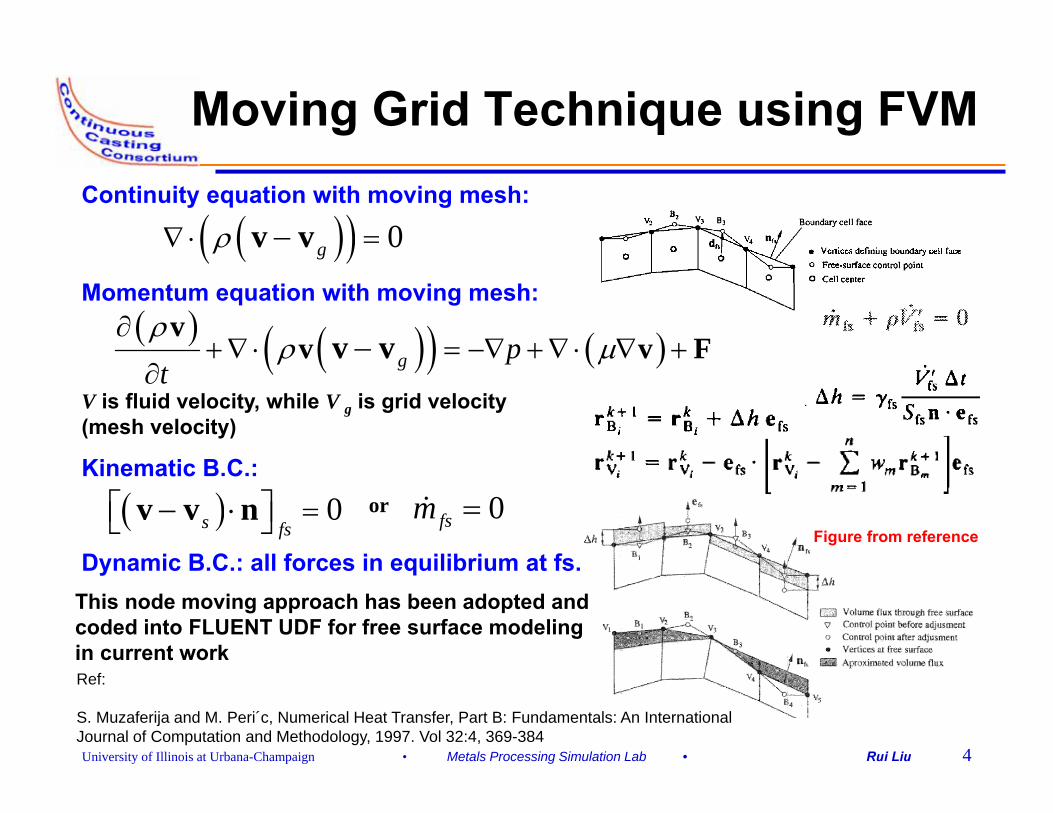
Moving Grid Technique using FVM
Ref:
S. Muzaferija and M. Peri´c, Numerical Heat Transfer, Part B: Fundamentals: An International Journal of Computation and Methodology, 1997. Vol 32:4, 369-384
This node moving approach has been adopted and coded into FLUENT UDF for free surface modeling in current work
( )( ) 0gρ∇ ⋅ =−v vContinuity equation with moving mesh:
Momentum equation with moving mesh:( ) ( )( ) ( )g p
tρ
ρ µ∂
+∇ ⋅ = −∇ +∇ ⋅ ∇ +∂
−v
v v Fv vV is fluid velocity, while V g is grid velocity (mesh velocity)
Kinematic B.C.:
Figure from reference( ) 0s fs
=⎡ ⎤− ⋅⎣ ⎦v v n or 0fsm =
Dynamic B.C.: all forces in equilibrium at fs.
University of Illinois at Urbana-Champaign • Metals Processing Simulation Lab • Rui Liu 5
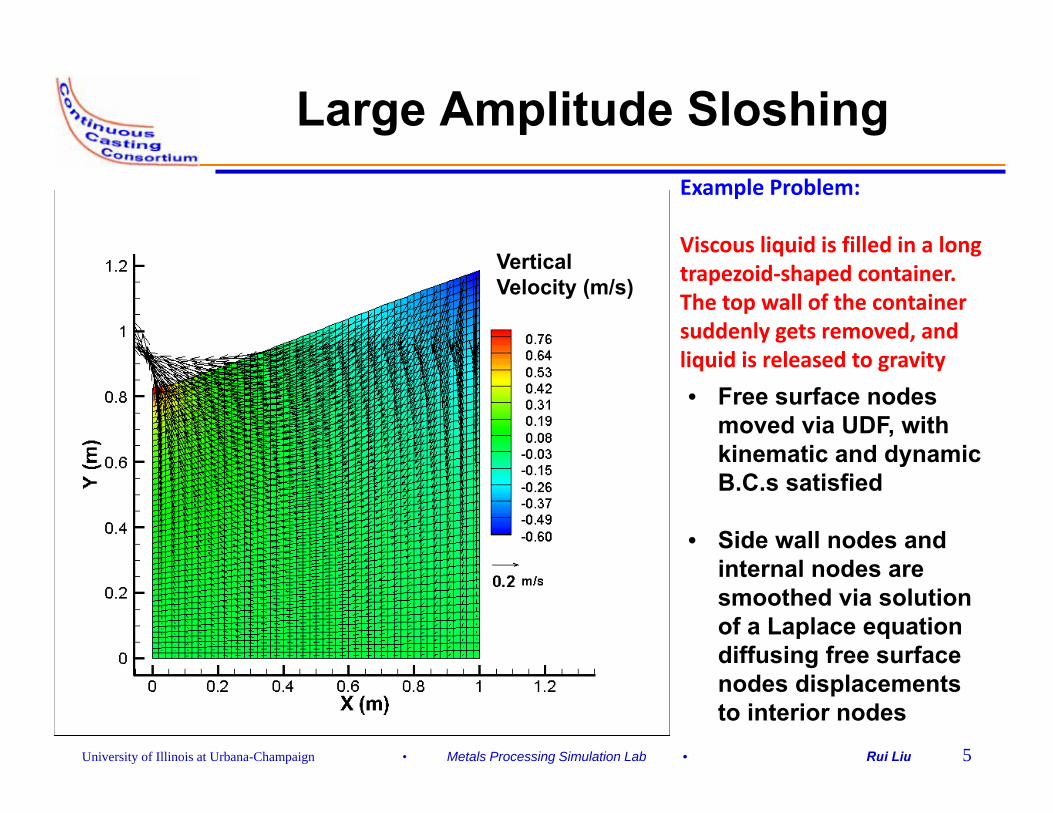
Large Amplitude Sloshing
Vertical Velocity (m/s)
• Free surface nodes moved via UDF, with kinematic and dynamic B.C.s satisfied
• Side wall nodes and internal nodes are smoothed via solution of a Laplace equation diffusing free surface nodes displacements to interior nodes
Example Problem:
Viscous liquid is filled in a long trapezoid‐shaped container. The top wall of the container suddenly gets removed, and liquid is released to gravity
University of Illinois at Urbana-Champaign • Metals Processing Simulation Lab • Rui Liu 6
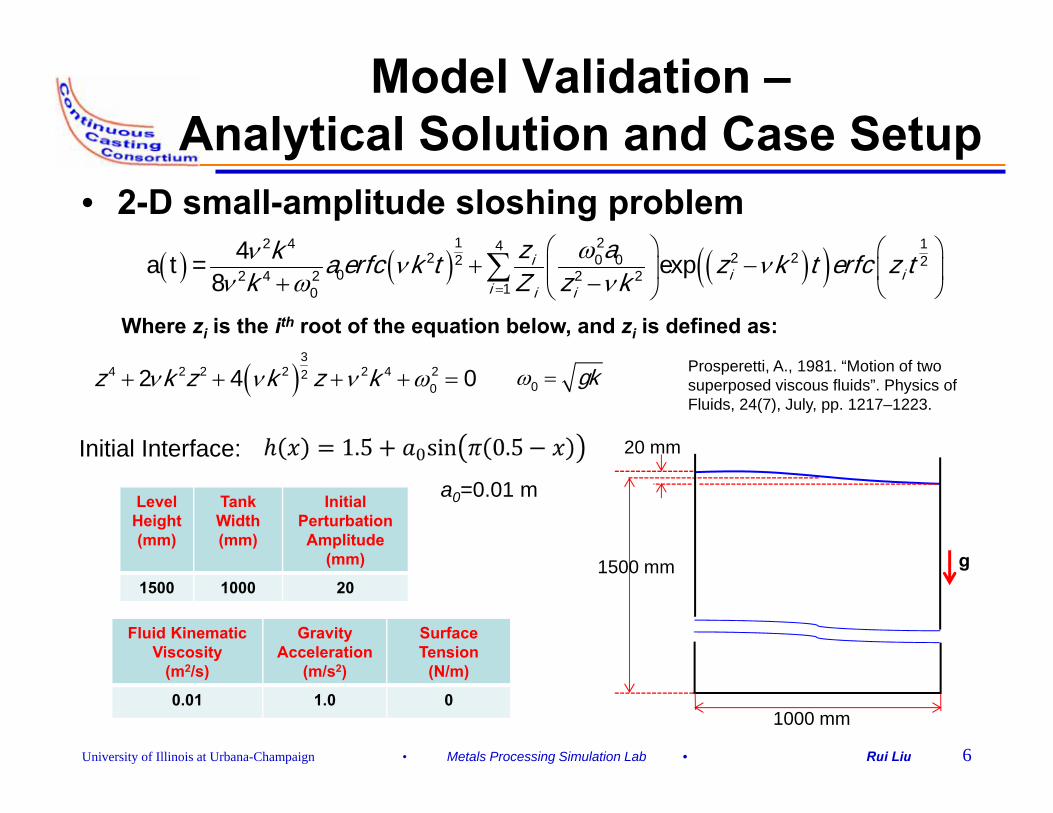
Model Validation –Analytical Solution and Case Setup
• 2-D small-amplitude sloshing problem
Where zi is the ith root of the equation below, and zi is defined as:
( )ν ν ν ω+ + + + =3
4 2 2 2 2 4 2202 4 0z k z k z k
( ) ( ) ( )( )ων ν νν ω ν=
⎛ ⎞ ⎛ ⎞⎜ ⎟ ⎜ ⎟
⎝ ⎠⎝ ⎠+ −
+ −∑1 22 4 14
2 2 20 02 202 4 2 2 2
10
4a t = exp8
ii i
i i i
azk a erfc k t z k t erfc z tk Z z k
Level Height (mm)
Tank Width (mm)
Initial Perturbation Amplitude
(mm)
1500 1000 201500 mm
20 mm
1000 mm
g
Fluid Kinematic Viscosity
(m2/s)
Gravity Acceleration
(m/s2)
Surface Tension
(N/m)
0.01 1.0 0
Initial Interface:
a0=0.01 m
0 gkω =Prosperetti, A., 1981. “Motion of two superposed viscous fluids”. Physics of Fluids, 24(7), July, pp. 1217–1223.
University of Illinois at Urbana-Champaign • Metals Processing Simulation Lab • Rui Liu 7
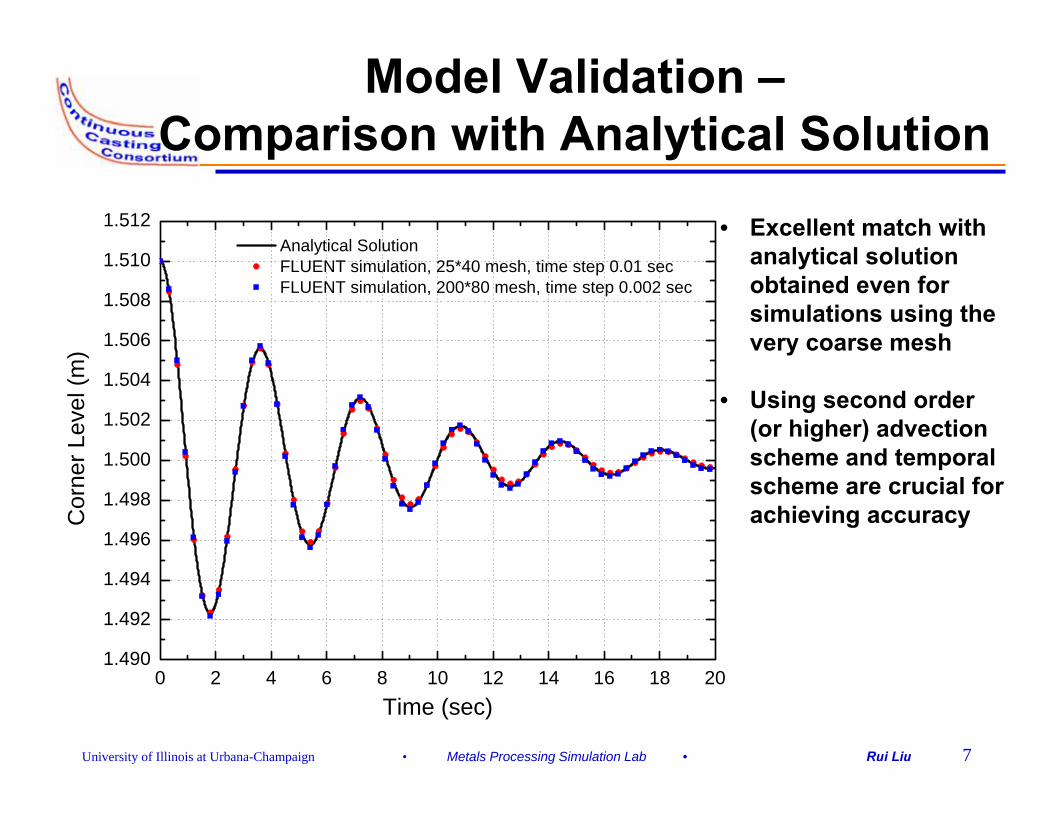
Model Validation –Comparison with Analytical Solution
0 2 4 6 8 10 12 14 16 18 201.490
1.492
1.494
1.496
1.498
1.500
1.502
1.504
1.506
1.508
1.510
1.512
Cor
ner L
evel
(m)
Time (sec)
Analytical Solution FLUENT simulation, 25*40 mesh, time step 0.01 sec FLUENT simulation, 200*80 mesh, time step 0.002 sec
• Excellent match with analytical solution obtained even for simulations using the very coarse mesh
• Using second order (or higher) advection scheme and temporal scheme are crucial for achieving accuracy
University of Illinois at Urbana-Champaign • Metals Processing Simulation Lab • Rui Liu 8
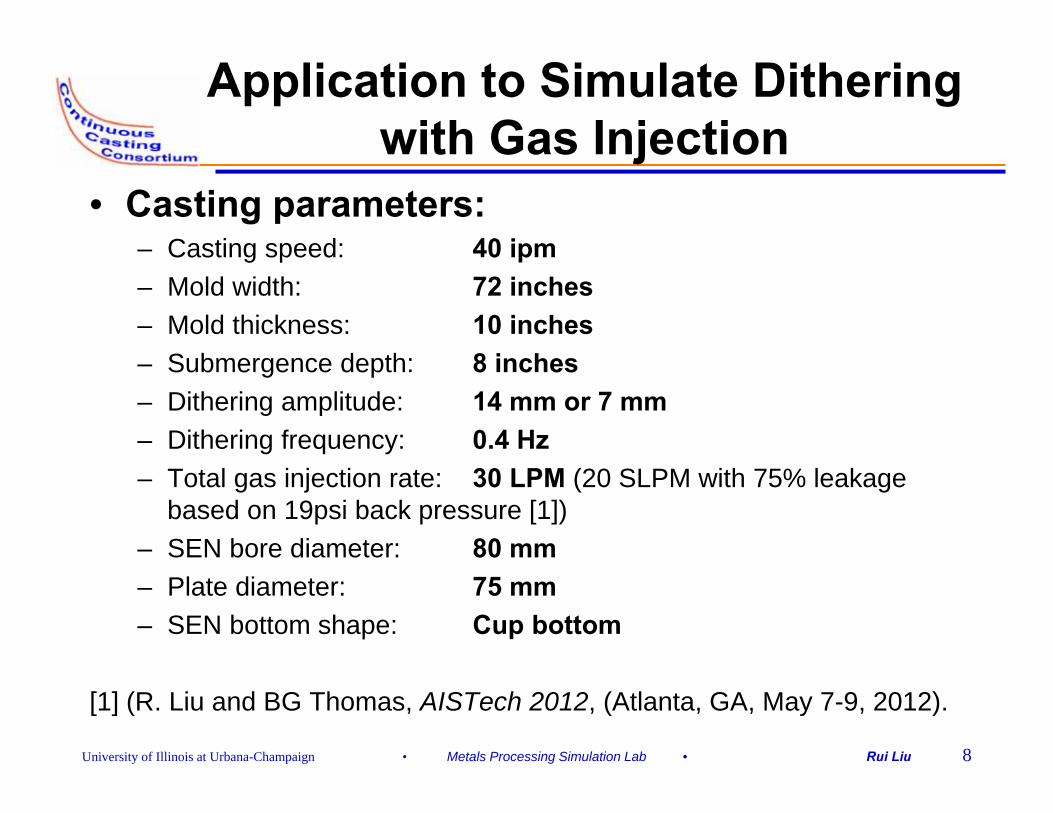
Application to Simulate Dithering with Gas Injection
• Casting parameters:– Casting speed: 40 ipm– Mold width: 72 inches– Mold thickness: 10 inches– Submergence depth: 8 inches– Dithering amplitude: 14 mm or 7 mm– Dithering frequency: 0.4 Hz– Total gas injection rate: 30 LPM (20 SLPM with 75% leakage
based on 19psi back pressure [1])– SEN bore diameter: 80 mm– Plate diameter: 75 mm– SEN bottom shape: Cup bottom
[1] (R. Liu and BG Thomas, AISTech 2012, (Atlanta, GA, May 7-9, 2012).
University of Illinois at Urbana-Champaign • Metals Processing Simulation Lab • Rui Liu 9
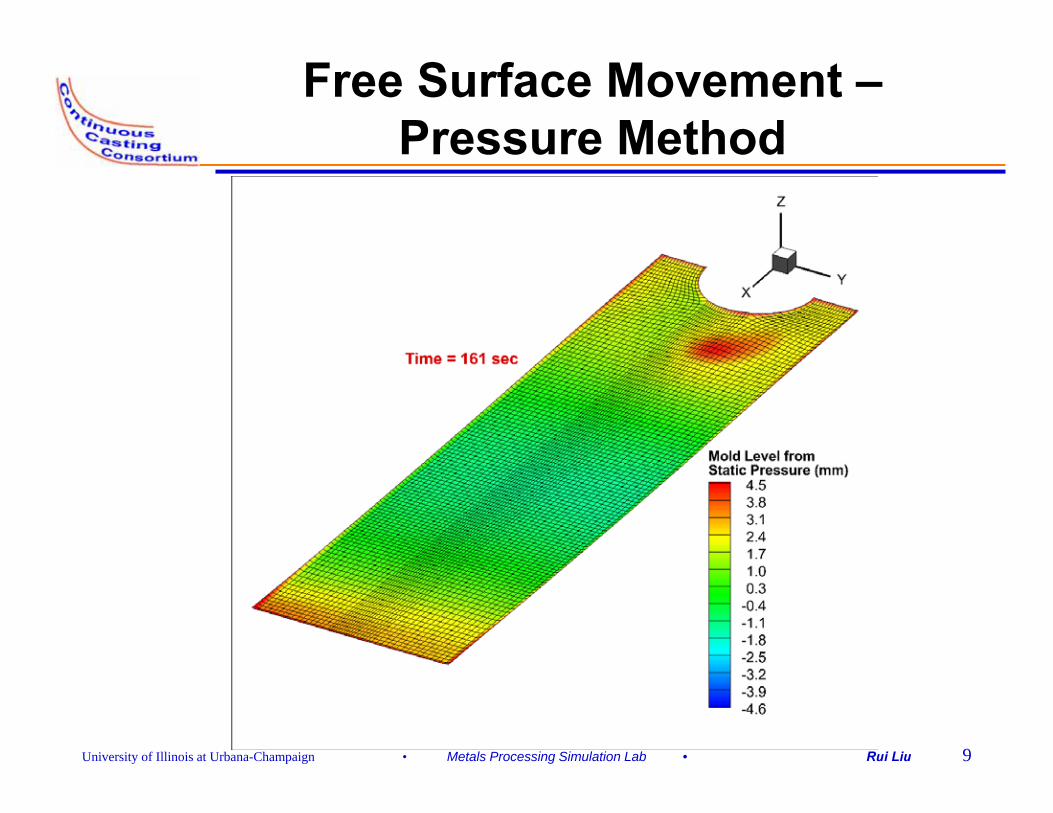
Free Surface Movement –Pressure Method
University of Illinois at Urbana-Champaign • Metals Processing Simulation Lab • Rui Liu 10
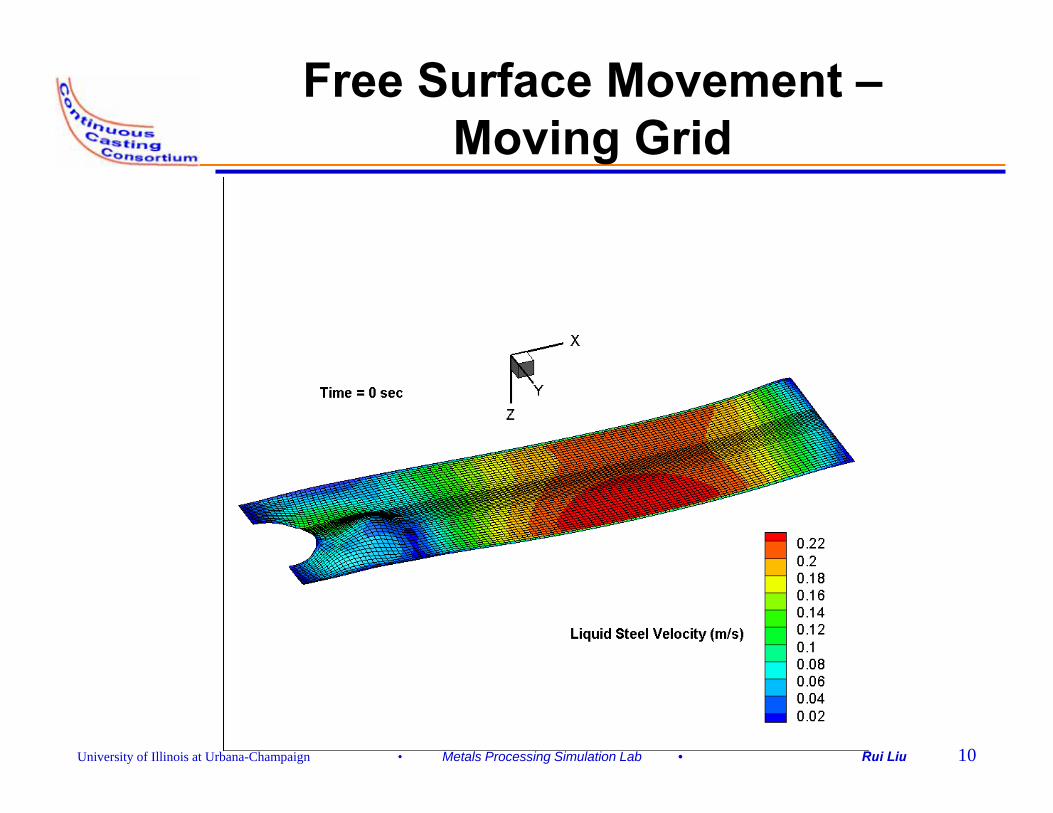
Free Surface Movement –Moving Grid
University of Illinois at Urbana-Champaign • Metals Processing Simulation Lab • Rui Liu 11
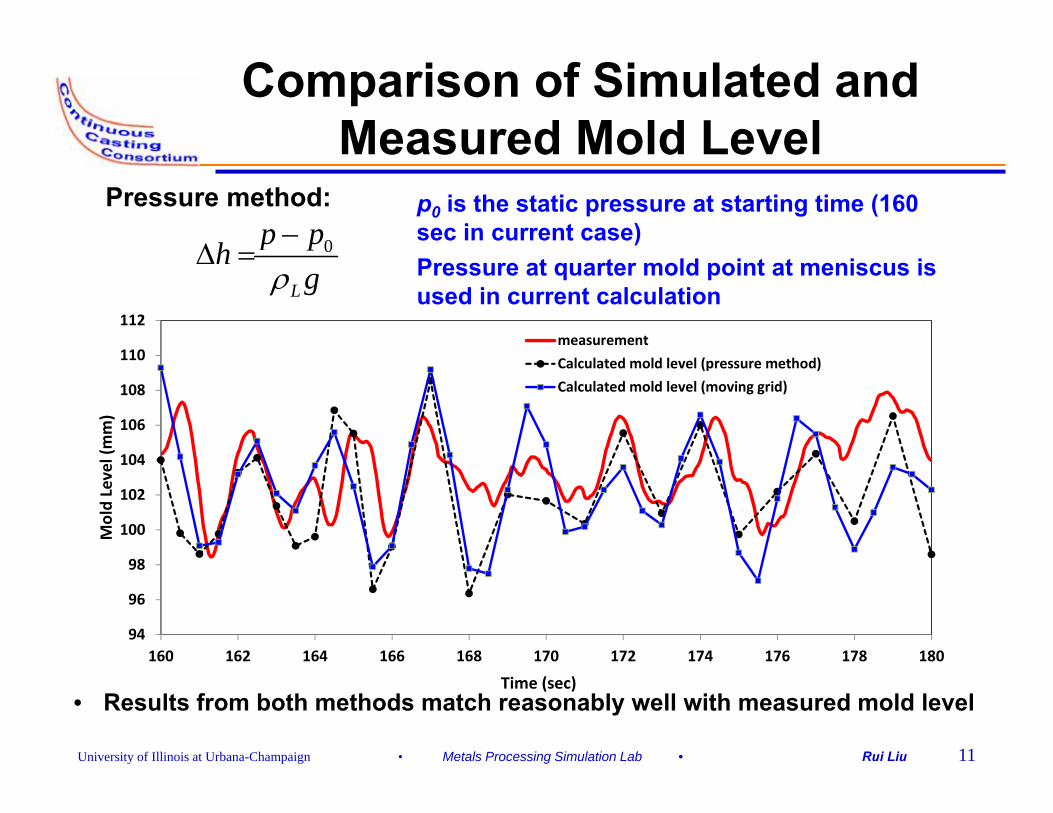
Comparison of Simulated and Measured Mold Level
94
96
98
100
102
104
106
108
110
112
160 162 164 166 168 170 172 174 176 178 180
Mold Level (mm)
Time (sec)
measurementCalculated mold level (pressure method)Calculated mold level (moving grid)
Pressure method: 0
L
p phgρ
−∆ =
p0 is the static pressure at starting time (160 sec in current case)Pressure at quarter mold point at meniscus is used in current calculation
• Results from both methods match reasonably well with measured mold level
University of Illinois at Urbana-Champaign • Metals Processing Simulation Lab • Rui Liu 12
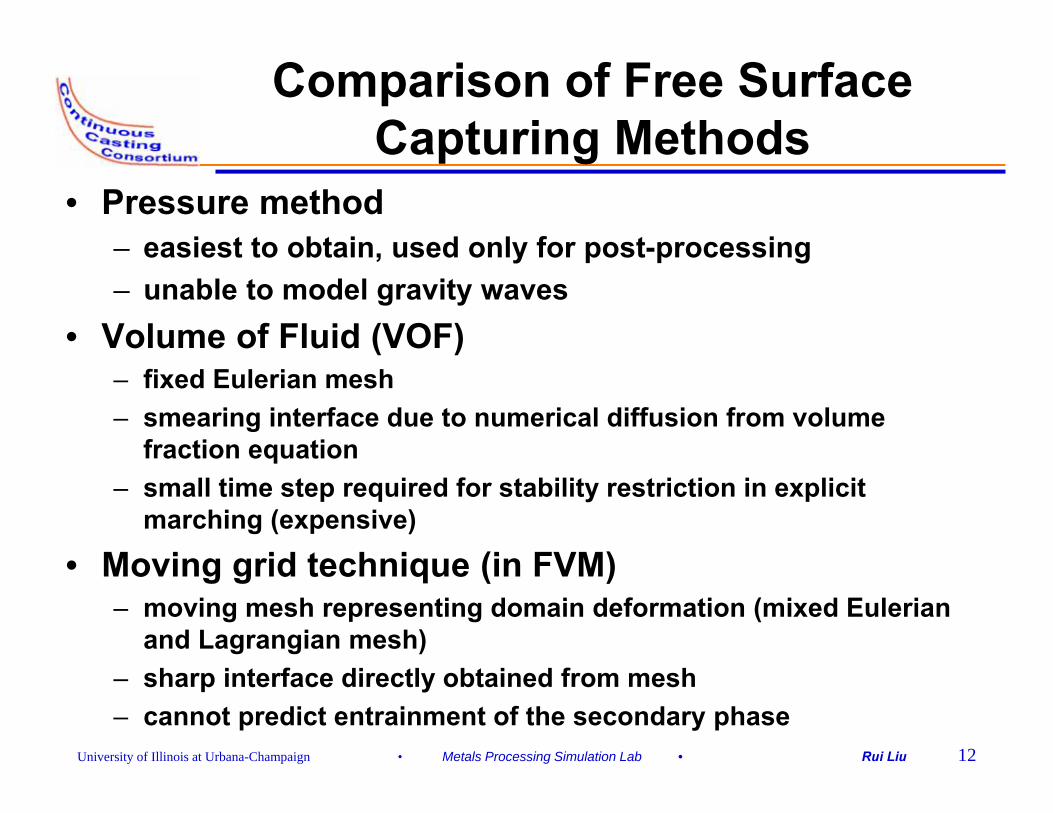
Comparison of Free Surface Capturing Methods
• Pressure method– easiest to obtain, used only for post-processing– unable to model gravity waves
• Volume of Fluid (VOF)– fixed Eulerian mesh– smearing interface due to numerical diffusion from volume
fraction equation– small time step required for stability restriction in explicit
marching (expensive)
• Moving grid technique (in FVM)– moving mesh representing domain deformation (mixed Eulerian
and Lagrangian mesh)– sharp interface directly obtained from mesh– cannot predict entrainment of the secondary phase
University of Illinois at Urbana-Champaign • Metals Processing Simulation Lab • Rui Liu 13
Conclusion – Part 1
• A free surface model with moving grid technique is developed in FLUENT via UDF based on its “dynamic mesh” feature.
• The free surface model has been validated using:– the small amplitude sloshing analytical solution, which
proves that the model is accurate even with relative coarse mesh;
– mold top surface motion during CC dithering process, which shows:
• the capability of the model to simulate free surface behavior under gravity waves;
• the model can be used together with Eulerian-Eulerian multiphase flow models to study free surface behavior in cases with argon injection into the CC mold
University of Illinois at Urbana-Champaign • Metals Processing Simulation Lab • Rui Liu 14
• List of Cases from ArcelorMittal Indiana Harbor 3SP dithering trial;
• Calculation of sloshing frequency– a rectangular tank (3-D solution);– an infinite deep channel (2-D solution).
• Computation of dithering effects on mold flow pattern and mold level fluctuations– computational model setup;– quasi-steady state flow pattern and free surface
deformation;– flow and free surface evolution during dithering.
Part 2 Modeling Transient Flows and Free Surface during the Dithering Trial

University of Illinois at Urbana-Champaign • Metals Processing Simulation Lab • Rui Liu 15
ArcelorMittal Indiana Harbor Dithering Trial
• Casting parameters for the dithering trial:– Casting speed: 40 ipm– Mold width: 72.5 inches– Mold thickness: 10 inches– Submergence depth: 5.6 inches– Total gas injection flow rate: 1 SLPM (1% in hot condition)– SEN bore diameter: 80 mm– Plate diameter: 75 mm– SEN bottom shape: Roof bottom
Case # Frequency (Hz) Stroke (mm) Mold Operator Comments1 0.6 14 Not many waves2 0.8 14 More waves than 0.6 Hz3 0.9 14 Giant sloshing, worst level scenario4 1.0 14 More waves than 0.8 Hz5 1.2 12 No waves in the mold, best frequency6 1.4 7 Very few waves, but 1.2 Hz is better
University of Illinois at Urbana-Champaign • Metals Processing Simulation Lab • Rui Liu 16
• Domain geometry and mesh • Computation condition:
– Numerical parameters– Turbulence models– Discretization scheme– Boundary conditions
• Quasi-steady state solution• Flow field evolution during dithering
process – simulating trial case 3
Numerical Simulation
University of Illinois at Urbana-Champaign • Metals Processing Simulation Lab • Rui Liu 17
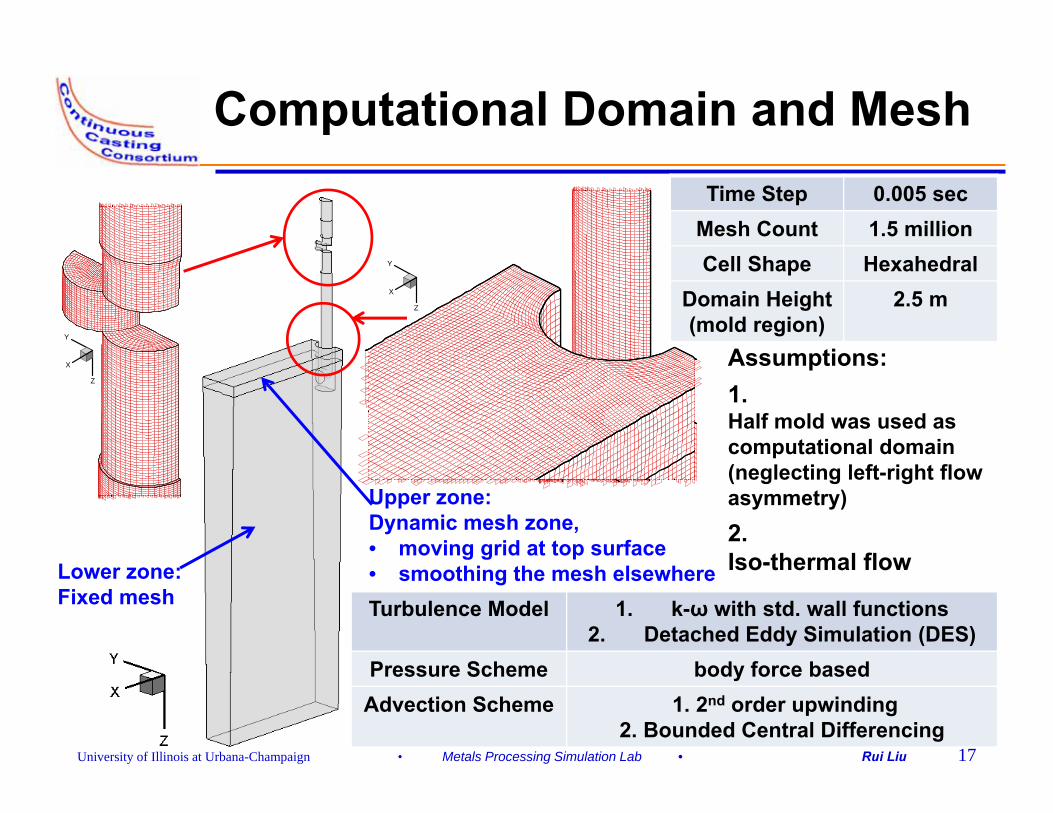
Computational Domain and Mesh
Y
Z
X
Y
Z
X
Turbulence Model 1. k-ω with std. wall functions2. Detached Eddy Simulation (DES)
Pressure Scheme body force basedAdvection Scheme 1. 2nd order upwinding
2. Bounded Central Differencing
Time Step 0.005 secMesh Count 1.5 millionCell Shape Hexahedral
Domain Height(mold region)
2.5 m
Assumptions:1. Half mold was used as computational domain(neglecting left-right flow asymmetry)2.Iso-thermal flow
Upper zone:Dynamic mesh zone,• moving grid at top surface• smoothing the mesh elsewhereLower zone:
Fixed mesh
University of Illinois at Urbana-Champaign • Metals Processing Simulation Lab • Rui Liu 18
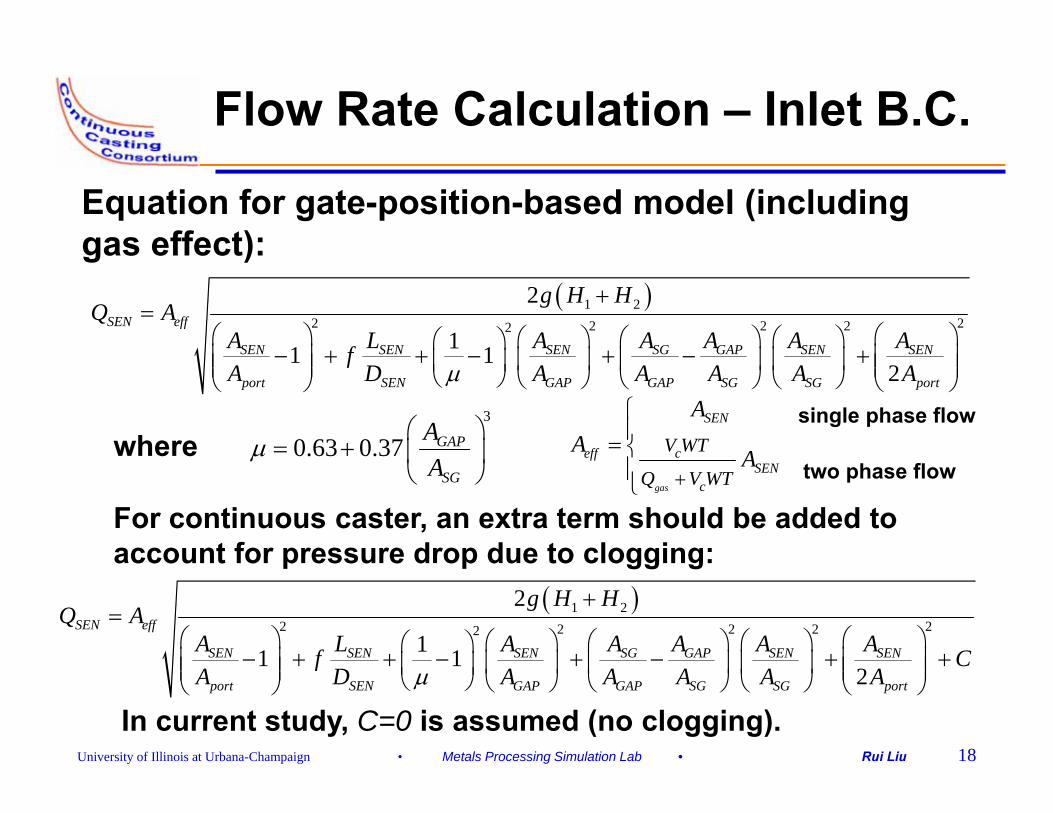
Flow Rate Calculation – Inlet B.C.
Equation for gate-position-based model (including gas effect):
( )1 22 22 2 22
2
11 12
SEN eff
SEN SEN SEN SG GAP SEN SEN
port SEN GAP GAP SG SG port
g H HQ A
A L A A A A AfA D A A A A Aµ
+=
⎛ ⎞ ⎛ ⎞⎛ ⎞ ⎛ ⎞ ⎛ ⎞⎛ ⎞− + + − + − +⎜ ⎟ ⎜ ⎟⎜ ⎟ ⎜ ⎟ ⎜ ⎟⎜ ⎟⎜ ⎟ ⎜ ⎟⎝ ⎠ ⎝ ⎠ ⎝ ⎠ ⎝ ⎠⎝ ⎠ ⎝ ⎠
3
0.63 0.37 GAP
SG
AA
µ⎛ ⎞
= + ⎜ ⎟⎝ ⎠
gas
SEN
ceffSEN
c
V WT
Q V WT
AA A
+
⎧⎪= ⎨⎪⎩
single phase flow
two phase flowwhere
For continuous caster, an extra term should be added to account for pressure drop due to clogging:
( )1 22 22 2 22
2
11 12
SEN eff
SEN SEN SEN SG GAP SEN SEN
port SEN GAP GAP SG SG port
g H HQ A
A L A A A A Af CA D A A A A Aµ
+=
⎛ ⎞ ⎛ ⎞⎛ ⎞ ⎛ ⎞ ⎛ ⎞⎛ ⎞− + + − + − + +⎜ ⎟ ⎜ ⎟⎜ ⎟ ⎜ ⎟ ⎜ ⎟⎜ ⎟⎜ ⎟ ⎜ ⎟⎝ ⎠ ⎝ ⎠ ⎝ ⎠ ⎝ ⎠⎝ ⎠ ⎝ ⎠
In current study, C=0 is assumed (no clogging).
University of Illinois at Urbana-Champaign • Metals Processing Simulation Lab • Rui Liu 19
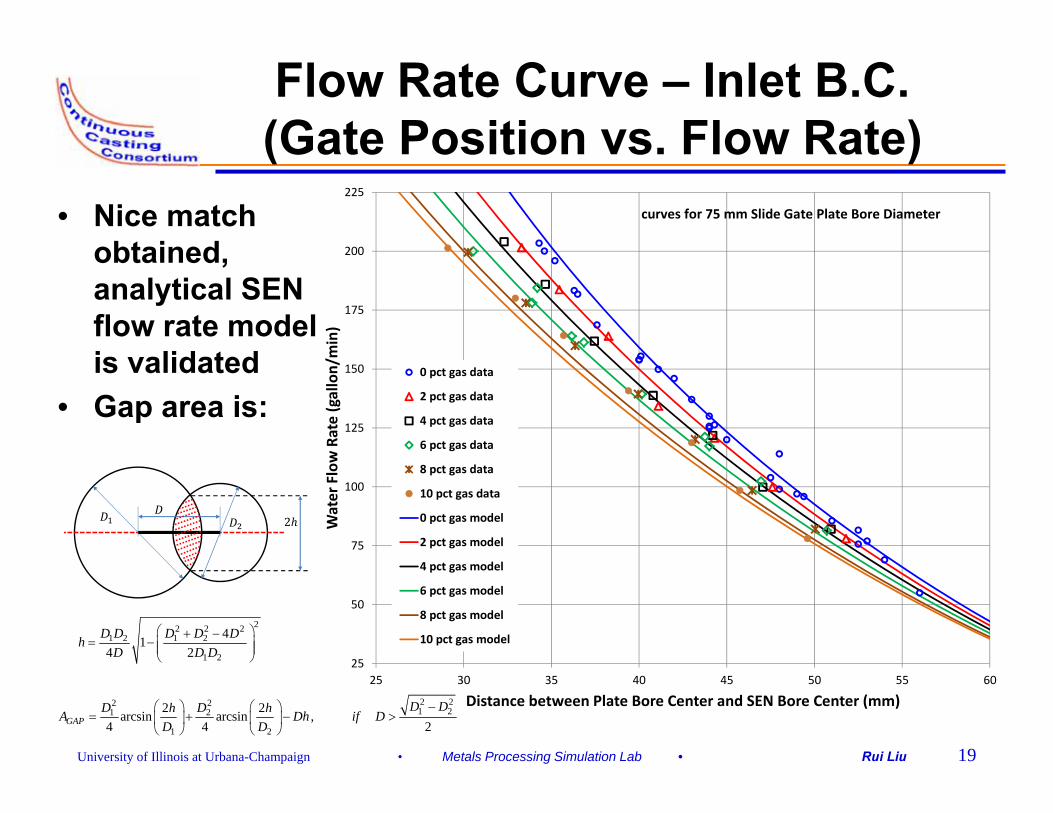
Flow Rate Curve – Inlet B.C.(Gate Position vs. Flow Rate)
25
50
75
100
125
150
175
200
225
25 30 35 40 45 50 55 60
Water Flow Rate (gallon/min)
Distance between Plate Bore Center and SEN Bore Center (mm)
0 pct gas data
2 pct gas data
4 pct gas data
6 pct gas data
8 pct gas data
10 pct gas data
0 pct gas model
2 pct gas model
4 pct gas model
6 pct gas model
8 pct gas model
10 pct gas model
curves for 75 mm Slide Gate Plate Bore Diameter
2 22 21 21 2
1 2
2 2arcsin arcsin ,4 4 2GAP
D DD Dh hA Dh if DD D
−⎛ ⎞ ⎛ ⎞= + − >⎜ ⎟ ⎜ ⎟
⎝ ⎠ ⎝ ⎠
22 2 21 2 1 2
1 2
41
4 2D D D D D
hD D D
⎛ ⎞+ −= − ⎜ ⎟⎜ ⎟
⎝ ⎠
• Nice match obtained, analytical SEN flow rate model is validated
• Gap area is:
University of Illinois at Urbana-Champaign • Metals Processing Simulation Lab • Rui Liu 20
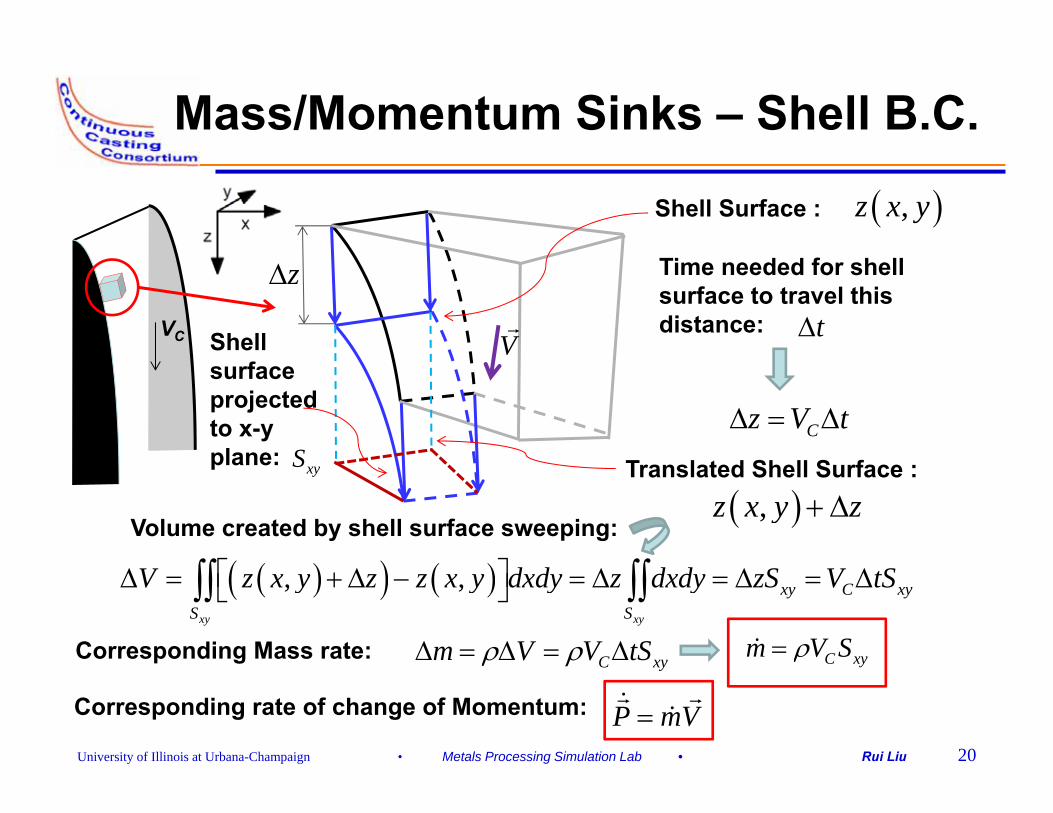
Mass/Momentum Sinks – Shell B.C.
VC
( ),z x yShell Surface :
z∆
Translated Shell Surface :
( ),z x y z+ ∆
Time needed for shell surface to travel this distance: t∆
Cz V t∆ = ∆
Volume created by shell surface sweeping:
( )( ) ( ), ,xy xy
xy C xyS S
V z x y z z x y dxdy z dxdy zS V tS⎡ ⎤∆ = + ∆ − = ∆ = ∆ = ∆⎣ ⎦∫∫ ∫∫
C xym V V tSρ ρ∆ = ∆ = ∆Corresponding Mass rate: C xym V Sρ=
Corresponding rate of change of Momentum: P mV=
VShell surface projected to x-y plane: xyS
University of Illinois at Urbana-Champaign • Metals Processing Simulation Lab • Rui Liu 21
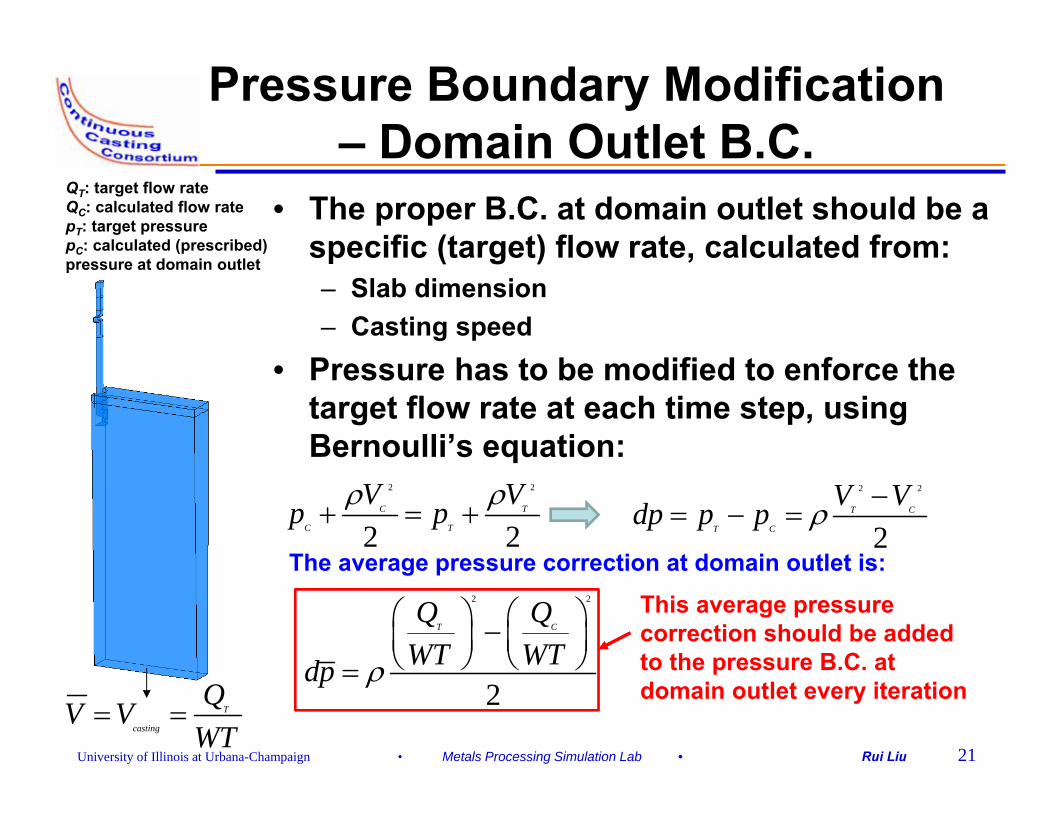
Pressure Boundary Modification – Domain Outlet B.C.
• The proper B.C. at domain outlet should be a specific (target) flow rate, calculated from:– Slab dimension– Casting speed
• Pressure has to be modified to enforce the target flow rate at each time step, using Bernoulli’s equation:
T
casting
QV VWT
= =
2 2
2 2C T
C T
V Vp pρ ρ+ = +
2 2
2T C
T C
V Vdp p p ρ −= − =
The average pressure correction at domain outlet is:2 2
2
T CQ Q
WT WTdp ρ
⎛ ⎞ ⎛ ⎞−⎜ ⎟ ⎜ ⎟⎝ ⎠ ⎝ ⎠=
This average pressure correction should be added to the pressure B.C. at domain outlet every iteration
QT: target flow rateQC: calculated flow ratepT: target pressurepC: calculated (prescribed) pressure at domain outlet
University of Illinois at Urbana-Champaign • Metals Processing Simulation Lab • Rui Liu 22
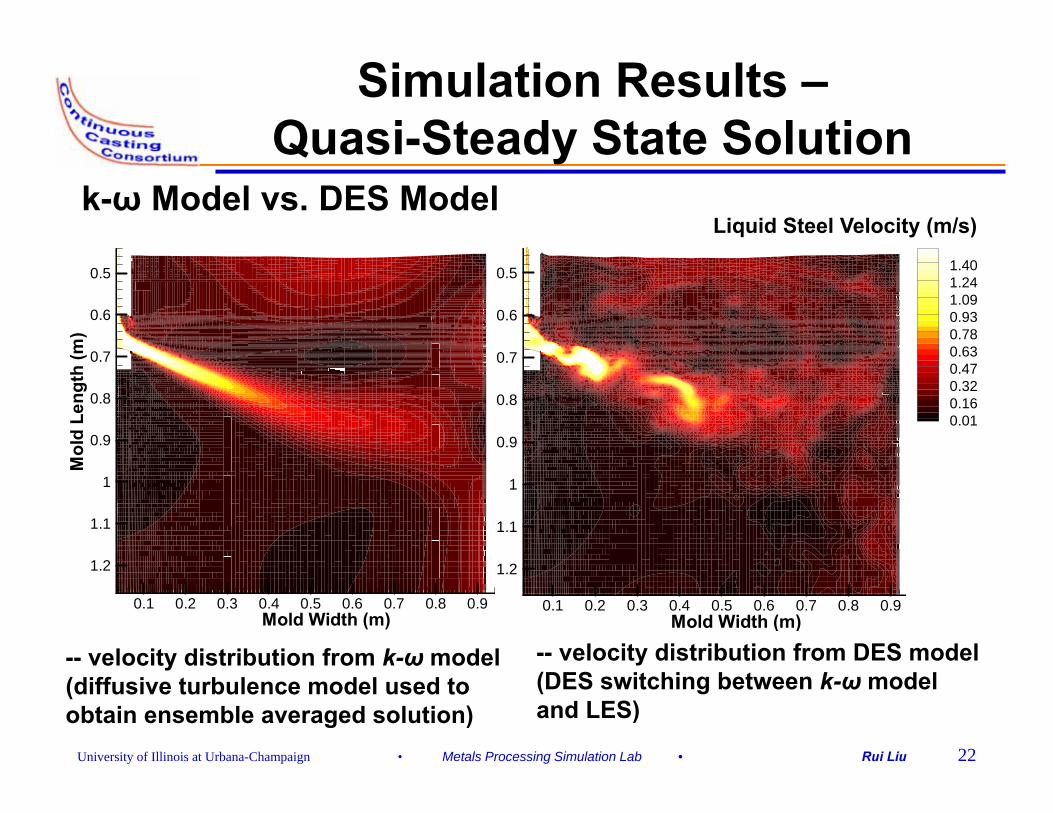
Simulation Results –Quasi-Steady State Solution
k-ω Model vs. DES Model
Mold Width (m)
Mol
dLe
ngth
(m)
0.1 0.2 0.3 0.4 0.5 0.6 0.7 0.8 0.9
0.5
0.6
0.7
0.8
0.9
1
1.1
1.2
Mold Width (m)
Mol
dLe
ngth
(m)
0.1 0.2 0.3 0.4 0.5 0.6 0.7 0.8 0.9
0.5
0.6
0.7
0.8
0.9
1
1.1
1.2
1.401.241.090.930.780.630.470.320.160.01
Liquid Steel Velocity (m/s)
-- velocity distribution from k-ω model(diffusive turbulence model used to obtain ensemble averaged solution)
-- velocity distribution from DES model(DES switching between k-ω model and LES)
University of Illinois at Urbana-Champaign • Metals Processing Simulation Lab • Rui Liu 23
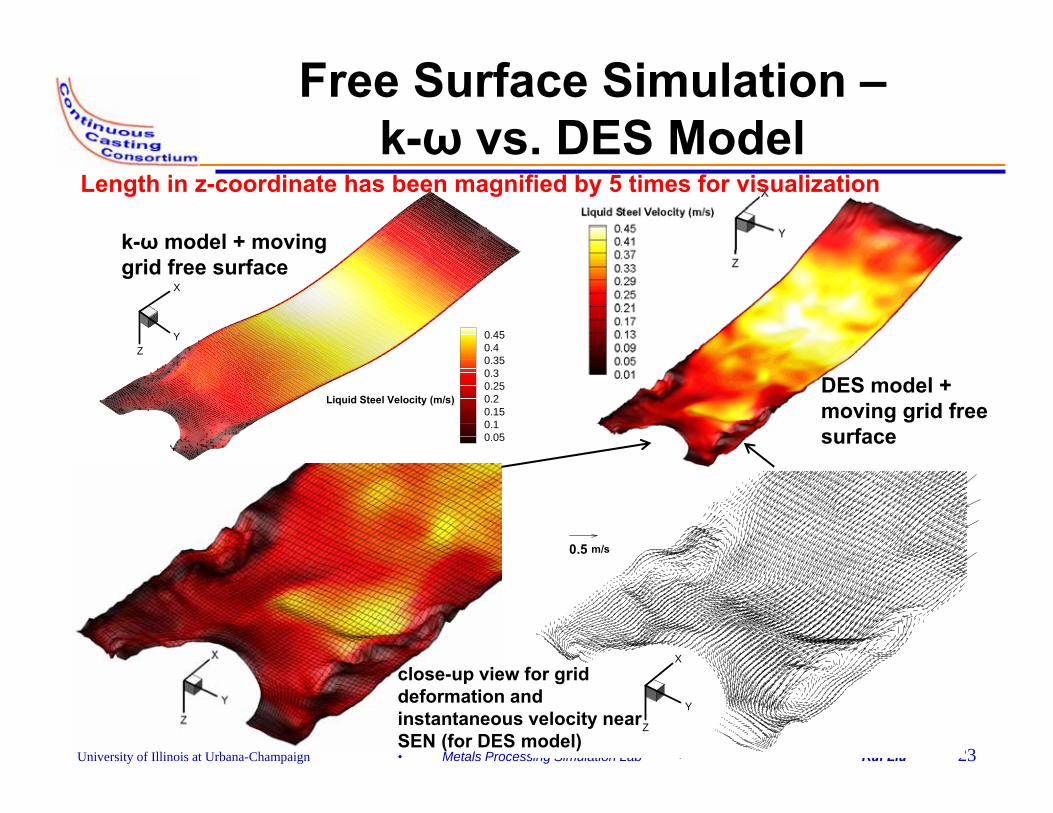
Free Surface Simulation –k-ω vs. DES Model
X
Y
Z
0.5 m/s
Z
X
Y 0.450.40.350.30.250.20.150.10.05
Liquid Steel Velocity (m/s)DES model + moving grid free surface
k-ω model + moving grid free surface
close-up view for grid deformation and instantaneous velocity near SEN (for DES model)
Length in z-coordinate has been magnified by 5 times for visualization
University of Illinois at Urbana-Champaign • Metals Processing Simulation Lab • Rui Liu 24
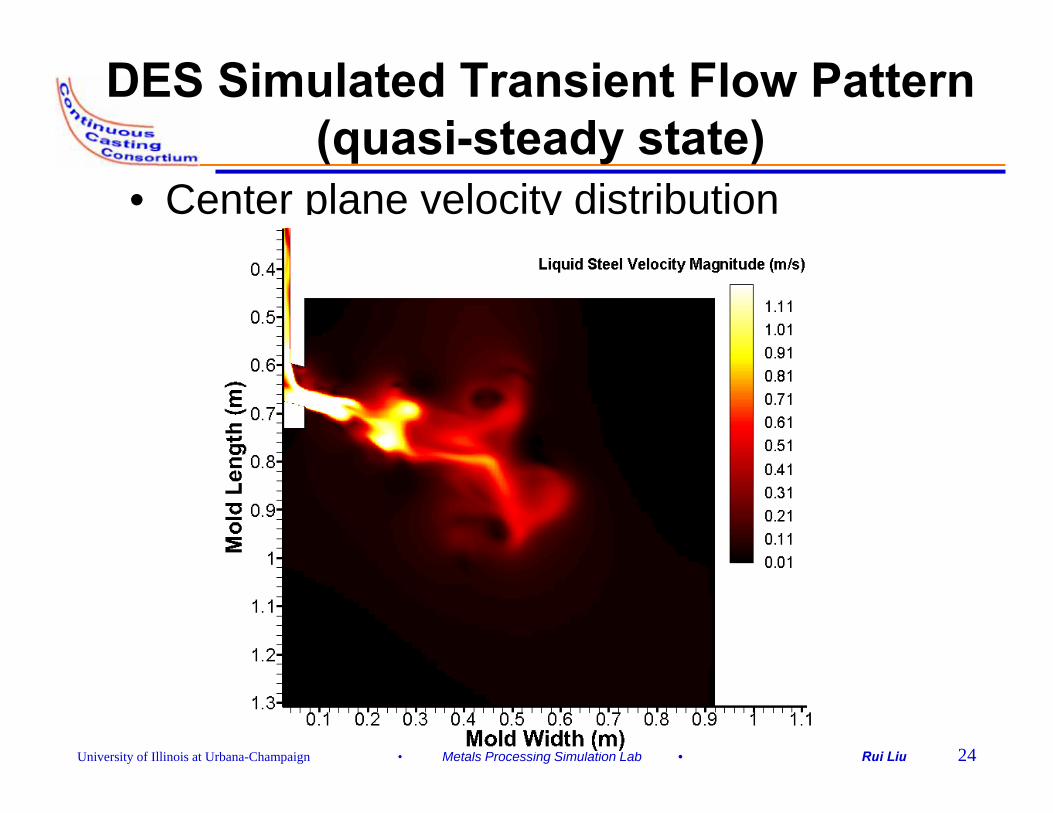
DES Simulated Transient Flow Pattern (quasi-steady state)
• Center plane velocity distribution
University of Illinois at Urbana-Champaign • Metals Processing Simulation Lab • Rui Liu 25
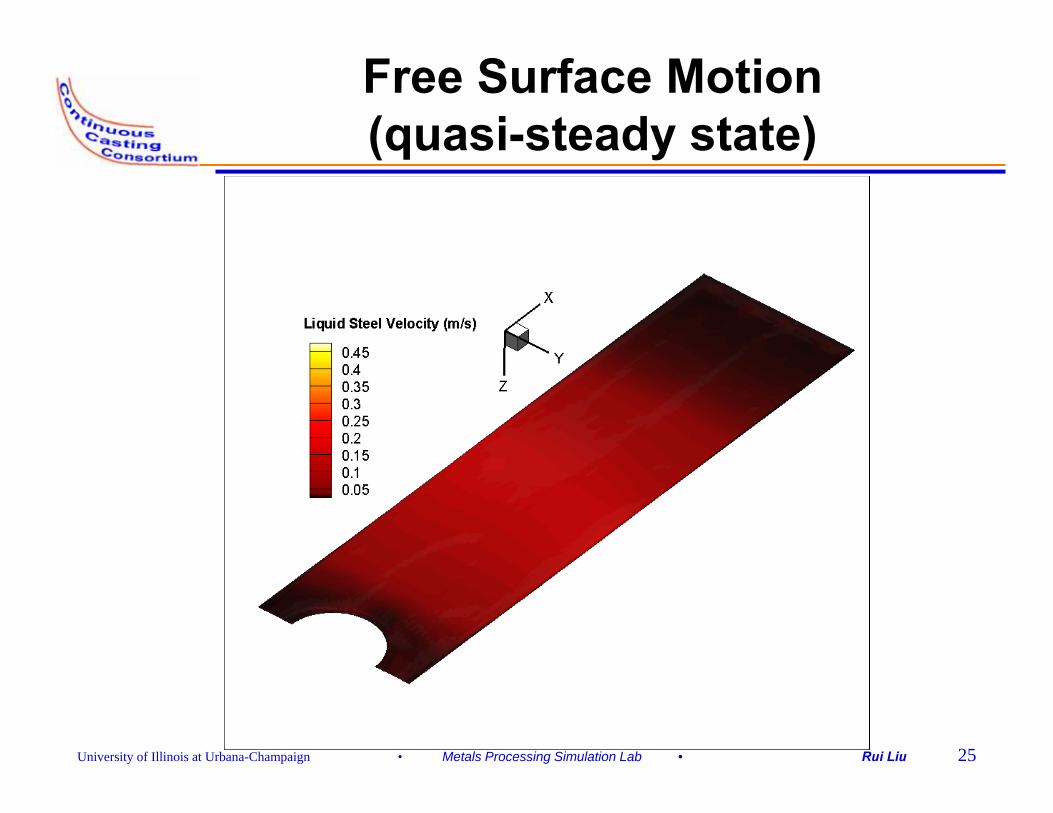
Free Surface Motion (quasi-steady state)
University of Illinois at Urbana-Champaign • Metals Processing Simulation Lab • Rui Liu 26
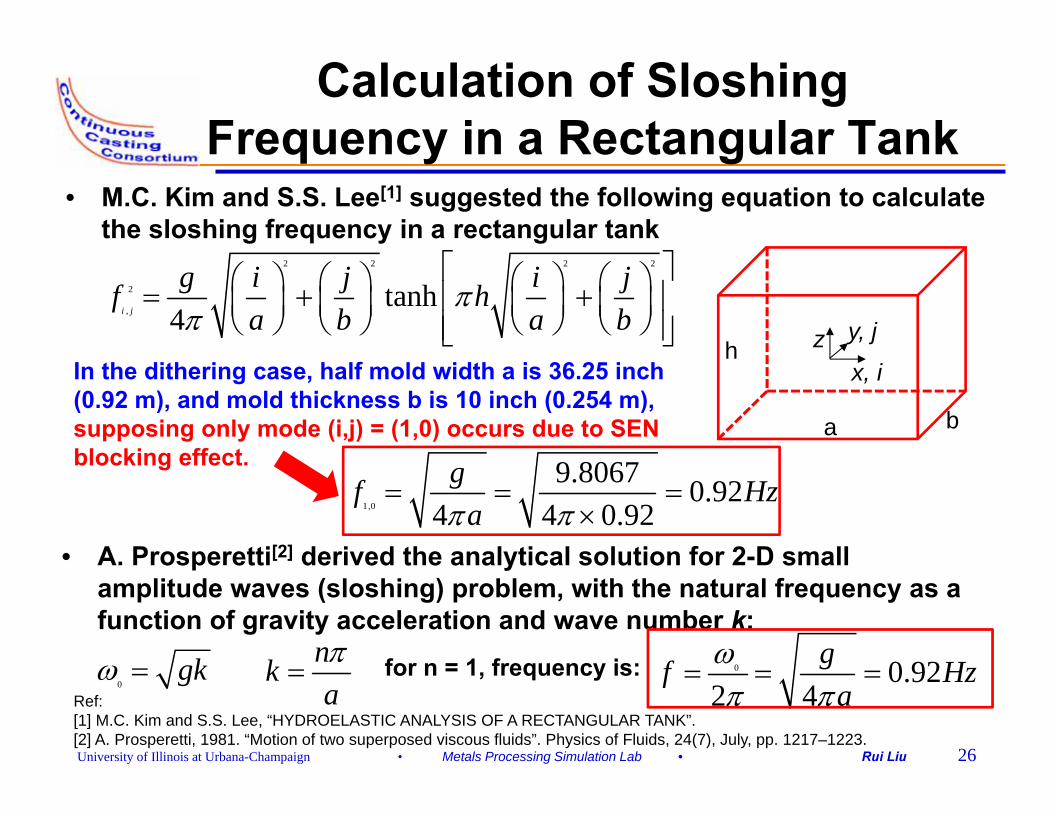
Calculation of Sloshing Frequency in a Rectangular Tank
2 2 2 2
2
,tanh
4i j
g i j i jf ha b a b
ππ
⎡ ⎤⎛ ⎞ ⎛ ⎞ ⎛ ⎞ ⎛ ⎞= + +⎢ ⎥⎜ ⎟ ⎜ ⎟ ⎜ ⎟ ⎜ ⎟⎝ ⎠ ⎝ ⎠ ⎝ ⎠ ⎝ ⎠⎢ ⎥⎣ ⎦
• M.C. Kim and S.S. Lee[1] suggested the following equation to calculate the sloshing frequency in a rectangular tank
• A. Prosperetti[2] derived the analytical solution for 2-D small amplitude waves (sloshing) problem, with the natural frequency as a function of gravity acceleration and wave number k:
Ref:[1] M.C. Kim and S.S. Lee, “HYDROELASTIC ANALYSIS OF A RECTANGULAR TANK”.[2] A. Prosperetti, 1981. “Motion of two superposed viscous fluids”. Physics of Fluids, 24(7), July, pp. 1217–1223.
x, iz y, j
a b
hIn the dithering case, half mold width a is 36.25 inch (0.92 m), and mold thickness b is 10 inch (0.254 m), supposing only mode (i,j) = (1,0) occurs due to SEN blocking effect.
1,0
9.8067 0.924 4 0.92
gf Hzaπ π
= = =×
0gkω = nk
aπ
= for n = 1, frequency is: 0 0.922 4
gf Hza
ωπ π
= = =
University of Illinois at Urbana-Champaign • Metals Processing Simulation Lab • Rui Liu 27
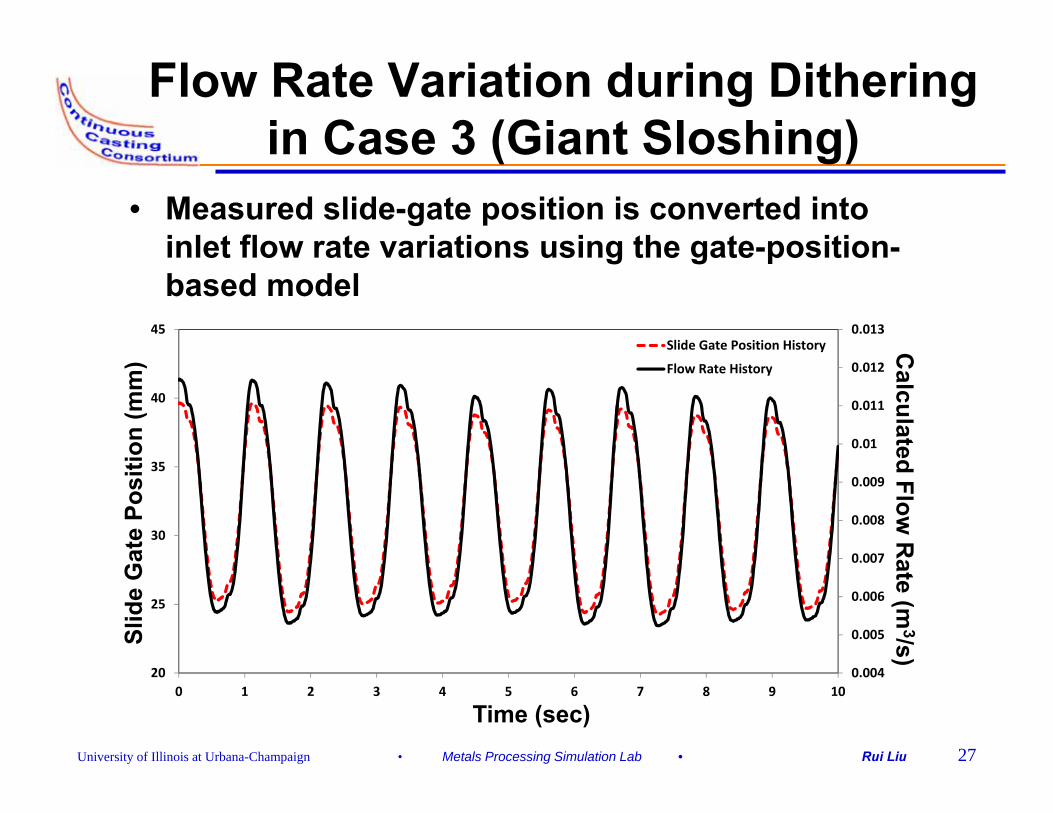
Flow Rate Variation during Dithering in Case 3 (Giant Sloshing)
• Measured slide-gate position is converted into inlet flow rate variations using the gate-position-based model
0.004
0.005
0.006
0.007
0.008
0.009
0.01
0.011
0.012
0.013
20
25
30
35
40
45
0 1 2 3 4 5 6 7 8 9 10
Slide Gate Position History
Flow Rate History
Time (sec)
Slid
e G
ate
Posi
tion
(mm
)C
alculated Flow R
ate (m3/s)
University of Illinois at Urbana-Champaign • Metals Processing Simulation Lab • Rui Liu 28
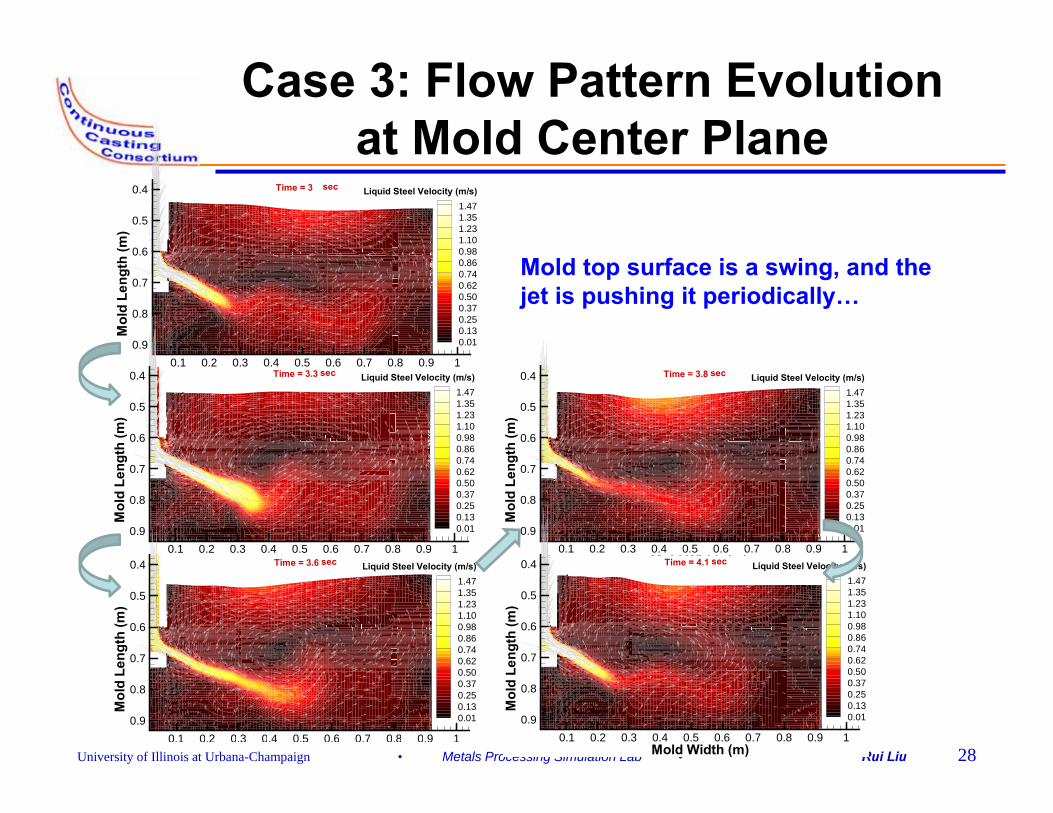
Case 3: Flow Pattern Evolution at Mold Center Plane
Mold Width (m)
Mol
dLe
ngth
(m)
0.1 0.2 0.3 0.4 0.5 0.6 0.7 0.8 0.9 1
0.4
0.5
0.6
0.7
0.8
0.9
1.471.351.231.100.980.860.740.620.500.370.250.130.01
Liquid Steel Velocity (m/s)Time = 3.8 sec
Mold Width (m)
Mol
dLe
ngth
(m)
0.1 0.2 0.3 0.4 0.5 0.6 0.7 0.8 0.9 1
0.4
0.5
0.6
0.7
0.8
0.9
1.471.351.231.100.980.860.740.620.500.370.250.130.01
Liquid Steel Velocity (m/s)Time = 4.1 sec
Mold Width (m)
Mol
dLe
ngth
(m)
0.1 0.2 0.3 0.4 0.5 0.6 0.7 0.8 0.9 1
0.4
0.5
0.6
0.7
0.8
0.9
1.471.351.231.100.980.860.740.620.500.370.250.130.01
Liquid Steel Velocity (m/s)Time = 3 sec
Mold Width (m)
Mol
dLe
ngth
(m)
0.1 0.2 0.3 0.4 0.5 0.6 0.7 0.8 0.9 1
0.4
0.5
0.6
0.7
0.8
0.9
1.471.351.231.100.980.860.740.620.500.370.250.130.01
Liquid Steel Velocity (m/s)Time = 3.3 sec
Mol
dLe
ngth
(m)
0.1 0.2 0.3 0.4 0.5 0.6 0.7 0.8 0.9 1
0.4
0.5
0.6
0.7
0.8
0.9
1.471.351.231.100.980.860.740.620.500.370.250.130.01
Liquid Steel Velocity (m/s)Time = 3.6 sec
Mold top surface is a swing, and the jet is pushing it periodically…
University of Illinois at Urbana-Champaign • Metals Processing Simulation Lab • Rui Liu 29
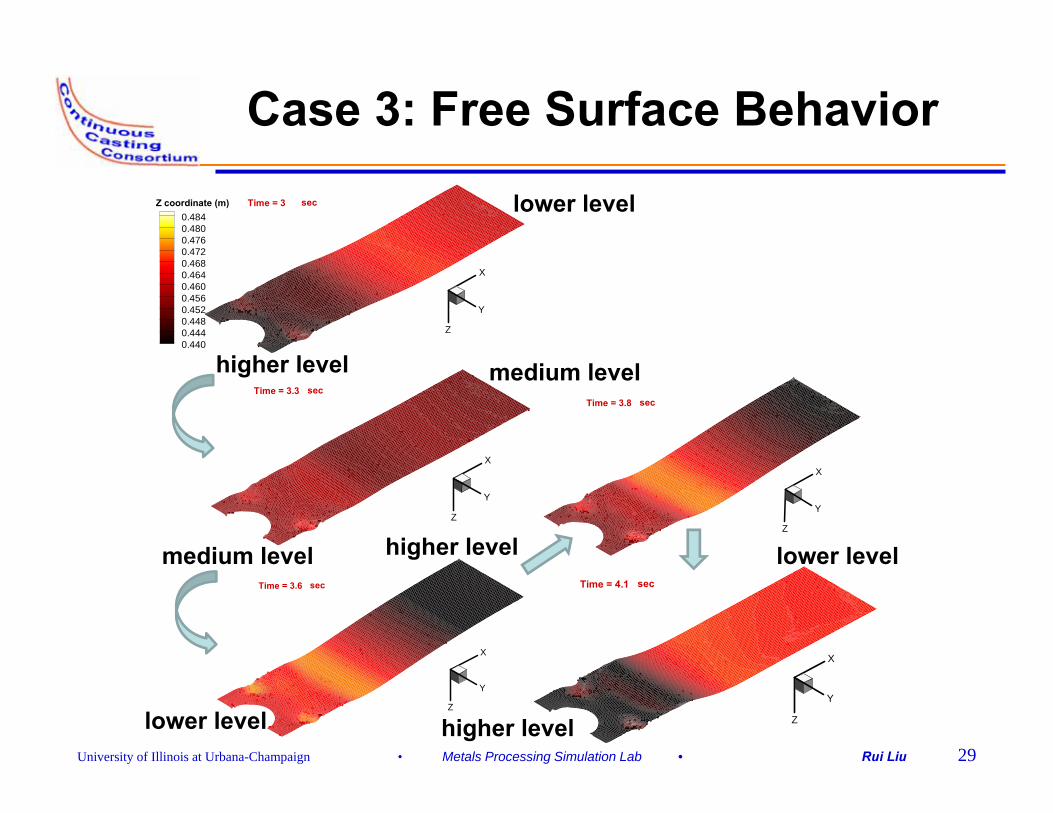
Case 3: Free Surface Behavior
X
Z
Y
Time = 3.3 sec
X
Z
Y
0.4840.4800.4760.4720.4680.4640.4600.4560.4520.4480.4440.440
Z coordinate (m) Time = 3 sec
X
Z
Y
Time = 3.6 sec
X
Z
Y
Time = 3.8 sec
X
Z
Y
Time = 4.1 sec
higher level
lower level
medium level
medium level higher level
lower level higher level
lower level
University of Illinois at Urbana-Champaign • Metals Processing Simulation Lab • Rui Liu 30
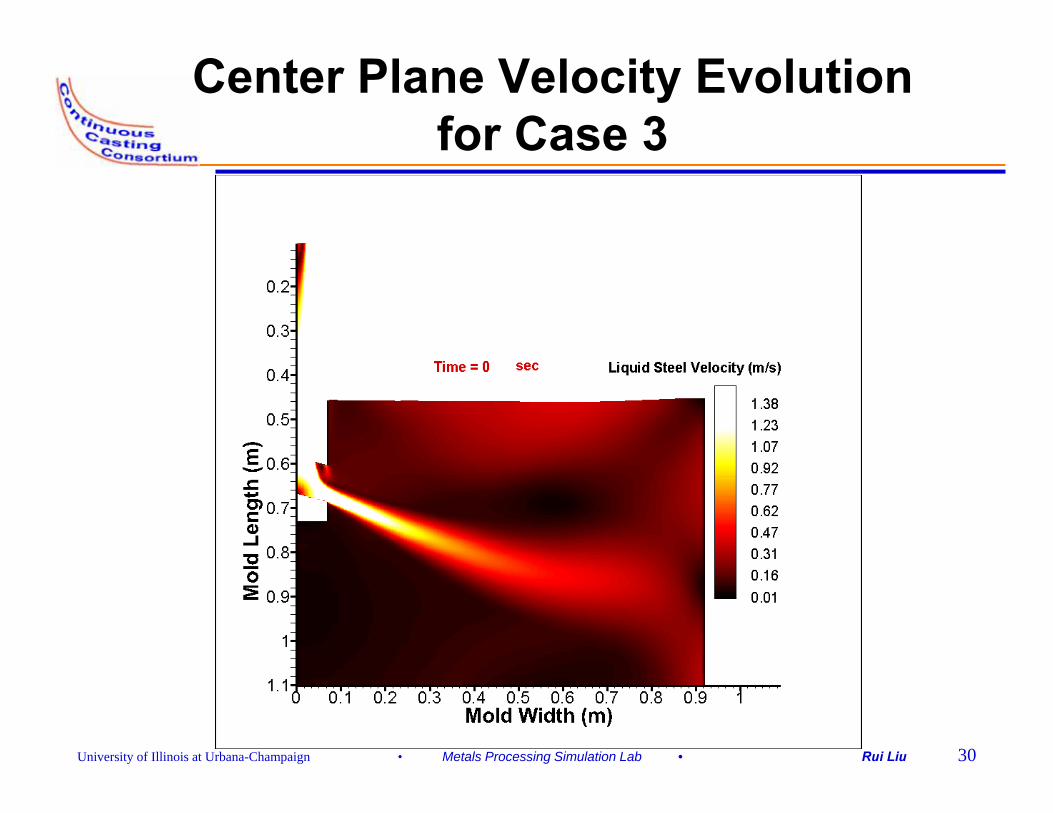
Center Plane Velocity Evolution for Case 3
University of Illinois at Urbana-Champaign • Metals Processing Simulation Lab • Rui Liu 31
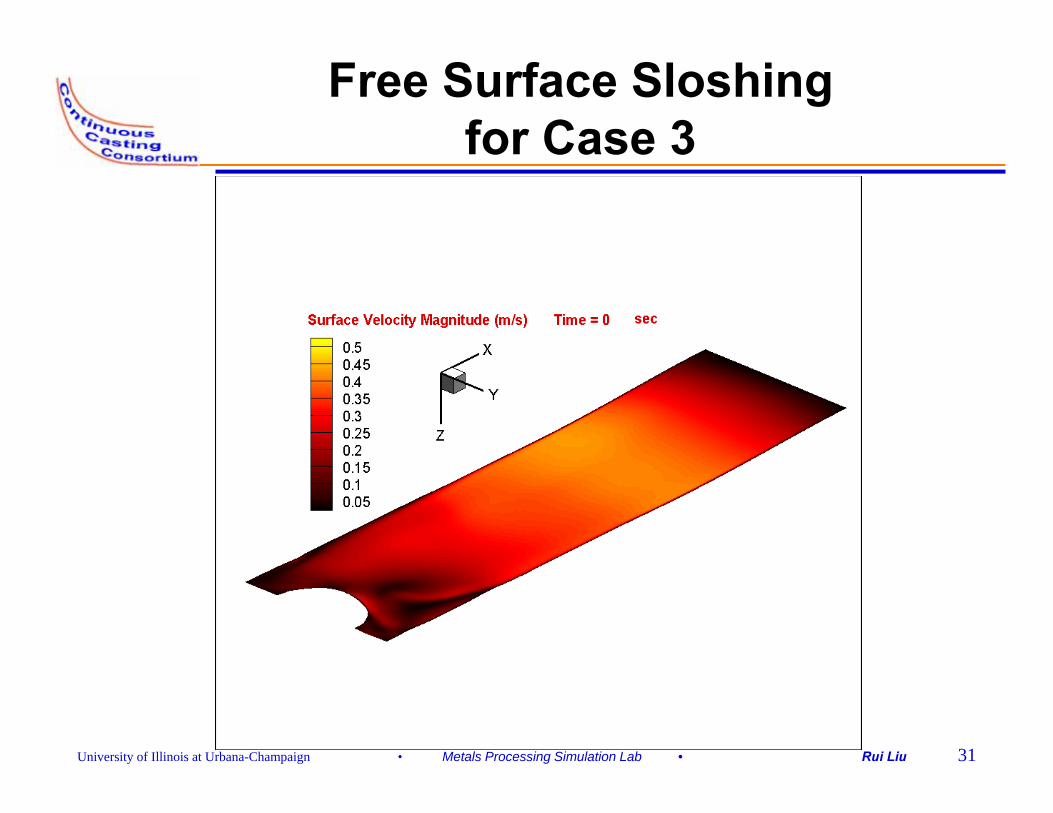
Free Surface Sloshing for Case 3
University of Illinois at Urbana-Champaign • Metals Processing Simulation Lab • Rui Liu 32
Conclusion – Part 2
• Computational models were setup and successfully adopted to investigate transient flow and free surface evolution, with:– Predicted flow rate at nozzle inlet B.C.– Mass/momentum sink terms at shell– Modified pressure B.C. at domain outlet
• Sloshing frequency is calculated via analytical solutions and validated via numerical simulation;
• The “swing” effect is identified via simulated results as the cause of giant sloshing which was observed to occur when dithering frequency matches with sloshing frequency.
University of Illinois at Urbana-Champaign • Metals Processing Simulation Lab • Rui Liu 33
Parametric Study on Mold Level Fluctuations during Dithering
• Simpler models are needed to predict average mold level fluctuations during dithering process:– derived from global mass conservation– with flow rate calculated from gate-position-based model
• Effects of the following factors are investigated via parametric study using the simple average mold level model, including:– dithering stroke– casting speed
Part 3
University of Illinois at Urbana-Champaign • Metals Processing Simulation Lab • Rui Liu 34
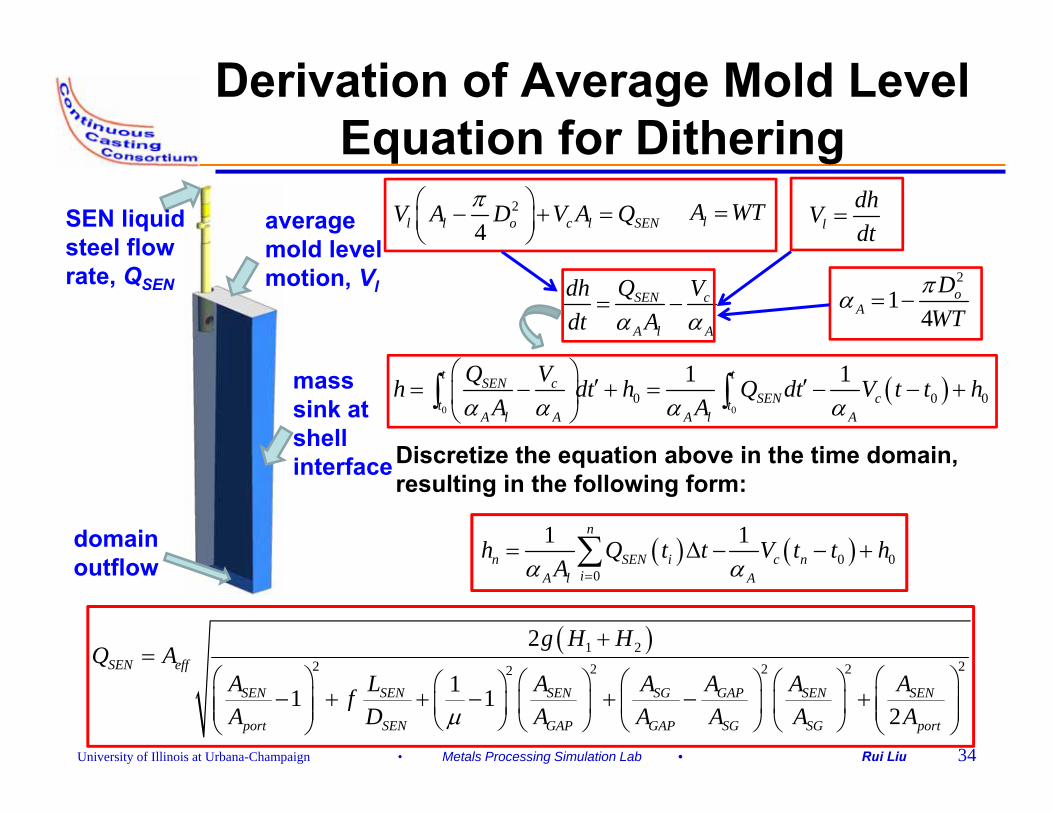
Derivation of Average Mold Level Equation for Dithering
Discretize the equation above in the time domain, resulting in the following form:
( ) ( )0 00
1 1n
n SEN i c niA l A
h Q t t V t t hAα α=
= ∆ − − +∑
( )1 22 22 2 22
2
11 12
SEN eff
SEN SEN SEN SG GAP SEN SEN
port SEN GAP GAP SG SG port
g H HQ A
A L A A A A AfA D A A A A Aµ
+=
⎛ ⎞ ⎛ ⎞⎛ ⎞ ⎛ ⎞ ⎛ ⎞⎛ ⎞− + + − + − +⎜ ⎟ ⎜ ⎟⎜ ⎟ ⎜ ⎟ ⎜ ⎟⎜ ⎟⎜ ⎟ ⎜ ⎟⎝ ⎠ ⎝ ⎠ ⎝ ⎠ ⎝ ⎠⎝ ⎠ ⎝ ⎠
2
4l l o c l SENV A D V A Qπ⎛ ⎞− + =⎜ ⎟⎝ ⎠ l
dhVdt
=
SEN c
A l A
Q Vdhdt Aα α
= −
( )0 0
0 0 01 1t t
SEN cSEN ct t
A l A A l A
Q Vh dt h Q dt V t t hA Aα α α α
⎛ ⎞′ ′= − + = − − +⎜ ⎟
⎝ ⎠∫ ∫
lA WT=
2
14
oA
DWTπα = −
average mold level motion, Vl
SEN liquid steel flow rate, QSEN
domain outflow
mass sink at shell interface
University of Illinois at Urbana-Champaign • Metals Processing Simulation Lab • Rui Liu 35
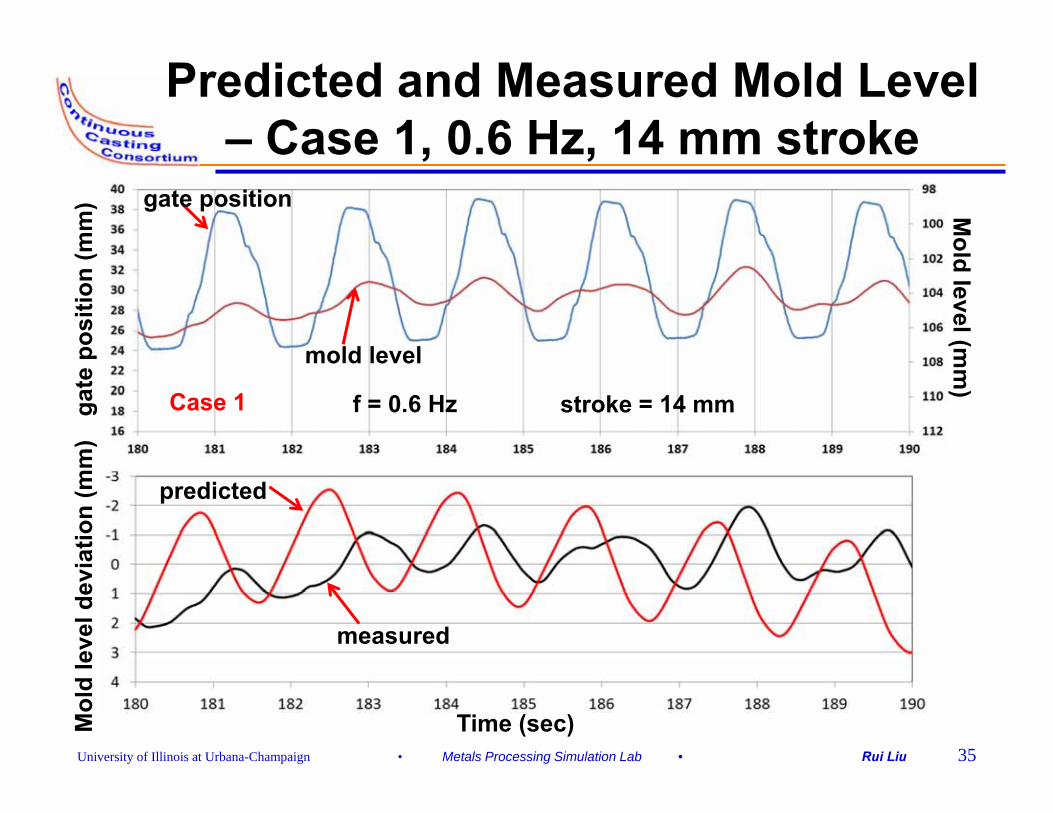
Predicted and Measured Mold Level – Case 1, 0.6 Hz, 14 mm stroke
f = 0.6 Hz stroke = 14 mmCase 1
gate position
mold level
gate
pos
ition
(mm
) Mold level (m
m)
Mol
d le
vel d
evia
tion
(mm
)
Time (sec)
predicted
measured
University of Illinois at Urbana-Champaign • Metals Processing Simulation Lab • Rui Liu 36
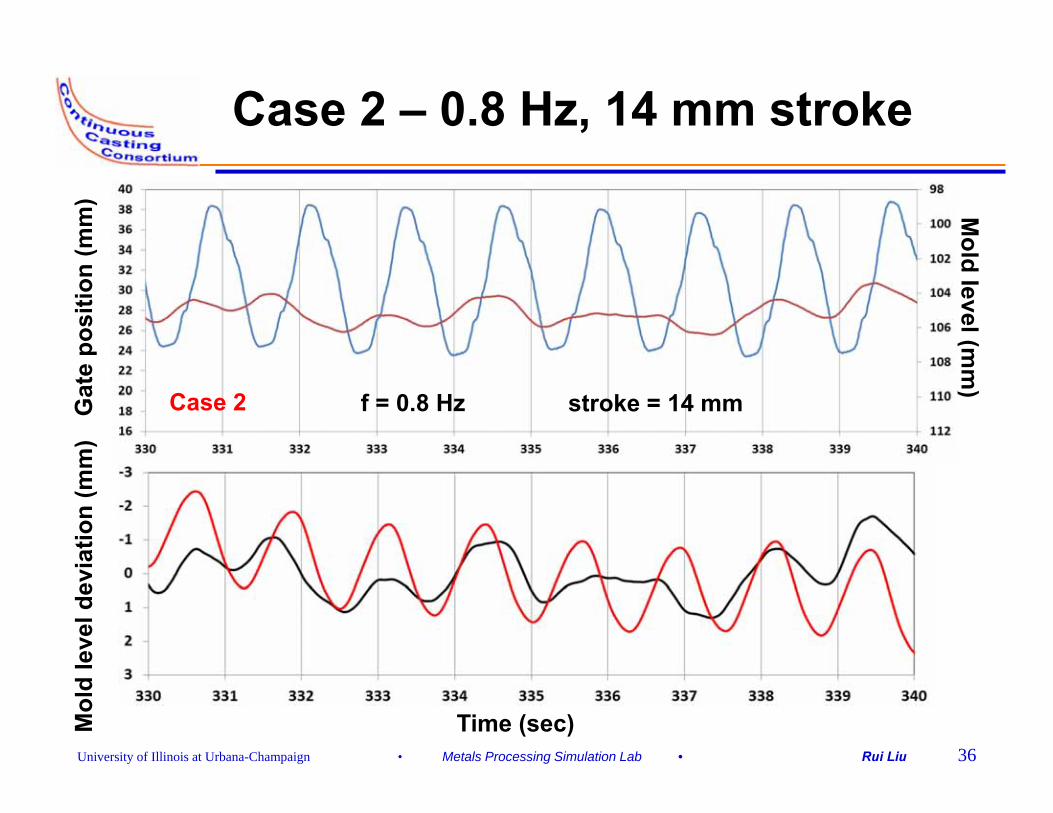
Gat
e po
sitio
n (m
m) M
old level (mm
)M
old
leve
l dev
iatio
n (m
m)
Time (sec)
f = 0.8 Hz stroke = 14 mmCase 2
Case 2 – 0.8 Hz, 14 mm stroke
University of Illinois at Urbana-Champaign • Metals Processing Simulation Lab • Rui Liu 37
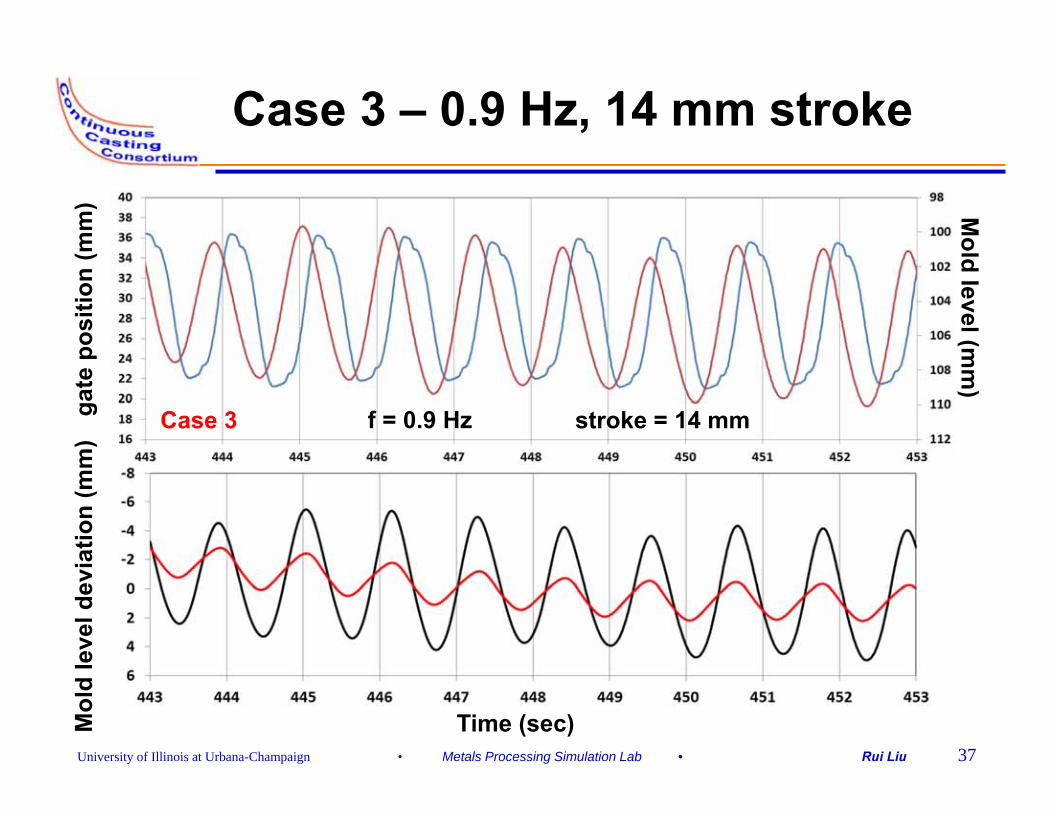
gate
pos
ition
(mm
) Mold level (m
m)
Mol
d le
vel d
evia
tion
(mm
)
Time (sec)
f = 0.9 Hz stroke = 14 mmCase 3
Case 3 – 0.9 Hz, 14 mm stroke
University of Illinois at Urbana-Champaign • Metals Processing Simulation Lab • Rui Liu 38
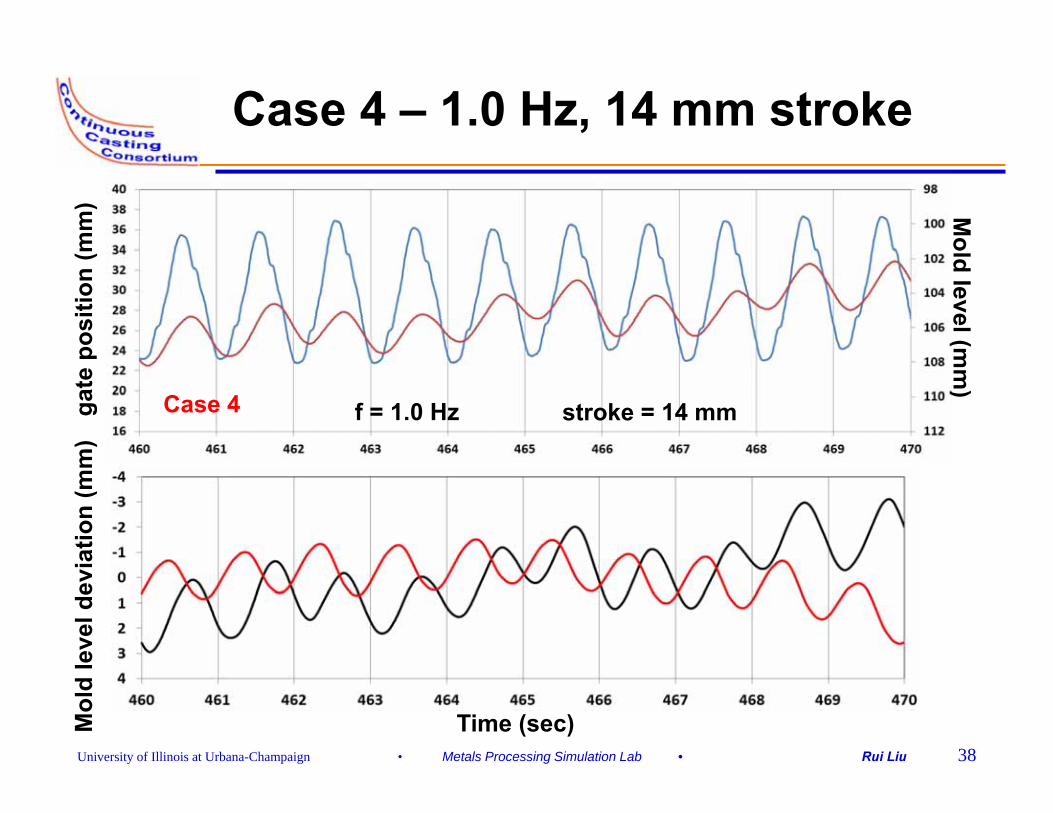
gate
pos
ition
(mm
) Mold level (m
m)
Mol
d le
vel d
evia
tion
(mm
)
Time (sec)
f = 1.0 Hz stroke = 14 mmCase 4
Case 4 – 1.0 Hz, 14 mm stroke
University of Illinois at Urbana-Champaign • Metals Processing Simulation Lab • Rui Liu 39
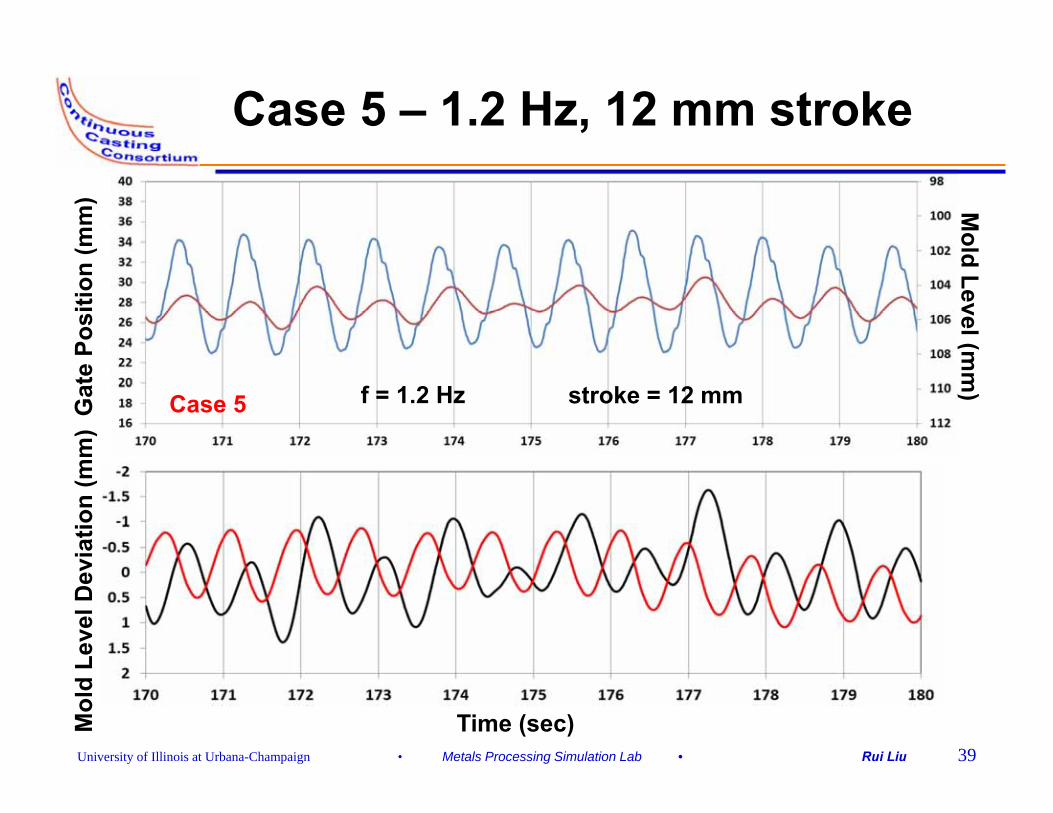
Gat
e Po
sitio
n (m
m) M
old Level (mm
)M
old
Leve
l Dev
iatio
n (m
m)
Time (sec)
f = 1.2 Hz stroke = 12 mmCase 5
Case 5 – 1.2 Hz, 12 mm stroke
University of Illinois at Urbana-Champaign • Metals Processing Simulation Lab • Rui Liu 40
gate
pos
ition
(mm
) Mold level (m
m)
Mol
d le
vel d
evia
tion
(mm
)
Time (sec)
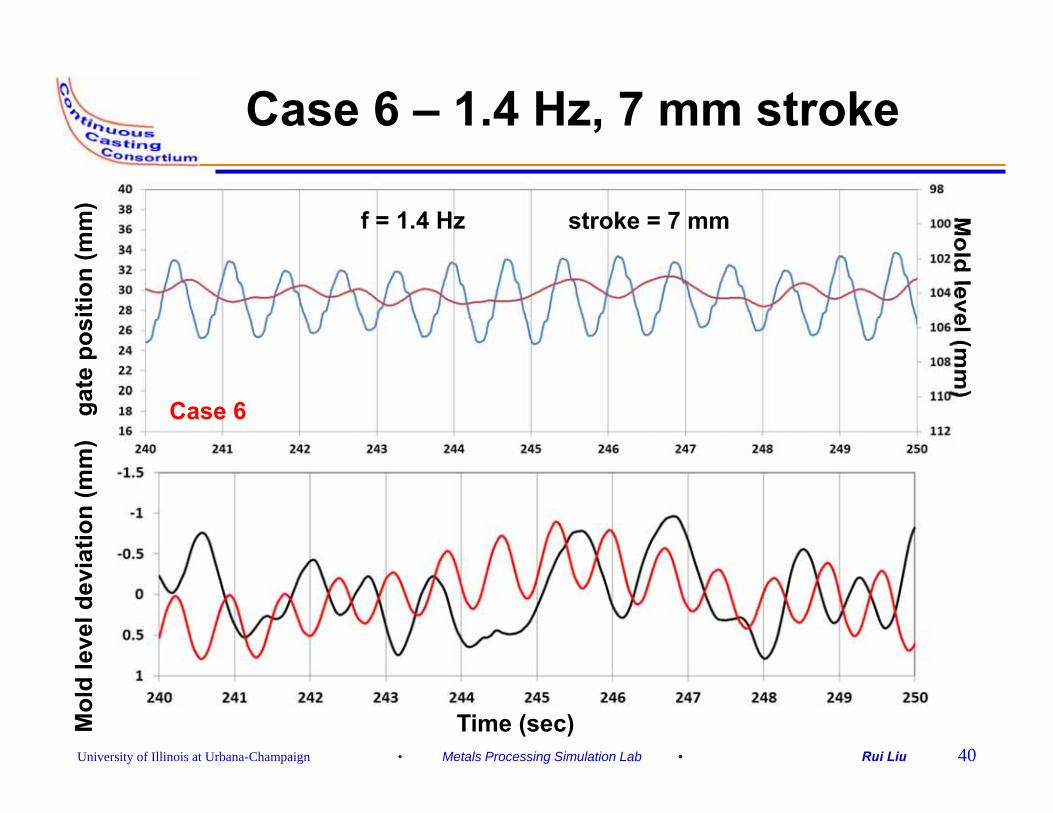
f = 1.4 Hz stroke = 7 mm
Case 6
Case 6 – 1.4 Hz, 7 mm stroke
University of Illinois at Urbana-Champaign • Metals Processing Simulation Lab • Rui Liu 41
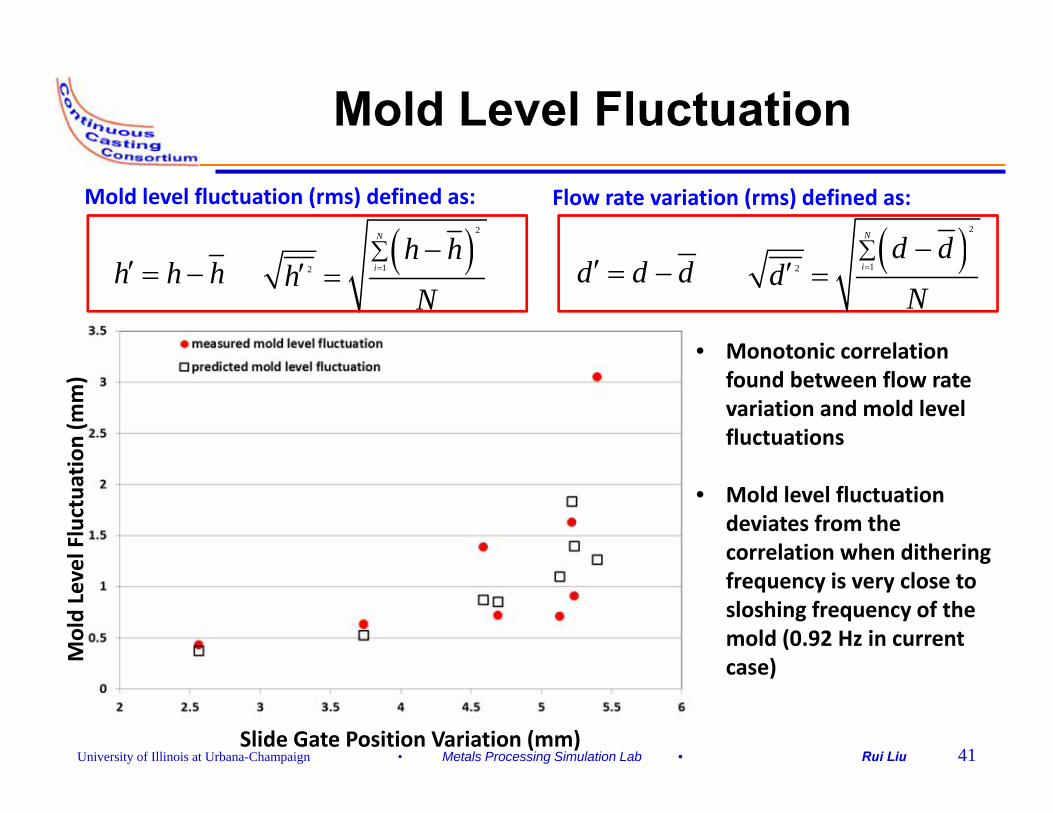
Mold Level Fluctuation
( )2
12
N
ih h
hN
=∑ −
′ =h h h′ = −
Mold level fluctuation (rms) defined as: Flow rate variation (rms) defined as:
• Monotonic correlation found between flow rate variation and mold level fluctuations
• Mold level fluctuation deviates from the correlation when dithering frequency is very close to sloshing frequency of the mold (0.92 Hz in current case)
Slide Gate Position Variation (mm)
Mold Level Fluctua
tion (m
m)
d d d′ = −( )2
12
N
id d
dN
=∑ −
′ =
University of Illinois at Urbana-Champaign • Metals Processing Simulation Lab • Rui Liu 42
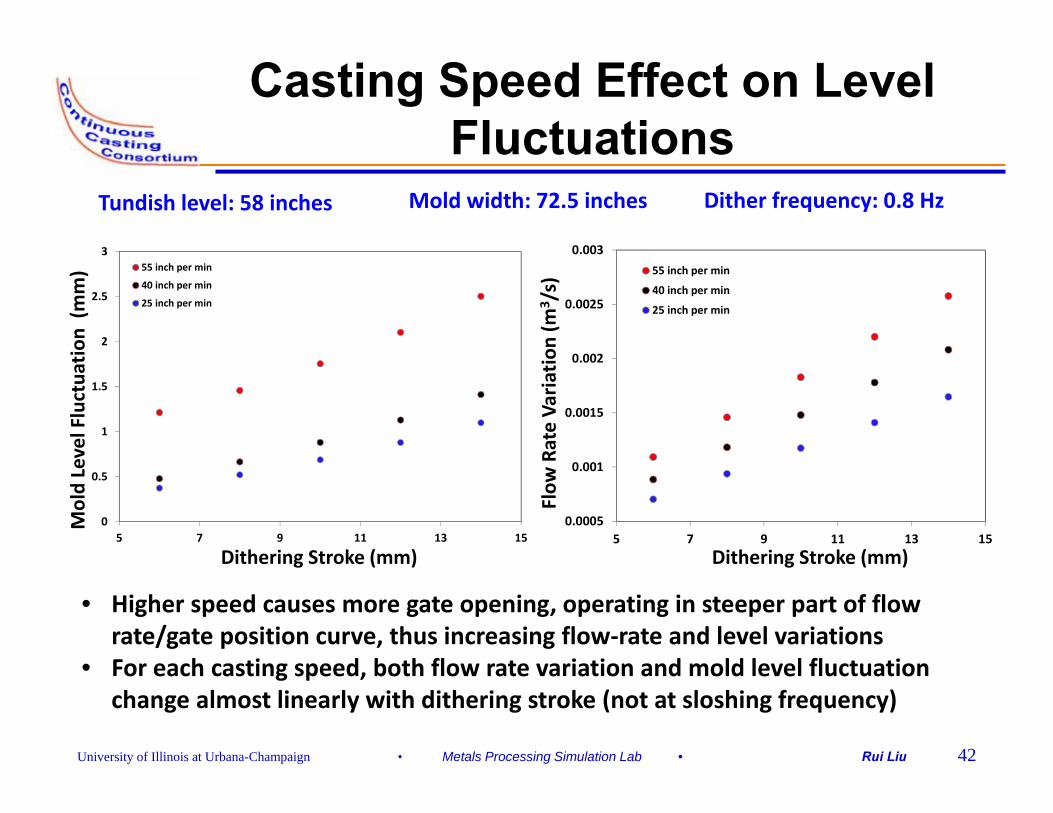
Casting Speed Effect on Level Fluctuations
Dithering Stroke (mm)
Mold Level Fluctua
tion (m
m)
0
0.5
1
1.5
2
2.5
3
5 7 9 11 13 15
55 inch per min
40 inch per min
25 inch per min
0.0005
0.001
0.0015
0.002
0.0025
0.003
5 7 9 11 13 15
55 inch per min
40 inch per min
25 inch per min
Dithering Stroke (mm)Flow
Rate Va
riatio
n (m
3 /s)
Tundish level: 58 inches Mold width: 72.5 inches
• Higher speed causes more gate opening, operating in steeper part of flow rate/gate position curve, thus increasing flow‐rate and level variations
• For each casting speed, both flow rate variation and mold level fluctuation change almost linearly with dithering stroke (not at sloshing frequency)
Dither frequency: 0.8 Hz
University of Illinois at Urbana-Champaign • Metals Processing Simulation Lab • Rui Liu 43
Slide Gate CylinderConnecting Block
L = 2 mm
d = 1 mm
L = 2 mm
d = 0 mm
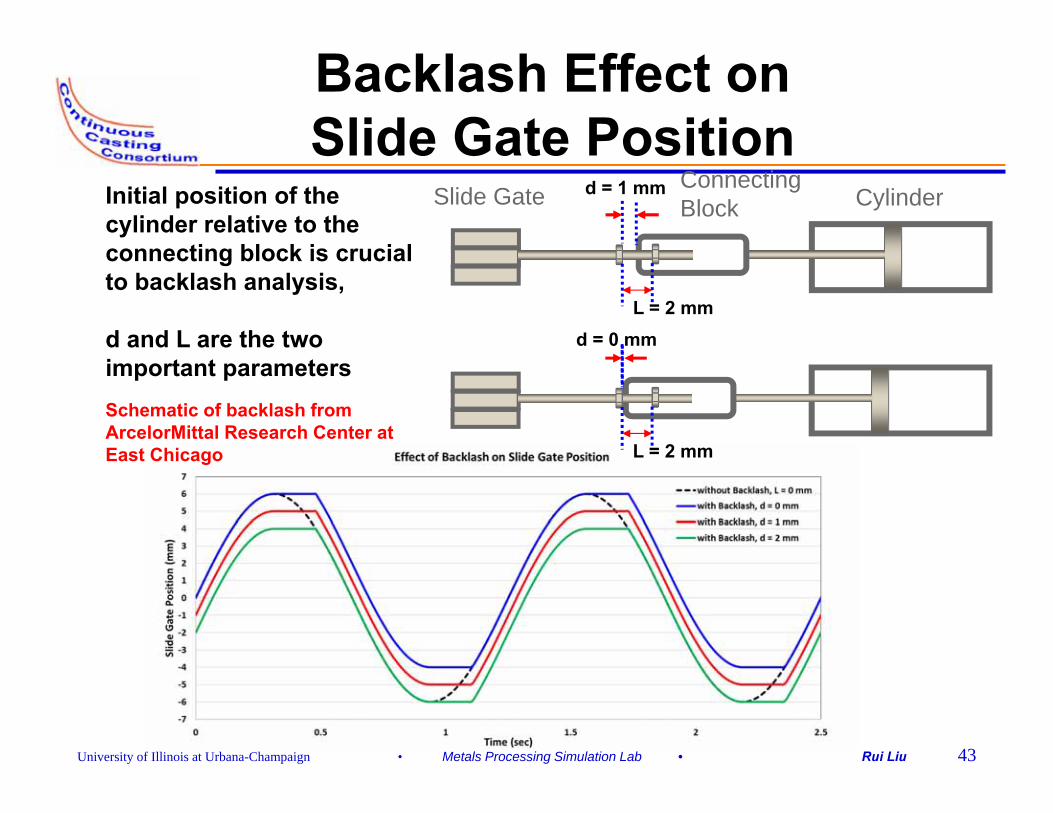
Initial position of the cylinder relative to the connecting block is crucial to backlash analysis,
d and L are the two important parameters
Backlash Effect on Slide Gate Position
Schematic of backlash from ArcelorMittal Research Center at East Chicago
University of Illinois at Urbana-Champaign • Metals Processing Simulation Lab • Rui Liu 44
Conclusions – Part 3
• Dithering frequency does not affect mold level fluctuations unless it is very close to the sloshing frequency of the mold (less than ±0.1 Hz);
• Predicted mold level fluctuation matches reasonably well with measurements, which proves the potential use of the simple analytical model during dithering;
• Flow rate variation during dithering is approximately linearly correlated with dithering stroke;
• Increasing casting speed or tundish level increases mold level fluctuation by opening the slide-gate wider, which creates more flow rate variation during dithering.
University of Illinois at Urbana-Champaign • Metals Processing Simulation Lab • Rui Liu 45
• Effects of backlash on mold level fluctuation is complicated:– both “actual” slide-gate position and dithering
stroke are affected by backlash;– Initial position of slide-gate, together with the
initial relative position of connecting block and cylinder determines the actual flow rate and flow rate variation during dithering;
– Slide-gate dithering from a steady gate position for a casting speed will cause mold level to rise, thus the average position of the slide-gate dithering should be calibrated taking into account both local slope of flow rate curve and backlash effect.
Conclusions – Part 3 (cont.)
University of Illinois at Urbana-Champaign • Metals Processing Simulation Lab • Rui Liu 46
Future Work
• Multiphase flow modeling– CU-FLOW GPU code development with Eulerian-
Lagrangian approach to model two phase bubbly flows in CC process;
– model validation using water model PIV experiment• More parametric study cases with:
– the effect of mold width on flow rate variation and mold level fluctuation
– backlash effect on flow rate during dithering
University of Illinois at Urbana-Champaign • Metals Processing Simulation Lab • Rui Liu 47
Acknowledgements
• Continuous Casting Consortium Members(ABB, ArcelorMittal, Baosteel, Tata Steel, Magnesita Refractories, Nucor Steel, Nippon Steel, Postech, Posco, SSAB, ANSYS-Fluent)
• Hongbin Yin, Tathagata Bhattacharya, Love Kalra, Kai Zheng, William Umlauf and Aloka Dasgupta in ArcelorMittal East Chicago research center
• Jean-Francois Domgin in ArcelorMittal Maizières France and Joydeep Sengupta in ArcelorMittal Dofasco in Canada
• Students in Metals Processing Simualtion Lab in UIUC