Embed Size (px)
Citation preview

Sociedad
1
Información
Sesión 9
Indice de próximas sesiones
2
1. Introducción2. Tecnología y sociedad se co-producen (1)3. ¿De qué hablamos cuando hablamos de
Internet?4. Internet: Un cruce de culturas5. Tecnología y sociedad se co-producen (2)6. Visiones de la sociedad de la información7. Web 2.0, Social Media y afines8. Comunicación y sociedad 9. Nueva (o no) Economía10. Libertad y ‘cultura free’

3
Sesión 9:
Nuevas(s) Economía(s)

4
• Comentarios y cuestiones sobre el blog• Debate: “Metafísica de las redes sociales”• Teoría 9: Nueva(s) Economía(s)
Plan de la Sesión:
5
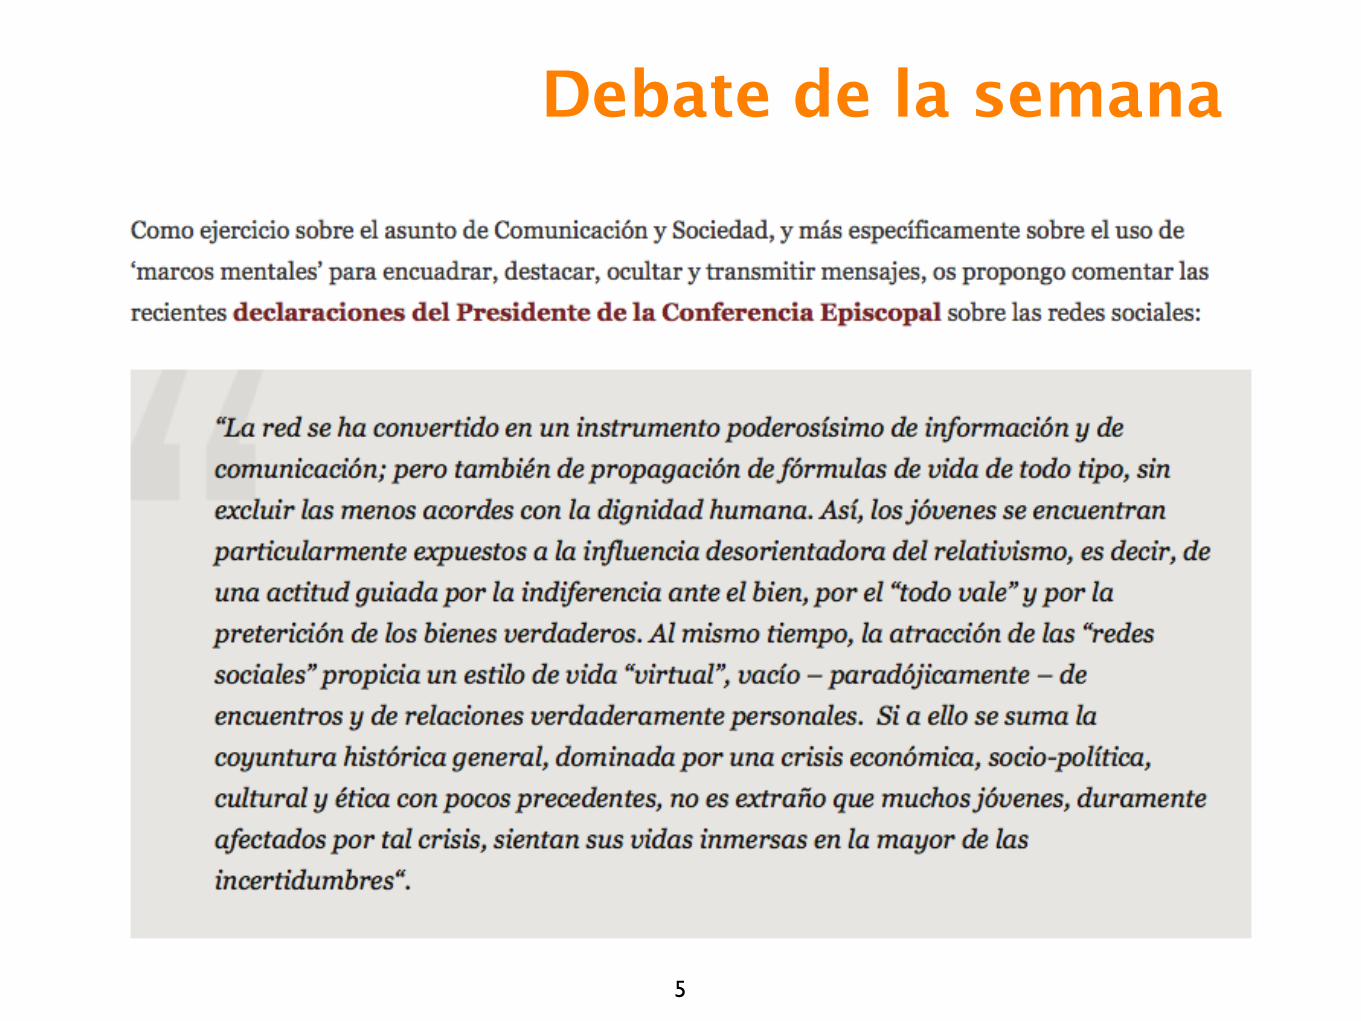
Debate de la semana

6
Sesión 9:
Nueva(s) Economía(s)
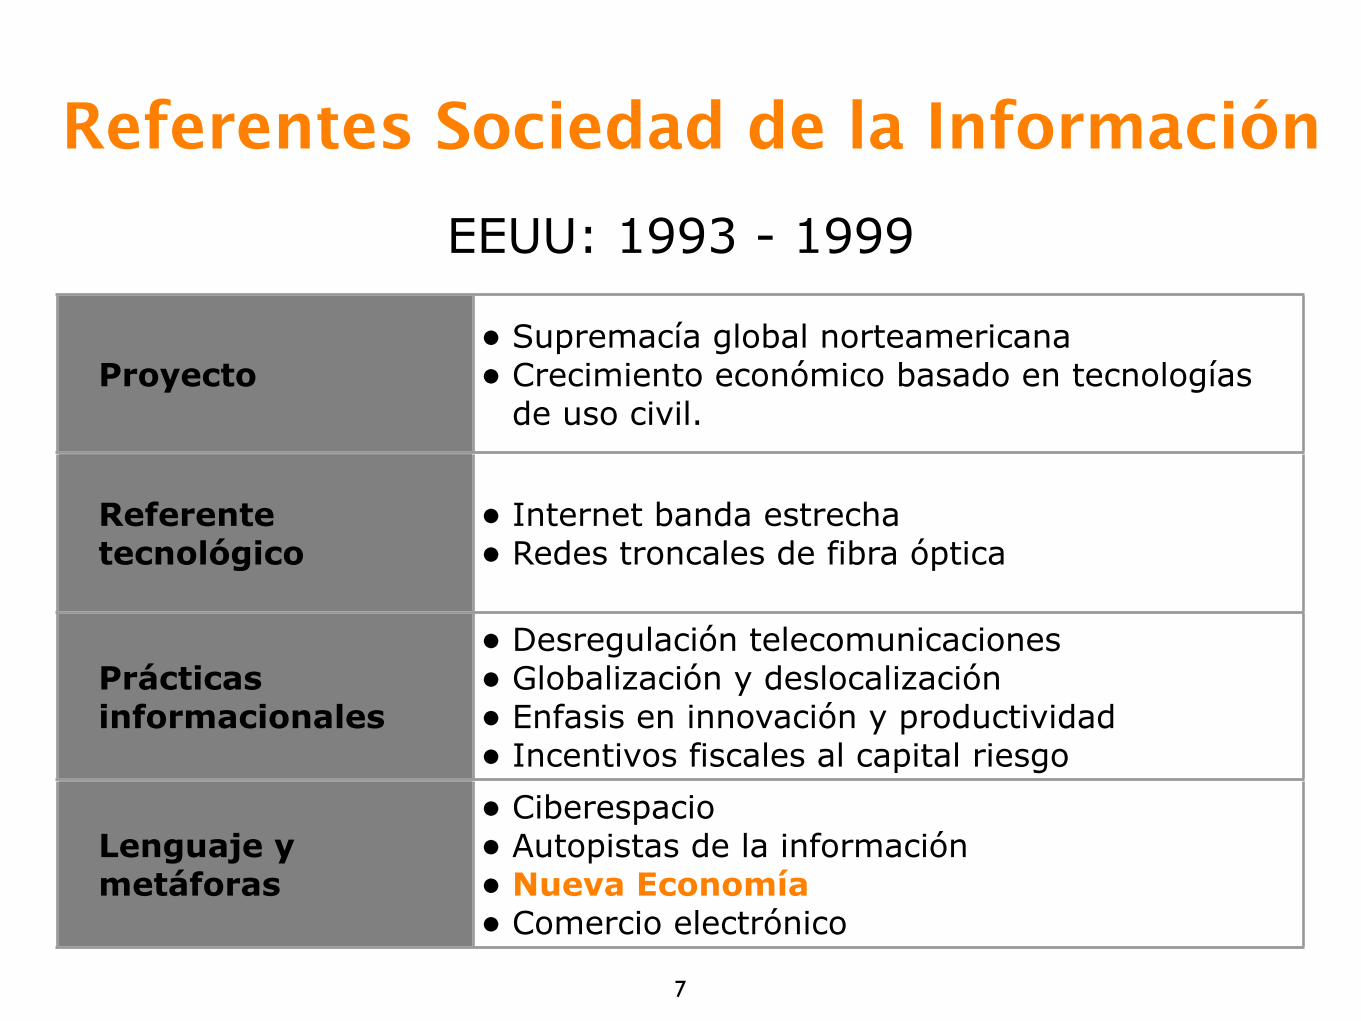
Proyecto• Supremacía global norteamericana• Crecimiento económico basado en tecnologías
de uso civil.
Referente tecnológico
• Internet banda estrecha• Redes troncales de fibra óptica
Prácticas informacionales
• Desregulación telecomunicaciones• Globalización y deslocalización• Enfasis en innovación y productividad• Incentivos fiscales al capital riesgo
Lenguaje y metáforas
• Ciberespacio• Autopistas de la información• Nueva Economía• Comercio electrónico
EEUU: 1993 - 1999
7
Referentes Sociedad de la Información
8
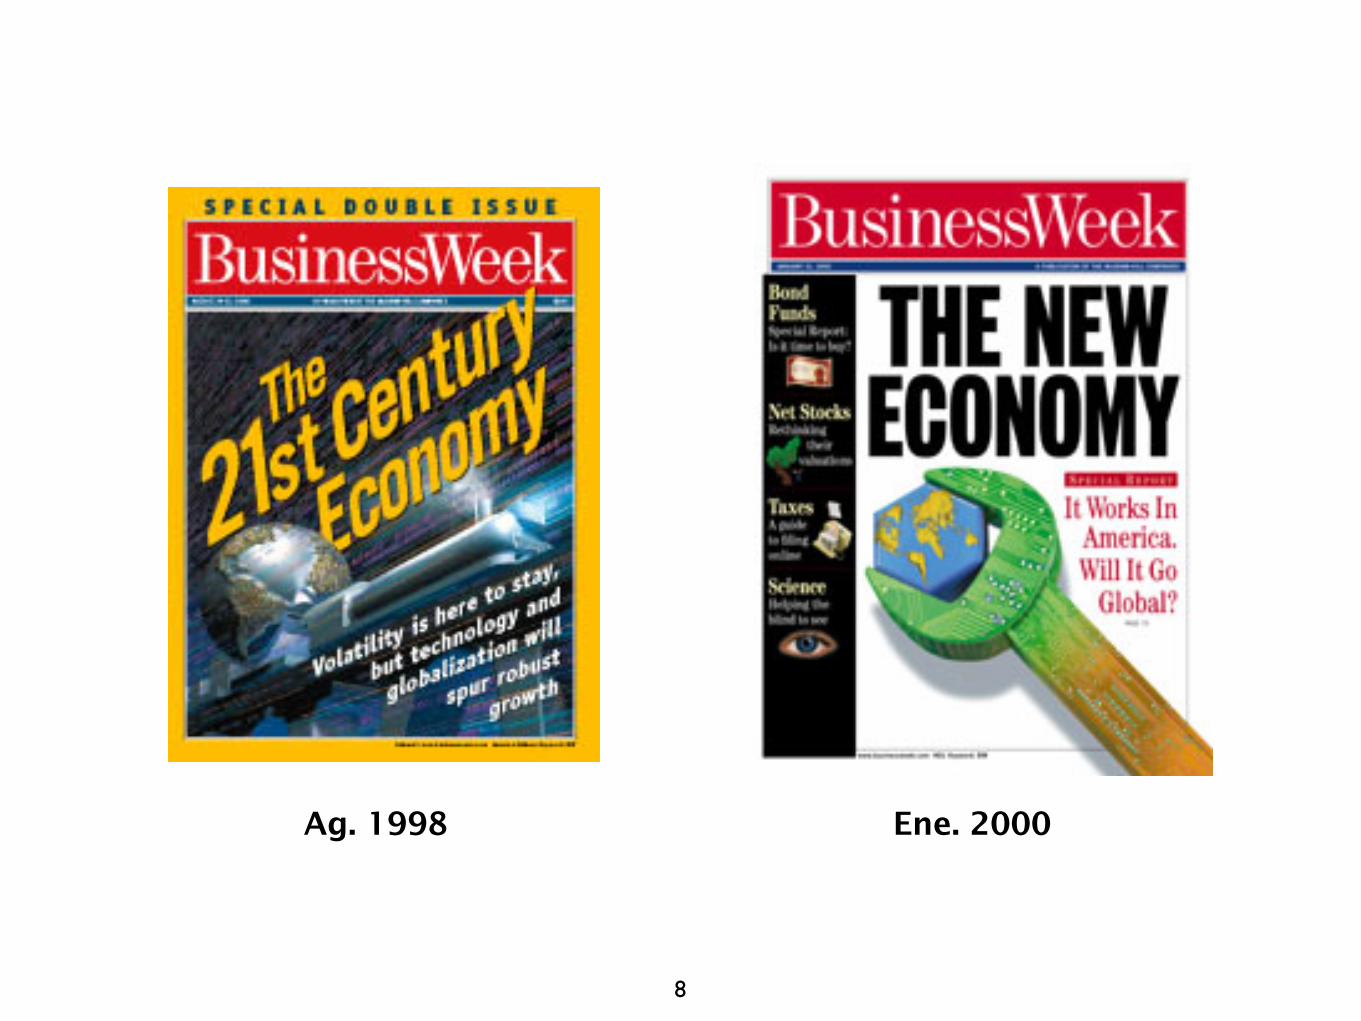
Ag. 1998 Ene. 2000
9
10
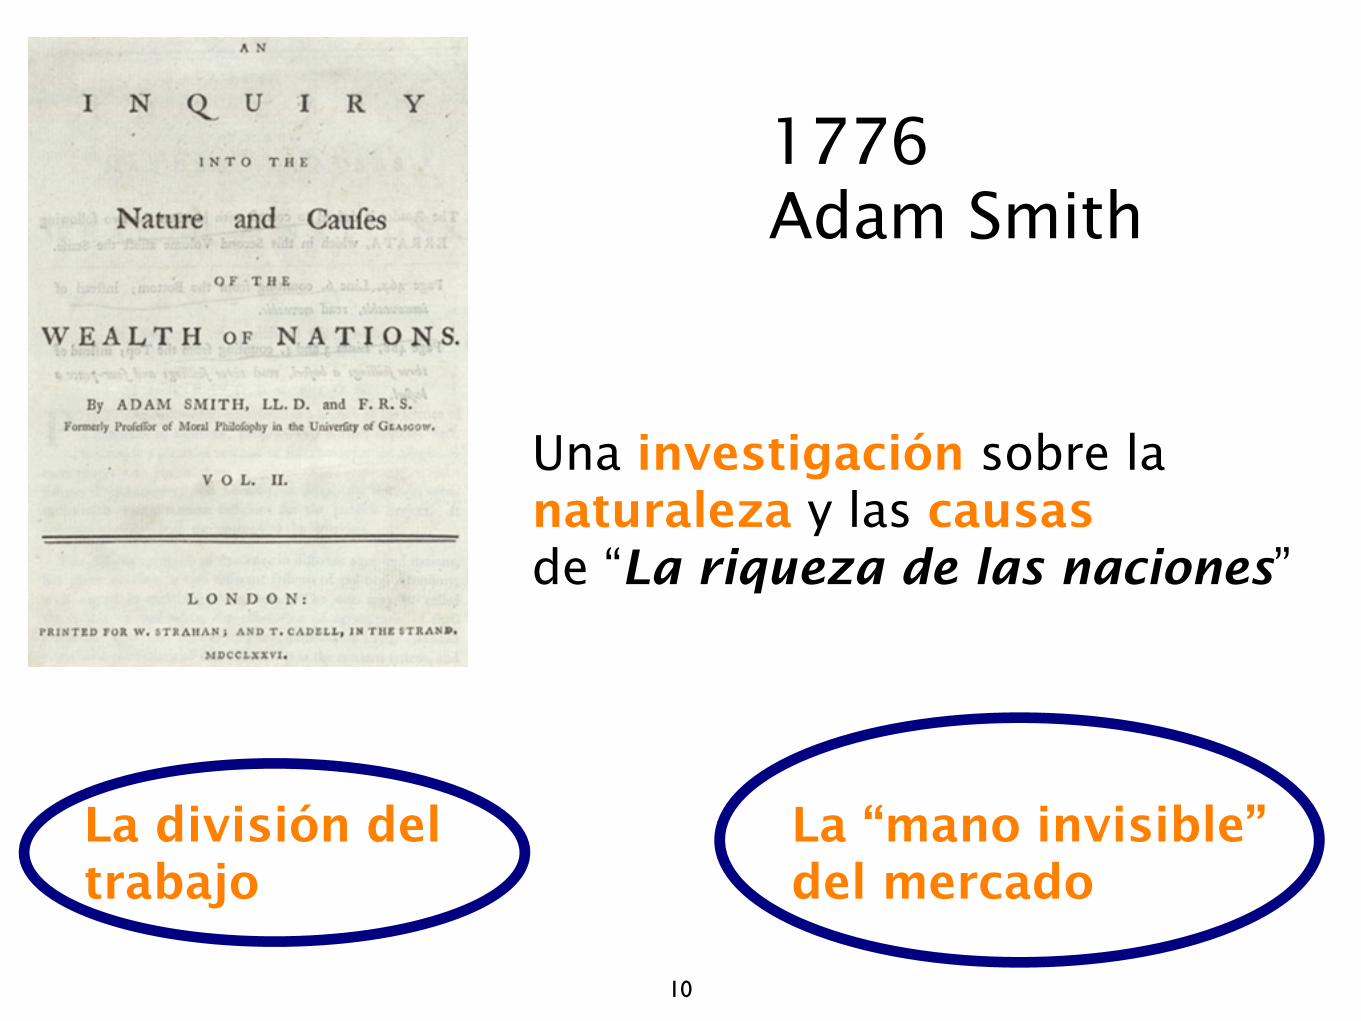
1776Adam Smith
Una investigación sobre la naturaleza y las causasde “La riqueza de las naciones”
La división deltrabajo
La “mano invisible”del mercado
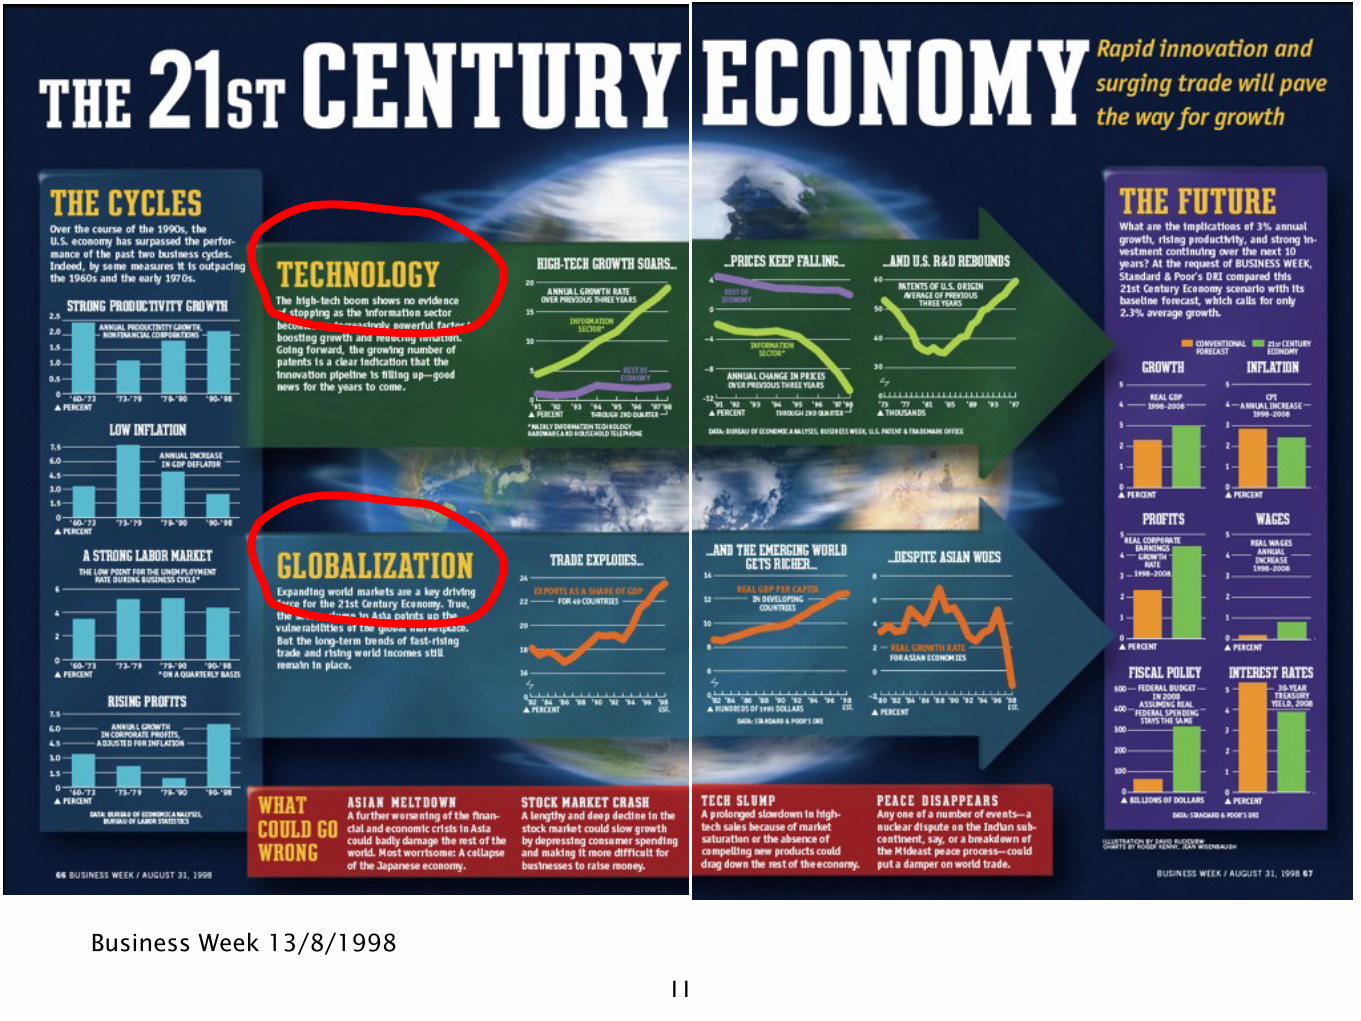
11
Business Week 13/8/1998
12
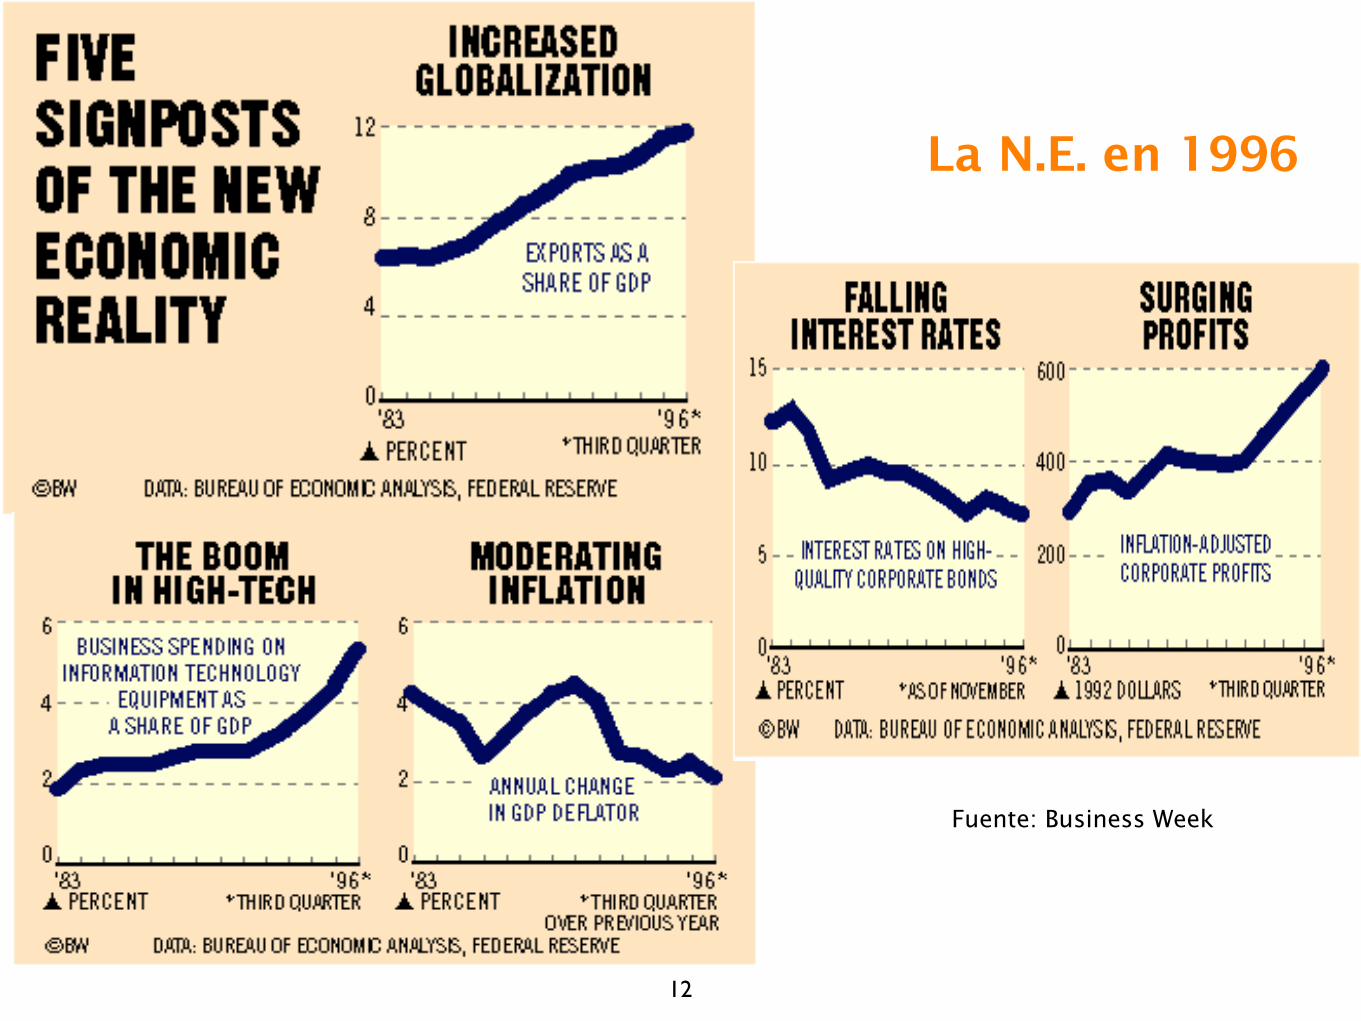
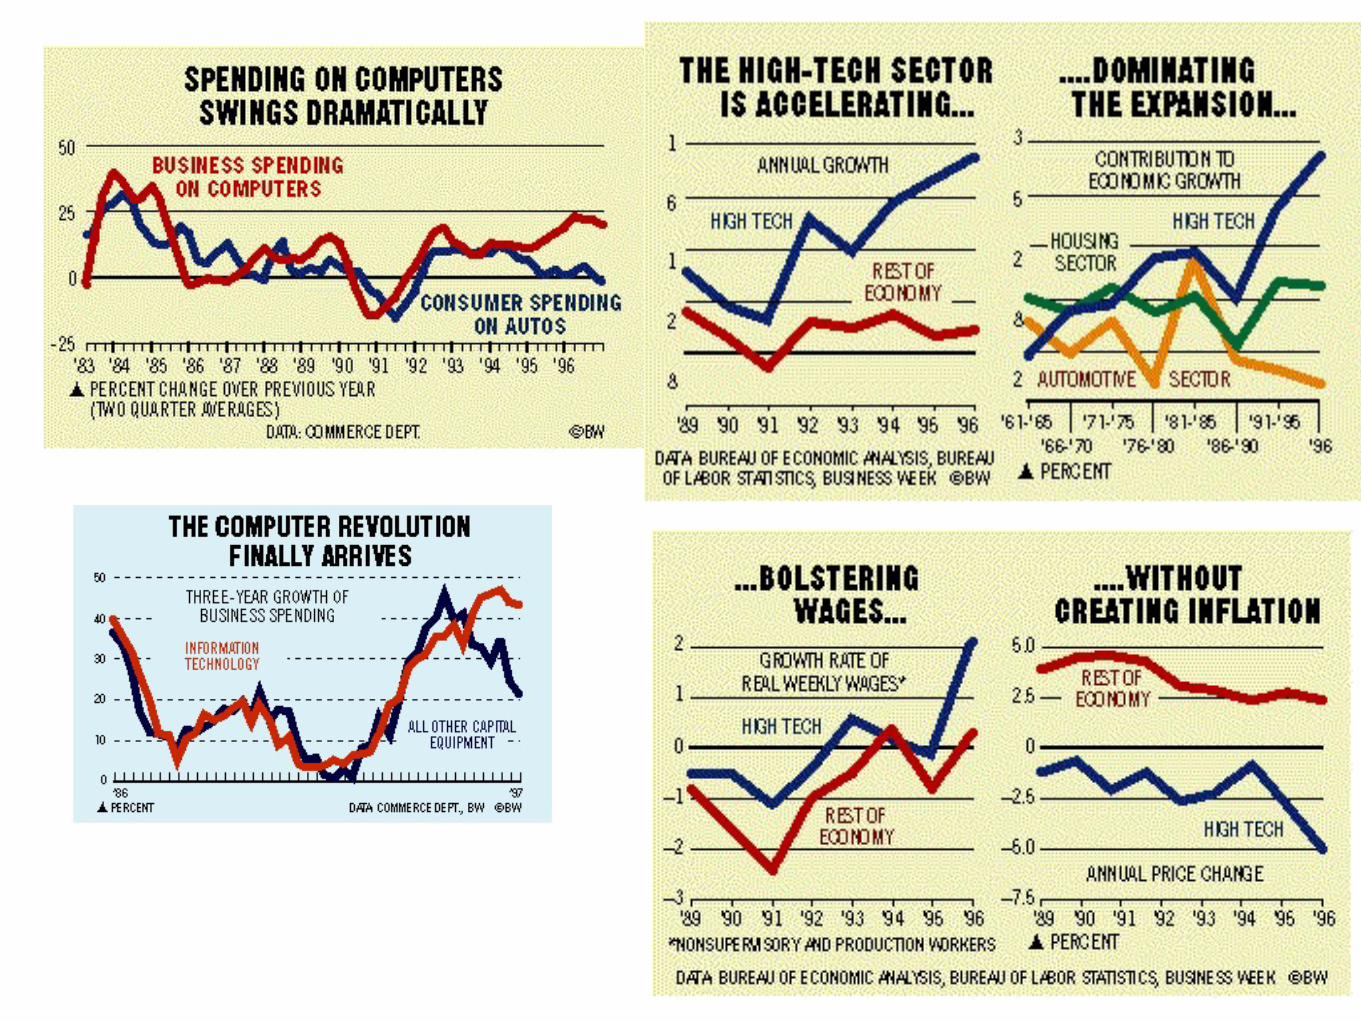
La N.E. en 1996
Fuente: Business Week
13
14
15
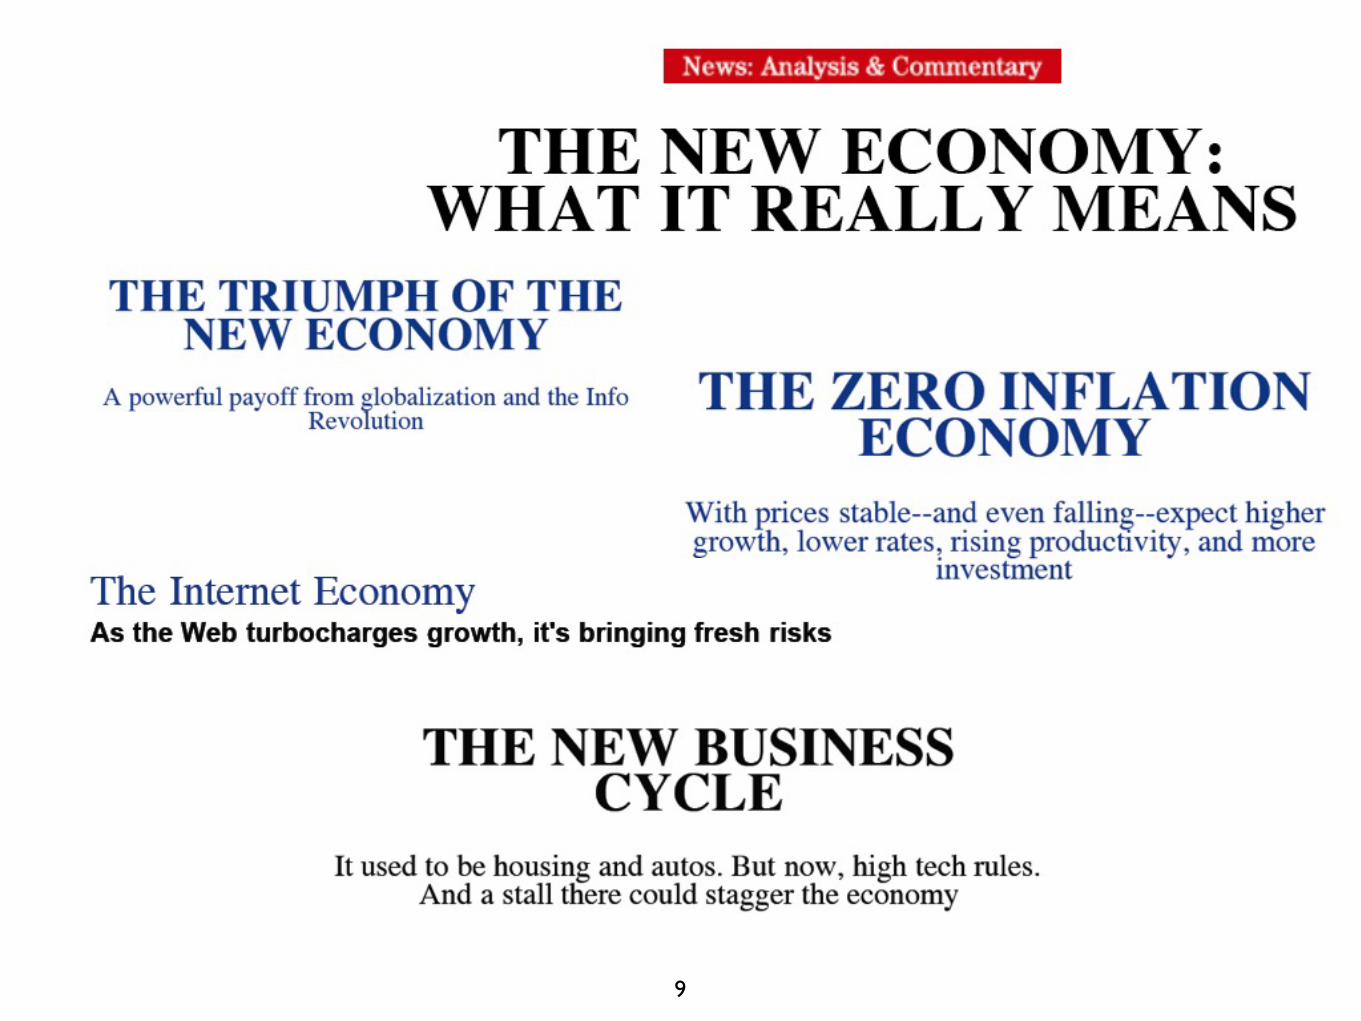
Nueva Economía
El concepto “nueva economía”, uno de los alias del proyecto de sociedad de la información, empezó a tomar cuerpo hacia 1995.
En términos técnicos, lo que caracterizaba a la llamada nueva economía era la combinación simultánea de :
✓ Altas tasas de crecimiento económico
✓ Bajos tipos de interés
✓ Inflación moderada
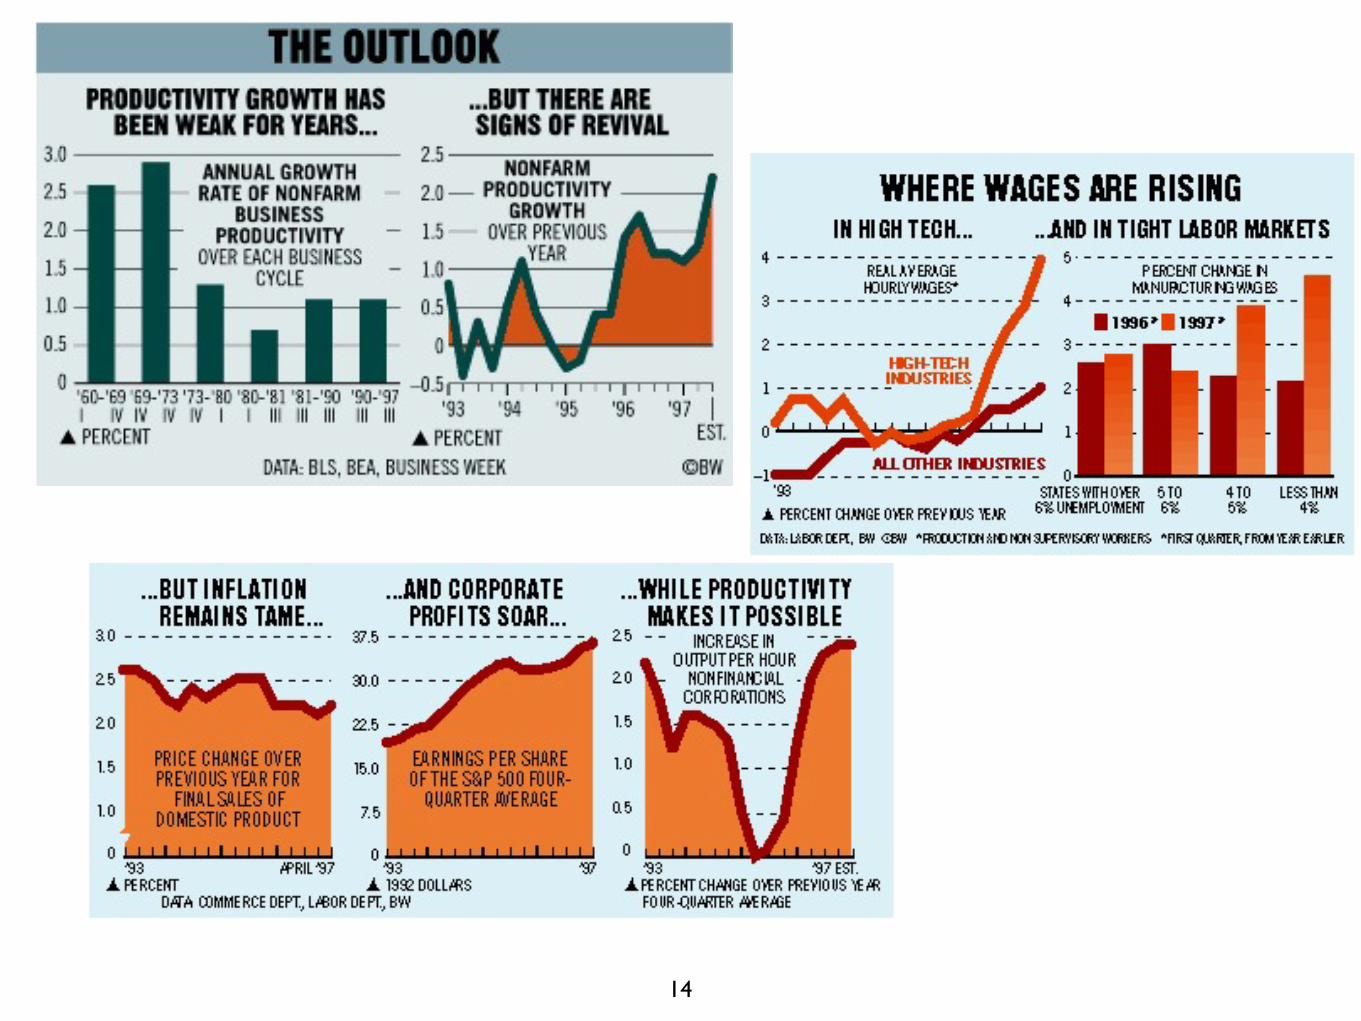
✓ Aumentos de productividad, atribuidos en parte a la aplicación de las tecnologías de la información
16
La cuestión de la productividad
Durante varias décadas a partir de los años 70, se dio la “paradoja de la productividad”:
✓ “Puede verse la era del ordenador por todas partes, excepto en las estadísticas de productividad” (Robert Solow)
✓ Strassmann (1997), "Computers Have Yet To Make Companies More Productive". Accesible en http://www.strassmann.com/pubs/cw/yetprod.shtml
A partir de finales de los 90 se ha constatado que algunos países han crecido a base de aumentos sostenibles de productividad.
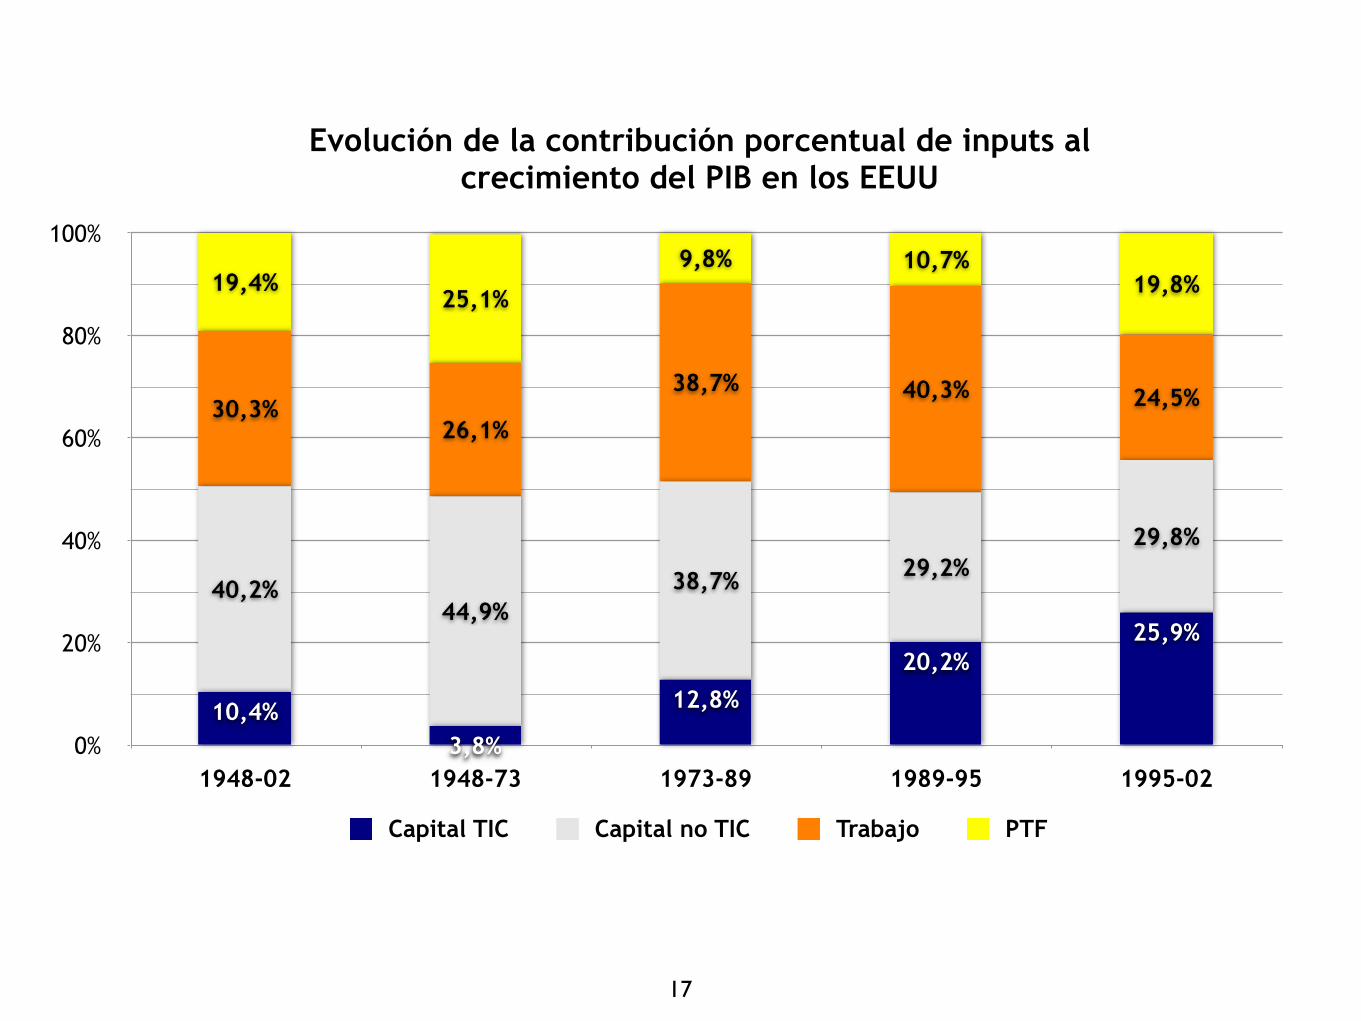
0%
20%
40%
60%
80%
100%
1948-02 1948-73 1973-89 1989-95 1995-02
19,8%10,7%9,8%
25,1%19,4%
24,5%40,3%38,7%
26,1%30,3%
29,8%29,2%38,7%
44,9%40,2%
25,9%20,2%
12,8%
3,8%10,4%
Capital TIC Capital no TIC Trabajo PTF
Evolución de la contribución porcentual de inputs al crecimiento del PIB en los EEUU
17
18
La ideología de la Nueva Economía
Las recetas (a veces argumentadas, a veces ideológicas) de la nueva economía incluyen :
✓ Incentivar una cultura de emprendedores y de innovación
✓ Reestructurar las empresas para recortar costes y aumentar la flexibilidad
✓ Abrir los mercados de capitales
✓ Desarrollar el capital riesgo y las salidas de empresas a Bolsa.
✓ Ajustar la política monetaria, manteniendo tipos de interés bajos.
✓ Aumentar las inversiones de TIC
✓ Liberalizar los mercados de telecomunicaciones y el de trabajo
19
“La construcción de un sistema técnico que involucra a seres humanos como parte de su funcionamiento requiere una reconstrucción de los roles y las reglas sociales”
(Winner : 27)
20
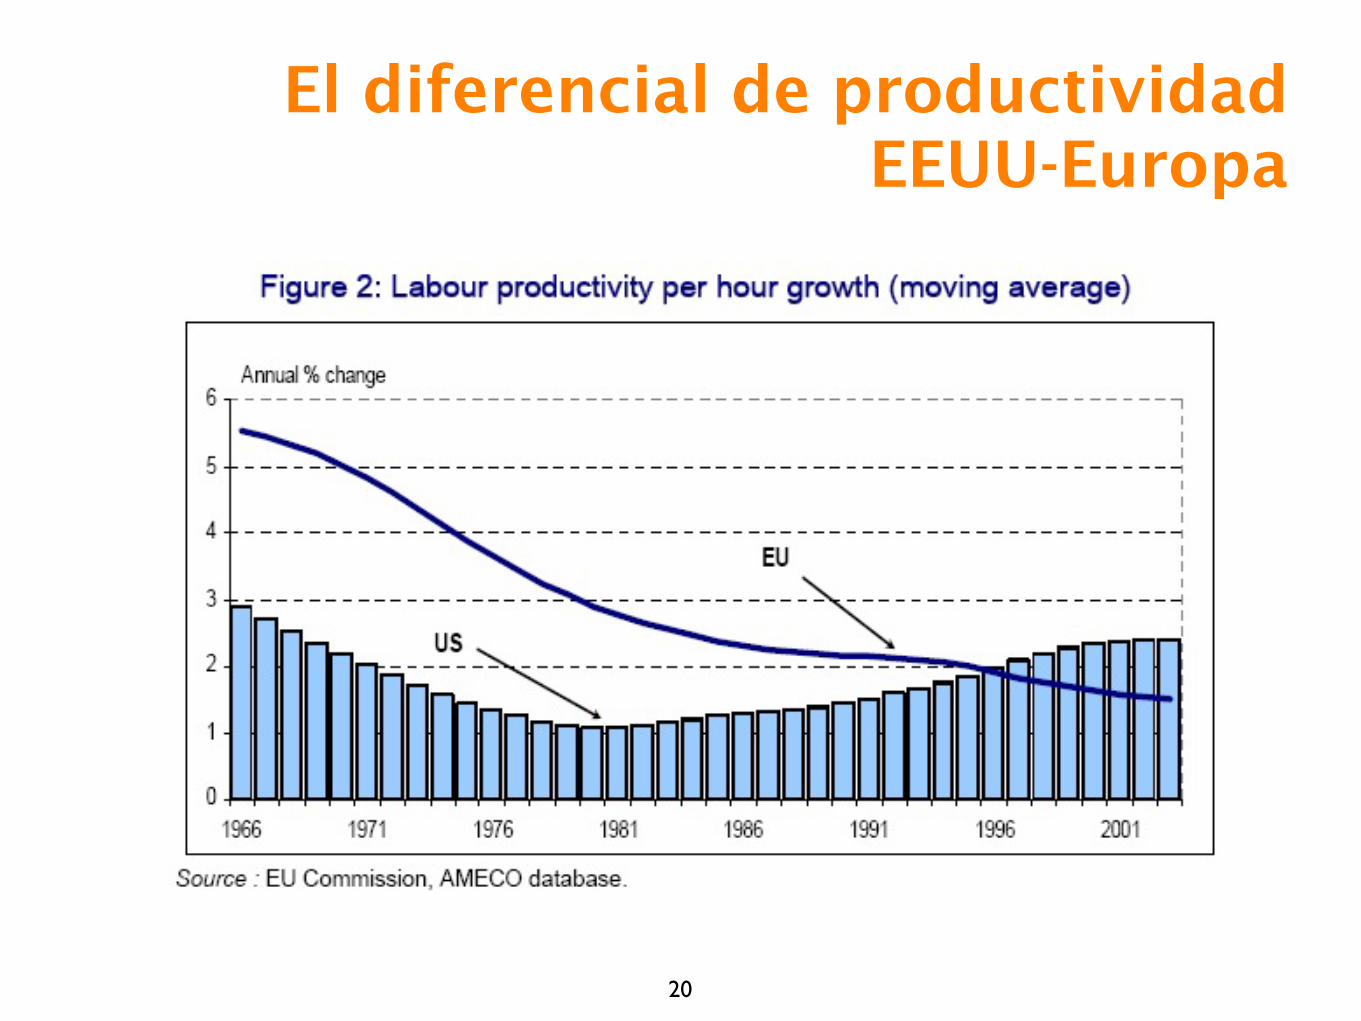
El diferencial de productividad EEUU-Europa
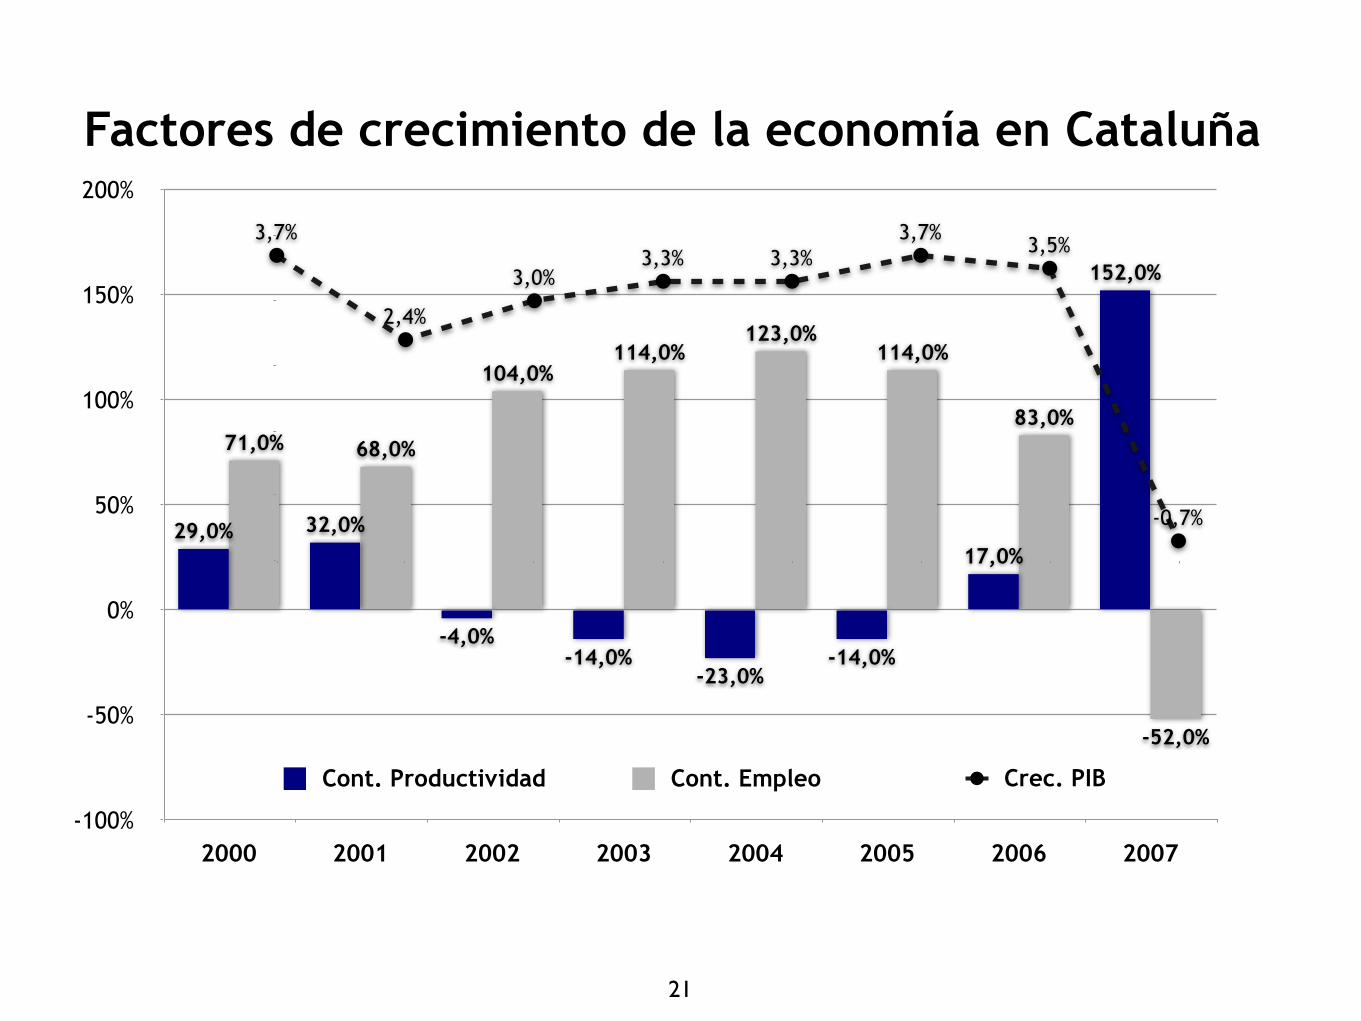
-100%
-50%
0%
50%
100%
150%
200%
2000 2001 2002 2003 2004 2005 2006 2007
-52,0%
83,0%
114,0%123,0%
114,0%104,0%
68,0%71,0%
152,0%
17,0%
-14,0%-23,0%
-14,0%-4,0%
32,0%29,0%
Cont. Productividad Cont. Empleo
3,7%
2,4%
3,0%3,3% 3,3%
3,7%3,5%
-0,7%
Crec. PIB
21
Factores de crecimiento de la economía en Cataluña
22
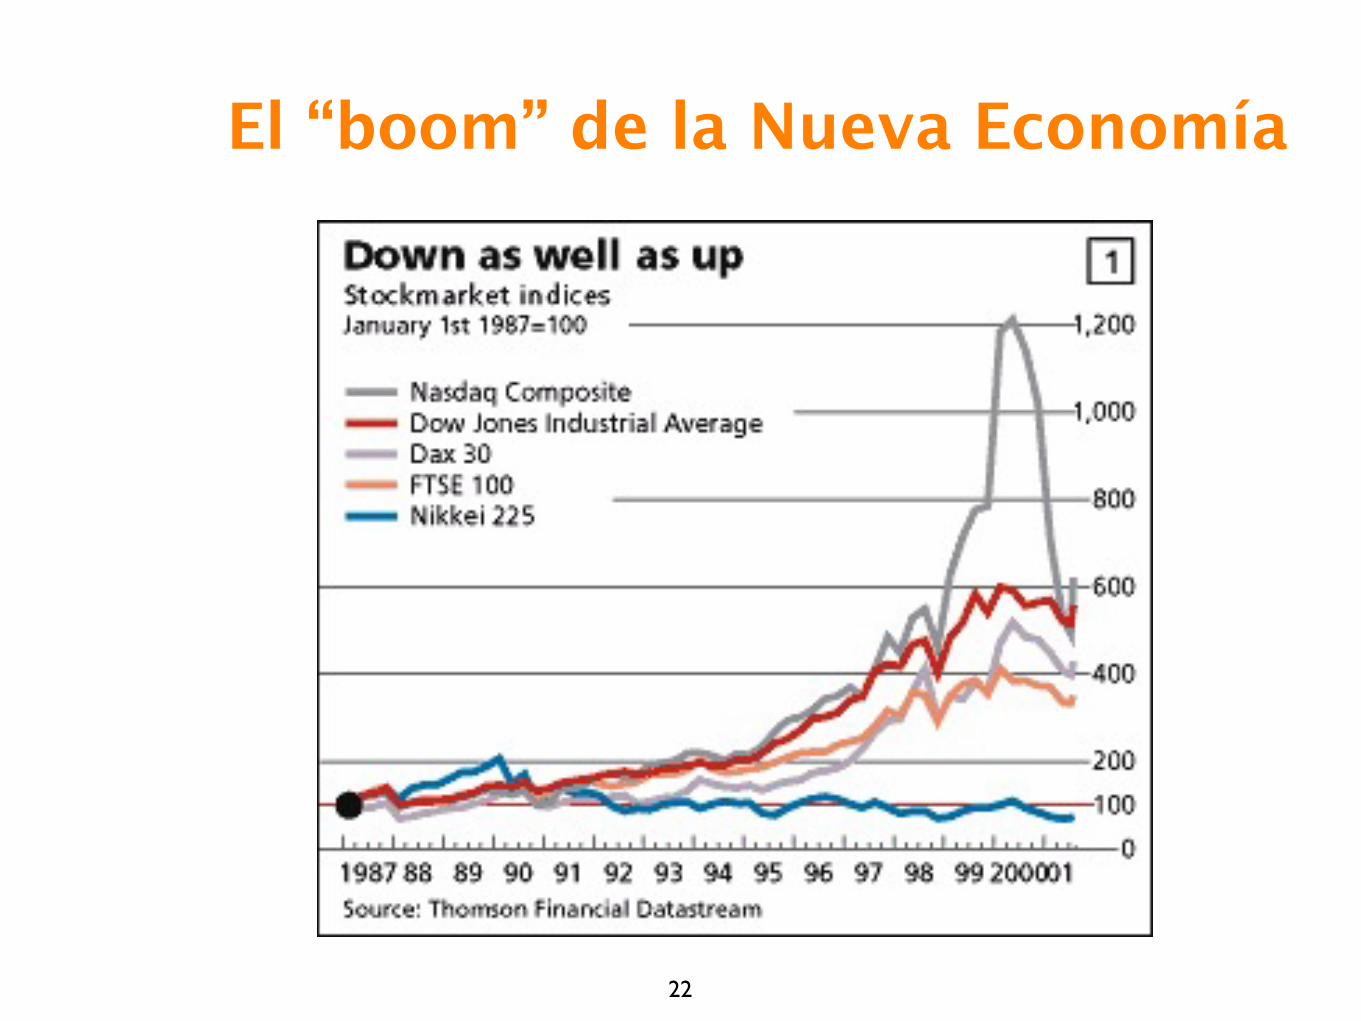
El “boom” de la Nueva Economía
23
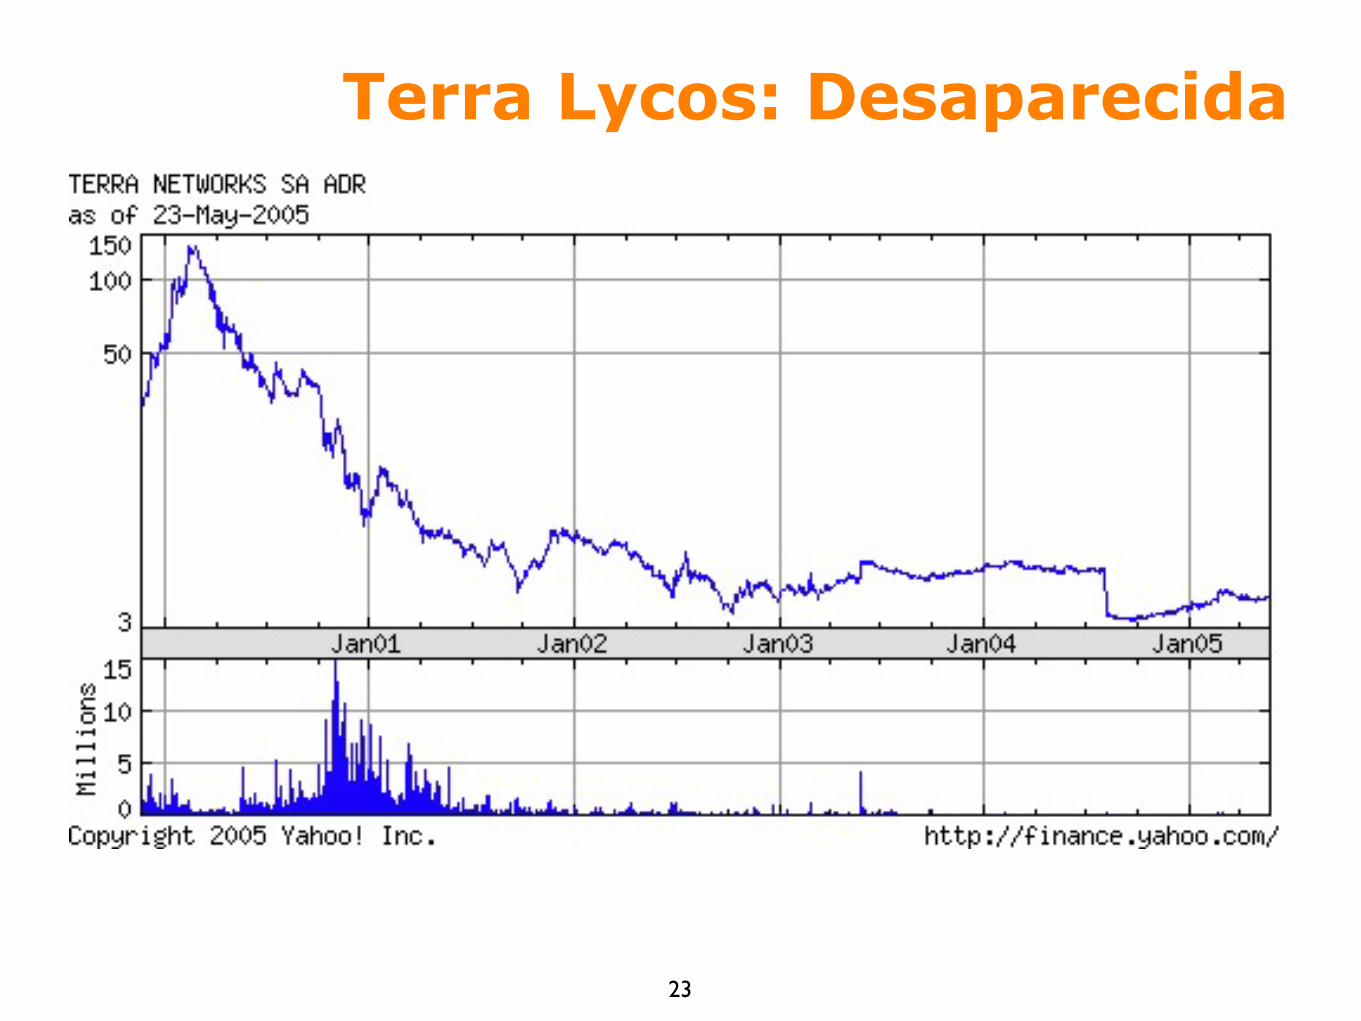
Terra Lycos: Desaparecida

© Arquetip Lab S.L. 24
1996
25
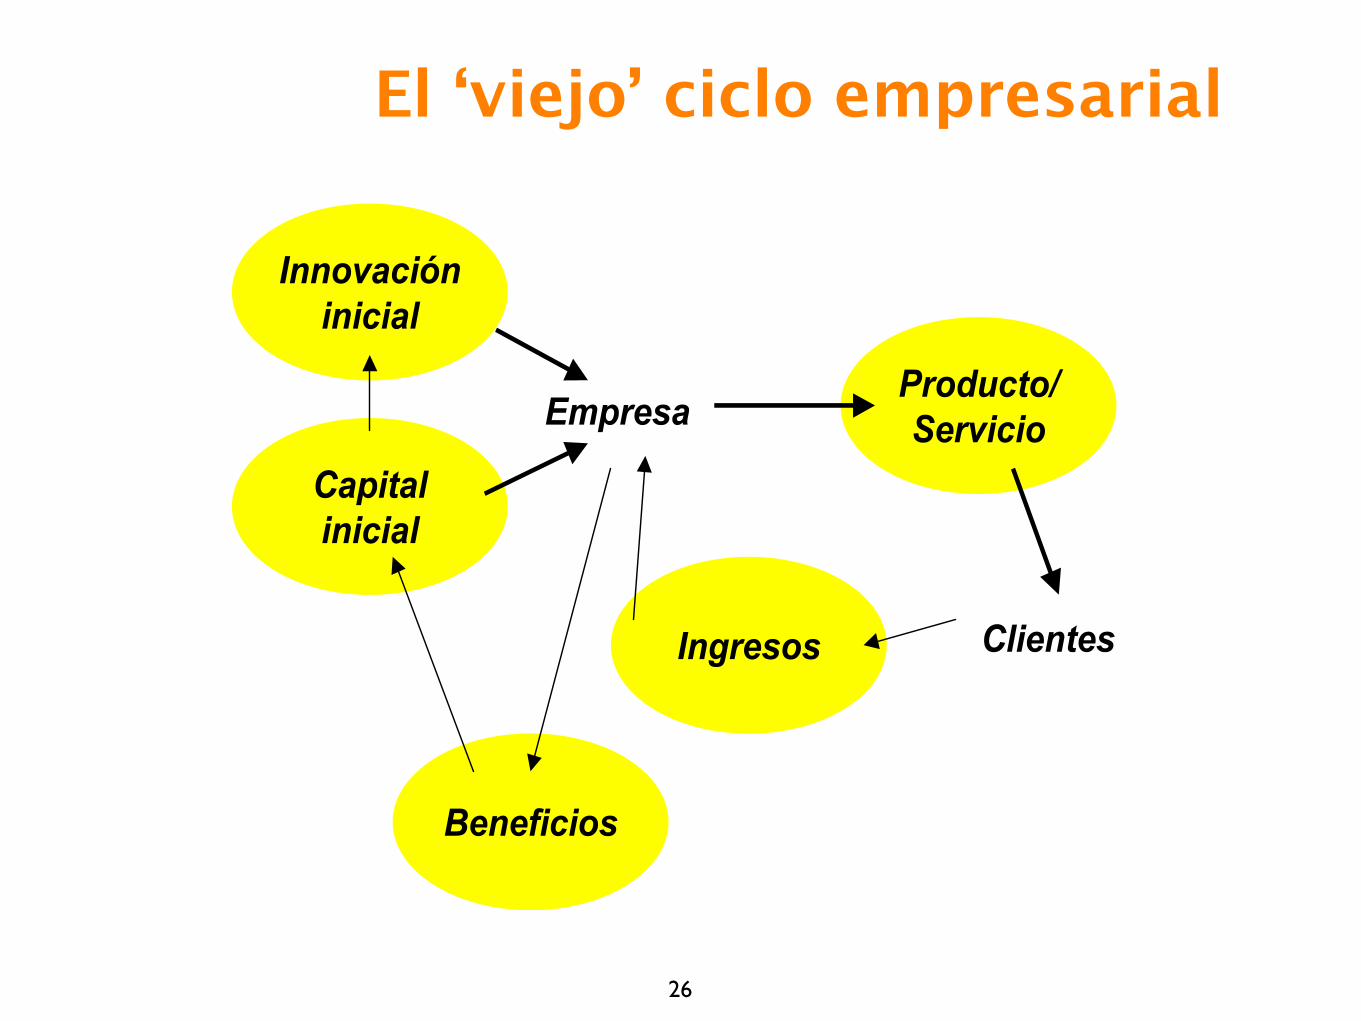
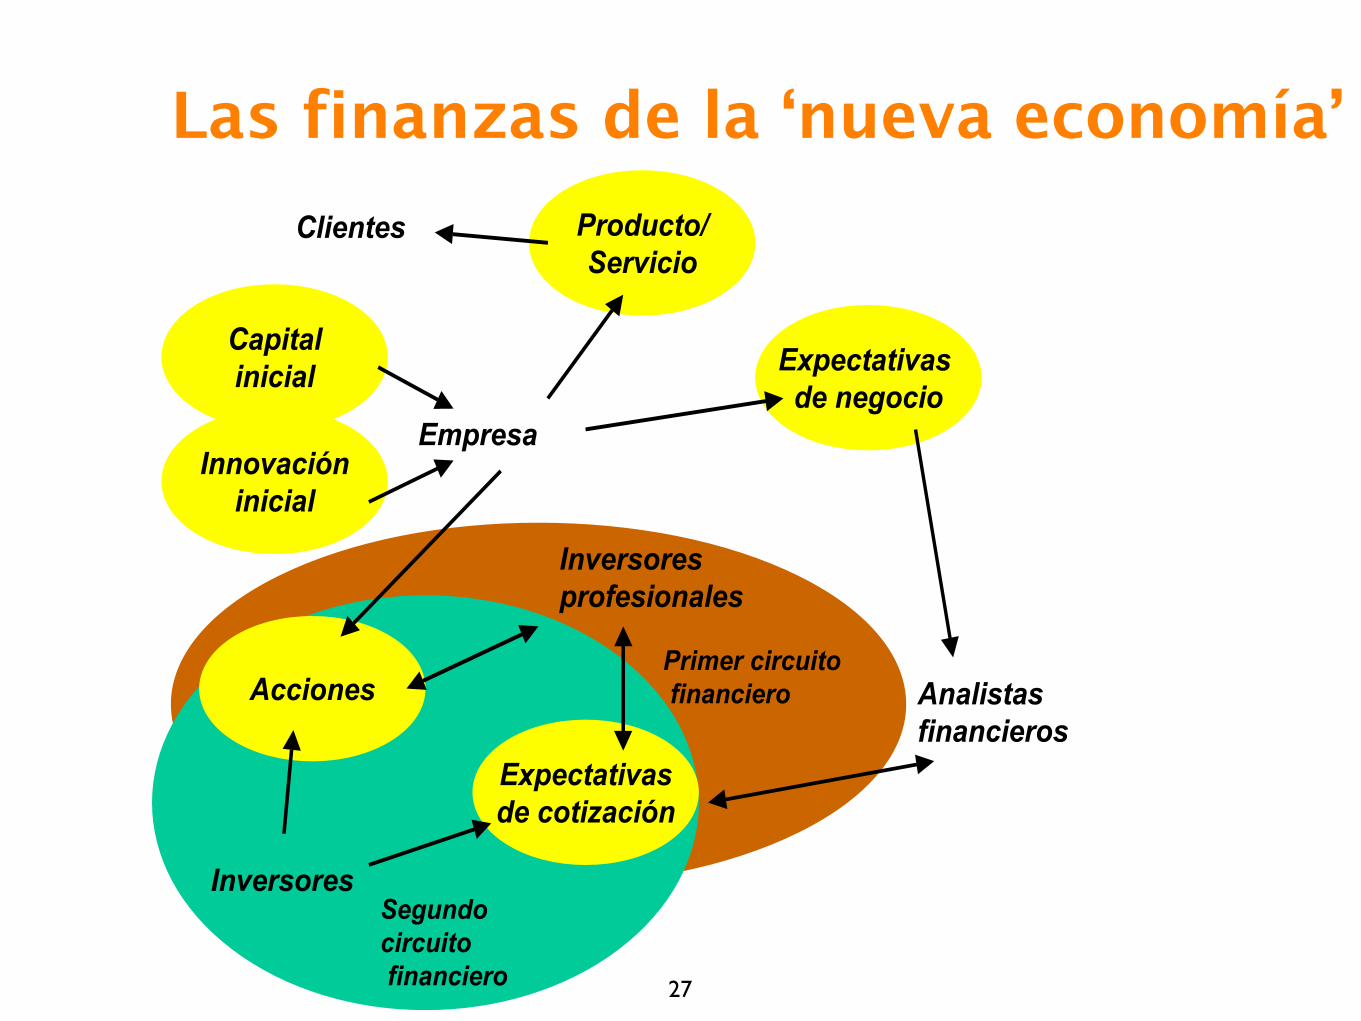
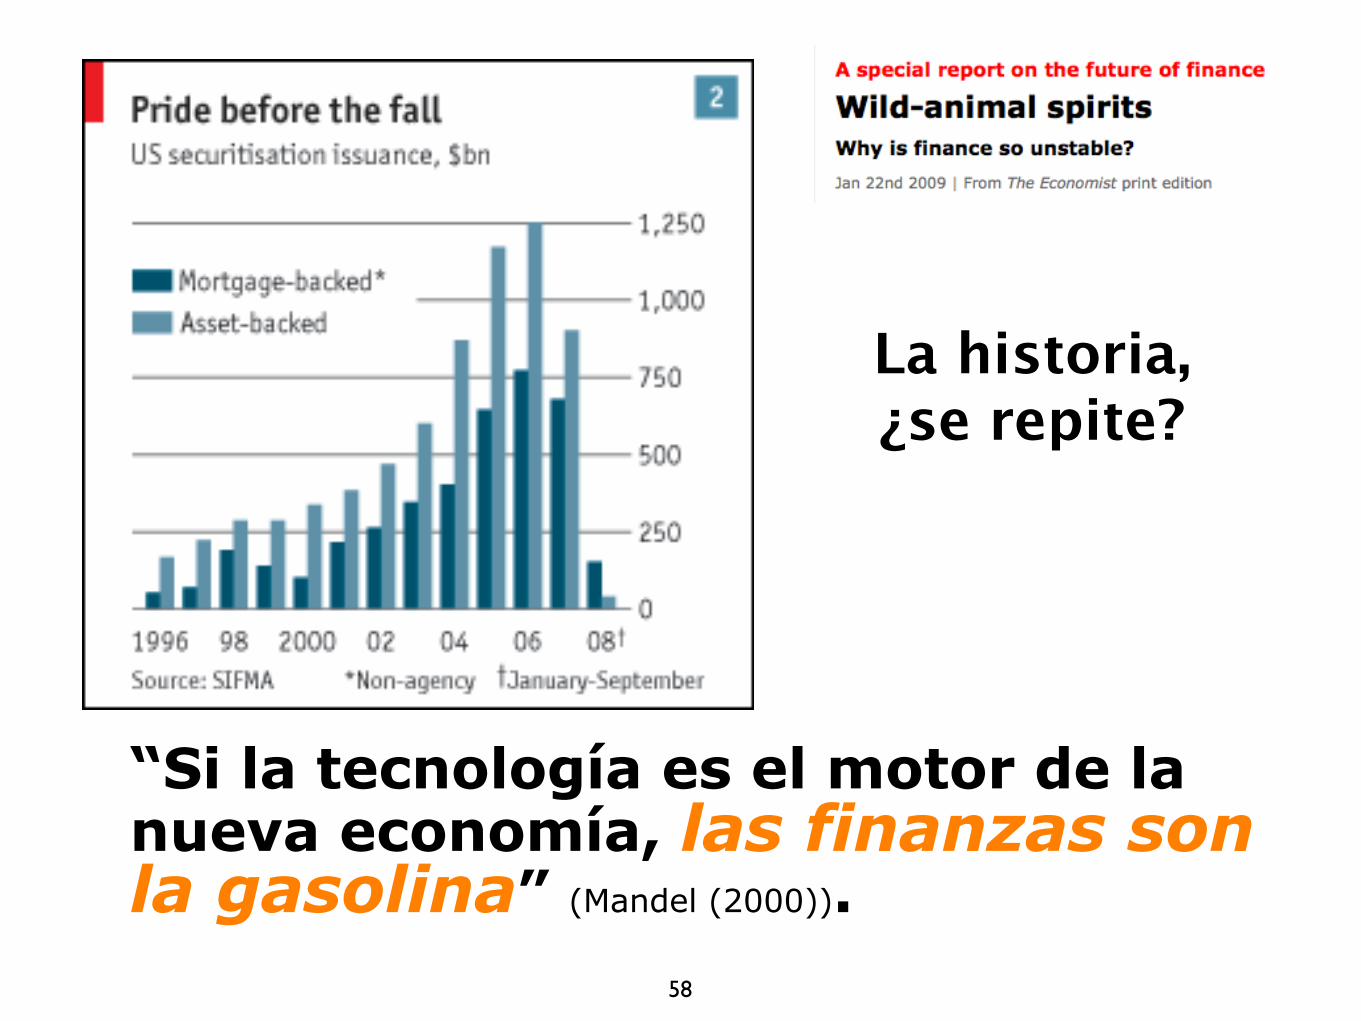
“Si la tecnología es el motor de la nueva economía, las finanzas son la gasolina” (Mandel (2000)).
¿Qué explica las ‘burbujas’?
26
El ‘viejo’ ciclo empresarial
27
Las finanzas de la ‘nueva economía’
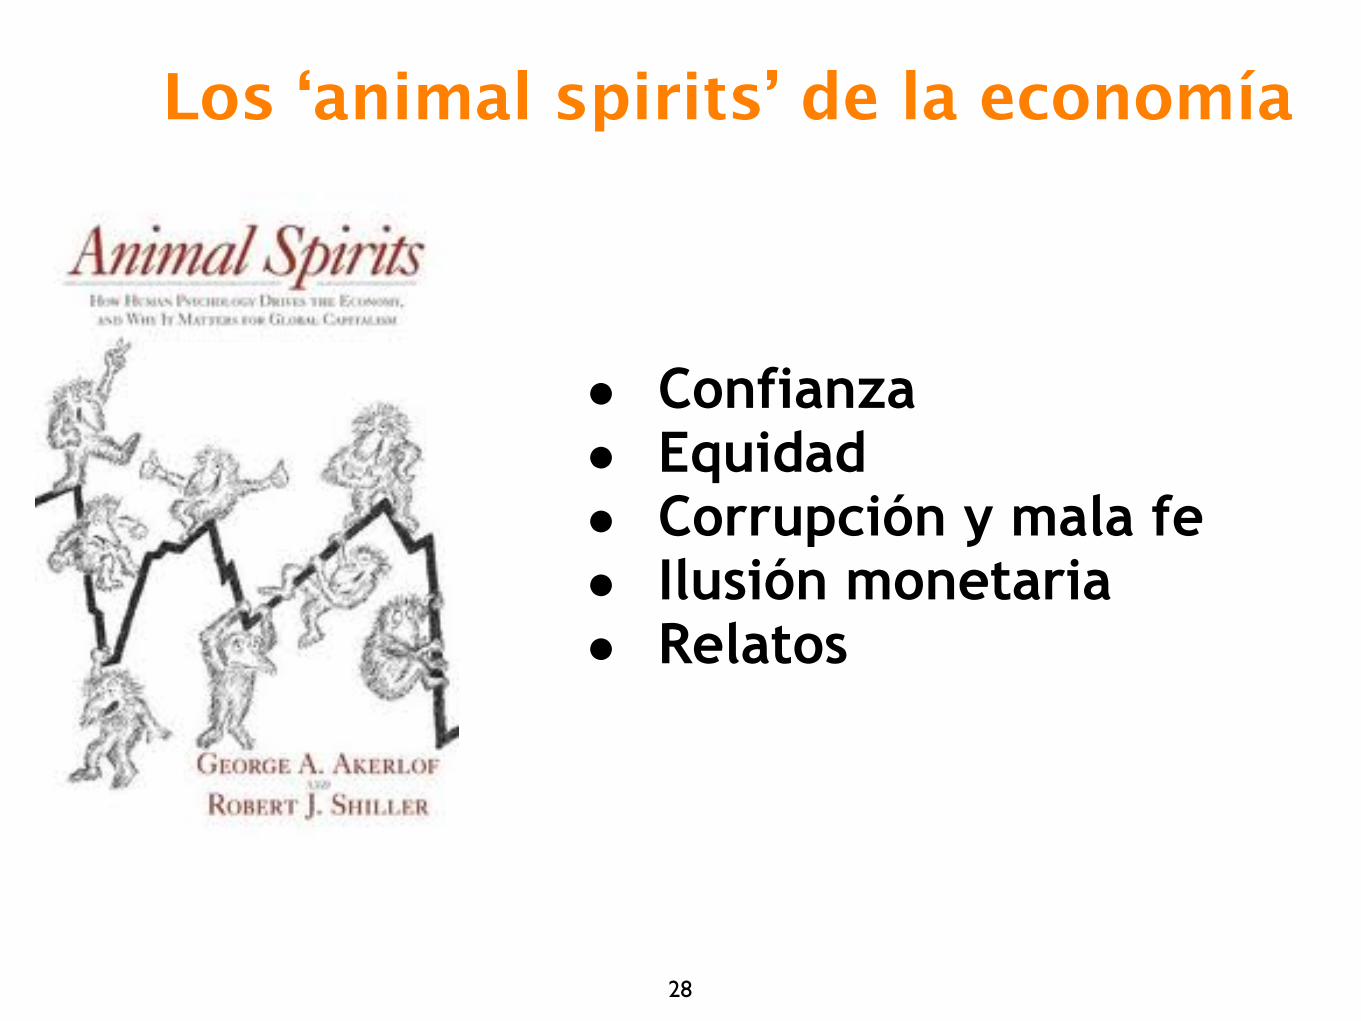
Los ‘animal spirits’ de la economía
28
• Confianza• Equidad• Corrupción y mala fe• Ilusión monetaria• Relatos

29
Una píldora de teoría social
Personas
InstitucionesPropósitosObjetivosSentido
ProyectosPrácticas
Actuaciones
Culturas

© Arquetip Lab S.L. 30
2000
31
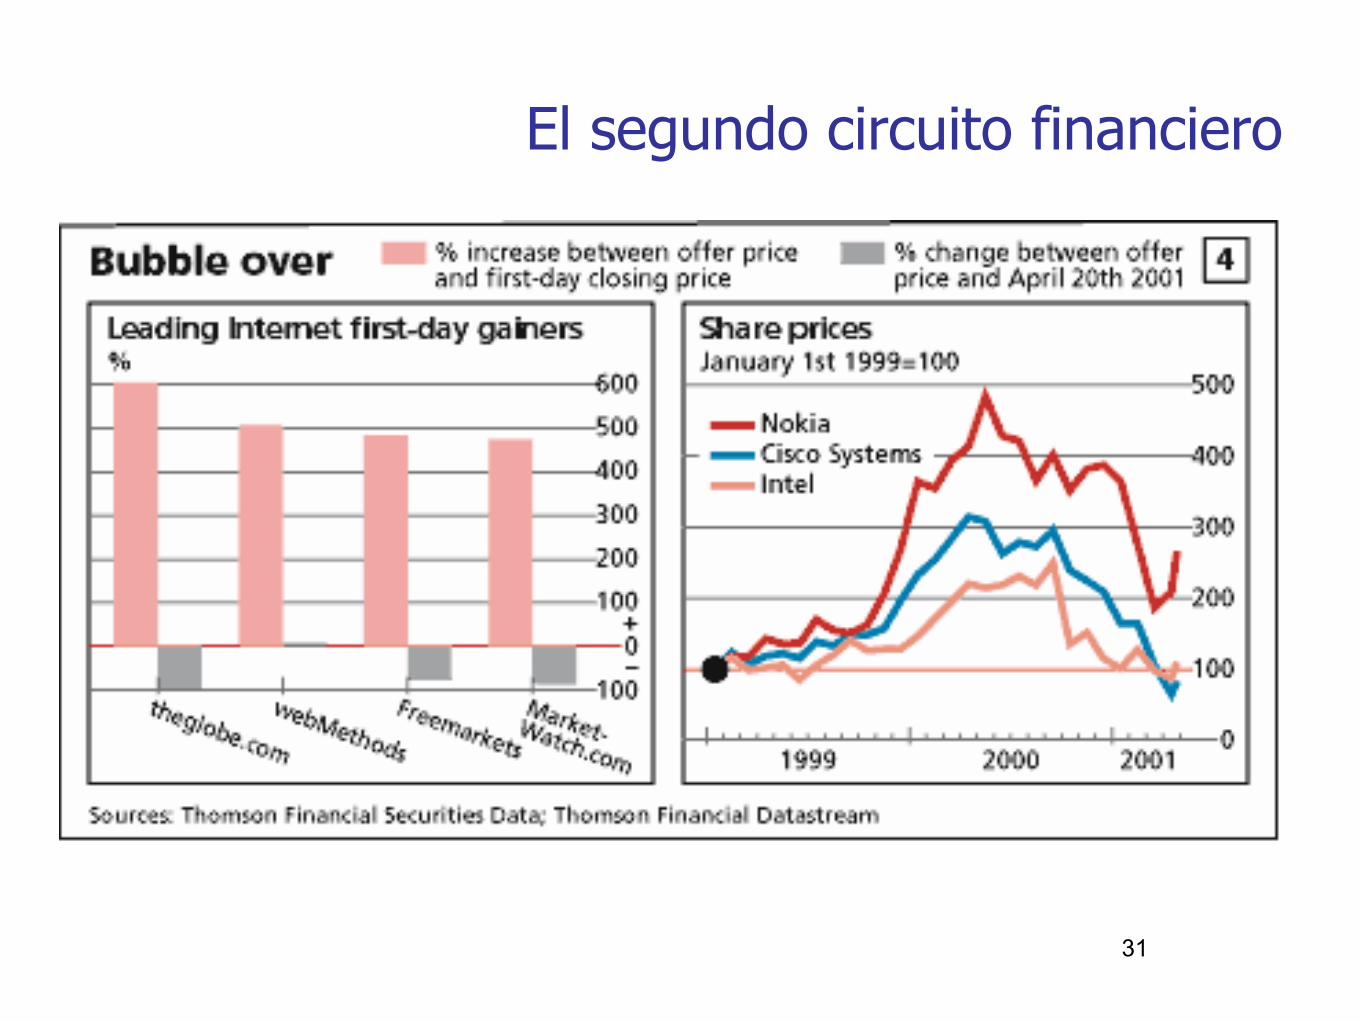
El segundo circuito financiero
32
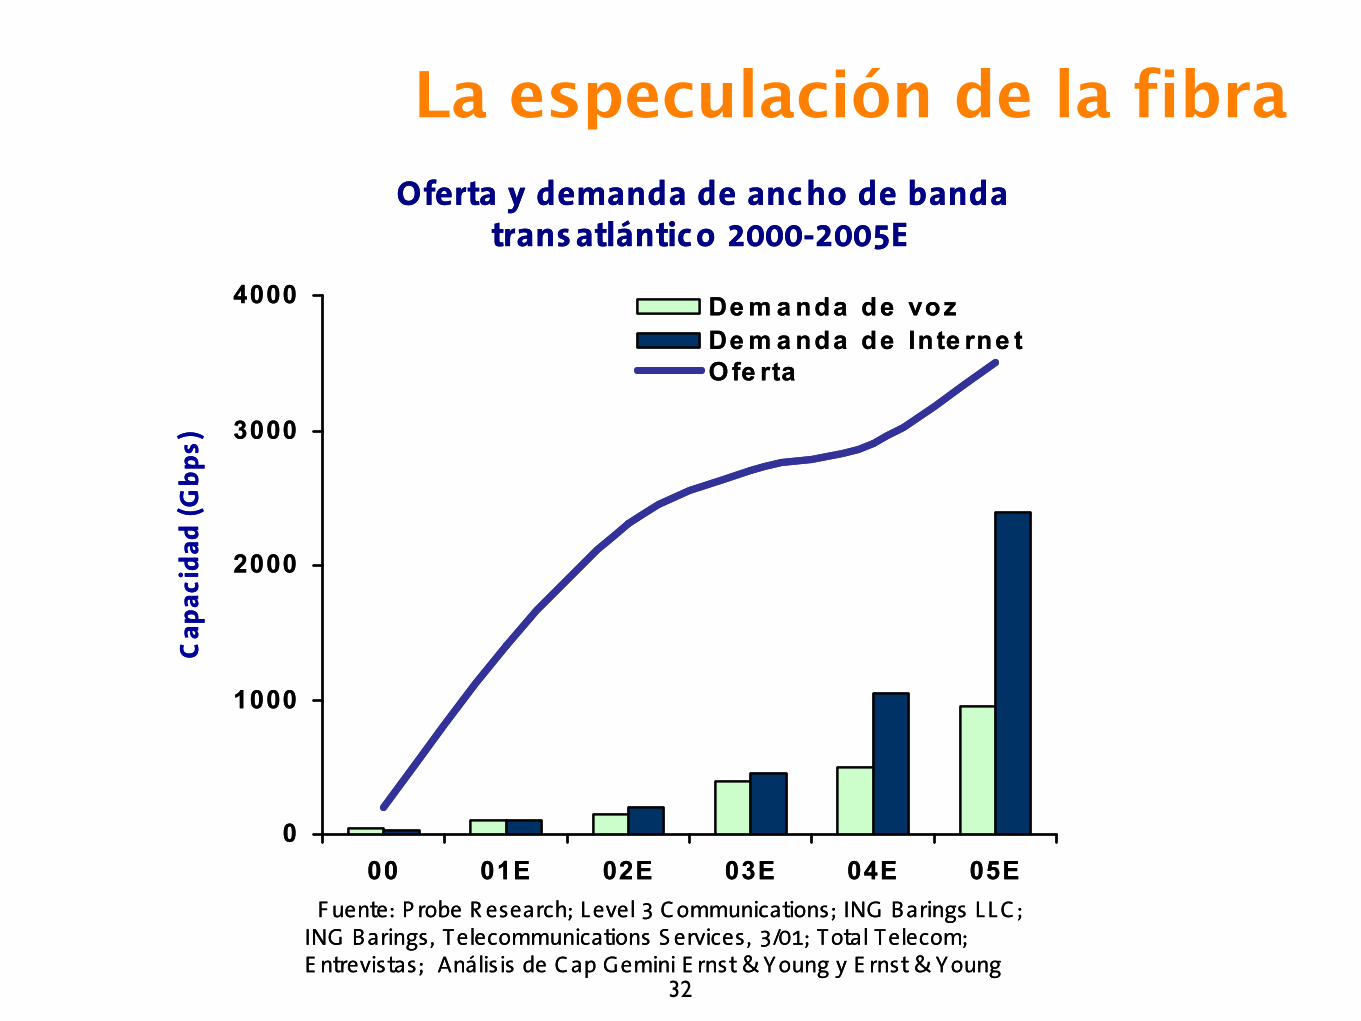
La especulación de la fibra
33
Sobre la “burbuja” tecnológica
Conclusiones
✓ A partir de 1995 se creó una “burbuja” especulativa alrededor de Internet y las nuevas tecnologías de la información, que pinchó en el año 2000
✓ Esta burbuja no es demasiado distinta de otros fenómenos especulativos del pasado.
✓ La “burbuja” de las telecomunicaciones fue mucho más seria que la de las empresas punto-com
✓ Tras la “limpieza” de los restos de la especulación, se apuntan nuevos modelos de crecimiento económico, basados en aumentos de la productividad, que parecen sostenibles.
Retos pendientes✓ Separar el grano (la productividad) de la paja (especulación)
34
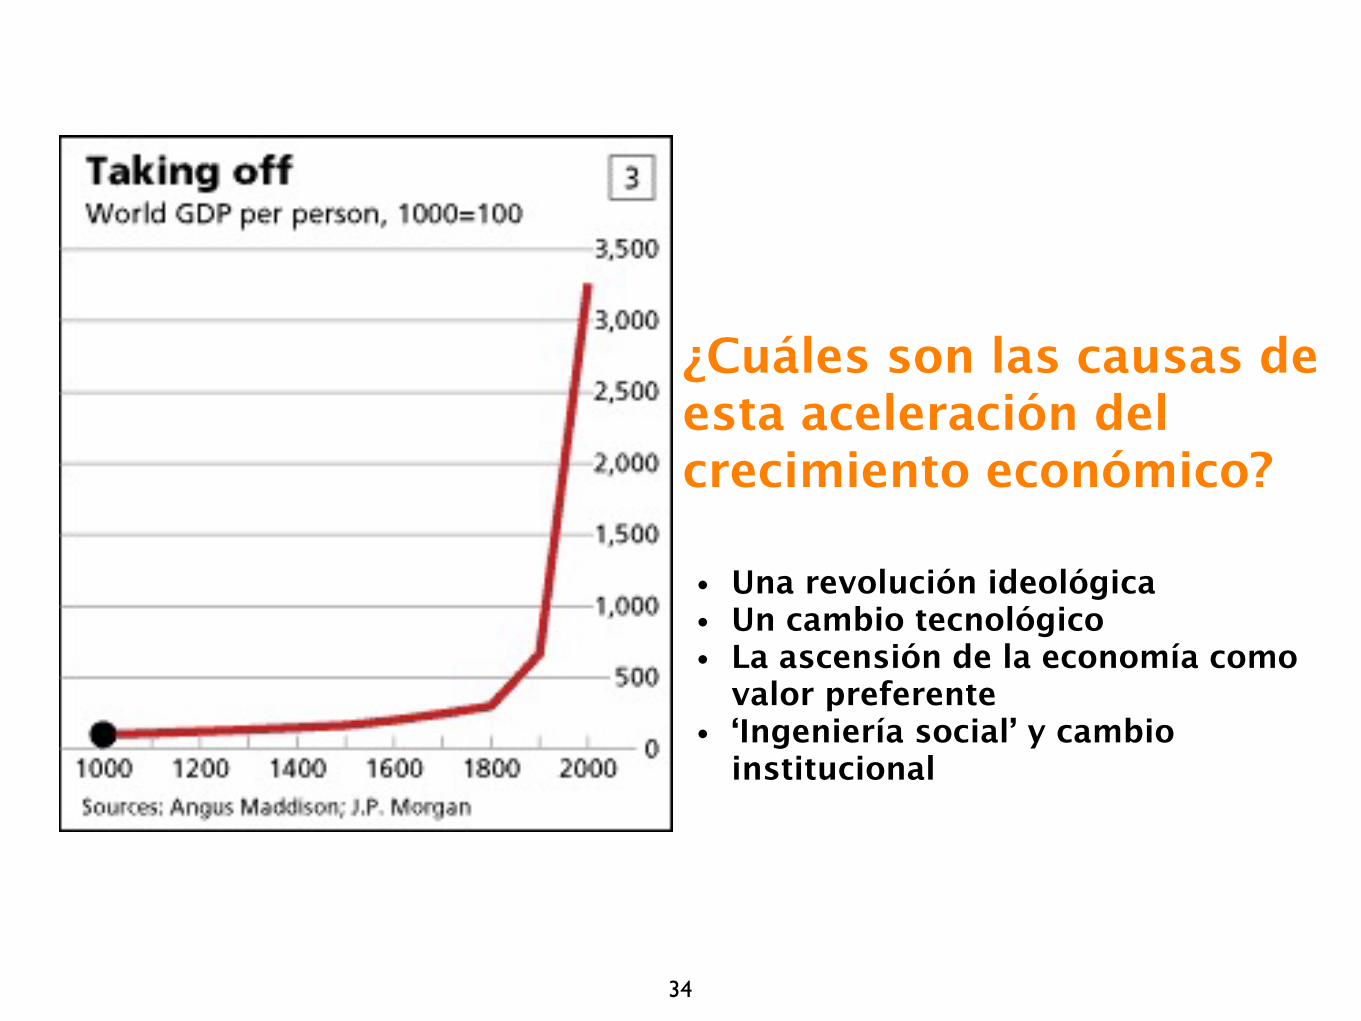
¿Cuáles son las causas de esta aceleración del crecimiento económico?
• Una revolución ideológica• Un cambio tecnológico• La ascensión de la economía como
valor preferente• ‘Ingeniería social’ y cambio
institucional
35
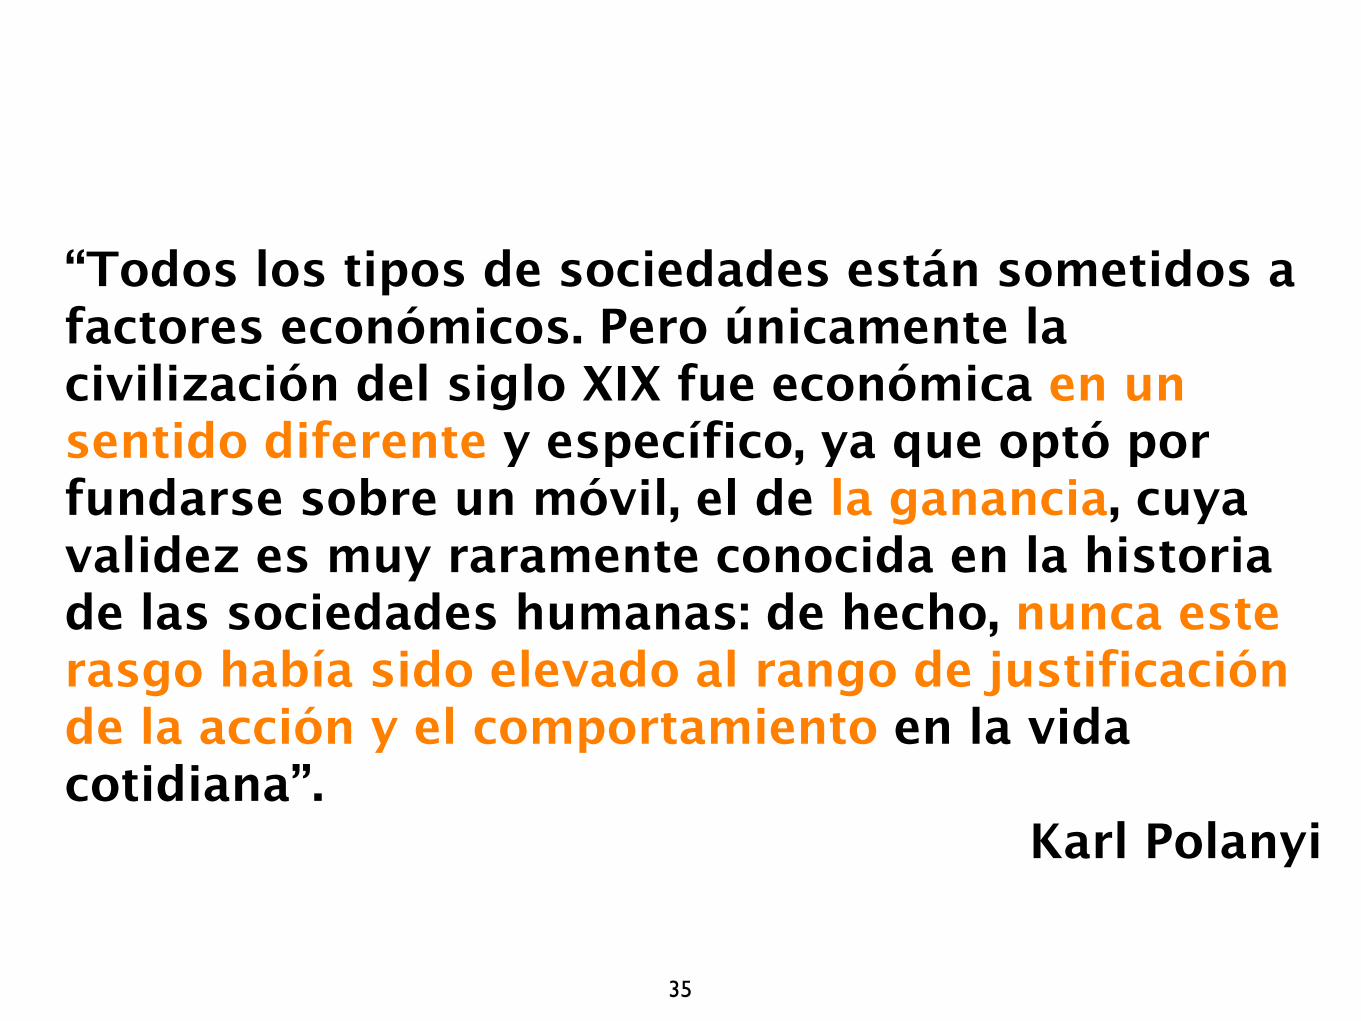
“Todos los tipos de sociedades están sometidos a factores económicos. Pero únicamente la civilización del siglo XIX fue económica en un sentido diferente y específico, ya que optó por fundarse sobre un móvil, el de la ganancia, cuya validez es muy raramente conocida en la historia de las sociedades humanas: de hecho, nunca este rasgo había sido elevado al rango de justificación de la acción y el comportamiento en la vida cotidiana”.
Karl Polanyi
36
“Las personas, como animales económicos, en donde destacan es en su capacidad para producir ideas, no sólo bienes físicos [...] No estamos acostumbrados a pensar en las ideas como bienes económicos, pero ciertamente son l o s b i e n e s m á s s i g n i f i c a t i v o s q u e producimos”.
(“Ideas and things”, P. Romer en “The Future Surveyed”, número especial the The Economist, 11/09/93)
¿La revolución ideológica de la Sociedad del Conocimiento?

37
“New growth theorists now start by dividing the world into two fundamentally different types of productive inputs that can be called ‘ideas’ and ‘things’ [...]
Ideas are goods that are produced and distributed just as other goods are.
One of the most important differences between objects and ideas is that ideas are not scarce and the process of discovery in the realm of ideas does not suffer from diminishing returns”.
Paul Romer
38
Economía de las ideas
“Monopolistic competition it's a form of competition between different firms, each of which sells a different kind of product and can behave like a monopolist at least temporarily. Of course, it takes various kinds of institutional infrastructure to make this system work. For example, the Government has to grant property rights over intangible assets like ideas. It is the combination of low replication costs to the producer and the protection of intellectual property rights that creates the monopoly position”.
Paul Romer
La combinación de los retornos crecientes y la propiedad intelectual crea monopolios ‘de
facto’
39
“We have to look at today’s economy and say “What is that’s really scarce in the Internet economy?” And the answer is ‘attention’ [...] So being able to capture someone’s attention at the right time is a very valuable asset”.
Hal Varian, Google Chief Economist
Ideología de la ‘nueva economía’
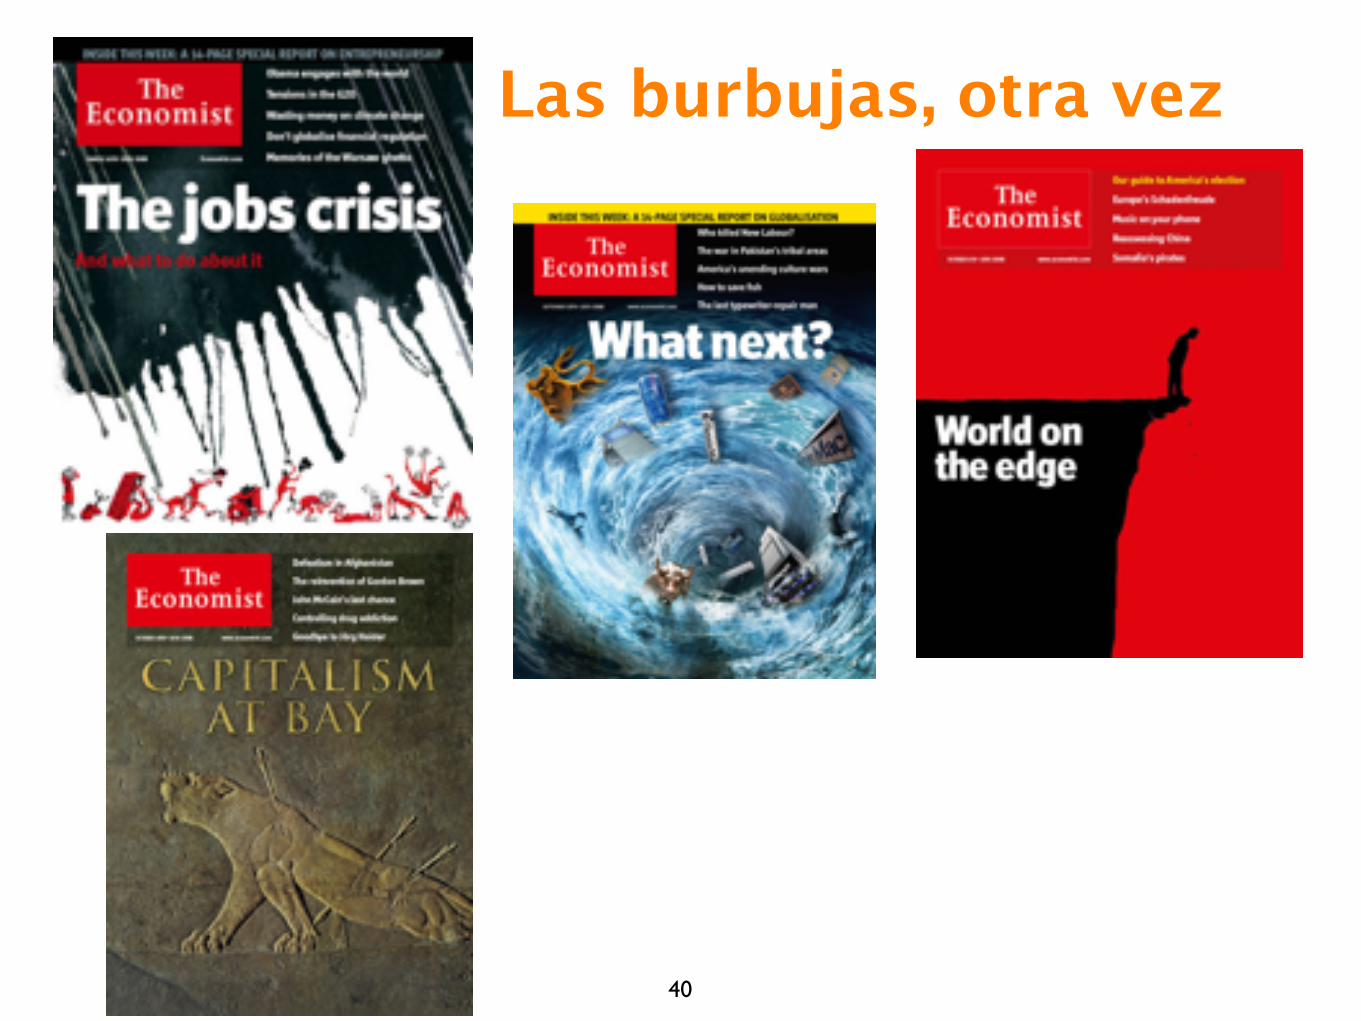
Las burbujas, otra vez
40
-4-color process CMYK -gritty matte UV
THE
FINANCIALCRISIS
INQUIRY REPORT
THE
FINAN
CIAL
CRISIS
INQUIRY
REPO
RT
• OFFICIAL GOVERNMENT EDITION •
OFFICIALGOVERNMENT
EDITION
Final Report of the National Commissionon the Causes of the Financial andEconomic Crisis in the United StatesI S BN 978-0-16-087727-8
9 7 8 0 1 6 0 8 7 7 2 7 8
9 0 0 0 0
FC_cover.indd 1FC_cover.indd 1 1/20/11 2:07 PM1/20/11 2:07 PM
0
10
20
30
40
50
60
$70
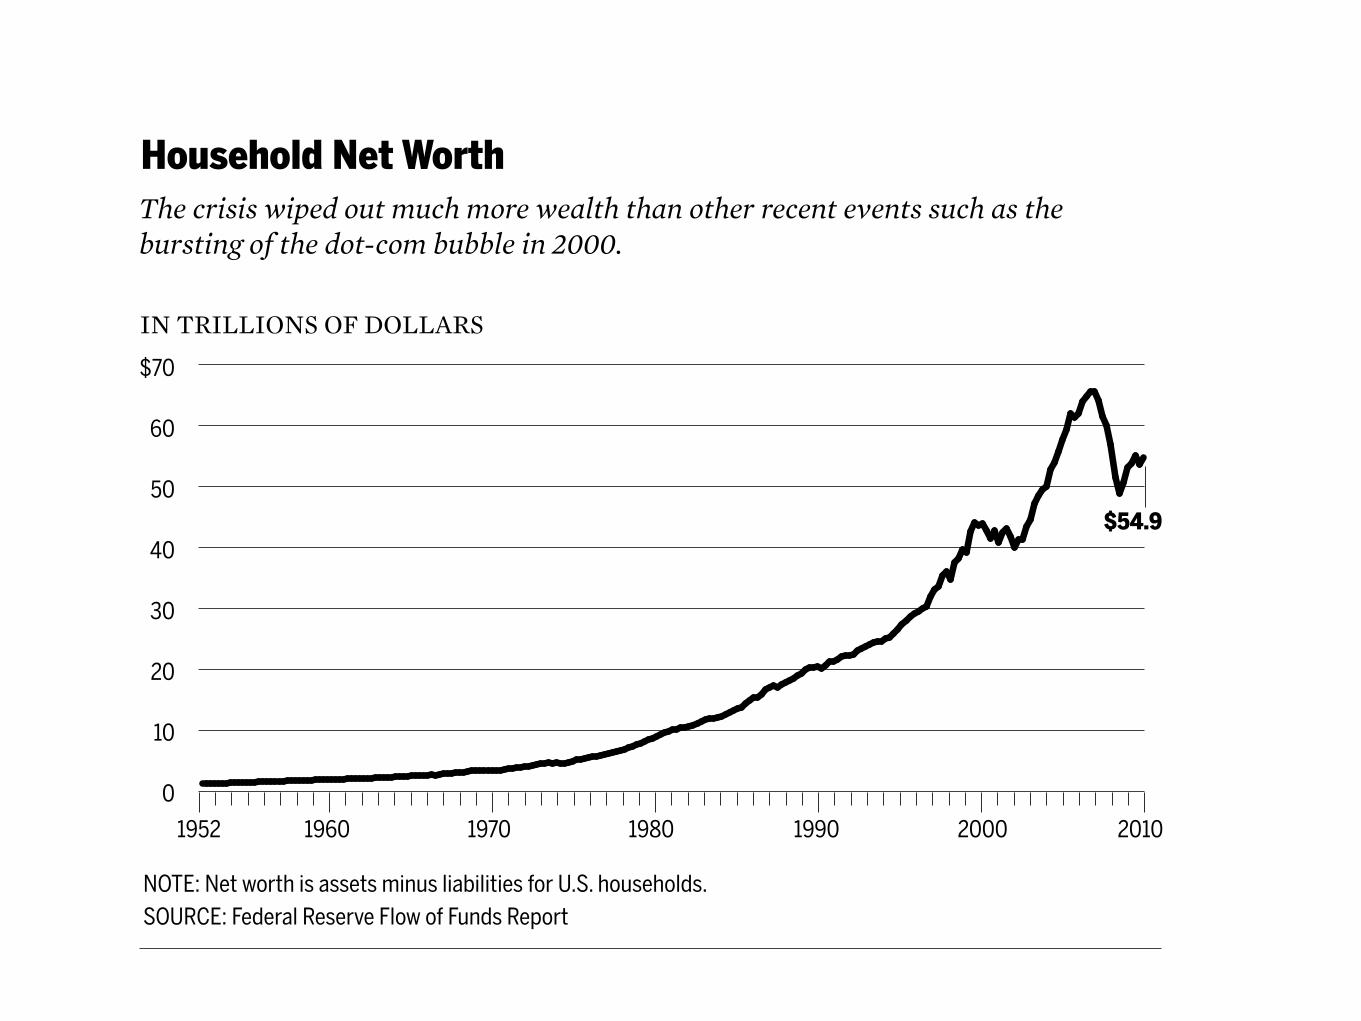
Household Net Worth
IN TRILLIONS OF DOLLARS
1952 1960 1970 1980 1990 2000 2010
NOTE: Net worth is assets minus liabilities for U.S. households.SOURCE: Federal Reserve Flow of Funds Report
$54.9
The crisis wiped out much more wealth than other recent events such as the bursting of the dot-com bubble in 2000.
Figure !"."
!"# F INANC IAL CR I S I S INQU IRY COMMI S S ION REPORT
early in !""#. The homeownership rate declined from its peak of $#.!% in !""& to$$.#% as of the fall of !"'". Because so many American households own homes, andbecause for most homeowners their housing represents their single most importantasset, these declines have been especially debilitating. Borrowing via home equityloans or cash-out re(nancing has fallen sharply.
At an FCIC hearing in Bakers(eld, California, Marie Vasile explained how herfamily had relocated &" miles into the mountains to a rental house to help her hus-band’s fragile health.) Their old home was put up for sale and languished on the mar-ket, losing value. Eventually, she and her husband found buyers willing to take theirhouse in a “short sale”—that is, a sale at a price less than the balance of the mortgage.But because the lender was acting slowly to approve that deal, they risked losing thesale and then going into foreclosure. “To top this all off,” Vasile told commissioners,“my husband is in the position of possibly losing his job.*.*.*. So not only do I have ahouse that I don’t know what’s happening to, I don’t know if he’s going to have a jobcome December. This is more than I can handle. I’m not eating. I’m not sleeping.”
Serious mortgage delinquencies—payments that are late #" days or more orhomes in the foreclosure process—have spread since the crisis. Among regions, the
457P!"!# J. W$%%&'()
of U.S. housing policy—until the true costs became clear with the collapse of the housing bubble in 2007. * en an elaborate process of shi+ ing the blame began.
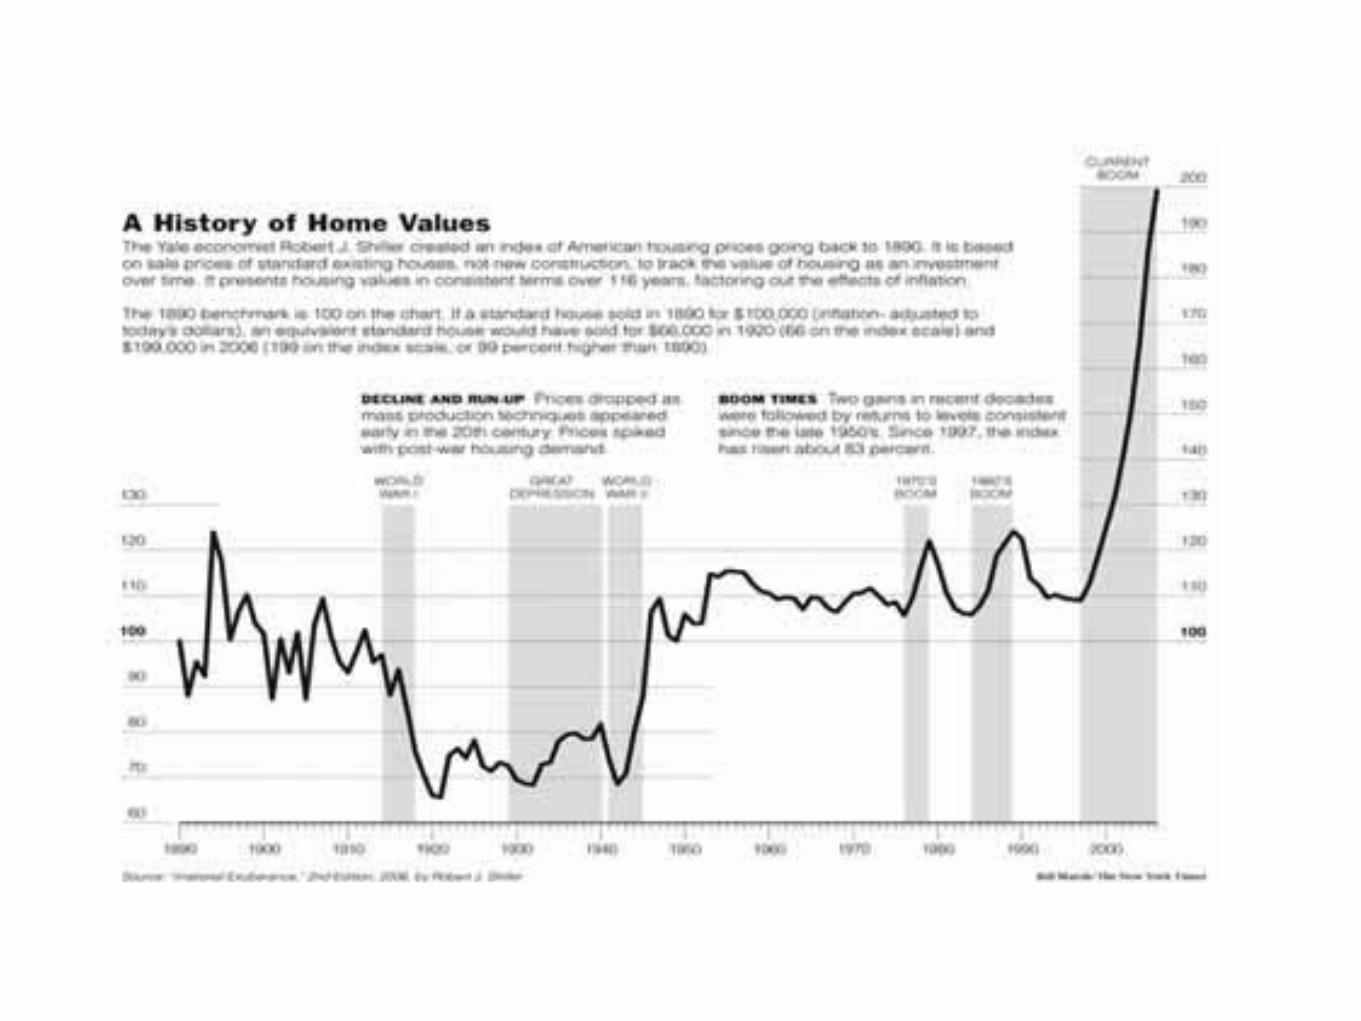
!. T"# G$#%& H'()*+, B(--.# %+/ I&) E00#1&)Figure 1 below, based on the data of Robert J. Shiller, shows the dramatic
growth of the 1997-2007 housing bubble in the United States. By mid-2007, home prices in the U.S. had increased substantially for ten years. * e growth in real dollar terms had been almost 90 percent, ten times greater than any other housing bubble in modern times. As discussed below, there is good reason to believe that the 1997-2007 bubble grew larger and extended longer in time than previous bubbles because of the government’s housing policies, which arti, cially increased the demand for housing by funneling more money into the housing market than would have been available if traditional lending standards had been maintained and the government had not promoted the growth of subprime lending.
Figure 1. * e Bubble According to Shiller
* at the 1997-2007 bubble lasted about twice as long as the prior housing bubbles is signi, cant in itself. Mortgage quality declines as a housing bubble grows and originators try to structure mortgages that will allow buyers to meet monthly payments for more expensive homes; the fact that the most recent bubble was so long-lived was an important element in its ultimate destructiveness when it de- ated. Why did this bubble last so long? Housing bubbles de- ate when delinquencies and defaults begin to appear in unusual numbers. Investors and creditors realize that the risks of a collapse are mounting. One by one, investors cash in and leave. Eventually, the bubble tops out, those who are still in the game run for the doors, and a de- ation in prices sets in. Generally, in the past, this process took three or four years. In the case of the most recent bubble, it took ten. * e reason for this longevity is that one
ings netted these households an estimated !"#$ billion; homeowners accessed an-other !"%& billion via home equity loans.'( Some were typical second liens; otherswere a newer invention, the home equity line of credit. These operated much like acredit card, letting the borrower borrow and repay as needed, often with the conven-ience of an actual plastic card.
According to the Fed’s #&&" Survey of Consumer Finances, "(.&) of homeownerswho tapped their equity used that money for expenses such as medical bills, taxes, elec-tronics, and vacations, or to consolidate debt; another %'.&) used it for home improve-ments; and the rest purchased more real estate, cars, investments, clothing, or jewelry.
A Congressional Budget O*ce paper from #&&$ reported on the recent history:“As housing prices surged in the late '++&s and early #&&&s, consumers boosted theirspending faster than their income rose. That was re,ected in a sharp drop in the per-sonal savings rate.”'- Between '++. and #&&(, increased consumer spending ac-counted for between -$) and '-.) of GDP growth in any year—rising above '&&)in years when spending growth offset declines elsewhere in the economy. Meanwhile,the personal saving rate dropped from (.#) to '."). Some components of spendinggrew remarkably fast: home furnishings and other household durables, recreationalgoods and vehicles, spending at restaurants, and health care. Overall consumerspending grew faster than the economy, and in some years it grew faster than realdisposable income.
Nonetheless, the economy looked stable. By #&&%, it had weathered the brief re-cession of #&&' and the dot-com bust, which had caused the largest loss of wealth in
C R E D I T E X PA N S I O N !"
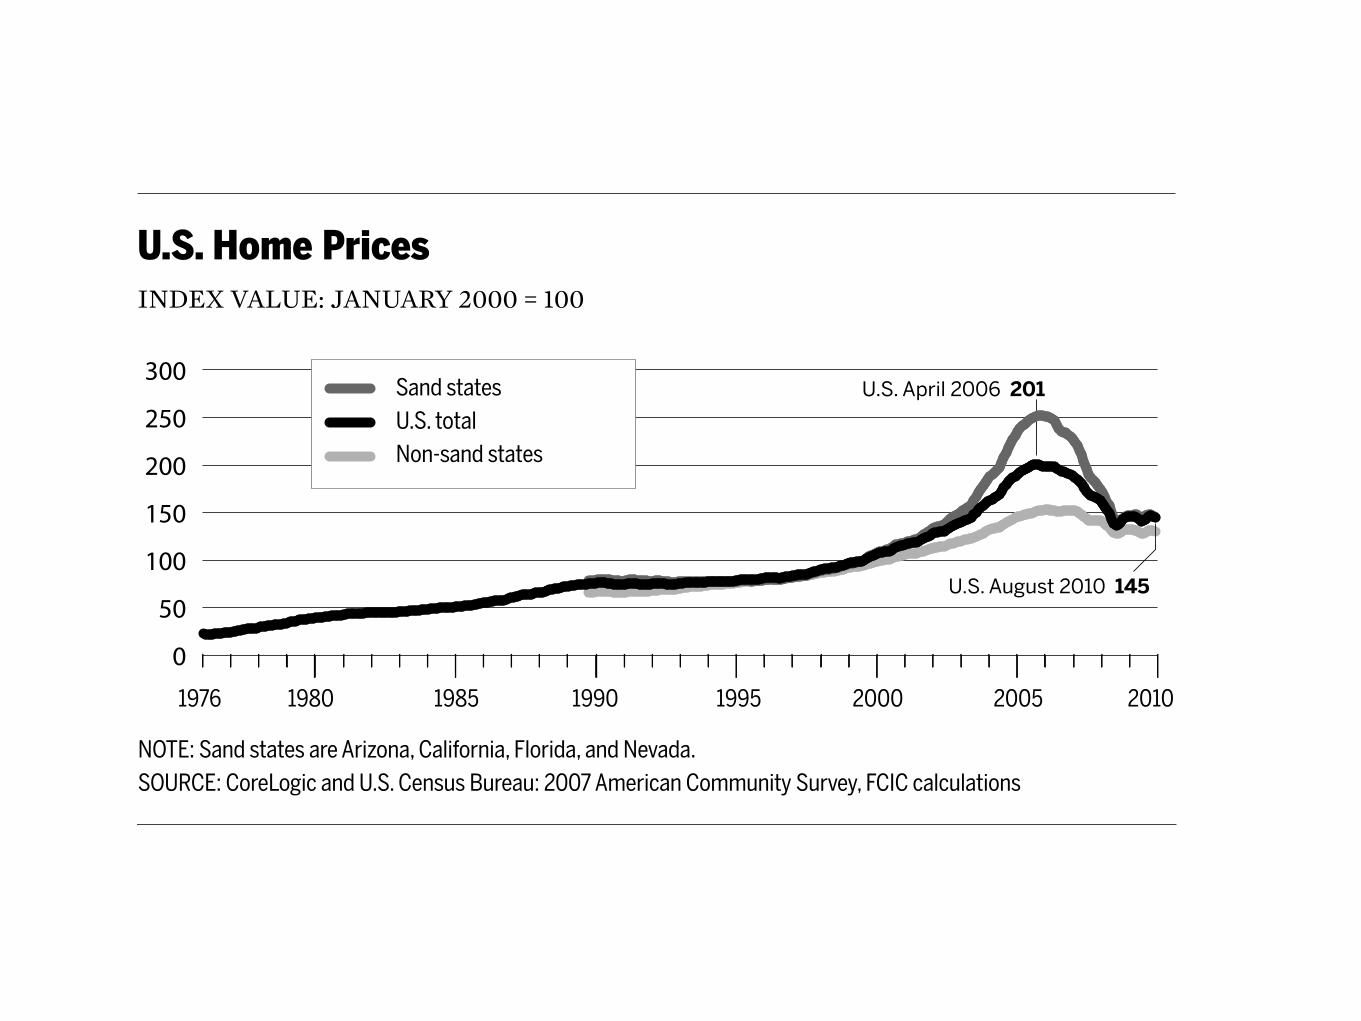
U.S. Home PricesINDEX VALUE: JANUARY 2000 = 100
U.S. August 2010 145
U.S. April 2006 201
1976 19851980 19951990 20052000 2010
0
50
100
150
200
250
300
NOTE: Sand states are Arizona, California, Florida, and Nevada.SOURCE: CoreLogic and U.S. Census Bureau: 2007 American Community Survey, FCIC calculations
Sand statesU.S. total Non-sand states
Figure !."
• The report largely ignores the credit bubble beyond housing. Credit spreads de-clined not just for housing, but also for other asset classes like commercial realestate. This tells us to look to the credit bubble as an essential cause of the U.S.housing bubble. It also tells us that problems with U.S. housing policy or mar-kets do not by themselves explain the U.S. housing bubble.
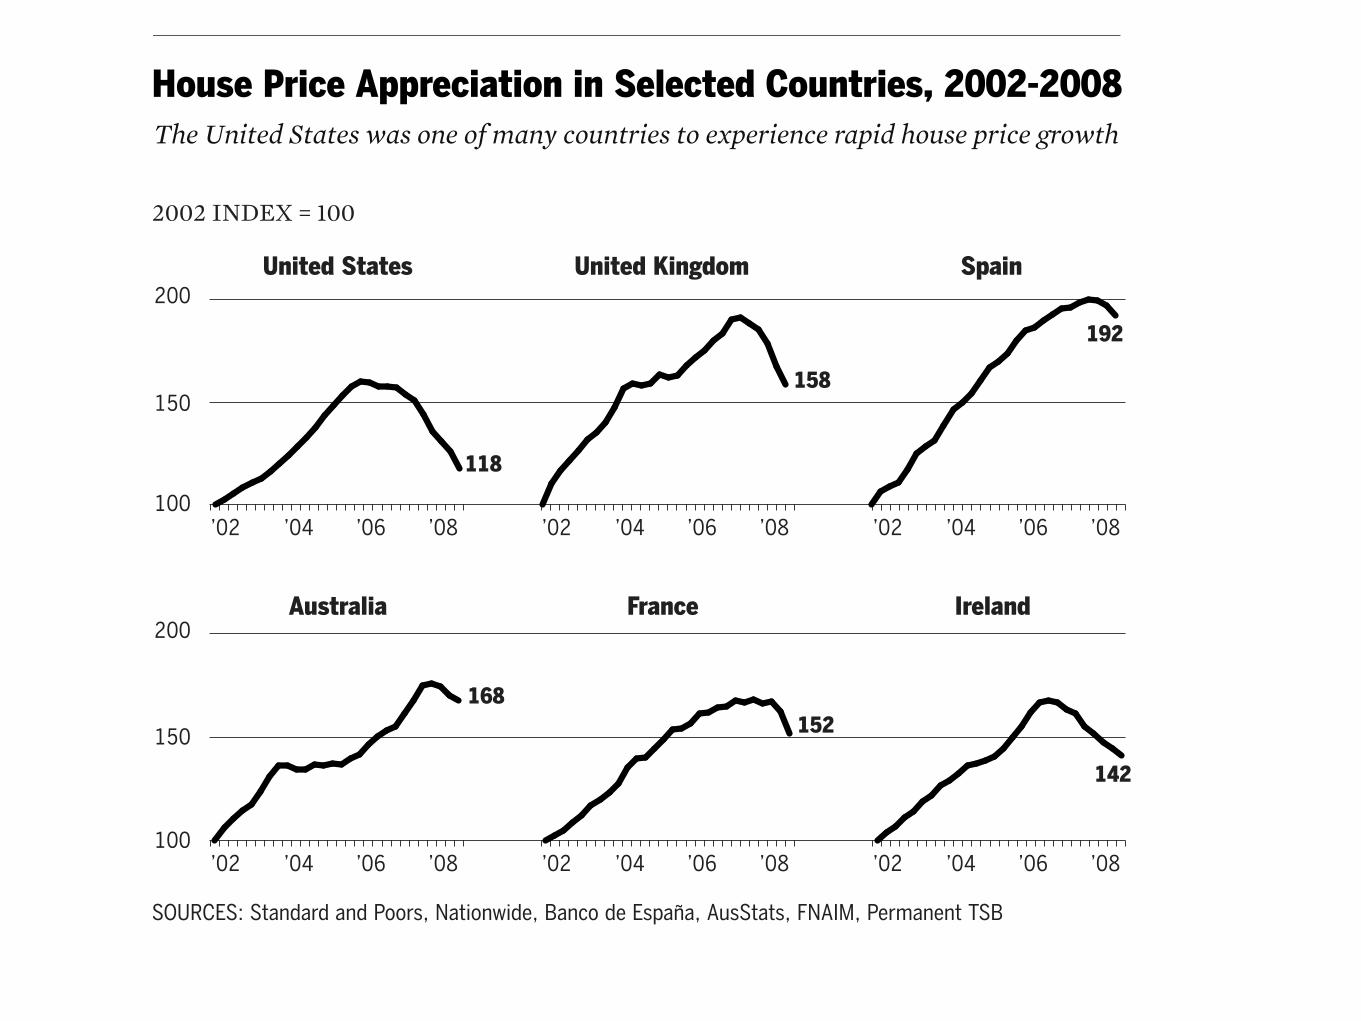
• There were housing bubbles in the United Kingdom, Spain, Australia, Franceand Ireland, some more pronounced than in the United States. Some nationswith housing bubbles relied little on American-style mortgage securitization. Agood explanation of the U.S. housing bubble should also take into account itsparallels in other nations. This leads us to explanations broader than just U.S.housing policy, regulation, or supervision. It also tells us that while failures inU.S. securitization markets may be an essential cause, we must look for otherthings that went wrong as well.
• Large !nancial !rms failed in Iceland, Spain, Germany, and the United King-dom, among others. Not all of these !rms bet solely on U.S. housing assets, and
The United States was one of many countries to experience rapid house price growth
House Price Appreciation in Selected Countries, 2002-2008
2002 INDEX = 100
SOURCES: Standard and Poors, Nationwide, Banco de España, AusStats, FNAIM, Permanent TSB
100
150
200
100
150
200
United States United Kingdom Spain
Australia France Ireland
118
192
168
158
152
142
’02 ’06’04 ’08 ’02 ’06’04 ’08 ’02 ’06’04 ’08
’02 ’06’04 ’08 ’02 ’06’04 ’08 ’02 ’06’04 ’08
K E I T H H E N N E S S E Y, D O U G L A S H O LT Z - E A K I N , A N D B I L L T H O M A S !"#
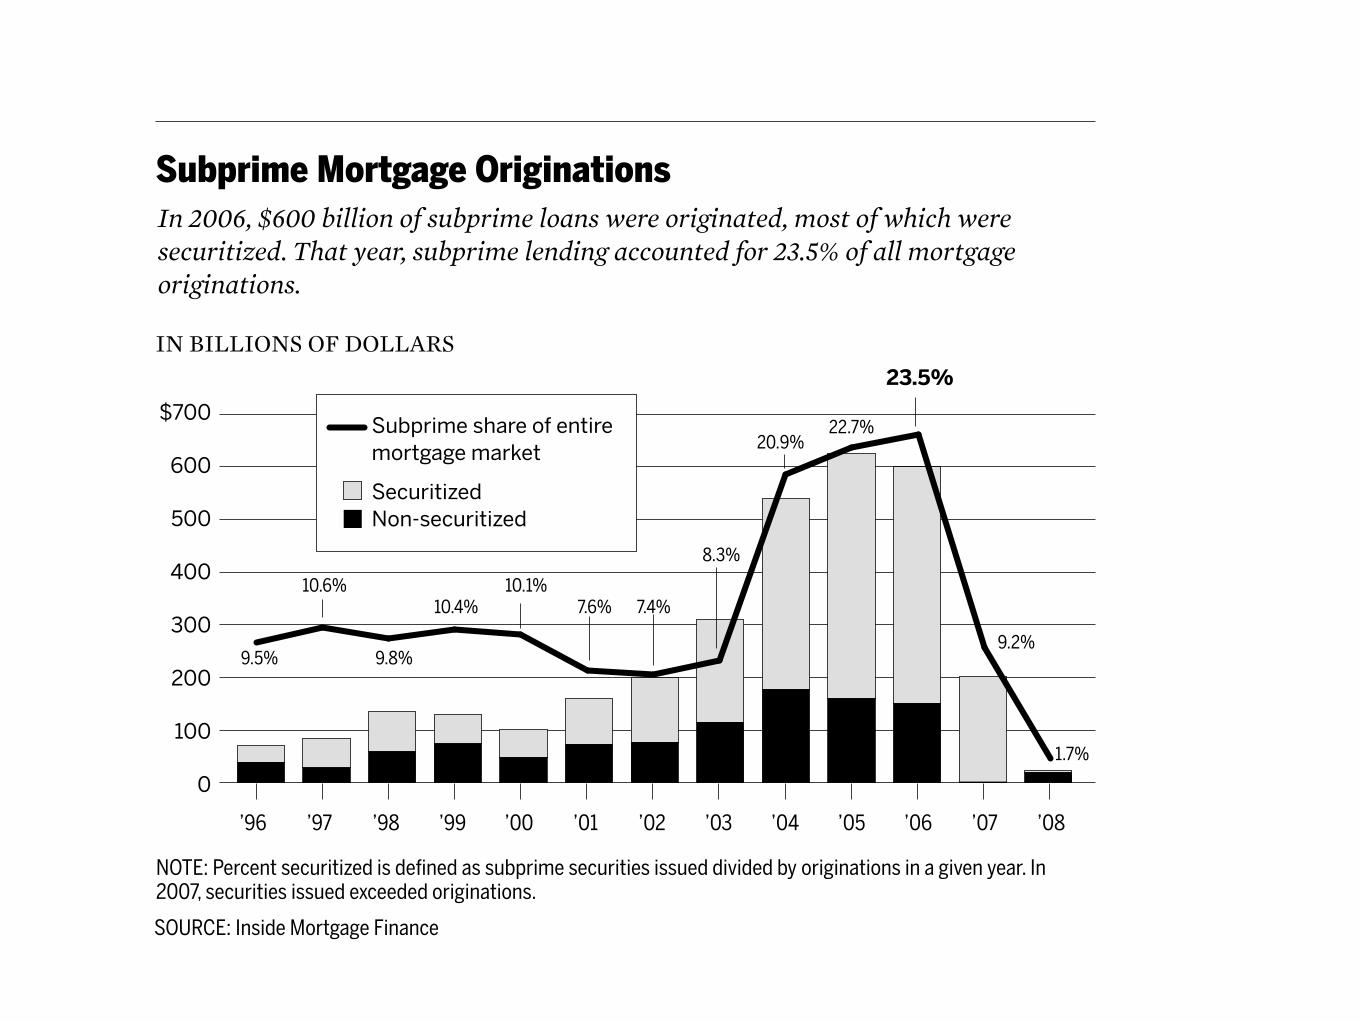
more familiar with the securitization of these assets, mortgage specialists and WallStreet bankers got in on the action. Securitization and subprime originations grewhand in hand. As !gure ".# shows, subprime originations increased from $%& billionin '(() to $'&& billion in #&&&. The proportion securitized in the late '((&s peaked at")*, and subprime mortgage originations’ share of all originations hovered around'&*.
Securitizations by the RTC and by Wall Street were similar to the Fannie andFreddie securitizations. The !rst step was to get principal and interest payments froma group of mortgages to +ow into a single pool. But in “private-label” securities (thatis, securitizations not done by Fannie or Freddie), the payments were then “tranched”in a way to protect some investors from losses. Investors in the tranches received dif-ferent streams of principal and interest in different orders.
Most of the earliest private-label deals, in the late '(,&s and early '((&s, used arudimentary form of tranching. There were typically two tranches in each deal. The
!" F INANC IAL CR I S I S INQU IRY COMMI S S ION REPORT
In 2006, $600 billion of subprime loans were originated, most of which were securitized. That year, subprime lending accounted for 23.5% of all mortgage originations.
Subprime Mortgage Originations
IN BILLIONS OF DOLLARS23.5%
SOURCE: Inside Mortgage Finance
’97 ’99 ’01 ’03 ’05’00 ’06 ’07 ’08’04’02’98’96
0
100
200
300
400
500
600
$700
9.5%
10.6%
9.8%
10.4%10.1%
7.6% 7.4%
9.2%
1.7%
8.3%
20.9%22.7%Subprime share of entire
mortgage market
SecuritizedNon-securitized
!!"#$ %"#$"%& '"$(#&&&'") &' )"*%") +' '((,#&-" '"$(#&&&"' &''(") )&.&)") (/ 0#&1&%+&&0%' &% + 1&."% /"+#) *% 2007, securities issued exceeded originations.
Figure !."
Homeownership increased steadily, peaking at !".#$ of households in #%%&.'' Be-cause so many families were bene(ting from higher home values, household wealthrose to nearly six times income, up from (ve times a few years earlier. The top '%$ ofhouseholds by net worth, of whom "!$ owned their homes, saw the value of theirprimary residences rise between #%%' and #%%& from )*+#,,%% to )&-%,%%% (adjustedfor in.ation), an increase of more than )++,%%%. Median net worth for all householdsin the top '%$, after accounting for other housing value and assets, as well as all lia-bilities, was )'.& million in #%%&. Homeownership rates for the bottom #-$ of house-holds ticked up from '&$ to '-$ between #%%' and #%%&; the median value of theirprimary residences rose from )-#,+%% to )!-,%%%, an increase of more than )'#,%%%.Median net worth for households in the bottom #-$ was )',+%% in #%%&.'#
Historically, every )',%%% increase in housing wealth boosted consumer spendingby an estimated )-% a year.'* But economists debated whether the wealth increaseswould affect spending more than in past years, because so many homeowners at somany levels of wealth saw increases and because it was easier and cheaper to taphome equity.
Higher home prices and low mortgage rates brought a wave of re(nancing to theprime mortgage market. In #%%* alone, lenders re(nanced over '- million mort-gages, more than one in four—an unprecedented level.'& Many homeowners took outcash while cutting their interest rates. From #%%' through #%%*, cash-out re(nanc-
!" F INANC IAL CR I S I S INQU IRY COMMI S S ION REPORT
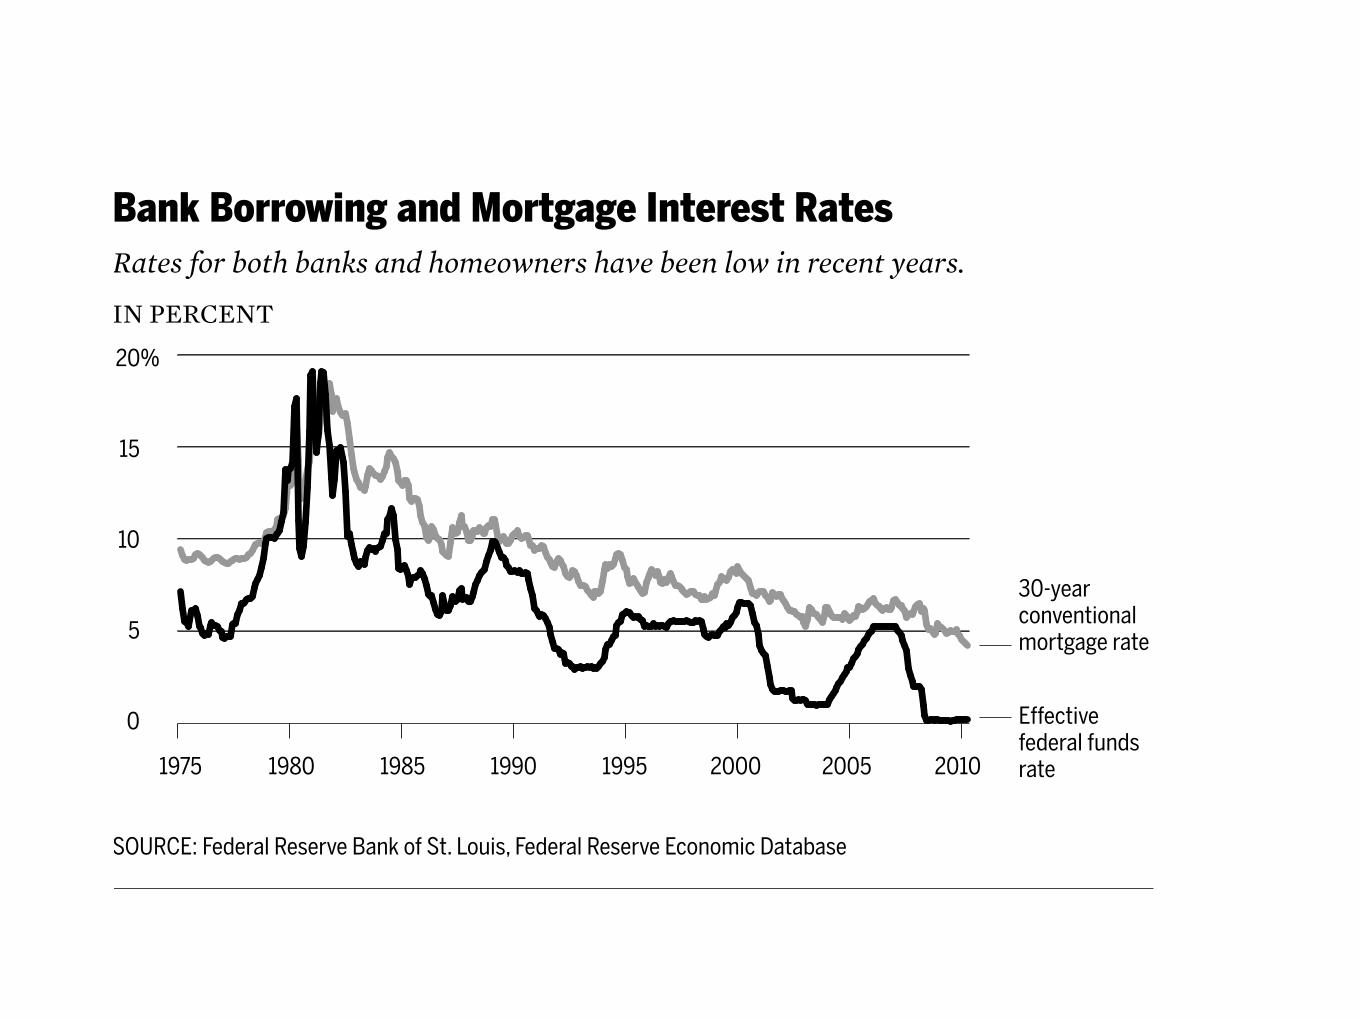
Bank Borrowing and Mortgage Interest Rates
IN PERCENT
0
5
10
15
20%
1975 19851980 19951990 2000 2005 2010
30-year conventional mortgage rate
SOURCE: Federal Reserve Bank of St. Louis, Federal Reserve Economic Database
Effective federal funds rate
Rates for both banks and homeowners have been low in recent years.
Figure !."
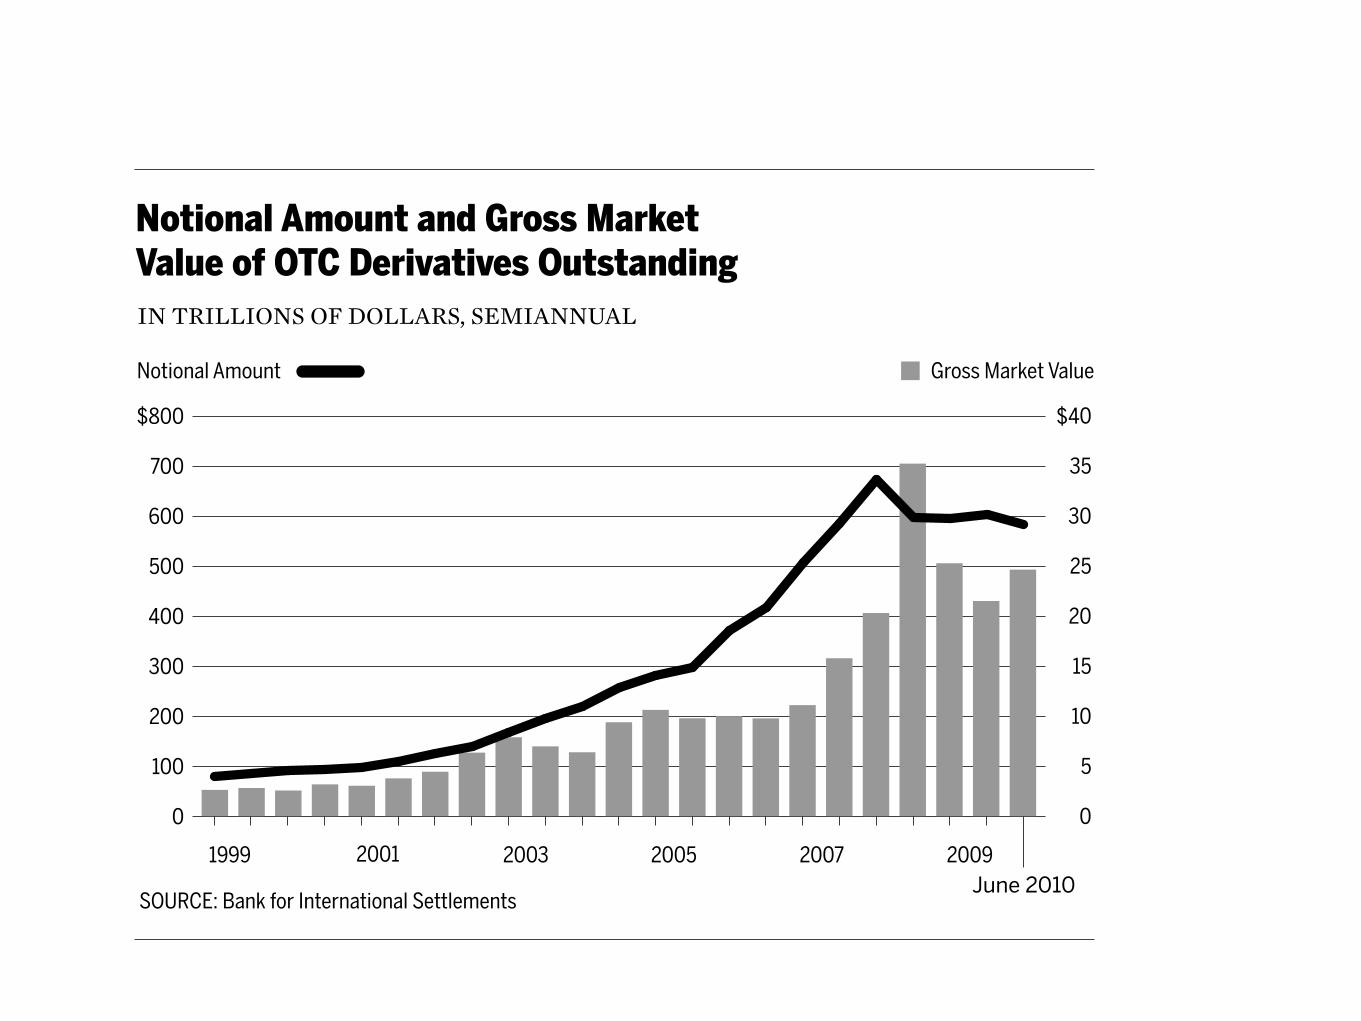
Notional Amount and Gross Market Value of OTC Derivatives OutstandingIN TRILLIONS OF DOLLARS, SEMIANNUAL
SOURCE: Bank for International Settlements
1999 20032001 2005 2007 2009
0
100
200
300
400
500
600
700
$800
0
5
10
15
20
25
30
35
$40
Gross Market ValueNotional Amount
June 2010
Figure !".!
M A R C H T O AU G U S T !""# : S Y S T E M I C R I S K C O N C E R N S !$$
the global derivatives market. At the end of June !""#, the notional amount of theover-the-counter derivatives market was $%&' trillion and the gross market value was$!" trillion (see (gure )%.)). Adequate information about the risks in this market wasnot available to market participants or government regulators like the Federal Re-serve. Because the market had been deregulated by statute in !""", market partici-pants were not subject to reporting or disclosure requirements and no governmentagency had oversight responsibility. While the O*ce of the Comptroller of the Cur-rency did report information on derivatives positions from commercial banks andbank holding companies, it did not collect such information from the large invest-ment banks and insurance companies like AIG, which were also major OTC deriva-tives dealers. During the crisis the lack of such basic information created heighteneduncertainty.
At this point in the crisis, regulators also worried about the interlocking relation-ships that derivatives created among the small number of large (nancial (rms thatact as dealers in the OTC derivatives business. A derivatives contract creates a creditrelationship between parties, such that one party may have to make large and unex-pected payments to the other based on sudden price or rate changes or loan defaults.If a party is unable to make those payments when they become due, that failure may
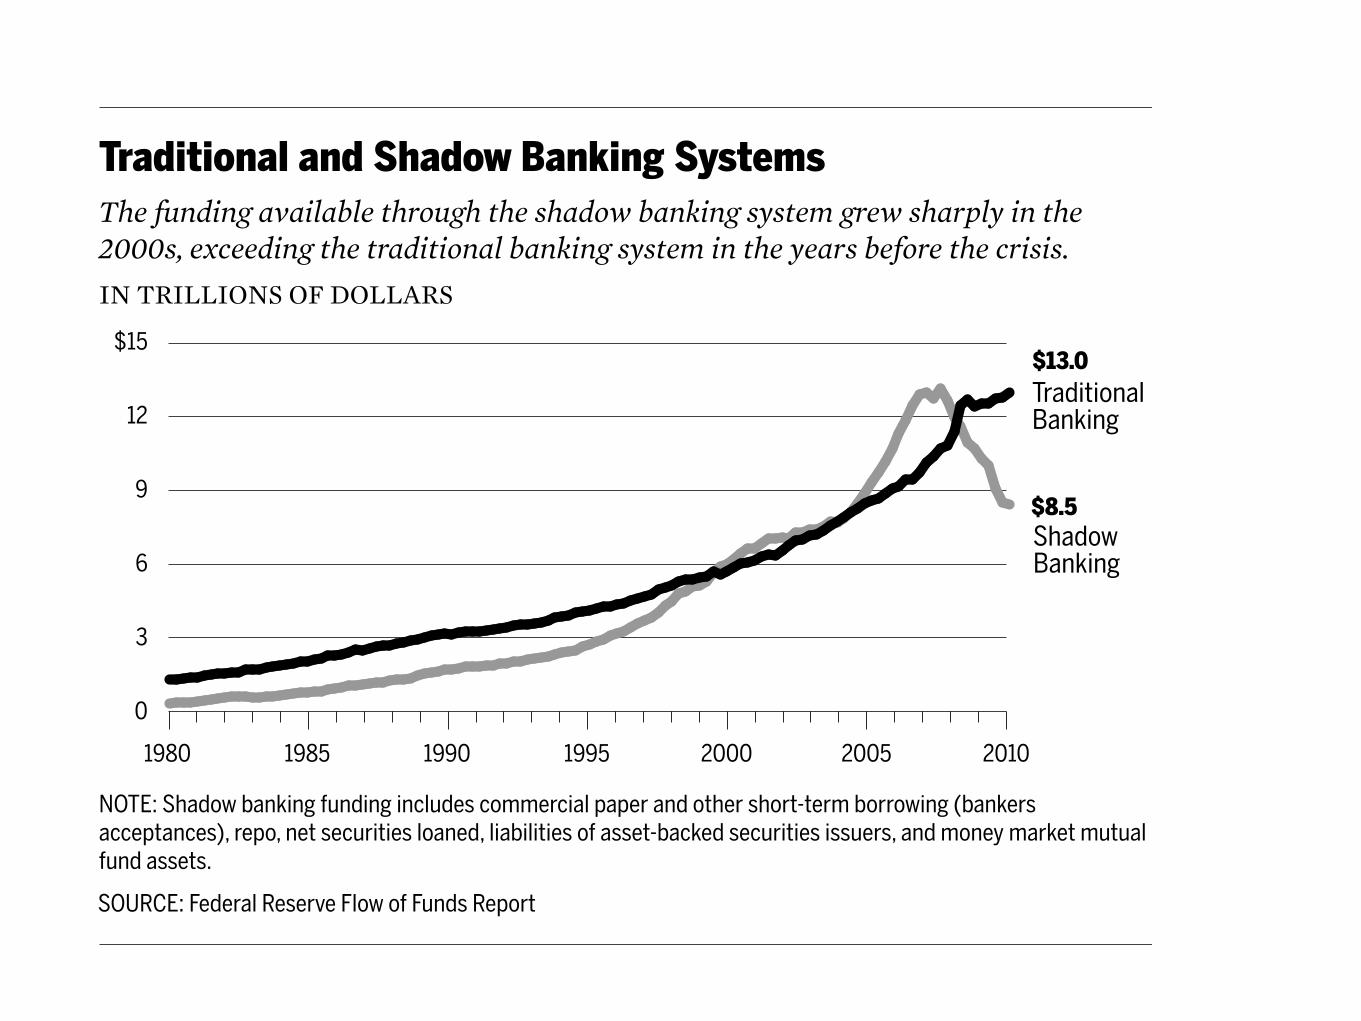
Figure !." shows that during the "##$s the shadow banking system steadilygained ground on the traditional banking sector—and actually surpassed the bank-ing sector for a brief time after !$$$.
Banks argued that their problems stemmed from the Glass-Steagall Act. Glass-Steagall strictly limited commercial banks’ participation in the securities markets, inpart to end the practices of the "#!$s, when banks sold highly speculative securitiesto depositors. In "#%&, Congress also imposed new regulatory requirements on banksowned by holding companies, in order to prevent a holding company from endan-gering any of its deposit-taking banks.
Bank supervisors monitored banks’ leverage—their assets relative to equity—because excessive leverage endangered a bank. Leverage, used by nearly every 'nan-cial institution, ampli'es returns. For example, if an investor uses ("$$ of his ownmoney to purchase a security that increases in value by "$), he earns ("$. However,if he borrows another (#$$ and invests "$ times as much ((",$$$), the same "$) in-crease in value yields a pro't of ("$$, double his out-of-pocket investment. If the investment sours, though, leverage magni'es the loss just as much. A decline of "$)costs the unleveraged investor ("$, leaving him with (#$, but wipes out the leveragedinvestor’s ("$$. An investor buying assets worth "$ times his capital has a leverage
!" F INANC IAL CR I S I S INQU IRY COMMI S S ION REPORT
Traditional and Shadow Banking Systems
IN TRILLIONS OF DOLLARS
SOURCE: Federal Reserve Flow of Funds Report
1980 1985 1990 1995 2000 2005 2010
Traditional Banking
Shadow Banking
$13.0
$8.5
The funding available through the shadow banking system grew sharply in the 2000s, exceeding the traditional banking system in the years before the crisis.
NOTE: Shadow banking funding includes commercial paper and other short-term borrowing (bankers acceptances), repo, net securities loaned, liabilities of asset-backed securities issuers, and money market mutual fund assets.
0
3
6
9
12
$15
Figure !."
50
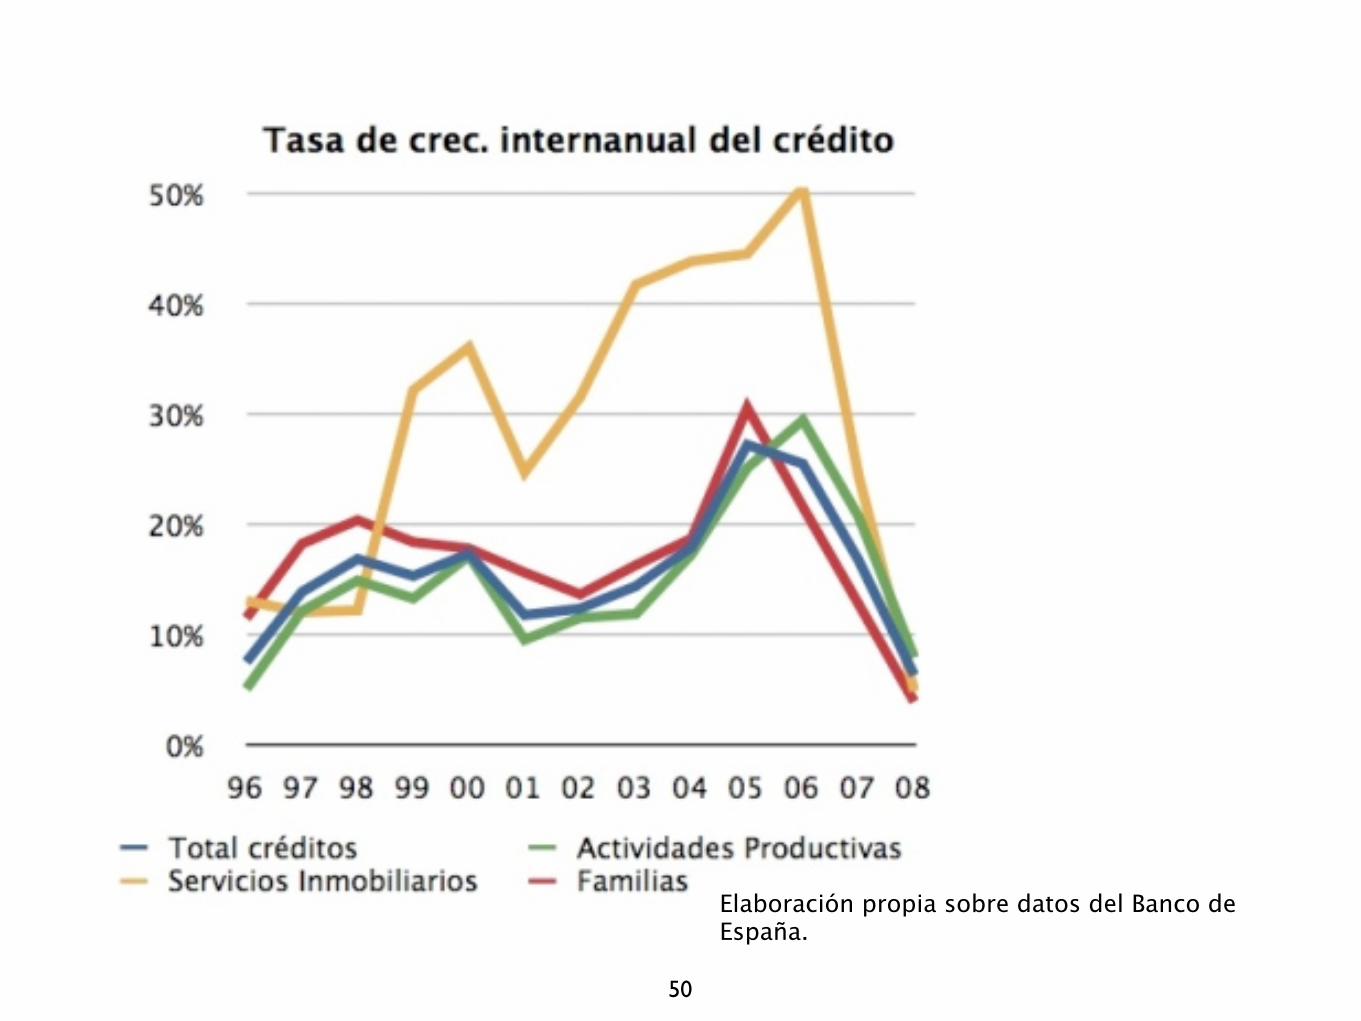
Elaboración propia sobre datos del Banco de España.
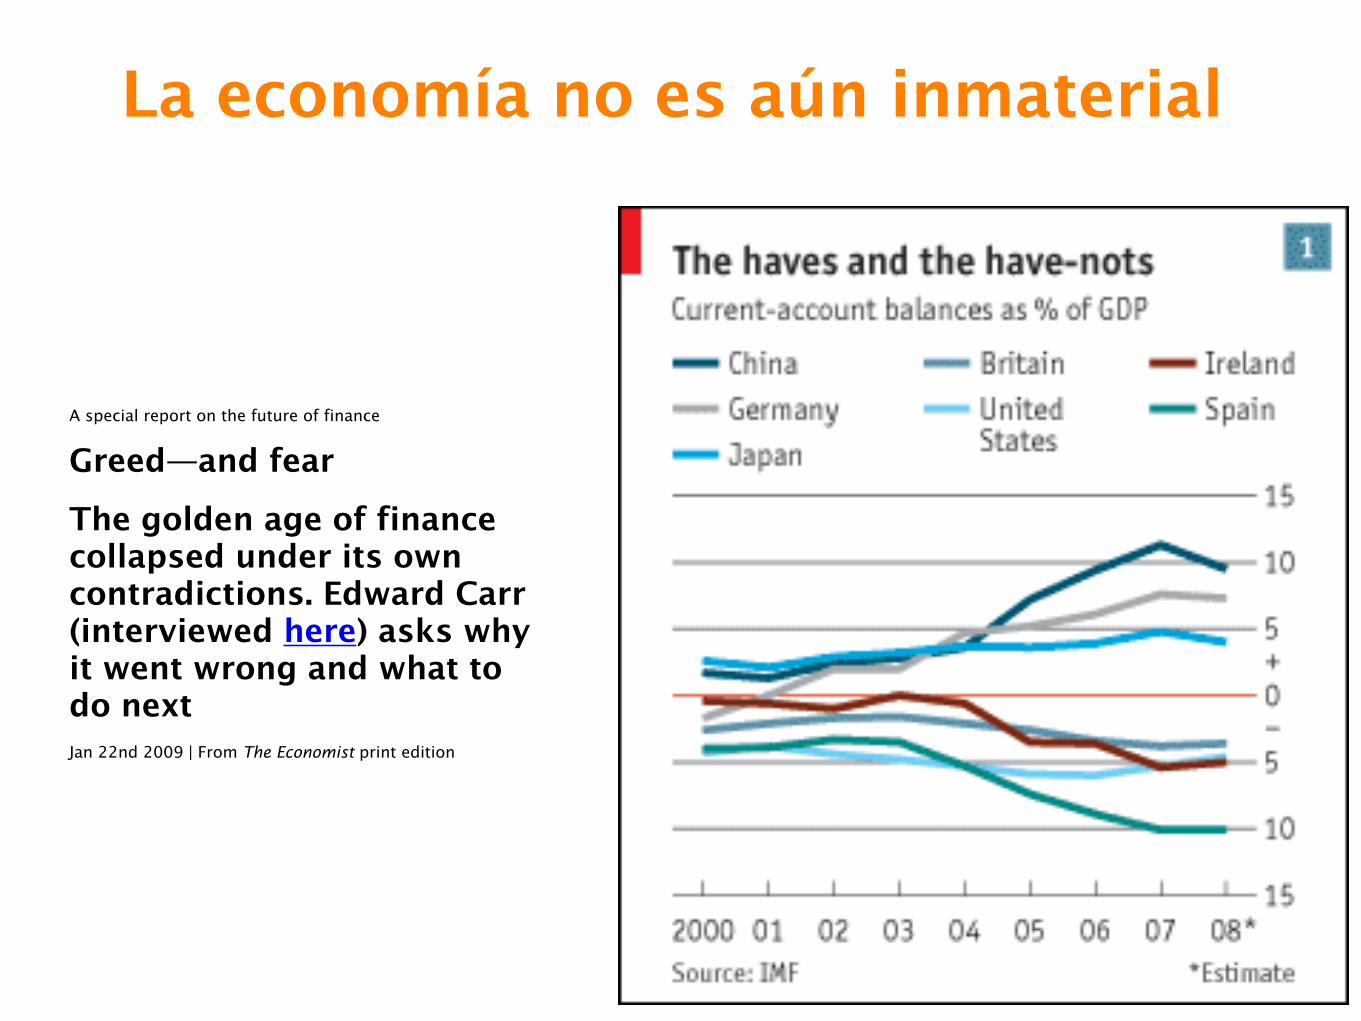
La economía no es aún inmaterial
51
A special report on the future of finance
Greed—and fear
The golden age of finance collapsed under its own contradictions. Edward Carr (interviewed here) asks why it went wrong and what to do nextJan 22nd 2009 | From The Economist print edition
52
!" F INANC IAL CR I S I S INQU IRY COMMI S S ION REPORT
started at Morgan Stanley, it was a private company. When you’re a private company,you don’t get paid until you retire. I mean, you get a good, you know, year-to-yearcompensation.” But the big payout was “when you retire.”!"
When the investment banks went public in the #"$%s and #""%s, the close rela-tionship between bankers’ decisions and their compensation broke down. They werenow trading with shareholders’ money. Talented traders and managers once tetheredto their &rms were now free agents who could play companies against each other formore money. To keep them from leaving, &rms began providing aggressive incen-tives, often tied to the price of their shares and often with accelerated payouts. Tokeep up, commercial banks did the same. Some included “clawback” provisions thatwould require the return of compensation under narrow circumstances, but thoseproved too limited to restrain the behavior of traders and managers.
Studies have found that the real value of executive pay, adjusted for in'ation, grew
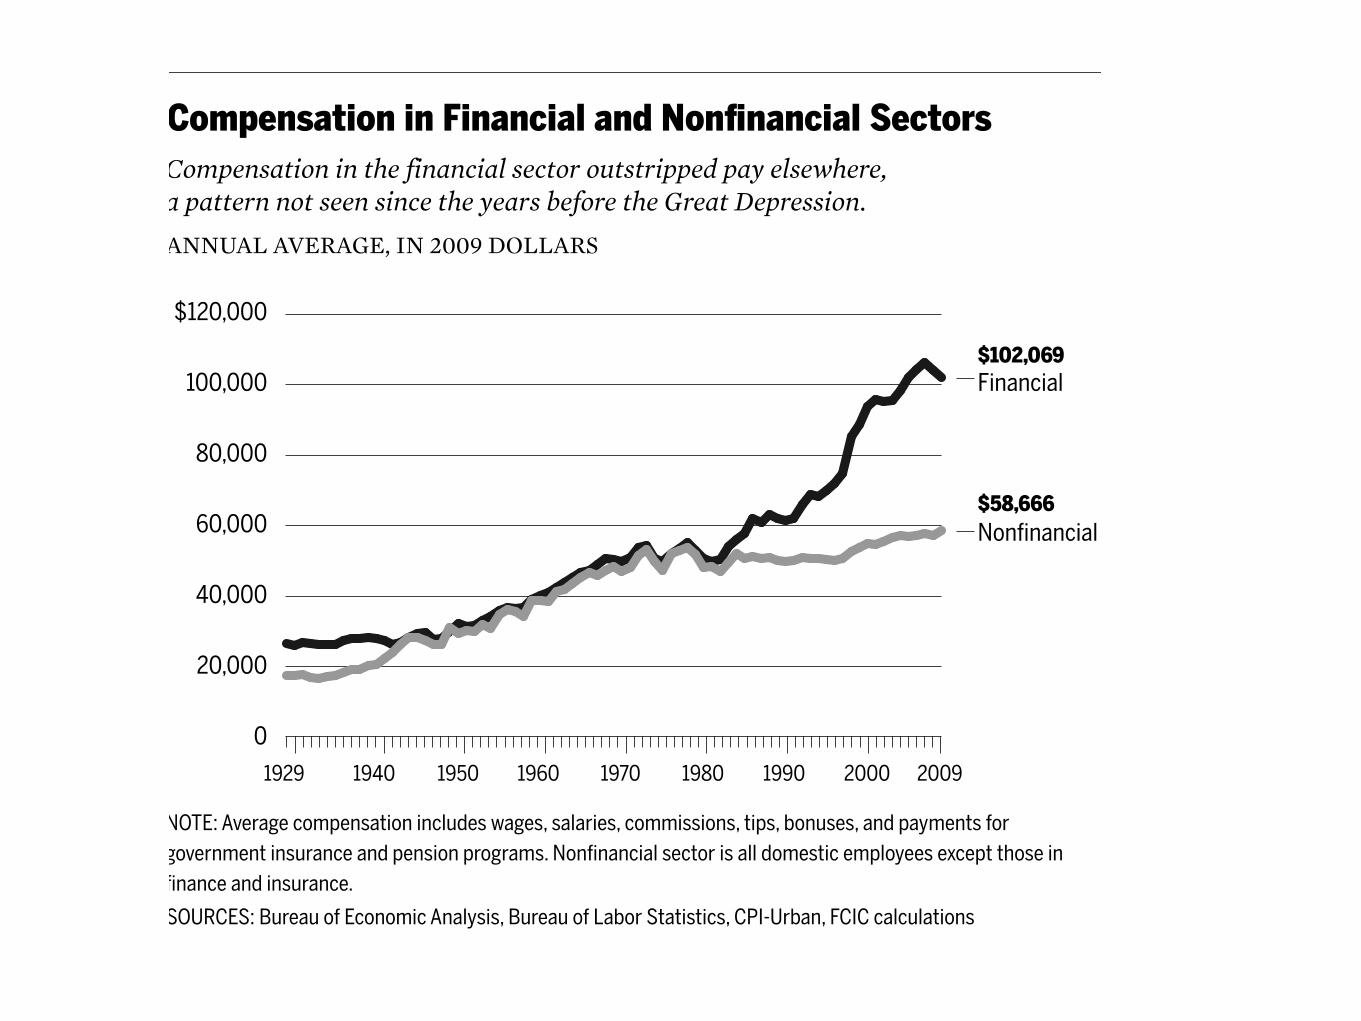
Financial
!"#$#%#&'%(
!"#$%&'()*"& *& +*&(&,*(- (&. /"&0&(&,*(- 1%,)"2'
SOURCES: Bureau of Economic Analysis, Bureau of Labor Statistics, CPI-Urban, FCIC calculations
ANNUAL AVERAGE, IN 2009 DOLLARS
0
$120,000
100,000
80,000
60,000
40,000
20,000
1929 1940 1950 1960 1970 1980 1990 2000 2009
$102,069
$58,666
Compensation in the financial sector outstripped pay elsewhere, a pattern not seen since the years before the Great Depression.
NOTE: Average compensation includes wages, salaries, commissions, tips, bonuses, and payments for )"*+,#-+#. '#/0,%#&+ %#1 2+#/'"# 2,"),%-/3 !"#$#%#&'%( /+&.", '/ %(( 1"-+/.'& +-2("4++/ +5&+2. .6"/+ '# $#%#&+ %#1 '#/0,%#&+3
Figure !."
!"# F INANC IAL CR I S I S INQU IRY COMMI S S ION REPORT
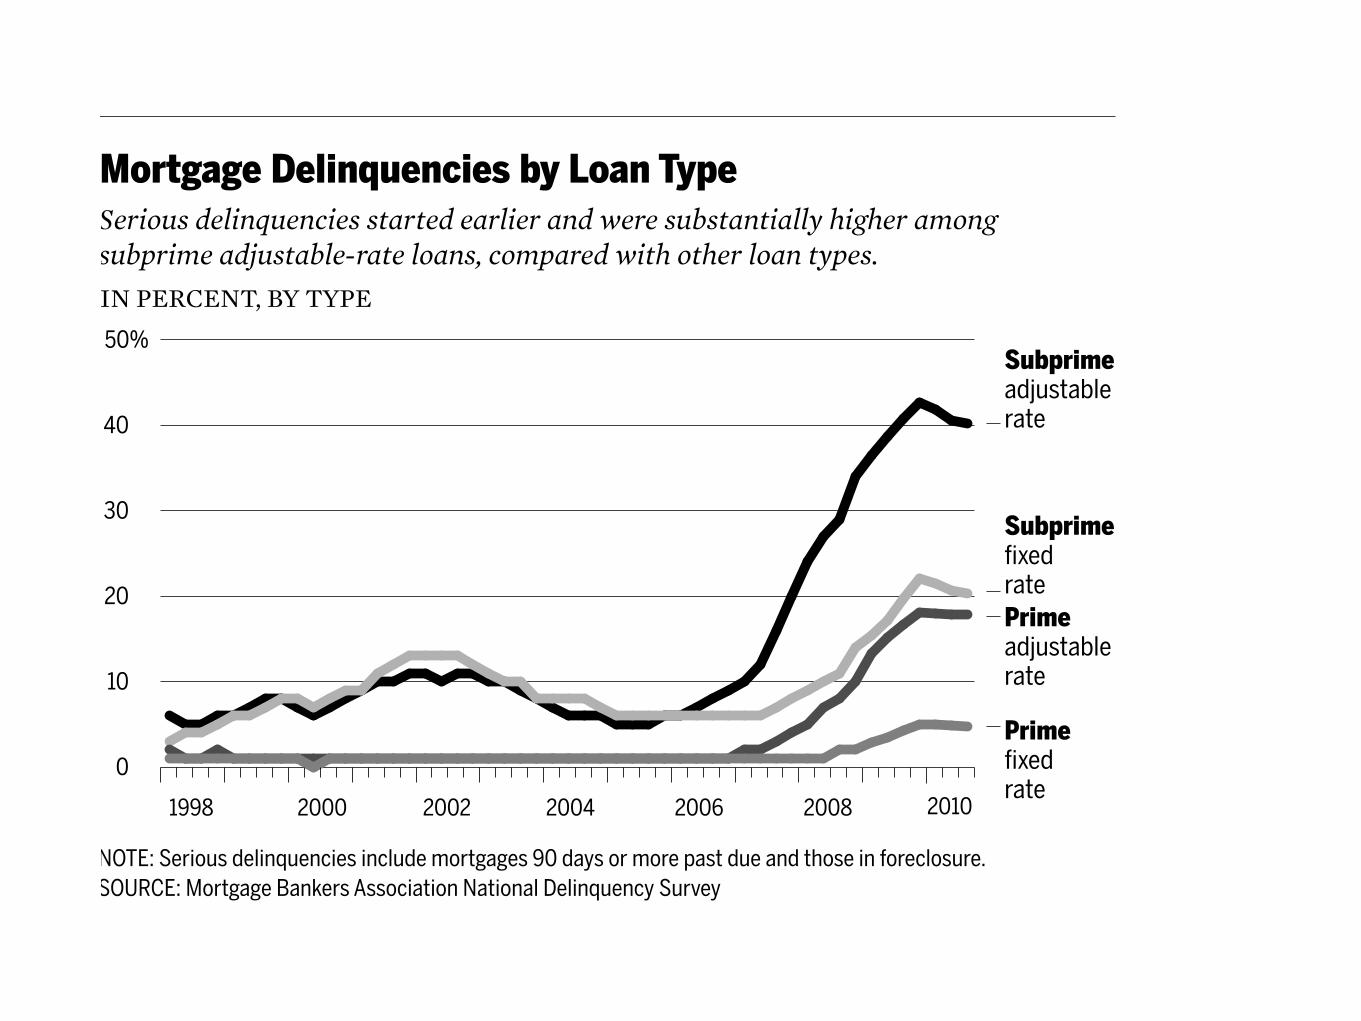
Serious delinquency also varied by type of loan (see !gure "".#). Subprime ad-justable-rate mortgages began to show increases in serious delinquency in early #$$%,even as house prices were peaking; the rate rose rapidly to #$& in #$$'. By late #$$(,the delinquency rate for subprime ARMs was )$&. Prime ARMs did not weaken un-til #$$', at about the same time as subprime !xed-rate mortgages. Prime !xed-ratemortgages, which have historically been the least risky, showed a slow increase in se-rious delinquency that coincided with the increasing severity of the recession and ofunemployment in #$$*.
The FCIC undertook an extensive examination of the relative performance ofmortgages purchased or guaranteed by the GSEs, those securitized in the privatemarket, and those insured by the Federal Housing Administration or Veterans Ad-ministration (see !gure "".+). The analysis was conducted using roughly #, millionmortgages outstanding at the end of each year from #$$% through #$$(."+ The datacontained mortgages in four groups—loans that were sold into private label securiti-zations labeled subprime by issuers (labeled SUB), loans sold into private label Alt-Asecuritizations (ALT), loans either purchased or guaranteed by the GSEs (GSE), andloans guaranteed by the Federal Housing Administration or Veterans Administration(FHA).") The GSE group, in addition to the more traditional conforming GSE loans,
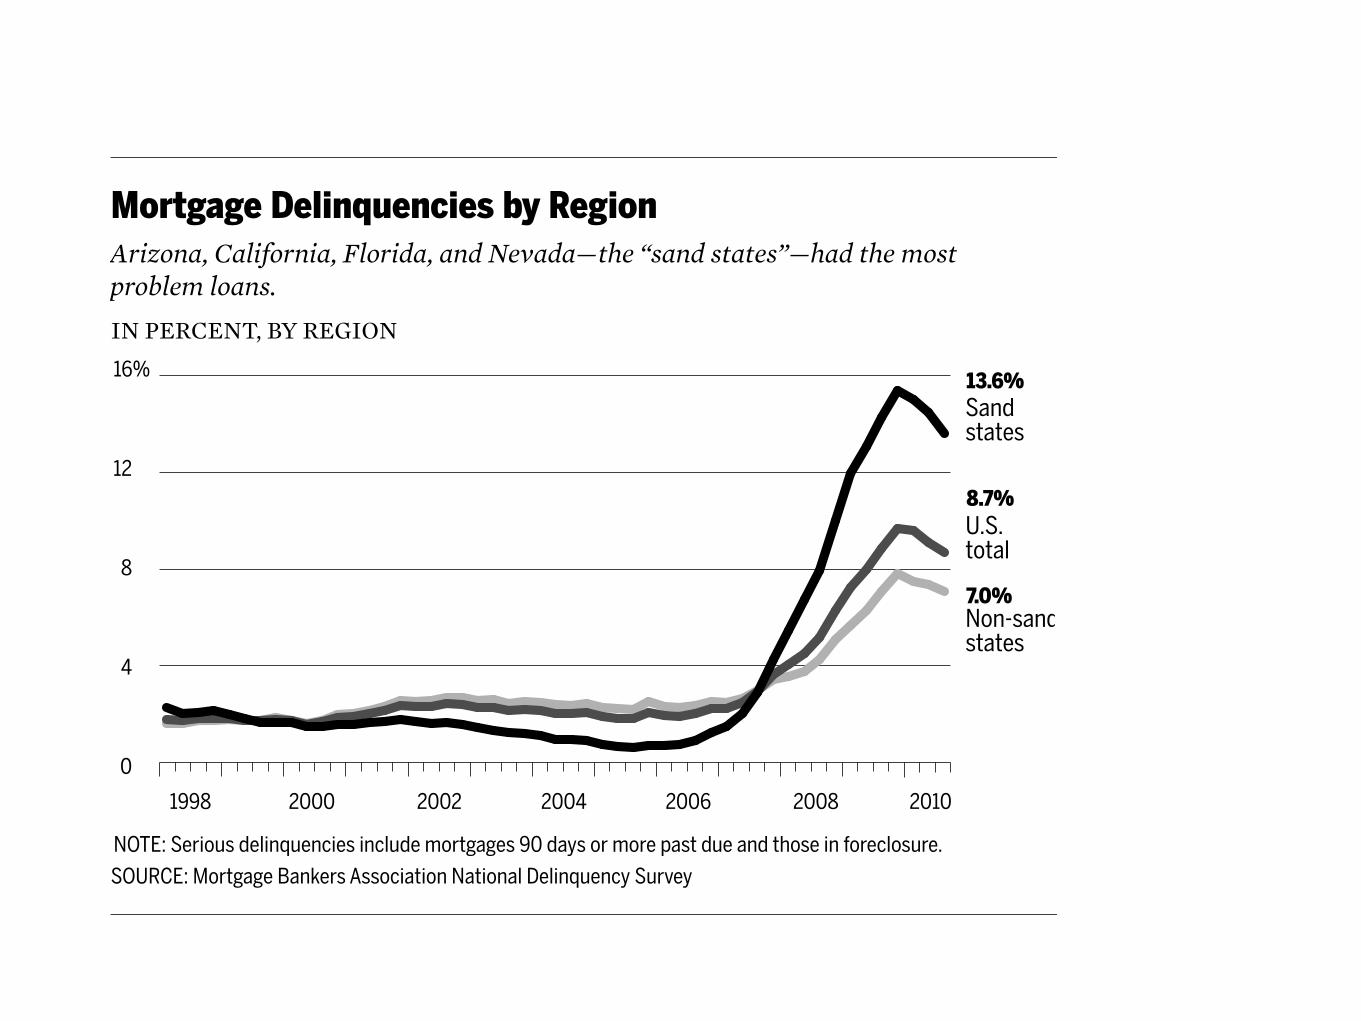
Arizona, California, Florida, and Nevada—the “sand states”—had the most problem loans.
Mortgage Delinquencies by Region
IN PERCENT, BY REGION
0
4
8
12
16%
1998 2000 2002 2004 2006 2008 2010
Sand states
U.S. total
Non-sandstates
13.6%
8.7%
7.0%
SOURCE: Mortgage Bankers Association National Delinquency SurveyNOTE: Serious delinquencies include mortgages 90 days or more past due and those in foreclosure.
Figure !!.!
T H E B U S T !"#
also includes mortgages that the GSEs identi!ed as subprime and Alt-A loans owingto their higher-risk characteristics, as discussed in earlier chapters.
Within each of the four groups, the FCIC created subgroups based on characteris-tics that could affect loan performance: FICO credit scores, loan-to-value ratios(LTVs), and mortgage size. For example, one subgroup would be GSE loans with abalance below "#$%,&&& (conforming to GSE loan size limits), a FICO score between'#& and '() (a borrower with below-average credit history), and LTV between *&+and $&&+. Another group would be Alt-A loans with the same characteristics. Ineach year, the loans were broken into (%' different subgroups—$## each for GSE,SUB, ALT, and FHA.$(
Figure $$., graphically demonstrates the results of the examination. The variousbars show the range of average delinquencies for each of the four groups examined,based on the distribution of delinquency rates within the $## subgroups for eachloan category. The black portion of each bar represents the middle (&+ (-(+ on ei-ther side of the median) of the distribution of average delinquency rates. The full bar,including both dark and light shading, represents the middle )&+ of the distributionof average delinquency rates. The bars exclude the (+ at the extremes of each end ofthe distribution. For example, at the end of -&&*, the black portion of the GSE bar
Figure !!."
Mortgage Delinquencies by Loan Type
IN PERCENT, BY TYPE
SOURCE: Mortgage Bankers Association National Delinquency Survey
Subprime adjustable rate
Subprime !"!" ratePrime adjustable rate
Prime !"!" rate
1998 2000 2002 2004 2006 2008 2010
NOTE: Serious delinquencies include mortgages 90 days or more past due and those in foreclosure.
Serious delinquencies started earlier and were substantially higher among subprime adjustable-rate loans, compared with other loan types.
0
10
20
30
40
50%
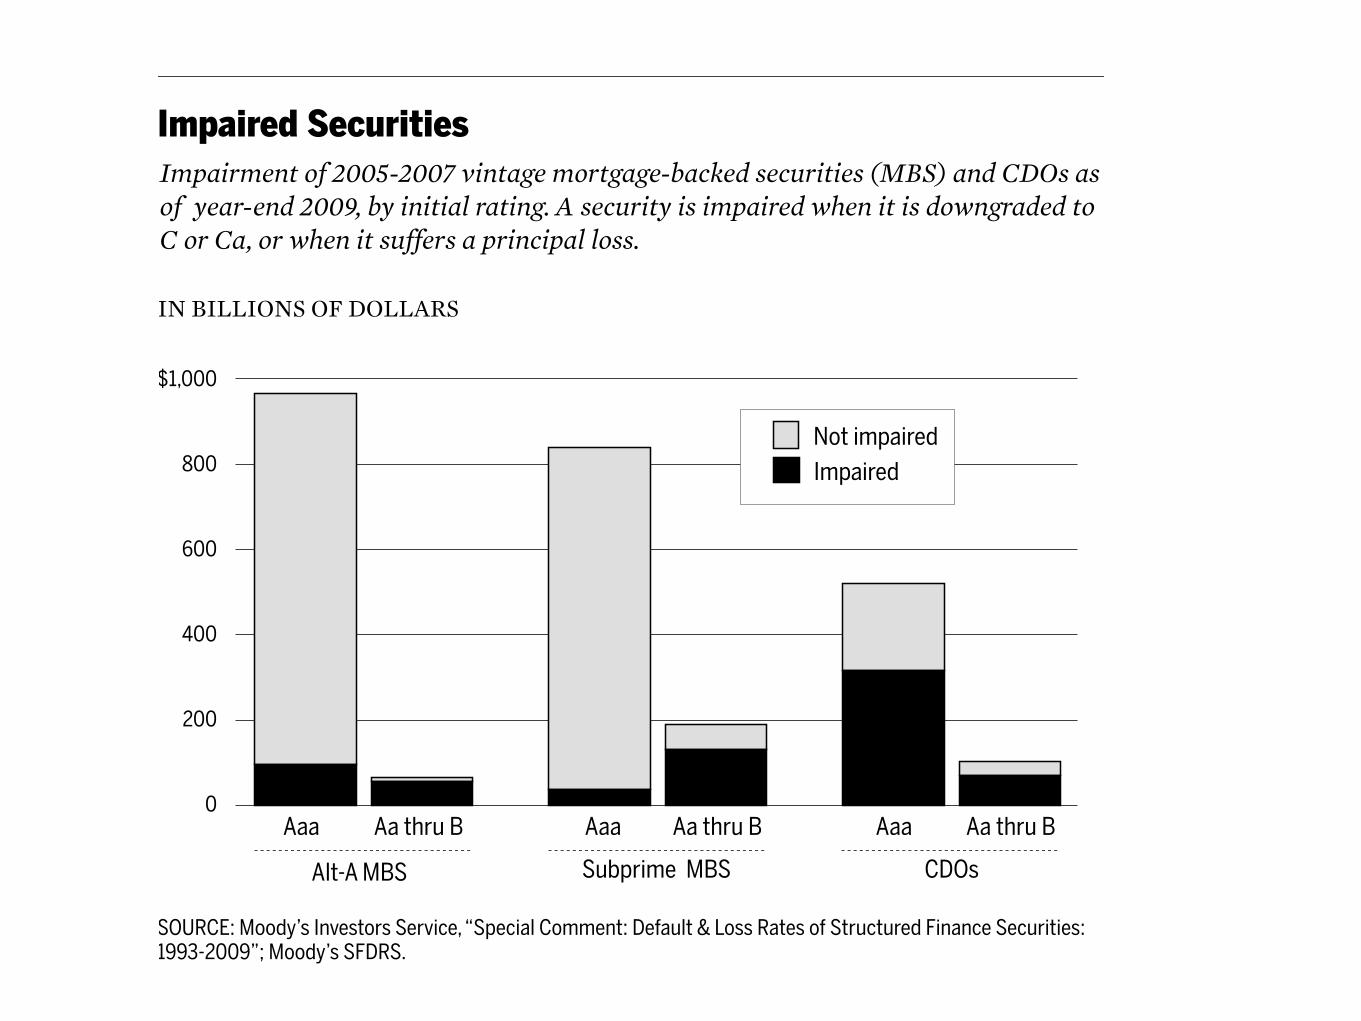
minent or had already been suffered—by the end of !""# (see $gure %%.&). For thelower-rated Baa tranches, #'.() of Alt-A and #(.() of subprime securities were im-paired. In all, by the end of !""#, *+!" billion worth of subprime and Alt-A trancheshad been materially impaired—including *%+!.' billion originally rated triple-A. Theoutcome would be far worse for CDO investors, whose fate largely depended on theperformance of lower-rated mortgage-backed securities. More than #") of Baa CDObonds and ,%.+) of Aaa CDO bonds were ultimately impaired.,!
The housing bust would not be the end of the story. As Chairman Bernanke testi-$ed to the FCIC: “What I did not recognize was the extent to which the system had-aws and weaknesses in it that were going to amplify the initial shock from subprimeand make it into a much bigger crisis.”,+
T H E B U S T !!"
Impairment of 2005-2007 vintage mortgage-backed securities (MBS) and CDOs as of year-end 2009, by initial rating. A security is impaired when it is downgraded to C or Ca, or when it suffers a principal loss.
Impaired Securities
IN BILLIONS OF DOLLARS
0
200
400
600
800
$1,000
SOURCE: Moody’s Investors Service, “Special Comment: Default & Loss Rates of Structured Finance Securities: 1993-2009”; Moody’s SFDRS.
Aa thru BAaaAa thru BAaaAa thru BAaa
Not impairedImpaired
Alt-A MBS Subprime MBS CDOs
Figure !!."
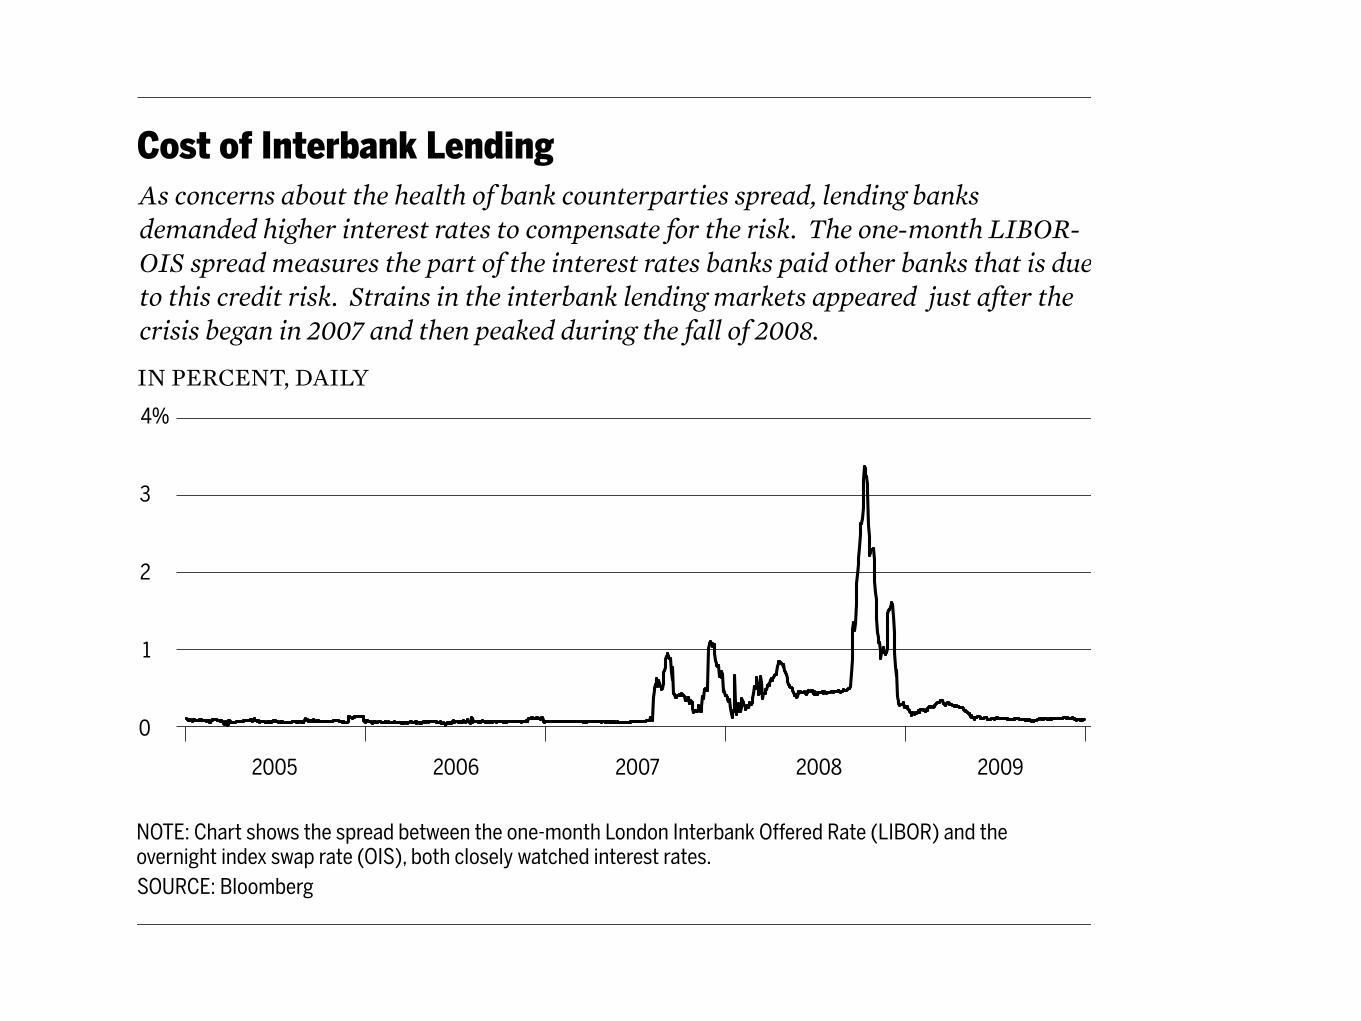
As concerns about the health of bank counterparties spread, lending banks demanded higher interest rates to compensate for the risk. The one-month LIBOR-OIS spread measures the part of the interest rates banks paid other banks that is dueto this credit risk. Strains in the interbank lending markets appeared just after the crisis began in 2007 and then peaked during the fall of 2008.
Cost of Interbank Lending
IN PERCENT, DAILY
SOURCE: Bloomberg
1
0
2
3
4%
2005 2006 2007 20092008
NOTE: Chart shows the spread between the one-month London Interbank Offered Rate (LIBOR) and the overnight index swap rate (OIS), both closely watched interest rates.
Figure !".#
C R I S I S A N D PA N I C !""
pended on those markets.! “When the commercial paper market died, the biggestcorporations in America thought they were "nished,” Harvey Miller, the bankruptcyattorney for the Lehman estate, told the FCIC.#$
Investors and uninsured depositors yanked tens of billions of dollars out of bankswhose real estate exposures might be debilitating (Washington Mutual, Wachovia) infavor of those whose real estate exposures appeared manageable (Wells Fargo, JP Mor-gan). Hedge funds withdrew tens of billions of dollars of assets held in custody at the re-maining investment banks (Goldman Sachs, Morgan Stanley, and even Merrill Lynch,as the just-announced Bank of America acquisition wouldn’t close for another three anda half months) in favor of large commercial banks with prime brokerage businesses (JPMorgan, Credit Suisse, Deutsche Bank), because the commercial banks had more di-verse sources of liquidity than the investment banks as well as large bases of insured de-posits. JP Morgan and BNY Mellon, the tri-party repo clearing banks, clamped downon their intraday exposures, demanding more collateral than ever from the remaininginvestment banks and other primary dealers. Many banks refused to lend to one an-other; the cost of interbank lending rose to unprecedented levels (see "gure %$.#).
58
“Si la tecnología es el motor de la nueva economía, las finanzas son la gasolina” (Mandel (2000)).
La historia, ¿se repite?
59
"Para que las fuerzas generadoras de riqueza en el nuevo paradigma alcancen su máximo esplendor, se requieren cambios inmensos en los patrones de inversión, en los modelos de organización de máxima eficiencia, en los mapas mentales de todos los actores sociales y en las instituciones que regulan y habilitan los procesos sociales y económicos".
Carlota Pérez