Embed Size (px)
Citation preview

Correla'ng Type II and III Radio Bursts with Solar Energe'c Par'cle Events
Kathryn Ledbe@er Mentors: Lisa Winter, Rick Quinn (AER)
SOHO/ESA & NASA
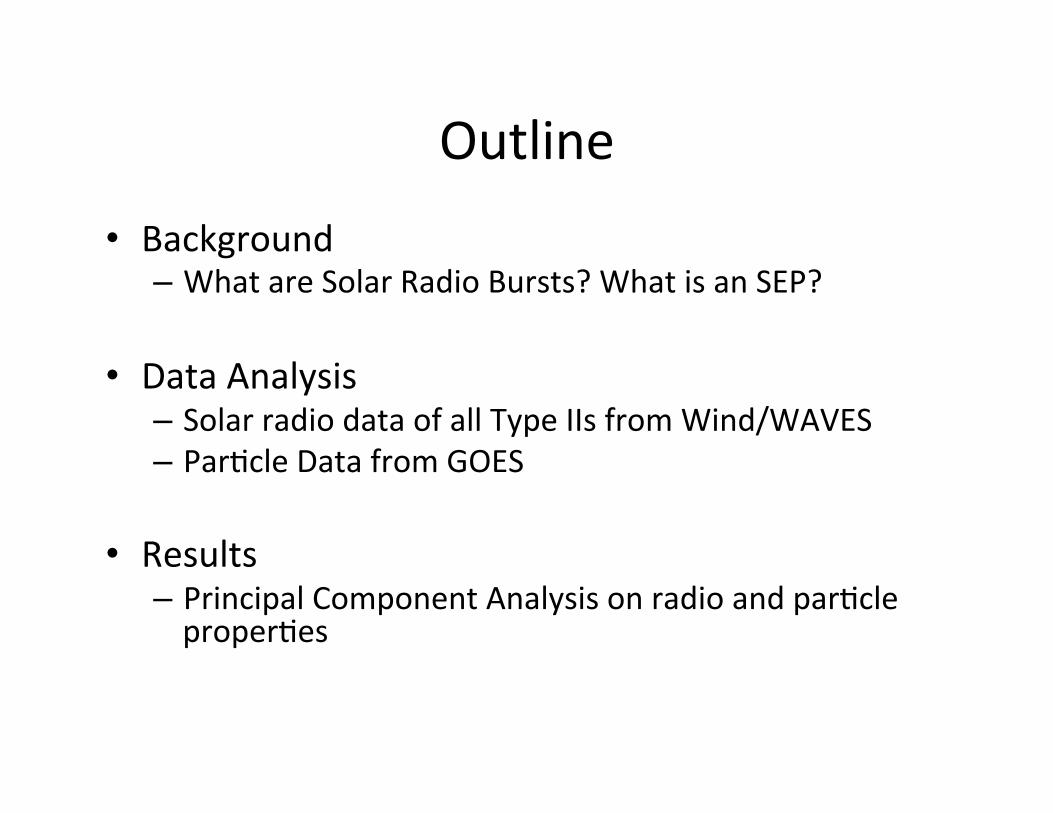
Outline • Background – What are Solar Radio Bursts? What is an SEP?
• Data Analysis – Solar radio data of all Type IIs from Wind/WAVES – Par'cle Data from GOES
• Results – Principal Component Analysis on radio and par'cle proper'es

Solar Energe'c Par'cles (SEPs)
• Impulsive (flare-‐related) and gradual (shock wave-‐related) • High energy protons can be damaging to satellites
NASA/Honeywell Tech Solu'ons, C. Meaney
GOES Geosta'onary orbit Space Environment Monitor:
Energe'c Par'cle Sensor Monitors 7 channels of energe'c protons

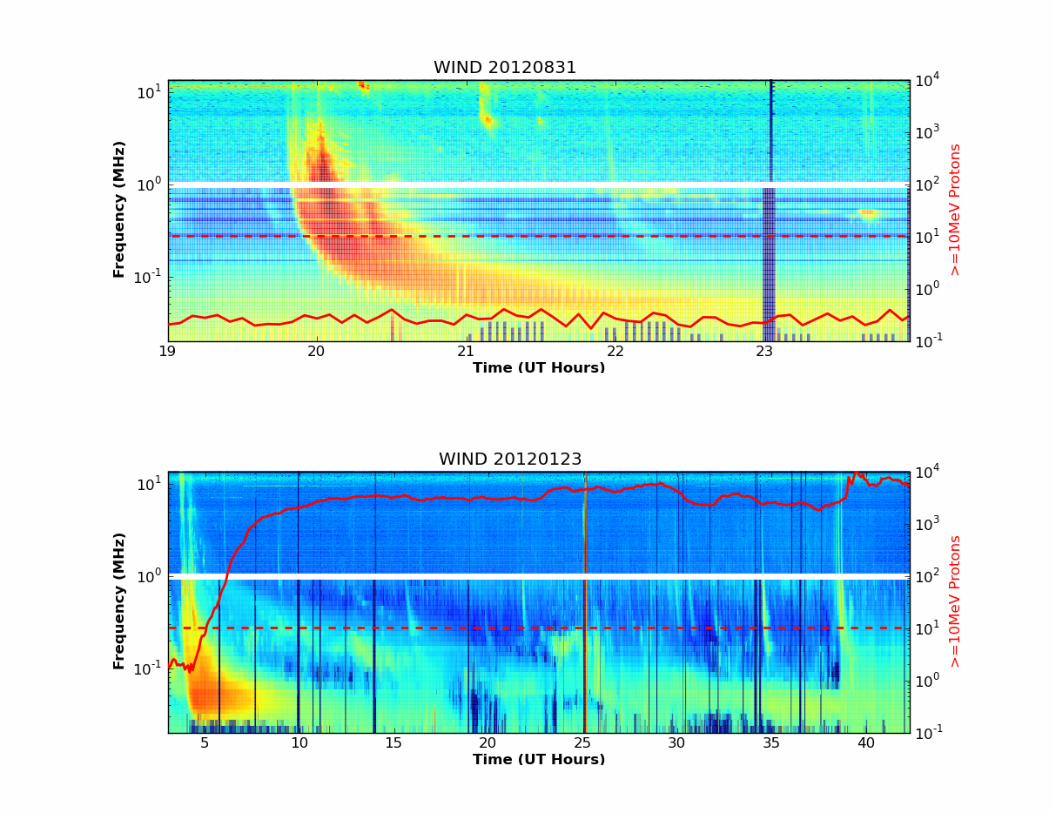
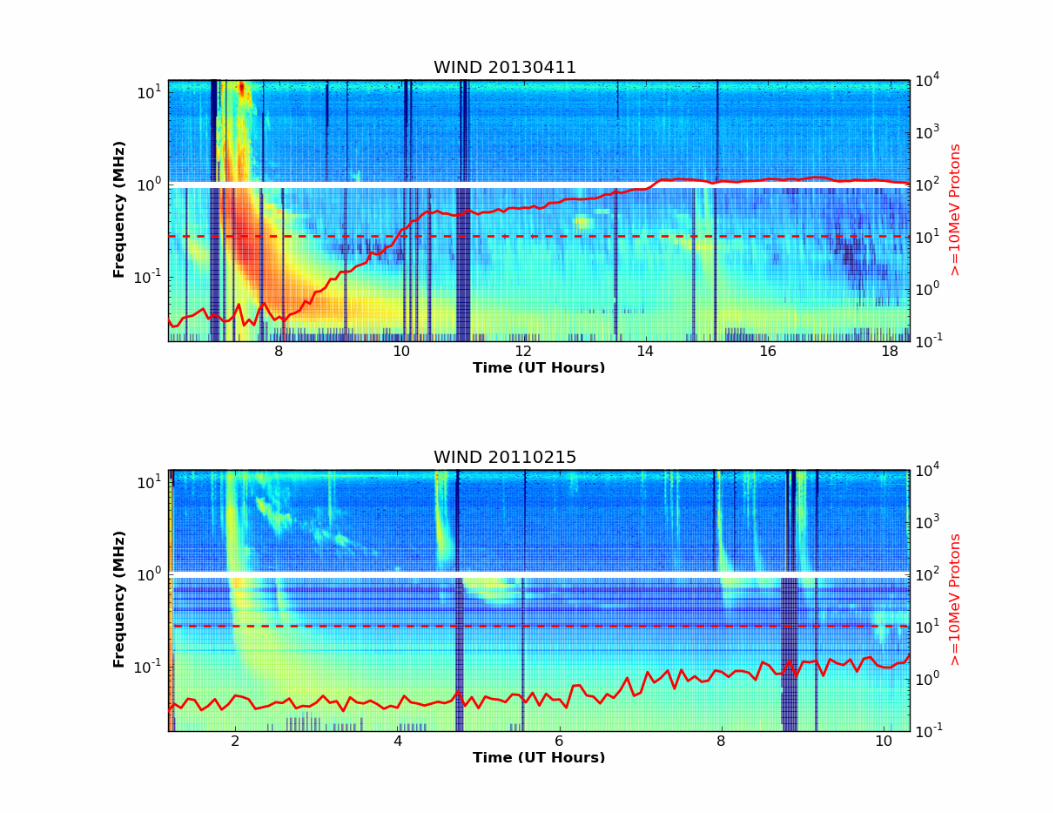
Data • Jan 2010-‐May 2013 • 123 Type II radio bursts detected by WAVES • 24 SEP events recorded by GOES; 22 associated with a Type II radio burst
• X-‐ray flares detected by GOES in 2010-‐2012 (compiled by Alan Ling of AER)
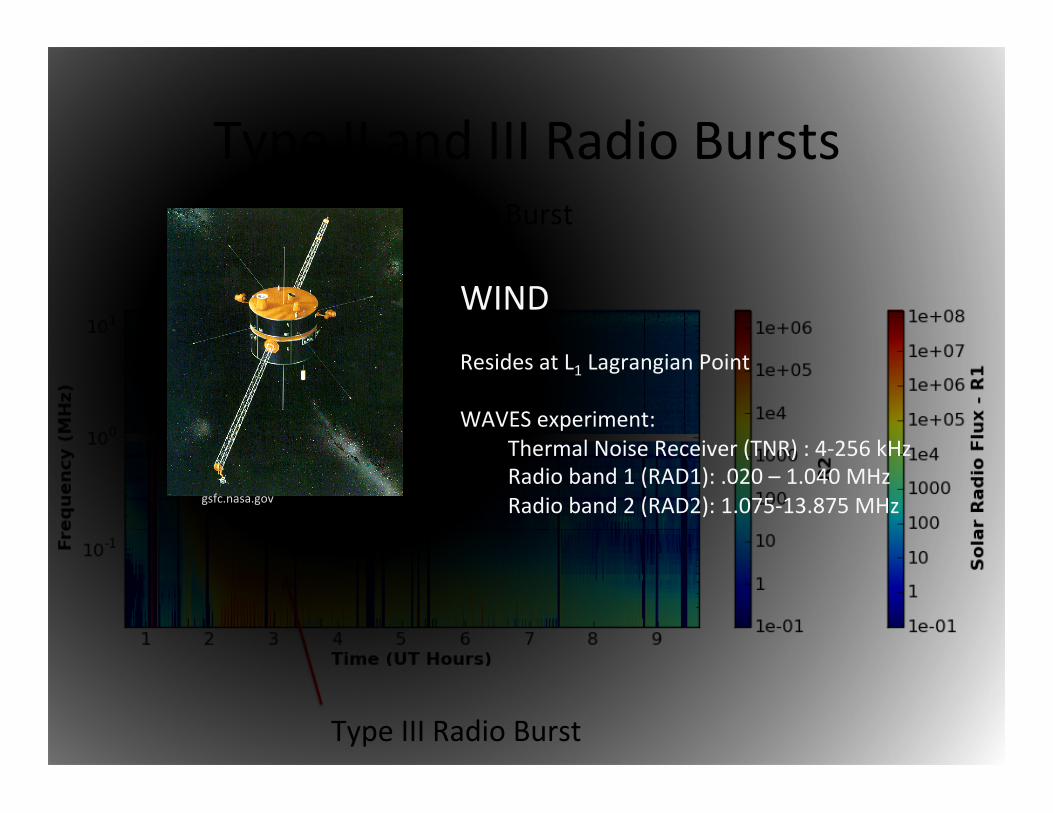
Type II and III Radio Bursts
Type III Radio Burst
Type II Radio Burst
gsfc.nasa.gov
WIND Resides at L1 Lagrangian Point WAVES experiment:
Thermal Noise Receiver (TNR) : 4-‐256 kHz Radio band 1 (RAD1): .020 – 1.040 MHz Radio band 2 (RAD2): 1.075-‐13.875 MHz

1/Frequency Transform
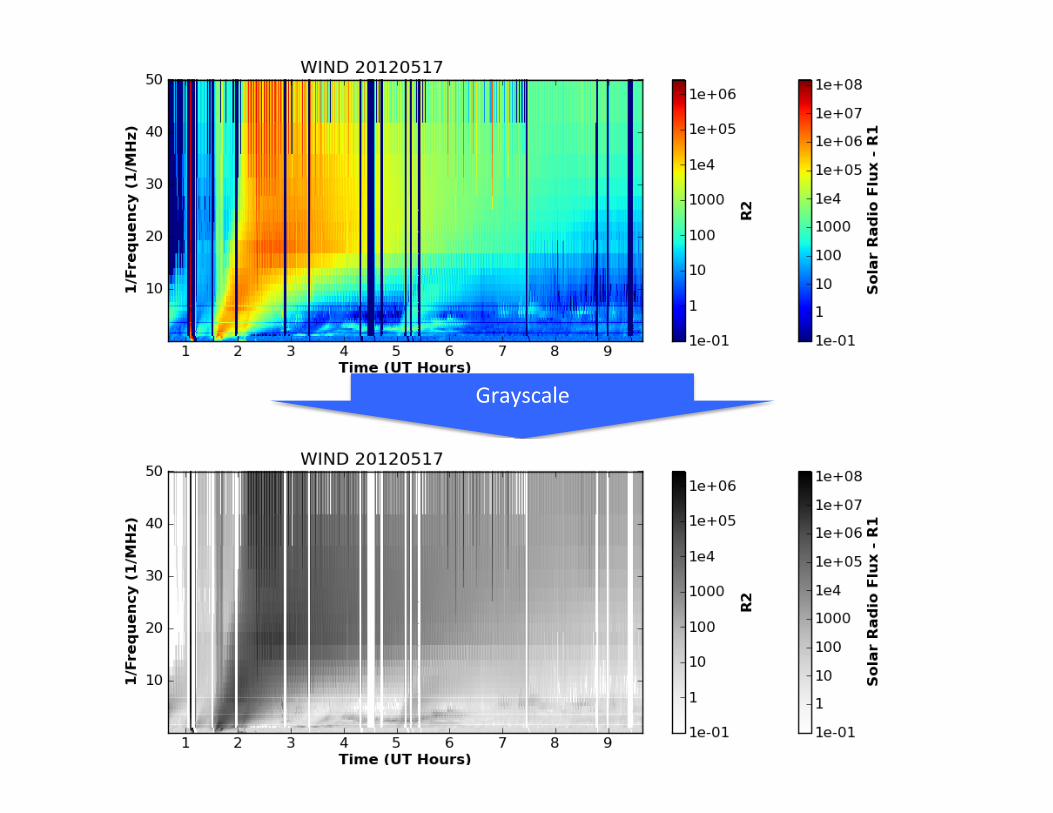
Grayscale

Histogram equaliza'on, boxcar smoothing, zoom
Local Maxima

Separa'on along Edges

Points Selected

-‐Type II Burst Slope -‐Type III Burst Slope -‐Type III Burst Dura'on above 6 dB at 1 MHz (10 minutes is the MacDowall (2003) defini'on of a long-‐dura'on Type III burst)
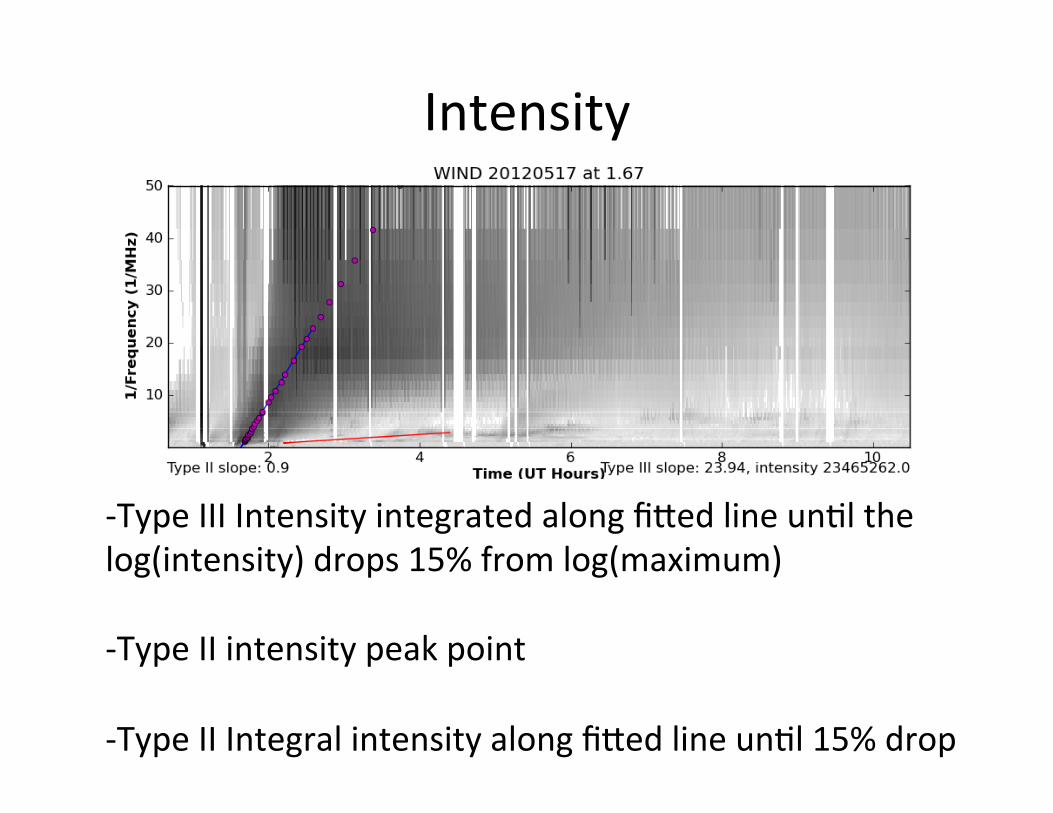
Intensity
-‐Type III Intensity integrated along fi@ed line un'l the log(intensity) drops 15% from log(maximum) -‐Type II intensity peak point -‐Type II Integral intensity along fi@ed line un'l 15% drop

X-‐Ray Flares
-‐X-‐ray Flares Preceding Type II Radio Burst -‐X-‐ray Peak Magnitude -‐X-‐ray Flare Dura'on

Local Langmuir Waves
Caused by electrons passing by the satellite and radia'ng at the local plasma frequency Langmuir waves are a sign that WIND is magne'cally well-‐connected to the ac've region and is in the path of electrons accelerated there

Time Deriva've
Signal Integrated over 9-‐49 kHz
-‐Langmuir Wave Maximum Intensity
SEPs
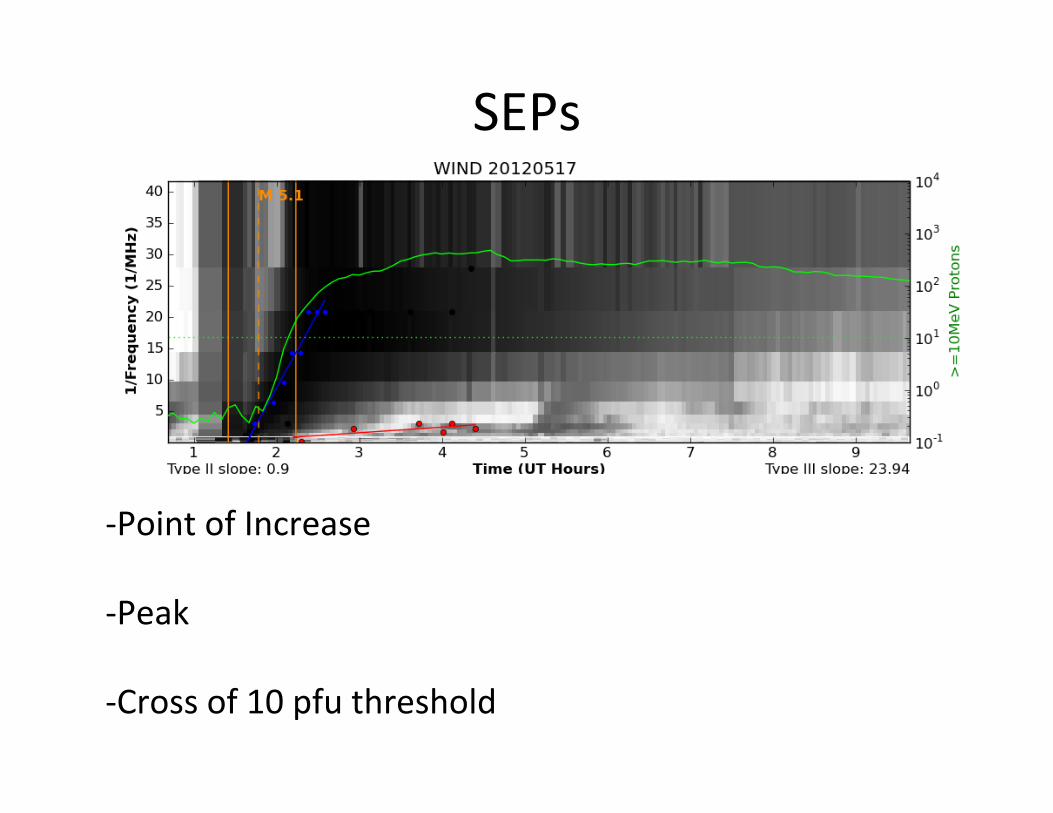
-‐Point of Increase -‐Peak -‐Cross of 10 pfu threshold

Type II Radio Bursts
Type III Radio Bursts
X-‐ray Flares Local Langmuir Waves
Solar Energe>c Par>cles
Dura'on Dura'on at 1MHz
Peak Intensity Peak Intensity Increase Time
Frequency Range Slope Dura'on Peak Time
Slope Integral Intensity Peak Intensity
Peak Intensity
Integral Intensity 94 usable data points—29 Type II bursts were either not visible to WIND or overlapped too closely to be characterized (none of these discarded bursts were associated with an SEP event).
Variables Overview
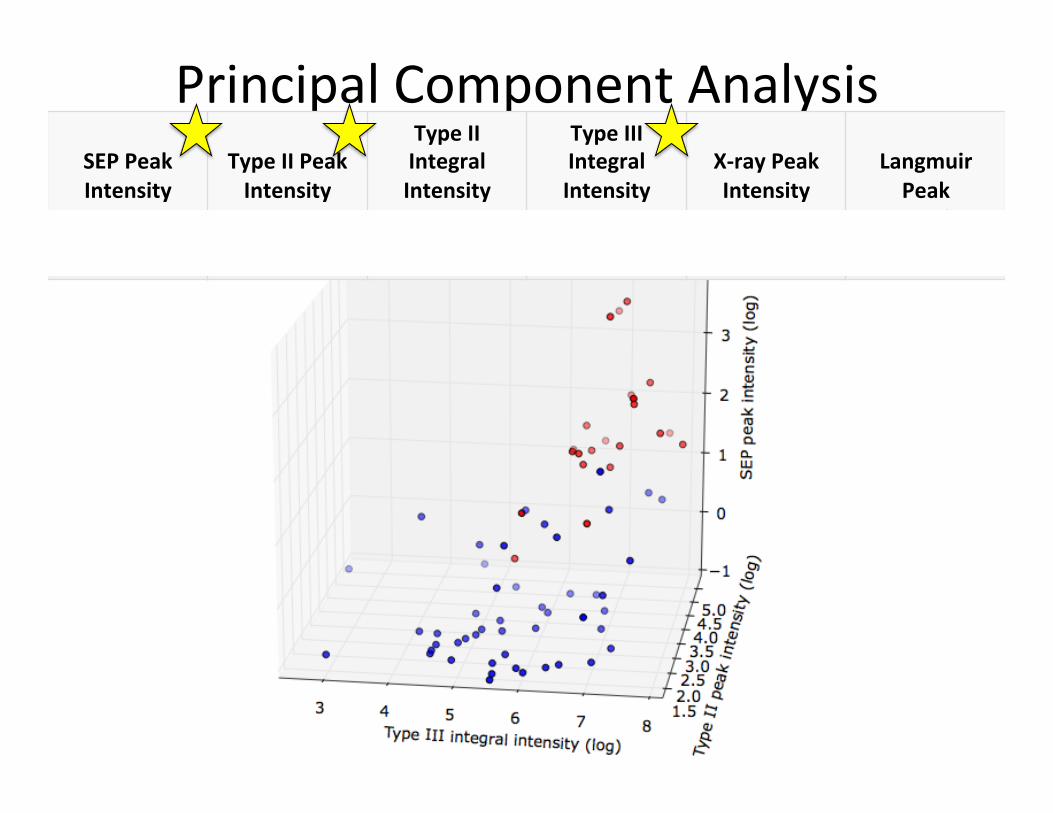
Principal Component Analysis
SEP Peak Intensity
Type II Peak Intensity
Type II Integral Intensity
Type III Integral Intensity
X-‐ray Peak Intensity
Langmuir Peak
Intensity
0.412 0.446 0.374 0.576 0.101 0.388

Type III dura>on at 1MHz
Type II Peak Intensity
Type III Integral Intensity
Langmuir Peak Intensity
0.358 0.355 0.610 0.346
Type II Dura>on
Type II Frequency Range
Type II Slope
Type II Integral Intensity
Type III Slope
0.168 0.259 0.003 0.294 0.269
19/22 SEPs predicted 5 false alarms

Future Work
• Present work at Fall AGU and AER • Extend to STEREO archived data, as well as beacon data for real-‐'me predic'ons
• Automate characteriza'on of SEP peaks • Include X-‐ray variables in PCA

Acknowledgements and Cita'ons
Mentors: Lisa Winter and Rick Quinn (AER) Langmuir Waves: David Malaspina (LASP) X-‐Ray Data: Alan Ling (AER) Lobzin, V et al. (2010). Automa'c recogni'on of coronal type II radio bursts: The
automated radio burst iden'fica'on system method and first observa'ons. The Astrophysical Journal Le@ers, (710), L58-‐L62. doi: 10.1088/2041-‐8205/710/1/L58.
MacDowall, R. J. (2003). Long-‐dura'on hectometric type III radio bursts and their associa'on with solar energe'c par'cle (SEP) events. Geophysical Research Le@ers, 30(12), 8018. doi: 10.1029/2002GL016624.