Embed Size (px)
Citation preview

Battery Storage Design for Grid Connected Systems
SEIA PD Day; Solar 2015Warwick JohnstonManaging Director
SunWiz

Storage – the hype and the reality
• Everyone asks for storage• ~1% actually go ahead, though some specialise• At least there can be some profit in it • Tesla has got everyone even more excited… but when will it be available in Australia
• Australian conditions ripe for Energy Storage (TOU, self‐consumption incentive)
• How to approach the market

Rules of thumb are really really really difficult
• We have built a sophisticated excel sheet to perform hour‐by‐hour modelling
• We will summarise lessons learned and generalise them, to assist in your design
• We can assist you with sizing and evaluating systems on a case‐by‐case basis. Alternatively you too could become an expert on HOMER software

Rule #1… hideously complex design for optimal financial outcome• The “Absorb all of the PV generation” approach leads to under‐utilisation of the battery
• Just like PV has financial diminishing returns, so does battery volume• Understanding the Energy Consumption Profile is key and critical, even moreso than for PV alone
• Consider whether switching to TOU will affect their bill• Should you focus upon arbitrage or avoided solar exports• How do technical factors affect things
• battery dis/charge regimen and • max rate of charge/discharge and battery capacity
• Cycle Life

Two approaches
Arbitrage• Discharge batteries during peak periods
• Charge batteries from off‐peak energy
• Any solar energy would likely be exported as batteries would start the day full
• Its possible to offer a Tesla battery‐only solution with 13 year payback in Ausgrid territory
Export Avoidance• Charge the batteries from energy that would otherwise be export
• Discharge batteries as soon as the solar exports cease – accept peak or shoulder rate
• Pre‐discharge batteries in the morning so they’re empty and can absorb as much PV as possible
• Its possible to offer a 5kW PV system with 7kW Tesla batteries with 7.6 year payback… well into Early Adopter territory
Simplistic approach: ARBITRAGE with Tesla
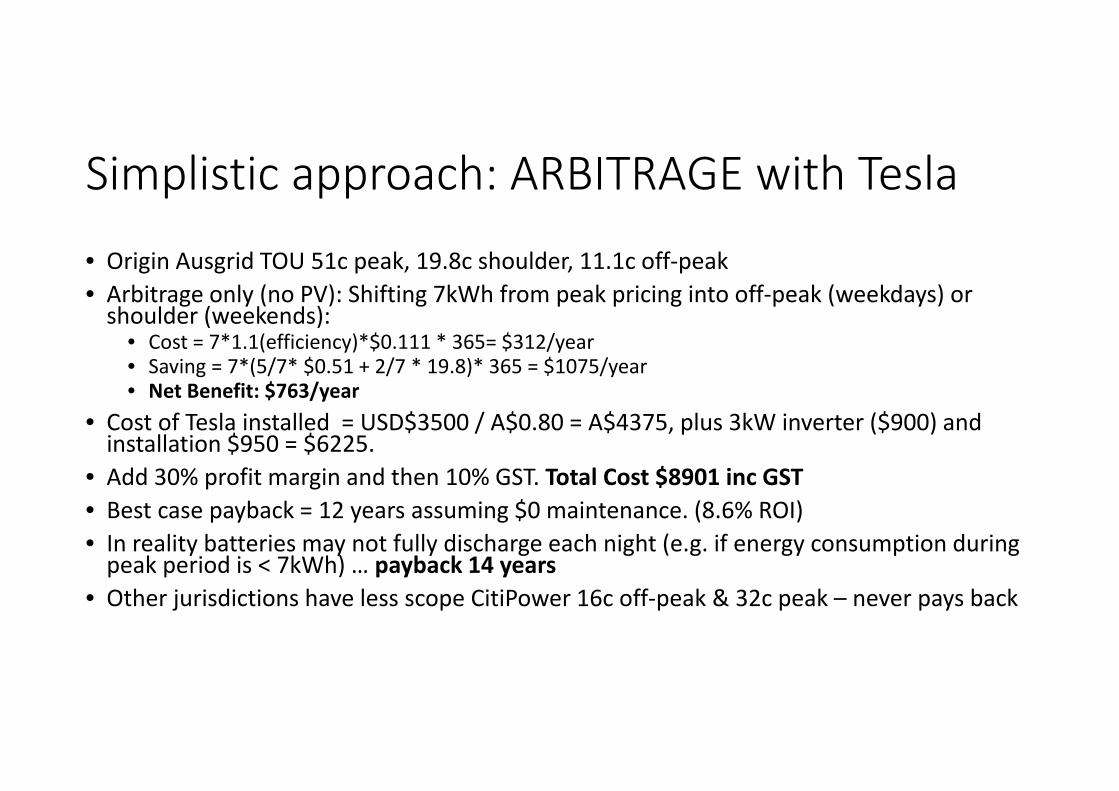
• Origin Ausgrid TOU 51c peak, 19.8c shoulder, 11.1c off‐peak• Arbitrage only (no PV): Shifting 7kWh from peak pricing into off‐peak (weekdays) or shoulder (weekends):
• Cost = 7*1.1(efficiency)*$0.111 * 365= $312/year• Saving = 7*(5/7* $0.51 + 2/7 * 19.8)* 365 = $1075/year• Net Benefit: $763/year
• Cost of Tesla installed = USD$3500 / A$0.80 = A$4375, plus 3kW inverter ($900) and installation $950 = $6225.
• Add 30% profit margin and then 10% GST. Total Cost $8901 inc GST• Best case payback = 12 years assuming $0 maintenance. (8.6% ROI)• In reality batteries may not fully discharge each night (e.g. if energy consumption during peak period is < 7kWh) … payback 14 years
• Other jurisdictions have less scope CitiPower 16c off‐peak & 32c peak – never pays back

Simplistic approach (detailed to come)100% effective PV shifting with Tesla• Origin Ausgrid TOU 51c peak, 19.8c shoulder, 11.1c off‐peak• Arbitrage only (no PV): Shifting 7kWh from export into peak (weekdays)/shoulder (weekends):
• Cost = 7*1.1(efficiency)*$0.06 * 365= $169/year• Benefit = 7*(5/7* $0.51 + 2/7 * 19.8) * 365 = $1075/year• Net: $906
• Cost of unit Total $8901.• Best case Battery payback = 9.8 years assuming $0 maintenance. (10% ROI)• Actual case: 15 years (for those with 5kW of PV already installed)• But System payback approaching 7 years!“There’s no way we can possibly satisfy this demand this year,” Musk admitted. “We’re basically sold out through the first half of next year.”

Export Avoidance Minimisation Approach• Consider: is it possible to absorb all the solar export?
• 5kW system produces 20kWh/day average• Problem #1: top 25% of consumers!!!
• 5.5kWh/kWp/day of production in daylight reasonable summer’s day. = 27.5kWh of generation
• Problem #2: 7kWh of storage• If 7kWh of it is absorbed by batteries, the rest must be self‐consumed… or will still be export.
• Problem #3: Unless the customer has 20.5kWh of daytime load, then there will be exports!

Export Avoidance Minimisation Approach• All of these battery‐backup systems with 2‐5kWh of storage will have minimal effect on reducing export
• In simple terms, the batteries readily fill, and overflow!
• Should I go for a bigger battery bank?• Financially & Energetically, there are diminishing
returns from upsized batteries• With lead‐acid, lifetime is a function of depth‐of‐
discharge, so there may be some long‐term value in larger batteries.
• The first kWh of storage does the most work in reducing export… the second kWh does a bit less… and so on. But there are also fixed costs of installation, so sweet spots will exist.
• Sweet spots with vary from customer to customer
System Size (kW)
1.0 1.5 2.0 2.5 3.0 3.5 4.0 4.5 5.0
0%
10%
20%
30%
40%
50%
60%
70%
80%
90%
28%
37%
49%
54%
60%
67%65%
68%
74%
Export for each System Size (kW) The view is filtered on Sys-
60% of 3kW system = 7.2kWh/day export
to store
75% of 5kW system = 15kWh/day export to
store

A: In most cases there is already more than enough PV capacity installed on existing systems to recharge batteries
Q: Is there sufficient solar PV capacity to run daytime loads as well as recharge batteries or is an increase required?

Sizing: Step 1
0%
10%
20%
30%
40%
50%
60%
70%
80%
90%
100%Hour (group)
EveningEarly MorningDaylight
• Understanding Total consumption• Median: 15kWh/day• 50% of Ausgrid solar customers between
11 – 20kWh/day• Google SunWiz Export Calculator for free
calculations of export from various system sizes
• High‐level understanding of consumption profile: What % is daytime use?
• ~ 45% is Daytime Load (7:00am‐5:59pm)• ~ 35% is Evening load (7pm‐midnight)• Rest is Early Morning• Therefore daytime load is 4‐10kWh/day =
1‐2.5kW of PV
• Therefore the rest of the PV must be stored
02
4
6
8
10
12
14
16
18
20
22
24
26
28
30
32
34
36
38
Lower Quartile
Median
Upper Quartile
Hour (group)Early MorningEveningDaylight

A: This is a financial optimisation problem… it really depends.Storing the exported energy is a good starting point – this could be calculated by reading the export meter and compared to the inverter’s production and installation date to reach a kWh/day export figure.
Q: What proportion of household’s needs do you want to supply from battery storage?
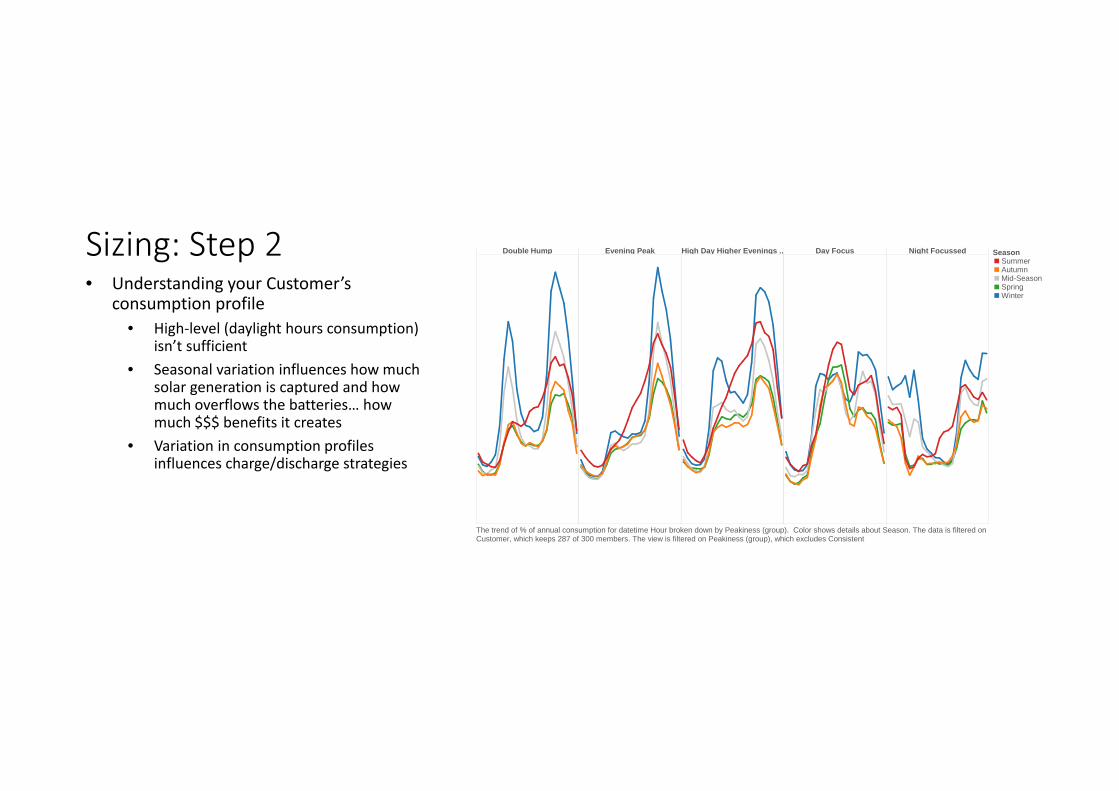
Sizing: Step 2 Double Hump Evening Peak High Day Higher Evenings .. Day Focus Night Focussed SeasonSummerAutumnMid-SeasonSpringWinter
The trend of % of annual consumption for datetime Hour broken down by Peakiness (group). Color shows details about Season. The data is filtered onCustomer, which keeps 287 of 300 members. The view is filtered on Peakiness (group), which excludes Consistent.
• Understanding your Customer’s consumption profile
• High‐level (daylight hours consumption) isn’t sufficient
• Seasonal variation influences how much solar generation is captured and how much overflows the batteries… how much $$$ benefits it creates
• Variation in consumption profiles influences charge/discharge strategies
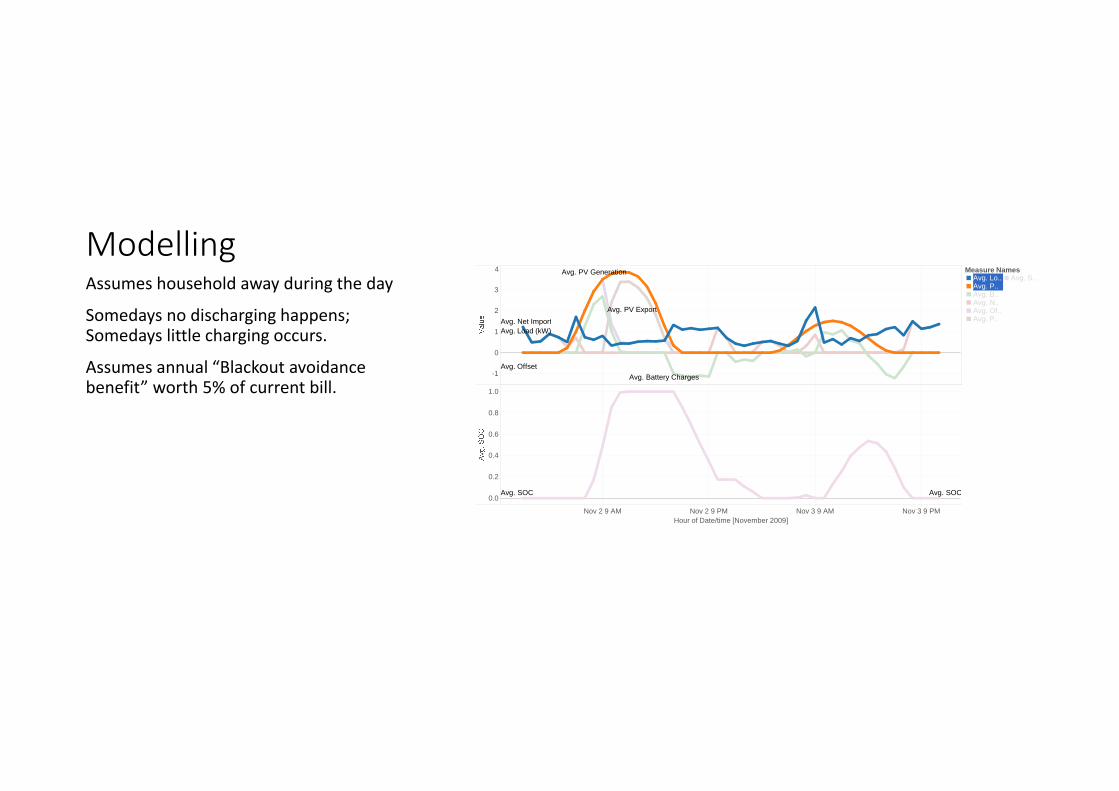
Modelling
Nov 2 9 AM Nov 2 9 PM Nov 3 9 AM Nov 3 9 PMHour of Date/time [November 2009]
-1
0
1
2
3
4
0.0
0.2
0.4
0.6
0.8
1.0
Avg. PV Export
Avg. OffsetAvg. Battery Charges
Avg. Net Import
Avg. PV Generation
Avg. Load (kW)
Avg. SOC Avg. SOC
Measure NamesAvg. Lo..Avg. P..Avg. B..Avg. N..Avg. Of..Avg. P..
Avg. S..Assumes household away during the day
Somedays no discharging happens; Somedays little charging occurs.
Assumes annual “Blackout avoidance benefit” worth 5% of current bill.

ModellingAssumes household away during the day
Somedays no discharging happens; Somedays little charging occurs.
Assumes annual “Blackout avoidance benefit” worth 5% of current bill.
Nov 2 9 AM Nov 2 9 PM Nov 3 9 AM Nov 3 9 PMHour of Date/time [November 2009]
-1
0
1
2
3
4
0.0
0.2
0.4
0.6
0.8
1.0
Avg. PV Export
Avg. Offset
Avg. Net Import
Avg. Battery Charges
Avg. PV Generation
Avg. Load (kW)
Avg. SOC Avg. SOC
Measure NamesAvg. Lo..Avg. P..Avg. B..Avg. N..Avg. Of..Avg. P..
Avg. S..

ModellingAssumes household away during the day
Somedays no discharging happens; Somedays little charging occurs.
Assumes annual “Blackout avoidance benefit” worth 5% of current bill.
Nov 2 9 AM Nov 2 9 PM Nov 3 9 AM Nov 3 9 PMHour of Date/time [November 2009]
-1
0
1
2
3
4
0.0
0.2
0.4
0.6
0.8
1.0
Avg. Offset
Avg. Net ImportAvg. PV Export
Avg. Battery Charges
Avg. PV Generation
Avg. Load (kW)
Avg. SOC Avg. SOC
Measure NamesAvg. Lo..Avg. P..Avg. B..Avg. N..Avg. Of..Avg. P..
Avg. S..

ModellingAssumes household away during the day
Somedays no discharging happens; Somedays little charging occurs.
Assumes annual “Blackout avoidance benefit” worth 5% of current bill.
Nov 2 9 AM Nov 2 9 PM Nov 3 9 AM Nov 3 9 PMHour of Date/time [November 2009]
-1
0
1
2
3
4
0.0
0.2
0.4
0.6
0.8
1.0
Avg. PV Export
Avg. OffsetAvg. Battery Charges
Avg. PV Generation
Avg. Load (kW)Avg. Net Import
Avg. SOC Avg. SOC
Measure NamesAvg. Lo..Avg. P..Avg. B..Avg. N..Avg. Of..Avg. P..
Avg. S..

Average energy flowsDate/time
0 1 2 3 4 5 6 7 8 9 10 11 12 13 14 15 16 17 18 19 20 21 22 23
-1
0
1
2
3
0.0
0.1
0.2
0.3
0.4
0.5
0.6
0.7
0.8
Measure NamesAvg. Lo..Avg. B..Avg. N..Avg. P..Avg. N..Avg. P..
Avg. S..

How much achieved with PV‐Batteries?Reducing export:
• 7kWh of storage drops export by 40% on a 3kW system, and by 25% on a 5kW system.
RULE OF THUMB (?): 7kWh of usable storage reduces export by 5kWh/day (for a household away during the day).
PV / Consumption3kW 5kW
11 15 20 25 11 15 20 250%5%
10%
15%
20%
25%
30%
35%
40%
45%
50%
55%
60%
65%
70%
75%
80%
85%Name
PV ExportPV-Batt Export

Modelling PaybackPV only:
• payback is quicker for smaller systems as lower export
• Payback improves with higher consumption (as lower export)
Battery only:
• Payback is really poor on low consumption as battery sits idle a lot of the time
• Payback improves with larger consumption but the best it can do is 15 years
PV‐Battery:
• Payback best on high consumers
• Larger systems better (as making greater use of the expensive battery)
Name / ConsumptionPV Payback Batt Payback PV-Batt Payback
11 15 20 25 11 15 20 25 11 15 20 25
0
2
4
6
8
10
12
14
16
18
20
22
24
26
PV3kW5kW

Sensitivity Analysis
• Moving from Flat‐TOU tariffs isn’t particularly disadvantageous for Ausgrid.
• If they’re home during the day:• Payback falls to 7.6 years• IRR grows to 12.1%• Export falls by 6% to 28%
• Its valuable to discharge during the 8‐10pm shoulder slot – otherwise exports grow. Pre‐discharging in the morning gives a few extra dollars per year, so its
• Peak‐only without other dis‐charge: $1646 with 39% export, 12.7% IRR (14 year life)
• Peak & Shoulder discharge $1703 with 29% export. 12.1% IRR (9 year life)
• Peak‐only with morning pre‐discharge: $1641 with 30% export; 11.8% IRR (10 year life)
• Peak‐shoulder with morning discharge: $1705 with 28% export; 12.1% IRR
Best case basis: 25kWh/day consumption
PV only: 5.8 year payback
Battery only: 15 year payback
Combined: 9.9 year payback; 10.9% IRR

Sensitivity Analysis: additional storageDiminishing returns of additional storage: As you add storage, you get less and less additional benefit.
Considering there are economics of scale, there would be some sweet spot… but it will vary by customer.
$0
$200
$400
$600
$800
$1,000
$1,200
$1,400
$1,600
$1,800
$2,000
0 2 4 6 8 10 12 14
Annu
al Savings
kWh of storage
Annual Savings vs kWh of Storage

The other solar energy storage• SHW commonly has better financials than
PV. • Often better to buy a SHW unit + 2kW PV
than buying 5kW PV.• IRR varies by location, water heating
backup fuel, and whether HW unit needs replacing.
• Or should I put off‐peak HW onto Peak and heat with PV?
• Instead of export @ 6c/kWh, could heat water and offset 13c/kWh.
• BUT if I need to boost on cloudy days I might do so at 33c/kWh
$0
$200
$400
$600
$800
$1,000
$1,200
$1,400
NSW‐Metro NSW‐Rural QLD‐Metro QLD‐Rural SA‐Metro TAS‐Metro Vic‐Metro Vic‐Rural WA‐Metro
Electricity Bill Reduction
1.5kW PV + SHW 3kW PV

Summary: What to Do?
• Yes we have storage: SHW• Most systems are already oversized and exporting far too much. Another way of looking at it: Crying out for batteries!
• Sell as a bundle with PV; retrofitting to existing PV less financially viable
• Find large consumers of energy• Opportunity NSW end of FiT 2016 (also Victorian tFiT)• Wait it out for 2016 – in the meanwhile Transform Your Commercial Profitability with ProfitVoltaics – efficiently target the customers who are easiest to convert and who will pay more for your services.

ResourcesSunWiz’s Free Export Calculator
http://www.pvsell.com.au/dbpage.php?pg=solar_export_calculator

ResourcesPVsell (Grid‐Connect only)http://www.pvsell.com.au from $55/month ex GST
Engage SunWiz on your battery backup project – from $225 ex GST. www.sunwiz.com.au
Buy HOMER energy $1500‐$3000. http://www.homerenergy.com/
• Compelling Proposals• Enhance Professionalism• Reduce Turn‐around time• Maximise Profitability• Get More Customers• Easy to Use• Accurate• Business Integrated

Come see us at our Booth C3 – sharing with Solar Analytics….Or reach us via:
www.sunwiz.com.au
www.pvsell.com.a
+61 (0)413 361 534
VISIT OUR STAND FOR A SPECIAL OFFER ON
PVSELL