Embed Size (px)
Citation preview

222 Biophysical Journal Volume 105 July 2013 222–230
Solid-State NMR Evidence for b-Hairpin Structure within MAX8 DesignerPeptide Nanofibers
Sarah R. Leonard,†‡ Ashley R. Cormier,†‡ Xiaodong Pang,§ Maxwell I. Zimmerman,†‡ Huan-Xiang Zhou,§
and Anant K. Paravastu†‡*†Department of Chemical and Biomedical Engineering, FAMU-FSU College of Engineering, Tallahassee, Florida; ‡National High MagneticField Laboratory, Tallahassee, Florida; and §Department of Physics and Institute of Molecular Biophysics, Florida State University,Tallahassee, Florida
ABSTRACT MAX8, a designer peptide known to undergo self-assembly following changes in temperature, pH, and ionicstrength, has demonstrated usefulness for tissue engineering and drug delivery. It is hypothesized that the self-assembledMAX8 nanofiber structure consists of closed b-hairpins aligned into antiparallel b-sheets. Here, we report evidence fromsolid-state NMR spectroscopy that supports the presence of the hypothesized b-hairpin conformation within the nanofiber struc-ture. Specifically, our 13C-13C two-dimensional exchange data indicate spatial proximity between V3 and K17, and 13C-13Cdipolar coupling measurements reveal proximity between the V3 and V18 backbone carbonyls. Moreover, isotopic dilution oflabeled MAX8 nanofibers did not result in a loss of the 13C-13C dipolar couplings, showing that these couplings are primarily intra-molecular. NMR spectra also indicate the existence of a minor conformation, which is discussed in terms of previouslyhypothesized nanofiber physical cross-linking and possible nanofiber polymorphism.
INTRODUCTION
With known protein structures serving as inspiration,peptides have been designed to form nanostructures throughstimuli-sensitive folding and self-assembly mechanisms(1,2). These designer peptides, capable of undergoingconformational transitions following changes in pH(3–11), temperature (12–18), ionic strength (19–22),enzyme concentration (23–27), or light exposure (28–32),have been investigated for applications in tissue engineering(7,23,25,28) and drug delivery (6,15,17,22). On a funda-mental level, design of self-assembling peptide biomaterialschallenges our basic understanding of protein folding andaggregation (3–5,10,11,14,16–18).
MAX8 is a promising self-assembling peptide designed bySchneider et al. (33). It is an amphiphilicmolecule composedof 20 amino acids: VKVKVKVKVDPPTKVEVKVKV-NH2, where
DP represents a proline with D-chirality for itsCa, and –NH2 refers to an amidated C-terminus. Thetwo stretches of alternating hydrophilic K (or E) andhydrophobic V residues promote b-strand formation(34,35). The VDPPT motif is known to form a type II0
b-turn (36). This turn makes it possible for the b-strands ofa MAX8 molecule to form a hairpin structure in which theb-strands are antiparallel. The formation of this b-hairpinin solution, however, would be hindered by repulsionbetween positively charged K side chains. Folding ofMAX8 into a b-hairpin can be triggered through theaddition of counterions. In particular, Dulbecco’s modifiedeagle medium (DMEM), a common cell culture medium,can initiate MAX8 self-assembly ostensibly because of its
Submitted February 7, 2013, and accepted for publication May 29, 2013.
*Correspondence: [email protected]
Editor: Mei Hong.
� 2013 by the Biophysical Society
0006-3495/13/07/0222/9 $2.00
salt content. MAX8 nanofibers are hypothesized toconsist of molecules in b-hairpin conformations assem-bled into extended antiparallel b-sheets. The minimalMAX8 nanofiber structural unit is believed to consist oftwo antiparallel b-sheets associated to form a hydrophobiccore (33).
The hypothesized MAX8 nanofiber structure ofSchneider et al. (33) is consistent with measurements ofnanofiber dimension and secondary structure. Transmissionelectron microscopy (TEM) images of MAX8 nanofibersshowed fibrils ~3 nm in width, a dimension in line withthe expected length of a MAX8 b-hairpin (33,34). Circulardichroism spectroscopy showed a transition from randomcoil to b-strand secondary structure following an increasein solution ionic strength (33). MAX8 differs from itsparent peptide, MAX1, by the substitution K15E, whichreduces the overall charge of the peptide. This substitu-tion decreased the time to form b-sheets from 30 minto <1 min (33).
Here, we report site-specific atomic-level information onthe MAX8 conformation within nanofibers. These resultssupport the predominance of a closed b-hairpin confor-mation. Antiparallel b-sheets of aligned MAX8 moleculeswere built by molecular modeling, and predicted atomicconfigurations were tested by 13C solid-state NMR spectros-copy of MAX8 nanofiber samples. We present directevidence for proximity of V3 and K17 as well as of theV3 and V18 backbone carbonyl (CO) atoms, as predictedby the molecular model of a b-hairpin. Although the majorNMR signals are consistent with an ordered self-assembledb-hairpin structure, there is also evidence for a minoradditional conformation.
http://dx.doi.org/10.1016/j.bpj.2013.05.047

NMR Evidence of MAX8 b-Hairpin Structure 223
MATERIALS AND METHODS
The MAX8 peptide was synthesized with standard fluorenylmethylcarbonyl
(Fmoc) synthesis procedures on a RINK amide resin (Anaspec, 0.4 meq/g)
using an Applied BiosystemsModel 433A Peptide Synthesizer with HBTU/
HoBt activation. Fmoc-protected amino acids were purchased from
Anaspec. For labeled samples (see Table 1), isotopically labeled Fmoc-
protected amino acids were purchased from Cambridge Isotopes or
Sigma-Aldrich.
The peptide was cleaved from the synthesis resin using a cleavage cock-
tail of 95% trifluoroacetic acid (TFA), 2.5% triisopropylsilane, and 2.5%
deionized water (20 mL of cleavage solution per 1 g of resin-bound peptide)
for 2 h. The peptide/cocktail mixture was filtered and then diluted 10-fold
with ice-cold tert-butyl methyl ether. The suspension was then centrifuged
at 5880 � g for 10 min at 4�C. The following cycle was repeated 4 times:
the supernatant was discarded and the pellet was resuspended in ice-cold
tert-butyl methyl ether followed by centrifugation. The peptide was then
dried overnight in vacuum (~10 mTorr) at room temperature.
The peptide was purified by high-performance liquid chromatography on
a Beckman Coulter System Gold 125 Solvent Module with a System Gold
166 Detector and a Waters C18-bonded silica semipreparative column.
Here, two solvents were used: 0.1% TFA in deionized water (Solvent A),
and 10% deionized water, 90% acetonitrile, and 0.1% TFA (Solvent B).
For each run, 10 mg of peptide was dissolved in 10 mL of Solvent A, filtered
(VWR International 25 mm syringe filters with 0.2 mm polyethersulfone
membrane), and loaded onto the column at a rate of 1 mL/min for 10 min.
This was followed by 0% Solvent B for 2 min, a linear gradient from 0%
to 22% Solvent B over 1 min, a linear gradient from 22% to 40% Solvent
B over 18 min, and a linear gradient from 40% to 100% Solvent B over
5 min. The peptide began to elute off the column after 24 min (33% B).
Purified solutions were frozen in liquid nitrogen and lyophilized using
a Virtis Benchtop K Freeze Dryer. The purity of the peptide was verified
using mass spectrometry on a Jeol Accutof JMS-T100LC Mass Spec-
trometer with low-resolution and electrospray ionization (ESIþ) settings.
MAX8 hydrogels were prepared at 0.5% (by weight) as previously
described (33). In a 45 mL centrifuge tube, 1 mL of 25 mM HEPES, pH
7.4, was added to 10 mg of purified peptide. Self-assembly was initiated
through the addition of 1 mL of DMEM supplemented with 25 mMHEPES,
pH 7.4. After 48 h of self-assembly, nanofibers were removed from solution
by centrifugation after diluting the hydrogel solution by filling the 45 mL
centrifuge tube with deionized water. Following centrifugation, the super-
natant was discarded and the pellet was frozen in liquid nitrogen. Samples
were lyophilized using a Virtis Benchtop K Freeze Dryer. Each solid-state
NMR sample contained between 5 and 10 mg of lyophilized nanofibers.
Each NMR sample was rehydrated with ~1 mL of water per mg of peptide
after packing in solid-state NMR rotors.
A Bruker Avance III 11.75 Tesla (500 MHz 1H NMR frequency) spec-
trometer equipped with a 2.5 mm Bruker magic angle spinning (MAS)
probe was used for all solid-state NMR experiments, including 1H-13C
cross-polarization magic angle spinning (CPMAS) (37), two-dimensional
(2D) 13C-13C finite pulse radio frequency driven recoupling (fpRFDR)
(38), 2D 13C-13C dipolar-assisted rotational resonance (DARR) (39,40),
and 13C-13C PITHIRDS-CT (41). All reported 13C chemical shifts are
relative to the NMR frequency of tetramethylsilane, calibrated through
measurement of CO 13C-labeled crystalline glycine. The CO signal of
glycine is at 176.5 ppm, as calibrated using adamantane. The CO-labeled
TABLE 1 Isotopic labeling for MAX8 nanofiber samples
Sample Isotopic labeling
A Uniform 13C and 15N in V3, T12, and K17
B Unlabeled (natural abundance)
C 13C on V3 CO
D 13C on V3 CO and V18 CO
E 10% 13C on V3 CO and V18 CO, 90% unlabeled
glycine was also used to calibrate the magic angle. CPMAS 1H-13C spectra
were acquired at 25 kHz MAS with ~1.5 h and 15 h of signal averaging for
Samples A and B, respectively. Simultaneous application of a constant 50
kHz radio frequency field on the 13C channel and a linear ramp in 1H pulse
power between 60 and 120 kHz radio frequency field strength was used
during the 1H-13C cross-polarization spinlock (2 ms contact time) for all
NMR experiments. 110 kHz of 1H decoupling was applied using a two
pulse phase modulation during the CPMAS and 2D NMR experiments
(42). 2D fpRFDR experiments were conducted at 25 kHz MAS with 5 ms
p/2 flip back pulses, 13.3 ms p pulses (1/3 of the rotor period) during the
1.28 ms recoupling period (32 rotor periods), and 110 kHz of two pulse
phase modulation 1H decoupling during the 13C-13C recoupling. A 2 s
recycle delay was used between scans. The major signals in the 2D fpRFDR
spectra were clearly visible after 24 h of signal averaging. One week of
signal averaging was used in an effort to visualize peaks for 13C-labeled
sites within the minor conformation. 2D DARR experiments were con-
ducted at 10 kHz MAS with mixing times of 500 ms. During exchange mix-
ing periods, experiments required continuous irradiation with 1H field
powers corresponding to 10 kHz nutation frequencies (equal to the MAS
spinning rate). Approximately 4 days of signal averaging was used.
PITHIRDS-CT measurements were conducted at 12.5 kHz MAS and
33.33 ms p pulses were applied during the 61.44 ms period of dipolar recou-
pling with k1 ¼ 4 and k2þ k3 ¼ 16, as defined by Tycko (41). 110 kHz field
strength of continuous wave 1H decoupling was applied during the PITH-
IRDS-CT pulse sequence and 90 kHz of continuous wave 1H decoupling
was used for acquisition. Signal averaging took ~3 days, 12 h, and
1 week for Samples C, D, and E, respectively. PITHIRDS-CT data analysis
included correction for undesired 13C natural abundance background signal.
We calculated the relative contributions of the isotopically enriched and
naturally abundant 13C signals, and subtracted the calculated natural
abundance contribution from each data point for all PITHIRDS-CT curves.
We assumed that natural abundance 13C signal does not decay in PITH-
IRDS-CT experiments.
For TEM, a 10 mL aliquot of MAX8 hydrogel was diluted by addition of
40 mL of deionized water 4 h after initiating self-assembly. The diluted
solution was sonicated for 2 s in a bath sonicator. A 5 mL drop was applied
to a carbon-coated copper grid (Ted Pella ultrathin carbon on holey support,
400 mesh copper grid). After 2 min, excess fluid was wicked from the grid
surface with filter paper and 5 mL of deionized water was applied to rinse
the surface. After 1 min, the water was wicked away and the sample was
negatively stained with 5 mL of 2% (wt/vol) aqueous uranyl acetate for
1 min before wicking and allowing the grid to air dry.
The computer models for MAX8 b-sheets were generated by assembling
b-hairpins. A b-hairpin model of the MAX8 molecule was built by
combining three segments: b-strand I (1VKVKVKVK8), type II0 b-turn(9V
DPPT12), and b-strand II (13KVEVKVKV20). b-strands I and II were
first generated by Ambertools 1.5 with backbone f and j angles
around �123� and 123�, respectively, and then assembled in an antiparallel
orientation with an interstrand spacing of 0.49 nm (43). Finally, the type II0
b-turn was generated by using Modeller (44). The above b-hairpin was
replicated to generate antiparallel b-sheets containing 10 b-hairpins by
satisfying the following conditions: strand-strand distance of 0.49 nm;
valine residues lining up along the fiber axis; and maximum number of
backbone hydrogen bonds between b-hairpins. Each model was then
solvated in a 5 � 8 � 13 nm3 water box with NaCl at 0.15 M, and energy
minimized for 50,000 steps in NAMD 2.8 (45). The energy minimized
b-sheets were then used to provide atomic coordinates of 13C-labeled sites
for PITHIRDS-CT simulations. The two b-sheet structures were well main-
tained in molecular dynamics simulations in which two b-sheets were asso-
ciated to bury the valine side chains.
The SPINEVOLUTION software package was used to simulate PITH-
IRDS-CT experiments (46). The simulations included 8 13C atoms at
coordinates predicted by models of MAX8 antiparallel b-sheets. The coor-
dinates used for the SPINEVOLUTION simulations were selected based
upon the labeling schemes for Samples C and D (Table 1). In these
Biophysical Journal 105(1) 222–230

224 Leonard et al.
simulations, initial magnetization for all 13C atoms was on the xy plane
before the PITHIRDS-CT pulses. Other parameters (magnetic fields, pulse
timings, etc.) were chosen to match the experimental conditions. To mini-
mize end effects for the limited 8-spin systems, SPINEVOLUTION dephas-
ing curves each examine only magnetization of four central spins.
FIGURE 2 2D 13C-13C fpRFDR NMR spectrum for Sample A, with
chemical shift assignment paths representing single-bond correlations.
Dashed boxes indicate minor signals most likely associated with K17.
RESULTS
TEM images of MAX8 nanofibers (Fig. 1) exhibit fibrilwidths of ~3 nm. This dimension is consistent with thatobtained previously and nanofiber morphologies appearsimilar suggesting the successful reproduction of MAX8nanofibers (33). The nanofiber width is also consistentwith the length of a MAX8 molecule folded into a b-hairpinstructure (33,47).
Fig. 2 shows a 2D fpRFDR NMR spectrum from a MAX8nanofiber sample isotopically labeled with uniform 13C and15N in the V3, T12, and K17 residues (Sample A, Table 1).The signal/noise in this spectrum is illustrated using hori-zontal slices in Fig. S1 in the Supporting Material. Spectralassignments for 13C sites are illustrated with lines that con-nect diagonal signals and crosspeaks between directlybonded 13C atoms (some weak two-bond crosspeaks werealso observed) (38). Peak positions, obtained throughnonlinear fitting of crosspeaks to Gaussian functions, arelisted in Table 2. Line widths were near 1.5 ppm (full width,half-maximum), similar to previously observed amyloidfibril line widths (48). For 13C atoms near the peptidebackbone (CO, Ca, and Cb) secondary structures are knownto correlate with secondary shifts, i.e., deviations of 13CNMR peak positions from those of equivalent signals withinrandom coil peptides (49). For V3 and K17, our observednegative secondary shifts of >1.5 ppm for the CO and Ca
signals and positive secondary shifts of >2.4 ppm for Cb
signals are consistent with b-strand secondary structure
FIGURE 1 TEM image of MAX8 nanofibers negatively stained with 2%
uranyl acetate. The inset shows a twofold magnified image of the region
defined by the dashed white box.
Biophysical Journal 105(1) 222–230
(49). On the other hand, Ca and Cb secondary chemicalshifts for T12 are inconsistent with these trends, due tothe proximity of T12 to the DPP hinge.
Dashed boxes in Fig. 2 mark minor signals observed inthe 2D fpRFDR NMR spectrum. Observed minor signalsinclude crosspeaks between 30.7 and 23.7 ppm, as well asresolved signals at 42.0 and 30.7 ppm on the diagonal. Webelieve that the peaks on the diagonal at 42.0 and 30.7ppm are too strong to be natural abundance backgroundsignals from unlabeled sites. Natural abundance signalsare commonly observed on the diagonals of 2D NMRspectra, but they are expected to be 100 times weaker thanpeaks from 13C-labeled sites due to the 1% natural abun-dance of 13C. The probability of existence of adjacent pairsof natural abundance 13C atoms makes it nearly impossibleto observe natural abundance crosspeaks; these signalswould be 104-fold weaker than crosspeaks between labeledsites. Instead, we believe that minor signals are due to13C-labeled sites within a subpopulation of MAX8 mole-cules in a conformation that differs from the major con-formation. The diagonal peak at 48.9 ppm, in contrast, hasan intensity that is consistent with natural abundance
TABLE 2 Peak positions based on 2D fpRFDR data
Residue CO Ca Cb Cg1 Cg2 Cd Ce
V3 172.0 (174.6) 58.6 (60.5) 33.7 (31.2) 19.3 19.3 – –
T12 170.7 (173.0) 61.5 (60.1) 67.4 (68.1) 19.9 – – –
K17 172.9 (174.9) 52.9 (54.5) 34.1 (31.4) 23.6 – 28.0 40.1
CO, Ca, and Cb random coil chemical shifts are shown in parentheses.
Estimated error: 50.1 ppm.

NMR Evidence of MAX8 b-Hairpin Structure 225
background. We do not have definitive assignments for theobserved minor signals because they do not exhibit a com-plete set of crosspeaks expected for V, K, or T residues.Based on the chemical shifts, it is likely that the observedminor signals are due to K: the peak on the diagonal at42.0 ppm could be due to K Ce and the crosspeaks couldcorrespond to a K Cb-Cg or Cg-Cd transfer. Based on therelative intensities of the minor and major K Ce signals,we estimate that the minor signals account for 21 5 8%of the total sample. Possible differences in 1H-13C cross-polarization efficiency for major and minor signals, due todifferences in side-chain dynamics, could lead to error inthis estimate.
In Fig. 3 we compare the CPMAS 13C NMR spectrum forSample A to that of an unlabeled MAX8 nanofiber sample(Sample B, Table 1) and show the peak assignments.Because the NMR signals from the unlabeled sample aredue to an evenly distributed 1% population of 13C (naturalabundance), these signals correspond to roughly equal con-tributions from every C site in the sample. Therefore,although each peak from the labeled sample correspondsto a single 13C site, signals from Vor K within the unlabeledsample correspond to overlapping signals from the 9 Vand 7K residues in the peptide. We observed agreement in posi-tions for the V and K signals between these two sampleswithin 0.1 ppm, indicating a uniform secondary structurewithin the VK repeats. Similar ratios of major and minorK signals between Samples A and B support the assignmentof minor (as opposed to natural abundance) signals in Fig. 2and suggest that K polymorphism occurs uniformly acrossthe MAX8 amino acid sequence. When these peak positionswere input into the TALOS software (50), the predicted f
FIGURE 3 1H-13C CPMAS NMR spectra of Sample A and Sample B.
Vertical dotted lines aid comparison of peak positions.
and j backbone torsion angles were consistent with b-strandsecondary structure for residues 1–8 and 13–20 (seeTable S1). Signals observed only in the natural abundancespectrum at 48.7 and 26.4 ppm are assigned to P Cd andP Cg (51). NMR signals from the E15 residue are notresolved from other signals.
Evidence of a closed b-hairpin molecular conformationwithin MAX8 nanofibers was obtained through a 2DDARR 13C-13C NMR experiment on Sample A. The 2DDARR spectrum in Fig. 4 A exhibits crosspeaks betweenthe V3 and K17 residues (circled). Selected horizontal slicescorresponding to V3, T12, and K17 signals shown in Fig. 4B further illustrate the polarization transfer between the Vand K residues. We would expect an interresidue 2DDARR contact to be most sensitive to the closest inter-residue 13C-13C distance; the b-hairpin model shown inFig. 4 C predicts a distance of 0.48 nm between the CO sitesof V3 and K17.
To further test the hypothesized b-hairpin conformation,we performed 13C-13C dipolar recoupling NMR experi-ments using the PITHIRDS-CT technique on selectively13C-labeled samples. In general, PITHIRDS-CT decaysare dependent on the three-dimensional organization ofdipolar coupled 13C nuclei and are dominated by nearest-neighbor internuclear distances (41). Our selective labelingincluded a sample with 13C labeling only on the V3 CO(Sample C, Table 1), a sample with 13C labeling on V3CO and V18 CO (Sample D, Table 1), and a sample with10% of molecules labeled with 13C on V3 CO and V18CO and 90% unlabeled (Sample E, Table 1). Experimentaldata are compared to simulated PITHIRDS-CT decays(Fig. 5 A) performed on antiparallel b-sheet models with1), adjacent b-hairpin turns on the same edge of the b-sheet(the ‘‘syn’’ configuration; Fig. 5 B) and 2), adjacentb-hairpin turns on opposite edges of the b-sheets (the‘‘anti’’ configuration; Fig. 5 C). We also considered theexpected behavior for two additional configurations forMAX8 molecules arranged in extended conformations cor-responding to an open VDPPT hinge. The first we identifyas an open hinge in-register parallel b-sheet, where theb-strands are aligned perpendicular to the fiber axis andall N-termini are on the same edge of the b-sheet (Table 3).The second is identified as an open hinge antiparallelb-sheet, where the N- and C-termini alternate along eachedge of the b-sheet (Table 3). We observed minimal PITH-IRDS-CT decay for Sample C, indicating that inter-molecular distances between V3 CO sites must be above~0.7 nm. This result rules out the in-register parallel b-sheetconfiguration that is commonly observed for amyloid fibrils(Table 3) (52). Data for Sample D, in contrast, exhibit asignificantly stronger decay, indicating shorter distancesbetween the V3 CO and V18 CO. Sample E, with thesame labels as Sample D but with a 10-fold isotopicdilution, exhibits a similar PITHIRDS-CT decay. Therefore,there was no change in internuclear distance between
Biophysical Journal 105(1) 222–230

FIGURE 4 (A) 2D 13C-13C DARR NMR spectrum of Sample A showing long-range (up to ~0.6 nm) contacts between labeled sites. Solid lines indicate
single-bond assignment pathways for each 13C-labeled residue. Contacts between V3 and K17 are indicated with circles. (B) Horizontal slices at peak
frequencies of V3 Ca, T12 Cb, and K17 Ca signals. Vertical dotted lines indicate polarization transfers between the V3 and K17 signals. (C) A molecular
model indicating relative positions of labeled residues within a b-hairpin.
226 Leonard et al.
labeled V3 CO and V18 CO sites upon isotopic dilution; thisresult is only possible if the coupling is between nucleiwithin the same molecule as predicted for the b-hairpinconformation (Table 3). We validated our PITHIRDS-CTexperiments by measuring the decay for Ab (1–42) amyloidfibrils selectively 13C-labeled at the V36 CO site. Theobserved decay (Fig. S2) is consistent with the knowngeometry (0.5 nm 13C-13C distance) for in-register parallelb-sheets (53–56).
Molecular modeling and simulated PITHIRDS-CTcurves provided a basis for quantitative analysis of theexperimental decays. We modeled two possible arrange-ments of MAX8 molecules: the syn-configuration (Fig. 5B) or the anti-configuration (Fig. 5 C). For both models,we considered only intermolecular alignments that maxi-mized hydrogen bonding. The solid curves in Fig. 5 A corre-spond to predictions based on 8-spin simulations of thePITHIRDS-CT experiment using the atomic coordinates inthe molecular models depicted in Fig. 5, B and C. ThePITHIRDS-CT decay for Sample C agrees with the simu-lated curves for both the syn- and anti-configurations (theanti-configuration simulated curve is not shown). The simu-lated curve for the syn-configuration, with a 0.98 nmdistance between nearest V3 CO sites, has a very weakdecay; the simulated curve for the anti-configuration, withan even longer 1.35 nm distance between nearest V3 COsites, shows essentially no decay. Simulated curves forSample D for syn- and anti-configurations are shown inFig. 5 A. The simulated curve for the syn-configuration
Biophysical Journal 105(1) 222–230
predicts a slightly faster decay compared to the simulatedcurve for the anti-configuration, but neither agrees wellwith the experimental data. As discussed below, we interpretthe discrepancy between the experimental and simulateddecays for Sample D in terms of polymorphic behaviorresulting in a minor population of molecules which arenot in the b-hairpin conformation. Each dashed curve inFig. 5 A represents a prediction corresponding to ananti-configuration with the indicated percent abundance ofmolecules in the minor population. For this analysis, weassumed that signal from the minor population wouldexhibit no decay due to a lack of 13C-13C dipolar couplingsbetween labeled sites. The dashed curves therefore suggestthat the minor structure represents 33 5 8% of the MAX8molecules. A similar analysis based on a syn-configurationmajor structure (not shown) would predict a minor popula-tion at 28 5 8%.
DISCUSSION
This work represents a direct interrogation of MAX8 molec-ular structure within nanofibers. Although previous resultsfrom circular dichroism measurements established thatMAX8 adopts a b-strand secondary structure, and b-hairpindimensions are consistent with TEM nanofiber dimensions,these results include no site-specific information or inter-atomic distance measurements. Our NMR data support thehypothesized b-hairpin as the major conformation forMAX8 molecules within the nanofiber. This interpretation
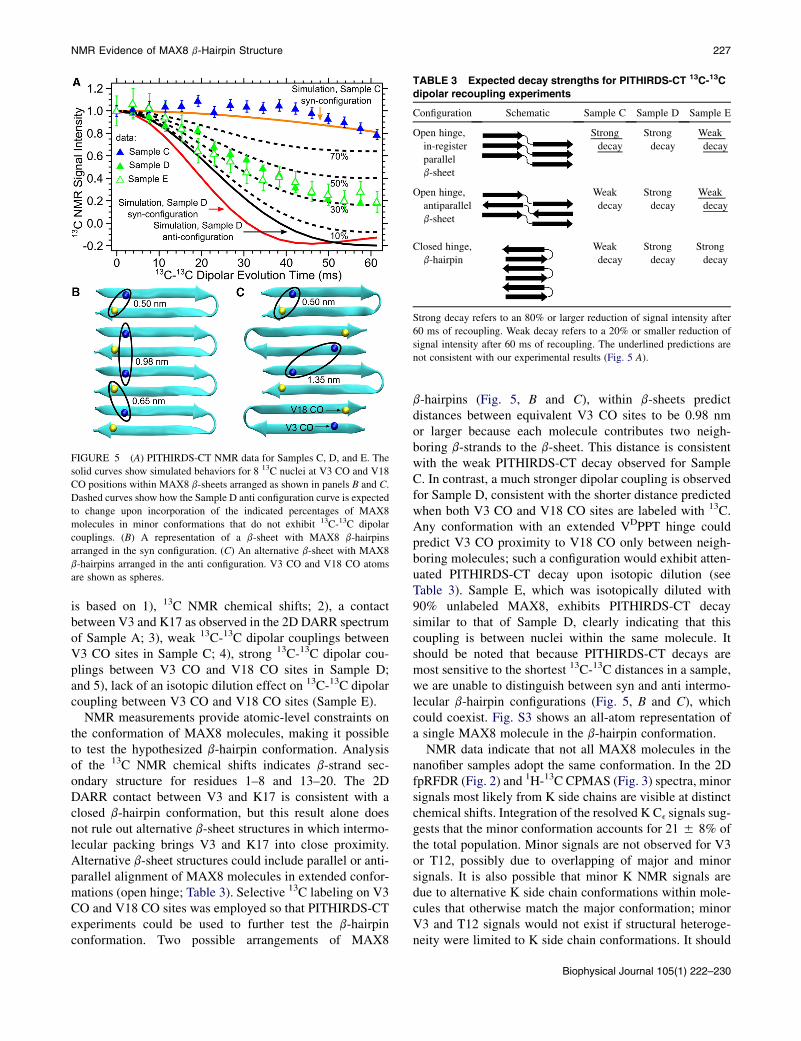
TABLE 3 Expected decay strengths for PITHIRDS-CT 13C-13C
dipolar recoupling experiments
Configuration Schematic Sample C Sample D Sample E
Open hinge,
in-register
parallel
b-sheet
Strong
decay
Strong
decay
Weak
decay
Open hinge,
antiparallel
b-sheet
Weak
decay
Strong
decay
Weak
decay
Closed hinge,
b-hairpin
Weak
decay
Strong
decay
Strong
decay
Strong decay refers to an 80% or larger reduction of signal intensity after
60 ms of recoupling. Weak decay refers to a 20% or smaller reduction of
signal intensity after 60 ms of recoupling. The underlined predictions are
not consistent with our experimental results (Fig. 5 A).
FIGURE 5 (A) PITHIRDS-CT NMR data for Samples C, D, and E. The
solid curves show simulated behaviors for 8 13C nuclei at V3 CO and V18
CO positions within MAX8 b-sheets arranged as shown in panels B and C.
Dashed curves show how the Sample D anti configuration curve is expected
to change upon incorporation of the indicated percentages of MAX8
molecules in minor conformations that do not exhibit 13C-13C dipolar
couplings. (B) A representation of a b-sheet with MAX8 b-hairpins
arranged in the syn configuration. (C) An alternative b-sheet with MAX8
b-hairpins arranged in the anti configuration. V3 CO and V18 CO atoms
are shown as spheres.
NMR Evidence of MAX8 b-Hairpin Structure 227
is based on 1), 13C NMR chemical shifts; 2), a contactbetween V3 and K17 as observed in the 2D DARR spectrumof Sample A; 3), weak 13C-13C dipolar couplings betweenV3 CO sites in Sample C; 4), strong 13C-13C dipolar cou-plings between V3 CO and V18 CO sites in Sample D;and 5), lack of an isotopic dilution effect on 13C-13C dipolarcoupling between V3 CO and V18 CO sites (Sample E).
NMR measurements provide atomic-level constraints onthe conformation of MAX8 molecules, making it possibleto test the hypothesized b-hairpin conformation. Analysisof the 13C NMR chemical shifts indicates b-strand sec-ondary structure for residues 1–8 and 13–20. The 2DDARR contact between V3 and K17 is consistent with aclosed b-hairpin conformation, but this result alone doesnot rule out alternative b-sheet structures in which intermo-lecular packing brings V3 and K17 into close proximity.Alternative b-sheet structures could include parallel or anti-parallel alignment of MAX8 molecules in extended confor-mations (open hinge; Table 3). Selective 13C labeling on V3CO and V18 CO sites was employed so that PITHIRDS-CTexperiments could be used to further test the b-hairpinconformation. Two possible arrangements of MAX8
b-hairpins (Fig. 5, B and C), within b-sheets predictdistances between equivalent V3 CO sites to be 0.98 nmor larger because each molecule contributes two neigh-boring b-strands to the b-sheet. This distance is consistentwith the weak PITHIRDS-CT decay observed for SampleC. In contrast, a much stronger dipolar coupling is observedfor Sample D, consistent with the shorter distance predictedwhen both V3 CO and V18 CO sites are labeled with 13C.Any conformation with an extended VDPPT hinge couldpredict V3 CO proximity to V18 CO only between neigh-boring molecules; such a configuration would exhibit atten-uated PITHIRDS-CT decay upon isotopic dilution (seeTable 3). Sample E, which was isotopically diluted with90% unlabeled MAX8, exhibits PITHIRDS-CT decaysimilar to that of Sample D, clearly indicating that thiscoupling is between nuclei within the same molecule. Itshould be noted that because PITHIRDS-CT decays aremost sensitive to the shortest 13C-13C distances in a sample,we are unable to distinguish between syn and anti intermo-lecular b-hairpin configurations (Fig. 5, B and C), whichcould coexist. Fig. S3 shows an all-atom representation ofa single MAX8 molecule in the b-hairpin conformation.
NMR data indicate that not all MAX8 molecules in thenanofiber samples adopt the same conformation. In the 2DfpRFDR (Fig. 2) and 1H-13C CPMAS (Fig. 3) spectra, minorsignals most likely from K side chains are visible at distinctchemical shifts. Integration of the resolved K Ce signals sug-gests that the minor conformation accounts for 21 5 8% ofthe total population. Minor signals are not observed for V3or T12, possibly due to overlapping of major and minorsignals. It is also possible that minor K NMR signals aredue to alternative K side chain conformations within mole-cules that otherwise match the major conformation; minorV3 and T12 signals would not exist if structural heteroge-neity were limited to K side chain conformations. It should
Biophysical Journal 105(1) 222–230

228 Leonard et al.
be noted that the magnetic inequivalence predicted byNielsen et al. (57) for neighboring b-strands within antipar-allel b-sheets would not lead to peak splittings for MAX8;each MAX8 molecule contributes two neighboringb-strands to a b-sheet. However, inequivalence could resultfrom interactions between different b-sheets within a nano-fiber. The observed PITHIRDS-CT decays for Samples Dand E show significant evidence of 13C-13C dipolar couplingbetween V3 CO and V18 CO sites, but observed decays areweaker than simulated curves (Fig. 5 A). As illustrated inFig. S4, the PITHIRDS-CT data are not well representedby spin simulations that consider longer 13C-13C distances.We interpret the PITHIRDS-CT data in terms of the exis-tence of MAX8 molecules in conformations that do notexhibit significant 13C-13C dipolar couplings. One possibil-ity is a MAX8 molecule with only one b-strand (residues1–8 or 13–20) inserted into the b-sheet; this configurationwould not generate significant 13C-13C intra- or intermolec-ular dipolar couplings between V3 CO and V18 CO sites.Based on the analysis represented by the dashed lines inFig. 5 A, the minor conformation would account for 33 58% of the MAX8 molecules (also see dashed curve inFig. S4). Although minor population estimates are similarbetween NMR spectra and PITHIRDS-CT observations, itis not clear if the 2D fpRFDR and PITHIRDS-CT measure-ments reflect the same minor conformation. Without theability to separate most minor and major NMR signals, weare unable to provide more constraints on the minorconformation.
The existence of a minor conformation was predicted bySchneider, Pochan, and co-workers (33), who proposed thatMAX8 nanofibers have physical cross-links, although alter-native explanations exist. Evidence for permanent junctionpoints between nanofibers has been found in rheologicalstudies of MAX1 solutions (58); MAX1 and MAX8 arelikely to have similar nanofiber structures. Observedcrossing of nanofibers in TEM images of MAX1 orMAX8 has also been attributed to nanofiber cross-linking(33). The minor conformations evident in our NMR datacould be attributed to conformational rearrangement atnanofiber junctions. However, our PITHIRDS-CT data indi-cate that minor conformations do not correspond to closedb-hairpins, contradicting the proposal that junctions corre-spond to interfacial association of closed b-hairpins.Furthermore, observation of minor NMR signals is notstrongly supportive of molecular rearrangement at junctionpoints: minor conformations are commonly observed in am-yloid fibril samples and attributed to coexistence of fibrilswith distinct molecular structures. These minor NMRsignals can be eliminated through sample preparationsdesigned to produce homogeneous samples, suggestingthat minor conformations are not fundamental to the amy-loid fibril structure (55,59,60). To our knowledge, no grouphas attributed polymorphic structure to structural rearrange-ments at amyloid fibril junction points. With amyloid fibrils,
Biophysical Journal 105(1) 222–230
distinct structures are associated with distinct fibril TEMmorphologies, but the greater thicknesses of amyloid fibrils(~10 nm) compared to MAX8 nanofiber thicknesses(~3 nm) make it easier to probe amyloid morphologieswith TEM (48,53,55).
The b-hairpin major conformation observed in MAX8nanofibers supports the idea that MAX8 b-hairpin formationis important to self-assembly. This hypothesis was pivotal tothe design of the MAX8 peptide for salt-triggered self-assembly, but previous results did not prove that b-hairpinsdominate the final nanofiber structure. Repulsion betweenlike-charged K side chains at low ionic strength is believedto prevent self-assembly by deterring b-hairpin formation.However, there are other possible explanations for observedsalt-triggered self-assembly. Salt is known to induce a tran-sition from random coil to b-strand secondary structure(33); a secondary structural transition alone could explainsalt-dependent kinetics. Furthermore, although ionicstrength could promote b-hairpin formation by screeningintramolecular repulsion between K side chains, ionicstrength will also screen intermolecular repulsion betweenK side chains. In fact, oligopeptides without turns can alsoexhibit salt-sensitive self-assembly kinetics (61). Even ifb-hairpin formation is critical to initiate self-assembly,b-hairpins may serve only as nuclei that could propagatethrough addition of extended MAX8 molecules. The obser-vation that 60–75% of MAX8 molecules within nanofibersare in b-hairpin conformations contradicts the alternativehypotheses for self-assembly and suggests that the self-assembly mechanism is dominated by association ofb-hairpins.
SUPPORTING MATERIAL
Four figures and one table are available at http://www.biophysj.org/
biophysj/supplemental/S0006-3495(13)00634-6.
The authors acknowledge financial support from the National Science
Foundation (DMR-105521 to A.K.P.) and the National Institutes of Health
(GM88187 to H.X.Z.). Portions of this work were conducted at the National
High Magnetic Field Laboratory (NHMFL) which is supported by the
National Science Foundation Cooperative Agreement (DMR-0654118),
the State of Florida, and the U.S. Department of Energy. A National
High Magnetic Field Lab (NHMFL) User Collaboration Research Grant
to A.K.P. also provided partial financial support for this research.
REFERENCES
1. Lowik, D. W. P. M., E. H. P. Leunissen, ., J. C. M. van Hest. 2010.Stimulus responsive peptide based materials. Chem. Soc. Rev.39:3394–3412.
2. Versluis, F., H. R. Marsden, and A. Kros. 2010. Power struggles inpeptide-amphiphile nanostructures. Chem. Soc. Rev. 39:3434–3444.
3. Adhikari, B., G. Palui, and A. Banerjee. 2009. Self-assembling tripep-tide based hydrogels and their use in removal of dyes from waste-water.Soft Matter. 5:3452–3460.

NMR Evidence of MAX8 b-Hairpin Structure 229
4. Aggeli, A., M. Bell, ., N. Boden. 2003. pH as a trigger of peptidebeta-sheet self-assembly and reversible switching between nematicand isotropic phases. J. Am. Chem. Soc. 125:9619–9628.
5. Altman, M., P. Lee,., S. G. Zhang. 2000. Conformational behavior ofionic self-complementary peptides. Protein Sci. 9:1095–1105.
6. Apostolovic, B., and H. A. Klok. 2008. pH-sensitivity of the E3/K3heterodimeric coiled coil. Biomacromolecules. 9:3173–3180.
7. Hartgerink, J. D., E. Beniash, and S. I. Stupp. 2001. Self-assemblyand mineralization of peptide-amphiphile nanofibers. Science. 294:1684–1688.
8. Pagel, K., S. C. Wagner,., B. Koksch. 2006. Random coils, beta-sheetribbons, and alpha-helical fibers: one peptide adopting three differentsecondary structures at will. J. Am. Chem. Soc. 128:2196–2197.
9. Zhao, Y., H. Yokoi, ., T. Tan. 2008. Self-assembled pH-responsivehydrogels composed of the RATEA16 peptide. Biomacromolecules.9:1511–1518.
10. Zimenkov, Y., S. N. Dublin,., V. P. Conticello. 2006. Rational designof a reversible pH-responsive switch for peptide self-assembly. J. Am.Chem. Soc. 128:6770–6771.
11. Schneider, J. P., D. J. Pochan, ., J. Kretsinger. 2002. Responsivehydrogels from the intramolecular folding and self-assembly ofa designed peptide. J. Am. Chem. Soc. 124:15030–15037.
12. Dong, H., and J. D. Hartgerink. 2007. Role of hydrophobic clusters inthe stability of alpha-helical coiled coils and their conversion toamyloid-like beta-sheets. Biomacromolecules. 8:617–623.
13. Komori, H., and Y. Inai. 2007. Control of peptide helix sense bytemperature tuning of noncovalent chiral domino effect. J. Org.Chem. 72:4012–4022.
14. Rajagopal, K., M. S. Lamm, ., J. P. Schneider. 2009. Tuning the pHresponsiveness of beta-hairpin peptide folding, self-assembly, andhydrogel material formation. Biomacromolecules. 10:2619–2625.
15. Sallach, R. E., M. Wei, ., E. L. Chaikof. 2006. Micelle densityregulated by a reversible switch of protein secondary structure.J. Am. Chem. Soc. 128:12014–12019.
16. Trabbic-Carlson, K., L. A. Setton, and A. Chilkoti. 2003. Swelling andmechanical behaviors of chemically cross-linked hydrogels of elastin-like polypeptides. Biomacromolecules. 4:572–580.
17. Wang, C., R. J. Stewart, and J. Kopecek. 1999. Hybrid hydrogelsassembled from synthetic polymers and coiled-coil protein domains.Nature. 397:417–420.
18. Zhang, S. G., and A. Rich. 1997. Direct conversion of an oligopeptidefrom a beta-sheet to an alpha-helix: a model for amyloid formation.Proc. Natl. Acad. Sci. USA. 94:23–28.
19. Beyer, R. L., H. N. Hoang, ., D. P. Fairlie. 2004. Metal clips inducefolding of a short unstructured peptide into an alpha-helix via turnconformations in water. Kinetic versus thermodynamic products.J. Am. Chem. Soc. 126:15096–15105.
20. Cerasoli, E., B. K. Sharpe, and D. N. Woolfson. 2005. ZiCo: a peptidedesigned to switch folded state upon binding zinc. J. Am. Chem. Soc.127:15008–15009.
21. Dublin, S. N., and V. P. Conticello. 2008. Design of a selective metalion switch for self-assembly of peptide-based fibrils. J. Am. Chem.Soc. 130:49–51.
22. Pires, M. M., and J. Chmielewski. 2009. Self-assembly of collagenpeptides into microflorettes via metal coordination. J. Am. Chem.Soc. 131:2706–2712.
23. Jun, H., V. Yuwono, ., J. Hartgerink. 2005. Enzyme-mediateddegradation of peptide-amphiphile nanofiber networks. Adv. Mater.17:2612–2617.
24. Kuhnle, H., and H. G. Borner. 2009. Biotransformation on polymer-peptide conjugates: a versatile tool to trigger microstructure formation.Angew. Chem. Int. Ed. Engl. 48:6431–6434.
25. Straley, K. S., and S. C. Heilshorn. 2009. Dynamic, 3D-pattern forma-tion within enzyme-responsive hydrogels. Adv. Mater. 21:4148–4152.
26. Tuchscherer, G., A. Chandravarkar, ., M. Mutter. 2007. Switch-peptides as folding precursors in self-assembling peptides and amyloidfibrillogenesis. Biopolymers. 88:239–252.
27. Yang, Z., M. Ma, and B. Xu. 2009. Using matrix metalloprotease-9(MMP-9) to trigger supramolecular hydrogelation. Soft Matter.5:2546–2548.
28. Haines, L. A., K. Rajagopal, ., J. P. Schneider. 2005. Light-activatedhydrogel formation via the triggered folding and self-assembly of adesigned peptide. J. Am. Chem. Soc. 127:17025–17029.
29. Kusebauch, U., S. A. Cadamuro,., C. Renner. 2006. Photocontrolledfolding and unfolding of a collagen triple helix. Angew. Chem. Int. Ed.Engl. 45:7015–7018.
30. Lowik, D.W. P. M., J. T. Meijer,., J. C. M. van Hest. 2008. Controlleddisassembly of peptide amphiphile fibres. J. Pept. Sci. 14:127–133.
31. Woolley, G. A. 2005. Photocontrolling peptide alpha helices. Acc.Chem. Res. 38:486–493.
32. Zhang, F., A. Zarrine-Afsar, ., G. A. Woolley. 2009. Structure-basedapproach to the photocontrol of protein folding. J. Am. Chem. Soc.131:2283–2289.
33. Haines-Butterick, L., K. Rajagopal, ., J. P. Schneider. 2007. Control-ling hydrogelation kinetics by peptide design for three-dimensionalencapsulation and injectable delivery of cells. Proc. Natl. Acad. Sci.USA. 104:7791–7796.
34. Altunbas, A., S. J. Lee, ., D. J. Pochan. 2011. Encapsulation ofcurcumin in self-assembling peptide hydrogels as injectable drug deliv-ery vehicles. Biomaterials. 32:5906–5914.
35. Xiong, H., B. L. Buckwalter, ., M. H. Hecht. 1995. Periodicity ofpolar and nonpolar amino acids is the major determinant of secondarystructure in self-assembling oligomeric peptides. Proc. Natl. Acad. Sci.USA. 92:6349–6353.
36. Stanger, H., and S. Gellman. 1998. Rules for antiparallel beta-sheetdesign: D-pro-gly is superior to L-asn-gly for beta-hairpin nucleation.J. Am. Chem. Soc. 120:4236–4237.
37. Schaefer, J., and E. Stejskal. 1976. C-13 nuclear magnetic-resonance ofpolymers spinning at magic angle. J. Am. Chem. Soc. 98:1031–1032.
38. Ishii, Y. 2001. C-13-C-13 dipolar recoupling under very fast magicangle spinning in solid-state nuclear magnetic resonance: applicationsto distance measurements, spectral assignments, and high-throughputsecondary-structure determination. J. Chem. Phys. 114:8473–8483.
39. Takegoshi, K., S. Nakamura, and T. Terao. 2001. C-13-H-1 dipolar-assisted rotational resonance in magic-angle spinning NMR. Chem.Phys. Lett. 344:631–637.
40. Morcombe, C. R., V. Gaponenko,., K. W. Zilm. 2004. Diluting abun-dant spins by isotope edited radio frequency field assisted diffusion.J. Am. Chem. Soc. 126:7196–7197.
41. Tycko, R. 2007. Symmetry-based constant-time homonuclear dipolarrecoupling in solid state NMR. J. Chem. Phys. 126:064506-1–064506-9.
42. Bennett, A. E., C. M. Rienstra, ., R. G. Griffin. 1995. Heteronucleardecoupling in rotating solids. J. Chem. Phys. 103:6951–6958.
43. Sawaya, M. R., S. Sambashivan,., D. Eisenberg. 2007. Atomic struc-tures of amyloid cross-beta spines reveal varied steric zippers. Nature.447:453–457.
44. Eswar, N., B. Webb, ., A. Sali. 2007. Comparative protein structuremodeling using MODELLER. Curr. Protoc. Protein Sci. 50:2.9.1–2.9.31.
45. Phillips, J. C., R. Braun, ., K. Schulten. 2005. Scalable moleculardynamics with NAMD. J. Comput. Chem. 26:1781–1802.
46. Veshtort, M., and R. G. Griffin. 2006. SPINEVOLUTION: a powerfultool for the simulation of solid and liquid state NMR experiments.J. Magn. Reson. 178:248–282.
47. Ozbas, B., J. Kretsinger, ., D. J. Pochan. 2004. Salt-triggered peptidefolding and consequent self-assembly into hydrogels with tunablemodulus. Macromolecules. 37:7331–7337.
Biophysical Journal 105(1) 222–230

230 Leonard et al.
48. Paravastu, A. K., A. T. Petkova, and R. Tycko. 2006. Polymorphic fibrilformation by residues 10–40 of the Alzheimer’s beta-amyloid peptide.Biophys. J. 90:4618–4629.
49. Wishart, D. S., B. D. Sykes, and F. M. Richards. 1991. Relationshipbetween nuclear magnetic resonance chemical shift and protein sec-ondary structure. J. Mol. Biol. 222:311–333.
50. Shen, Y., F. Delaglio,., A. Bax. 2009. TALOSþ: a hybrid method forpredicting protein backbone torsion angles from NMR chemical shifts.J. Biomol. NMR. 44:213–223.
51. Ulrich, E. L., H. Akutsu, ., J. L. Markley. 2008. BioMagResBank.Nucleic Acids Res. 36(Database issue):D402–D408.
52. Tycko, R. 2011. Solid-state NMR studies of amyloid fibril structure.Annu. Rev. Phys. Chem. 62:279–299.
53. Petkova, A. T., R. D. Leapman, ., R. Tycko. 2005. Self-propagating,molecular-level polymorphism in Alzheimer’s beta-amyloid fibrils.Science. 307:262–265.
54. Balbach, J. J., A. T. Petkova, ., R. Tycko. 2002. Supramolecularstructure in full-length Alzheimer’s beta-amyloid fibrils: evidence fora parallel beta-sheet organization from solid-state nuclear magneticresonance. Biophys. J. 83:1205–1216.
Biophysical Journal 105(1) 222–230
55. Paravastu, A. K., R. D. Leapman,., R. Tycko. 2008. Molecular struc-tural basis for polymorphism in Alzheimer’s beta-amyloid fibrils. Proc.Natl. Acad. Sci. USA. 105:18349–18354.
56. Tay, W. M., D. Huang, ., A. K. Paravastu. 2013. The Alzheimer’samyloid-beta(1–42) peptide forms off-pathway oligomers and fibrilsthat are distinguished structurally by intermolecular organization.J. Mol. Biol. 10.1016/j.jmb.2013.04.003.
57. Nielsen, J. T., M. Bjerring, ., N. C. Nielsen. 2009. Unique identifica-tion of supramolecular structures in amyloid fibrils by solid-state NMRspectroscopy. Angew. Chem. Int. Ed. Engl. 48:2118–2121.
58. Ozbas, B., K. Rajagopal, ., D. J. Pochan. 2004. Semiflexible chainnetworks formed via self-assembly of beta-hairpin molecules. Phys.Rev. Lett. 93: 268106-1–26108-4.
59. Qiang, W., W. M. Yau, and R. Tycko. 2011. Structural evolution ofIowa mutant b-amyloid fibrils from polymorphic to homogeneousstates under repeated seeded growth. J. Am. Chem. Soc. 133:4018–4029.
60. Bertini, I., L. Gonnelli, ., A. Nesi. 2011. A new structural model ofAb40 fibrils. J. Am. Chem. Soc. 133:16013–16022.
61. Caplan, M. R., E. M. Schwartzfarb, ., D. A. Lauffenburger. 2002.Control of self-assembling oligopeptide matrix formation through sys-tematic variation of amino acid sequence. Biomaterials. 23:219–227.