Embed Size (px)
Citation preview
Some Fundamental Aspects Concerning
Secondary Steelmaking
Jimmy Gran
Doctoral Thesis
School of Industrial Engineering and Management
Department of Materials Science and Engineering
Royal Institute of Technology
SE-100 44 Stockholm
Sweden
Akademisk avhandling som med tillstånd av Kungliga Tekniska Högskolan i Stockholm, framlägges
för offentlig granskning för avläggande av Teknologie Doktorsexamen, fredagen den 1 april 2011,
kl. 10.00 i sal D2, Lindstedtsvägen 5, Kungliga Tekniska Högskolan, Stockholm
ISRN KTH/MSE--11/04--SE+MICROMODMETU/AVH
ISBN 978-91-7415-901-1
Jimmy Gran Some Fundamental Aspects Concerning Secondary Steelmaking
KTH School of Industrial Engineering and Management
Department of Materials Science and Engineering
Division of Micro-Modelling
Royal Institute of Technology
SE-100 44 Stockholm
Sweden
ISRN KTH/MSE--11/04--SE+MICROMODMETU/AVH
ISBN 978-91-7415-901-1
© The Author
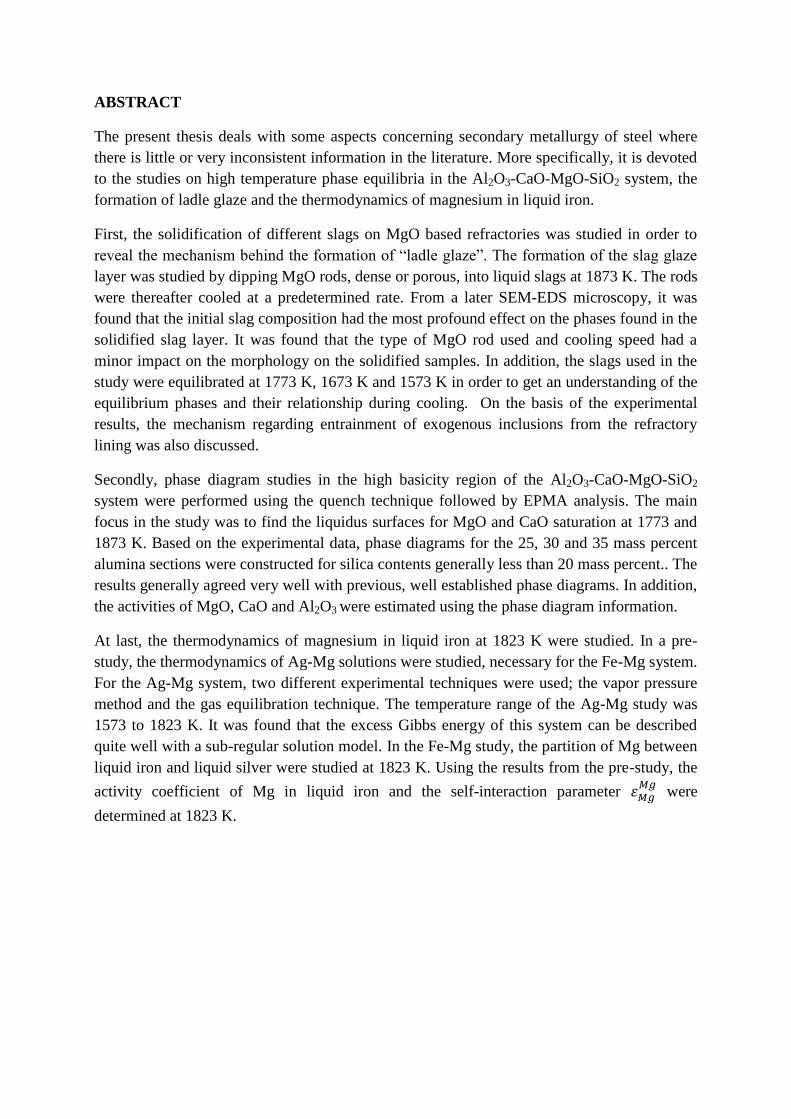
ABSTRACT
The present thesis deals with some aspects concerning secondary metallurgy of steel where
there is little or very inconsistent information in the literature. More specifically, it is devoted
to the studies on high temperature phase equilibria in the Al2O3-CaO-MgO-SiO2 system, the
formation of ladle glaze and the thermodynamics of magnesium in liquid iron.
First, the solidification of different slags on MgO based refractories was studied in order to
reveal the mechanism behind the formation of “ladle glaze”. The formation of the slag glaze
layer was studied by dipping MgO rods, dense or porous, into liquid slags at 1873 K. The rods
were thereafter cooled at a predetermined rate. From a later SEM-EDS microscopy, it was
found that the initial slag composition had the most profound effect on the phases found in the
solidified slag layer. It was found that the type of MgO rod used and cooling speed had a
minor impact on the morphology on the solidified samples. In addition, the slags used in the
study were equilibrated at 1773 K, 1673 K and 1573 K in order to get an understanding of the
equilibrium phases and their relationship during cooling. On the basis of the experimental
results, the mechanism regarding entrainment of exogenous inclusions from the refractory
lining was also discussed.
Secondly, phase diagram studies in the high basicity region of the Al2O3-CaO-MgO-SiO2
system were performed using the quench technique followed by EPMA analysis. The main
focus in the study was to find the liquidus surfaces for MgO and CaO saturation at 1773 and
1873 K. Based on the experimental data, phase diagrams for the 25, 30 and 35 mass percent
alumina sections were constructed for silica contents generally less than 20 mass percent.. The
results generally agreed very well with previous, well established phase diagrams. In addition,
the activities of MgO, CaO and Al2O3 were estimated using the phase diagram information.
At last, the thermodynamics of magnesium in liquid iron at 1823 K were studied. In a pre-
study, the thermodynamics of Ag-Mg solutions were studied, necessary for the Fe-Mg system.
For the Ag-Mg system, two different experimental techniques were used; the vapor pressure
method and the gas equilibration technique. The temperature range of the Ag-Mg study was
1573 to 1823 K. It was found that the excess Gibbs energy of this system can be described
quite well with a sub-regular solution model. In the Fe-Mg study, the partition of Mg between
liquid iron and liquid silver were studied at 1823 K. Using the results from the pre-study, the
activity coefficient of Mg in liquid iron and the self-interaction parameter
were
determined at 1823 K.


ACKNOWLEDGEMENTS
First I would like to express my sincere gratitude and appreciation to my supervisor Professor
Du Sichen. Beside the excellent guidance and support during this work, you gave me the
liberty needed to develop as a scientist.
I am also grateful to my co-supervisor, Dr. Robert Eriksson, for his valuable advices and
supervision during this work.
I would also like to thank M.Sc. Jan-Erik Andersson at Ovako Hofors AB. Your sincere
devotion to making cleaner steel is admirable, giving me both inspiration and encouragement
during my thesis work.
I am also thankful to Professor Mats Hillert and Associate Professor Malin Selleby for their
valuable suggestions.
I owe my gratitude to Wenli Long for her help with sample preparation and for giving me the
opportunity to become a fairly good SEM user. I also thank Peter Kling for his very important
help and assistance with the experimental equipment.
A special thank to my colleagues and friends at Materials Science and Engineering for both
professional and less professional discussions. Especially I owe my gratitude to my friend and
former roommate Dr. Minho Song for his never ending good spirit and kindness.
Finally, I would like to thank my family for their love and support. Especially, I would like to
express my appreciation for having my dear wife Katrin and my daughter Agnes in my life.
Jimmy Gran, Stockholm, February 2011.

SUPPLEMENTS
The thesis is based on the following supplements:
Supplement 1: “Effects of slag composition and cooling rate on formation of
glaze on MgO refractory”
Jimmy Gran, Mikael Thunman and Du Sichen
Ironmaking and Steelmaking 37(2010), pp. 27-34
Supplement 2: “Experimental determination of the liquidus in the high basicity
region in the Al2O3(30 mass%)-CaO-MgO-SiO2 system”
Jimmy Gran, Yanli Wang and Du Sichen
In press, Calphad (2011), doi: 10.1016/j.calphad;2010.11.004.
Supplement 3: “Experimental determination of the liquidus in the high basicity
region in the Al2O3(25mass%)-CaO-MgO-SiO2 and
Al2O3(35mass%)-CaO-MgO-SiO2 systems”
Jimmy Gran, Baijun Yan and Du Sichen
Sent to Metallurgical and Materials Transactions B for publication
Supplement 4: “Activity of Magnesium in liquid Ag-Mg alloys.”
Jimmy Gran, Minho Song and Du Sichen
Sent to ISIJ International for publication
Supplement 5: “Experimental determination of Mg activities in Fe-Mg solutions”
Jimmy Gran and Du Sichen
Sent to Metallurgical and Materials Transactions B for publication

CONTENTS
1. INTRODUCTION ............................................................................................................................... 1
1.1 Technological background ............................................................................................................ 1
1.2 Present work .................................................................................................................................. 2
2. EXPERIMENTAL .............................................................................................................................. 4
2.1 Glaze formation on MgO refractory .............................................................................................. 4
2.2 Phase diagram study ...................................................................................................................... 6
2.3 Activity of magnesium in liquid Ag-Mg alloys ............................................................................ 7
2.4 Thermodynamics of Fe-Mg solutions ........................................................................................... 9
3. RESULTS .......................................................................................................................................... 10
3.1 Glaze formation on MgO refractory ............................................................................................ 10
3.2 Phase diagram study .................................................................................................................... 16
3.3 Activity of magnesium in liquid Ag-Mg alloys .......................................................................... 18
3.4 Thermodynamics of Fe-Mg solutions ......................................................................................... 20
4. DISCUSSION ................................................................................................................................... 21
4.1 Glaze formation on MgO refractory ............................................................................................ 21
4.1.1 Phases present after the MgO-rod immersion ...................................................................... 22
4.1.2 Dusting and cracks ............................................................................................................... 24
4.1.3 Potential source for exogenous inclusions............................................................................ 25
4.2 Phase diagram study .................................................................................................................... 26
4.2.1 Presentation of the liquidus lines .......................................................................................... 26
4.2.2 Estimation of the activities ................................................................................................... 30
4.3 Activity of magnesium in liquid Ag-Mg alloys .......................................................................... 37
4.4 Thermodynamics of liquid Fe-Mg solutions ............................................................................... 38
5. SUMMARY ...................................................................................................................................... 42
6. REFERENCES .................................................................................................................................. 43
1
1. INTRODUCTION
One of the main purposes of secondary steelmaking is to adjust the composition and the
temperature before casting. In recent years, removal of non metallic inclusions has also
become a very important task. Refining operations such as deoxidation, alloying, vacuum
degassing, heating and stirring are made at this stage. As the steel contains several elements
beside iron and carbon, the reactions taking place in these refining operations are complex.
The situation is further complicated by the refractory, as it reacts with the steel and the slag. It
even affects the compositions of inclusions and their stabilities.
In order to be able to understand the reactions taking place and optimize the secondary
steelmaking processes, knowledge of different phenomena and having sufficient
thermodynamic data are essential. Even though secondary refining of steel has been a field in
metallurgical research for several decades, there are still many phenomena remaining unclear.
Accurate thermodynamic data are still scarce. The present thesis work is focused on a few
very important fundamental aspects related to secondary steelmaking, although it could touch
a tiny fraction of the things urgently needed. More specifically, it devotes to the studies on
high temperature phase equilibria in the Al2O3-CaO-MgO-SiO2 system, the formation of ladle
glaze and the thermodynamics of magnesium in liquid iron.
1.1 Technological background
In most operations in secondary steelmaking, a synthetic slag based on the Al2O3-CaO-MgO-
SiO2 system is added for refining. In order to get good kinetic conditions for different refining
operations, the steel producers very often prefer a completely liquid slag. At the same time,
slags that are far from saturated with respect to the refractory oxide will cause severe
refractory consumption. Recommended phase diagrams for the Al2O3-CaO-MgO-SiO2 system
can be found in Slag Atlas [1], which is based on a number of studies. Most of the work was
done by Osborn et al. [2] with some modifications by Gutt and Russel [3] as well as Cavalier
and Sandrea-Deudon [4]. However, as stated by Osborn et al. [2], the accuracy of the position
of the liquidus line in the basic slag region might be low in the Al2O3-CaO-MgO-SiO2 system
in comparison with the area for blast furnace slags. These lines are indicated with a dashed
line in their presentation. The work by Cavalier and Sandrea-Deudon [4] is basically a re-
calculation using the result from Osborn et al. [2] and the four ternary systems with some
additional experiments in the high silica (25-45 mass%) region. It should be mentioned that
the initial dashed lines from Osborn et al. [2] suddenly became solid lines in the work by
Cavalier and Sandrea-Deudon [4], although no more experimental data in the high basicity
region was available. In the work by Gutt and Russel [3], the scope of the investigations was
slags with higher SiO2 contents, with no additional information in the CaO-rich part of the
system at steelmaking temperatures. Some disagreements between experimental results and
the diagram from Osborn et al. [2] were found by Dahl et al. [5].
Most vessels for secondary refining of steels are lined with MgO based refractories. Then, as
the slag will be close to or saturated with MgO, exchange reactions with the liquid steel will
cause magnesium and other elements in the slag to transfer to the liquid steel to some extent.
As the content of dissolved magnesium is in ppm level in most steels, it is difficult to
2
distinguish between magnesium from non-metallic inclusions and the part dissolved in the
steel. As making cleaner steel and improving the steel properties have become one of the
foremost important tasks of the steel industries, the formation of Al2O3.MgO spinel inclusions
and their stability have been the focus of many researchers [6-10]. The stability of the
inclusions containing MgO depends directly on the activity of magnesium in the liquid metal.
Unfortunately, great discrepancy of magnesium activity in liquid steel is found. For the
reaction Mg(wt% Fe) + O(wt% Fe) = MgO(s), the reported log K values at 1823 K varies between
6.08 and 9 in previous investigations [11-15]. Reliable thermodynamic data for magnesium
dissolved in liquid iron would help researchers when performing thermodynamic calculations
for process predictions and process optimizations.
Furthermore, during teeming of the steelmaking vessel, a thin slag layer will adhere to the
lining. This slag layer sometimes referred to as ―ladle glaze‖, will solidify on the lining wall
after teeming. As this layer is most likely the first part of the lining that will be in contact with
the steel in the next heat, it is important to have some idea about the formation of this glaze
layer and the solidification behavior in contact with the MgO lining. Earlier researchers have
suggested that ladle glaze might be a source of inclusions in steel [16-21]. Song [22] found
that the number of non-metallic inclusions increase with the SiO2 concentration in the slag in
the previous heat at Uddeholms AB. After some trials with BaO as a tracer, he concluded that
ladle glaze is an important source of non-metallic inclusions. Although he couldn‘t explain
the mechanisms, he suggested that the 2CaO.SiO2 formed during cooling of the ladle glaze
might be an important source of non-metallic inclusion in the next heat.
The present thesis work is devoted to the aspects above, all related to secondary refining of
steel.
1.2 Present work
The first supplement deals with the slag-MgO reactions during teeming of the vessel. The
solidification of different slags on MgO rods are studied under controlled conditions in a
laboratory furnace. Although the subject has been studied extensively, there are no studies
about the mechanisms behind the formation of ―ladle glaze‖. As the term ―ladle glaze‖
implies that this layer would consist of one homogenous glassy phase, the concept needs some
clarification. In addition, the possibility to form non-metallic inclusions from ladle glaze is
discussed.
The second and third supplements focus on the properties of the slag. The liquidus surfaces in
the high basicity region of the Al2O3-CaO-MgO-SiO2 quaternary are determined
experimentally using the quench technique. The primary interest is the liquidus surfaces of
MgO and CaO as primary phases for alumina contents between 25 and 35 mass percent. A
thorough survey is needed as there is discrepancy between some results from a recent work
[5] and the well established work by Osborn et al.[2]. This study will help decision-making of
slag praxis in steelworks, both with respect to having a completely liquid slag and to reduce
refractory consumption. The activities of CaO, MgO and Al2O3 are also discussed based on
the phase diagram information.
3
The fourth and fifth paper deals with the thermodynamics of magnesium in liquid iron. The
fourth paper is an activity measurement for the silver-magnesium system, necessary for the
fifth paper. The reported thermodynamic data [11-15,23] for magnesium in iron at
steelmaking temperatures shows a huge inconsistency. Reliable thermodynamic data for
magnesium dissolved in liquid iron will help researchers and process developers to better
understand the movement of magnesium in the ―system‖ for steelmaking reactors.
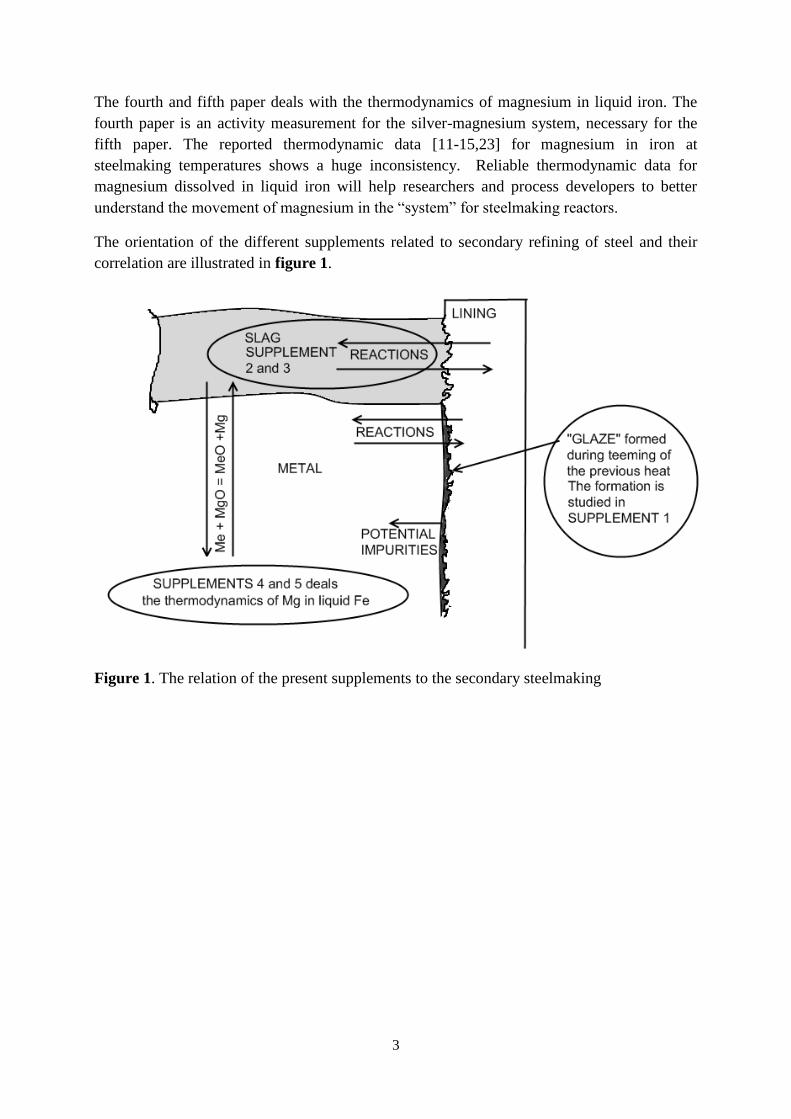
The orientation of the different supplements related to secondary refining of steel and their
correlation are illustrated in figure 1.
Figure 1. The relation of the present supplements to the secondary steelmaking
4
2. EXPERIMENTAL
2.1 Glaze formation on MgO refractory
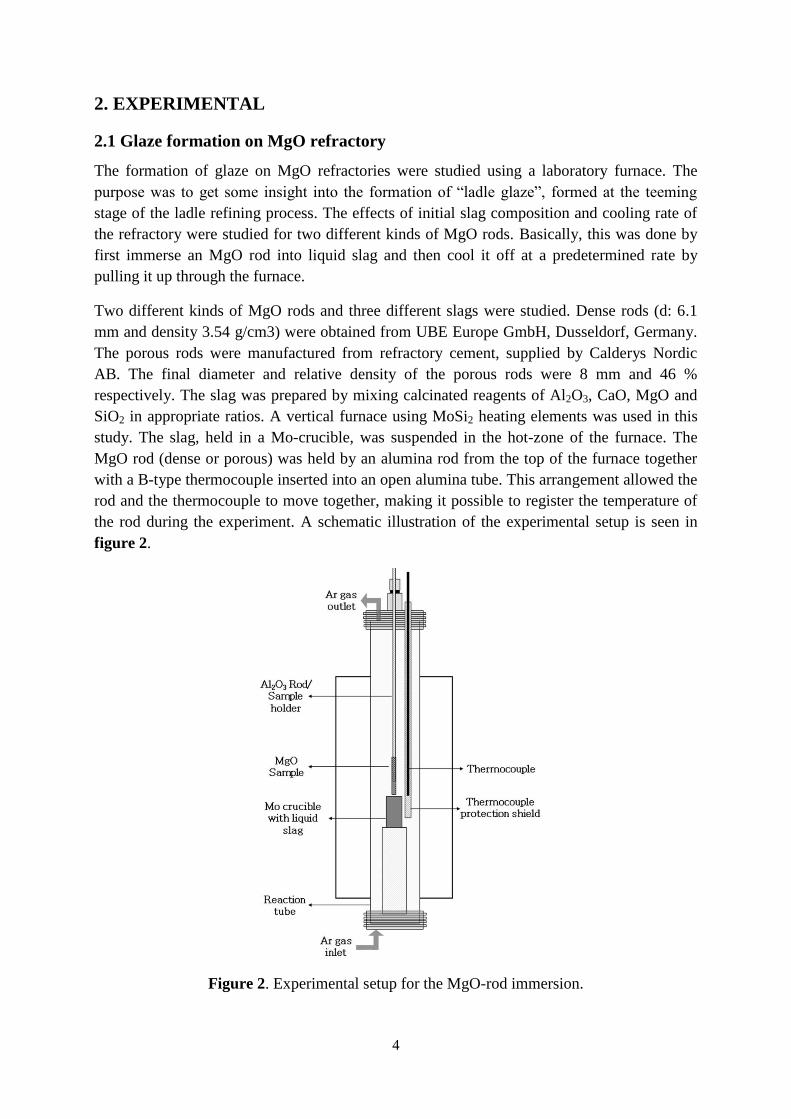
The formation of glaze on MgO refractories were studied using a laboratory furnace. The
purpose was to get some insight into the formation of ―ladle glaze‖, formed at the teeming
stage of the ladle refining process. The effects of initial slag composition and cooling rate of
the refractory were studied for two different kinds of MgO rods. Basically, this was done by
first immerse an MgO rod into liquid slag and then cool it off at a predetermined rate by
pulling it up through the furnace.
Two different kinds of MgO rods and three different slags were studied. Dense rods (d: 6.1
mm and density 3.54 g/cm3) were obtained from UBE Europe GmbH, Dusseldorf, Germany.
The porous rods were manufactured from refractory cement, supplied by Calderys Nordic
AB. The final diameter and relative density of the porous rods were 8 mm and 46 %
respectively. The slag was prepared by mixing calcinated reagents of Al2O3, CaO, MgO and
SiO2 in appropriate ratios. A vertical furnace using MoSi2 heating elements was used in this
study. The slag, held in a Mo-crucible, was suspended in the hot-zone of the furnace. The
MgO rod (dense or porous) was held by an alumina rod from the top of the furnace together
with a B-type thermocouple inserted into an open alumina tube. This arrangement allowed the
rod and the thermocouple to move together, making it possible to register the temperature of
the rod during the experiment. A schematic illustration of the experimental setup is seen in
figure 2.
Figure 2. Experimental setup for the MgO-rod immersion.
5
After heating the slag to 1873 K, this temperature was held for 120 minutes to ensure molten
and homogenous slag. Thereafter the rod was dipped into the slag for 5 minutes for dense rods
and 1 minute for porous rods. The ―glazed‖ rod was then brought up through the furnace at a
predetermined cooling rate until the temperature reached 1373 K. It was then removed from
the furnace and cooled in air. In order to study the effect of termination temperature, two
samples were withdrawn from the furnace at 1573 K. Argon was passed through the furnace
during the whole procedure to avoid oxidation of the Mo-crucible.
After the experiments, the MgO rods were sectioned and mounted into conductive resin for
SEM-EDS analysis. The samples were grinded and polished with standard polishing
techniques and sputter coated with gold. For the SEM-EDS analysis, a JEOL JSM840 SEM
microscope equipped with an EDS detector was used.
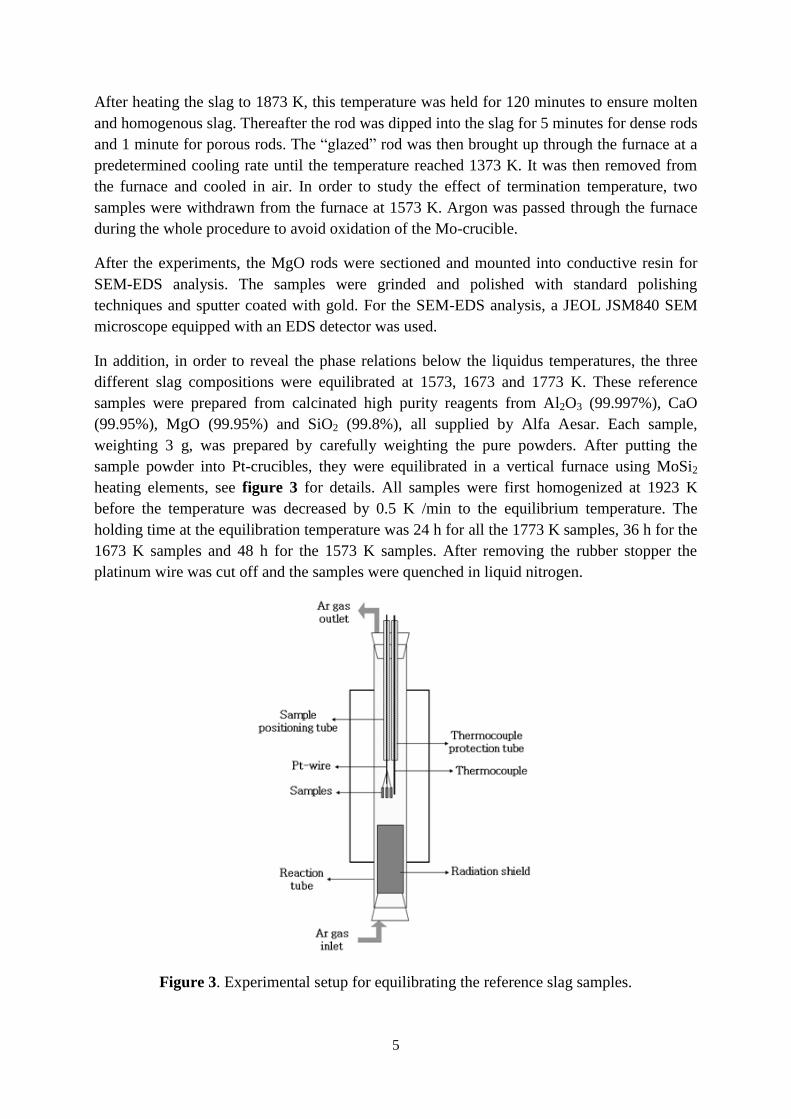
In addition, in order to reveal the phase relations below the liquidus temperatures, the three
different slag compositions were equilibrated at 1573, 1673 and 1773 K. These reference
samples were prepared from calcinated high purity reagents from Al2O3 (99.997%), CaO
(99.95%), MgO (99.95%) and SiO2 (99.8%), all supplied by Alfa Aesar. Each sample,
weighting 3 g, was prepared by carefully weighting the pure powders. After putting the
sample powder into Pt-crucibles, they were equilibrated in a vertical furnace using MoSi2
heating elements, see figure 3 for details. All samples were first homogenized at 1923 K
before the temperature was decreased by 0.5 K /min to the equilibrium temperature. The
holding time at the equilibration temperature was 24 h for all the 1773 K samples, 36 h for the
1673 K samples and 48 h for the 1573 K samples. After removing the rubber stopper the
platinum wire was cut off and the samples were quenched in liquid nitrogen.
Figure 3. Experimental setup for equilibrating the reference slag samples.
6
The reference samples were sectioned and mounted into conductive embedding material.
Grinding and polishing were done using ethanol as coolant. After sputter coating with gold,
the samples were examined using a JEOL JSM840 SEM equipped with an EDS detector.
2.2 Phase diagram study
Al2O3, CaO, MgO, and SiO2 forms the most common constituents in ladle slags. Beside the
general requirement of a completely liquid slag, it should be saturated or close to saturated
with the refractory oxide. Therefore, as a first task, the positions of the liquidus surfaces for
the CaO and MgO saturation were detected using the quench technique. Secondly, if possible,
the liquidus surfaces for 3CaO.SiO2 and 2CaO.SiO2 saturations were detected. All
experiments were conducted at typical steelmaking temperatures using the equilibrating and
quench technique.
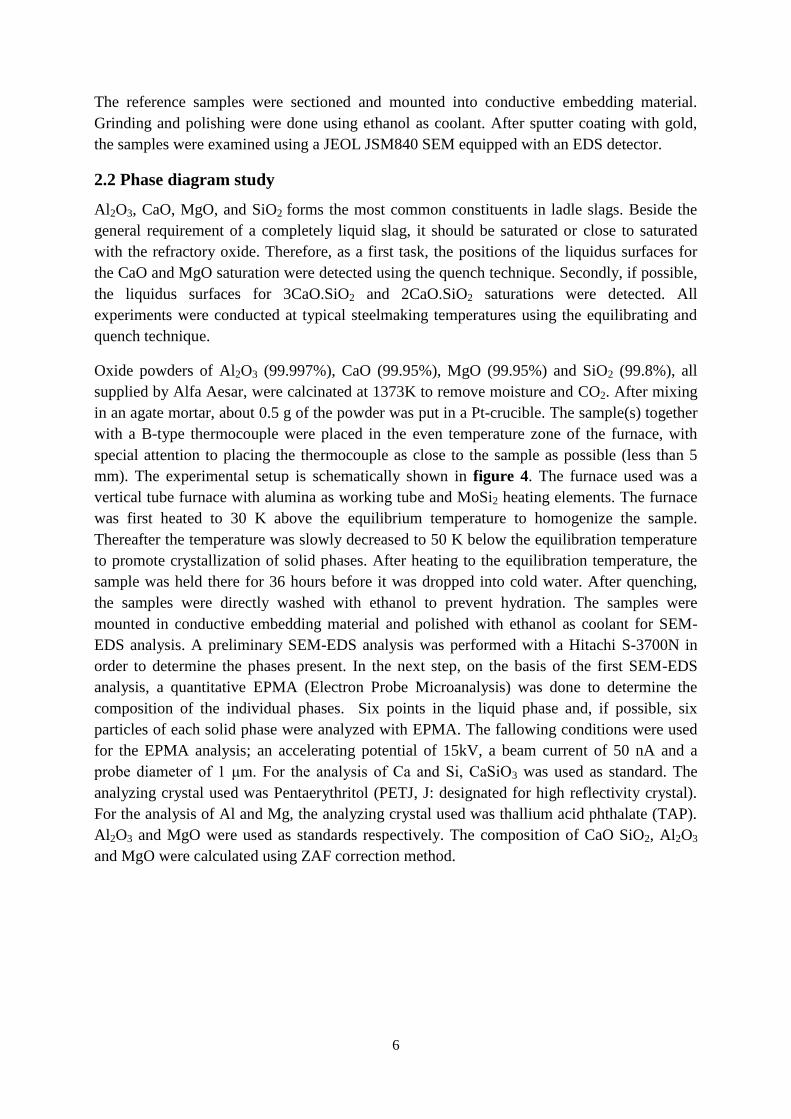
Oxide powders of Al2O3 (99.997%), CaO (99.95%), MgO (99.95%) and SiO2 (99.8%), all
supplied by Alfa Aesar, were calcinated at 1373K to remove moisture and CO2. After mixing
in an agate mortar, about 0.5 g of the powder was put in a Pt-crucible. The sample(s) together
with a B-type thermocouple were placed in the even temperature zone of the furnace, with
special attention to placing the thermocouple as close to the sample as possible (less than 5
mm). The experimental setup is schematically shown in figure 4. The furnace used was a
vertical tube furnace with alumina as working tube and MoSi2 heating elements. The furnace
was first heated to 30 K above the equilibrium temperature to homogenize the sample.
Thereafter the temperature was slowly decreased to 50 K below the equilibration temperature
to promote crystallization of solid phases. After heating to the equilibration temperature, the
sample was held there for 36 hours before it was dropped into cold water. After quenching,
the samples were directly washed with ethanol to prevent hydration. The samples were
mounted in conductive embedding material and polished with ethanol as coolant for SEM-
EDS analysis. A preliminary SEM-EDS analysis was performed with a Hitachi S-3700N in
order to determine the phases present. In the next step, on the basis of the first SEM-EDS
analysis, a quantitative EPMA (Electron Probe Microanalysis) was done to determine the
composition of the individual phases. Six points in the liquid phase and, if possible, six
particles of each solid phase were analyzed with EPMA. The fallowing conditions were used
for the EPMA analysis; an accelerating potential of 15kV, a beam current of 50 nA and a
probe diameter of 1 μm. For the analysis of Ca and Si, CaSiO3 was used as standard. The
analyzing crystal used was Pentaerythritol (PETJ, J: designated for high reflectivity crystal).
For the analysis of Al and Mg, the analyzing crystal used was thallium acid phthalate (TAP).
Al2O3 and MgO were used as standards respectively. The composition of CaO SiO2, Al2O3
and MgO were calculated using ZAF correction method.
7
Figure 4. The experimental setup used in the phase diagram study, 1. gas outlet; 2. Silicone
rubber stopper; 3. alumina reaction tube; 4. Furnace shell; 5. Pt-wire holding the crucibles; 6.
Pt-crucibles containing the samples; 7. B-type thermocouple; 8. Gas inlet.
2.3 Activity of magnesium in liquid Ag-Mg alloys
In order to evaluate the thermodynamics of magnesium in liquid iron from the partition of Mg
between iron and silver, the thermodynamics of Mg in Ag must be known. Therefore, the
activity of Mg in Ag-Mg solutions was determined experimentally.
Two different experimental techniques were used in this study. The first experimental
technique was used for higher and intermediate Mg contents while the second technique was
used for lower Mg contents.
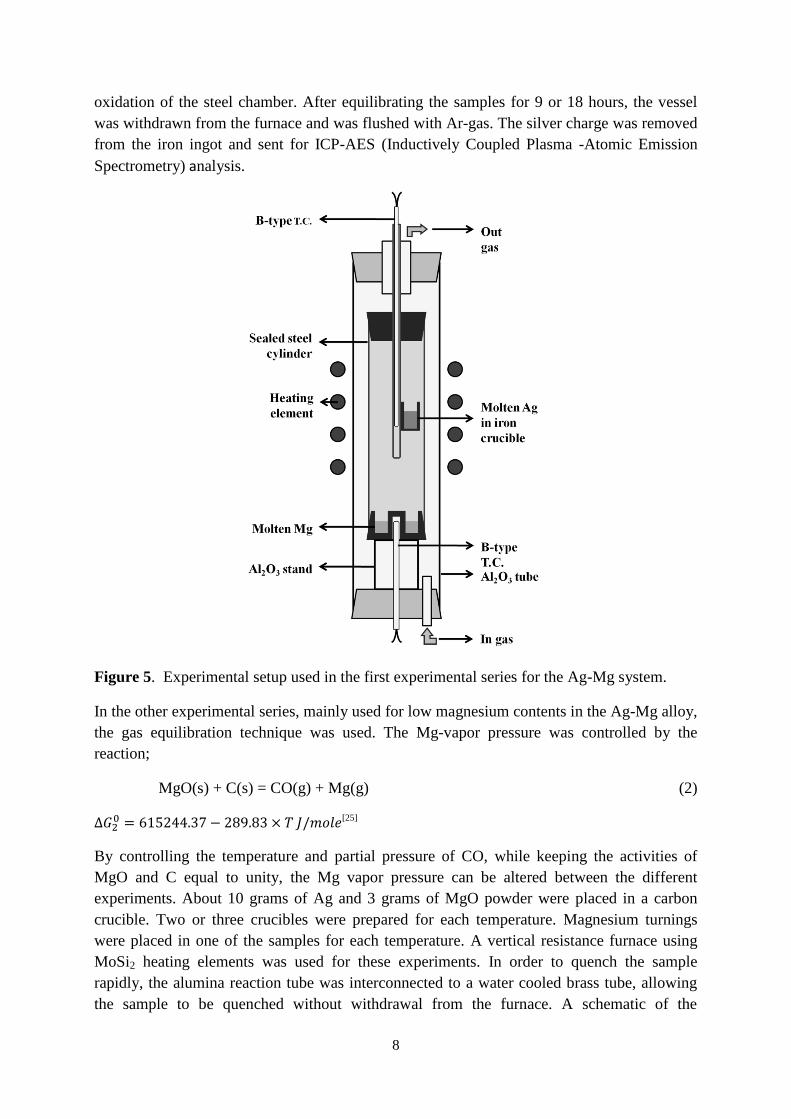
In the first experimental series, an Ag charge was equilibrated with Mg vapor in a semi-closed
steel vessel. This technique was mainly used for high and intermediate magnesium contents in
the Ag-Mg alloys. The experimental setup is seen in figure 5. Approximately 1 gram of
silver was charged in an iron crucible placed in the upper part of the vessel. The temperature
of the silver charge was controlled with a B type thermocouple inserted into a steel tube
holding the Ag-charge. Magnesium turnings (about 2 grams) were put in a cavity in the
bottom plug of the chamber. The temperature of the Mg was measured with another B-type
thermocouple inserted into a bored hole in the bottom plug. The vapor pressure of pure Mg
was controlled by altering the temperature of the Mg-charge. The vapor pressure of Mg
beneath the normal boiling point was obtained from [24];
[1]
After closing the steel chamber with conical steel plugs, it was placed in a vertical resistance
furnace with special attention to get the Ag-charge in the even temperature zone of the
furnace. The furnace was heated with MoSi2 heating elements and used an alumina working
tube. Before the heating was started, the furnace was closed in both ends with silicon rubber
stoppers. Argon was passed through the furnace during the whole heating procedure to avoid
8
oxidation of the steel chamber. After equilibrating the samples for 9 or 18 hours, the vessel
was withdrawn from the furnace and was flushed with Ar-gas. The silver charge was removed
from the iron ingot and sent for ICP-AES (Inductively Coupled Plasma -Atomic Emission
Spectrometry) analysis.
Figure 5. Experimental setup used in the first experimental series for the Ag-Mg system.
In the other experimental series, mainly used for low magnesium contents in the Ag-Mg alloy,
the gas equilibration technique was used. The Mg-vapor pressure was controlled by the
reaction;
MgO(s) + C(s) = CO(g) + Mg(g) (2)
[25]
By controlling the temperature and partial pressure of CO, while keeping the activities of
MgO and C equal to unity, the Mg vapor pressure can be altered between the different
experiments. About 10 grams of Ag and 3 grams of MgO powder were placed in a carbon
crucible. Two or three crucibles were prepared for each temperature. Magnesium turnings
were placed in one of the samples for each temperature. A vertical resistance furnace using
MoSi2 heating elements was used for these experiments. In order to quench the sample
rapidly, the alumina reaction tube was interconnected to a water cooled brass tube, allowing
the sample to be quenched without withdrawal from the furnace. A schematic of the
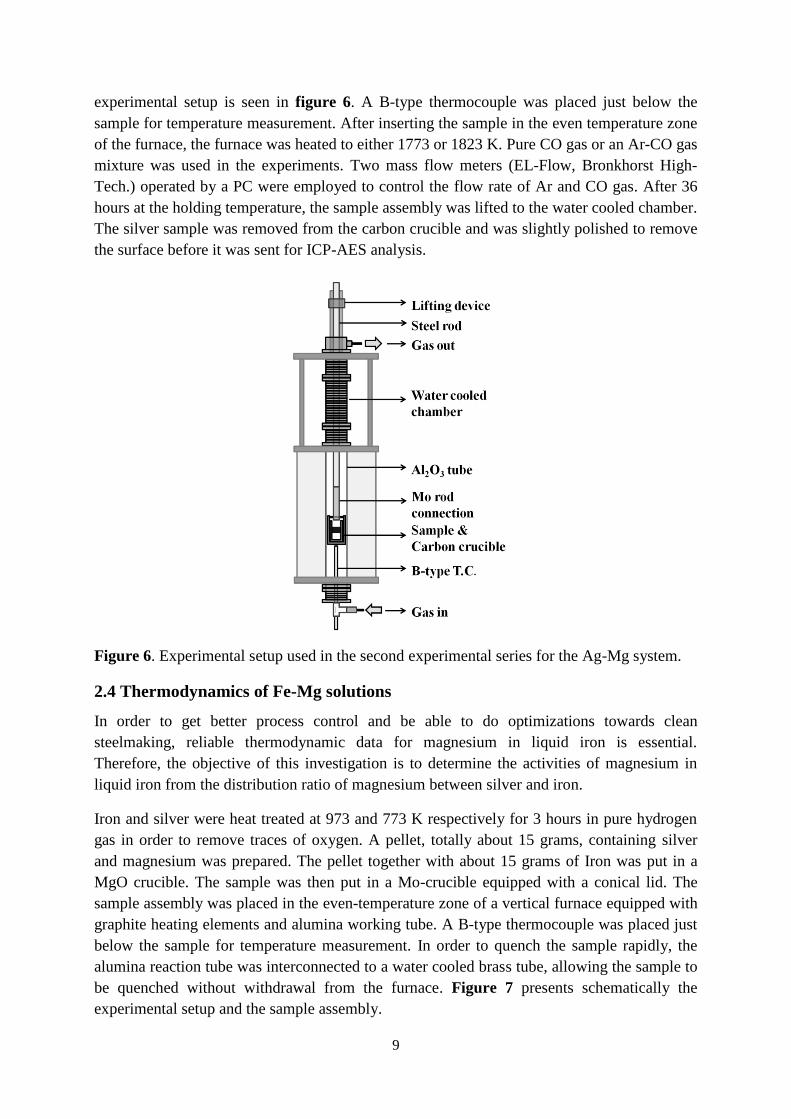
9
experimental setup is seen in figure 6. A B-type thermocouple was placed just below the
sample for temperature measurement. After inserting the sample in the even temperature zone
of the furnace, the furnace was heated to either 1773 or 1823 K. Pure CO gas or an Ar-CO gas
mixture was used in the experiments. Two mass flow meters (EL-Flow, Bronkhorst High-
Tech.) operated by a PC were employed to control the flow rate of Ar and CO gas. After 36
hours at the holding temperature, the sample assembly was lifted to the water cooled chamber.
The silver sample was removed from the carbon crucible and was slightly polished to remove
the surface before it was sent for ICP-AES analysis.
Figure 6. Experimental setup used in the second experimental series for the Ag-Mg system.
2.4 Thermodynamics of Fe-Mg solutions
In order to get better process control and be able to do optimizations towards clean
steelmaking, reliable thermodynamic data for magnesium in liquid iron is essential.
Therefore, the objective of this investigation is to determine the activities of magnesium in
liquid iron from the distribution ratio of magnesium between silver and iron.
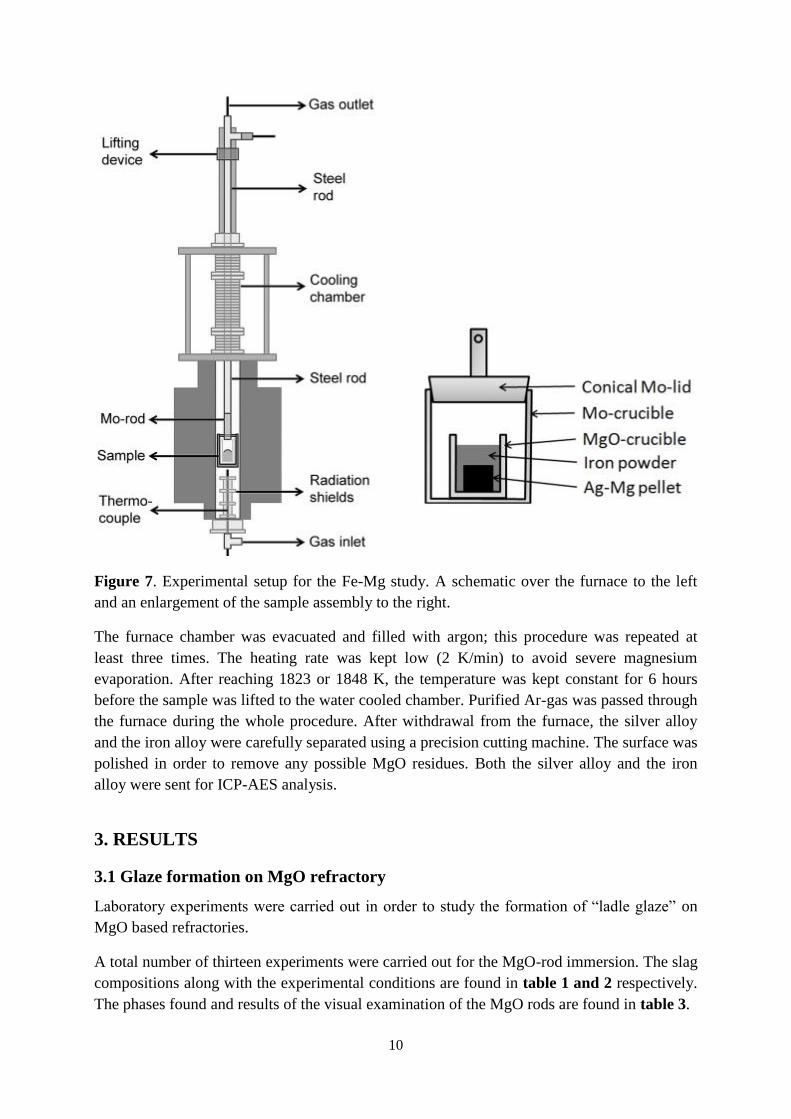
Iron and silver were heat treated at 973 and 773 K respectively for 3 hours in pure hydrogen
gas in order to remove traces of oxygen. A pellet, totally about 15 grams, containing silver
and magnesium was prepared. The pellet together with about 15 grams of Iron was put in a
MgO crucible. The sample was then put in a Mo-crucible equipped with a conical lid. The
sample assembly was placed in the even-temperature zone of a vertical furnace equipped with
graphite heating elements and alumina working tube. A B-type thermocouple was placed just
below the sample for temperature measurement. In order to quench the sample rapidly, the
alumina reaction tube was interconnected to a water cooled brass tube, allowing the sample to
be quenched without withdrawal from the furnace. Figure 7 presents schematically the
experimental setup and the sample assembly.
10
Figure 7. Experimental setup for the Fe-Mg study. A schematic over the furnace to the left
and an enlargement of the sample assembly to the right.
The furnace chamber was evacuated and filled with argon; this procedure was repeated at
least three times. The heating rate was kept low (2 K/min) to avoid severe magnesium
evaporation. After reaching 1823 or 1848 K, the temperature was kept constant for 6 hours
before the sample was lifted to the water cooled chamber. Purified Ar-gas was passed through
the furnace during the whole procedure. After withdrawal from the furnace, the silver alloy
and the iron alloy were carefully separated using a precision cutting machine. The surface was
polished in order to remove any possible MgO residues. Both the silver alloy and the iron
alloy were sent for ICP-AES analysis.
3. RESULTS
3.1 Glaze formation on MgO refractory
Laboratory experiments were carried out in order to study the formation of ―ladle glaze‖ on
MgO based refractories.
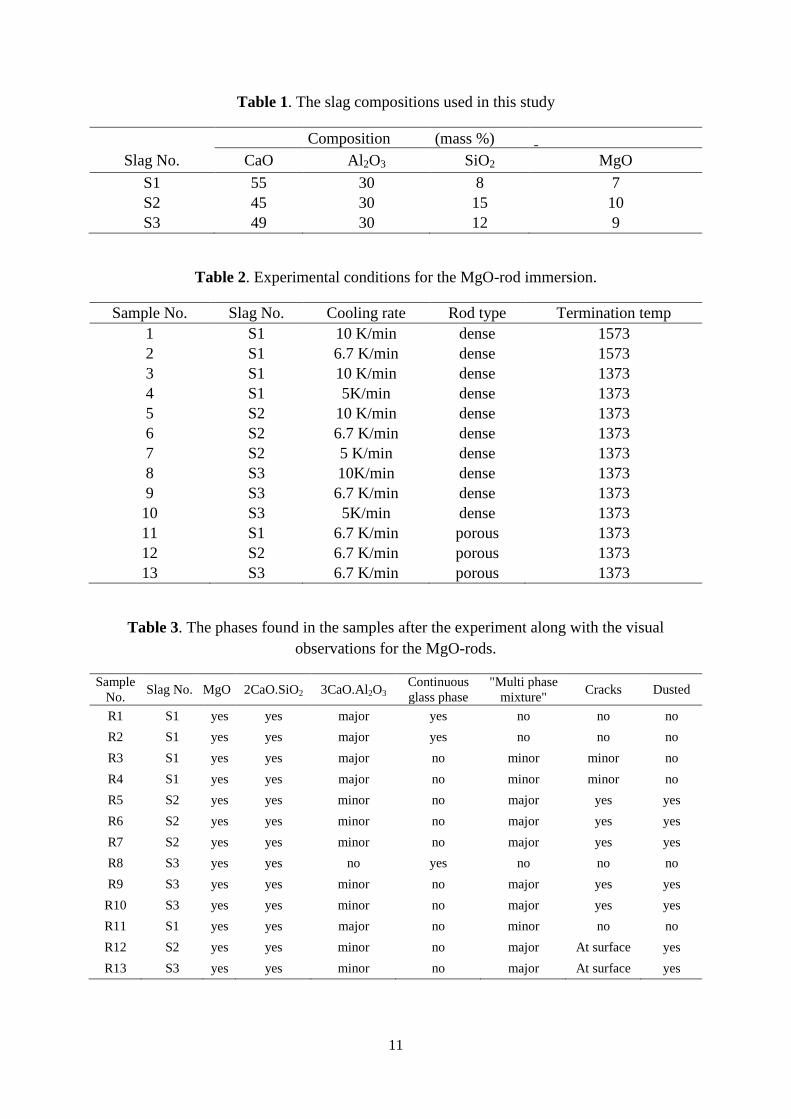
A total number of thirteen experiments were carried out for the MgO-rod immersion. The slag
compositions along with the experimental conditions are found in table 1 and 2 respectively.
The phases found and results of the visual examination of the MgO rods are found in table 3.
11
Table 1. The slag compositions used in this study
Composition (mass %)
Slag No. CaO Al2O3 SiO2 MgO
S1 55 30 8 7
S2 45 30 15 10
S3 49 30 12 9
Table 2. Experimental conditions for the MgO-rod immersion.
Sample No. Slag No. Cooling rate Rod type Termination temp
1 S1 10 K/min dense 1573
2 S1 6.7 K/min dense 1573
3 S1 10 K/min dense 1373
4 S1 5K/min dense 1373
5 S2 10 K/min dense 1373
6 S2 6.7 K/min dense 1373
7 S2 5 K/min dense 1373
8 S3 10K/min dense 1373
9 S3 6.7 K/min dense 1373
10 S3 5K/min dense 1373
11 S1 6.7 K/min porous 1373
12 S2 6.7 K/min porous 1373
13 S3 6.7 K/min porous 1373
Table 3. The phases found in the samples after the experiment along with the visual
observations for the MgO-rods.
Sample
No. Slag No. MgO 2CaO.SiO2 3CaO.Al2O3
Continuous
glass phase
"Multi phase
mixture" Cracks Dusted
R1 S1 yes yes major yes no no no
R2 S1 yes yes major yes no no no
R3 S1 yes yes major no minor minor no
R4 S1 yes yes major no minor minor no
R5 S2 yes yes minor no major yes yes
R6 S2 yes yes minor no major yes yes
R7 S2 yes yes minor no major yes yes
R8 S3 yes yes no yes no no no
R9 S3 yes yes minor no major yes yes
R10 S3 yes yes minor no major yes yes
R11 S1 yes yes major no minor no no
R12 S2 yes yes minor no major At surface yes
R13 S3 yes yes minor no major At surface yes
12
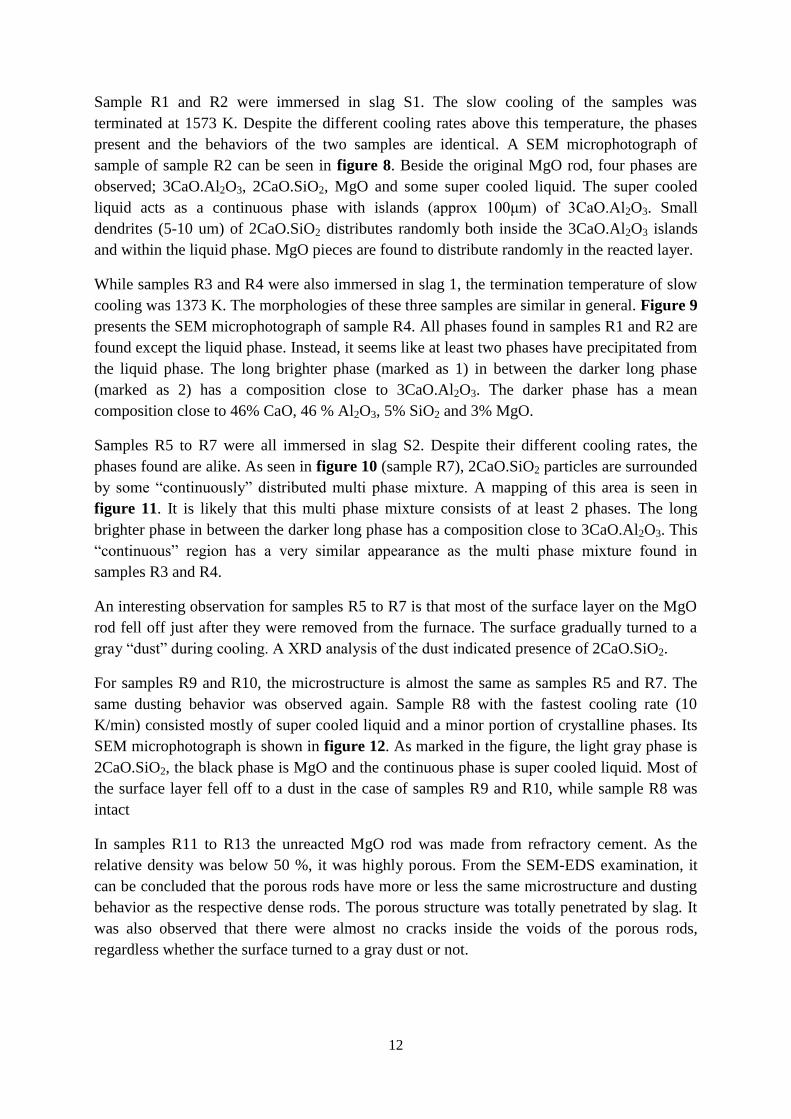
Sample R1 and R2 were immersed in slag S1. The slow cooling of the samples was
terminated at 1573 K. Despite the different cooling rates above this temperature, the phases
present and the behaviors of the two samples are identical. A SEM microphotograph of
sample of sample R2 can be seen in figure 8. Beside the original MgO rod, four phases are
observed; 3CaO.Al2O3, 2CaO.SiO2, MgO and some super cooled liquid. The super cooled
liquid acts as a continuous phase with islands (approx 100μm) of 3CaO.Al2O3. Small
dendrites (5-10 um) of 2CaO.SiO2 distributes randomly both inside the 3CaO.Al2O3 islands
and within the liquid phase. MgO pieces are found to distribute randomly in the reacted layer.
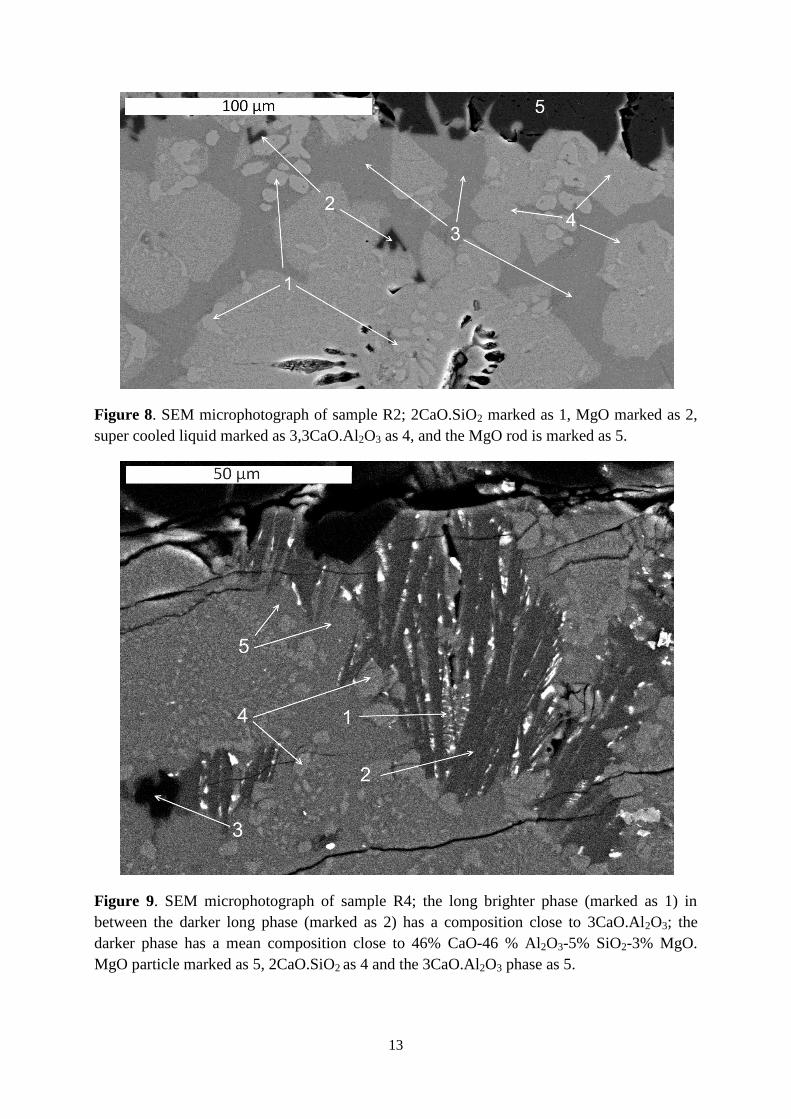
While samples R3 and R4 were also immersed in slag 1, the termination temperature of slow
cooling was 1373 K. The morphologies of these three samples are similar in general. Figure 9
presents the SEM microphotograph of sample R4. All phases found in samples R1 and R2 are
found except the liquid phase. Instead, it seems like at least two phases have precipitated from
the liquid phase. The long brighter phase (marked as 1) in between the darker long phase
(marked as 2) has a composition close to 3CaO.Al2O3. The darker phase has a mean
composition close to 46% CaO, 46 % Al2O3, 5% SiO2 and 3% MgO.
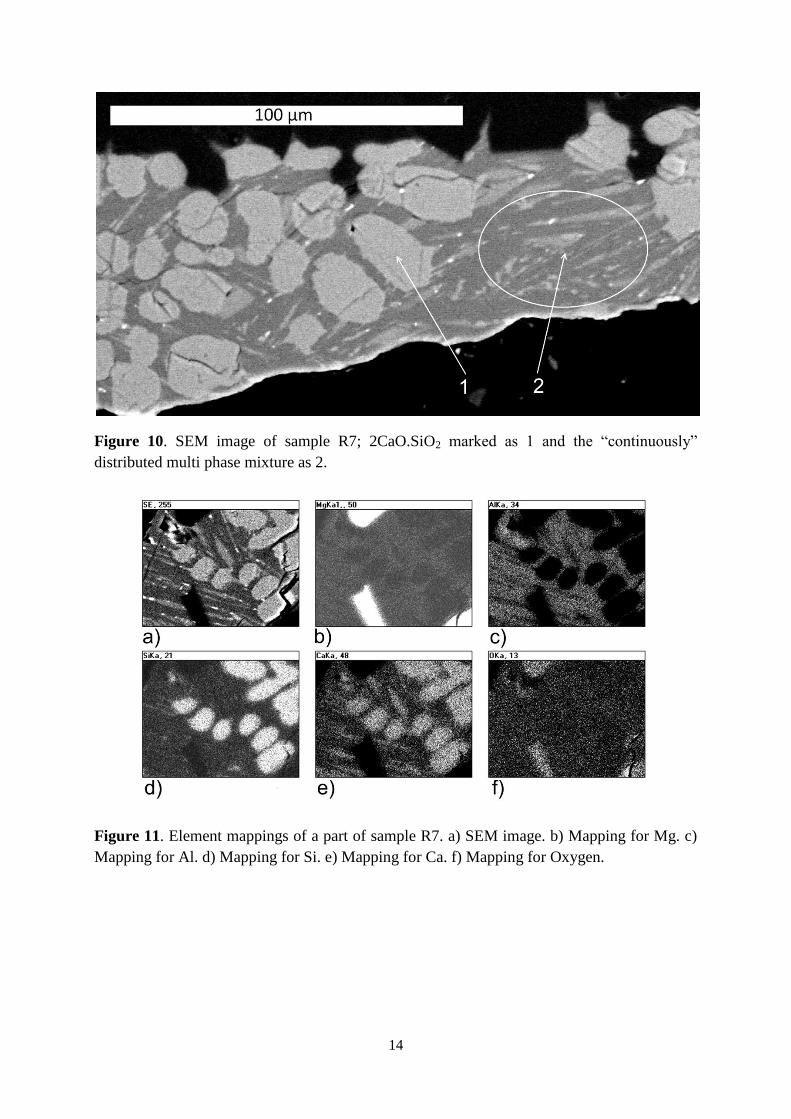
Samples R5 to R7 were all immersed in slag S2. Despite their different cooling rates, the
phases found are alike. As seen in figure 10 (sample R7), 2CaO.SiO2 particles are surrounded
by some ―continuously‖ distributed multi phase mixture. A mapping of this area is seen in
figure 11. It is likely that this multi phase mixture consists of at least 2 phases. The long
brighter phase in between the darker long phase has a composition close to 3CaO.Al2O3. This
―continuous‖ region has a very similar appearance as the multi phase mixture found in
samples R3 and R4.
An interesting observation for samples R5 to R7 is that most of the surface layer on the MgO
rod fell off just after they were removed from the furnace. The surface gradually turned to a
gray ―dust‖ during cooling. A XRD analysis of the dust indicated presence of 2CaO.SiO2.
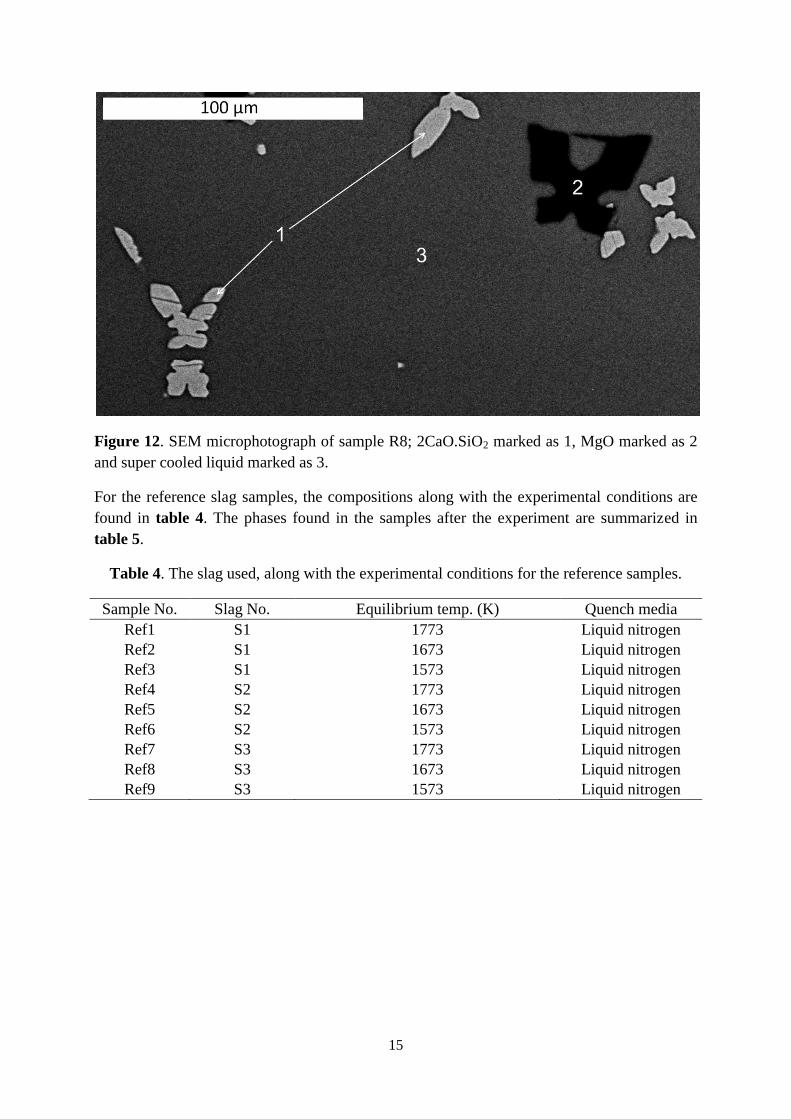
For samples R9 and R10, the microstructure is almost the same as samples R5 and R7. The
same dusting behavior was observed again. Sample R8 with the fastest cooling rate (10
K/min) consisted mostly of super cooled liquid and a minor portion of crystalline phases. Its
SEM microphotograph is shown in figure 12. As marked in the figure, the light gray phase is
2CaO.SiO2, the black phase is MgO and the continuous phase is super cooled liquid. Most of
the surface layer fell off to a dust in the case of samples R9 and R10, while sample R8 was
intact
In samples R11 to R13 the unreacted MgO rod was made from refractory cement. As the
relative density was below 50 %, it was highly porous. From the SEM-EDS examination, it
can be concluded that the porous rods have more or less the same microstructure and dusting
behavior as the respective dense rods. The porous structure was totally penetrated by slag. It
was also observed that there were almost no cracks inside the voids of the porous rods,
regardless whether the surface turned to a gray dust or not.
13
Figure 8. SEM microphotograph of sample R2; 2CaO.SiO2 marked as 1, MgO marked as 2,
super cooled liquid marked as 3,3CaO.Al2O3 as 4, and the MgO rod is marked as 5.
Figure 9. SEM microphotograph of sample R4; the long brighter phase (marked as 1) in
between the darker long phase (marked as 2) has a composition close to 3CaO.Al2O3; the
darker phase has a mean composition close to 46% CaO-46 % Al2O3-5% SiO2-3% MgO.
MgO particle marked as 5, 2CaO.SiO2 as 4 and the 3CaO.Al2O3 phase as 5.
14
Figure 10. SEM image of sample R7; 2CaO.SiO2 marked as 1 and the ―continuously‖
distributed multi phase mixture as 2.
Figure 11. Element mappings of a part of sample R7. a) SEM image. b) Mapping for Mg. c)
Mapping for Al. d) Mapping for Si. e) Mapping for Ca. f) Mapping for Oxygen.
15
Figure 12. SEM microphotograph of sample R8; 2CaO.SiO2 marked as 1, MgO marked as 2
and super cooled liquid marked as 3.
For the reference slag samples, the compositions along with the experimental conditions are
found in table 4. The phases found in the samples after the experiment are summarized in
table 5.
Table 4. The slag used, along with the experimental conditions for the reference samples.
Sample No. Slag No. Equilibrium temp. (K) Quench media
Ref1 S1 1773 Liquid nitrogen
Ref2 S1 1673 Liquid nitrogen
Ref3 S1 1573 Liquid nitrogen
Ref4 S2 1773 Liquid nitrogen
Ref5 S2 1673 Liquid nitrogen
Ref6 S2 1573 Liquid nitrogen
Ref7 S3 1773 Liquid nitrogen
Ref8 S3 1673 Liquid nitrogen
Ref9 S3 1573 Liquid nitrogen
16
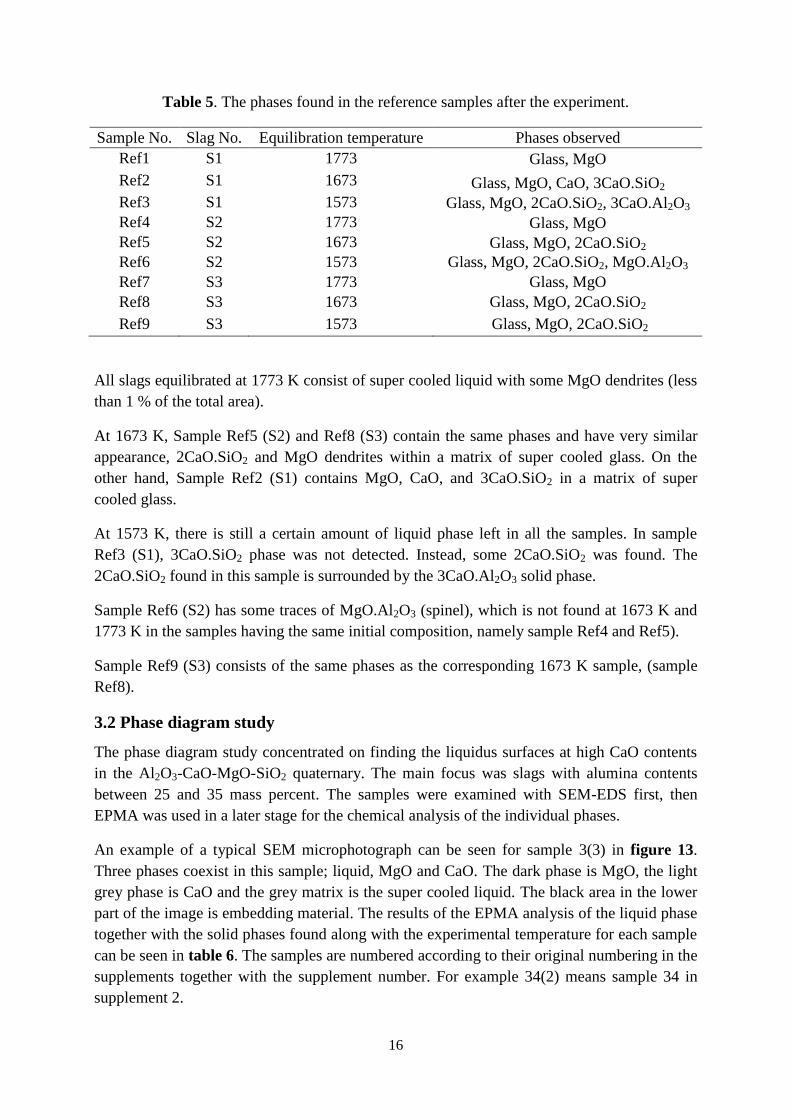
Table 5. The phases found in the reference samples after the experiment.
Sample No. Slag No. Equilibration temperature Phases observed
Ref1 S1 1773 Glass, MgO
Ref2 S1 1673 Glass, MgO, CaO, 3CaO.SiO2
Ref3 S1 1573 Glass, MgO, 2CaO.SiO2, 3CaO.Al2O3
Ref4 S2 1773 Glass, MgO
Ref5 S2 1673 Glass, MgO, 2CaO.SiO2
Ref6 S2 1573 Glass, MgO, 2CaO.SiO2, MgO.Al2O3
Ref7 S3 1773 Glass, MgO
Ref8 S3 1673 Glass, MgO, 2CaO.SiO2
Ref9 S3 1573 Glass, MgO, 2CaO.SiO2
All slags equilibrated at 1773 K consist of super cooled liquid with some MgO dendrites (less
than 1 % of the total area).
At 1673 K, Sample Ref5 (S2) and Ref8 (S3) contain the same phases and have very similar
appearance, 2CaO.SiO2 and MgO dendrites within a matrix of super cooled glass. On the
other hand, Sample Ref2 (S1) contains MgO, CaO, and 3CaO.SiO2 in a matrix of super
cooled glass.
At 1573 K, there is still a certain amount of liquid phase left in all the samples. In sample
Ref3 (S1), 3CaO.SiO2 phase was not detected. Instead, some 2CaO.SiO2 was found. The
2CaO.SiO2 found in this sample is surrounded by the 3CaO.Al2O3 solid phase.
Sample Ref6 (S2) has some traces of MgO.Al2O3 (spinel), which is not found at 1673 K and
1773 K in the samples having the same initial composition, namely sample Ref4 and Ref5).
Sample Ref9 (S3) consists of the same phases as the corresponding 1673 K sample, (sample
Ref8).
3.2 Phase diagram study
The phase diagram study concentrated on finding the liquidus surfaces at high CaO contents
in the Al2O3-CaO-MgO-SiO2 quaternary. The main focus was slags with alumina contents
between 25 and 35 mass percent. The samples were examined with SEM-EDS first, then
EPMA was used in a later stage for the chemical analysis of the individual phases.
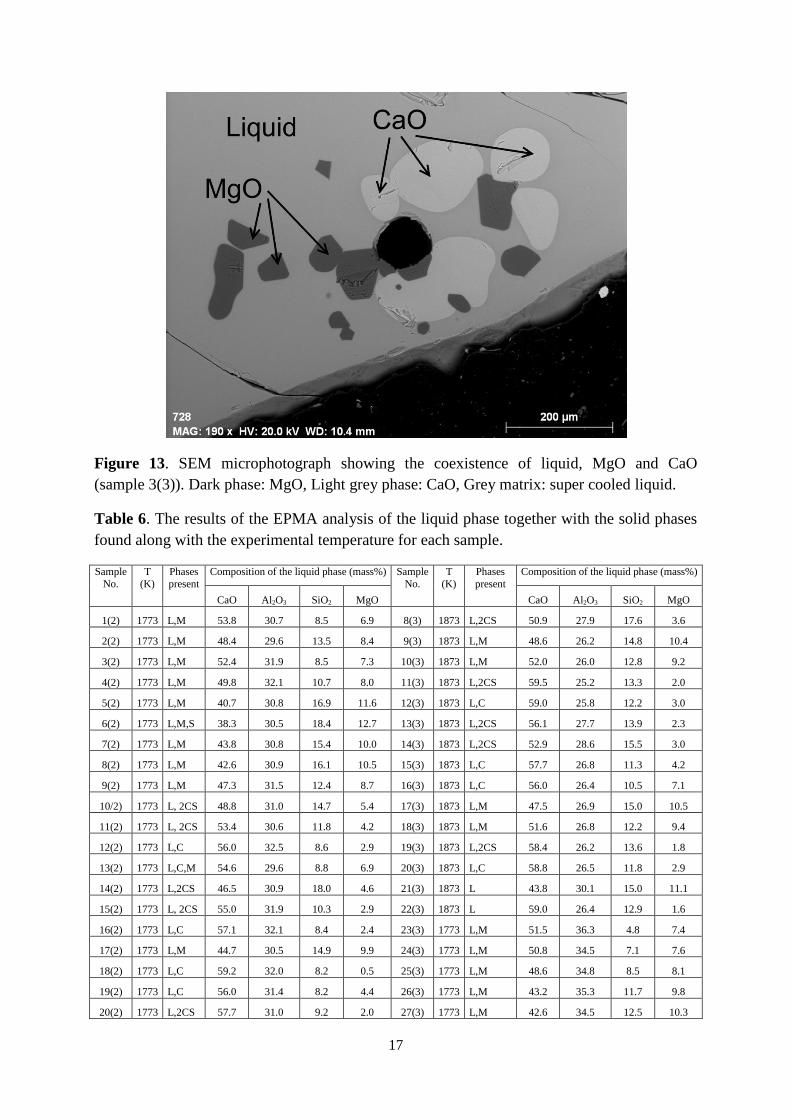
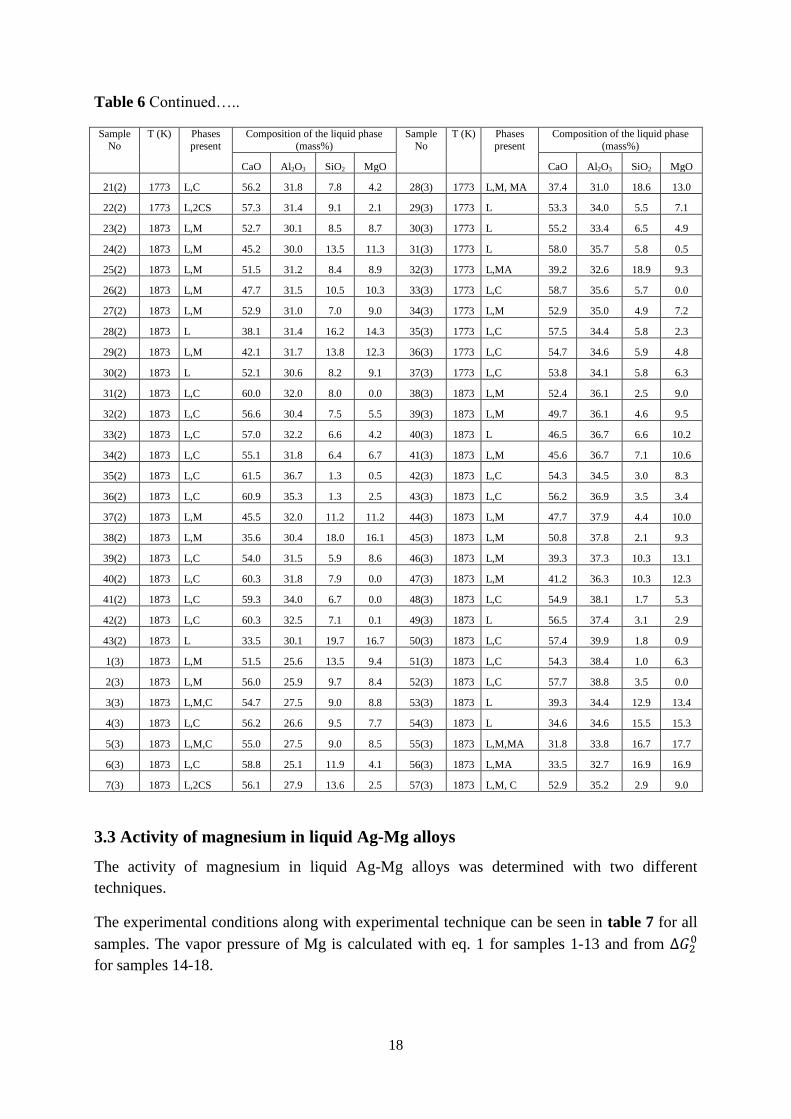
An example of a typical SEM microphotograph can be seen for sample 3(3) in figure 13.
Three phases coexist in this sample; liquid, MgO and CaO. The dark phase is MgO, the light
grey phase is CaO and the grey matrix is the super cooled liquid. The black area in the lower
part of the image is embedding material. The results of the EPMA analysis of the liquid phase
together with the solid phases found along with the experimental temperature for each sample
can be seen in table 6. The samples are numbered according to their original numbering in the
supplements together with the supplement number. For example 34(2) means sample 34 in
supplement 2.
17
Figure 13. SEM microphotograph showing the coexistence of liquid, MgO and CaO
(sample 3(3)). Dark phase: MgO, Light grey phase: CaO, Grey matrix: super cooled liquid.
Table 6. The results of the EPMA analysis of the liquid phase together with the solid phases
found along with the experimental temperature for each sample.
Sample
No.
T
(K)
Phases
present
Composition of the liquid phase (mass%) Sample
No.
T
(K)
Phases
present
Composition of the liquid phase (mass%)
CaO Al2O3 SiO2 MgO CaO Al2O3 SiO2 MgO
1(2) 1773 L,M 53.8 30.7 8.5 6.9 8(3) 1873 L,2CS 50.9 27.9 17.6 3.6
2(2) 1773 L,M 48.4 29.6 13.5 8.4 9(3) 1873 L,M 48.6 26.2 14.8 10.4
3(2) 1773 L,M 52.4 31.9 8.5 7.3 10(3) 1873 L,M 52.0 26.0 12.8 9.2
4(2) 1773 L,M 49.8 32.1 10.7 8.0 11(3) 1873 L,2CS 59.5 25.2 13.3 2.0
5(2) 1773 L,M 40.7 30.8 16.9 11.6 12(3) 1873 L,C 59.0 25.8 12.2 3.0
6(2) 1773 L,M,S 38.3 30.5 18.4 12.7 13(3) 1873 L,2CS 56.1 27.7 13.9 2.3
7(2) 1773 L,M 43.8 30.8 15.4 10.0 14(3) 1873 L,2CS 52.9 28.6 15.5 3.0
8(2) 1773 L,M 42.6 30.9 16.1 10.5 15(3) 1873 L,C 57.7 26.8 11.3 4.2
9(2) 1773 L,M 47.3 31.5 12.4 8.7 16(3) 1873 L,C 56.0 26.4 10.5 7.1
10/2) 1773 L, 2CS 48.8 31.0 14.7 5.4 17(3) 1873 L,M 47.5 26.9 15.0 10.5
11(2) 1773 L, 2CS 53.4 30.6 11.8 4.2 18(3) 1873 L,M 51.6 26.8 12.2 9.4
12(2) 1773 L,C 56.0 32.5 8.6 2.9 19(3) 1873 L,2CS 58.4 26.2 13.6 1.8
13(2) 1773 L,C,M 54.6 29.6 8.8 6.9 20(3) 1873 L,C 58.8 26.5 11.8 2.9
14(2) 1773 L,2CS 46.5 30.9 18.0 4.6 21(3) 1873 L 43.8 30.1 15.0 11.1
15(2) 1773 L, 2CS 55.0 31.9 10.3 2.9 22(3) 1873 L 59.0 26.4 12.9 1.6
16(2) 1773 L,C 57.1 32.1 8.4 2.4 23(3) 1773 L,M 51.5 36.3 4.8 7.4
17(2) 1773 L,M 44.7 30.5 14.9 9.9 24(3) 1773 L,M 50.8 34.5 7.1 7.6
18(2) 1773 L,C 59.2 32.0 8.2 0.5 25(3) 1773 L,M 48.6 34.8 8.5 8.1
19(2) 1773 L,C 56.0 31.4 8.2 4.4 26(3) 1773 L,M 43.2 35.3 11.7 9.8
20(2) 1773 L,2CS 57.7 31.0 9.2 2.0 27(3) 1773 L,M 42.6 34.5 12.5 10.3
18
Table 6 Continued…..
Sample
No
T (K) Phases
present
Composition of the liquid phase
(mass%)
Sample
No
T (K) Phases
present
Composition of the liquid phase
(mass%)
CaO Al2O3 SiO2 MgO CaO Al2O3 SiO2 MgO
21(2) 1773 L,C 56.2 31.8 7.8 4.2 28(3) 1773 L,M, MA 37.4 31.0 18.6 13.0
22(2) 1773 L,2CS 57.3 31.4 9.1 2.1 29(3) 1773 L 53.3 34.0 5.5 7.1
23(2) 1873 L,M 52.7 30.1 8.5 8.7 30(3) 1773 L 55.2 33.4 6.5 4.9
24(2) 1873 L,M 45.2 30.0 13.5 11.3 31(3) 1773 L 58.0 35.7 5.8 0.5
25(2) 1873 L,M 51.5 31.2 8.4 8.9 32(3) 1773 L,MA 39.2 32.6 18.9 9.3
26(2) 1873 L,M 47.7 31.5 10.5 10.3 33(3) 1773 L,C 58.7 35.6 5.7 0.0
27(2) 1873 L,M 52.9 31.0 7.0 9.0 34(3) 1773 L,M 52.9 35.0 4.9 7.2
28(2) 1873 L 38.1 31.4 16.2 14.3 35(3) 1773 L,C 57.5 34.4 5.8 2.3
29(2) 1873 L,M 42.1 31.7 13.8 12.3 36(3) 1773 L,C 54.7 34.6 5.9 4.8
30(2) 1873 L 52.1 30.6 8.2 9.1 37(3) 1773 L,C 53.8 34.1 5.8 6.3
31(2) 1873 L,C 60.0 32.0 8.0 0.0 38(3) 1873 L,M 52.4 36.1 2.5 9.0
32(2) 1873 L,C 56.6 30.4 7.5 5.5 39(3) 1873 L,M 49.7 36.1 4.6 9.5
33(2) 1873 L,C 57.0 32.2 6.6 4.2 40(3) 1873 L 46.5 36.7 6.6 10.2
34(2) 1873 L,C 55.1 31.8 6.4 6.7 41(3) 1873 L,M 45.6 36.7 7.1 10.6
35(2) 1873 L,C 61.5 36.7 1.3 0.5 42(3) 1873 L,C 54.3 34.5 3.0 8.3
36(2) 1873 L,C 60.9 35.3 1.3 2.5 43(3) 1873 L,C 56.2 36.9 3.5 3.4
37(2) 1873 L,M 45.5 32.0 11.2 11.2 44(3) 1873 L,M 47.7 37.9 4.4 10.0
38(2) 1873 L,M 35.6 30.4 18.0 16.1 45(3) 1873 L,M 50.8 37.8 2.1 9.3
39(2) 1873 L,C 54.0 31.5 5.9 8.6 46(3) 1873 L,M 39.3 37.3 10.3 13.1
40(2) 1873 L,C 60.3 31.8 7.9 0.0 47(3) 1873 L,M 41.2 36.3 10.3 12.3
41(2) 1873 L,C 59.3 34.0 6.7 0.0 48(3) 1873 L,C 54.9 38.1 1.7 5.3
42(2) 1873 L,C 60.3 32.5 7.1 0.1 49(3) 1873 L 56.5 37.4 3.1 2.9
43(2) 1873 L 33.5 30.1 19.7 16.7 50(3) 1873 L,C 57.4 39.9 1.8 0.9
1(3) 1873 L,M 51.5 25.6 13.5 9.4 51(3) 1873 L,C 54.3 38.4 1.0 6.3
2(3) 1873 L,M 56.0 25.9 9.7 8.4 52(3) 1873 L,C 57.7 38.8 3.5 0.0
3(3) 1873 L,M,C 54.7 27.5 9.0 8.8 53(3) 1873 L 39.3 34.4 12.9 13.4
4(3) 1873 L,C 56.2 26.6 9.5 7.7 54(3) 1873 L 34.6 34.6 15.5 15.3
5(3) 1873 L,M,C 55.0 27.5 9.0 8.5 55(3) 1873 L,M,MA 31.8 33.8 16.7 17.7
6(3) 1873 L,C 58.8 25.1 11.9 4.1 56(3) 1873 L,MA 33.5 32.7 16.9 16.9
7(3) 1873 L,2CS 56.1 27.9 13.6 2.5 57(3) 1873 L,M, C 52.9 35.2 2.9 9.0
3.3 Activity of magnesium in liquid Ag-Mg alloys
The activity of magnesium in liquid Ag-Mg alloys was determined with two different
techniques.
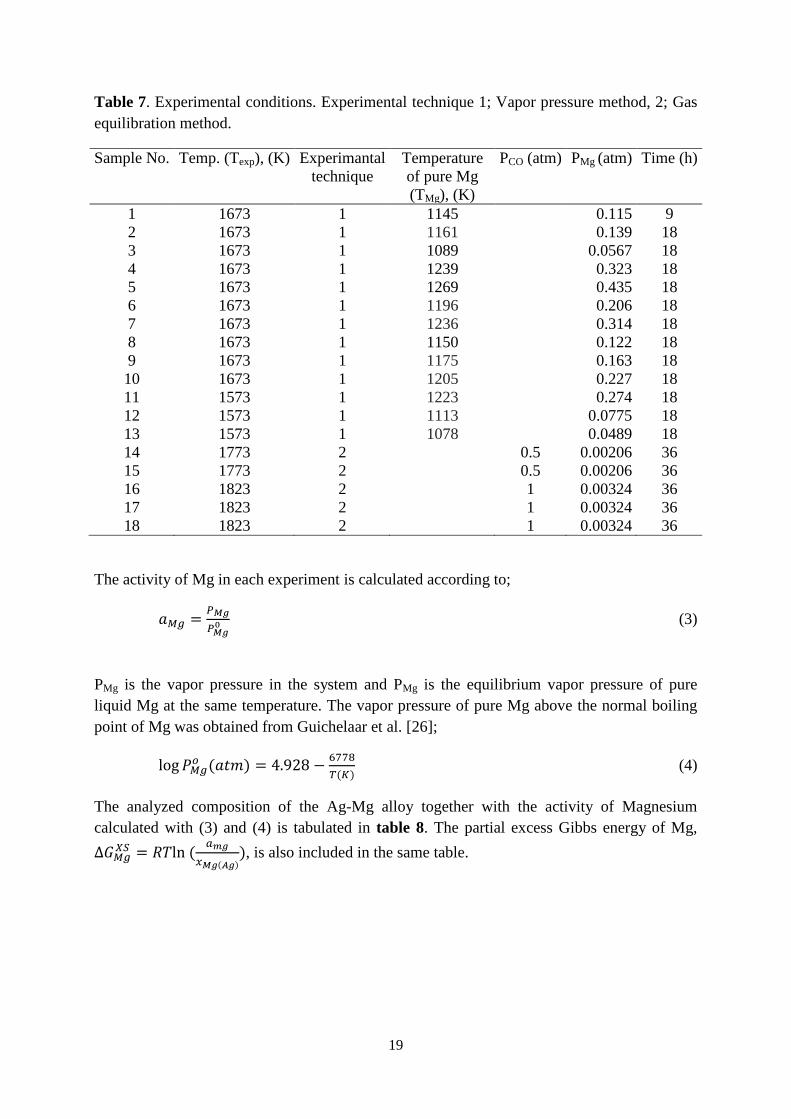
The experimental conditions along with experimental technique can be seen in table 7 for all
samples. The vapor pressure of Mg is calculated with eq. 1 for samples 1-13 and from
for samples 14-18.
19
Table 7. Experimental conditions. Experimental technique 1; Vapor pressure method, 2; Gas
equilibration method.
Sample No. Temp. (Texp), (K) Experimantal
technique
Temperature
of pure Mg
(TMg), (K)
PCO (atm) PMg (atm) Time (h)
1 1673 1 1145
0.115 9
2 1673 1 1161
0.139 18
3 1673 1 1089
0.0567 18
4 1673 1 1239
0.323 18
5 1673 1 1269
0.435 18
6 1673 1 1196
0.206 18
7 1673 1 1236
0.314 18
8 1673 1 1150
0.122 18
9 1673 1 1175
0.163 18
10 1673 1 1205
0.227 18
11 1573 1 1223
0.274 18
12 1573 1 1113
0.0775 18
13 1573 1 1078
0.0489 18
14 1773 2
0.5 0.00206 36
15 1773 2
0.5 0.00206 36
16 1823 2
1 0.00324 36
17 1823 2
1 0.00324 36
18 1823 2
1 0.00324 36
The activity of Mg in each experiment is calculated according to;
(3)
PMg is the vapor pressure in the system and PMg is the equilibrium vapor pressure of pure
liquid Mg at the same temperature. The vapor pressure of pure Mg above the normal boiling
point of Mg was obtained from Guichelaar et al. [26];
(4)
The analyzed composition of the Ag-Mg alloy together with the activity of Magnesium
calculated with (3) and (4) is tabulated in table 8. The partial excess Gibbs energy of Mg,
, is also included in the same table.
20
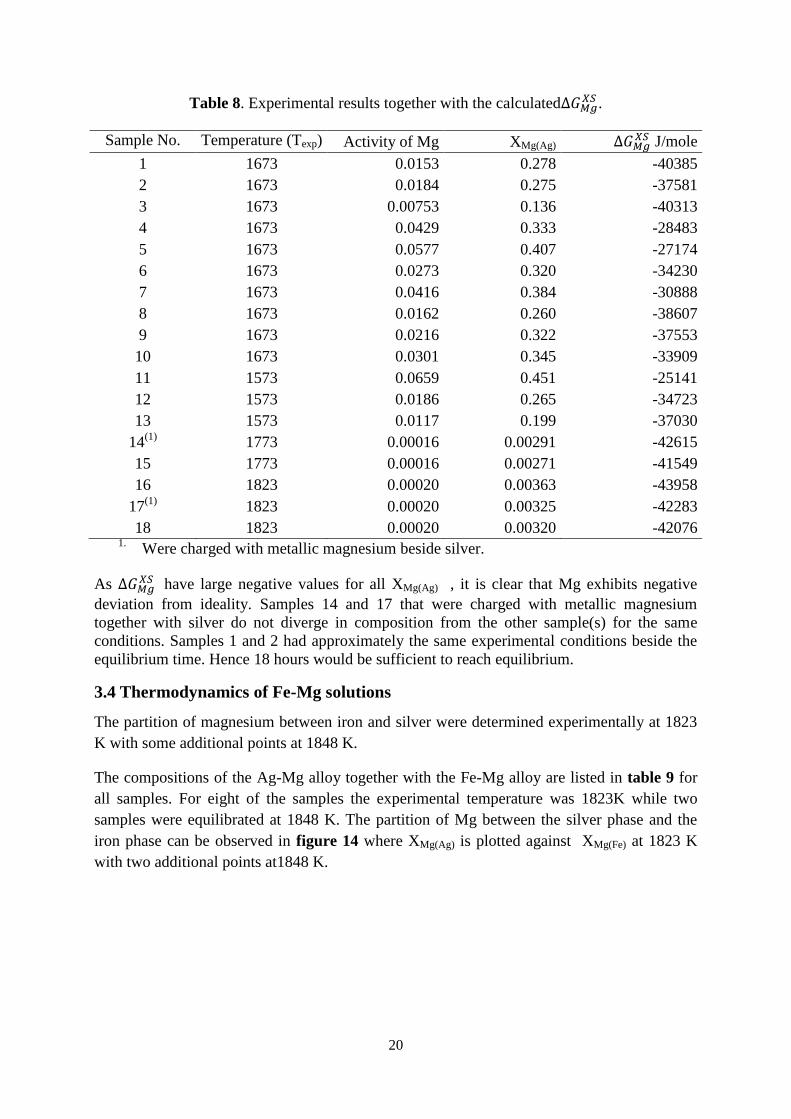
Table 8. Experimental results together with the calculated .
Sample No. Temperature (Texp) Activity of Mg XMg(Ag) J/mole
1 1673 0.0153 0.278 -40385
2 1673 0.0184 0.275 -37581
3 1673 0.00753 0.136 -40313
4 1673 0.0429 0.333 -28483
5 1673 0.0577 0.407 -27174
6 1673 0.0273 0.320 -34230
7 1673 0.0416 0.384 -30888
8 1673 0.0162 0.260 -38607
9 1673 0.0216 0.322 -37553
10 1673 0.0301 0.345 -33909
11 1573 0.0659 0.451 -25141
12 1573 0.0186 0.265 -34723
13 1573 0.0117 0.199 -37030
14(1)
1773 0.00016 0.00291 -42615
15 1773 0.00016 0.00271 -41549
16 1823 0.00020 0.00363 -43958
17(1)
1823 0.00020 0.00325 -42283
18 1823 0.00020 0.00320 -42076 1. Were charged with metallic magnesium beside silver.
As
have large negative values for all XMg(Ag) , it is clear that Mg exhibits negative
deviation from ideality. Samples 14 and 17 that were charged with metallic magnesium
together with silver do not diverge in composition from the other sample(s) for the same
conditions. Samples 1 and 2 had approximately the same experimental conditions beside the
equilibrium time. Hence 18 hours would be sufficient to reach equilibrium.
3.4 Thermodynamics of Fe-Mg solutions
The partition of magnesium between iron and silver were determined experimentally at 1823
K with some additional points at 1848 K.
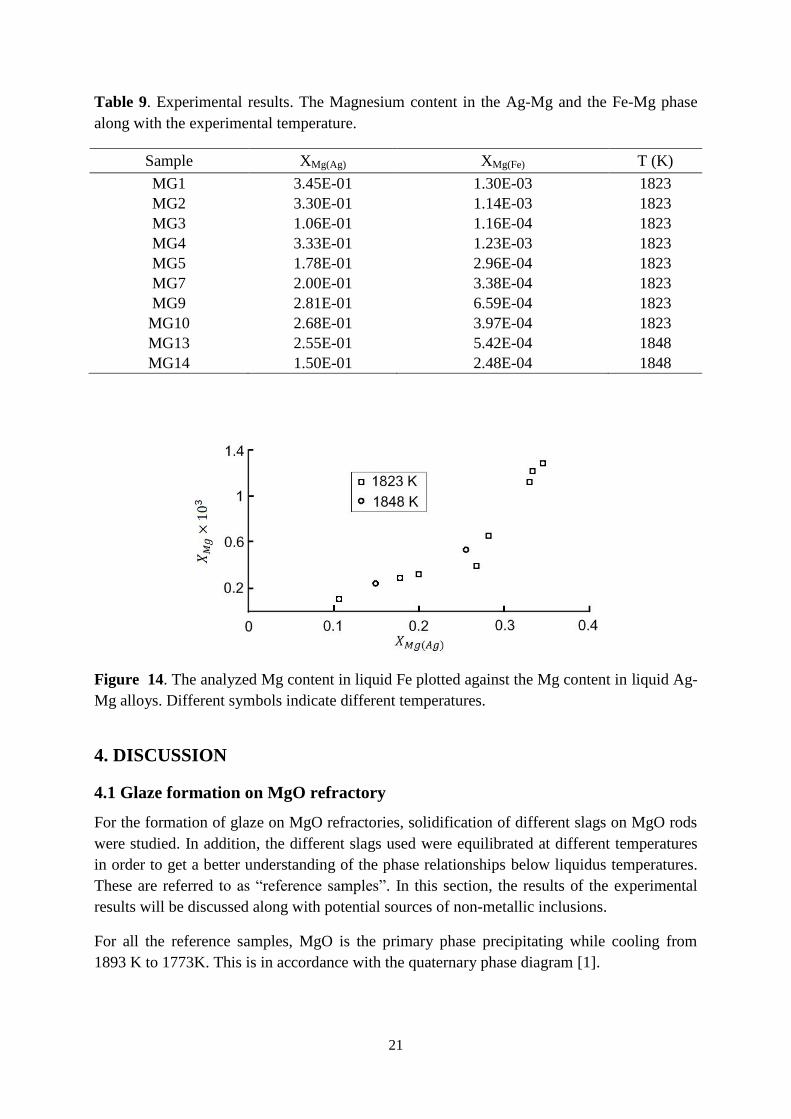
The compositions of the Ag-Mg alloy together with the Fe-Mg alloy are listed in table 9 for
all samples. For eight of the samples the experimental temperature was 1823K while two
samples were equilibrated at 1848 K. The partition of Mg between the silver phase and the
iron phase can be observed in figure 14 where XMg(Ag) is plotted against XMg(Fe) at 1823 K
with two additional points at1848 K.
21
Table 9. Experimental results. The Magnesium content in the Ag-Mg and the Fe-Mg phase
along with the experimental temperature.
Sample XMg(Ag) XMg(Fe) T (K)
MG1 3.45E-01 1.30E-03 1823
MG2 3.30E-01 1.14E-03 1823
MG3 1.06E-01 1.16E-04 1823
MG4 3.33E-01 1.23E-03 1823
MG5 1.78E-01 2.96E-04 1823
MG7 2.00E-01 3.38E-04 1823
MG9 2.81E-01 6.59E-04 1823
MG10 2.68E-01 3.97E-04 1823
MG13 2.55E-01 5.42E-04 1848
MG14 1.50E-01 2.48E-04 1848
Figure 14. The analyzed Mg content in liquid Fe plotted against the Mg content in liquid Ag-
Mg alloys. Different symbols indicate different temperatures.
4. DISCUSSION
4.1 Glaze formation on MgO refractory
For the formation of glaze on MgO refractories, solidification of different slags on MgO rods
were studied. In addition, the different slags used were equilibrated at different temperatures
in order to get a better understanding of the phase relationships below liquidus temperatures.
These are referred to as ―reference samples‖. In this section, the results of the experimental
results will be discussed along with potential sources of non-metallic inclusions.
For all the reference samples, MgO is the primary phase precipitating while cooling from
1893 K to 1773K. This is in accordance with the quaternary phase diagram [1].
22
In the case of slag composition S1, CaO and 3CaO.SiO2 precipitate when it is cooled from
1773 K to 1673 K. Further lowering the temperature from 1673 K to 1573 K leads to the
vanishing of the 3CaO.SiO2 and CaO phases and the formation of 2CaO.SiO2 and
3CaO.Al2O3. It is very difficult to reveal the phase transformation(s) in this process. The
following peritectic reactions (5 and 6) could be a possible explanation for the change of
phase relationship from 1673 K to 1573K.
(5)
(6)
In the case of slag composition S2, only one more phase beside MgO, viz. 2CaO.SiO2
precipitates when the sample is cooled from 1773 K to 1673 K. Spinel phase is formed when
the sample temperature is brought down from 1673 K to 1573 K.
Slag composition S3 behaves similarly as S2 when cooled from 1773 K to 1673 K. The
lowering of temperature results in the precipitation of 2CaO.SiO2. On the other hand, unlike
composition S2 the same phases retain when the sample is equilibrated at 1573 K.
4.1.1 Phases present after the MgO-rod immersion
For samples R1 and R2, which have been immersed in slag S1 it is evident that 3CaO.Al2O3
is the major phase present. It exists in the form of big pieces around 100 um. As 2CaO.SiO2
can be observed both inside the 3CaO.Al2O3 and in the remaining liquid, it is reasonable to
believe that the precipitation of this phase occurs before 3CaO.Al2O3. A comparison of table 3
and table 5 shows that the phases found on the MgO rods R1 and R2 are identical with the
equilibrium phases found in the S1 sample quenched from 1573 K (Ref3). In fact, the cooling
rate of the inner ladle wall is expected to be in the range very similar as the cooling rates of
R1 and R2. This comparison would suggest that the adhered layer on the ladle lining during
casting is likely to have the same phases as the equilibrium phases down to the temperature of
1573 K. Since the slag is usually not saturated with MgO, the dissolution of MgO into the
adhering layer would take place at high temperatures. On the other hand, as indicated in table
5, MgO is the first phase precipitating during cooling in all slag samples, even at 1773 K. It
is expected that the time for the MgO dissolution process is very short (only a few minutes).
Moreover, the dissolved MgO would precipitate when the temperature decreases. The limited
dissolution in short time and the MgO precipitation would explain the same phases found on
R1, R2 and Ref3.
Table 5 shows that the cooling rate has no appreciable impact on the MgO rods that was
immersed in slag S2. The 3 samples, viz. R5, R6 and R7 have very similar behavior and same
phases. The higher SiO2 content in the slag (S2) would explain the major phase 2CaO.SiO2 in
these three samples. Note that the liquid phase is no longer found in samples R5-R7. The
vanishing of the liquid phase is expected at such a low temperature (1373 K). However, in
contradiction with Ref6, no MgO.Al2O3 spinel phase is detected in these three samples. It is
less likely that the spinel phase vanishes below 1573 K. A plausible explanation would be the
slight change of the total liquid composition attached to the rods due to MgO dissolution. An
23
increase of MgO content in the total composition might shift the phase relationship. Instead of
MgO.Al2O3 spinel phase, MgO is stable with higher MgO content
The rods immersed in slag S3 behave differently. The rod cooled down to 1373 K at 10 K/min
has liquid phase, but no ―multi phase region‖, while the other rods cooled with lower rates
show a contradictory behavior (the ―multi phase region‖ presents instead of liquid). R8 does
not show crack and dust. On the other hand, rods R9 and R10 both crack and dust. In fact, the
retaining of liquid phase in rod R8 prevents the sample from cracking and dusting. It is
interesting to see that slag S3 only differs slight in composition in comparison with S2. The
slight difference in slag composition along with cooling rate would lead to very different
glaze layer on the ladle wall. A comparison between table 3 and table 5 also shows that
3CaO.Al2O3 precipitates and liquid phase vanishes below 1573 K.
The multi phase mixture found in samples R3 to R7 and R9 to R13 consists of large dark
crystals mixed with a brighter phase. As this region is somewhat continuous, the phases in this
region must have precipitated after the calcium silicate. The EDS analysis indicates that the
darker regions have a composition close to 12CaO.7Al2O3 and the brighter phase
3CaO.Al2O3. As seen in figure 11, some parts seem to be richer in silica also, indicating that
this region might consist of more than two phases.
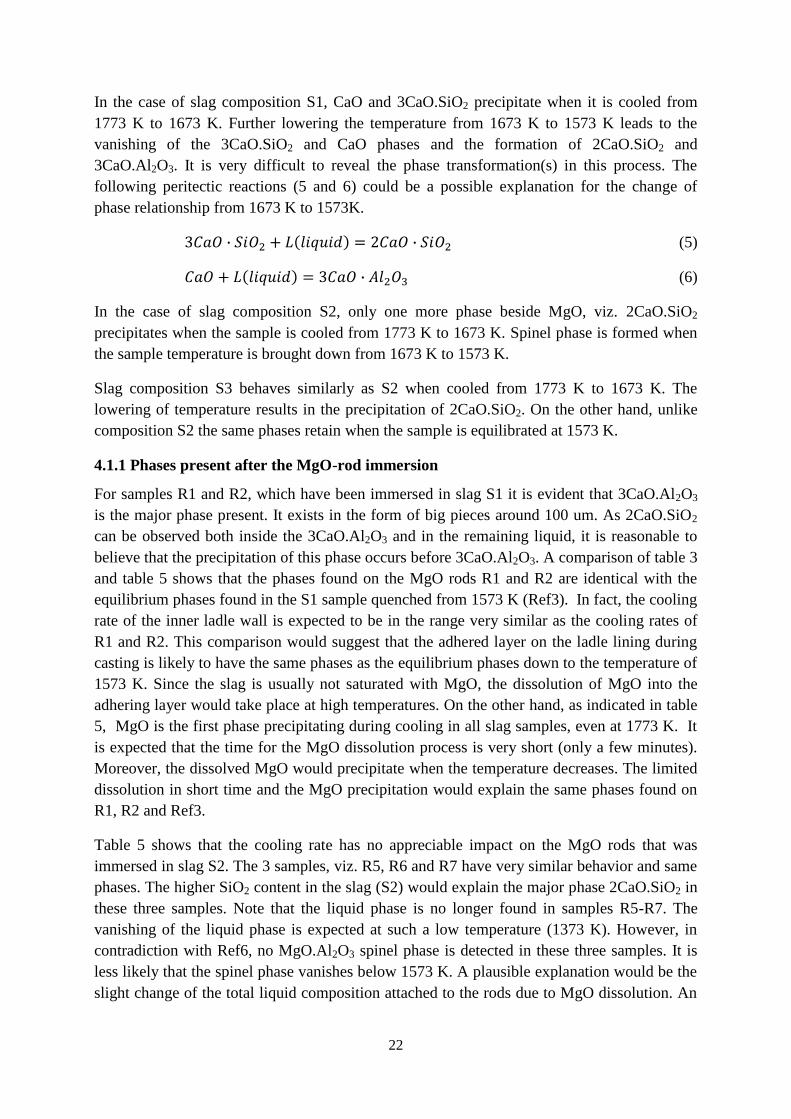
The MgO content after primary precipitation is low (generally below 3 mass %). In order to
simplify the discussion, the solidification path at lower temperatures is discussed using the
ternary CaO-Al2O3-SiO2 phase diagram [27], (see figure15).
Figure 15. The CaO corner of the CaO-Al2O3-SiO2 phase diagram [27]. Arrow A indicates
the phase border between 2CaO.SiO2 and 3CaO.Al2O3. Arrow B indicates the 4-phase
equilibrium between liquid, 2CaO.SiO2, 3CaO.Al2O3 and 12CaO.7Al2O3. Cross 1 and 2
indicate the two possible compositions when the melt reaches the 2CaO.SiO2 liquidus surface.
When the molten slag composition hits the 2CaO.SiO2 surface at point 1, the liquid
composition will move towards line A, to company the precipitation of 2CaO.SiO2. When the
liquid reaches the binary eutectic valley A, 3CaO.Al2O3 will precipitate together with
24
2CaO.SiO2 until the invariant point B is reached. If the molten slag hits the 2CaO.SiO2
surface at point 2, the composition will go more or less directly to the invariant point B,
without going to the binary eutectic first. This illustrates the difference in the amount of
3CaO.Al2O3 between the samples. It also indicates that the last liquid at point B will solidify
according to (7).
(7)
This discussion would qualitatively explain the microstructure of the multi phase region in
samples R3-R7 and R9-R13. The darker phase is 12CaO.Al2O3 and the brighter one is
3CaO.Al2O3.
Any 2CaO.SiO2 phase cannot be spotted in this region from the SEM image, although the
mapping results shown in figure 11 indicate some silica rich parts within this region. In the
samples where super cooled liquid still remains, no reactions at the invariant point occurred,
despite the fact that the invariant point lies well above 1573 K in the ternary system. The
presence of a small amount of dissolved MgO might shift the invariant point to lower
temperatures. This is seen in the reference samples where substantial amounts of liquid still
remains at 1573 K.
As mentioned in the result part, the phases detected in the porous rods, namely R11, R12 and
R13 are identical with that found in the corresponding rods having the same termination
temperatures of slow-cooling. The higher porosity would enhance the penetration of the slag
into the rod. Hence, the dissolution of MgO into the slag at high temperatures is more
profound. On the other hand, MgO would precipitate when the temperature decreases. The
results shown in table 4 suggest that the dissolution of MgO in the pores of the MgO rod have
little effect on the phases during cooling.
4.1.2 Dusting and cracks
The presence of cracks in the solidified layer has a clear correlation to the presence of the
remaining liquid phase. In all the samples in which liquid phase still remaining, (R1, R2 and
R8), no obvious cracks is detected in the layer. In most of samples without liquid phase,
cracks can be spotted, more or less in the tangential direction. This implies that the presence
of super cooled liquid prevents the initiation or propagation of the cracks
In samples R5 to R7, R9 to R10 and R12 to R13, the surface turned to a gray dust while
cooling. The common factors shared by these samples are the existence of a substantial
amount of calcium silicate particles and the absence of liquid phase. All samples dusting have
2CaO.SiO2 as the major solid phase. At mean time, all samples having liquid phase do not
show dusting behavior. For example, in sample R8 that has 2CaO.SiO2 and also liquid phase,
no ―dusting‖ was observed.
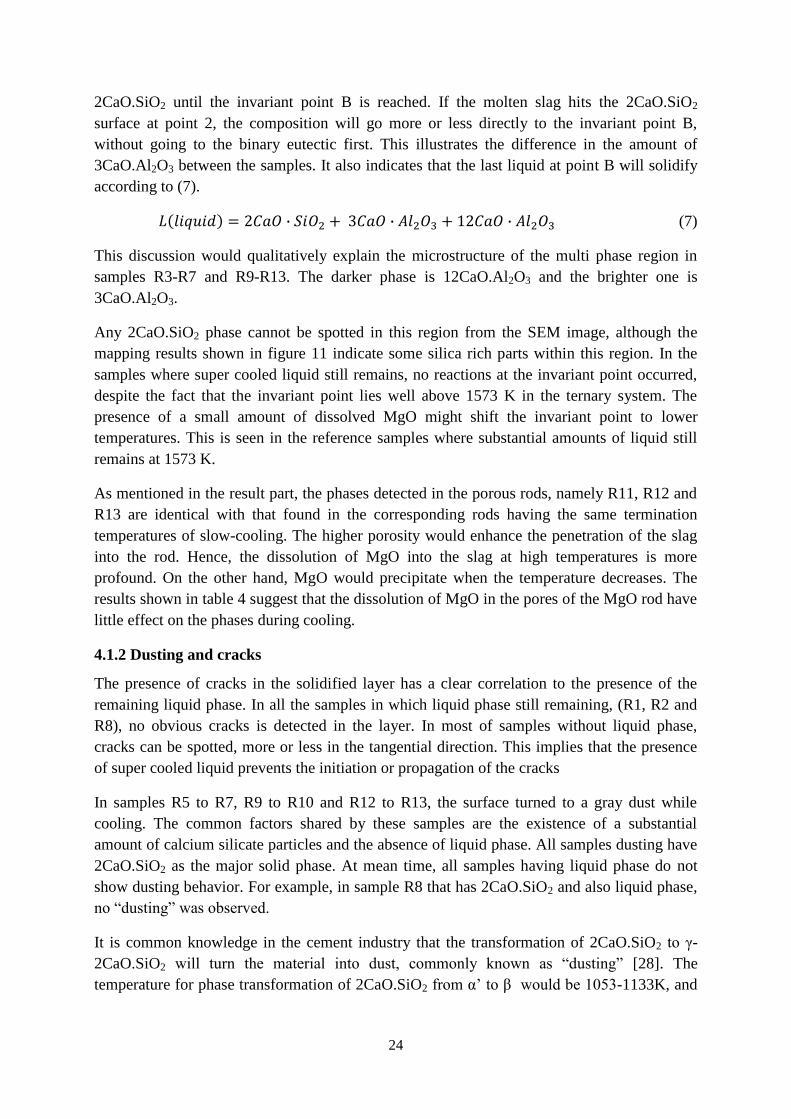
It is common knowledge in the cement industry that the transformation of 2CaO.SiO2 to γ-
2CaO.SiO2 will turn the material into dust, commonly known as ―dusting‖ [28]. The
temperature for phase transformation of 2CaO.SiO2 from α‘ to β would be 1053-1133K, and
25
<773 K for the β→ γ. [28].This implies that the transformation to γ-2CaO.SiO2 occurs after
withdrawing the sample from the furnace.
4.1.3 Potential source for exogenous inclusions
Ladle slag attached to the refractory material from the earlier heat has previously been
reported as an important source of inclusion formation in steel.[16-21]
The present results show that the slag lining reactions can indeed be a potential source for the
exogenous inclusions during ladle treatment. The following mechanisms could be expected.
(i) The glassy phase with solid particles embedded within it (found in sample R1, R2
and R8), is peeled off due to heavy stirring practice and is entrained in the steel.
(ii) Physical detachment of solid particles without any continuous glass phase (found
in sample R3 –R7 and R9-R13).
(iii) Dusting (found in samples R5-R7, R9-R10 and R12-R13) and cracks in the
solidified layer create particles of small sizes that might be entrained in the liquid
steel in the next heat.
It should be pointed out that the continuous glassy layer would be melted directly when the
molten steel is tapped into the ladle and separated to the top slag. On the other hand, the liquid
phase inside the pores of the MgO matrix might have good opportunity to remain under the
surface layer. Some of the solid particles encountered in this study have a quite high melting
point, and some of them have a melting point much lower than the liquid steel. For example,
12CaO.7Al2O3 that is found in most samples in the ―multi phase region‖ has a melting point
of 1673 K, which implies that this phase will melt as the molten steel is tapped into the ladle.
This complicates further the situation. Nevertheless, too strong stirring during ladle treatment
would possibly entrain some tiny particles, droplets and even their combination from the
MgO matrix. Again, bigger particles and droplets would float up, while the droplets and
particles in micro sizes would stay in the steel as exogenous inclusions. Since the pores of the
MgO matrix could be very small, the continuous entrainment of tiny particles or droplets is
favorable.
The present study shows evidently that slight difference in composition of the ladle slag
would lead to different products in the MgO matrix. For example, the rods immersed in S1
behave very differently from the rods immersed in S2. It is possible to control the
composition of the ladle slag in order to control the behavior of the ladle glaze. For example,
to retain the super cooled liquid in the glaze layer the following alternative could be
considered.
i) Make sure that the slag has a composition that will precipitate as little 2CaO.SiO2
and 3CaO.Al2O3 as possible before it reaches the invariant point between
2CaO.SiO2, 3CaO.Al2O3 and 12CaO.7Al2O3. This will both minimize the number
of particles and give fewer points for heterogonous nucleation of other phases
below the invariant point.
ii) Increase the cooling speed of the lining to retard the precipitation of compounds
and promote glass forming.
26
As the slag composition in the ladle refining station is primary based on sulphide capacity and
oxygen potential etc, it can be a disadvantage to change the slag composition according to the
above points. On the other hand, the slag composition could be adjusted late in the process,
just before casting, in order to avoid these problems.
However, it is still not well known whether the crack formation and dusting are favorable for
the formation of inclusions or unfavorable. It is also unknown regarding the functioning of the
liquid phase in the glaze layer. These aspects would require further in-depth study before any
suggestion regarding the optimization of the ladle slag.
4.2 Phase diagram study
The phase diagram study aimed at finding the liquidus surfaces in the high basicity region of
the Al2O3-CaO-MgO-SiO2 quaternary system at steelmaking temperatures. In this discussion,
constructed phase diagrams are discussed and compared with existing phase diagrams. In
addition, the activities of CaO, MgO and Al2O3 are evaluated based on the phase diagram
information.
4.2.1 Presentation of the liquidus lines
In the preparation of the samples, all the compositions have been aimed at in either the 25, 30
or 35 mass% Al2O3 section. However, as none of the experimental points lies exactly on these
sections, a normalization of the sample composition is necessary for the visual presentation.
The normalization is done according to the following procedure: the alumina content is
adjusted to 25, 30 or 35 mass %, while the compositions of the rest of the components are
normalized in proportion to their original fractions with their sum being either 65, 70 or 75
mass%. As the normalized composition will shift away from the true liquidus surface of the
tetrahedron, only the points with a moderate deviation (up to ± 2.5 mass % Al2O3) are
considered in the graphical presentation. Note that readers should use the data in table 6, if
any thermodynamic calculation is carried out.
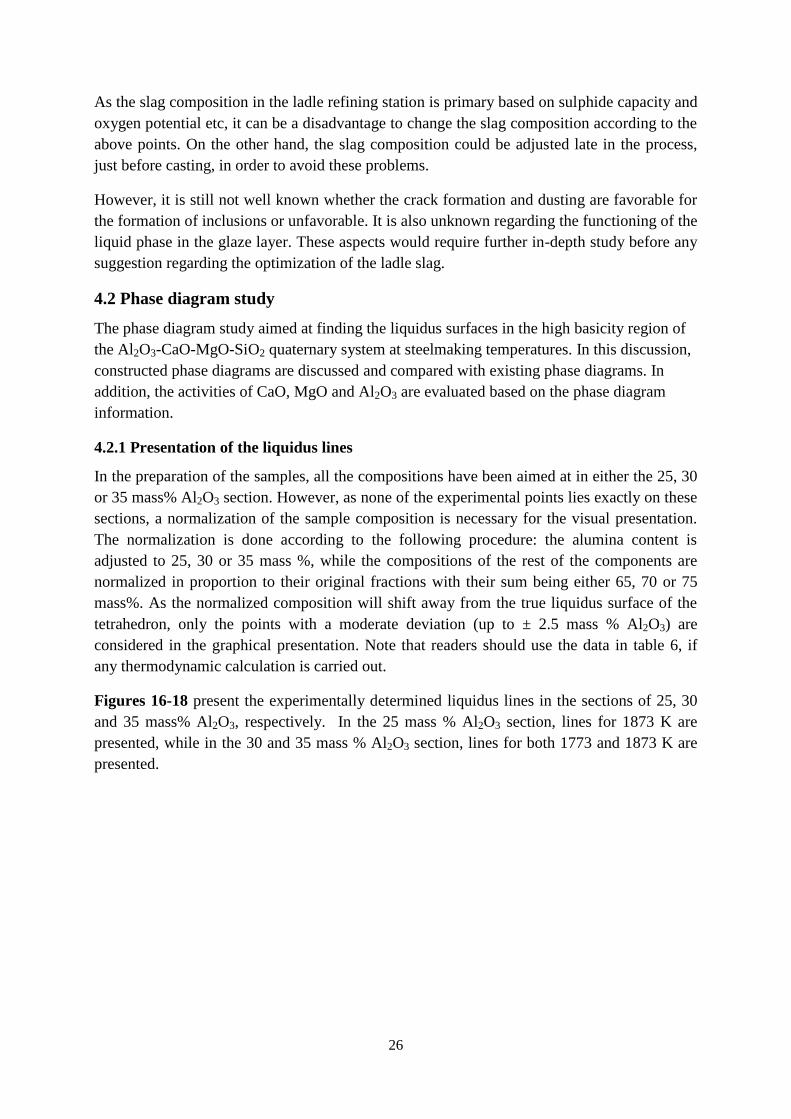
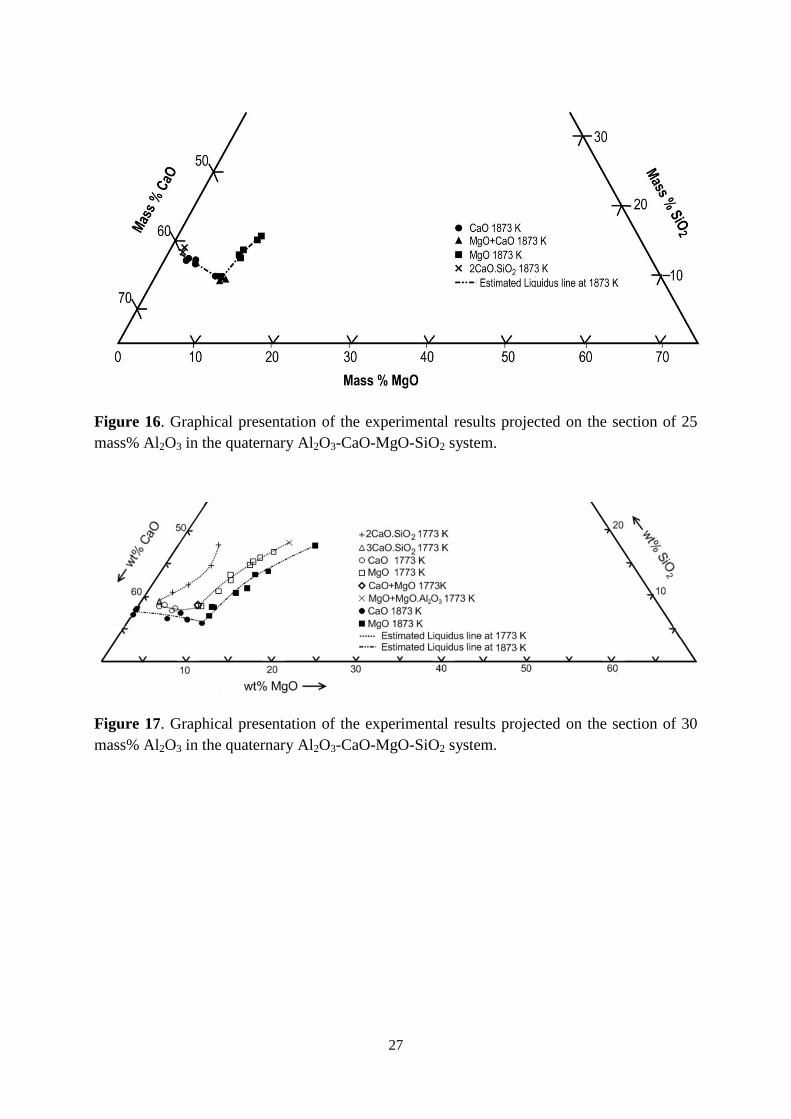
Figures 16-18 present the experimentally determined liquidus lines in the sections of 25, 30
and 35 mass% Al2O3, respectively. In the 25 mass % Al2O3 section, lines for 1873 K are
presented, while in the 30 and 35 mass % Al2O3 section, lines for both 1773 and 1873 K are
presented.
27
Figure 16. Graphical presentation of the experimental results projected on the section of 25
mass% Al2O3 in the quaternary Al2O3-CaO-MgO-SiO2 system.
Figure 17. Graphical presentation of the experimental results projected on the section of 30
mass% Al2O3 in the quaternary Al2O3-CaO-MgO-SiO2 system.
28
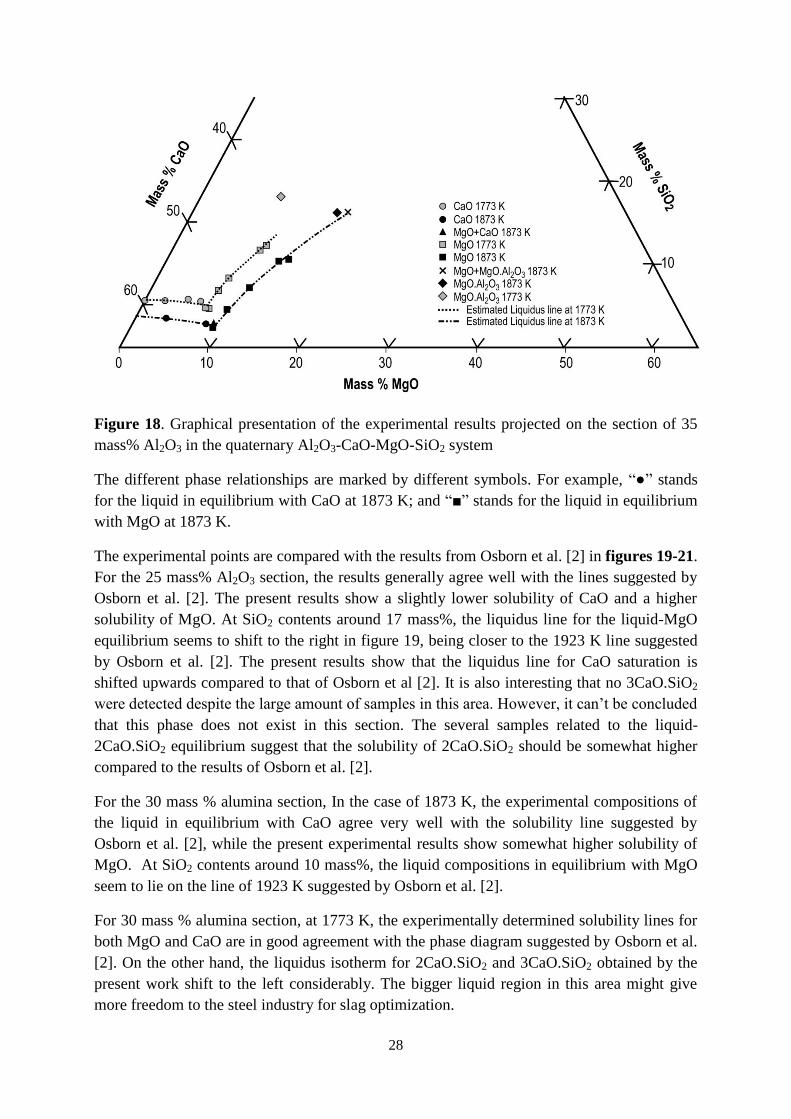
Figure 18. Graphical presentation of the experimental results projected on the section of 35
mass% Al2O3 in the quaternary Al2O3-CaO-MgO-SiO2 system
The different phase relationships are marked by different symbols. For example, ―●‖ stands
for the liquid in equilibrium with CaO at 1873 K; and ―■‖ stands for the liquid in equilibrium
with MgO at 1873 K.
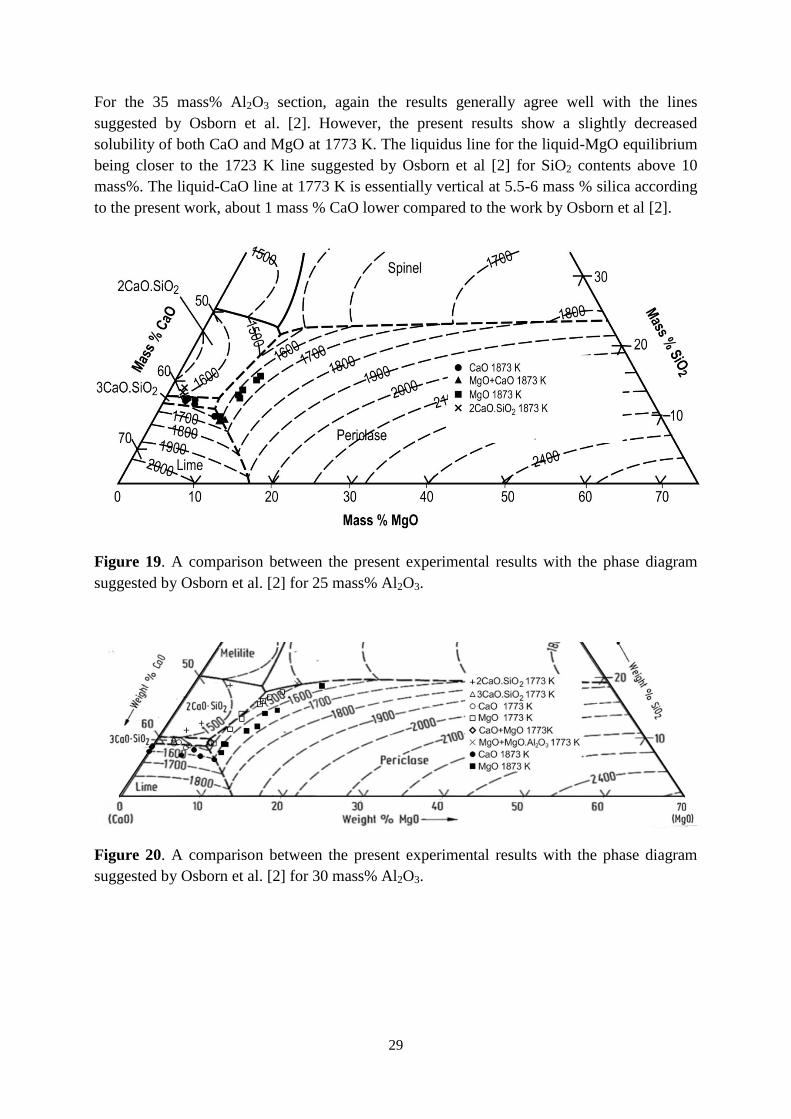
The experimental points are compared with the results from Osborn et al. [2] in figures 19-21.
For the 25 mass% Al2O3 section, the results generally agree well with the lines suggested by
Osborn et al. [2]. The present results show a slightly lower solubility of CaO and a higher
solubility of MgO. At SiO2 contents around 17 mass%, the liquidus line for the liquid-MgO
equilibrium seems to shift to the right in figure 19, being closer to the 1923 K line suggested
by Osborn et al. [2]. The present results show that the liquidus line for CaO saturation is
shifted upwards compared to that of Osborn et al [2]. It is also interesting that no 3CaO.SiO2
were detected despite the large amount of samples in this area. However, it can‘t be concluded
that this phase does not exist in this section. The several samples related to the liquid-
2CaO.SiO2 equilibrium suggest that the solubility of 2CaO.SiO2 should be somewhat higher
compared to the results of Osborn et al. [2].
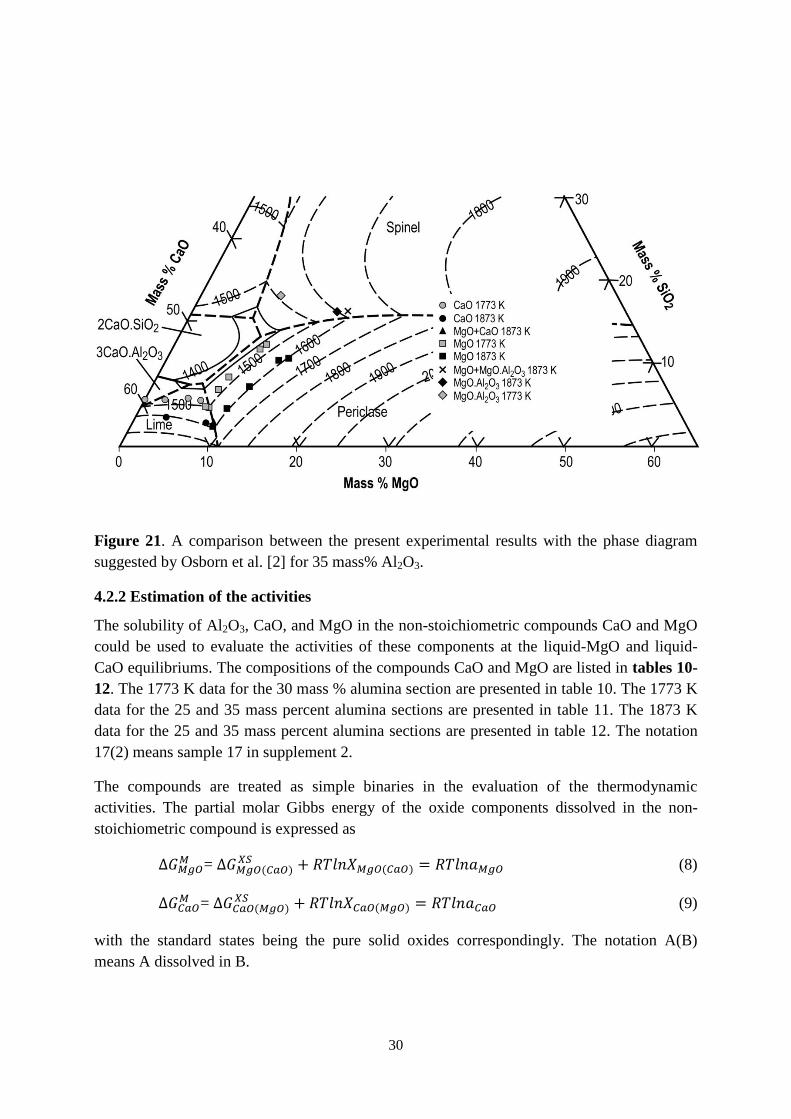
For the 30 mass % alumina section, In the case of 1873 K, the experimental compositions of
the liquid in equilibrium with CaO agree very well with the solubility line suggested by
Osborn et al. [2], while the present experimental results show somewhat higher solubility of
MgO. At SiO2 contents around 10 mass%, the liquid compositions in equilibrium with MgO
seem to lie on the line of 1923 K suggested by Osborn et al. [2].
For 30 mass % alumina section, at 1773 K, the experimentally determined solubility lines for
both MgO and CaO are in good agreement with the phase diagram suggested by Osborn et al.
[2]. On the other hand, the liquidus isotherm for 2CaO.SiO2 and 3CaO.SiO2 obtained by the
present work shift to the left considerably. The bigger liquid region in this area might give
more freedom to the steel industry for slag optimization.
29
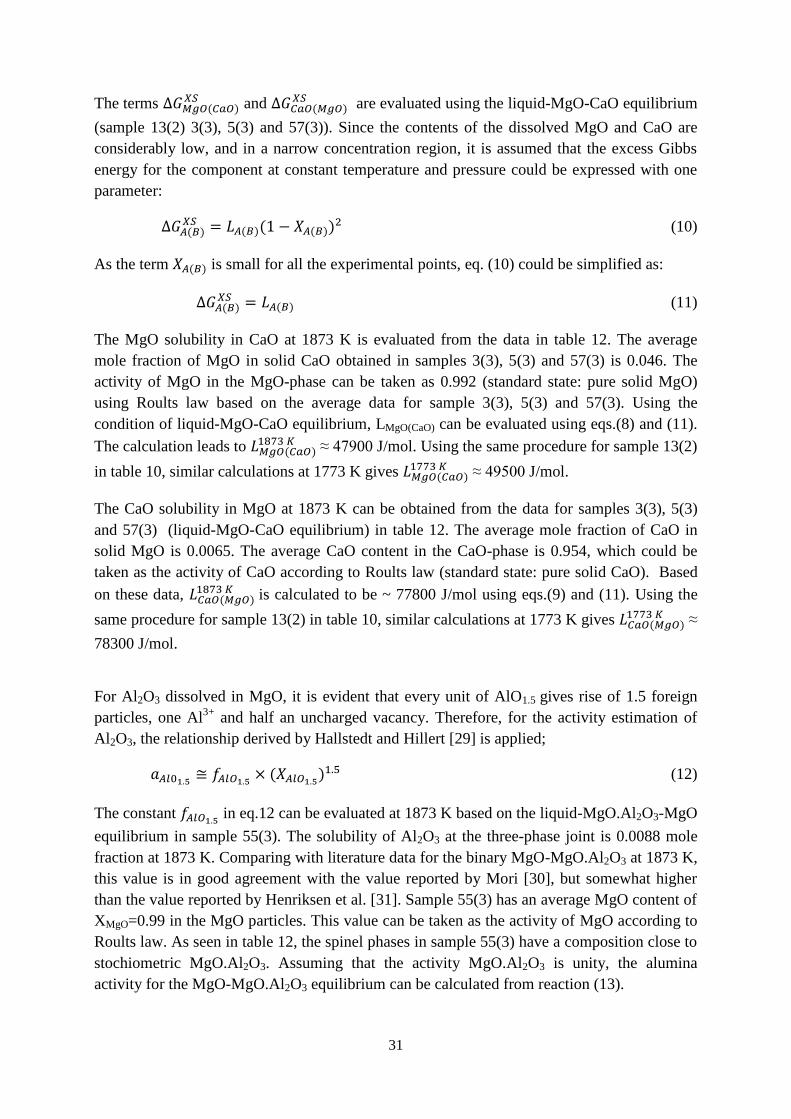
For the 35 mass% Al2O3 section, again the results generally agree well with the lines
suggested by Osborn et al. [2]. However, the present results show a slightly decreased
solubility of both CaO and MgO at 1773 K. The liquidus line for the liquid-MgO equilibrium
being closer to the 1723 K line suggested by Osborn et al [2] for SiO2 contents above 10
mass%. The liquid-CaO line at 1773 K is essentially vertical at 5.5-6 mass % silica according
to the present work, about 1 mass % CaO lower compared to the work by Osborn et al [2].
Figure 19. A comparison between the present experimental results with the phase diagram
suggested by Osborn et al. [2] for 25 mass% Al2O3.
Figure 20. A comparison between the present experimental results with the phase diagram
suggested by Osborn et al. [2] for 30 mass% Al2O3.
30
Figure 21. A comparison between the present experimental results with the phase diagram
suggested by Osborn et al. [2] for 35 mass% Al2O3.
4.2.2 Estimation of the activities
The solubility of Al2O3, CaO, and MgO in the non-stoichiometric compounds CaO and MgO
could be used to evaluate the activities of these components at the liquid-MgO and liquid-
CaO equilibriums. The compositions of the compounds CaO and MgO are listed in tables 10-
12. The 1773 K data for the 30 mass % alumina section are presented in table 10. The 1773 K
data for the 25 and 35 mass percent alumina sections are presented in table 11. The 1873 K
data for the 25 and 35 mass percent alumina sections are presented in table 12. The notation
17(2) means sample 17 in supplement 2.
The compounds are treated as simple binaries in the evaluation of the thermodynamic
activities. The partial molar Gibbs energy of the oxide components dissolved in the non-
stoichiometric compound is expressed as
=
(8)
=
(9)
with the standard states being the pure solid oxides correspondingly. The notation A(B)
means A dissolved in B.
31
The terms and
are evaluated using the liquid-MgO-CaO equilibrium
(sample 13(2) 3(3), 5(3) and 57(3)). Since the contents of the dissolved MgO and CaO are
considerably low, and in a narrow concentration region, it is assumed that the excess Gibbs
energy for the component at constant temperature and pressure could be expressed with one
parameter:
(10)
As the term is small for all the experimental points, eq. (10) could be simplified as:
(11)
The MgO solubility in CaO at 1873 K is evaluated from the data in table 12. The average
mole fraction of MgO in solid CaO obtained in samples 3(3), 5(3) and 57(3) is 0.046. The
activity of MgO in the MgO-phase can be taken as 0.992 (standard state: pure solid MgO)
using Roults law based on the average data for sample 3(3), 5(3) and 57(3). Using the
condition of liquid-MgO-CaO equilibrium, LMgO(CaO) can be evaluated using eqs.(8) and (11).
The calculation leads to ≈ 47900 J/mol. Using the same procedure for sample 13(2)
in table 10, similar calculations at 1773 K gives ≈ 49500 J/mol.
The CaO solubility in MgO at 1873 K can be obtained from the data for samples 3(3), 5(3)
and 57(3) (liquid-MgO-CaO equilibrium) in table 12. The average mole fraction of CaO in
solid MgO is 0.0065. The average CaO content in the CaO-phase is 0.954, which could be
taken as the activity of CaO according to Roults law (standard state: pure solid CaO). Based
on these data, is calculated to be ~ 77800 J/mol using eqs.(9) and (11). Using the
same procedure for sample 13(2) in table 10, similar calculations at 1773 K gives ≈
78300 J/mol.
For Al2O3 dissolved in MgO, it is evident that every unit of AlO1.5 gives rise of 1.5 foreign
particles, one Al3+
and half an uncharged vacancy. Therefore, for the activity estimation of
Al2O3, the relationship derived by Hallstedt and Hillert [29] is applied;
(12)
The constant in eq.12 can be evaluated at 1873 K based on the liquid-MgO.Al2O3-MgO
equilibrium in sample 55(3). The solubility of Al2O3 at the three-phase joint is 0.0088 mole
fraction at 1873 K. Comparing with literature data for the binary MgO-MgO.Al2O3 at 1873 K,
this value is in good agreement with the value reported by Mori [30], but somewhat higher
than the value reported by Henriksen et al. [31]. Sample 55(3) has an average MgO content of
XMgO=0.99 in the MgO particles. This value can be taken as the activity of MgO according to
Roults law. As seen in table 12, the spinel phases in sample 55(3) have a composition close to
stochiometric MgO.Al2O3. Assuming that the activity MgO.Al2O3 is unity, the alumina
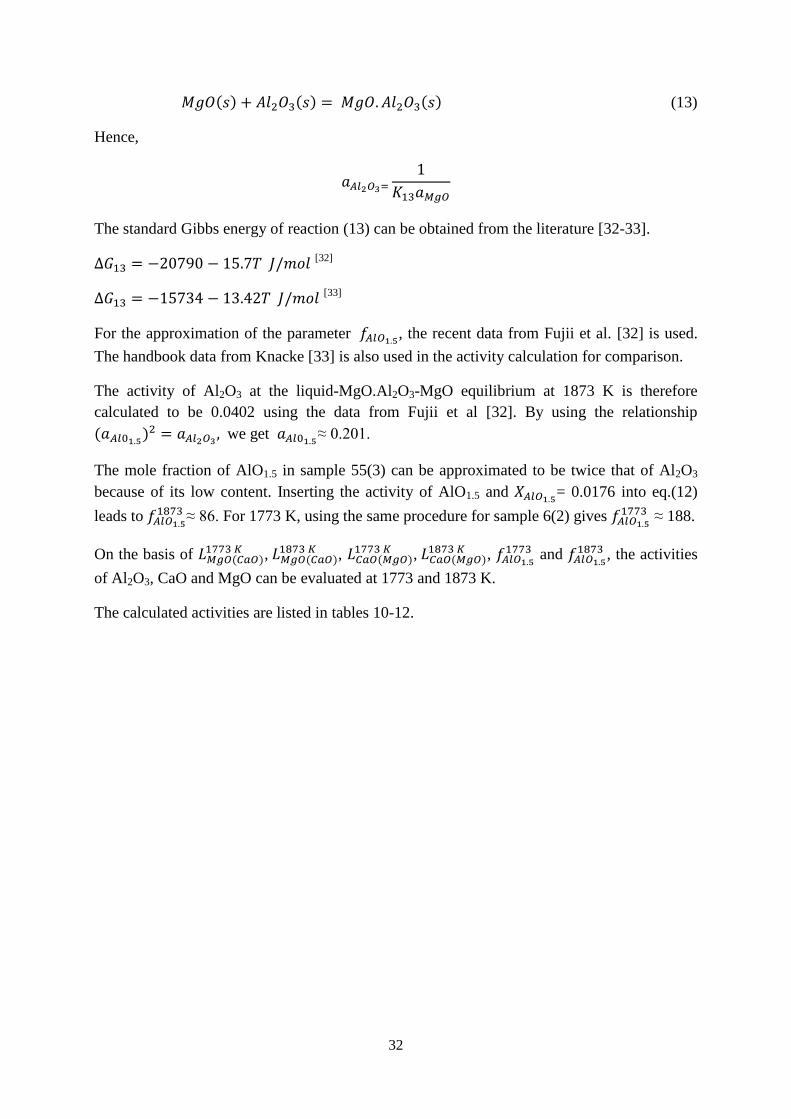
activity for the MgO-MgO.Al2O3 equilibrium can be calculated from reaction (13).
32
(13)
Hence,
The standard Gibbs energy of reaction (13) can be obtained from the literature [32-33].
[32]
[33]
For the approximation of the parameter , the recent data from Fujii et al. [32] is used.
The handbook data from Knacke [33] is also used in the activity calculation for comparison.
The activity of Al2O3 at the liquid-MgO.Al2O3-MgO equilibrium at 1873 K is therefore
calculated to be 0.0402 using the data from Fujii et al [32]. By using the relationship
we get ≈ 0.201.
The mole fraction of AlO1.5 in sample 55(3) can be approximated to be twice that of Al2O3
because of its low content. Inserting the activity of AlO1.5 and = 0.0176 into eq.(12)
leads to
≈ 86. For 1773 K, using the same procedure for sample 6(2) gives
≈ 188.
On the basis of ,
, ,
,
and
, the activities
of Al2O3, CaO and MgO can be evaluated at 1773 and 1873 K.
The calculated activities are listed in tables 10-12.
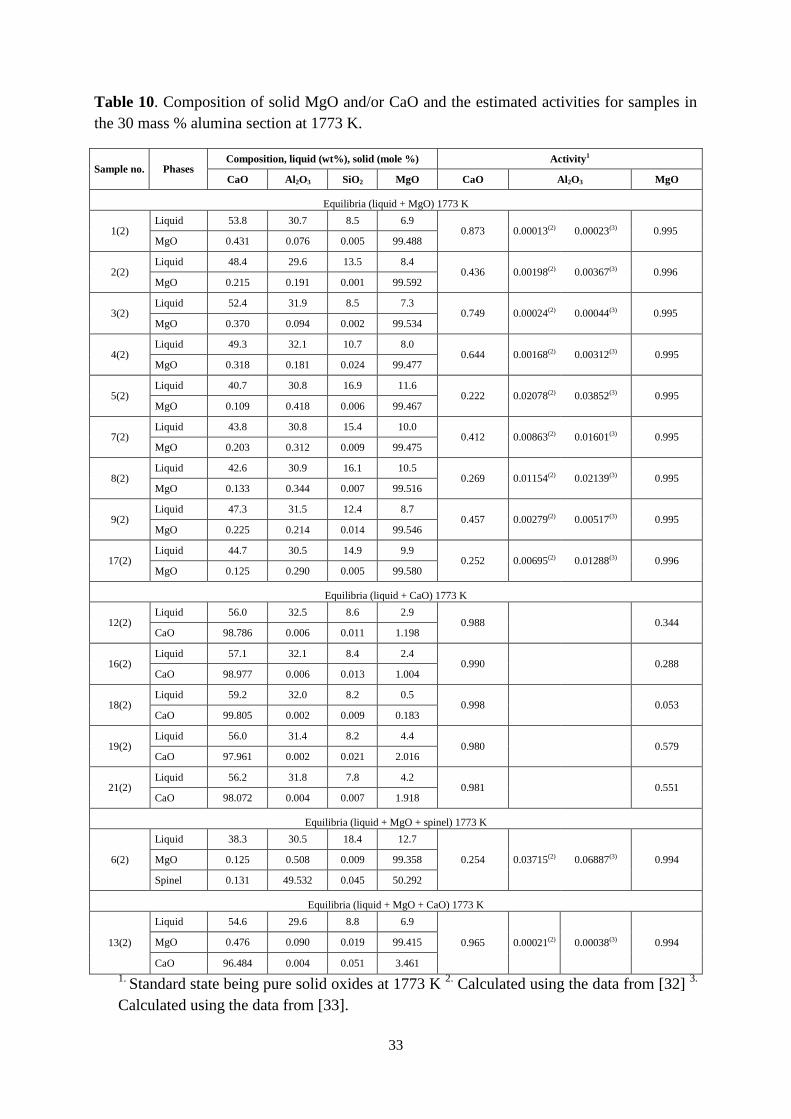
33
Table 10. Composition of solid MgO and/or CaO and the estimated activities for samples in
the 30 mass % alumina section at 1773 K.
Sample no. Phases Composition, liquid (wt%), solid (mole %) Activity1
CaO Al2O3 SiO2 MgO CaO Al2O3 MgO
Equilibria (liquid + MgO) 1773 K
1(2) Liquid 53.8 30.7 8.5 6.9
0.873 0.00013(2) 0.00023(3) 0.995 MgO 0.431 0.076 0.005 99.488
2(2) Liquid 48.4 29.6 13.5 8.4
0.436 0.00198(2) 0.00367(3) 0.996 MgO 0.215 0.191 0.001 99.592
3(2) Liquid 52.4 31.9 8.5 7.3
0.749 0.00024(2) 0.00044(3) 0.995 MgO 0.370 0.094 0.002 99.534
4(2) Liquid 49.3 32.1 10.7 8.0
0.644 0.00168(2) 0.00312(3) 0.995 MgO 0.318 0.181 0.024 99.477
5(2) Liquid 40.7 30.8 16.9 11.6
0.222 0.02078(2) 0.03852(3) 0.995 MgO 0.109 0.418 0.006 99.467
7(2) Liquid 43.8 30.8 15.4 10.0
0.412 0.00863(2) 0.01601(3) 0.995 MgO 0.203 0.312 0.009 99.475
8(2) Liquid 42.6 30.9 16.1 10.5
0.269 0.01154(2) 0.02139(3) 0.995 MgO 0.133 0.344 0.007 99.516
9(2) Liquid 47.3 31.5 12.4 8.7
0.457 0.00279(2) 0.00517(3) 0.995 MgO 0.225 0.214 0.014 99.546
17(2) Liquid 44.7 30.5 14.9 9.9
0.252 0.00695(2) 0.01288(3) 0.996 MgO 0.125 0.290 0.005 99.580
Equilibria (liquid + CaO) 1773 K
12(2) Liquid 56.0 32.5 8.6 2.9
0.988 0.344 CaO 98.786 0.006 0.011 1.198
16(2) Liquid 57.1 32.1 8.4 2.4
0.990 0.288 CaO 98.977 0.006 0.013 1.004
18(2) Liquid 59.2 32.0 8.2 0.5
0.998 0.053 CaO 99.805 0.002 0.009 0.183
19(2) Liquid 56.0 31.4 8.2 4.4
0.980 0.579 CaO 97.961 0.002 0.021 2.016
21(2) Liquid 56.2 31.8 7.8 4.2
0.981 0.551 CaO 98.072 0.004 0.007 1.918
Equilibria (liquid + MgO + spinel) 1773 K
6(2)
Liquid 38.3 30.5 18.4 12.7
0.254 0.03715(2) 0.06887(3) 0.994 MgO 0.125 0.508 0.009 99.358
Spinel 0.131 49.532 0.045 50.292
Equilibria (liquid + MgO + CaO) 1773 K
13(2)
Liquid 54.6 29.6 8.8 6.9
0.965 0.00021(2) 0.00038(3) 0.994 MgO 0.476 0.090 0.019 99.415
CaO 96.484 0.004 0.051 3.461
1. Standard state being pure solid oxides at 1773 K
2. Calculated using the data from [32]
3.
Calculated using the data from [33].
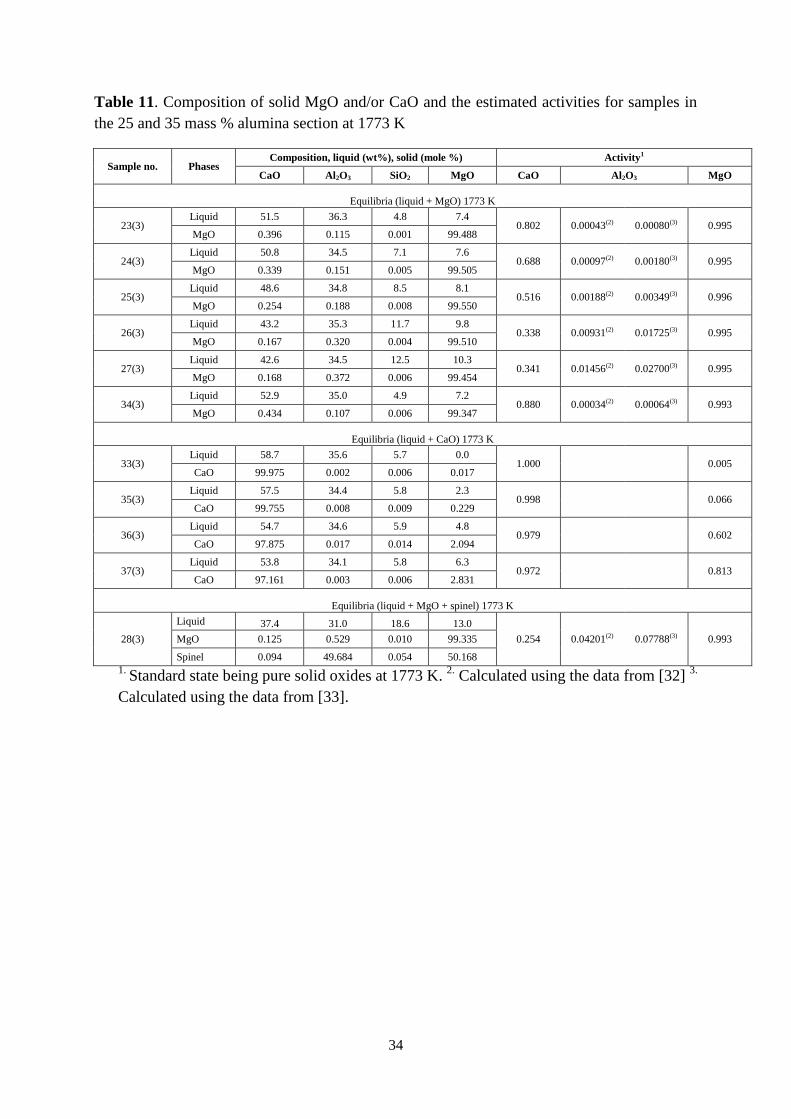
34
Table 11. Composition of solid MgO and/or CaO and the estimated activities for samples in
the 25 and 35 mass % alumina section at 1773 K
Sample no. Phases Composition, liquid (wt%), solid (mole %) Activity1
CaO Al2O3 SiO2 MgO CaO Al2O3 MgO
Equilibria (liquid + MgO) 1773 K
23(3) Liquid 51.5 36.3 4.8 7.4
0.802 0.00043(2) 0.00080(3) 0.995 MgO 0.396 0.115 0.001 99.488
24(3) Liquid 50.8 34.5 7.1 7.6
0.688 0.00097(2) 0.00180(3) 0.995 MgO 0.339 0.151 0.005 99.505
25(3) Liquid 48.6 34.8 8.5 8.1
0.516 0.00188(2) 0.00349(3) 0.996 MgO 0.254 0.188 0.008 99.550
26(3) Liquid 43.2 35.3 11.7 9.8
0.338 0.00931(2) 0.01725(3) 0.995 MgO 0.167 0.320 0.004 99.510
27(3) Liquid 42.6 34.5 12.5 10.3
0.341 0.01456(2) 0.02700(3) 0.995 MgO 0.168 0.372 0.006 99.454
34(3) Liquid 52.9 35.0 4.9 7.2
0.880 0.00034(2) 0.00064(3) 0.993 MgO 0.434 0.107 0.006 99.347
Equilibria (liquid + CaO) 1773 K
33(3) Liquid 58.7 35.6 5.7 0.0
1.000 0.005 CaO 99.975 0.002 0.006 0.017
35(3) Liquid 57.5 34.4 5.8 2.3
0.998 0.066 CaO 99.755 0.008 0.009 0.229
36(3) Liquid 54.7 34.6 5.9 4.8
0.979 0.602 CaO 97.875 0.017 0.014 2.094
37(3) Liquid 53.8 34.1 5.8 6.3
0.972 0.813 CaO 97.161 0.003 0.006 2.831
Equilibria (liquid + MgO + spinel) 1773 K
28(3)
Liquid 37.4 31.0 18.6 13.0
0.254 0.04201(2) 0.07788(3) 0.993 MgO 0.125 0.529 0.010 99.335
Spinel 0.094 49.684 0.054 50.168
1. Standard state being pure solid oxides at 1773 K.
2. Calculated using the data from [32]
3.
Calculated using the data from [33].
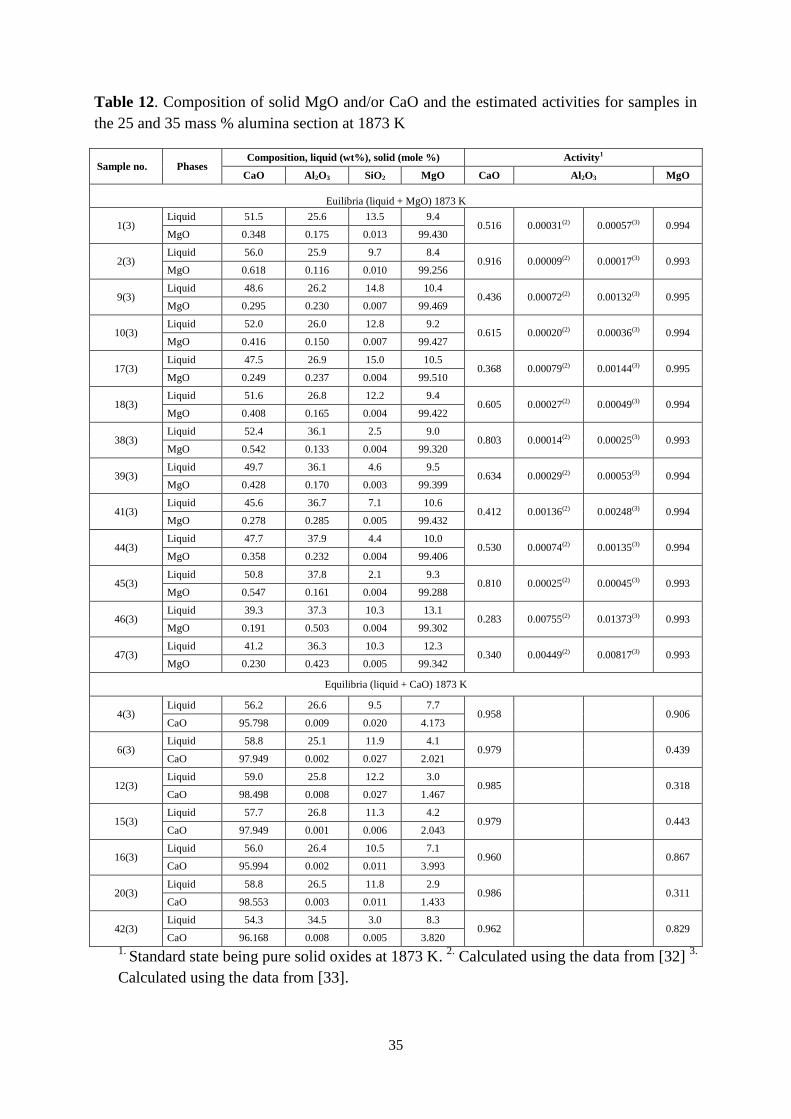
35
Table 12. Composition of solid MgO and/or CaO and the estimated activities for samples in
the 25 and 35 mass % alumina section at 1873 K
Sample no. Phases Composition, liquid (wt%), solid (mole %) Activity1
CaO Al2O3 SiO2 MgO CaO Al2O3 MgO
Euilibria (liquid + MgO) 1873 K
1(3) Liquid 51.5 25.6 13.5 9.4
0.516 0.00031(2) 0.00057(3) 0.994 MgO 0.348 0.175 0.013 99.430
2(3) Liquid 56.0 25.9 9.7 8.4
0.916 0.00009(2) 0.00017(3) 0.993 MgO 0.618 0.116 0.010 99.256
9(3) Liquid 48.6 26.2 14.8 10.4
0.436 0.00072(2) 0.00132(3) 0.995 MgO 0.295 0.230 0.007 99.469
10(3) Liquid 52.0 26.0 12.8 9.2
0.615 0.00020(2) 0.00036(3) 0.994 MgO 0.416 0.150 0.007 99.427
17(3) Liquid 47.5 26.9 15.0 10.5
0.368 0.00079(2) 0.00144(3) 0.995 MgO 0.249 0.237 0.004 99.510
18(3) Liquid 51.6 26.8 12.2 9.4
0.605 0.00027(2) 0.00049(3) 0.994 MgO 0.408 0.165 0.004 99.422
38(3) Liquid 52.4 36.1 2.5 9.0
0.803 0.00014(2) 0.00025(3) 0.993 MgO 0.542 0.133 0.004 99.320
39(3) Liquid 49.7 36.1 4.6 9.5
0.634 0.00029(2) 0.00053(3) 0.994 MgO 0.428 0.170 0.003 99.399
41(3) Liquid 45.6 36.7 7.1 10.6
0.412 0.00136(2) 0.00248(3) 0.994 MgO 0.278 0.285 0.005 99.432
44(3) Liquid 47.7 37.9 4.4 10.0
0.530 0.00074(2) 0.00135(3) 0.994 MgO 0.358 0.232 0.004 99.406
45(3) Liquid 50.8 37.8 2.1 9.3
0.810 0.00025(2) 0.00045(3) 0.993 MgO 0.547 0.161 0.004 99.288
46(3) Liquid 39.3 37.3 10.3 13.1
0.283 0.00755(2) 0.01373(3) 0.993 MgO 0.191 0.503 0.004 99.302
47(3) Liquid 41.2 36.3 10.3 12.3
0.340 0.00449(2) 0.00817(3) 0.993 MgO 0.230 0.423 0.005 99.342
Equilibria (liquid + CaO) 1873 K
4(3) Liquid 56.2 26.6 9.5 7.7
0.958
0.906 CaO 95.798 0.009 0.020 4.173
6(3) Liquid 58.8 25.1 11.9 4.1
0.979
0.439 CaO 97.949 0.002 0.027 2.021
12(3) Liquid 59.0 25.8 12.2 3.0
0.985
0.318 CaO 98.498 0.008 0.027 1.467
15(3) Liquid 57.7 26.8 11.3 4.2
0.979
0.443 CaO 97.949 0.001 0.006 2.043
16(3) Liquid 56.0 26.4 10.5 7.1
0.960
0.867 CaO 95.994 0.002 0.011 3.993
20(3) Liquid 58.8 26.5 11.8 2.9
0.986
0.311 CaO 98.553 0.003 0.011 1.433
42(3) Liquid 54.3 34.5 3.0 8.3
0.962
0.829 CaO 96.168 0.008 0.005 3.820
1. Standard state being pure solid oxides at 1873 K.
2. Calculated using the data from [32]
3.
Calculated using the data from [33].
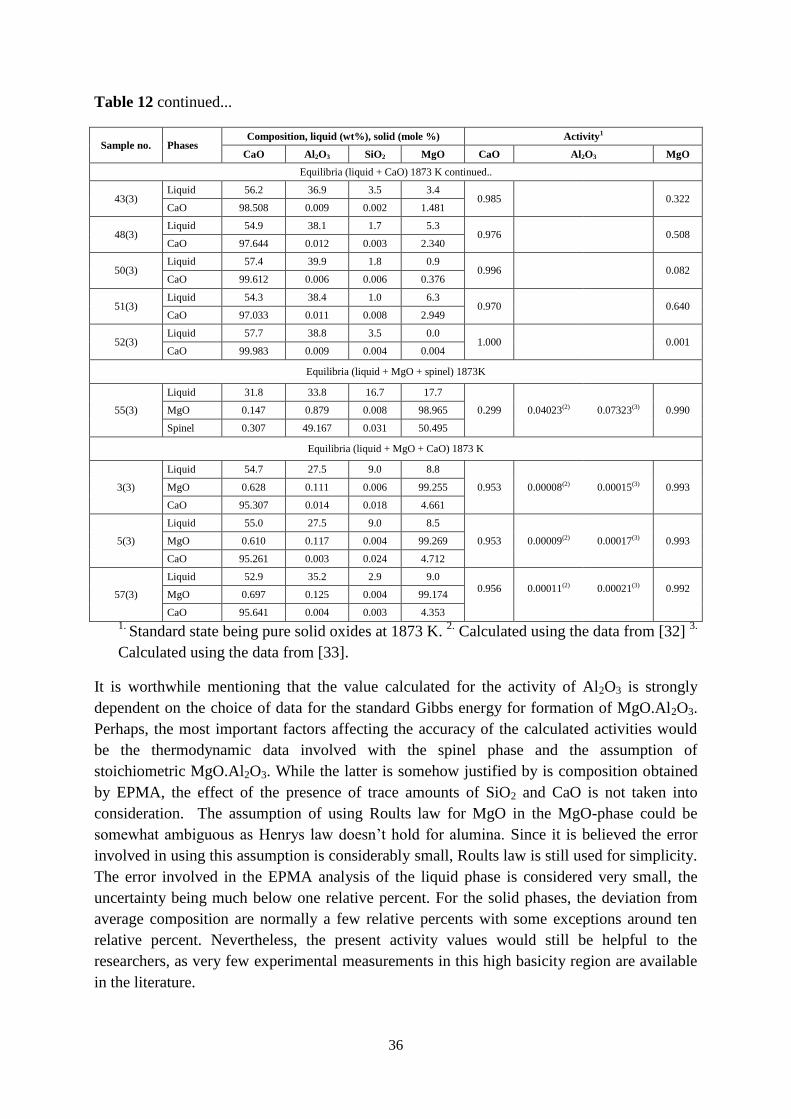
36
Table 12 continued...
Sample no. Phases Composition, liquid (wt%), solid (mole %) Activity1
CaO Al2O3 SiO2 MgO CaO Al2O3 MgO
Equilibria (liquid + CaO) 1873 K continued..
43(3) Liquid 56.2 36.9 3.5 3.4
0.985 0.322 CaO 98.508 0.009 0.002 1.481
48(3) Liquid 54.9 38.1 1.7 5.3
0.976 0.508 CaO 97.644 0.012 0.003 2.340
50(3) Liquid 57.4 39.9 1.8 0.9
0.996 0.082 CaO 99.612 0.006 0.006 0.376
51(3) Liquid 54.3 38.4 1.0 6.3
0.970 0.640 CaO 97.033 0.011 0.008 2.949
52(3) Liquid 57.7 38.8 3.5 0.0
1.000 0.001 CaO 99.983 0.009 0.004 0.004
Equilibria (liquid + MgO + spinel) 1873K
55(3)
Liquid 31.8 33.8 16.7 17.7
0.299 0.04023(2) 0.07323(3) 0.990 MgO 0.147 0.879 0.008 98.965
Spinel 0.307 49.167 0.031 50.495
Equilibria (liquid + MgO + CaO) 1873 K
3(3)
Liquid 54.7 27.5 9.0 8.8
0.953 0.00008(2) 0.00015(3) 0.993 MgO 0.628 0.111 0.006 99.255
CaO 95.307 0.014 0.018 4.661
5(3)
Liquid 55.0 27.5 9.0 8.5
0.953 0.00009(2) 0.00017(3) 0.993 MgO 0.610 0.117 0.004 99.269
CaO 95.261 0.003 0.024 4.712
57(3)
Liquid 52.9 35.2 2.9 9.0 0.956
0.00011(2)
0.00021(3)
0.992
MgO 0.697 0.125 0.004 99.174
CaO 95.641 0.004 0.003 4.353
1. Standard state being pure solid oxides at 1873 K.
2. Calculated using the data from [32]
3.
Calculated using the data from [33].
It is worthwhile mentioning that the value calculated for the activity of Al2O3 is strongly
dependent on the choice of data for the standard Gibbs energy for formation of MgO.Al2O3.
Perhaps, the most important factors affecting the accuracy of the calculated activities would
be the thermodynamic data involved with the spinel phase and the assumption of
stoichiometric MgO.Al2O3. While the latter is somehow justified by is composition obtained
by EPMA, the effect of the presence of trace amounts of SiO2 and CaO is not taken into
consideration. The assumption of using Roults law for MgO in the MgO-phase could be
somewhat ambiguous as Henrys law doesn‘t hold for alumina. Since it is believed the error
involved in using this assumption is considerably small, Roults law is still used for simplicity.
The error involved in the EPMA analysis of the liquid phase is considered very small, the
uncertainty being much below one relative percent. For the solid phases, the deviation from
average composition are normally a few relative percents with some exceptions around ten
relative percent. Nevertheless, the present activity values would still be helpful to the
researchers, as very few experimental measurements in this high basicity region are available
in the literature.
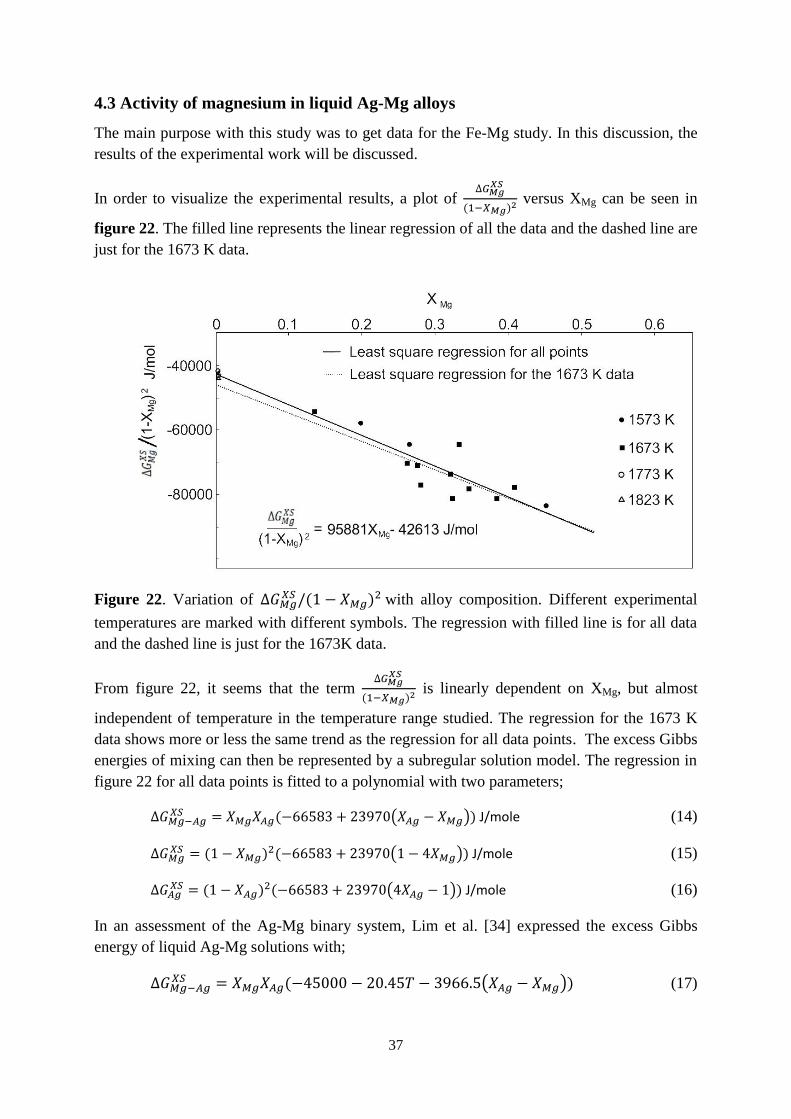
37
4.3 Activity of magnesium in liquid Ag-Mg alloys
The main purpose with this study was to get data for the Fe-Mg study. In this discussion, the
results of the experimental work will be discussed.
In order to visualize the experimental results, a plot of
versus XMg can be seen in
figure 22. The filled line represents the linear regression of all the data and the dashed line are
just for the 1673 K data.
Figure 22. Variation of
with alloy composition. Different experimental
temperatures are marked with different symbols. The regression with filled line is for all data
and the dashed line is just for the 1673K data.
From figure 22, it seems that the term
is linearly dependent on XMg, but almost
independent of temperature in the temperature range studied. The regression for the 1673 K
data shows more or less the same trend as the regression for all data points. The excess Gibbs
energies of mixing can then be represented by a subregular solution model. The regression in
figure 22 for all data points is fitted to a polynomial with two parameters;
J/mole (14)
J/mole (15)
J/mole (16)
In an assessment of the Ag-Mg binary system, Lim et al. [34] expressed the excess Gibbs
energy of liquid Ag-Mg solutions with;
(17)
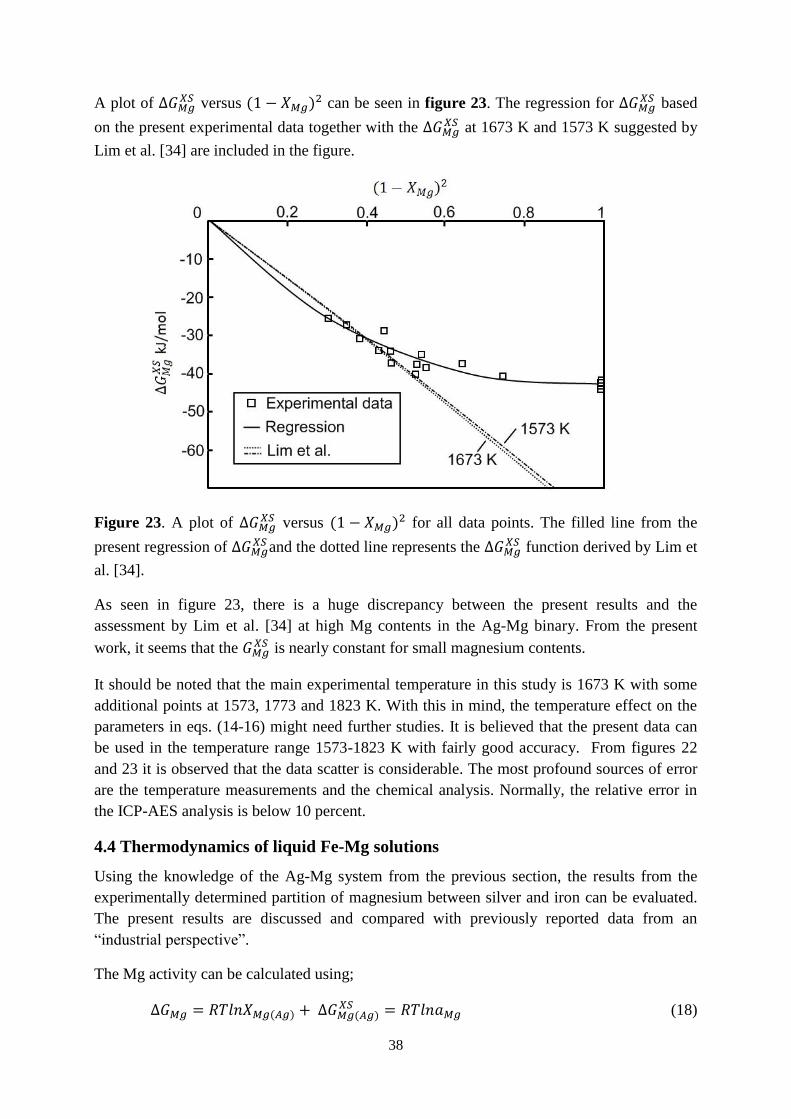
38
A plot of versus
can be seen in figure 23. The regression for based
on the present experimental data together with the at 1673 K and 1573 K suggested by
Lim et al. [34] are included in the figure.
Figure 23. A plot of versus
for all data points. The filled line from the
present regression of and the dotted line represents the
function derived by Lim et
al. [34].
As seen in figure 23, there is a huge discrepancy between the present results and the
assessment by Lim et al. [34] at high Mg contents in the Ag-Mg binary. From the present
work, it seems that the is nearly constant for small magnesium contents.
It should be noted that the main experimental temperature in this study is 1673 K with some
additional points at 1573, 1773 and 1823 K. With this in mind, the temperature effect on the
parameters in eqs. (14-16) might need further studies. It is believed that the present data can
be used in the temperature range 1573-1823 K with fairly good accuracy. From figures 22
and 23 it is observed that the data scatter is considerable. The most profound sources of error
are the temperature measurements and the chemical analysis. Normally, the relative error in
the ICP-AES analysis is below 10 percent.
4.4 Thermodynamics of liquid Fe-Mg solutions
Using the knowledge of the Ag-Mg system from the previous section, the results from the
experimentally determined partition of magnesium between silver and iron can be evaluated.
The present results are discussed and compared with previously reported data from an
―industrial perspective‖.
The Mg activity can be calculated using;
(18)
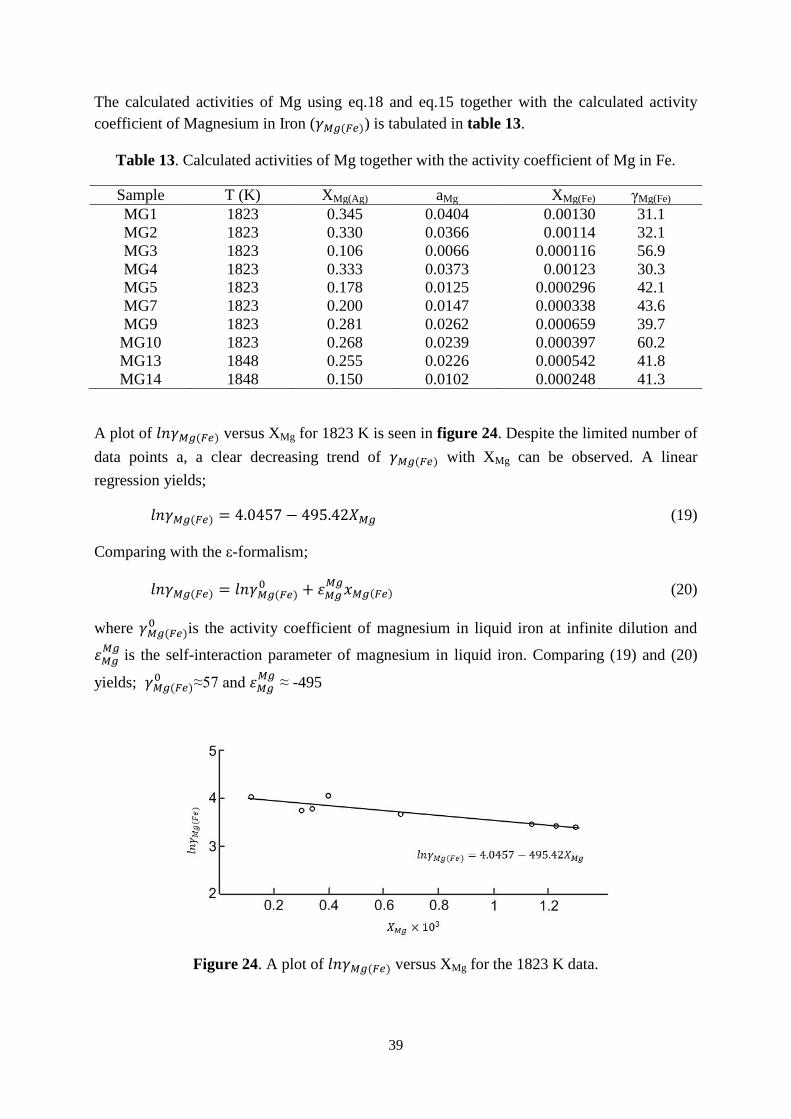
39
The calculated activities of Mg using eq.18 and eq.15 together with the calculated activity
coefficient of Magnesium in Iron ( ) is tabulated in table 13.
Table 13. Calculated activities of Mg together with the activity coefficient of Mg in Fe.
Sample T (K) XMg(Ag) aMg XMg(Fe) γMg(Fe)
MG1 1823 0.345 0.0404 0.00130 31.1
MG2 1823 0.330 0.0366 0.00114 32.1
MG3 1823 0.106 0.0066 0.000116 56.9
MG4 1823 0.333 0.0373 0.00123 30.3
MG5 1823 0.178 0.0125 0.000296 42.1
MG7 1823 0.200 0.0147 0.000338 43.6
MG9 1823 0.281 0.0262 0.000659 39.7
MG10 1823 0.268 0.0239 0.000397 60.2
MG13 1848 0.255 0.0226 0.000542 41.8
MG14 1848 0.150 0.0102 0.000248 41.3
A plot of versus XMg for 1823 K is seen in figure 24. Despite the limited number of
data points a, a clear decreasing trend of with XMg can be observed. A linear
regression yields;
(19)
Comparing with the ε-formalism;
(20)
where is the activity coefficient of magnesium in liquid iron at infinite dilution and
is the self-interaction parameter of magnesium in liquid iron. Comparing (19) and (20)
yields; ≈57 and
≈ -495
Figure 24. A plot of versus XMg for the 1823 K data.
40
The magnitude of
unusually high for self interaction, but is in accordance with the value
calculated by Tarby [35] from the data from Zhang et al. [23].
As the number of experimental points is small at higher temperatures above 1823 K, no
attempt is made to do any regressions for these points. However, as seen in figure 14, the data
for 1848 K follow the same trend as the data for 1823 K.
From an industrial perspective, the most common way to express activities of dissolved
elements in liquid iron would be to use the ―wt%‖ standard state. The free energy change for
the change of standard state from ―pure element‖ to the wt% standard state is calculated
according to;
(21)
where MFe and MMg are the atomic weights of iron and magnesium, respectively. At 1823 K,
equals 4125 J/mole, using =57
The formation of MgO by the reaction between dissolved Mg and O can be expressed as:
Mg(wt% Fe) + O(wt% Fe) = MgO(s) (22)
The standard Gibbs energy for reaction (22) can be calculated using the following
reactions
Mg(g) + ½ O2(g) = MgO(s) (23)
J/mol
[25]
O(wt% Fe)=1/2 O2(g) (24)
J/mol
[36]
Mg(l)=Mg(g) (25)
J/mol
[26]
Mg(wt% Fe)= Mg(l) (26)
J/mol
Hence,
+ = -281552 J/mole at 1823 K. This value leads to
=8.07 at 1823 K. This value is compared with the literature data in table 14.
It is reported by Beskow et al. [37] that the total magnesium content is below 2 ppm in the
liquid metal after vacuum treatment of Al-deoxidized tool steel. The oxygen activity
according to the Celox measurements is about (―wt%‖ standard state). As the analyzed
Mg content includes both dissolved Mg and the Mg in the oxide inclusions, the dissolved
magnesium content is definitely much lower. A calculation using the present result based on
reaction (22) reveals dissolved magnesium content of 0.9ppm (The MgO activity is assumed
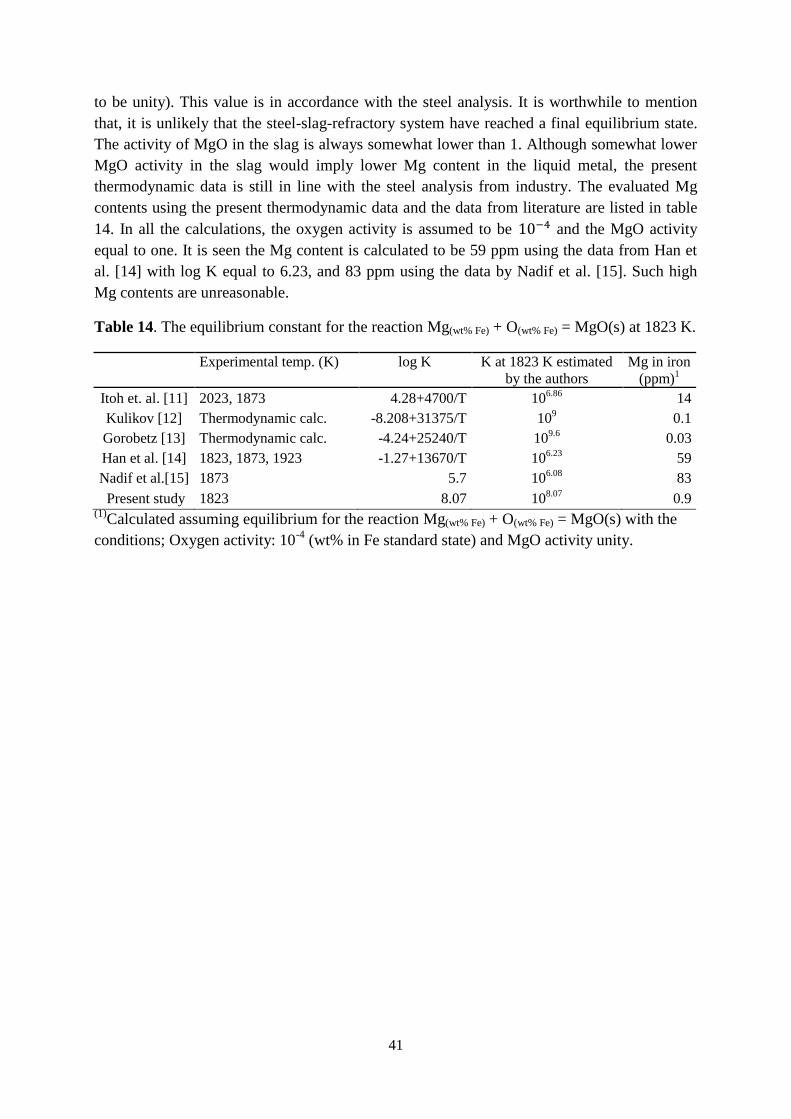
41
to be unity). This value is in accordance with the steel analysis. It is worthwhile to mention
that, it is unlikely that the steel-slag-refractory system have reached a final equilibrium state.
The activity of MgO in the slag is always somewhat lower than 1. Although somewhat lower
MgO activity in the slag would imply lower Mg content in the liquid metal, the present
thermodynamic data is still in line with the steel analysis from industry. The evaluated Mg
contents using the present thermodynamic data and the data from literature are listed in table
14. In all the calculations, the oxygen activity is assumed to be and the MgO activity
equal to one. It is seen the Mg content is calculated to be 59 ppm using the data from Han et
al. [14] with log K equal to 6.23, and 83 ppm using the data by Nadif et al. [15]. Such high
Mg contents are unreasonable.
Table 14. The equilibrium constant for the reaction Mg(wt% Fe) + O(wt% Fe) = MgO(s) at 1823 K.
Experimental temp. (K) log K K at 1823 K estimated
by the authors
Mg in iron
(ppm)1
Itoh et. al. [11] 2023, 1873 4.28+4700/T 106.86
14
Kulikov [12] Thermodynamic calc. -8.208+31375/T 109 0.1
Gorobetz [13] Thermodynamic calc. -4.24+25240/T 109.6
0.03
Han et al. [14] 1823, 1873, 1923 -1.27+13670/T 106.23
59
Nadif et al.[15] 1873 5.7 106.08
83
Present study 1823 8.07 108.07
0.9 (1)
Calculated assuming equilibrium for the reaction Mg(wt% Fe) + O(wt% Fe) = MgO(s) with the
conditions; Oxygen activity: 10-4
(wt% in Fe standard state) and MgO activity unity.
42
5. SUMMARY
The present thesis dealt with some aspects concerning secondary metallurgy of steel where
there is little or very inconsistent information in the literature. More specifically, it was
devoted to the studies on high temperature phase equilibria in the Al2O3-CaO-MgO-SiO2
system, the formation of ladle glaze and the thermodynamics of magnesium in liquid iron.
The formation of glaze on dense and porous MgO rods was studied. It was found that the
initial slag composition had the most profound impact on the formed glaze layer. The
presence of cracks had a clear correlation to the presence of remaining liquid phase in the
glaze layer. No cracks were observed in samples with substantial amount of liquid left. The
existence of a substantial amount of calcium silicate particles (2CaO.SiO2) along with the
absence of liquid phase would lead to the dusting behavior of the sample.
The liquidus in the high basicity region of the Al2O3-CaO-MgO-SiO2 were studied at
steelmaking temperatures, aiming at the compositions in the ~25 to ~35 mass percent alumina
region with silica contents generally lower than 20 mass percent. Based on the experimental
results, phase diagrams were constructed for the 25, 30 and 35 mass percent alumina sections
in the CaO-rich corner of the Al2O3-CaO-MgO-SiO2 system. In comparison with the work by
Osborn at al. [2], the solubility of MgO is found higher at 1873 K for the 25 mass% Al2O3
section but lower at 1773 K for the 35 mass% Al2O3 section. The solubility of CaO is
somewhat lower at 1873 K in the 25 mass% Al2O3 section and at 1773 K in the 35 mass%
Al2O3 compared to the existing phase diagram. For the 30 mass% alumina section, the
solubilities of 2CaO.SiO2 and 3CaO.SiO2 at 1773 K were found to be considerably higher in
comparison with the existing phase diagram. Even the solubility of MgO at 1873 K was found
to be somewhat higher. However, the results generally agree very well with the results from
Osborn et al. In addition, the activities of MgO, CaO and Al2O3 were estimated in the same
region using the phase diagram information.
Activity measurements were done in the Ag-Mg binary at 1573, 1673, 1773 and 1823 K with
two different techniques. The 1573 and 1673 K measurements were performed using the
vapour pressure method whilst the higher temperature data were retrieved from gas-
equilibration experiments. From the experimental results, it can be concluded that the Ag-Mg
system have a subregular solution behaviour with a weak temperature dependency within the
temperature range of this study. It was found that there is a huge discrepancy between the
present results and the assessment by Lim et al. [34] at high silver contents in the Ag-Mg
binary.
The thermodynamic properties of magnesium in liquid iron were evaluated based on the
distribution ratio of magnesium between liquid an Ag-Mg alloy and liquid iron. The results
from the Ag-Mg activity measurements were used to evaluate the activity of magnesium in
the system. At 1823 K, the activity coefficient of magnesium in liquid iron at infinite dilution,
, equals 57 and the self interaction parameter of magnesium,
equals -495. For the
reaction Mg(wt% Fe) + O(wt% Fe) = MgO(s), log K equals 8.07 at 1823 K. This value seems more
reasonable than data from some previous work when comparing with industrial data.
43
6. REFERENCES
1. Slag Atlas. 2nd ed., ed. by Verein Deutscher Eisenhuttenleute, Dusseldorf: Verlag
Sthaleisen GmbH; 1995, ISBN 3-514-00457-9, pp. 156-160.
2. E. F. Osborn, R.C. DeVries, K. H. Gee and H. M. Kraner, Trans. AIME, J. Met. 6(1954),
pp. 33-45.
3. W. Gutt and A. D. Russel, J. Mat. Sci. 12(1977), pp.1869-1878.
4. G. Cavalier and M. Sandrea-Deudon, Rev. Metall., 57(1960), pp.1143-1157.
5. F. Dahl, J. Brandberg and Du Sichen, ISIJ Int., 46(2006), pp. 614-616.
6. H. Todoroki and K. Mizuno, ISIJ Int., 44( 2004), pp. 1350-1357.
7. I.H. Jung, S.A. Decterov and A.D. Pelton, ISIJ Int., 44(2004), pp. 527-536.
8. H. Suito and R. Inoue, ISIJ Int., 36(1996), pp. 528-536.
9. H. Itoh, M. Hino and S. Ban-Ya: Metall. Trans. B, 28B(1997), pp. 953-956.
10. G. Okuyama, K. Yamaguchi, S. Takeuchi and K.I. Sorimachi, ISIJ Int., 40(2000), pp. 121-
128.
11. H. Itoh, M. Hino and S. Ban-ya: Tetsu-to-Hagané, 83(1997), pp. 623-628.
12. I.S. Kulikov, Izv Akad. Nauk SSSR, Met., 1985, pp. 9-15.
13. A.P. Gorobetz, Metall. Koksokhim, 69(1980), pp. 34-37.
14. Q. Han, D. Zhou and C. Xiang: Steel Res., 68(1997), pp. 9-14.
15. M. Nadif and C. Gatellier: Rev. Métall, Cah. Inf. Tech., 83(1986), pp. 377-394.
16. K. Beskow and Du Sichen, Ironmaking and Steelmaking, 31(2004), pp. 393-400.
17. N. N. Tripathi, M. Mzotta, A. Sandberg and Du Sichen, Ironmaking and steelmaking,
31(2004), pp. 235-240.
18. K. Beskow, N. N. Tripathi, M. Nzotta, A. Sandberg and Du Sichen, Ironmaking and
Steelmaking, 31(2004), pp. 514-518.
19. J.-H. Son, I.-H. Jung, S.-M. Jung, H. Gaye and H.-G. Lee, ISIJ Int., 48(2008), pp. 1542-
1551.
20. M. Song, M. Nzotta and Du Sichen, Steel Research Int. 80(2009), pp. 753-760.
21. S. Riaz, K. C. Mills and K. Bain, Ironmaking and Steelmaking, 29(2002), pp. 107-113.
44
22. M. Song, ―A study on the correlation between ladle glaze and non-metallic inclusions in
the ladle treatment‖, Doctoral thesis in Metallurgy, Royal Institute of technology, Sweden,
2011, ISRN KTH/MSE—10/68—SE+MICROMODMETU/AVH
23. X. Zhang, Q. Han and D. Chen, Metall. Trans. B, 22B(1991), pp. 918-921.
24. O. Knacke, O.Kubaschewski and K. Hesselmann. Thermochemical Properties of
Inorganic Substances, 2nd
ed., Springer-Verlag, Berlin, 1991, ISBN: 3-540-54014-8, p. 1114.
25. E. T. Turkdogan: Physical chemistry of high temperature technology, Academic Press,
New York, 1980, ISBN: 0-12-704650-x, pp. 5-26.
26. P.J. Guichelaar, P.K. Trojan, T.McCluhan and R.A. Flinn, Metall. Trans., 2(1971), pp.
3305-3313.
27. A. Muan and E. F. Osborn: ‗Phase Equilibria among Oxides in Steelmaking‘; 1965,
Mass., Addison-Wesley Pub. Co., ISBN 999-166925-6, p. 95.
28. H. F. W. Taylor: ‘Cement Chemistry‘, 1990, London, Academic Press. ISBN: 0-12-
683900-x, p.15.
29. B. Hallstedt, M. Hillert, Calphad, 14(1990), pp.23-26.
30. T. Mori, Yogyo-kyokai-shi, 90(1981), pp. 551-552.
31. A.F. Henriksen and W.D. Kingery, Ceram. Int., 5(1979), pp 11-17.
32. K. Fujii, T. Nagasaka and M. Hino, ISIJ Int. 40(2000), pp. 1059-1066.
33. O. Knacke, O.Kubaschewski and K. Hesselmann. Thermochemical Properties of
Inorganic Substances, 2nd
ed., Springer-Verlag, Berlin, 1991, ISBN 3-540-54014-8, p. 47,
1136, 1171.
34. M. Lim, J.E. Tibballs and P.L. Rossiter, Z. Metallkund, (88)1997, pp.162-169.
35. S.K. Tarby: Metall. Trans. B, 24B(1993), pp. 909-910.
36. G.K. Sigworth and J.F. Elliott, Met. Sci., 8(1974), pp. 298-310.
37. K. Beskow, Du Sichen and N. Sano: Iron and steel technology, 3(2006), pp. 103-117.


![SOME QUESTIONS CONCERNING HRUSHOVSKI’S · SOME QUESTIONS CONCERNING HRUSHOVSKI’S AMALGAMATION CONSTRUCTIONS ASSAF HASSON∗ 1. Introduction In his book on stable groups [Poi87]](https://img.pdfslide.tips/doc/110x75/600549f11e0bc94deb69cc8e/some-questions-concerning-hrushovskias-some-questions-concerning-hrushovskias.jpg)