Embed Size (px)
Citation preview

1
Some Wind Engineering Studies in India
Achal Kr Mittala, Nikhil Agrawalb
aPrincipal Scientist, CSIR-CBRI Roorkee, India bResearch Scholar, IIT Roorkee, India
ABSTRACT With the infrastructural development in India the growth of wind engineering profession is also increasing in India. This paper encompasses the summary of various research work carried out in different institutes (IIT Roorkee, CSIR-SERC, CSIR-CBRI, JP-Guna) of India, ISWE activities. New wind tunnel has been established at Guna (India). An extensive wind tunnel programme has been carried out to study the interference effect. In this study flow conditions for different terrains are established and results of wind characteristics are compared with different international wind codes. An aeroelastic model study is conducted in these flow conditions and base bending moments are measured at a range of reduced velocity. Results of isolated building in different terrains and orientations are compared with the results estimated from different codes. Effects of different parameters, height ratio, orientations of principal as well as interfering building, reduced velocity and location of interfering building are considered for interference study. At the end interference influence zones are established to yield simple guidelines for the designers KEYWORDS: Tall building, wind tunnel, long afterbody, short afterbody, height ratio Indian Society for Wind Engineering (ISWE) Indian Society of Wind Engineering (ISWE) was established in 1993 and at present the total membership is 480. The main activities of ISWE are organization of a National Conference on Wind Engineering (once in two years) and publishing a bi-annual Journal on Wind Engineering. The Southeast Asian region which includes India is affected mainly by three natural hazards-earthquakes, floods and windstorms. According to prevalent school of thought, the changes in the ecosystem have been leading to an increase in the frequency of occurrence of natural hazards, particularly windstorms. This is happening in the zone of severe winds such as coastal regions, open terrains, and summit of hills. According to BMTPC-2006 data 33% of total number of houses is only affected by wind storms. Most of the times the wind storms are associated with water related disasters also (Tsunami). Thus windstorms are considered the most destructive natural disasters in many parts of the world. Therefore, it appears a need to educate and sensitize the more people particularly designers, engineers and researchers working in the field of disaster mitigation (wind). You will be happy to know that the ISWE is jointly organizing the 6th National Conference on. Wind Engineering “NCWE” from December 14~15, 2012, at New Delhi with the collaboration of the CSIR institutes namely: CSIR-CBRI and CSIR-SERC. Eminent researchers from Japan, USA are expected to deliver lectures related to this field. Keynote lectures will be also be addressed by experts in this field from various reputed institutes (IITs, NITs and CSIR Laboratories) and major consulting firms.

2
Major work in the recent past of the following Institutes is included:
1. IIT Roorkee 2. SERC Chennai 3. CBRI Roorkee 4. JUET Guna
1. Indian Institute of Technology Roorkee (IITR) The various fields where research activities in the recent past have been conducted are:
i. Wind induced interference effects on tall rectangular building. ii. Wind loads on tall buildings.
iii. Wind effects on tall buildings of different shapes. iv. CFD simulation of tall buildings for interference study. v. An experimental study of wind effects on low-rise buildings.
vi. Study of free-standing latticed tower under wind loading. vii. Study of cylindrical shells under wind loading.
viii. Wind loads on sloping roofs with skylight. ix. Wind pressure measurements on hyperbolic paraboloid circular roof models. x. Wind loads on hoardings of different heights.
2. Structural Engineering Research Centre (SERC) Chennai Research work in recent years at SERC:
i. Computation of peal load effects on low rise buildings-A simple method ii. Experimental evaluation of aerodynamic parameters for a cooling tower model.
iii. Aerodynamic analysis of a small horizontal axis wind turbine using CFD. iv. Numerical Simulation of Interference Effect between Two 2-D Square Cylinders in
Tandem. v. Validation of methods of evaluation of structural damping using numerically simulated
wind induced random response. 3. Central Building Research Institute (CBRI) Roorkee Different Research Works being pursued at present are as follows: Research work in recent years at SERC:
i. Programme of up-gradation of existing wind tunnel facility and strengthening of wind research group.
ii. Pressure study on wind-induced interference on tall buildings. iii. Atmospheric boundary layer airflow through CFD simulation on pyramidal roof of
square plan shape buildings. 4. Boundary Layer wind tunnel at JUET, GUNA

3
The test section of the wind tunnel is 3.5 x 3.0 m and length of 22m. The larger cross-sectional area enables a larger turntable to be built (enable more upstream fetch). Boundary layer heights in excess of 1.5m will also be possible. The test section is instrumented with two turntables. Each turntable will be made of two concentric plates, one inner circular plate and other annular plate. Three mesh screens are provided in the wind tunnel with two after the honey comb and one at the entry of the wide angle diffuser. Contraction cone connects the settling chamber with the test section of the wind tunnel. In the present case the length of contraction cone is 7m. The function of diffuser is to decrease the velocity by a gradual expansion of area. Area at outlet of diffuser to that at inlet is kept below 3. There are two diffusers in the wind tunnel circuit. The first diffuser located at the end of test section is designed for an area ratio of 1.4, and length of 8m. This section also converts the rectangular test section to one of an octagonal side. The second diffuser provided has a length of 34m and the area ratio chosen is 2.8. A pre-fan diffuser is provided which transforms the octagonal section of the wind tunnel to a circular one of the same diameter as that of the fan at the fan section. In the post fan section, the circular section of fan is transformed back into an octagonal one using post-fan diffuser. The fan has a diameter of 4.8m, with a shaft power of 600kW. The present wind tunnel circuit is designed for a maximum speed of 50m/s. In wind tunnel at Guna, it is proposed to use a multichannel CTA probe. It can measure the flow velocity 0.20m/s to 200m/s, maximum frequency response 90 KHz at 100m/s with a maximum operating temperature 1500C. Two multi-point pressure measurement subsystems of 256 channels each are proposed for the wind tunnel instrumentation. Each subsystem will measure pressures at up to 256 points on the model surface. The load range for the low frequency force balance is of the order of 300-400N, and that of high range load cell is of the order of 1500-2000N. A LAB View assisted data acquisition system (PXI-Based and FF-Based) and ICONICS integrated front end provides the user with the opportunity to online monitor the parameters of data acquisition and control.
With the application of new materials and advanced technologies, modern tall buildings are becoming lighter and more slender than their predecessors, thus they are more sensitive to wind excitation. In addition, along with the development of modern cities, a large number of tall buildings may be constructed in a small zone. The evaluation of wind loads on buildings is carried out mainly by using codes and standards, whose specifications are generally based on wind tunnel tests performed on isolated structures. However, it has been presented by several researchers that wind loads on buildings in realistic environments may be considerably different from those measured on isolated buildings. Neighbouring structure(s) may either increase or decrease the flow-induced forces on a building,

4
depending mainly on the geometry and arrangement of these structures, their orientation with respect to the direction of flow, wind velocity and upstream terrain conditions etc. Therefore, this effect, commonly known as interference, must be properly assessed by designers and planners. In the present study an aeroelastic model used as the principal model and rigid model used as the interfering building model. Interfering models consists of five rigid model of different height ratio (i.e. 0.60, 0.75, 1, 1.25 and 1.5). Tests are conducted for two different orientations, namely, long afterbody (LAB) and short afterbody (SAB). Experimental arrangements for all configurations/orientations of principal as well as interfering building models are shown in Table 1.
Table 1 Experimental arrangement for the building models
Terrain category Case
Principal (P) building model
orientation
Interfering (I) building model
orientation
Height ratio (HR)
Number of positions of the
interfering building model
I SAB SAB
0.6 0.75
1 1.25 1.5
65 65 70 70 70
II SAB LAB
0.6 0.75
1 1.25 1.5
65 65 70 70 70
III LAB SAB
0.6 0.75
1 1.25 1.5
65 65 65 65 65
Suburban
IV LAB LAB
0.6 0.75
1 1.25 1.5
70 70 70 70 70
Isolated aeroelastic model has been tested to three terrain conditions namely: suburban, heavy suburban and urban terrain. Interference study has been done only for suburban terrain category. In all the roughness conditions considered, suburban, heavy suburban and urban, bending moment at the base and acceleration at the top of the building model are recorded. More than 4000 cases of building arrangements are tested in the present study.
Photograph 1 Principal building with and without the interfering building (H)

5
For validation purpose experimental results for different wind characteristics have been compared with the results estimated from different codes/standards and literature. The codes/standards considered in the study are: (1) Architectural Institute of Japan (AIJ-2004) Recommendations for Loads on Buildings. (2) Australian Standard: Minimum Design Loads on Structures (AN/NZS 1172.2:2002). (3) British/European Standard: Euro-code 1: Actions on Structures (BS EN 1991-1-4:2005). (4) China National Standard (GB50009-2001). (5) Code of Practice on Wind Effects in Hong-Kong (CPWEHK-2004). (6) Code of Practice for Design Loads for Buildings and Structures IS: 875(Part-3)-1987
(Existing). (7) Code of Practice for Design Loads for Buildings and Structures IS: 875(Part-3)-2011
(Proposed). (8) Minimum Design Loads for Buildings and Other Structures (ASCE 7-05). (9) National Building Code of Canada (NBCC-1995). Limited information is also available for International Standard (Wind Actions on Structures, ISO/FDIS 4354: 2008) and Russian Code (Wind Loads and Effects, SNiP 2.01.07-85, Moscow, 1996). Hourly wind velocity is given by A Tall building with H=240m is used as an example in this study to compare the wind characteristics estimated with different codes/standards. The building is located at Bombay (India) far from sea. As per IS: 875 (Part3)-1987, the basic 3-sec gust wind velocity at 10m height is 44m/s (reference wind speed). Orientation of building in which shorter dimension of building faces the wind, with longer dimension along the wind, corresponds to LAB orientation and when longer dimension of building faces the wind, with shorter dimension along the wind, corresponds to SAB orientation.
0
50
100
150
200
250
300
350
400
10 20 30 40 50 60 70
Ht
(m)
Velocity (m/s)
IS-875-1987 (0.18)
IS-875-2011 (0.18)
HK-2004 (0.11)
AS/NZS 1170.2.2002 (0.20)
AIJ-2004 (0.20)
BS EN-2004 (0.21)
PRESENT STUDY (0.19)
ASCE 7.05 (0.20)
0
50
100
150
200
250
300
350
400
0 0.05 0.1 0.15 0.2 0.25 0.3 0.35 0.4
Ht
(m)
Turbulent Intensity(%)
IS:875-1987 (0.18)
IS:875-2011(0.18)
HK-2004 (0.11)
AS/NZS 1170.2.2002 (0.20)
AIJ-2004 (0.20)
BS EN-2004 (0.21)
Present Study (0.19)
Tang and Kwok (0.19)
ESDU (0.19)
ASCE 7.05 (0.20)
Figure 1 Vertical distribution of mean wind velocity and turbulent intensity in suburban terrain
Vertical distribution of mean wind velocity and turbulent intensity with height is present in the above figure for suburban terrain. Present experimental data follow the Indian Standard velocity profile up-to 100m building height. For H>100m, the experimental values become higher than
4321 kkkkUU bZ

6
the Indian Standard but the trend is similar. Present experiment data follow the Tang and Kwok experimental curve with lower values of turbulent intensity. Indian Standard (1987) consists of wide range of turbulent intensity (0.1 to 0.27) and at lower heights (<60m) the turbulent intensity is higher than the other codes. Turbulent intensity curve of Indian Standard (proposed) lies near the middle of the curves by other codes/standards and the values are close to Japanese Code at lower heights. The existing and proposed Indian Standards show similar trend but with a significant difference (approximately ± 21%) in turbulent intensity values.
Similarly for heavy suburban and urban terrains present experimental results are in reasonable agreement with the codes/standards. The trend of curve in each codes, present study and literature is similar as expected due to difference in measurement techniques, terrain height factor, turbulent intensity formulae and average time for wind velocity. Aeroelastic model study has been carried out for estimating the response of isolated building. Experimental results for the responses in along-wind direction are also compared with the above mention codes/standards for three different terrains and two different building orientations. The experimental results show more or less similar trend as shown by codes/standards for all the terrains and both the orientations of building for GLF, peak acceleration and base bending moment. Base bending moments vary ±11% from average value for all codes/standards considered, for suburban terrain, and the variation is ±22.5% and ±18% for heavy suburban and urban terrain respectively, for SAB orientation of building. These variations for respective terrains in LAB orientation of building are ±13.6%, ±27.75% and ±24.5%. In general, proposed Indian Standard is more accurate and refined than the earlier version i.e. 1987 and is more direct than other codes/standards for estimating response parameters such as acceleration and moment.
Urban Terrain Heavy Sub Urban Terrain Sub Urban Terrain Symbols
0
0.5
1
1.5
2
2.5
3
Gust Factors for SAB Orientation
Wind
0
0.5
1
1.5
2
2.5
3
Gust Factors for LAB Orientation
Wind
00.5
11.5
22.5
33.5
44.5
55.5
66.5
7
Peak Accerations (%
of g)
Peak Accelerations for SAB Orientation
Wind
00.5
11.5
22.5
33.5
44.5
55.5
66.5
7
Peak Accerations (%
of g)
Peak Accelerations for LAB Orientation
Wind

7
Figure 2 Variation of GLF, peak accelerations, base bending moments and shear forces with different codes/standards and wind tunnel data
Mean and peak along-wind and peak across-wind responses of principal building have been measured due to the presence of interfering building. Effect of height ratio, reduced velocity, and orientation of principal as well as interfering building model on the interference factor has been considered. Results of interference study are summarized in the form Interference Influence Zones (IIZs). A concept of interference influence zones has been devised to present an overall simplified yet comprehensive view of wind induced interference effects. Structural designers are more concerned about the amplification in the response due to interference. Therefore, maximum value of amplification has been picked up for all the variations of height ratio, reduced velocity as well as all locations, and they are presented for different cases. Important feature of the interference are highlighted by dotted line in the zones. IIZs for mean response
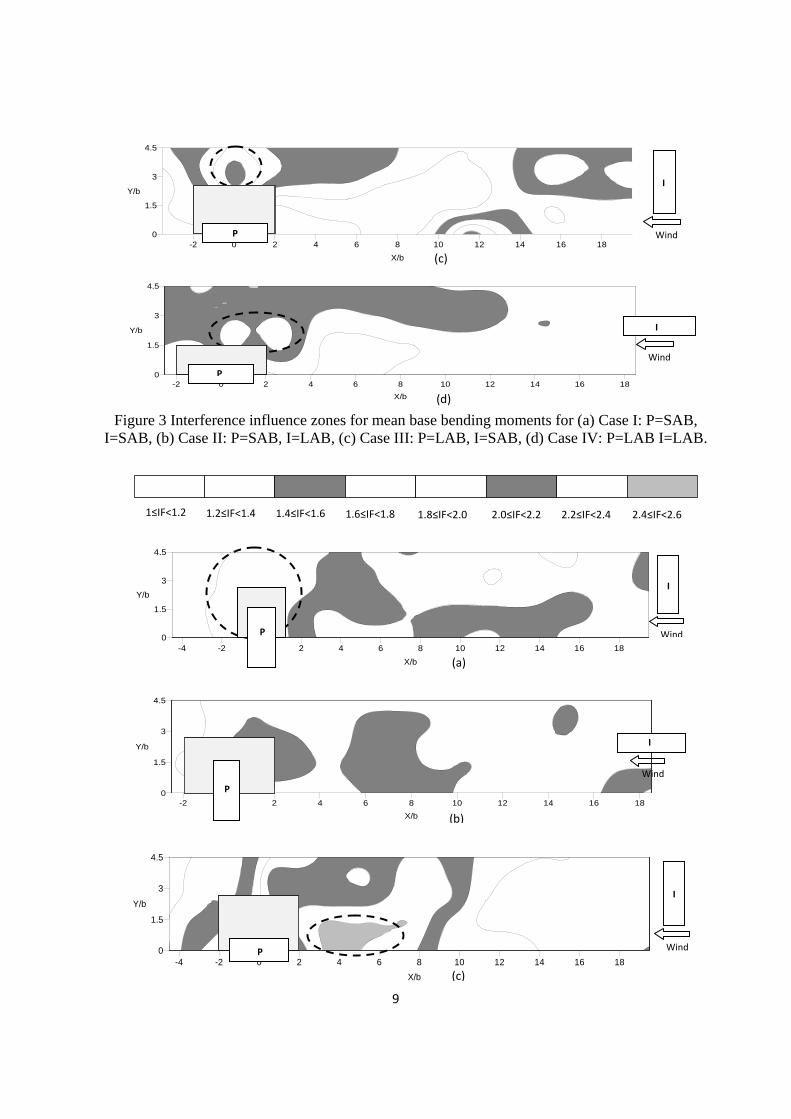
Figure 3 (a-d) represents the interference influence zones for mean along-wind moment of principal building for different cases. For Case II i.e. P=SAB, I=LAB, mostly there is shielding. Substantial amplification for all other three cases is evident especially in the zone marked by dotted line wherein IF vary from 1.4 to 2.0. Maximum increase in mean moment has been observed at side-by-side locations of interfering building. Significant increase up-to 60% in mean moment at downstream of principal building has been noted. Similarly, at X=11.5b and Y=0, there is an increase of 40% in Case I as well as Case IV and 100% in Case III. It is worthy to note (Figure 3-c) that there is an increase of 40-80% in IF values when X=19.5b (390m) and Y varies from 2.5b (50m) to 3.5b (70m).
0
5
10
15
20
25
30
35
40
Shear Forces (KN
*1000)
Shear Forces for SAB Orientation
Wind
0
5
10
15
20
25
30
35
40
Shear Forces (KN
*1000)
Shear Forces for LAB Orientation
Wind
0
0.5
1
1.5
2
2.5
3
3.5
4
4.5
5
5.5
Base Mom
ents (KN
‐m *1000000)
Base Moments for SAB Orientation
Wind
0
0.5
1
1.5
2
2.5
3
3.5
4
4.5
5
5.5
Base M
oments (KN‐m
*1000000)
Base Moments for LAB Orientation
Wind
8
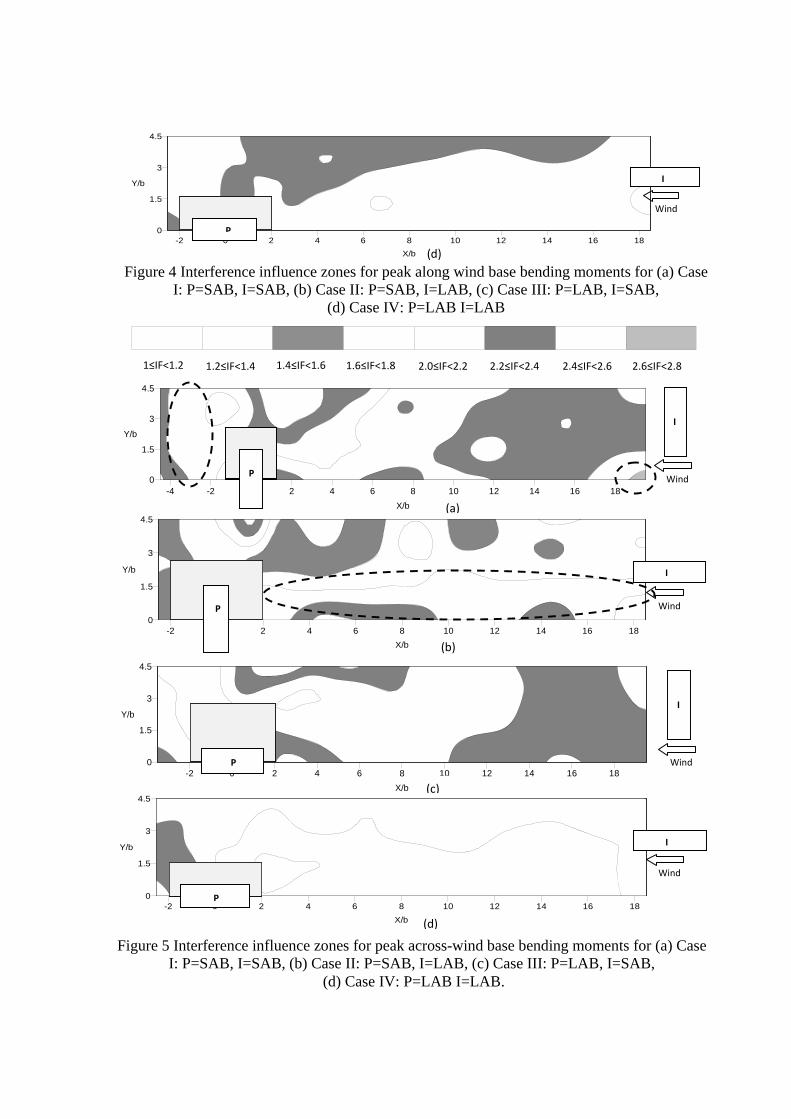
IIZs for peak along-wind response Figure 4 (a-d) present IIZs for absolute maximum values of peak base bending moments in along-wind direction. The figures show zones around the principal building where an interfering building would create significant effects on it. Figure 5 (a) represents maximum increase of 80-100% in peak moment only at a few upstream locations. Further, for this orientation of buildings, constant range of IF (1.2 to 1.4) in side-by-side locations of interfering building is obtained. For LAB orientation of interfering building, maximum increase in IF of the order of 60% has been noted from Figure 4 (b) and (d). Figure 4 (c) represents maximum value of IF between 2.4 to 2.6. This case gives highest values of IF for upstream locations of interfering building, amongst all the four cases. IIZs for peak across-wind response
Figure 5 (a-d) presents IIZs for absolute maximum values of peak base bending moments in across-wind direction. Figure 5 (a) represents maximum increase of 170% in peak moment at farthest upstream locations (X=19.5b). Significant increase of 120-140% is recorded when X varies from 10.5b to 19.5b and Y from 0 to 4.5b. Dotted line in this Figure 5 (b) represents the region of IFs over 2.0 in upstream location, which is extended up-to17.5b in X direction and up-to 1.5b distance in Y direction. Maximum increase of 160% in IF value is noted at X=1b and Y=4.5b. Similarly maximum IF is noted for downstream locations of interfering building also. Figure 5 (c-d) represent maximum value of IF between 40-60% and 20-40 % respectively. LAB orientation of principal building show lesser increase in peak bending moment at most of the upstream locations, when compare with SAB orientation of principal building.
1.0<IF≤1.2 1.2<IF≤1.4 1.4<IF≤1.6 1.6<IF≤1.8 1.8<IF≤2.0 2.0<IF≤2.1IF≤1.0
Shielding
(a)-4 -2 0 2 4 6 8 10 12 14 16 18
X/b
0
1.5
3
4.5
Y/b
P Wind
I
(b)
Wind
I
-2 0 2 4 6 8 10 12 14 16 18
X/b
0
1.5
3
4.5
Y/b
P
9
Figure 3 Interference influence zones for mean base bending moments for (a) Case I: P=SAB, I=SAB, (b) Case II: P=SAB, I=LAB, (c) Case III: P=LAB, I=SAB, (d) Case IV: P=LAB I=LAB.
1 1.2
1.4
1.6
1.8
2 2.2
2.4
1≤IF<1.2 1.2≤IF<1.4 1.4≤IF<1.6 1.6≤IF<1.8 1.8≤IF<2.0 2.0≤IF<2.2 2.2≤IF<2.4 2.4≤IF<2.6
(c)-2 0 2 4 6 8 10 12 14 16 18
X/b
0
1.5
3
4.5
Y/b
Wind
I
P
(a)-4 -2 0 2 4 6 8 10 12 14 16 18
X/b
0
1.5
3
4.5
Y/b
Wind
I
P
(c)-4 -2 0 2 4 6 8 10 12 14 16 18
X/b
0
1.5
3
4.5
Y/b
Wind
I
P
(b)
-2 0 2 4 6 8 10 12 14 16 18
X/b
0
1.5
3
4.5
Y/b
Wind
I
P
(d)
-2 0 2 4 6 8 10 12 14 16 18
X/b
0
1.5
3
4.5
Y/b
Wind
I
P
10
Figure 4 Interference influence zones for peak along wind base bending moments for (a) Case I: P=SAB, I=SAB, (b) Case II: P=SAB, I=LAB, (c) Case III: P=LAB, I=SAB,
(d) Case IV: P=LAB I=LAB
Figure 5 Interference influence zones for peak across-wind base bending moments for (a) Case I: P=SAB, I=SAB, (b) Case II: P=SAB, I=LAB, (c) Case III: P=LAB, I=SAB,
(d) Case IV: P=LAB I=LAB.
1≤IF<1.2 1.2≤IF<1.4 1.4≤IF<1.6 1.6≤IF<1.8 2.0≤IF<2.2 2.2≤IF<2.4 2.4≤IF<2.6 2.6≤IF<2.8
(d)-2 0 2 4 6 8 10 12 14 16 18
X/b
0
1.5
3
4.5
Y/b
Wind
I
P
(a)
-4 -2 0 2 4 6 8 10 12 14 16 18
X/b
0
1.5
3
4.5
Y/b
P Wind
I
(b)
-2 0 2 4 6 8 10 12 14 16 18
X/b
0
1.5
3
4.5
Y/b
P Wind
I
-2 0 2 4 6 8 10 12 14 16 18
X/b
0
1.5
3
4.5
Y/b
(c)
Wind
I
P
(d)
-2 0 2 4 6 8 10 12 14 16 18
X/b
0
1.5
3
4.5
Y/b
Wind
I
P

11
Figure 6 Variation of IF with HR at different locations (X, Y) at Ur=11.7 (P=LAB, I=SAB)
In along-wind direction variation of IF with HR at Ur=11.7 for different locations at upstream of principal building has been recorded in Figure 6 (a). Maximum increase of 150% in peak moment has been noted at X=3.5b in the case when interfering building of 1.5H is present. Maximum difference of 133% in IF value has been observed at X=3.5b between two interfering buildings i.e. HR=0.6 and HR=1.5. At farthest tandem location i.e. X=390m, interference effect still there, due to the presence of interfering buildings for all the values of HR, with maximum IF value 1.30 for HR=1.5. In across-wind direction variation of IF with HR at Ur=11.7 for different locations at upstream of principal building has been recorded in Figure 6 (b). Maximum increase of 75% in peak moment has been noted at X=2.5b, Y=4.5b in the case when interfering building of 1.5H is present. Maximum difference of 65% in IF value has been observed at X=2.5b, Y=4.5b, between two interfering buildings i.e. HR=0.6 and HR=1.5. At farthest tandem location i.e. X=390m, interference effect still there, due to the presence of interfering buildings for all the values of HR, with maximum IF value 1.40 for HR=1.5.
Conclusions
With the increase in the height of interfering building shielding at upstream locations and amplification at side-by-side and downstream locations increase in mean the response. Peak response is found to be increasing with the increase in the height of interfering building at most of the locations.
Mean response is observed to be independent of incident wind velocity except at some locations that too with a maximum variation of 25%. Maximum peak response in along-wind direction is observed for reduced velocity of 4.3 in SAB orientation and 11.7 in LAB orientation. In across-wind direction maximum response is noted for reduced velocity near to the critical reduced velocity associated Strouhal number.
Maximum along-wind response is found for Case III (P=LAB, I=SAB), and in across-wind direction it is maximum for Case II (P=SAB, I=LAB).
Based on the results of detailed experiments interference influence zones are identified.
0
0.5
1
1.5
2
2.5
IF
Locations (X,Y)
0.6 0.75 1 1.25 1.5
Wind

12
Effect of different parameters i.e. height ratio, reduced velocity and orientation of principal as well as interfering building, on principal building are combined and critical zone is proposed. This zone can be used for preliminary design of tall building.
Critical zone of having high interference factor between 2.0 to 2.6 is observed to lie between 2b to 9b upstream with lateral offset up-to 4.5b and immediate downstream locations of principal building. A zone with moderate interference factor between 1.5 to 2.0 is observed, ranges X=9.5b to 19.5b and Y=0 to 4.5b at upstream location and some downstream locations. A low interference zone is effective at most of the downstream locations.
References:
• Agrawal, N., Mittal, A. K., Gupta, A. and Gupta, V. K. (2012), “Along-wind response of a tall rectangular building: a comparative study of international codes/standards with wind tunnel data”, Journal of Wind and Engineering, Vol. 9, No. 1, pp 1-19.
• Agrawal, N., Gupta, V. K., Gupta, A. and Mittal, A. K. (2012), “Comparison of codal values and experimental data pertaining to dynamic wind characteristics”, Journal of Wind and Engineering, Vol. 9, No. 1, pp 33-53.
Acknowledgement: Sincere thanks are due to Prof. Yukio Tamura, Director, GCOE, Tokyo Polytechnic University, Japan, for the invitation to APEC 2012 and extending necessary financial support. Author is thankful to Director CBRI, for permitting him to present the India Country report at APEC 2012 at Vietnam.
-4 -2 0 2 4 6 8 10 12 14 16 18
X/b
0
1.5
3
4.5
Y/b
P
Interference Zones Low Moderate High
1 1.5
2 2.5
1.0. ≤ IF < 1.5 1.5 ≤ IF < 2.0 2.0 ≤ IF < 2.6


![FAJLAGOS FORGÁCSOLÓ ERÕ SZERKEZETFÜGGÕSÉGE ......[2] Corokey 2010 szerszámkatalógus (Sandvik) [3] Suresh, R., Basavarajappa, S., Samuel, G.L.: Some studies on hard turning](https://img.pdfslide.tips/doc/110x75/60cbacf90f58611d59223a66/fajlagos-forgcsol-er-szerkezetfoeggsge-2-corokey-2010-szerszmkatalgus.jpg)