Embed Size (px)
Citation preview

Sound Wave Measurements using an Oscilloscope and Waveform Generator
In this module students will learn to make sound wave measurements using an oscilloscope and a function generator. This equipment will later be used to measure and analyze attenuation properties of different samples interrogated using ultrasonic waves.
The materials in this module are presented in a span of three different classes. This module includes a lesson plan, introduction activity sheet, lab instruction sheet, equipment reference sheet, and a follow‐up worksheet.
The introduction activity sheet presents the students with important sound/wave definitions and with a basic description of the equipment. In addition, students are asked to apply understanding of the definitions provided by answering a few questions.
The lab instruction and reference sheets are meant to be presented on a different day. The instruction sheet contains questions to assess understanding of concepts and ability to operate the equipment.
A follow‐up sheet (how much do you remember?) is used as overall assessment of the module.
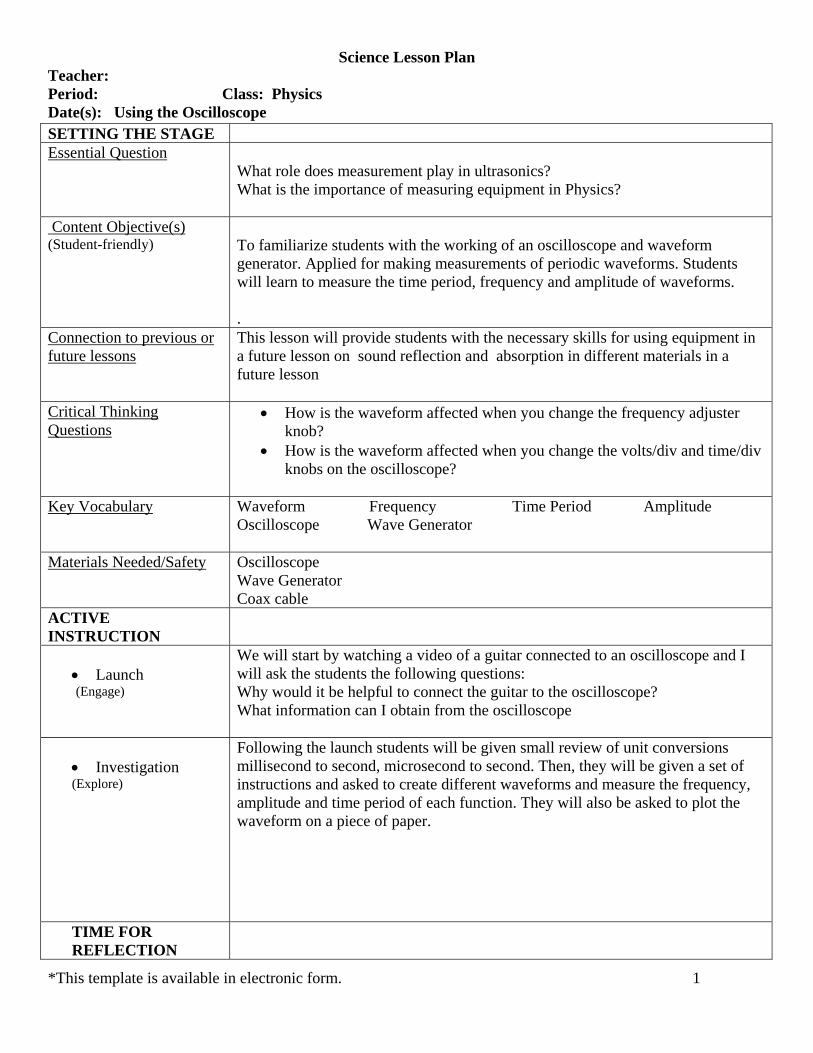
Science Lesson Plan Teacher:
*This template is available in electronic form. 1
Period: Class: Physics Date(s): Using the Oscilloscope SETTING THE STAGE Essential Question
What role does measurement play in ultrasonics? What is the importance of measuring equipment in Physics?
Content Objective(s) (Student-friendly)
To familiarize students with the working of an oscilloscope and waveform generator. Applied for making measurements of periodic waveforms. Students will learn to measure the time period, frequency and amplitude of waveforms. .
Connection to previous or future lessons
This lesson will provide students with the necessary skills for using equipment in a future lesson on sound reflection and absorption in different materials in a future lesson
Critical Thinking Questions
• How is the waveform affected when you change the frequency adjuster knob?
• How is the waveform affected when you change the volts/div and time/div knobs on the oscilloscope?
Key Vocabulary Waveform Frequency Time Period Amplitude
Oscilloscope Wave Generator
Materials Needed/Safety
Oscilloscope Wave Generator Coax cable
ACTIVE INSTRUCTION
• Launch (Engage)
We will start by watching a video of a guitar connected to an oscilloscope and I will ask the students the following questions: Why would it be helpful to connect the guitar to the oscilloscope? What information can I obtain from the oscilloscope
• Investigation (Explore)
Following the launch students will be given small review of unit conversions millisecond to second, microsecond to second. Then, they will be given a set of instructions and asked to create different waveforms and measure the frequency, amplitude and time period of each function. They will also be asked to plot the waveform on a piece of paper.
TIME FOR REFLECTION

Science Lesson Plan Teacher:
*This template is available in electronic form. 2
• Summarization (Explain & Extend)
Discuss the use of electronic measuring equipment and their benefits. Students will be asked to note their observations in their journals. We will also discuss the various frequencies used in the medical field.
• Assessment (Evaluate)
Individually students will be asked to calculate the time period, frequency
and amplitude of the wave of an input from the waveform generator set by the instructor.
Written notes in their journals will be reviewed.
• Homework

Using the oscilloscope and SIGNAL generator
Background Information
Key Words:
EQUIPMENT:
• Oscilloscope: An electronic measuring instrument that displays input waveforms on a screen. The horizontal axis is indicative of time, and the vertical axis provides the instantaneous amplitude at the time recorded.
• Waveform Generator: An electronic test instrument that delivers an accurately calibrated waveform at various frequencies. It allows users to generate waveforms that can be adjusted according to their frequency, amplitude, and shape. Some of the most common waveforms are sine, square, and triangle waveforms.
IMPORTANT DEFINITIONS:
• Frequency: The frequency of a waveform is the number of cycles it makes per second.
Every day we experience a wide range of frequencies. Your heartbeat probably has a frequency between one-half and two cycles per second. Frequency is measured in Hertz (Hz).
• Amplitude: The amplitude describes how big the cycle is. With mechanical systems (such as a pendulum), the amplitude is often a distance or angle. With other kinds of oscillators, the amplitude might be voltage or pressure.
• Time Period: The time taken to complete one cycle is called the time period.
The graph shows a pendulum swinging from +20 centimeters to -20 centimeters and back. The amplitude represents the distance away from center, or 20 centimeters. Notice that the graph above returns to the same place every 1.5 seconds. No matter where you start, you come back to the same value 1.5 seconds later.

Try it on your own: Measurement of an oscillating system is shown in the figure as a function of time. Answer the questions below and show/explain your work.
a. What is the amplitude?
b. What is the period of oscillation?
c. What is the frequency?
d. Give the start time and end time of one complete cycle. Mark your choice on the figure.
e. How many cycles are represented in the diagram?
References:
Foundations of Physics, cpo science. Dr. Tom Hsu

References: http://www.electronics-radio.com http://www.britannica.com Foundations of Physics, cpo science. Dr. Tom Hsu
Using an OSCILLOSCOPE and a WAVEFORM generator
Objective: To demonstrate ability to effectively use the OSCILLOSCOPE and WAVEFORM generator
Equipment:
1. Waveform Generator 2. Oscilloscope 3. Coaxial cable with BNC connector
SET UP:
• Using the WAVEFORM GENERATOR follow the steps below:
1. Set SYMMETRY POS DURATION (6) to extreme left (off). 2. Set the ATTENUATOR (4) near 0 dB. 3. Make the DC OFFSET (7) dial to extreme left (off).
• Connect one end of the coaxial cable to CH1 (00) of the oscilloscope and the other end to
the OUTPUT (5) of the signal generator.
• Turn on the OSCILLOSCOPE and WAVEFORM GENERATOR
Generate a sine wave of frequency 300 Hz Using the SIGNAL Generator set the MUTIPLIER (1) to 100 and the FREQUENCY RANGE (2) to 3. Now, on the OSCILLOSCOPE gently turn the VOLTS/DIV (5) knob until you are able to see something. Next, turn the TIME/DIV (15) knob and the VOLTS/DIV know until you are able to find a sine wave like the shown in Fig. 1.
Fig1. Sine Wave at 300 Hz

How could you obtain a 300 Hz wave using different settings of the ULTIPLIER (1) and the FREQUENCY RANGE? Draw the knob settings. ________________________________________________ ________________________________________________ ________________________________________________ ________________________________________________ ________________________________________________ Analyzing the wave: The wave should have a frequency of 300 Hz according to the WAVEFORM GENERATOR settings. Knowing the time period of the wave will allow us to check the actual frequency value shown on the OSCILLOSCOPE. So, let’s check: We know that where f is the frequency in Hz, T is the time period in seconds. Time Period is approximately 3 ms Plug in equation:
1 1. 003 333. 33
Finding the amplitude of the wave:

Now, on the WAVEFORM GENERATOR set the frequency to 4,000Hz. Find the Frequency, Time Period, and Amplitude. Plot your wave.

Time Period _________ (T)=
Frequency =
Amplitude=

Name:__________________________ Date:_______________
Oscilloscope Reference Sheet
(6) POSITION: Changes the position of the signal on the vertical axis.
(16) POSITION: Changes the position of the signal on the horizontal axis.
(15) TIME/DIV: used to adjust the horizontal time axis.
(A) CH1: Channel 1 input signal.
(3) POWER: turn on or off
(5) VOLTS/DIV: used to adjust the vertical axis for amplitude.

Name:__________________________ Date:_______________
Waveform Generator Reference Sheet
WAVEFORM: Availability to choose from different waveforms such as sine, triangle or square
(1)MULTIPLIER: Sets reference ( ) for
desired waveform frequency.
(0) ATTENUATOR: Controls amplitude of waveform
(0) POWER: turn on or off
(2) Frequency Range : Allows selection of specific waveform
(5) OUTPUT: Signal output using a BNC connection

Making Measurements
What do you remember?
Name:__________________________ Date:________________
1. What role does measurement play in ultrasonics? .
2. What is the importance of measuring equipment in Physics?
3. Please draw a wave and indicate the following: (Label as best as you can) a. A full wave cycle b. How can you use the graph calculate the time period? c. How can you find the wave frequency? d. What is the amplitude of the wave?
1. What role does measurement play in ultrasonics? .
2. What is the importance of measuring equipment in Physics?

3. Please draw a wave and indicate the following: (Label as best as you can) a. A full wave cycle b. How can you use the graph calculate the time period? c. How can you find the wave frequency? d. What is the amplitude of the wave?