Embed Size (px)
Citation preview
Journal of OceanographyVol. 49, pp. 173 to 191. 1993
Southward Intrusion of the Intermediate Oyashio Wateralong the East Coast of the Boso Peninsula, Japan
II. Intrusion Events into Sagami Bay
SUNG-KEE YANG1, YUTAKA NAGATA2, KEISUKE TAIRA3 and MASAKI KAWABE3
1Department of Oceanography, College of Ocean Sciences, Cheju National University,1 Ara-dong, Cheju 690-756, Korea
2Department of Earth and Planetary Physics, Faculty of Science, University of Tokyo,2-11-16 Yayoi, Bunkyo-ku, Tokyo 113, Japan
3Ocean Research Institute, University of Tokyo, 1-15-1, Minamidai, Nakano-ku, Tokyo 164, Japan
(Received 29 June 1992; in revised form 10 August 1992; accepted 26 August 1992)
In the previous paper (Yang et al., 1993), it was shown that there always exists thecoastal salinity-minimum-layer (SML) water just off the Boso Peninsula. Thecoastal SML water is bounded by the current zone of the Kuroshio, and a relativelyhigh salinity domain separates it from the offshore SML water which would be acontinum of the North Pacific Intermediate Water. We suggested that the coastalSML water region indicates the pathway along which the Intermediate OyashioWater intrudes into Sagami Bay. In this paper, by selecting seven cases where wefound the coastal SML water having abnormally high oxygen content and lowsalinity, we try to follow the intrusion manner of the Intermediate Oyashio Waterinto Sagami Bay by using available hydrographic data taken routinely by variousorganizations in the period from 1973 to 1986. Some of these water can be tracedfrom the observation line near the cape of Inubo to the central part of Sagami Bay,and its propagation speed along the coast is shown to be of order of 1 cm/s. Theintruding intermediate Oyashio water usually has a complicated layered structurein it, and its time scale of persistence is shown to be only a few months.
1. IntroductionIntrusions of the Intermediate Oyashio Water along the Boso Peninsula is suggested by
Omori (1967) in order to explain the existence of index species of zooplankton of the OyashioWater at depths greater than 350 m or in and beneath the salinity minimum layer in Sagami Bay.In the previous papers (Yang, 1989; Yang et al., 1993: the latter will be referred as Part Ihereafter), we analyzed the data taken by the Japan Meteorological Agency along KJ line whichextends southeast from off the tip of the Boso Peninsula crossing the Kuroshio (Fig. 1). It wasshown that there exists always a coastal salinity-minimum-layer (SML) water just off the BosoPeninsula. This water is bounded by the current zone of the Kuroshio, and a relatively highsalinity water separates it from the offshore SML water which would be a continuum of the NorthPacific Intermediate Water. The coastal SML water was considered to indicate the pathway ofthe Intermediate Oyashio Water into Sagami Bay.
The distribution characteristics of the water types of the coastal SML water and of theoffshore SML water were also analyzed in Part I. The ranges of the water type distributions ofthe coastal SML water in T-S plane, in ∆st-S plane, and in ∆st-O2 plane are almost identical to thoseof the offshore SML water. However, the water types of the coastal SML water in ∆st-O2 plane
174 S.-K. Yang et al.
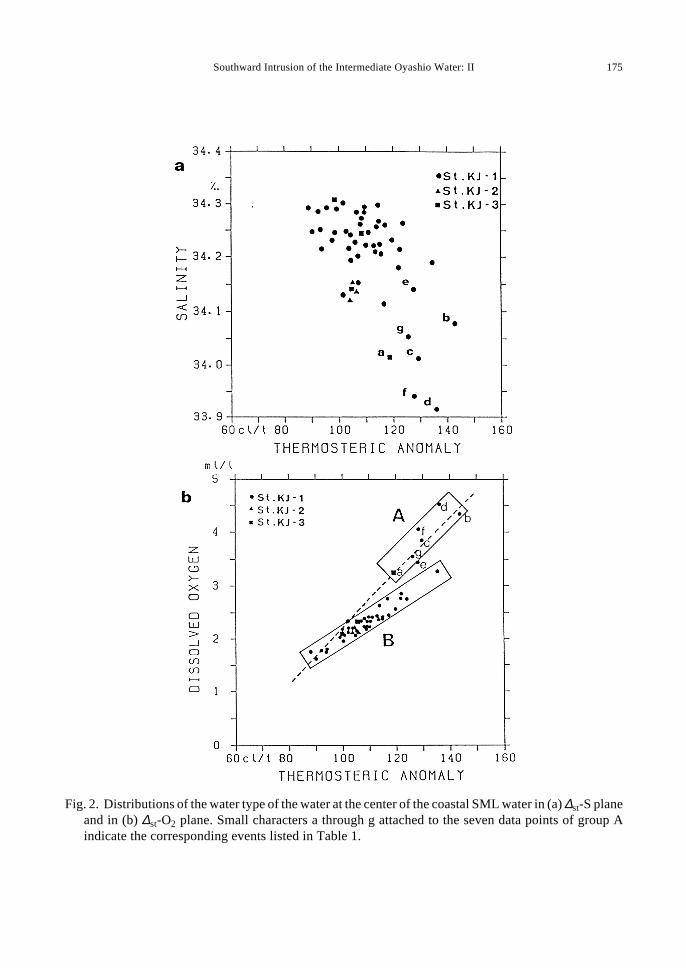
is not homogeneously distributed as for the offshore SML water, and the water type can beclassified into two group (Fig. 2(b)) by their distribution nature: Group A with high oxygencontent and with low salinity value and group B for which no significant difference can be seenfrom ambient water in the salinity minimum layer in this area. High oxygen content and lowsalinity value of group A suggest that the water left the Oyashio or Mixed Water Region veryrecently and that the water would be associated with some strong intrusion event. The water typeof group A was found seven times in our analyzed period from 1973 to 1986. In this paper, weshall investigate these events as typical cases or strong intrusion events, in order to clarify theintrusion nature of the Intermediate Oyashio Water into Sagami Bay.
2. Strong Intrusion Events of the Intermediate Oyashio Water Found along KJ-LineThe distributions in T-S and ∆st-S planes of the water types of the water at the center of the
coastal SML water observed along KJ line in the period from 1973 to 1986 are shown in Figs.2(a) and 2(b), respectively. The classification of group A and group B is shown in Fig. 2(b) (PartI). The seven events which brought the water type belonging to group A in the cross-section along
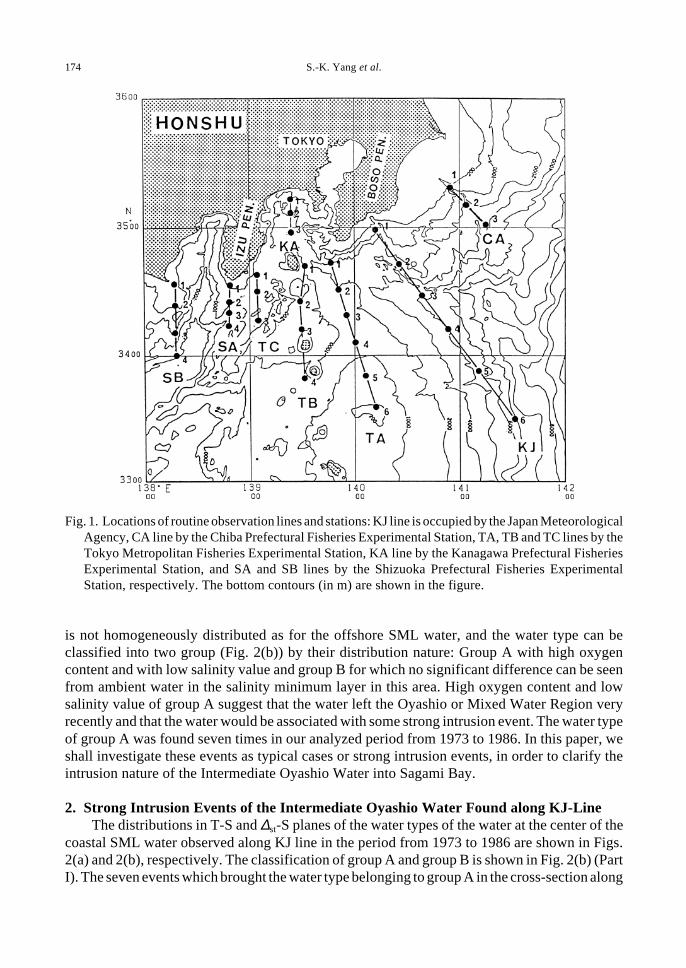
Fig. 1. Locations of routine observation lines and stations: KJ line is occupied by the Japan MeteorologicalAgency, CA line by the Chiba Prefectural Fisheries Experimental Station, TA, TB and TC lines by theTokyo Metropolitan Fisheries Experimental Station, KA line by the Kanagawa Prefectural FisheriesExperimental Station, and SA and SB lines by the Shizuoka Prefectural Fisheries ExperimentalStation, respectively. The bottom contours (in m) are shown in the figure.
Southward Intrusion of the Intermediate Oyashio Water: II 175
Fig. 2. Distributions of the water type of the water at the center of the coastal SML water in (a) ∆st-S planeand in (b) ∆st-O2 plane. Small characters a through g attached to the seven data points of group Aindicate the corresponding events listed in Table 1.
176 S.-K. Yang et al.
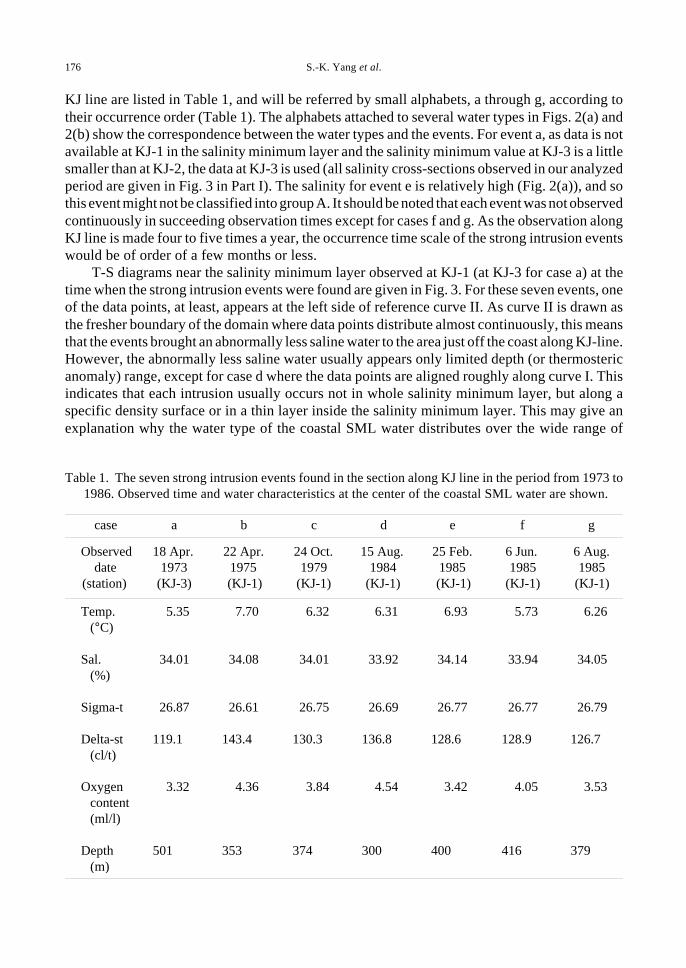
KJ line are listed in Table 1, and will be referred by small alphabets, a through g, according totheir occurrence order (Table 1). The alphabets attached to several water types in Figs. 2(a) and2(b) show the correspondence between the water types and the events. For event a, as data is notavailable at KJ-1 in the salinity minimum layer and the salinity minimum value at KJ-3 is a littlesmaller than at KJ-2, the data at KJ-3 is used (all salinity cross-sections observed in our analyzedperiod are given in Fig. 3 in Part I). The salinity for event e is relatively high (Fig. 2(a)), and sothis event might not be classified into group A. It should be noted that each event was not observedcontinuously in succeeding observation times except for cases f and g. As the observation alongKJ line is made four to five times a year, the occurrence time scale of the strong intrusion eventswould be of order of a few months or less.
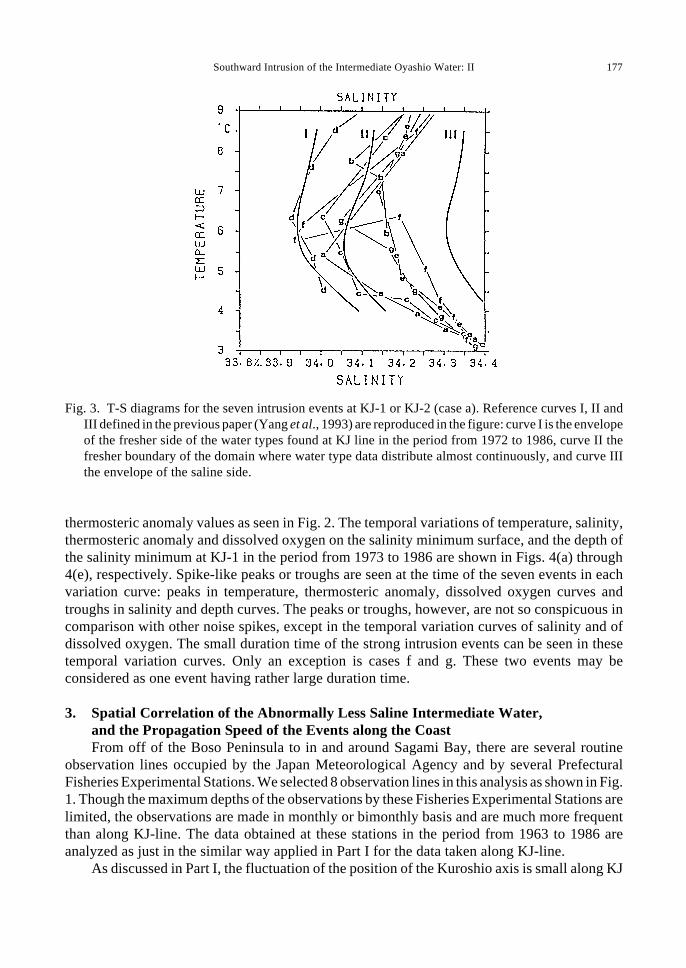
T-S diagrams near the salinity minimum layer observed at KJ-1 (at KJ-3 for case a) at thetime when the strong intrusion events were found are given in Fig. 3. For these seven events, oneof the data points, at least, appears at the left side of reference curve II. As curve II is drawn asthe fresher boundary of the domain where data points distribute almost continuously, this meansthat the events brought an abnormally less saline water to the area just off the coast along KJ-line.However, the abnormally less saline water usually appears only limited depth (or thermostericanomaly) range, except for case d where the data points are aligned roughly along curve I. Thisindicates that each intrusion usually occurs not in whole salinity minimum layer, but along aspecific density surface or in a thin layer inside the salinity minimum layer. This may give anexplanation why the water type of the coastal SML water distributes over the wide range of
case a b c d e f g
Observeddate
(station)
18 Apr.1973
(KJ-3)
22 Apr.1975(KJ-1)
24 Oct.1979
(KJ-1)
15 Aug.1984
(KJ-1)
25 Feb.1985(KJ-1)
6 Jun.1985
(KJ-1)
6 Aug.1985
(KJ-1)
Temp.(°C)
5.35 7.70 6.32 6.31 6.93 5.73 6.26
Sal.(%)
34.01 34.08 34.01 33.92 34.14 33.94 34.05
Sigma-t 26.87 26.61 26.75 26.69 26.77 26.77 26.79
Delta-st(cl/t)
119.1 143.4 130.3 136.8 128.6 128.9 126.7
Oxygencontent(ml/l)
3.32 4.36 3.84 4.54 3.42 4.05 3.53
Depth(m)
501 353 374 300 400 416 379
Table 1. The seven strong intrusion events found in the section along KJ line in the period from 1973 to1986. Observed time and water characteristics at the center of the coastal SML water are shown.
Southward Intrusion of the Intermediate Oyashio Water: II 177
thermosteric anomaly values as seen in Fig. 2. The temporal variations of temperature, salinity,thermosteric anomaly and dissolved oxygen on the salinity minimum surface, and the depth ofthe salinity minimum at KJ-1 in the period from 1973 to 1986 are shown in Figs. 4(a) through4(e), respectively. Spike-like peaks or troughs are seen at the time of the seven events in eachvariation curve: peaks in temperature, thermosteric anomaly, dissolved oxygen curves andtroughs in salinity and depth curves. The peaks or troughs, however, are not so conspicuous incomparison with other noise spikes, except in the temporal variation curves of salinity and ofdissolved oxygen. The small duration time of the strong intrusion events can be seen in thesetemporal variation curves. Only an exception is cases f and g. These two events may beconsidered as one event having rather large duration time.
3. Spatial Correlation of the Abnormally Less Saline Intermediate Water,and the Propagation Speed of the Events along the CoastFrom off of the Boso Peninsula to in and around Sagami Bay, there are several routine
observation lines occupied by the Japan Meteorological Agency and by several PrefecturalFisheries Experimental Stations. We selected 8 observation lines in this analysis as shown in Fig.1. Though the maximum depths of the observations by these Fisheries Experimental Stations arelimited, the observations are made in monthly or bimonthly basis and are much more frequentthan along KJ-line. The data obtained at these stations in the period from 1963 to 1986 areanalyzed as just in the similar way applied in Part I for the data taken along KJ-line.
As discussed in Part I, the fluctuation of the position of the Kuroshio axis is small along KJ
Fig. 3. T-S diagrams for the seven intrusion events at KJ-1 or KJ-2 (case a). Reference curves I, II andIII defined in the previous paper (Yang et al., 1993) are reproduced in the figure: curve I is the envelopeof the fresher side of the water types found at KJ line in the period from 1972 to 1986, curve II thefresher boundary of the domain where water type data distribute almost continuously, and curve IIIthe envelope of the saline side.

178 S.-K. Yang et al.
Fig. 4. Temporal variations of temperature (a), salinity (b), thermosteric anomaly (c), and dissolvedoxygen content (d) at the salinity minimum surface, and of the depth of the salinity minimum surface(e) at KJ-1 in the period from 1973 to 1986. When the observations at inshore stations KJ-1 and KJ-2 were not available for the salinity minimum layer, the data at KJ-3 are given by dark squares in eachfigures. When the center of the coastal SML water was located at KJ-2, the data at KJ-2 are given bydark triangles. Small alphabets shown above the bottom margin indicate the time that the events listedin Table 1 occurred.
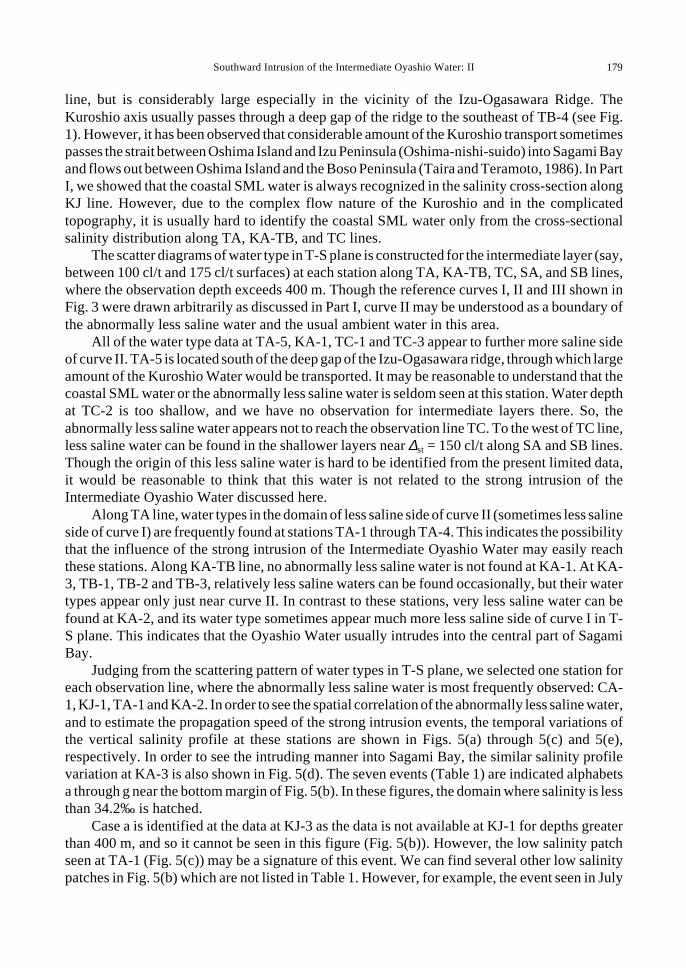
Southward Intrusion of the Intermediate Oyashio Water: II 179
line, but is considerably large especially in the vicinity of the Izu-Ogasawara Ridge. TheKuroshio axis usually passes through a deep gap of the ridge to the southeast of TB-4 (see Fig.1). However, it has been observed that considerable amount of the Kuroshio transport sometimespasses the strait between Oshima Island and Izu Peninsula (Oshima-nishi-suido) into Sagami Bayand flows out between Oshima Island and the Boso Peninsula (Taira and Teramoto, 1986). In PartI, we showed that the coastal SML water is always recognized in the salinity cross-section alongKJ line. However, due to the complex flow nature of the Kuroshio and in the complicatedtopography, it is usually hard to identify the coastal SML water only from the cross-sectionalsalinity distribution along TA, KA-TB, and TC lines.
The scatter diagrams of water type in T-S plane is constructed for the intermediate layer (say,between 100 cl/t and 175 cl/t surfaces) at each station along TA, KA-TB, TC, SA, and SB lines,where the observation depth exceeds 400 m. Though the reference curves I, II and III shown inFig. 3 were drawn arbitrarily as discussed in Part I, curve II may be understood as a boundary ofthe abnormally less saline water and the usual ambient water in this area.
All of the water type data at TA-5, KA-1, TC-1 and TC-3 appear to further more saline sideof curve II. TA-5 is located south of the deep gap of the Izu-Ogasawara ridge, through which largeamount of the Kuroshio Water would be transported. It may be reasonable to understand that thecoastal SML water or the abnormally less saline water is seldom seen at this station. Water depthat TC-2 is too shallow, and we have no observation for intermediate layers there. So, theabnormally less saline water appears not to reach the observation line TC. To the west of TC line,less saline water can be found in the shallower layers near ∆st = 150 cl/t along SA and SB lines.Though the origin of this less saline water is hard to be identified from the present limited data,it would be reasonable to think that this water is not related to the strong intrusion of theIntermediate Oyashio Water discussed here.
Along TA line, water types in the domain of less saline side of curve II (sometimes less salineside of curve I) are frequently found at stations TA-1 through TA-4. This indicates the possibilitythat the influence of the strong intrusion of the Intermediate Oyashio Water may easily reachthese stations. Along KA-TB line, no abnormally less saline water is not found at KA-1. At KA-3, TB-1, TB-2 and TB-3, relatively less saline waters can be found occasionally, but their watertypes appear only just near curve II. In contrast to these stations, very less saline water can befound at KA-2, and its water type sometimes appear much more less saline side of curve I in T-S plane. This indicates that the Oyashio Water usually intrudes into the central part of SagamiBay.
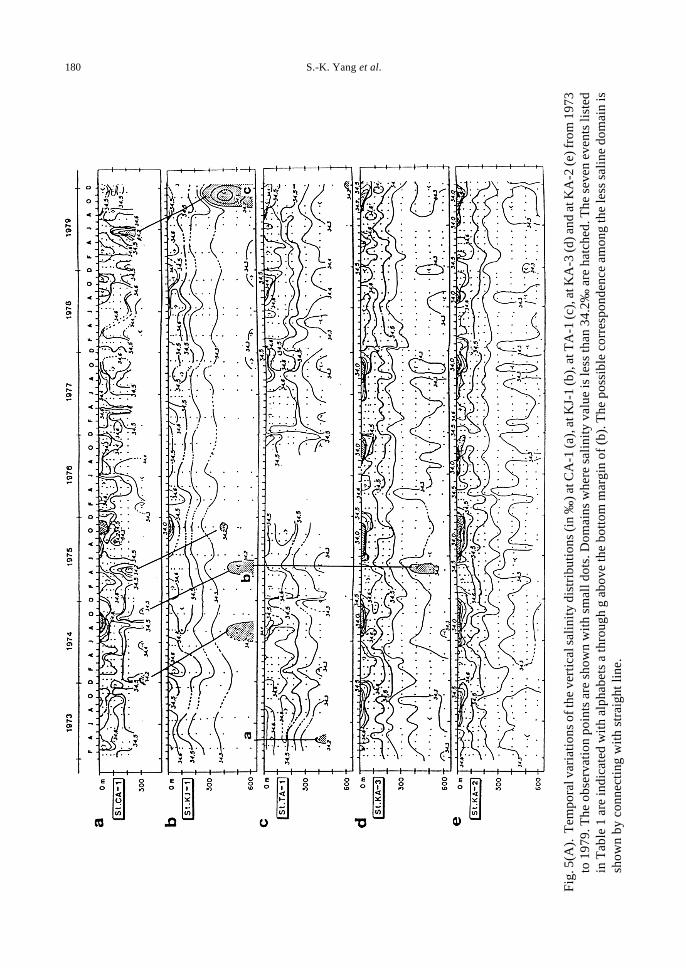
Judging from the scattering pattern of water types in T-S plane, we selected one station foreach observation line, where the abnormally less saline water is most frequently observed: CA-1, KJ-1, TA-1 and KA-2. In order to see the spatial correlation of the abnormally less saline water,and to estimate the propagation speed of the strong intrusion events, the temporal variations ofthe vertical salinity profile at these stations are shown in Figs. 5(a) through 5(c) and 5(e),respectively. In order to see the intruding manner into Sagami Bay, the similar salinity profilevariation at KA-3 is also shown in Fig. 5(d). The seven events (Table 1) are indicated alphabetsa through g near the bottom margin of Fig. 5(b). In these figures, the domain where salinity is lessthan 34.2‰ is hatched.
Case a is identified at the data at KJ-3 as the data is not available at KJ-1 for depths greaterthan 400 m, and so it cannot be seen in this figure (Fig. 5(b)). However, the low salinity patchseen at TA-1 (Fig. 5(c)) may be a signature of this event. We can find several other low salinitypatches in Fig. 5(b) which are not listed in Table 1. However, for example, the event seen in July
180 S.-K. Yang et al.
Fig
. 5(A
). T
empo
ral v
aria
tion
s of
the
vert
ical
sal
init
y di
stri
buti
ons
(in
‰) a
t CA
-1 (a
), a
t KJ-
1 (b
), a
t TA
-1 (c
), a
t KA
-3 (d
) and
at K
A-2
(e) f
rom
197
3to
197
9. T
he o
bser
vati
on p
oint
s ar
e sh
own
wit
h sm
all d
ots.
Dom
ains
whe
re s
alin
ity
valu
e is
less
than
34.
2‰ a
re h
atch
ed. T
he s
even
eve
nts
list
edin
Tab
le 1
are
indi
cate
d w
ith
alph
abet
s a
thro
ugh
g ab
ove
the
bott
om m
argi
n of
(b)
. The
pos
sibl
e co
rres
pond
ence
am
ong
the
less
sal
ine
dom
ain
issh
own
by c
onne
ctin
g w
ith
stra
ight
line
.
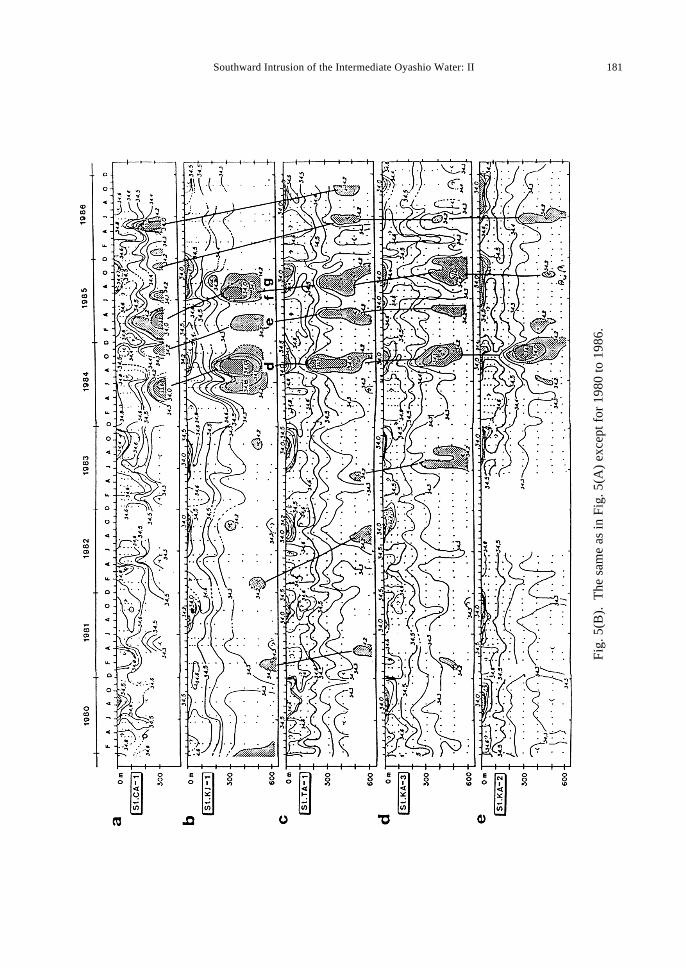
Southward Intrusion of the Intermediate Oyashio Water: II 181
Fig
. 5(B
). T
he s
ame
as in
Fig
. 5(A
) ex
cept
for
198
0 to
198
6.
182 S.-K. Yang et al.
1974 had been classified into group B as the dissolved oxygen content at its center is not so high(2.4 ml/l). Of course, as the classification of groups A and B is arbitrary as discussed in Part I,this case might be considered as one of the strong intrusion events.
We try to find the spatial correlation among the low salinity domains appears these 5 stations,and indicated with straight lines. The correlation is not so clear except several events (cases d,e, f-g) occurred in 1984 through 1986. However, it should be noted that the observation at TA-1 was usually terminated at a 400 m depth before 1980. We might find much more clearcorrelation if the observation were made up to 600 m. A conspicuous intrusion into Sagami Bayappears to occur in the spring of 1986, although no corresponding less saline patch is observedat KJ-1. It may be reasonable to think that the event is missed to be observed at KJ-1 because ofthe relatively large observation interval.
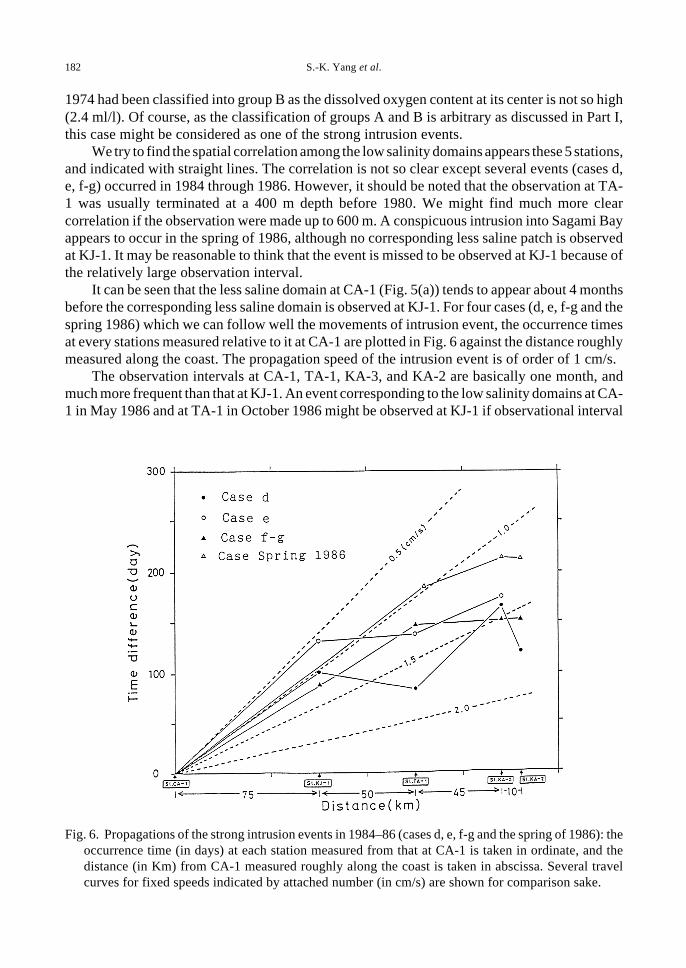
It can be seen that the less saline domain at CA-1 (Fig. 5(a)) tends to appear about 4 monthsbefore the corresponding less saline domain is observed at KJ-1. For four cases (d, e, f-g and thespring 1986) which we can follow well the movements of intrusion event, the occurrence timesat every stations measured relative to it at CA-1 are plotted in Fig. 6 against the distance roughlymeasured along the coast. The propagation speed of the intrusion event is of order of 1 cm/s.
The observation intervals at CA-1, TA-1, KA-3, and KA-2 are basically one month, andmuch more frequent than that at KJ-1. An event corresponding to the low salinity domains at CA-1 in May 1986 and at TA-1 in October 1986 might be observed at KJ-1 if observational interval
Fig. 6. Propagations of the strong intrusion events in 1984–86 (cases d, e, f-g and the spring of 1986): theoccurrence time (in days) at each station measured from that at CA-1 is taken in ordinate, and thedistance (in Km) from CA-1 measured roughly along the coast is taken in abscissa. Several travelcurves for fixed speeds indicated by attached number (in cm/s) are shown for comparison sake.
Southward Intrusion of the Intermediate Oyashio Water: II 183
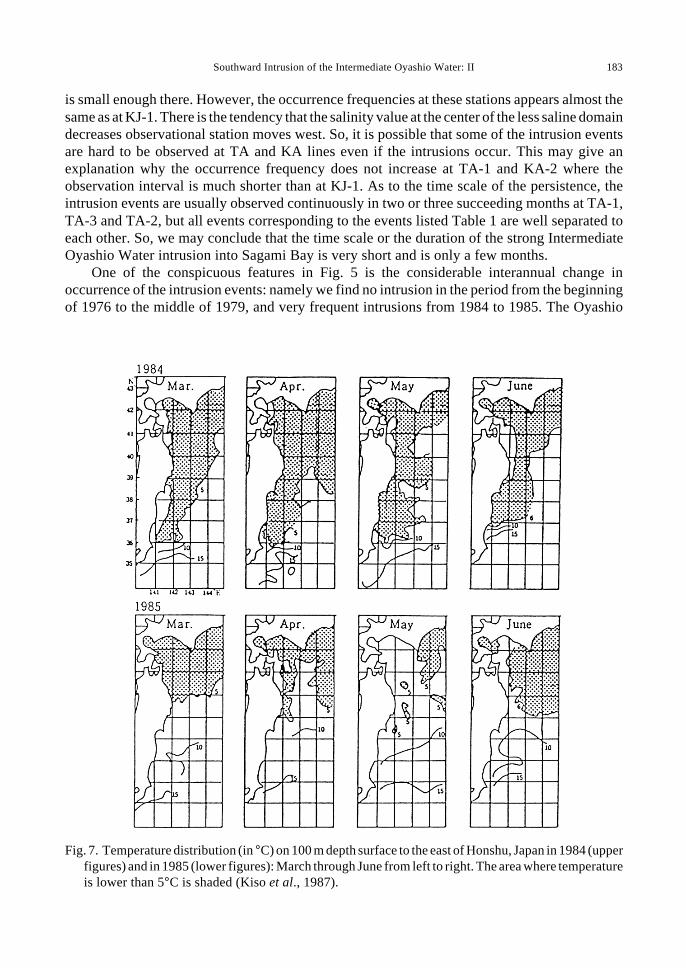
Fig. 7. Temperature distribution (in °C) on 100 m depth surface to the east of Honshu, Japan in 1984 (upperfigures) and in 1985 (lower figures): March through June from left to right. The area where temperatureis lower than 5°C is shaded (Kiso et al., 1987).
is small enough there. However, the occurrence frequencies at these stations appears almost thesame as at KJ-1. There is the tendency that the salinity value at the center of the less saline domaindecreases observational station moves west. So, it is possible that some of the intrusion eventsare hard to be observed at TA and KA lines even if the intrusions occur. This may give anexplanation why the occurrence frequency does not increase at TA-1 and KA-2 where theobservation interval is much shorter than at KJ-1. As to the time scale of the persistence, theintrusion events are usually observed continuously in two or three succeeding months at TA-1,TA-3 and TA-2, but all events corresponding to the events listed Table 1 are well separated toeach other. So, we may conclude that the time scale or the duration of the strong IntermediateOyashio Water intrusion into Sagami Bay is very short and is only a few months.
One of the conspicuous features in Fig. 5 is the considerable interannual change inoccurrence of the intrusion events: namely we find no intrusion in the period from the beginningof 1976 to the middle of 1979, and very frequent intrusions from 1984 to 1985. The Oyashio
184 S.-K. Yang et al.
Water (in the surface layer) extended significantly southward in 1974, 1977, 1981 and 1984(Sekine, 1988). But, it is hard to find any correlation with the occurrence of the IntermediateOyashio Water intrusions into Sagami Bay. In Fig. 7, the temperature distributions at 100 m depthsurface in March through June are given for 1984 and 1985 (Kiso et al., 1987). Although thestrong intrusion event is observed for both of the periods as seen in Fig. 5, the southwardexpansion of the Oyashio Water in the surface layer is quite different in 1984 and in 1985 (see,for example, the position of 5°C isotherm). We may conclude that the correlation between theoccurrence of the Intermediate Oyashio Water intrusion and the strength of the Oyashio Waterto the east of Honshu (say, the latitude of the southern tip of the 5°C isotherm). This seems tosuggest that the intrusion is triggered by some local oceanographic condition in the vicinity ofthe Boso Peninsula.
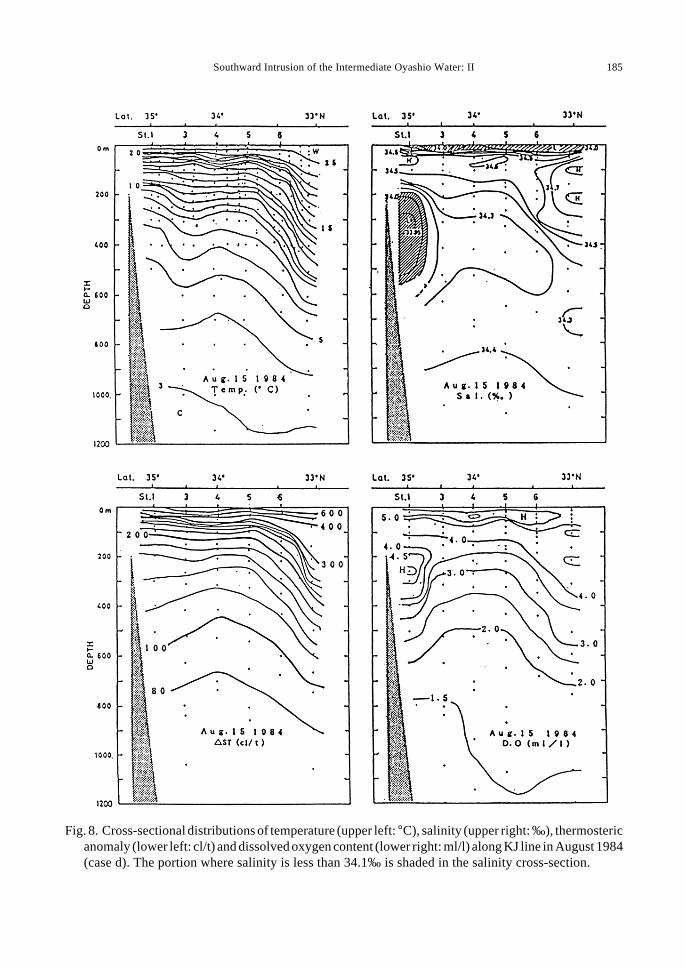
4. Structures of the Intruding Intermediate Oyashio WaterThe cross-sections of temperature, salinity, dissolved oxygen content, and thermosteric
anomaly along KJ line are shown in Figs. 8 through 10 for three cases d, f and g, respectively.As discussed in Part I, the coastal SML water is hardly identified in dissolved oxygen section forusual cases, because it does not form a high oxygen patch due to relatively large vertical gradientin the background of the oxygen content. However, for the case of very strong intrusion (casesb, c, d, f, and g), a high oxygen patch is clearly recognizable as seen in each figure of Figs. 8through 10. Such a high oxygen core is never found associated with the offshore SML water orwith the isolated SML water except for the case of August 1981 where the extraordinarily lesssaline water was found in the isolated SML water (Part I).
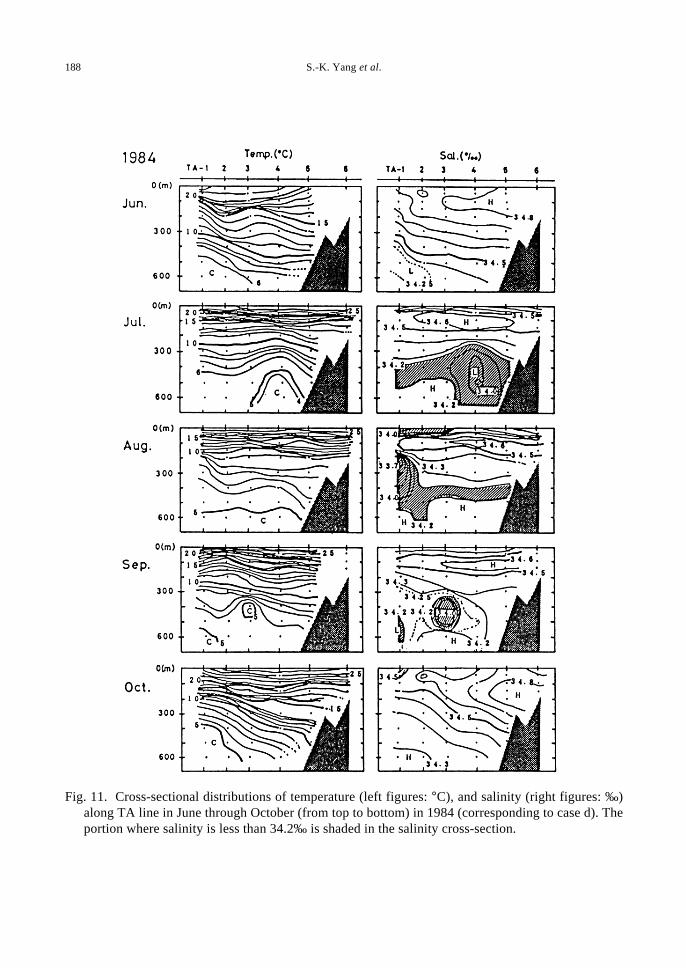
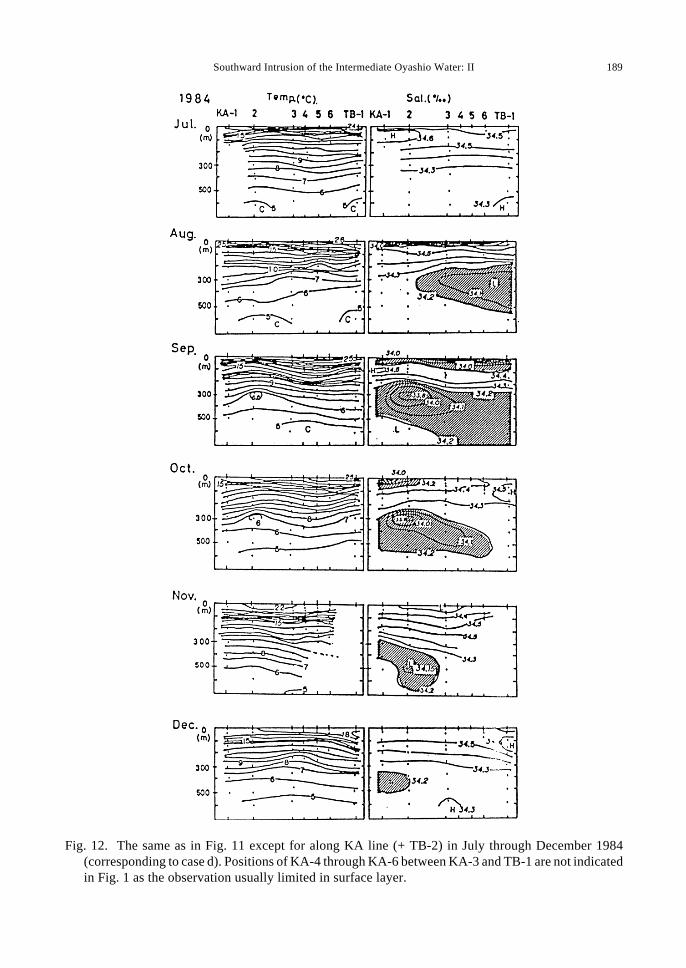
The temperature and salinity cross-sections along TA line for each month from June throughOctober 1984 are shown in Fig. 11. A less saline patch is consecutively observed in July throughSeptember, but its position is very variable: the center is located at TA-4 in July, at TA-1 inAugust and at TA-3 in September. The similar cross-sections are shown in Fig. 12 for KA line(+TB-1: see Fig. 1 for the positions of observation points) in July through December 1984. In thiscross-section, less saline patch is consecutively observed in August through December. The lesssaline patch seen along TA line in July (and along KA line in August) may be an eventindependent from those observed in later months, because its center is located much offshore thanthe later ones. This water would be independent to the intrusion event of case d, which is observedalong northeastern observation line (KJ) in August. Including this extra-event, there are someresemblance between the cross-sectional natures in Figs. 9 and 10 with lag of one month. Thislag corresponds roughly to the propagation speed (1 cm/s) shown in Fig. 6. It appears that theduration of the event d is about 2 months along TA line and 4 months along KA line from thesefigures. It is hard to conclude from the limited data, but this may suggest that the movement ofthe less saline patch is terminated at the middle of Sagami Bay as discussed before, so that theduration tends to increase there.
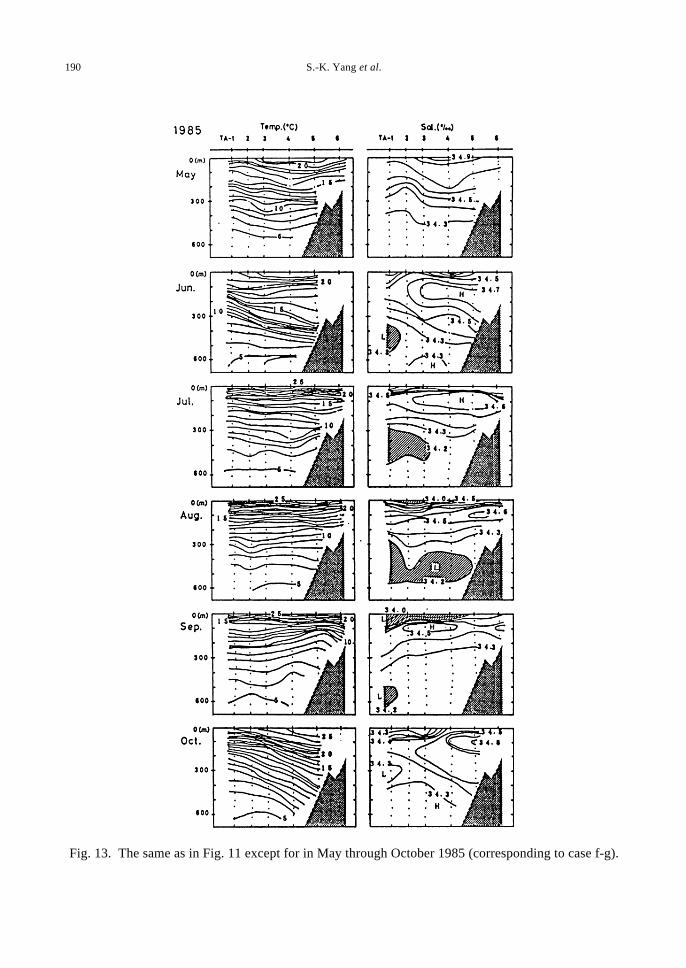
The temperature and salinity cross-sections along TA line in May through in October 1985are shown in Fig. 13. The intrusion event f-g is seen along KJ line in June and in August 1984(Figs. 9 and 10), and is consecutively seen along TA line in June through September. Thesefigures also indicate the intruding path of the Intermediate Oyashio Water into Sagami Bay. Itmay be noted that the distribution of thermosteric anomaly in Fig. 9 is quite different to that inFig. 10: the distribution in Fig. 10 indicates that the flow direction in and near the less saline patchis southward, but that in Fig. 9 northward. Of course, the instantaneous current feature does notnecessary to indicate the southern migration of the less saline water, because the cross-sectional
Southward Intrusion of the Intermediate Oyashio Water: II 185
Fig. 8. Cross-sectional distributions of temperature (upper left: °C), salinity (upper right: ‰), thermostericanomaly (lower left: cl/t) and dissolved oxygen content (lower right: ml/l) along KJ line in August 1984(case d). The portion where salinity is less than 34.1‰ is shaded in the salinity cross-section.

186 S.-K. Yang et al.
Fig. 9. The same as in Fig. 8 except for June 1985 (case f).

Southward Intrusion of the Intermediate Oyashio Water: II 187
Fig. 10. The same as in Fig. 8 except for August 1985 (case g).
188 S.-K. Yang et al.
Fig. 11. Cross-sectional distributions of temperature (left figures: °C), and salinity (right figures: ‰)along TA line in June through October (from top to bottom) in 1984 (corresponding to case d). Theportion where salinity is less than 34.2‰ is shaded in the salinity cross-section.
Southward Intrusion of the Intermediate Oyashio Water: II 189
Fig. 12. The same as in Fig. 11 except for along KA line (+ TB-2) in July through December 1984(corresponding to case d). Positions of KA-4 through KA-6 between KA-3 and TB-1 are not indicatedin Fig. 1 as the observation usually limited in surface layer.
190 S.-K. Yang et al.
Fig. 13. The same as in Fig. 11 except for in May through October 1985 (corresponding to case f-g).
Southward Intrusion of the Intermediate Oyashio Water: II 191
salinity feature only reflects the intrusion in past. However, this suggests that the southwardmigration of the less saline water does not carried by a constant southward flow, and that it iscarried by a fluctuating current, the direction of which may sometimes be changed.
5. Concluding RemarksIn Part I, it was shown that there always exists the coastal SML water just off the Boso
Peninsula, which is separated from the SML waters existing offshore of the current zone of theKuroshio (the offshore SML water). We assumed that the coastal SML water indicates thepathway along which the Intermediate Oyashio Water intrudes into Sagami Bay.
By selecting seven cases where we found the coastal SML water having abnormally highoxygen content and low salinity, we try to follow the intrusion manner of the IntermediateOyashio Water into Sagami Bay. Some of these water can be traced from the observation line(CA) to the east of the Boso Peninsula up to the line (KA) in the central part of Sagami Bay, andits propagation speed along the coast is shown to be of order of 1 cm/s.
It should noted, however, the horizontal scale of the intrusion phenomena is very small, andtheir detailed structures are hardly analyzed with the available data taken at the present routineobservation network even though the observation density in this area is fairly high as shown inFig. 1. The duration time scale of these strong intrusion events is only a few month, and even theobservations in monthly bases conducted by the Prefectural Fisheries Experimental Stationsappear not to enough to trace the movements of many of the intrusion events. The intrudingIntermediate Oyashio Water has usually complicated and layered structure in it, and exhibitslarge temporal and spatial variability. In order to clarify the detailed structure and detailedintruding manner of the intruding Intermediate Oyashio Water into Sagami Bay, we would needmuch more elaborated and specially designed observations in this area.
AcknowledgementsThe authors wishes to express their sincere thanks to Prof. Toshihiko Teramoto, Kanagawa
University for his encouragement throughout this work, and to Dr. Denzo Inagake, TohokuFisheries Research Institute for being supplied the necessary data. He is also indebted to thevarious Japanese national and prefectural research organizations for their kindness in supplyingthe necessary data, some of which were obtained through the Japan Ocean Data Center.
ReferencesKiso, K., I. Kumagai and M. Kaeriyama (1987): Spring migration of Masu Salmon (Oncorhynchus masou) as
determined by the tagging experiments performed in Sizugawa Bay, the east of Honshu, Japan. Bull. Tohoku Reg.Fish. Res. Lab., 49, 89–101 (in Japanese).
Omori, M. (1967): Calanus cristatus and submergence of the Oyashio water. Deep-Sea Res., 14, 525–532.Sekine, Y. (1988): Anomalous southward intrusion of the Oyashio east of Japan. 1. Influence of the seasonal and
interannual variations in the wind stress over the North Pacific. J. Geophys. Res., 93, 2247–2255.Taira, K. and T. Teramoto (1986): Path and volume transport of the Kuroshio current in Sagami Bay and their
relationship to cold water masses near Izu Peninsula. J. Oceanogr. Soc. Japan, 42, 212–223.Yang, S. K. (1989): Southward intrusion of the intermediate Oyashio Water along the east coast of the Boso
Peninsula, Japan. Sc. D. dissertation, University of Tokyo, 124 pp.Yang, S. K., Y. Nagata, K. Taira and M. Kawabe (1993): Southward intrusion of the Intermediate Oyashio Water
along the east coast of the Boso Peninsula—I. Coastal salinity-minimum-layer water off the Boso Peninsula. J.Oceanogr., 49, 89–114.