Embed Size (px)
Citation preview

Proceedings of the 48th Annual Forum on the
Geology of Industrial Minerals Scottsdale, Arizona | April 30 - May 4, 2012
Arizona Geological SurveySpecial Paper 9
Chapter #6
St. Peter Sandstone Mineral Resource Evaluation, Missouri, USA
Justin G. Davis

Special Paper 9
Officers and Organizers of the 48th Annual Forum on the Geology of Industrial Miner-Board of DirectorsPresident – Mark WolfVice President – Thomas NewmanSecretary – Stan Krukowski Treasurer – Vanessa Santos
MembersLynne CarpenterNelson ShafferDale Scott
Forum Steering CommitteeLynne Carpenter Dale Scott Dave Crouse Greta Orris
Bates Scholarship Trustees - RLBMSFGeorge EdwardsRoger SharpePeter HarbenVanessa SantosGretchen HoffmanMarion WigginsTom Newman
Arizona Geological Survey
Proceedings of the
48th Annual Forum on the Geology of Industrial Minerals Scottsdale, Arizona | April 30 - May 4, 2012
Suggested Citation: Davis, J.G., 2014, St. Peter Sandstone Mineral Resource Evaluation, Missouri, USA, in, Conway, F.M., ed., Proceedings of the 48th Annual Forum on the Geology of Industrial Minerals, Phoenix, Arizona, April 30 - May 4, 2012. Arizona Geological Survey Special Paper #9, Chapter 6, p. 1-7.
M. Lee Allison, State Geologist and DirectorThis publication was prepared by an agency of the State
of Arizona. The State of Arizona, or any agency thereof, or any of their employees, makes no warranty, expressed or implied, or assumes any legal liability or responsibility for the accuracy, completeness, or usefulness of any information, apparatus, product, or process disclosed in this report. Any use of trade, product, or firm names in this publication is for descriptive purposes only and does not imply endorsement by the State of Arizona.
For information on the mission, objectives or geologic products of the Arizona Geological Survey visit www.azgs.az.gov.
Manuscript approved for publication in 2014. Printed by the Arizona Geological Survey. All rights reserved.
1St. Peter Sandstone Mineral Resource Evaluation, Missouri, USA
Table of Contents
Abstract 2Introduction 3Geology 3Industrial Usage 4Mining 4Evaluation Findings 4References 6

2 St. Peter Sandstone Mineral Resource Evaluation, Missouri, USA
St. Peter Sandstone Mineral Resource Evaluation, Missouri, USA
Justin G. Davis Missouri Department of Natural Resources ,
Division of Geology and Land Survey, Rolla, [email protected]
ABSTRACTThe St. Peter Sandstone is typically a well-sorted, friable, ultra-pure, fine- to medium-
grained, quartzose sandstone with silica content higher than 99 weight percent in places. The sand grains are well-rounded, highly spherical and characteristically frosted. Their size typically varies from 2 millimeters diameter (No. 10 U.S. Standard Sieve Series size) to less than 0.08 millimeters diameter (No. 200 U.S. Standard Sieve Series size). A freshly exposed surface of the formation is commonly white with shades of pink and green. Weathered surfaces are a dirty gray or brown and are case-hardened at many localities. Bedding is characteristically indistinct, and the formation usually appears massive throughout. The rock is cross-bedded and ripple-marked locally. The formation is generally porous, permeable and rarely fossiliferous in Missouri. The St. Peter is continuously present in the subsurface in the northern half of the state and along the southeastern edge of the state. The St. Peter crops out in a narrow band that starts in western Montgomery County and runs southeastward, along the Missouri River, to just west of St. Louis and continues south, just west of the Mississippi River, through Scott County. The outcrop belt varies from less than one mile wide to over ten miles wide, and it is over 150 miles in length. The formation dips into the subsurface radially away from the outcrop band. A notable isolated outcrop occurs in Lincoln County to the north of the main outcrop band. The St. Peter is discontinuously present in the subsurface along a band in the west-central portion of the state. It is not present at the surface or in subsurface in the remainder of the state. The formation averages 80–100 feet thick. There is an estimated 3.8 trillion short tons of St. Peter in Missouri. Sieve analyses on drill cuttings indicate three subsurface locations in northeastern Missouri where the St. Peter is greater than 10 percent by weight of sand falling in the 20–40 U.S. Standard Sieve Series size range. The St. Peter was first produced in Missouri in the 1870s for the manufacture of glass. Since that time it has been used as a paint additive, filler material, polishing compound, filtering media, and recently it is commonly used as a fracture proppant in oil and gas wells. The St. Peter is currently quarried and produced in Missouri from four sites located in St. Louis, Jefferson and Perry counties. In the same area there are at least nine abandoned historic mine sites.
3St. Peter Sandstone Mineral Resource Evaluation, Missouri, USA
Introduction The St. Peter Sandstone is a sedimentary rock
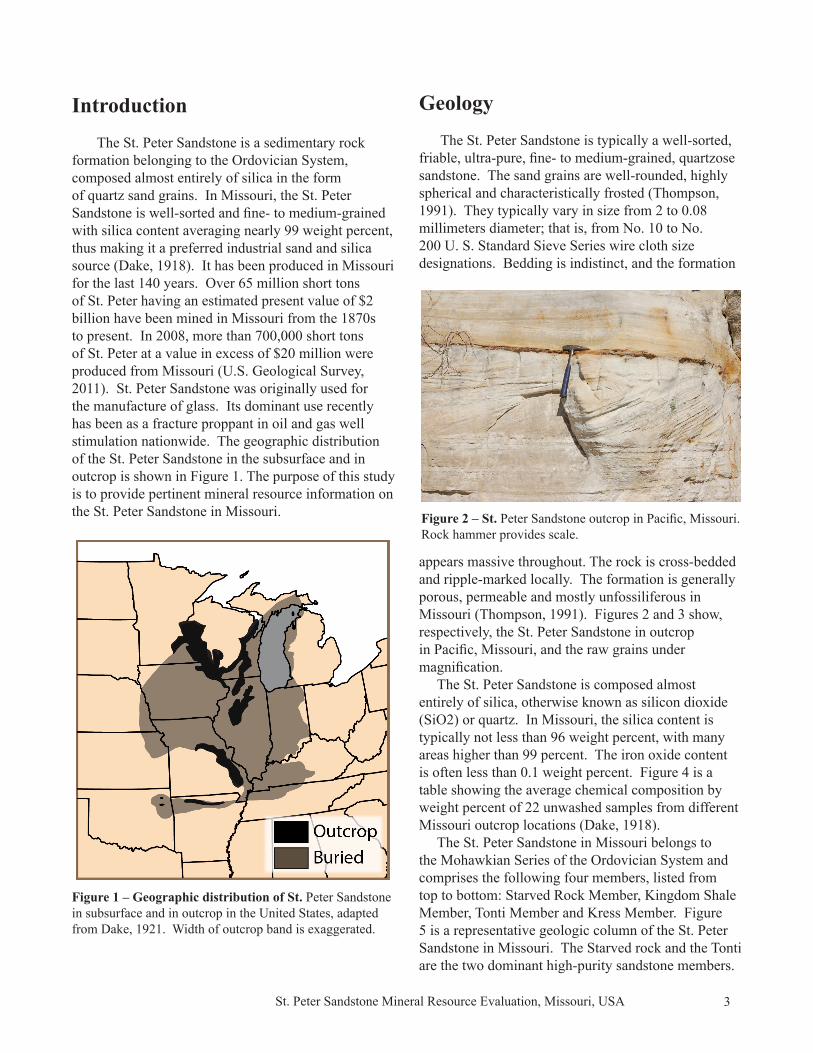
formation belonging to the Ordovician System, composed almost entirely of silica in the form of quartz sand grains. In Missouri, the St. Peter Sandstone is well-sorted and fine- to medium-grained with silica content averaging nearly 99 weight percent, thus making it a preferred industrial sand and silica source (Dake, 1918). It has been produced in Missouri for the last 140 years. Over 65 million short tons of St. Peter having an estimated present value of $2 billion have been mined in Missouri from the 1870s to present. In 2008, more than 700,000 short tons of St. Peter at a value in excess of $20 million were produced from Missouri (U.S. Geological Survey, 2011). St. Peter Sandstone was originally used for the manufacture of glass. Its dominant use recently has been as a fracture proppant in oil and gas well stimulation nationwide. The geographic distribution of the St. Peter Sandstone in the subsurface and in outcrop is shown in Figure 1. The purpose of this study is to provide pertinent mineral resource information on the St. Peter Sandstone in Missouri.
Geology The St. Peter Sandstone is typically a well-sorted,
friable, ultra-pure, fine- to medium-grained, quartzose sandstone. The sand grains are well-rounded, highly spherical and characteristically frosted (Thompson, 1991). They typically vary in size from 2 to 0.08 millimeters diameter; that is, from No. 10 to No. 200 U. S. Standard Sieve Series wire cloth size designations. Bedding is indistinct, and the formation
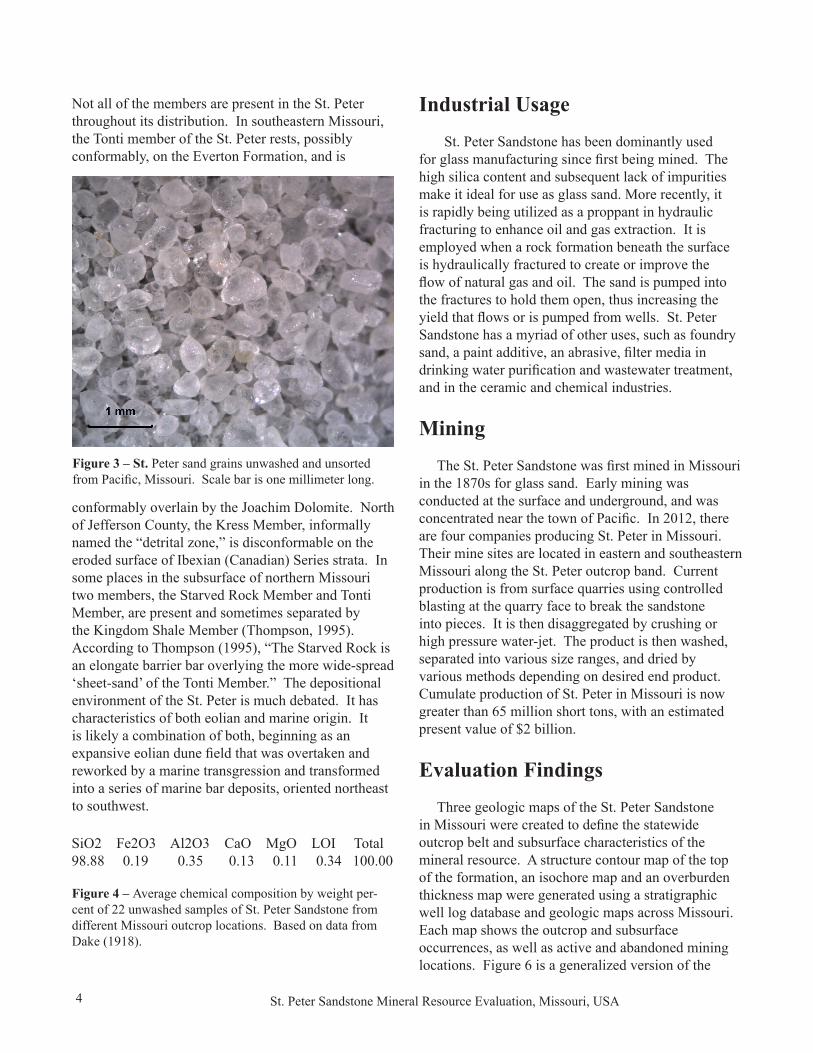
appears massive throughout. The rock is cross-bedded and ripple-marked locally. The formation is generally porous, permeable and mostly unfossiliferous in Missouri (Thompson, 1991). Figures 2 and 3 show, respectively, the St. Peter Sandstone in outcrop in Pacific, Missouri, and the raw grains under magnification.
The St. Peter Sandstone is composed almost entirely of silica, otherwise known as silicon dioxide (SiO2) or quartz. In Missouri, the silica content is typically not less than 96 weight percent, with many areas higher than 99 percent. The iron oxide content is often less than 0.1 weight percent. Figure 4 is a table showing the average chemical composition by weight percent of 22 unwashed samples from different Missouri outcrop locations (Dake, 1918).
The St. Peter Sandstone in Missouri belongs to the Mohawkian Series of the Ordovician System and comprises the following four members, listed from top to bottom: Starved Rock Member, Kingdom Shale Member, Tonti Member and Kress Member. Figure 5 is a representative geologic column of the St. Peter Sandstone in Missouri. The Starved rock and the Tonti are the two dominant high-purity sandstone members.
Figure 1 – Geographic distribution of St. Peter Sandstone in subsurface and in outcrop in the United States, adapted from Dake, 1921. Width of outcrop band is exaggerated.
Figure 2 – St. Peter Sandstone outcrop in Pacific, Missouri. Rock hammer provides scale.
4 St. Peter Sandstone Mineral Resource Evaluation, Missouri, USA
Not all of the members are present in the St. Peter throughout its distribution. In southeastern Missouri, the Tonti member of the St. Peter rests, possibly conformably, on the Everton Formation, and is
conformably overlain by the Joachim Dolomite. North of Jefferson County, the Kress Member, informally named the “detrital zone,” is disconformable on the eroded surface of Ibexian (Canadian) Series strata. In some places in the subsurface of northern Missouri two members, the Starved Rock Member and Tonti Member, are present and sometimes separated by the Kingdom Shale Member (Thompson, 1995). According to Thompson (1995), “The Starved Rock is an elongate barrier bar overlying the more wide-spread ‘sheet-sand’ of the Tonti Member.” The depositional environment of the St. Peter is much debated. It has characteristics of both eolian and marine origin. It is likely a combination of both, beginning as an expansive eolian dune field that was overtaken and reworked by a marine transgression and transformed into a series of marine bar deposits, oriented northeast to southwest.
Industrial Usage St. Peter Sandstone has been dominantly used
for glass manufacturing since first being mined. The high silica content and subsequent lack of impurities make it ideal for use as glass sand. More recently, it is rapidly being utilized as a proppant in hydraulic fracturing to enhance oil and gas extraction. It is employed when a rock formation beneath the surface is hydraulically fractured to create or improve the flow of natural gas and oil. The sand is pumped into the fractures to hold them open, thus increasing the yield that flows or is pumped from wells. St. Peter Sandstone has a myriad of other uses, such as foundry sand, a paint additive, an abrasive, filter media in drinking water purification and wastewater treatment, and in the ceramic and chemical industries.
Mining The St. Peter Sandstone was first mined in Missouri
in the 1870s for glass sand. Early mining was conducted at the surface and underground, and was concentrated near the town of Pacific. In 2012, there are four companies producing St. Peter in Missouri. Their mine sites are located in eastern and southeastern Missouri along the St. Peter outcrop band. Current production is from surface quarries using controlled blasting at the quarry face to break the sandstone into pieces. It is then disaggregated by crushing or high pressure water-jet. The product is then washed, separated into various size ranges, and dried by various methods depending on desired end product. Cumulate production of St. Peter in Missouri is now greater than 65 million short tons, with an estimated present value of $2 billion.
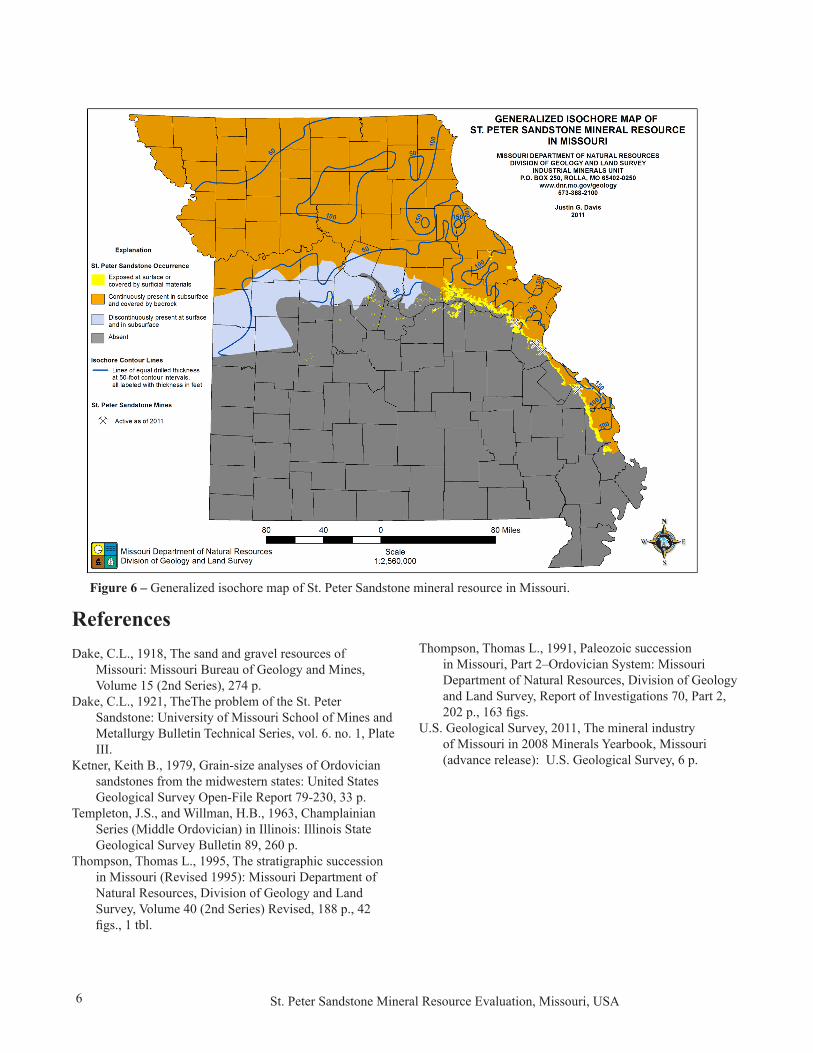
Evaluation FindingsThree geologic maps of the St. Peter Sandstone
in Missouri were created to define the statewide outcrop belt and subsurface characteristics of the mineral resource. A structure contour map of the top of the formation, an isochore map and an overburden thickness map were generated using a stratigraphic well log database and geologic maps across Missouri. Each map shows the outcrop and subsurface occurrences, as well as active and abandoned mining locations. Figure 6 is a generalized version of the
Figure 3 – St. Peter sand grains unwashed and unsorted from Pacific, Missouri. Scale bar is one millimeter long.
SiO2 Fe2O3 Al2O3 CaO MgO LOI Total98.88 0.19 0.35 0.13 0.11 0.34 100.00
Figure 4 – Average chemical composition by weight per-cent of 22 unwashed samples of St. Peter Sandstone from different Missouri outcrop locations. Based on data from Dake (1918).

5St. Peter Sandstone Mineral Resource Evaluation, Missouri, USA
isochore map with contours illustrating the drill thickness of the formation at 50-foot intervals. The St. Peter is continuously present in the subsurface in the northern half of the state and the southeastern edge of the state. The St. Peter crops out in a narrow
band that starts in western Montgomery County and runs southeastward, along the Missouri River, to just west of St. Louis and continues south, just west of the Mississippi River, through Scott County. The outcrop band varies from less than one mile wide to over ten miles wide, and it is more than 150 miles in length. The formation dips into the subsurface radially away from the outcrop band. A notable isolated outcrop occurs in Lincoln County to the north of the main outcrop band. The St. Peter is discontinuously present in the subsurface along a band in the west-central
portion of the state. The St. Peter is not present at the surface or in subsurface in the remainder of the state. The formation averages 80–100 feet thick. There is an estimated 3.8 trillion short tons of St. Peter Sandstone reserves in Missouri.
According to Templeton and Willman (1963) the Tonti Member, which is the lower sandstone member of the St. Peter, is considered the finer-grained member, and the Starved Rock is considered the medium-grained member of the formation. However, sieve analyses of a limited number of drill cuttings samples from Missouri suggest that medium-grained sand preferentially occurs towards the bottom of the St. Peter deposit, which is the Tonti Member, and the finer-grained sand occurs towards the top in the Starved Rock Member.
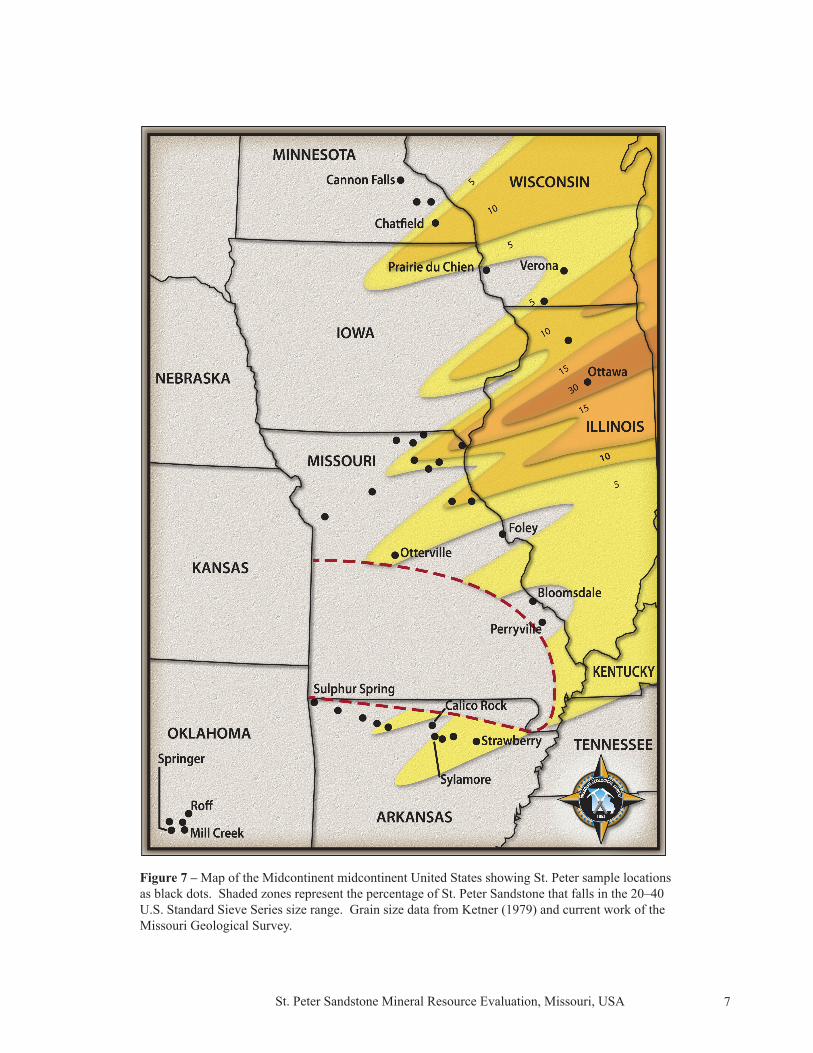
Based on sieve analyses of drill cuttings from Missouri and sieve data contained in Ketner (1979) approximately 50 percent of the St. Peter in Missouri has a grain size that falls within the 40–70 U.S. Standard Sieve Series size range. The highest percentage of coarser sand occurs in the subsurface of the northeast corner of the state. Figure 7 shows sample locations and shaded zones representing the percentage of sand in the St. Peter that falls in the 20-40 U.S. Standard Sieve Series size bracket. At three subsurface sample locations, the amount of sand within the 20–40 size range is greater than 10 weight percent. Figure 7 also demonstrates the northeast to southwest trend, supporting the idea that the sand is a succession of marine bars created by stepwise northward transgression of the sea over and across an eolian dune field. This map is intended to serve as a starting point for those interested in the coarser size fraction of the St. Peter. It should be noted that the shaded zones outside the State of Missouri are estimations based solely on the sample data contained in Ketner (1979). Further research is needed to verify these trends. Persons wanting more information on the St. Peter Sandstone in Missouri or wanting to inquire about the above mentioned maps, should contact the author.
Figure 5 – Representative geologic column of the St. Peter Sandstone and bounding units. Adapted from Thomson (1995).
6 St. Peter Sandstone Mineral Resource Evaluation, Missouri, USA
ReferencesDake, C.L., 1918, The sand and gravel resources of
Missouri: Missouri Bureau of Geology and Mines, Volume 15 (2nd Series), 274 p.
Dake, C.L., 1921, TheThe problem of the St. Peter Sandstone: University of Missouri School of Mines and Metallurgy Bulletin Technical Series, vol. 6. no. 1, Plate III.
Ketner, Keith B., 1979, Grain-size analyses of Ordovician sandstones from the midwestern states: United States Geological Survey Open-File Report 79-230, 33 p.
Templeton, J.S., and Willman, H.B., 1963, Champlainian Series (Middle Ordovician) in Illinois: Illinois State Geological Survey Bulletin 89, 260 p.
Thompson, Thomas L., 1995, The stratigraphic succession in Missouri (Revised 1995): Missouri Department of Natural Resources, Division of Geology and Land Survey, Volume 40 (2nd Series) Revised, 188 p., 42 figs., 1 tbl.
Thompson, Thomas L., 1991, Paleozoic succession in Missouri, Part 2–Ordovician System: Missouri Department of Natural Resources, Division of Geology and Land Survey, Report of Investigations 70, Part 2, 202 p., 163 figs.
U.S. Geological Survey, 2011, The mineral industry of Missouri in 2008 Minerals Yearbook, Missouri (advance release): U.S. Geological Survey, 6 p.
Figure 6 – Generalized isochore map of St. Peter Sandstone mineral resource in Missouri.
7St. Peter Sandstone Mineral Resource Evaluation, Missouri, USA
Figure 7 – Map of the Midcontinent midcontinent United States showing St. Peter sample locations as black dots. Shaded zones represent the percentage of St. Peter Sandstone that falls in the 20–40 U.S. Standard Sieve Series size range. Grain size data from Ketner (1979) and current work of the Missouri Geological Survey.