Embed Size (px)
Citation preview
─ ─45
広島文教女子大学紀要 53,2018
Abstract
The Bunkyo English Speaking Tests (BESTs) are used at the Bunkyo English Communication Centre (BECC) as part of a wider, CEFR aligned assessment system for the English Communication (英語コミュニケーション) classes I, II, III and IV. These make up the General English (GE) first- and second-year courses for all students at Hiroshima Bunkyo Women’s University. There are four speaking tests, one at the end of each semester. The tests consist of three parts, based on different sections of the Cambridge KET and PET tests. The BESTs aim to track students’ improvement in speaking and are based on content from our self-made curriculum. At the same time, we are trying to place students at their correct levels within the CEFR bands of A1–B1 or above, in line with our curriculum goals and streaming bands. We also wish to provide students with constructive feedback to inform their materials choice in our Self Access Learning Centre (SALC). Firstly, this report gives a brief explanation of the context and development of the BESTs, and the rubrics developed based on CEFR ‘can-do’ descriptors and external examiner training and experience. It will then cover the reasons why all members of the teaching and student advisory staff need to be on the same page regarding both the running and the grading of the speaking tests. After a brief overview of the concepts of rater/interlocutor strictness and leniency, it will detail how we go about the training and standardizing of our teachers, and the need to work out fair scores using Excel documents and Rasch Facets. This is followed by a simple explanation of Rasch Facets and its uses. After discussing washback from the BESTs and teacher training, it will outline ongoing and future improvements that can be made.
概 要
Bunkyo English Speaking Tests(BEST)は,英語コミュニケーション(GE)コース I, II, III, IVの 1 年生と 2 年生の学生向けで,CEFR【Common European Framework of Reference for Languages,ヨーロッパ言語共通参照枠。語学のコミュニケーション能力を広く測るこの国際標準規格】準拠,かつ広範囲をカバーする評価システムの一環として,広島文教女子大学英語コミュニケーションセンター(BECC)【広島文教女子大学が新設した英語教育用施設】で実施されている。4 種のテストがあり,1 種ずつ各学期の終わりに行われる。その内容はケンブ
【原著】
Standardizing Teacher Training for CEFR-based Speaking Assessments
Richard Sugg and Jordan Svien
CEFRを用いたスピーキングテスト評価標準化のための教員研修
Richard Sugg and Jordan Svien

─ ─46
リッジ英検のキー(KET)テストおよびプレリミナリー(PET)テストの各セクションに沿って 3 つのパートから構成されている。BEST では,スピーキングにおける改善の記録を目的とし,独自のカリキュラムの内容に基づいている。と同時に,独自のカリキュラムが設定する目標や能力別クラス編成に従い,CEFR における A1–B1 レベルかそれ以上のレベルまで学生を教育することを目指している。また,セルフアクセスラーニングセンター(SALC)において個々人にあった教材の選択を助言できるよう,学生に建設的なフィードバックを提供することを理想としている。まず今回の報告書では,BEST の内容とその発展,つまり CEFR の「CAN-DO」リストや学外の試験官訓練と経験に基づき開発された規定について,簡単な説明を行う。次に,スピーキング試験の実施と評価のいずれにおいても,教師陣および学生へのアドバイススタッフの全員が,同じ情報を共有しなければならない理由を解説する。評価者または面談者が持つべき厳格さと寛容さについて概説した後,教師に対する教育と標準化について,そして Excel 文書とラッシュ分析を使用して公正なスコアを作成する必要性について詳しく解説する。その最後には,ラッシュ分析とその用途についても簡単に説明する。BEST からのウォッシュバック効果【目標となる入試の変化がそれまでの教育手法に影響を与えること】および教員教育について述べた後,達成が可能な継続的かつ将来的な改善についても概説する。
A Summary of the BECC’s General English Course Proficiency Tests
The BECC has given reading and listening tests to all first and second-year English Communication class students in the General English (GE) course since its inception in 2008. Currently, English Communication I and II are compulsory for all first-year students in the five departments of Global Communication, Early Childhood Education, Welfare, Nutrition, and Psychology. English Communication III and IV are compulsory for all Global Communication students and are elective subjects for the other four departments. The tests are held at the beginning of the first year, the end of the first year, and again at the end of the second year. For all courses, in the past, these tests acted as both streaming tests and as a method to bolster weaker students’ grades beyond the course pass line. As of 2013, along with the whole of the GE curriculum, these tests were rewritten to target the CEFR (COE, 2001, updated 2018) A1 to B1 levels and were renamed the Bunkyo English Tests (BETs). However, the focus from an institutional point of view has now shifted to using them as a means of tracking and improving student progress in L2 proficiency. (For a full description, see Bower et al, 2014).
In 2010, four speaking tests were added to the above tests for all students, with one being taken at the end of each semester. Rather than a means of accurate student assessment, these were again more of a way of making less motivated students study to the end of the course. The tests consisted of one teacher conducting paired interviews and grading both students holistically. The tests consisted of a short interview and role-plays using three out of six speaking activities taken directly from the curriculum. However, as double grading is needed to ensure reliable direct test scores (Taylor and Galaczi, 2011), these test results could not be used as part of the student streaming. While many may disregard this as a more traditional Japanese high school style of assessment, it does have its place in that it makes objectives clear to students and lets them know

─ ─47
Standardizing Teacher Training for CEFR-based Speaking Assessments
what they should cover for their test. As with any test, the “need to pass” and the chance to get points are also extrinsically motivating. Sadly, this style of test bears little resemblance to any “real world” situation in which a student may find themselves and makes it very difficult to gauge or track any form of student progress or speaking ability in terms relative to the CEFR. It can also lead to teachers “drilling” one activity to students who in turn just memorize word for word for the test. Another drawback was that after the tests, students usually received no feedback on their performance other than their grade, and that was only if they had actually failed their course.
The Introduction of the Bunkyo English Speaking Tests (BESTs)
In 2015 the decision was taken to bring the speaking tests into line with the remainder of the now CEFR based English Communication I, II, III and IV General English curriculum. The format was to remain a three-part paired speaking test but be double rated by an interlocutor using a holistic rubric and a rater using an analytic rubric. As when making the BETs in 2013, there were no CEFR based speaking tests readily available, so we once again turned to the Cambridge Key English Test (KET) and the Cambridge Preliminary English Test (PET) (The writers used the 2012 a and b versions at the time; updated versions can be found at University of Cambridge ESOL Examinations, 2016) for inspiration. After a review of past tests and the above-mentioned handbooks, two parts of the KET speaking test and one part of the PET speaking test were chosen to best fit our time frame (two 90-minute classes within the university’s exam week) and curriculum speaking activities. These speaking tasks were analysed, and detailed specifications were made and added to the already existing BET specifications (Bower et al, 2014). The new speaking tests were then made using these specifications, “can do” statements, situations, and vocabulary from the curriculum, but care was taken to make sure that no prompts beyond the simple introduction questions answered by all students were word for word copies from the GE course lessons. As with any test, prompt wording, instruction translation and topic choice have been changed or modified based on both teacher and student feedback. The current BEST specifications also incorporate these changes. As well as being used to create the tests, the specifications also help clarify for teachers what each part of the test is actually trying to assess. As of July 2018, to improve consistency and to maintain fairness for all, it was also decided to have a standard time limit of 10 minutes for each pair. Table 1 below lists the updated BEST specifications for 2018.
Table 1. BEST specifications (abridged for test security reasons)
Speaking Section – Structure and tasks
PART 1 (Modelled on KET Speaking Part 1)
Task Type Informational exchange with the interlocutor
Format The interlocutor will ask students standardized questions. There is no visual prompt.
Task Focus Giving information of a factual, personal kind, such as name, place of origin, occupation, family, everyday routines, likes and dislikes.

─ ─48
Can Dos Targeted
A2• I can describe myself, my family and other people. • I can describe my education, my present or last job.• I can describe my hobbies and interests.• I can describe my home and where I live.• I can describe what I did at the weekend or on my last holiday.• I can talk about my plans for the weekend or on my next holiday. • I can understand what people say to me in simple, everyday conversation, if they
speak clearly and slowly and give me help.
Items One
Timing 2–3 minutes
Task Specifications
This task contains two phases:
1. The interlocutor asks simple informational questions to each student in turn. This phase takes about one minute. Each student is asked six short questions. These questions are the same on all test versions.
2. Each student is asked one question that allows her to attempt a longer answer. Each student will be expected to give a two or three sentence answer, or in more advanced cases (time allowing) for up to one minute. If a student cannot answer at all, a back-up question is asked. Each semester has a different version of this task depending on topics covered in the curriculum. This phase can take up to two minutes.
PART 2 (Modelled on KET Speaking Part 2)
Task Type Paired speaking task
Format Test takers ask and answer questions eliciting factual information using prompt cards.
Task Focus Eliciting and giving factual information about a place or event based on a short written notice or advertisement, and brief questions prompts.
Can Dos Targeted
CEFR A2 – Reading for OrientationCan find specific, predictable information in simple everyday material such as advertisements, prospectuses, menus, reference lists and timetables.
CEFR A2 – Overall Spoken InteractionCan communicate in simple and routine tasks requiring a simple and direct exchange of information on familiar and routine matters to do with work and free time.
CEFR A2 – ConversationCan generally understand clear, standard speech on familiar matters directed at him/her, provided he/she can ask for repetition or reformulation from time to time.
CEFR A2+ – Information ExchangeCan deal with practical everyday demands: finding out and passing on straightforward factual information.
CEFR A2 – Information ExchangeCan communicate in simple and routine tasks requiring a simple and direct exchange of information.
Timing 30 seconds to read the information on the cards, 2 minutes to ask and answer the questions. Repeat for the second student. (Total 5 minutes)
─ ─49
Standardizing Teacher Training for CEFR-based Speaking Assessments
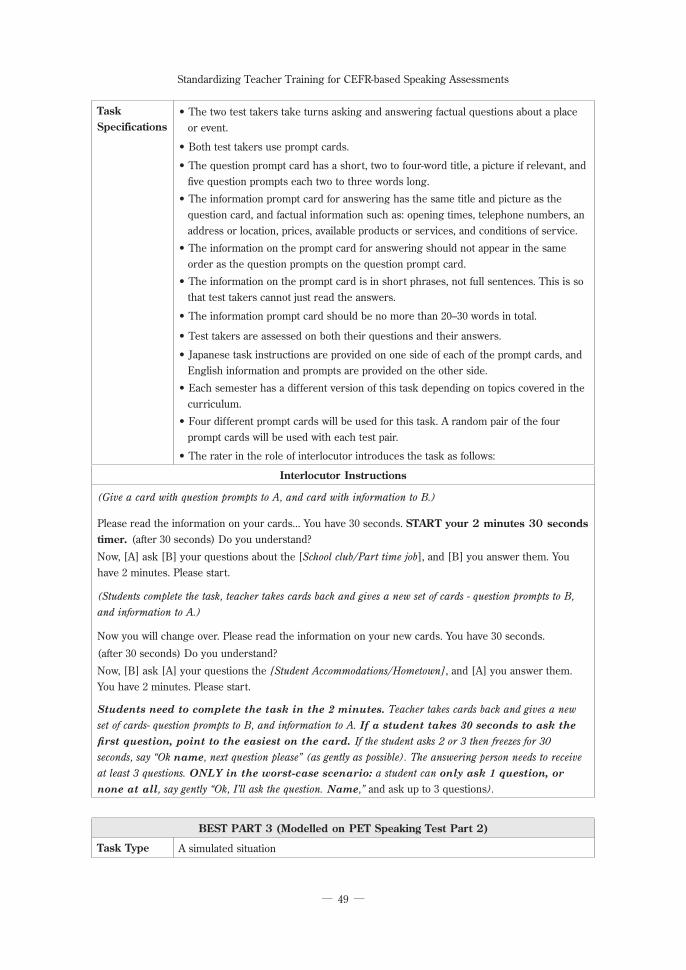
Task Specifications
• The two test takers take turns asking and answering factual questions about a place or event.
• Both test takers use prompt cards.
• The question prompt card has a short, two to four-word title, a picture if relevant, and five question prompts each two to three words long.
• The information prompt card for answering has the same title and picture as the question card, and factual information such as: opening times, telephone numbers, an address or location, prices, available products or services, and conditions of service.
• The information on the prompt card for answering should not appear in the same order as the question prompts on the question prompt card.
• The information on the prompt card is in short phrases, not full sentences. This is so that test takers cannot just read the answers.
• The information prompt card should be no more than 20–30 words in total.
• Test takers are assessed on both their questions and their answers.
• Japanese task instructions are provided on one side of each of the prompt cards, and English information and prompts are provided on the other side.
• Each semester has a different version of this task depending on topics covered in the curriculum.
• Four different prompt cards will be used for this task. A random pair of the four prompt cards will be used with each test pair.
• The rater in the role of interlocutor introduces the task as follows:
Interlocutor Instructions
(Give a card with question prompts to A, and card with information to B.)
Please read the information on your cards... You have 30 seconds. START your 2 minutes 30 seconds timer. (after 30 seconds) Do you understand?
Now, [A] ask [B] your questions about the [School club/Part time job], and [B] you answer them. You have 2 minutes. Please start.
(Students complete the task, teacher takes cards back and gives a new set of cards - question prompts to B, and information to A.)
Now you will change over. Please read the information on your new cards. You have 30 seconds.
(after 30 seconds) Do you understand?
Now, [B] ask [A] your questions the [Student Accommodations/Hometown], and [A] you answer them. You have 2 minutes. Please start.
Students need to complete the task in the 2 minutes. Teacher takes cards back and gives a new set of cards- question prompts to B, and information to A. If a student takes 30 seconds to ask the first question, point to the easiest on the card. If the student asks 2 or 3 then freezes for 30 seconds, say “Ok name, next question please” (as gently as possible). The answering person needs to receive at least 3 questions. ONLY in the worst-case scenario: a student can only ask 1 question, or none at all, say gently “Ok, I’ll ask the question. Name,” and ask up to 3 questions).
BEST PART 3 (Modelled on PET Speaking Test Part 2)
Task Type A simulated situation

─ ─50
Format The interlocutor gives pictures to the students to help a discussion task and sets up the activity.
Task Focus Students use functional language to make and respond to suggestions, discuss alternatives, make recommendations and come to an agreement.
Can Dos Targeted
SPOKEN INTERACTION
· B1 Lower: Can enter unprepared into conversation of familiar topics, express personal opinions and exchange information on topics that are familiar, of personal interest or pertinent to everyday life. (e.g. family, hobbies, work, travel and current events).
· A2 Higher: Can interact with reasonable ease in structured situations and short conversations, provided the other person helps if necessary. Can manage simple, routine exchanges without undue effort; can ask and answer questions and exchange ideas and information on familiar topics in predictable everyday situations.
CONVERSATION
· B1: Can enter unprepared into conversations on familiar topics.
· A2 Higher: Can participate in short conversations in routine contexts on topics of interests.
INFORMAL DISCUSSION
· B1 Higher: Can compare and contrast alternatives, discussing what to do, where to go, who or which to choose etc.
· B1 Lower: Can make his/her opinions and reactions understood as regards solutions to problems or practical questions of where to go, what to do or how to organize an event.
Timing 2–3 minutes
Task Specifications
This is a simulated situation where students are asked to make and respond to suggestions, discuss alternatives, make recommendations and come to an agreement with their partner.
This differs from a role-play as students are giving their own opinions about a given situation, rather than playing a role.
The interlocutor sets up the task and then takes no further part. If there is a complete breakdown in interaction, the interlocutor may intervene with gestures, or ask students to “move on”, but will not take part in the task.
Students are given pictures but may introduce their own ideas. Students are graded on their ability to take part in the task, the appropriateness of language and their interaction, rather than their ability to make a decision. Therefore, it is not necessary for them to complete the task in the time given. Also, if they have finished within the time, the interlocutor can end the task.
Students are given a sheet of pictures (a card) designed to generate ideas as a basis for discussion. The card will have one main picture which represents the situation surrounded by six smaller pictures representing the options/hints for discussion. A word can be used in addition to the pictures for part 3 if a suitable clear picture cannot be found.
· The task instructions will be IN JAPANESE on the BACK of the card.
· All prompts should be based on classroom pair or group discussion tasks.
· There should be 4 different situation cards for teachers to distribute randomly to students.
─ ─51
Standardizing Teacher Training for CEFR-based Speaking Assessments
BEST Rubric Development
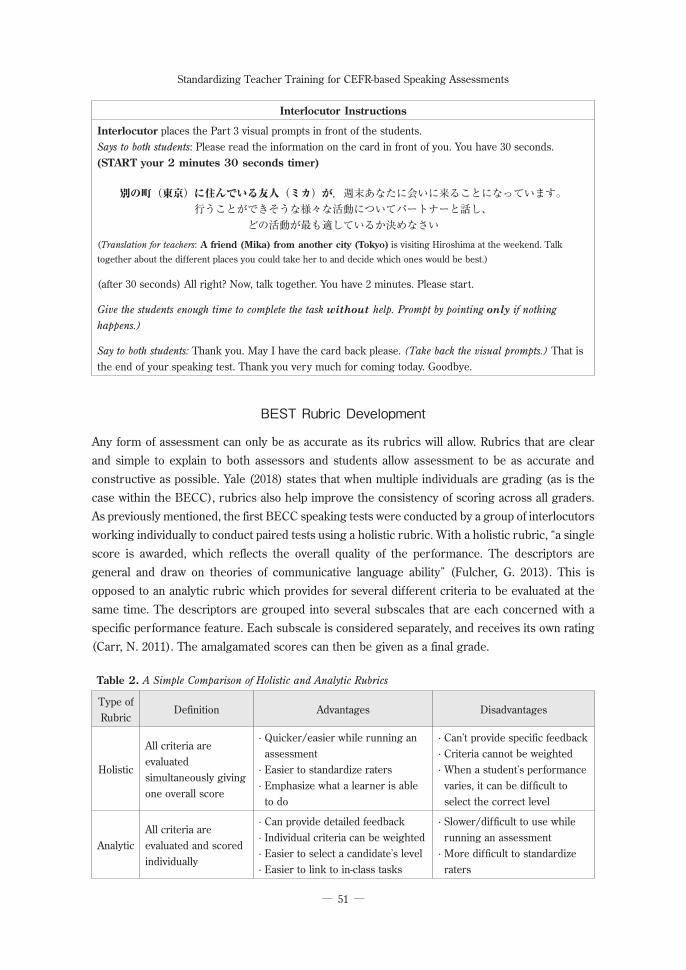
Any form of assessment can only be as accurate as its rubrics will allow. Rubrics that are clear and simple to explain to both assessors and students allow assessment to be as accurate and constructive as possible. Yale (2018) states that when multiple individuals are grading (as is the case within the BECC), rubrics also help improve the consistency of scoring across all graders. As previously mentioned, the first BECC speaking tests were conducted by a group of interlocutors working individually to conduct paired tests using a holistic rubric. With a holistic rubric, “a single score is awarded, which reflects the overall quality of the performance. The descriptors are general and draw on theories of communicative language ability” (Fulcher, G. 2013). This is opposed to an analytic rubric which provides for several different criteria to be evaluated at the same time. The descriptors are grouped into several subscales that are each concerned with a specific performance feature. Each subscale is considered separately, and receives its own rating (Carr, N. 2011). The amalgamated scores can then be given as a final grade.
Table 2. A Simple Comparison of Holistic and Analytic Rubrics
Type of Rubric
Definition Advantages Disadvantages
Holistic
All criteria are evaluated simultaneously giving one overall score
· Quicker/easier while running an assessment
· Easier to standardize raters· Emphasize what a learner is able
to do
· Can’t provide specific feedback· Criteria cannot be weighted· When a student’s performance
varies, it can be difficult to select the correct level
AnalyticAll criteria are evaluated and scored individually
· Can provide detailed feedback· Individual criteria can be weighted· Easier to select a candidate’s level· Easier to link to in-class tasks
· Slower/difficult to use while running an assessment
· More difficult to standardize raters
Interlocutor Instructions
Interlocutor places the Part 3 visual prompts in front of the students. Says to both students: Please read the information on the card in front of you. You have 30 seconds. (START your 2 minutes 30 seconds timer)
別の町(東京)に住んでいる友人(ミカ)が,週末あなたに会いに来ることになっています。行うことができそうな様々な活動についてパートナーと話し、
どの活動が最も適しているか決めなさい(Translation for teachers: A friend (Mika) from another city (Tokyo) is visiting Hiroshima at the weekend. Talk
together about the different places you could take her to and decide which ones would be best.)
(after 30 seconds) All right? Now, talk together. You have 2 minutes. Please start.
Give the students enough time to complete the task without help. Prompt by pointing only if nothing happens.)
Say to both students: Thank you. May I have the card back please. (Take back the visual prompts.) That is the end of your speaking test. Thank you very much for coming today. Goodbye.
─ ─52
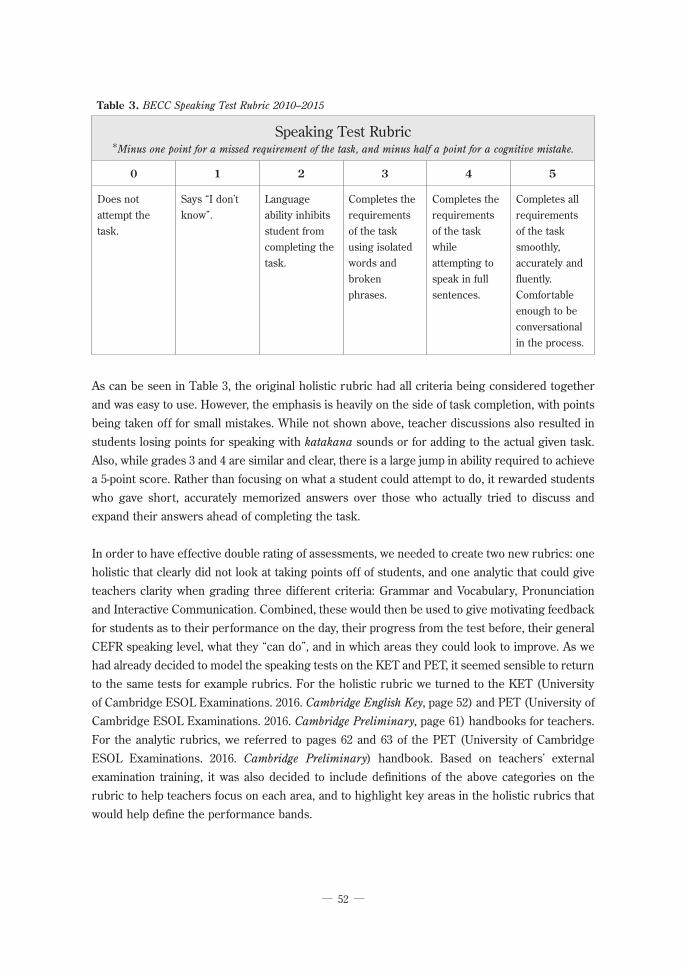
Table 3. BECC Speaking Test Rubric 2010–2015
Speaking Test Rubric*Minus one point for a missed requirement of the task, and minus half a point for a cognitive mistake.
0 1 2 3 4 5
Does not attempt the task.
Says “I don’t know”.
Language ability inhibits student from completing the task.
Completes the requirements of the task using isolated words and broken phrases.
Completes the requirements of the task while attempting to speak in full sentences.
Completes all requirements of the task smoothly, accurately and fluently. Comfortable enough to be conversational in the process.
As can be seen in Table 3, the original holistic rubric had all criteria being considered together and was easy to use. However, the emphasis is heavily on the side of task completion, with points being taken off for small mistakes. While not shown above, teacher discussions also resulted in students losing points for speaking with katakana sounds or for adding to the actual given task. Also, while grades 3 and 4 are similar and clear, there is a large jump in ability required to achieve a 5-point score. Rather than focusing on what a student could attempt to do, it rewarded students who gave short, accurately memorized answers over those who actually tried to discuss and expand their answers ahead of completing the task.
In order to have effective double rating of assessments, we needed to create two new rubrics: one holistic that clearly did not look at taking points off of students, and one analytic that could give teachers clarity when grading three different criteria: Grammar and Vocabulary, Pronunciation and Interactive Communication. Combined, these would then be used to give motivating feedback for students as to their performance on the day, their progress from the test before, their general CEFR speaking level, what they “can do”, and in which areas they could look to improve. As we had already decided to model the speaking tests on the KET and PET, it seemed sensible to return to the same tests for example rubrics. For the holistic rubric we turned to the KET (University of Cambridge ESOL Examinations. 2016. Cambridge English Key, page 52) and PET (University of Cambridge ESOL Examinations. 2016. Cambridge Preliminary, page 61) handbooks for teachers. For the analytic rubrics, we referred to pages 62 and 63 of the PET (University of Cambridge ESOL Examinations. 2016. Cambridge Preliminary) handbook. Based on teachers’ external examination training, it was also decided to include definitions of the above categories on the rubric to help teachers focus on each area, and to highlight key areas in the holistic rubrics that would help define the performance bands.
─ ─53
Standardizing Teacher Training for CEFR-based Speaking Assessments
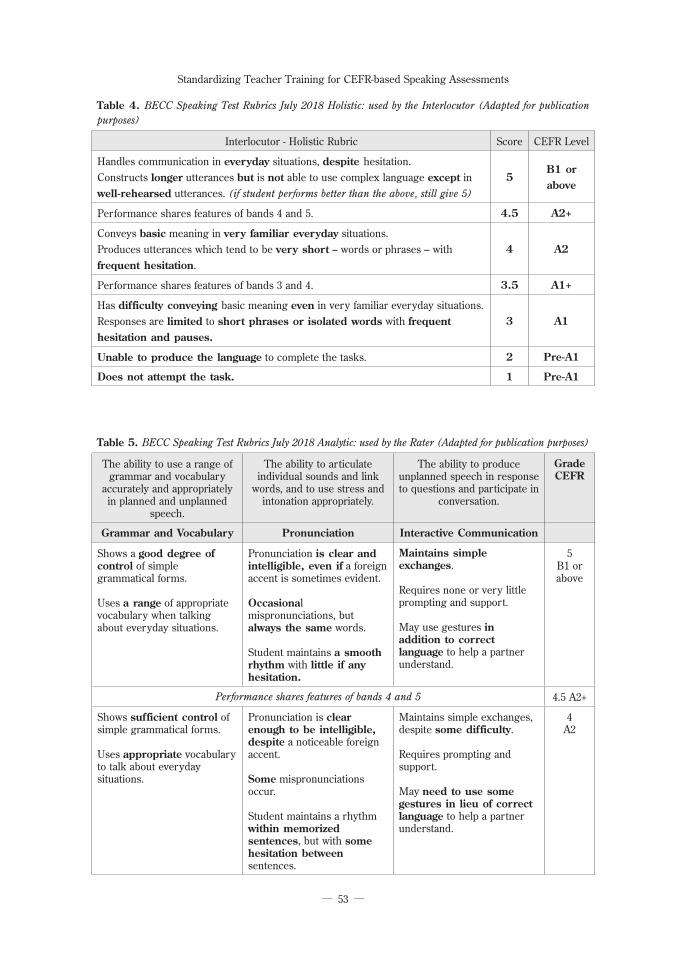
Table 4. BECC Speaking Test Rubrics July 2018 Holistic: used by the Interlocutor (Adapted for publication purposes)
Interlocutor - Holistic Rubric Score CEFR Level
Handles communication in everyday situations, despite hesitation.Constructs longer utterances but is not able to use complex language except in well-rehearsed utterances. (if student performs better than the above, still give 5)
5B1 or above
Performance shares features of bands 4 and 5. 4.5 A2+
Conveys basic meaning in very familiar everyday situations.Produces utterances which tend to be very short – words or phrases – with frequent hesitation.
4 A2
Performance shares features of bands 3 and 4. 3.5 A1+
Has difficulty conveying basic meaning even in very familiar everyday situations.Responses are limited to short phrases or isolated words with frequent hesitation and pauses.
3 A1
Unable to produce the language to complete the tasks. 2 Pre-A1
Does not attempt the task. 1 Pre-A1
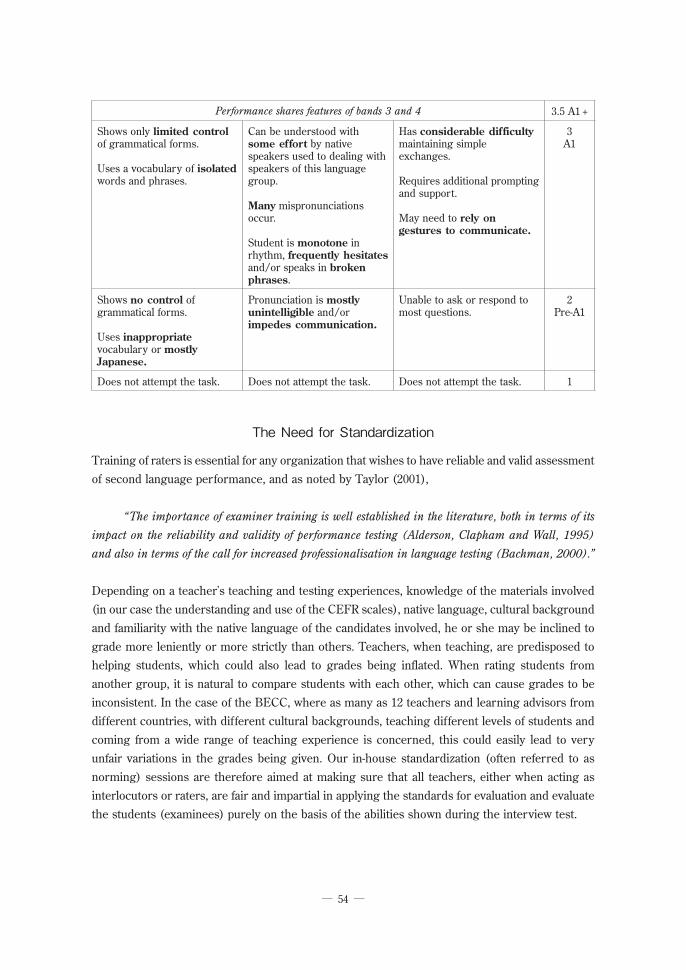
Table 5. BECC Speaking Test Rubrics July 2018 Analytic: used by the Rater (Adapted for publication purposes)
The ability to use a range of grammar and vocabulary
accurately and appropriately in planned and unplanned
speech.
The ability to articulate individual sounds and link
words, and to use stress and intonation appropriately.
The ability to produce unplanned speech in response to questions and participate in
conversation.
GradeCEFR
Grammar and Vocabulary Pronunciation Interactive Communication
Shows a good degree of control of simple grammatical forms.
Uses a range of appropriate vocabulary when talking about everyday situations.
Pronunciation is clear and intelligible, even if a foreign accent is sometimes evident.
Occasional mispronunciations, but always the same words.
Student maintains a smooth rhythm with little if any hesitation.
Maintains simple exchanges.
Requires none or very little prompting and support.
May use gestures in addition to correct language to help a partner understand.
5B1 or above
Performance shares features of bands 4 and 5 4.5 A2+
Shows sufficient control of simple grammatical forms.
Uses appropriate vocabulary to talk about everyday situations.
Pronunciation is clear enough to be intelligible, despite a noticeable foreign accent.
Some mispronunciations occur.
Student maintains a rhythm within memorized sentences, but with some hesitation between sentences.
Maintains simple exchanges, despite some difficulty.
Requires prompting and support.
May need to use some gestures in lieu of correct language to help a partner understand.
4A2
─ ─54
The Need for Standardization
Training of raters is essential for any organization that wishes to have reliable and valid assessment of second language performance, and as noted by Taylor (2001),
“The importance of examiner training is well established in the literature, both in terms of its
impact on the reliability and validity of performance testing (Alderson, Clapham and Wall, 1995)
and also in terms of the call for increased professionalisation in language testing (Bachman, 2000).”
Depending on a teacher’s teaching and testing experiences, knowledge of the materials involved (in our case the understanding and use of the CEFR scales), native language, cultural background and familiarity with the native language of the candidates involved, he or she may be inclined to grade more leniently or more strictly than others. Teachers, when teaching, are predisposed to helping students, which could also lead to grades being inflated. When rating students from another group, it is natural to compare students with each other, which can cause grades to be inconsistent. In the case of the BECC, where as many as 12 teachers and learning advisors from different countries, with different cultural backgrounds, teaching different levels of students and coming from a wide range of teaching experience is concerned, this could easily lead to very unfair variations in the grades being given. Our in-house standardization (often referred to as norming) sessions are therefore aimed at making sure that all teachers, either when acting as interlocutors or raters, are fair and impartial in applying the standards for evaluation and evaluate the students (examinees) purely on the basis of the abilities shown during the interview test.
Performance shares features of bands 3 and 4 3.5 A1 +
Shows only limited control of grammatical forms.
Uses a vocabulary of isolated words and phrases.
Can be understood with some effort by native speakers used to dealing with speakers of this language group.
Many mispronunciations occur.
Student is monotone in rhythm, frequently hesitates and/or speaks in broken phrases.
Has considerable difficulty maintaining simple exchanges.
Requires additional prompting and support.
May need to rely on gestures to communicate.
3A1
Shows no control of grammatical forms.
Uses inappropriate vocabulary or mostly Japanese.
Pronunciation is mostly unintelligible and/or impedes communication.
Unable to ask or respond to most questions.
2Pre-A1
Does not attempt the task. Does not attempt the task. Does not attempt the task. 1
─ ─55
Standardizing Teacher Training for CEFR-based Speaking Assessments
Standardization in the BECC ‒ Phase 1
The BECC has held termly standardization sessions since the introduction of the speaking assessment in 2010, and these have evolved over time along with the test. Originally aimed at introducing the practicalities of the test, these soon changed to focus on discussing how to get consistent grading from all teachers delivering the same assessment. This was done by defining the terms that decided the difference between a 3 and a 4 on the original holistic rubric, and by trying to qualify “smoothly, accurately and fluently” for a 5. This is where teachers started looking at “penalizing” students for using katakana pronunciation, or for hesitating or repeating themselves while trying to add extra information to an answer. As both of the latter are natural in fluent conversation but distracting or signs of obvious weakness in lower level learners, these were areas that led to the greatest differences of opinion in teacher decision making.
Standardization in the BECC ‒ Phase 2
With the beginning of the new BESTs in July 2015, a new standardization session was introduced. The first session focused heavily on the content and mechanics of the new test. While still a 3-part paired test, the question style was new, as were the rubrics and the idea of two teachers together in a room grading independently from each other. Teachers were already acquainted with the CEFR scales in terms of making lessons and teaching to match a certain CEFR level (see COE, 2001), but not in terms of how to assess performance at each band. After going through the above, teachers then watched example KET and PET videos from Cambridge University, reviewed the examiners comments, and read the speaking assessment glossary of terms from the PET handbook (see University of Cambridge ESOL Examinations, 2016, 64-65 for the latest version). To finish, teachers watched two sample videos of our own students trialling the new BESTs and practiced grading as an interlocutor with the holistic rubric. This was followed by two more videos which were graded as the rater using the analytic video. Scores were submitted anonymously and compared to the example grades given by the session leaders. The idea at this stage was to make sure that teachers could all run the tests and assess the students within .5 of the example grades on the day. After much discussion and referencing back to the CEFR and the Cambridge comments and handbook notes, this was achieved.
As when introducing any new style of test and assessment methodology, this naturally took a great deal of time. As is also common, after the tests were completed and scores submitted, there were complaints from teachers regarding differences in colleagues’ assessment styles and the grades they gave. Many of these were caused by the fact that the majority of our students did not really fit the profile of the candidates in the Cambridge videos (KET and PET students being intrinsically motivated to take English tests versus our students who, for the majority, were just extrinsically “forced” to take the tests), and that as it was the first time using the rubrics, teachers still had questions regarding when to take points off students (as with the old style rubric) rather than looking at grading bands from a point of view of what a student could actually do.

─ ─56
In the second semester the session was repeated before the end of term tests using actual video of our own students under test conditions. With an emphasis on looking at what the students could do, teachers were again encouraged to agree on standardized scores giving grades of within .5 of each other across a range of levels of video. An increased level of understanding meant that both students and teachers performed better in the end of semester tests, but there was still a feeling that some raters and interlocutors were much stricter, or more lenient, or just inconsistent in their grading.
Standardization in the BECC ‒ Phase 3
Due to changes in committee members, the standardization sessions in 2016 were led by different teachers, and a greater focus was placed on dealing with rater strictness and leniency. Multi-faceted Rasch analysis was used to try and nullify the effects of these problems (detailed later in this paper) and had revealed that during actual tests, teachers had indeed been far stricter or more lenient than others, often leading to a difference of 1 full grade point (out of 5) or more between students performing at similar levels. This led to some changes being made to the analytic rubric, particularly in the pronunciation criteria, and to having extra materials and time in the standardization session allotted to clarifying how to assess this area. The results also pointed to inconsistent grading by teachers, naturally caused by tiredness after two or three hours of grading or having to grade over 2 different days to varying levels of students. As quoted by Ackerman and Kennedy (2010), “Earlier studies have revealed the instability in marking behaviour over an extended marking period when a large number of test taker responses are involved (see Wood & Wilson, 1974).”
The standardization sessions in 2016 were again held in a single session just before the exam week. Ackerman and Kennedy (2010) point out that “It must be kept in mind, as Lumley and McNamara (1995) warn, that training effects “may not endure for long after a training session” (p. 69)”. However, long sessions involving the review of materials and methodology in addition to four or more videos lasting up to 15 minutes followed by discussions, take their toll on a busy teacher’s concentration skills. This can then lead to a negative view towards a session which should be a positive and meaningful part of ongoing teacher training and development. We were now faced with a dilemma: try to increase and/or improve teacher training in order to rely less on Rasch to create fair scores for students, and to increase teacher confidence in their own abilities to run and grade the tests, while at the same time reducing the burden this extra training imposed on teachers.
Current Standardization in the BECC ‒ Phase 4
From the summer of 2017, the standardization session was split up into two parts, and consisted of 3 stages. All of the Cambridge assessment literature and pre-reading, copies of the test questions, the rubrics, example student calibration videos with grades and examiner notes, and a link to an online standardization (via secure Google forms) were placed on our in-house Wix site

─ ─57
Standardizing Teacher Training for CEFR-based Speaking Assessments
via a password protected page. This page was released to teachers two weeks before the exam period started, so they could choose to access it a time or times most convenient to them. Teachers were also emailed an outline reminding them of the test procedure and containing all the teacher pack materials needed in preparation for the test (rubrics, student marksheets, interlocutor and rater name cards, etc.) Stage 1 of the standardization consisted of teachers being asked to re-read all off the previously shared literature at their own pace, and then to watch the calibration videos. Stage 2 consisted of opening the standardization page and grading the students (using videos from previous tests) from 1 to 5 holistically, and then two more student videos analytically. Teacher grades were collected through the forms page for analysis by the session leader, and teachers received feedback in terms of accuracy and explanations of why the BEST committee had assigned the grades they had. An example of this would be:
Answer: 3.5/A1+ Feedback: Correct. The student conveys the basic meaning in very familiar
everyday situations (4/A2). However, her responses are limited to short phrases or isolated words
with frequent hesitations and pauses (3/A1). A student who scores a 4 in one category, and 3 in
another, is awarded a 3.5.
Any teachers who showed too great a level of leniency or strictness, or who raised individual concerns could then be assisted on a one to one basis. Stage 3 consisted of a now much shorter in-house Keynote-based session held one or two days before the tests began. This session covered any areas that a majority needed clarification on, reviewed general procedures, and introduced any minor changes that were required. Some more light-hearted videos were also added to help teachers visualize what students were thinking before a test, and also what could go wrong during a test. While lightening the mood, these videos also performed the very real task of making it clear how everybody should and could deal consistently with all students in any given situation.
This current style of training and standardization has already led to teachers commenting that they feel happier both doing the training and running the tests. There have also been fewer to no complaints from colleagues and students, which most importantly has also increased ‘buy-in’ to having the termly sessions, the tests themselves and the feedback they give. While some statistical improvements will be outlined in the following section, we also appear to be getting a higher level of interlocutor and rater accuracy and consistency.
Preparing the Exam
A master Excel document is used by both teachers for the inputting of BEST class rosters and student grades and by test administrators for the rater/interlocutor roster creation and Rasch Facets data transfer and conversion. This document is shared on the university server, and an oral training session for all involved parties on operation and save conflict resolution was conducted in 2016 in addition to the provision of an operations manual.
Roughly two weeks prior to administering the BEST, teachers input their BEST pairing rosters into

─ ─58
a designated class worksheet tab. The student pair order may be input manually or randomized via a distributed Excel randomizer tool. Once input, the data is transferred automatically to a master course roster tab which retains the order of students for ease of data input. After conducting the exams, the raters and interlocutors enter their grades (from 1 to 5) into the document along with a designation of each student as partner A or B within the speaking test. This numerical data is subsequently translated by Excel into a Rasch readable format and processed through Rasch Facets.
Utilizing Rasch Facets
Through performing a multifaceted analysis of the BEST data via Rasch Facets (Linacre, 2018), a tool designed for analysing human ratings of student performance, the BECC is able to provide fair BEST student scores. These fair scores are calculated by Rasch after adjusting for the found leniency and severity of the judges and of the rubrics. Due to possible rater severity or leniency, it is feasible for students who scored below a maximum raw score to still be awarded a full score, or alternatively, a student who received a maximum or close to maximum score to have her score slightly reduced. Once fair scores have been calculated, they are reported to teachers for final grading.
In addition to this practical element, Rasch Facets also provides the BECC with several data sets and opportunities for continued test and judge development, including:
· Relative analysis of the rubrics· Judge leniency and severity· Judge understanding of the rating system
Examples of each of these points will be discussed henceforth.
Relative Analysis of the Rubrics
Rasch Facets provides insight on the relative difficulty of each grading rubric. An example is shown in Figures 1.1 and 1.2 below.
Figure 1.1. Example Judge and Rubric Relative Measures
─ ─59
Standardizing Teacher Training for CEFR-based Speaking Assessments
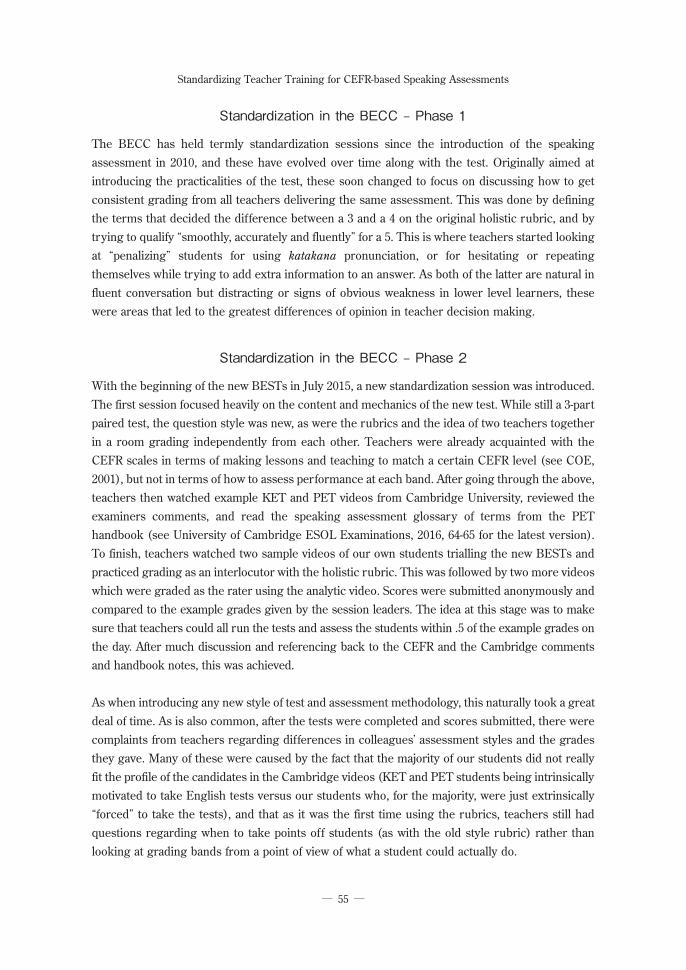
Rasch’s unit of measurement is the logit, or a measure of ability based on the relative difficulty of students to complete a task and judges to assign a low or high score on the task. Figures 1.1 and 1.2 above demonstrate the relative difficulty of several grading rubrics used by judges on students. The higher the judge criteria are ordered, the more difficult it was found to be, resulting in lower scores awarded. In the above example, Judge Criteria 2 was found to be the most difficult scoring rubric, with a measure of .86 logits, while Judge Criteria 4 was found to be the easiest to achieve a high score on, with a measure of -.79 logits. The fair average column further demonstrates the relative difficulties. While students received an observed average of 3.71 points on Judge Criteria
2 while receiving 4.16 on Judge Criteria 4, these averages may be influenced by the judges’ relative severity and leniency, causing some scores to become inflated or deflated. However, the fair average column largely confirms the observed averages, meaning that a student who performed of exactly equal ability on the four judging rubrics would have received the fair scores displayed. If this gap is larger than expected or desired, it may indicate a need for further judge training on awarding scores more evenly, or it may indicate a flaw in the rubrics that need further balancing in future iterations of the exam.
Judge Leniency and Severity
The same relative difficulty data can be applied to the judges to determine individual leniency and severity, allowing conclusions to be drawn on the necessity of further judge standardization sessions. These measures are based on student fair scores rather than only on observed scores, meaning a judge whom by chance happened to rate only high or low-level students would not be considered particularly lenient or severe, respectively, if other judges who rated those students awarded similar scores. Therefore, the resulting measure gaps indicate that judges may have had different applications of the rating criteria, and that the same student may have received different scores from different judges for identical performance.
In Figure 2 below (in conjunction with Figure 1.1) with the average measure anchored at zero logits, there is a 3.7 logit gap between the harshest judge (Judge 4) and the most lenient judge (Judge 11). By fair average, this translates to a one Rasch-converted point discrepancy (3.56 vs 4.55) between these judges, or in terms of the BEST, a half CEFR grade level, awarded by these judges for a student of identical performance. These fair averages provide a contrast to those from the judging criteria in Figure 1.2, as here, the observed averages do not necessarily correspond to the fair average; Judge 4, the harshest judge, awarded the highest scores (4.86 observed
Figure 1.2. Example Rubric Measures
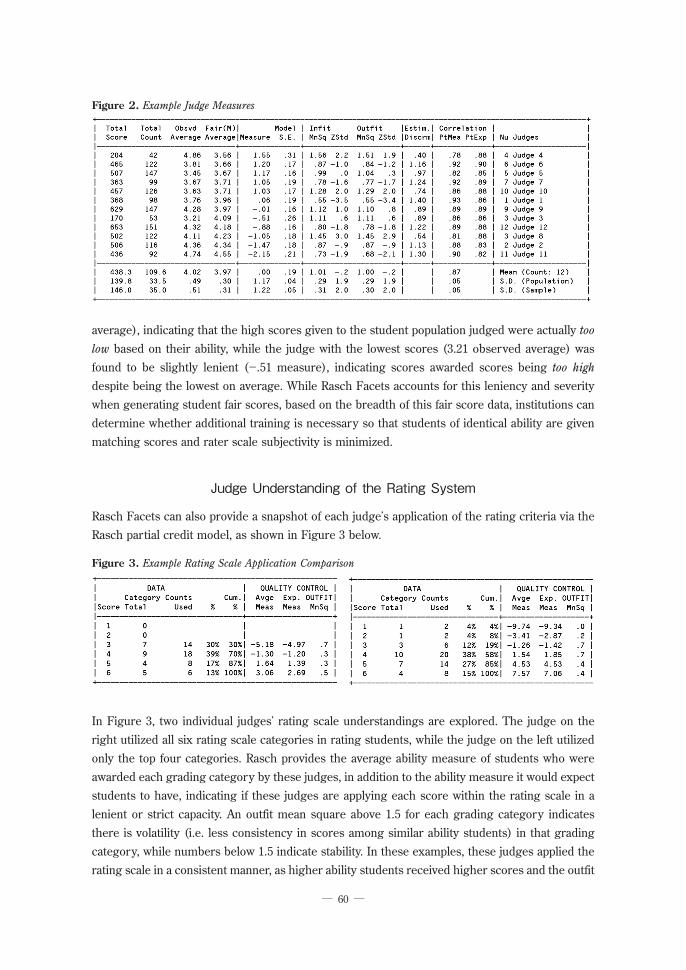
─ ─60
average), indicating that the high scores given to the student population judged were actually too
low based on their ability, while the judge with the lowest scores (3.21 observed average) was found to be slightly lenient (-.51 measure), indicating scores awarded scores being too high
despite being the lowest on average. While Rasch Facets accounts for this leniency and severity when generating student fair scores, based on the breadth of this fair score data, institutions can determine whether additional training is necessary so that students of identical ability are given matching scores and rater scale subjectivity is minimized.
Judge Understanding of the Rating System
Rasch Facets can also provide a snapshot of each judge’s application of the rating criteria via the Rasch partial credit model, as shown in Figure 3 below.
Figure 3. Example Rating Scale Application Comparison
In Figure 3, two individual judges’ rating scale understandings are explored. The judge on the right utilized all six rating scale categories in rating students, while the judge on the left utilized only the top four categories. Rasch provides the average ability measure of students who were awarded each grading category by these judges, in addition to the ability measure it would expect students to have, indicating if these judges are applying each score within the rating scale in a lenient or strict capacity. An outfit mean square above 1.5 for each grading category indicates there is volatility (i.e. less consistency in scores among similar ability students) in that grading category, while numbers below 1.5 indicate stability. In these examples, these judges applied the rating scale in a consistent manner, as higher ability students received higher scores and the outfit
Figure 2. Example Judge Measures
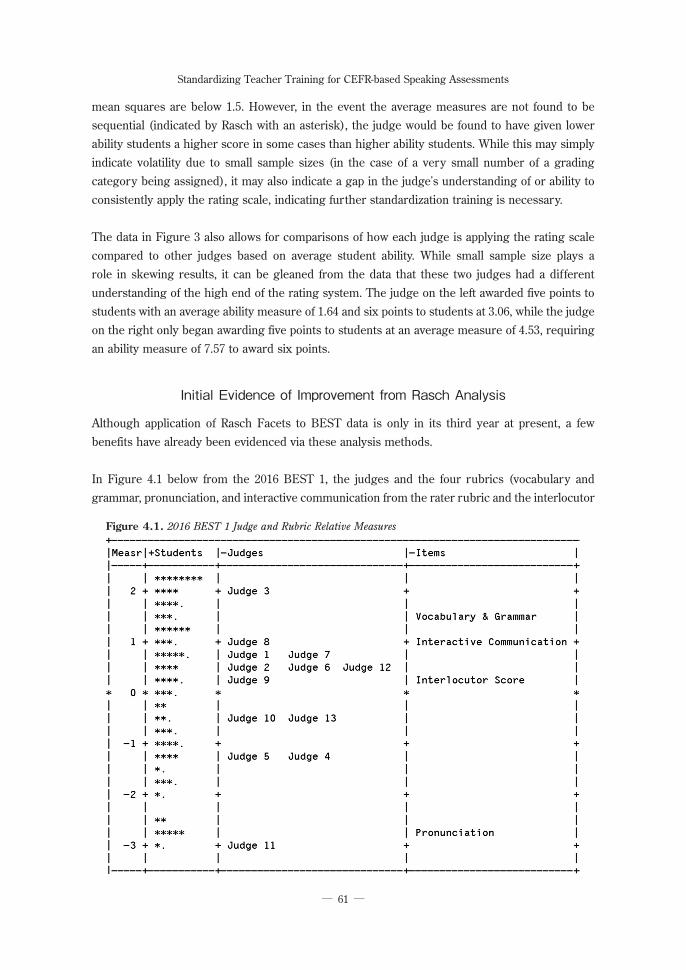
─ ─61
Standardizing Teacher Training for CEFR-based Speaking Assessments
mean squares are below 1.5. However, in the event the average measures are not found to be sequential (indicated by Rasch with an asterisk), the judge would be found to have given lower ability students a higher score in some cases than higher ability students. While this may simply indicate volatility due to small sample sizes (in the case of a very small number of a grading category being assigned), it may also indicate a gap in the judge’s understanding of or ability to consistently apply the rating scale, indicating further standardization training is necessary.
The data in Figure 3 also allows for comparisons of how each judge is applying the rating scale compared to other judges based on average student ability. While small sample size plays a role in skewing results, it can be gleaned from the data that these two judges had a different understanding of the high end of the rating system. The judge on the left awarded five points to students with an average ability measure of 1.64 and six points to students at 3.06, while the judge on the right only began awarding five points to students at an average measure of 4.53, requiring an ability measure of 7.57 to award six points.
Initial Evidence of Improvement from Rasch Analysis
Although application of Rasch Facets to BEST data is only in its third year at present, a few benefits have already been evidenced via these analysis methods.
In Figure 4.1 below from the 2016 BEST 1, the judges and the four rubrics (vocabulary and grammar, pronunciation, and interactive communication from the rater rubric and the interlocutor
Figure 4.1. 2016 BEST 1 Judge and Rubric Relative Measures
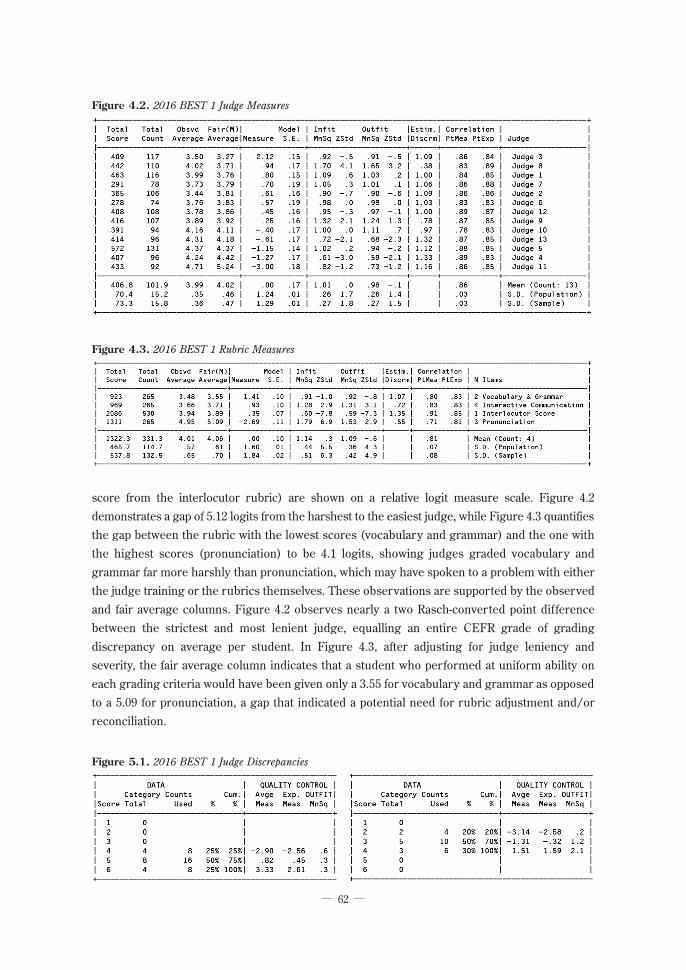
─ ─62
score from the interlocutor rubric) are shown on a relative logit measure scale. Figure 4.2 demonstrates a gap of 5.12 logits from the harshest to the easiest judge, while Figure 4.3 quantifies the gap between the rubric with the lowest scores (vocabulary and grammar) and the one with the highest scores (pronunciation) to be 4.1 logits, showing judges graded vocabulary and grammar far more harshly than pronunciation, which may have spoken to a problem with either the judge training or the rubrics themselves. These observations are supported by the observed and fair average columns. Figure 4.2 observes nearly a two Rasch-converted point difference between the strictest and most lenient judge, equalling an entire CEFR grade of grading discrepancy on average per student. In Figure 4.3, after adjusting for judge leniency and severity, the fair average column indicates that a student who performed at uniform ability on each grading criteria would have been given only a 3.55 for vocabulary and grammar as opposed to a 5.09 for pronunciation, a gap that indicated a potential need for rubric adjustment and/or reconciliation.
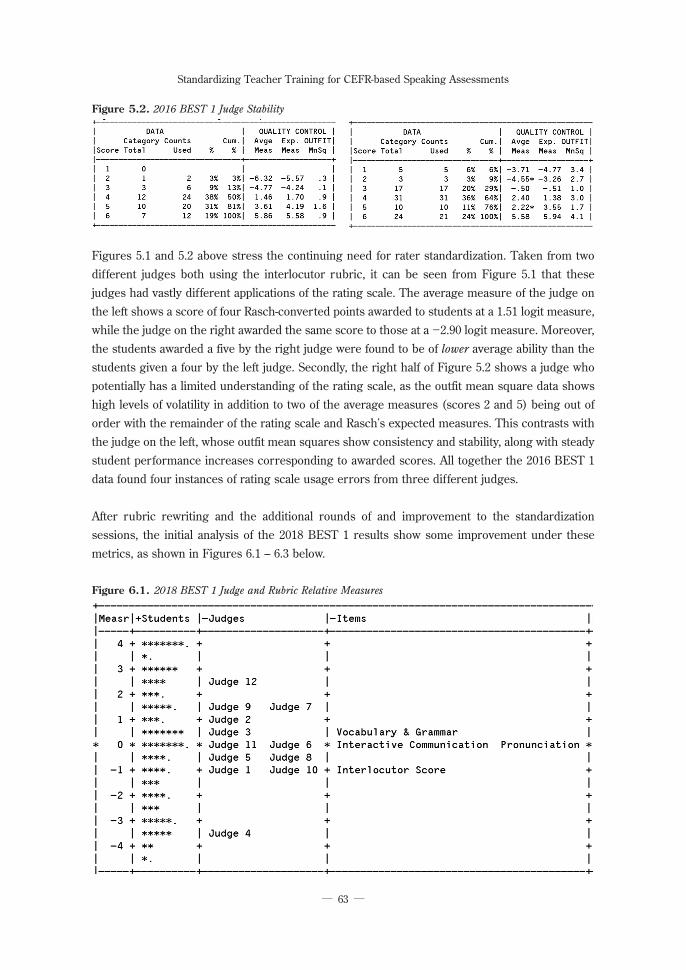
Figure 5.1. 2016 BEST 1 Judge Discrepancies
Figure 4.2. 2016 BEST 1 Judge Measures
Figure 4.3. 2016 BEST 1 Rubric Measures
─ ─63
Standardizing Teacher Training for CEFR-based Speaking Assessments
Figure 5.2. 2016 BEST 1 Judge Stability
Figures 5.1 and 5.2 above stress the continuing need for rater standardization. Taken from two different judges both using the interlocutor rubric, it can be seen from Figure 5.1 that these judges had vastly different applications of the rating scale. The average measure of the judge on the left shows a score of four Rasch-converted points awarded to students at a 1.51 logit measure, while the judge on the right awarded the same score to those at a -2.90 logit measure. Moreover, the students awarded a five by the right judge were found to be of lower average ability than the students given a four by the left judge. Secondly, the right half of Figure 5.2 shows a judge who potentially has a limited understanding of the rating scale, as the outfit mean square data shows high levels of volatility in addition to two of the average measures (scores 2 and 5) being out of order with the remainder of the rating scale and Rasch’s expected measures. This contrasts with the judge on the left, whose outfit mean squares show consistency and stability, along with steady student performance increases corresponding to awarded scores. All together the 2016 BEST 1 data found four instances of rating scale usage errors from three different judges.
After rubric rewriting and the additional rounds of and improvement to the standardization sessions, the initial analysis of the 2018 BEST 1 results show some improvement under these metrics, as shown in Figures 6.1 – 6.3 below.
Figure 6.1. 2018 BEST 1 Judge and Rubric Relative Measures

─ ─64
While the logit gap between judges as seen in Figures 6.1 and 6.2 exceeds that of the 2016 BEST 1 data (see Figure 4.2), there is a smaller gap in the fair score discrepancy at 1.35 points, or slightly above a half CEFR grade level. What is more, the gaps between the strictest and second most strict judge, along with the gap between the most and second lenient judge, are smaller than two years prior. While this is still not ideal, it is hoped it represents a modicum of progress. The rating scale as shown in Figure 6.3 has seen considerable standardization, with only a 1.63 logit difference between hardest and easiest rubrics, equalling a .35 fair average difference, or roughly a .2 CEFR-grade level discrepancy. Finally, while a full analysis of the 2018 BEST 1 rater scale understanding has yet to be undertaken, a cursory glance at the data shows only one error by a single judge in rater scale order application, a 75% decrease from the 2016 iteration.
Curriculum Washback from BESTs and Standardization
Bower et al (2014) state that“the term ‘washback’ refers to the influence of testing on classroom instruction, assuming that
teachers and learners ‘do things they would not necessarily otherwise do because of the test’ (Alderson
& Wall, 1993, p. 5). In the case of large, high-stakes tests this effect has often been taken to be
negative, but in the case of smaller, lower-stakes tests, it is hypothesized to have a positive effect on
classroom instruction (Cheng, Watanabe & Curtis, 2004)”.
In line with the above, we hoped to see positive washback from our BEST tests and associated teacher training. The first and most obvious case is with our spoken presentations that
Figure 6.2. 2018 BEST 1 Judge Measures
Figure 6.3. 2018 BEST 1 Rubric Measures

─ ─65
Standardizing Teacher Training for CEFR-based Speaking Assessments
all students do in all their English courses. The rubrics for these assessments have been developed directly from the BEST rubrics, and as such both teachers and students are familiar with the scoring system. Teacher understanding of how the grades are achieved helps them better explain these points to the students, who now have a clearer idea of what they can do already, and what they need to do to improve. They also have a better understanding of how the “can-do” statements and main tasks in their lessons relate to their tests and overall speaking ability. While these in-class assessments are graded by the students’ own teachers, we are still seeing more consistency in grading. As the feedback from these rubrics gives the students their CEFR grades for spoken presentation, these can be compared to their BEST spoken interaction grades to provide students with an overall idea of their speaking ability. Our writing assessments too now have a CEFR based feedback system. While obviously different to the speaking assessments in terms of areas assessed, the style is the same so that students are constantly getting a grade in terms of what they can do in English, rather than in just points. This in turn encourages students to seek out the correct levels of activities in the SALC to help them progress, rather than defaulting to the easiest option. Many activities in the lessons and SALC activities have also been written or re-written based on the specifications for the BEST tests, thus leading to a greater feeling that the tests are seamless extensions to the curriculum, and an assessment of what students do in class and might need in real life, rather than something to be studied for separately.
Recent and Future Developments
We are always looking to find ways of improving our BEST tests and our training. After every test period feedback is collected and used to both clarify and “tidy” prompts within the test, improve student preparation for test procedure via our BEST preparation lessons, and to clarify further test procedure and grading criteria. An example of this was the decision made in July 2018 to have all paired interviews a standard maximum of ten minutes long. This required us to work out how long each part of the test could take, and in what way teachers could seamlessly keep track of time. Adding this extra layer of complexity to the interlocutors’ job meant not only extra training in the July session, but also once again focusing on ways for teachers to improve smoothness of operation and consistency of scoring. The goal of every standardization session is to improve teacher ability, confidence and reliability in test administration and grading, so as to make the end results fairer and more useful for students. Further developments already being looked at include a wording change for the BEST part 2 cards to both mirror the style of a well-regarded external examination, and to combat a situation many Japanese students find themselves in when trying to make questions. Often, when armed with only context and one or two words, students will panic and think, “I’m not sure of the perfect answer, so I won’t say anything!” By changing the prompt instructions from “When/start work”, to a sentence form such as “Ask your partner what time they start work”, students have to perform the same task (forming a correct question) but are no longer constrained by the idea of trying to find one perfect question. Another is the construction of the BEST specifications themselves. Now that we have experience and video evidence of how our students will perform in our tests, we can look at adding a Response Attributes section to each part of the specifications. Response attributes are “a complete and detailed description of the way

─ ─66
in which the student will provide the answer; that is…what will constitute a failure or success” (Popham, 1978, quoted in Fulcher, G (2013) p. 135). Rather than failure or success, our attributes will more clearly define the CEFR band performance teachers can expect to see. Also, while the majority of our students fit the A2 – B1 CEFR bands, there are some students who exceed this level. To give these students a more accurate assessment of their abilities, and those at the B1 level some idea of what they can aim for, we will be introducing extended rubrics that will show descriptors for the B1+ and B2 levels, while at the same time keeping the ‘maximum’ points score level as a 5/B1 so as not to penalize those students at a lower CEFR level. After all, the whole idea of the new BEST tests is not to help teachers just give an end of semester grade, but to tell students, as accurately as possible, what they “can do”, reassure them that they can speak English, and therefore motivate them to study more in the future.
References
Ackerman, K. & Kennedy, L. (2010). Standardizing Rater Performance: Empirical Support for Regulating Language Proficiency Test Scoring. Research notes for Establishing Construct Validity for Pearson Test of English Academic. Retrieved from: https://pearsonpte.com/wp-content/uploads/2014/07/RN_StandardizingRaterPerformance_2010.pdf
Bower, J., Rutson-Griffiths, A. & Sugg, R. (2014). Setting and Raising Standards - the Rationale for, and the Structure of the Bunkyo English Tests. Bulletin of Hiroshima Bunkyo Women’s University, Volume 49.
Carr, N. (2011). Designing and Analysing Language Tests. Oxford, Oxford University Press.Council of Europe (COE). (2017). Common European Framework of Reference for Languages (CEFR): Global
scale - Table 1 (CEFR 3.3): Common Reference levels. Retrieved from: http://www.coe.int/en/web/common-european-framework-reference-languages/table-1-cefr-3.3-commo n-reference-levels-global-scale
Council of Europe (COE). (2018). Common European Framework of Reference for Languages (CEFR): Learning, teaching, assessment. Companion Volume with New Descriptors. Retrieved from: https://rm.coe.int/cefr-companion-volume-with-new-descriptors-2018/1680787989
Council of Europe (COE). (2001). Common European Framework of Reference for Languages (CEFR): Learning, teaching, assessment. Cambridge: Cambridge University Press.
Fulcher, G. (2013). Practical Language Teaching. Routledge, Oxford, UK.Linacre, J. M. (2018). Facets computer program for many-facet Rasch measurement, version 3.80.4. Beaverton,
Oregon: Winsteps.comTaylor, L. & Galaczi, E. (2011). Scoring validity. In L, Taylor (Ed.), Examining speaking: Research and practice
in second language speaking. (171–233). Cambridge: Cambridge University Press.Taylor, L. (2001). Research Notes 6, Revising the IELTS Speaking Test (9–11). University of Cambridge Local
Examinations Syndicate. Retrieved from: https://www.cambridgeenglish.org/Images/23117-research-notes-06.pdf
University of Cambridge ESOL Examinations. (2016). Cambridge English Key: Key English Test (KET) CEFR Level A2 Handbook for Teachers. Retrieved from: https://www.cambridgeenglish. org/Images/168163-cambridge-english-key-handbook-for-teachers.pdf
University of Cambridge ESOL Examinations. (2016). Cambridge English Preliminary: Preliminary English Test (PET) CEFR Level B1 Handbook for Teachers. Retrieved from: https://www.cambridgeenglish.org/Images/168150-cambridge-english-preliminary-teachers-handbook.pdf
Yale University, Yale Center for Teaching and Learning. (2018). Creating and Using Rubrics. Retrieved from: https://ctl.yale.edu/Rubrics
All Cambridge KET and PET videos are freely available at: https://www.youtube.com/user/cambridgeenglishtv
─平成30年 8月10日 受理─