Embed Size (px)
Citation preview
STATE OF ALASKADIVISION OF WORKERS’ COMPENSATION
2016 ANNUAL REPORT
2016 ANNUAL REPORT
MONITORING: This section of the report provides information from the prior calendar year.Under Alaska Statute 23.30.155(m), each insurer, providing workers’ compensation coverage in Alaska or their adjuster must file an annual report with the Alaska Compensation Board providing number of claims filed, the type of claims filed, total dollarsspent on medical, lost wages compensation, death benefits, rehabilitation costs and claim litigation costs. The annual report requirement also applies to uninsured employer and self‐insured employers. Along with the annual report, each insurer, adjuster, uninsured employer, or self insured employer must submit payment of their Second Injury Fund (SIF) contribution and their Workers’ Compensation Fund fee. These fees fund reimbursements from the SIF and help support the Division’s operations. This report covers activity from January 1, 2016 to December 31, 2016. This report contains restated annual report values for 2014 and 2015. The historical data for the estimated statewide average monthly employment for 2003 to 2016 was restated.
Claims DataJuly 22, 2013, the Division of Workers’ Compensation adopted and implemented electronic reporting of workers’ compensation first reports of injury (FROI) and subsequent reports of injury (SROI) – commonly referred to as compensation reports. Electronic reporting is done via EDI transmission, using the Claims 3.0 reporting standards promulgated by the International Association ofIndustrial Accident Boards and Commissions (IAIABC). The State of Alaska has contracted with Insurance Services Office, Inc. (ISO) to manage its FROI/SROI reporting.
Challenges identified this year and/or ones that continue from previous years: Release of 3.0 requires annual report values with cumulative totals from claim inception to reporting calendar year end. Under the new EDI standard, certain fields are classified as “required”, that is, necessary for a claim to be processed but not
necessary to complete the a report. Data variances reported by trading partners may occur.
Page 2 of 20
2016 ANNUAL REPORTAnalysis of Workers’ Compensation Claims Data
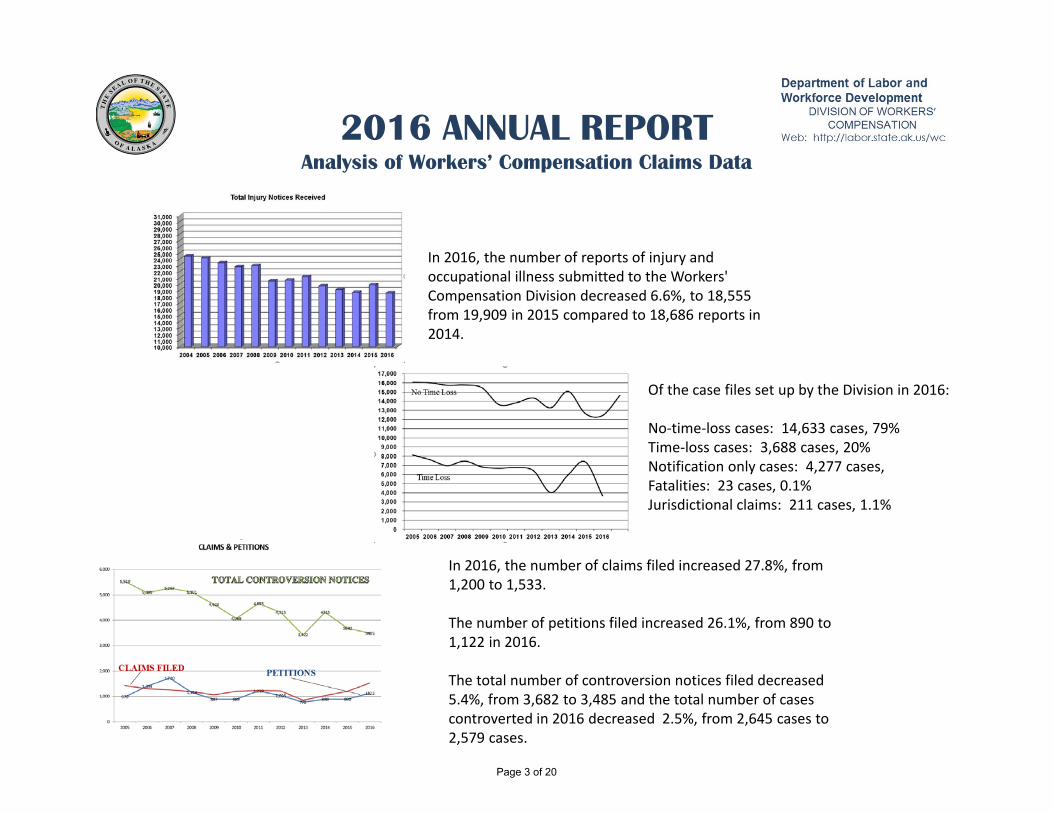
In 2016, the number of reports of injury and occupational illness submitted to the Workers' Compensation Division decreased 6.6%, to 18,555 from 19,909 in 2015 compared to 18,686 reports in 2014.
Of the case files set up by the Division in 2016:
No‐time‐loss cases: 14,633 cases, 79%Time‐loss cases: 3,688 cases, 20%Notification only cases: 4,277 cases, Fatalities: 23 cases, 0.1%Jurisdictional claims: 211 cases, 1.1%
In 2016, the number of claims filed increased 27.8%, from 1,200 to 1,533.
The number of petitions filed increased 26.1%, from 890 to 1,122 in 2016.
The total number of controversion notices filed decreased 5.4%, from 3,682 to 3,485 and the total number of cases controverted in 2016 decreased 2.5%, from 2,645 cases to 2,579 cases.
Page 3 of 20
2016 ANNUAL REPORTTotal Compensation Payments
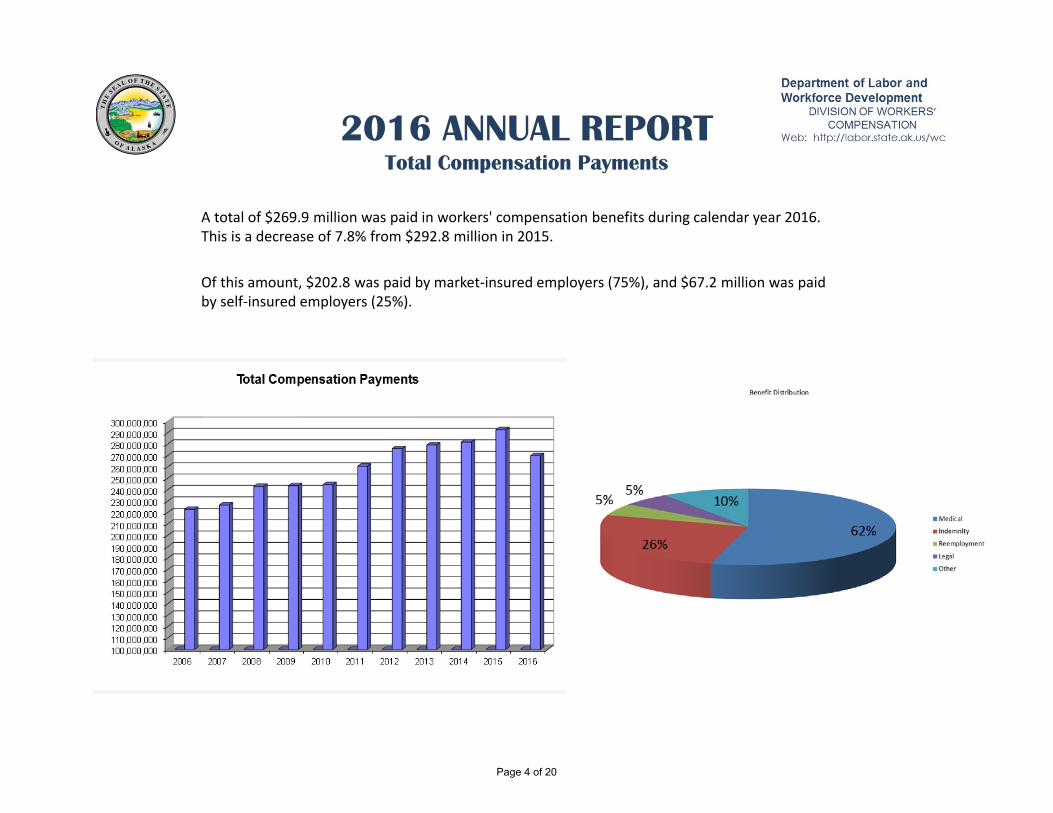
A total of $269.9 million was paid in workers' compensation benefits during calendar year 2016. This is a decrease of 7.8% from $292.8 million in 2015.
Of this amount, $202.8 was paid by market‐insured employers (75%), and $67.2 million was paid by self‐insured employers (25%).
Page 4 of 20
2016 ANNUAL REPORTMedical Benefits
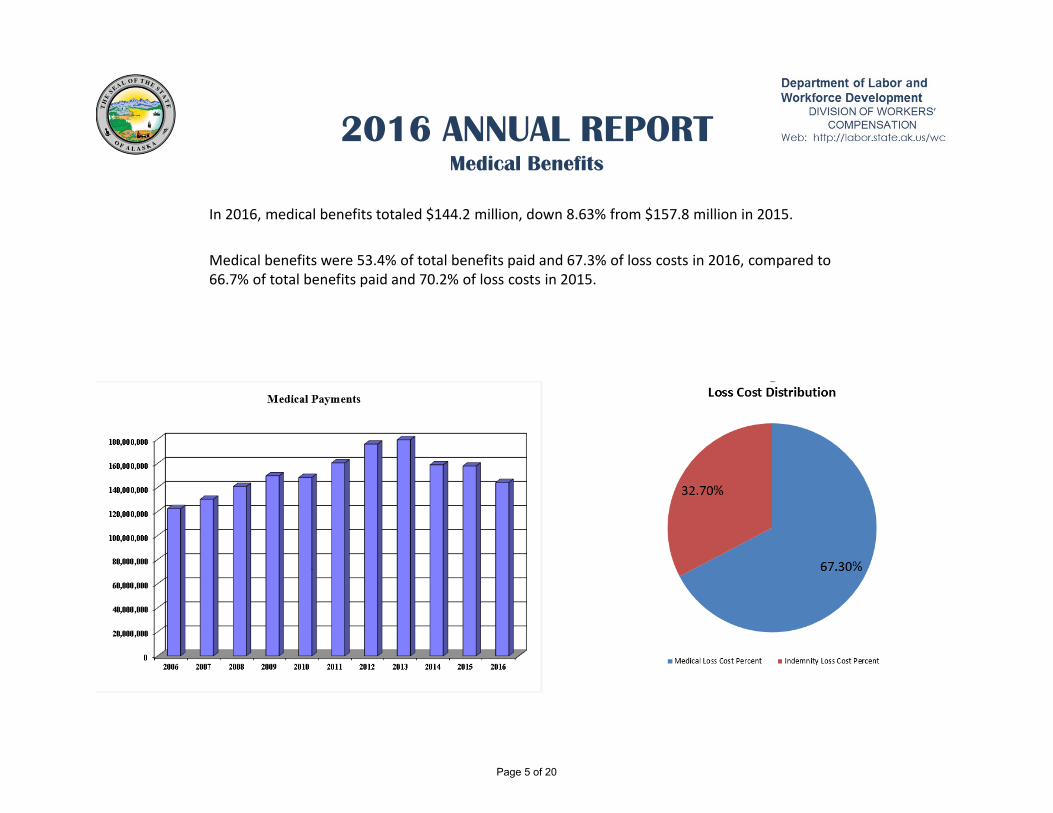
In 2016, medical benefits totaled $144.2 million, down 8.63% from $157.8 million in 2015.
Medical benefits were 53.4% of total benefits paid and 67.3% of loss costs in 2016, compared to 66.7% of total benefits paid and 70.2% of loss costs in 2015.
c
Page 5 of 20

2016 ANNUAL REPORTIndemnity Benefits
For calendar year 2016 indemnity benefits (TTD, TPD, PPI, PTD & Death Benefits) totaled $69.2 million, down 3.5% from $66.9 million in 2015 and $62.1 million in 2014.
TTD benefits decreased 2.9%, from $35.2 million in 2015 to $34.2 million in 2016.
TPD benefits increased 18.2%, from $966 thousand in 2015 to $1.1 million in 2016.
PPI benefits decreased 8.2%, from $13.9 million in 2015 to $12.7 million in 2016.
PTD benefits increased 5.9% from $12.3 million in 2015 to $13 million in 2016.
Death benefits increased 80%, from $4.5 million in 2015 to $8.0 million in 2016.
Page 6 of 20
2016 ANNUAL REPORTLegal Costs
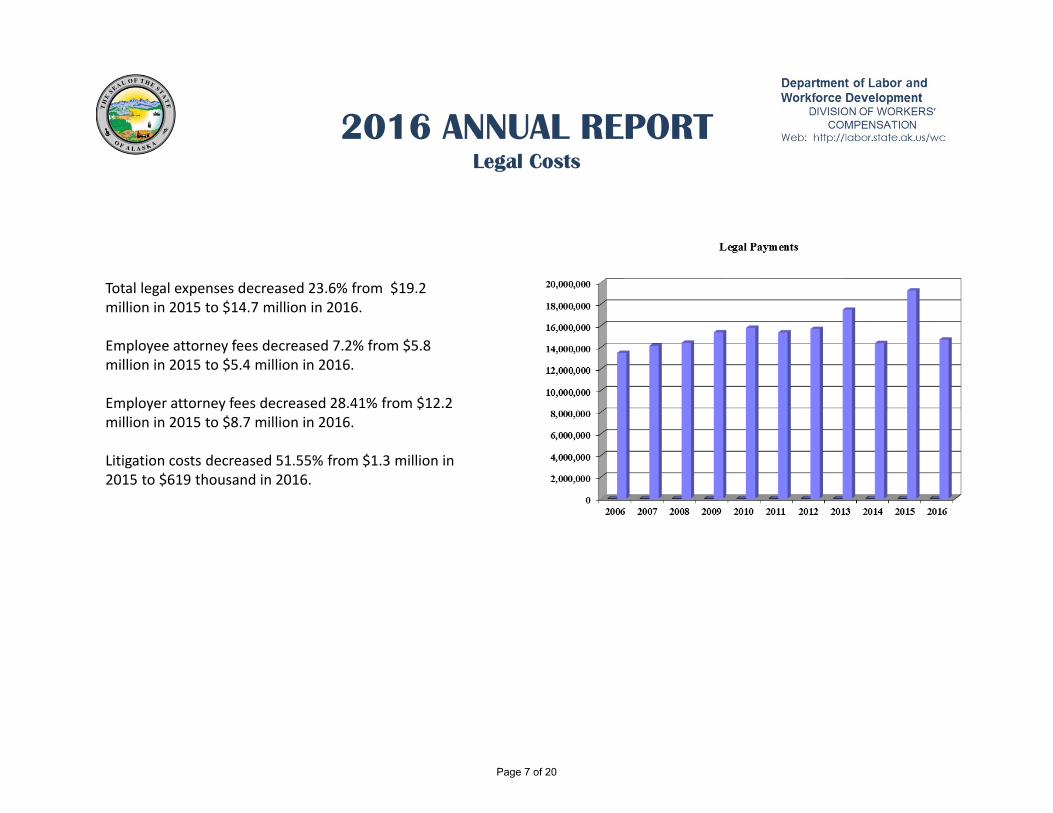
Total legal expenses decreased 23.6% from $19.2 million in 2015 to $14.7 million in 2016.
Employee attorney fees decreased 7.2% from $5.8 million in 2015 to $5.4 million in 2016.
Employer attorney fees decreased 28.41% from $12.2 million in 2015 to $8.7 million in 2016.
Litigation costs decreased 51.55% from $1.3 million in 2015 to $619 thousand in 2016.
Page 7 of 20
2016 ANNUAL REPORTReemployment Benefits
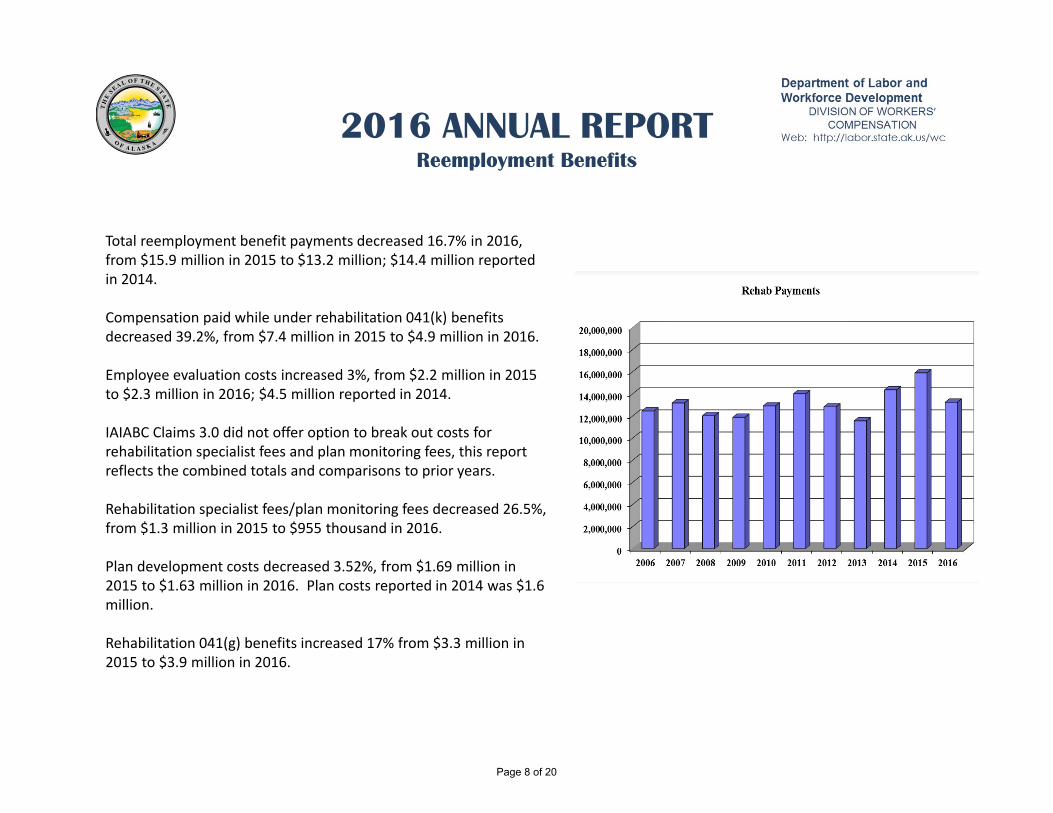
Total reemployment benefit payments decreased 16.7% in 2016, from $15.9 million in 2015 to $13.2 million; $14.4 million reported in 2014.
Compensation paid while under rehabilitation 041(k) benefits decreased 39.2%, from $7.4 million in 2015 to $4.9 million in 2016.
Employee evaluation costs increased 3%, from $2.2 million in 2015 to $2.3 million in 2016; $4.5 million reported in 2014.
IAIABC Claims 3.0 did not offer option to break out costs for rehabilitation specialist fees and plan monitoring fees, this report reflects the combined totals and comparisons to prior years.
Rehabilitation specialist fees/plan monitoring fees decreased 26.5%, from $1.3 million in 2015 to $955 thousand in 2016.
Plan development costs decreased 3.52%, from $1.69 million in 2015 to $1.63 million in 2016. Plan costs reported in 2014 was $1.6 million.
Rehabilitation 041(g) benefits increased 17% from $3.3 million in 2015 to $3.9 million in 2016.
Page 8 of 20
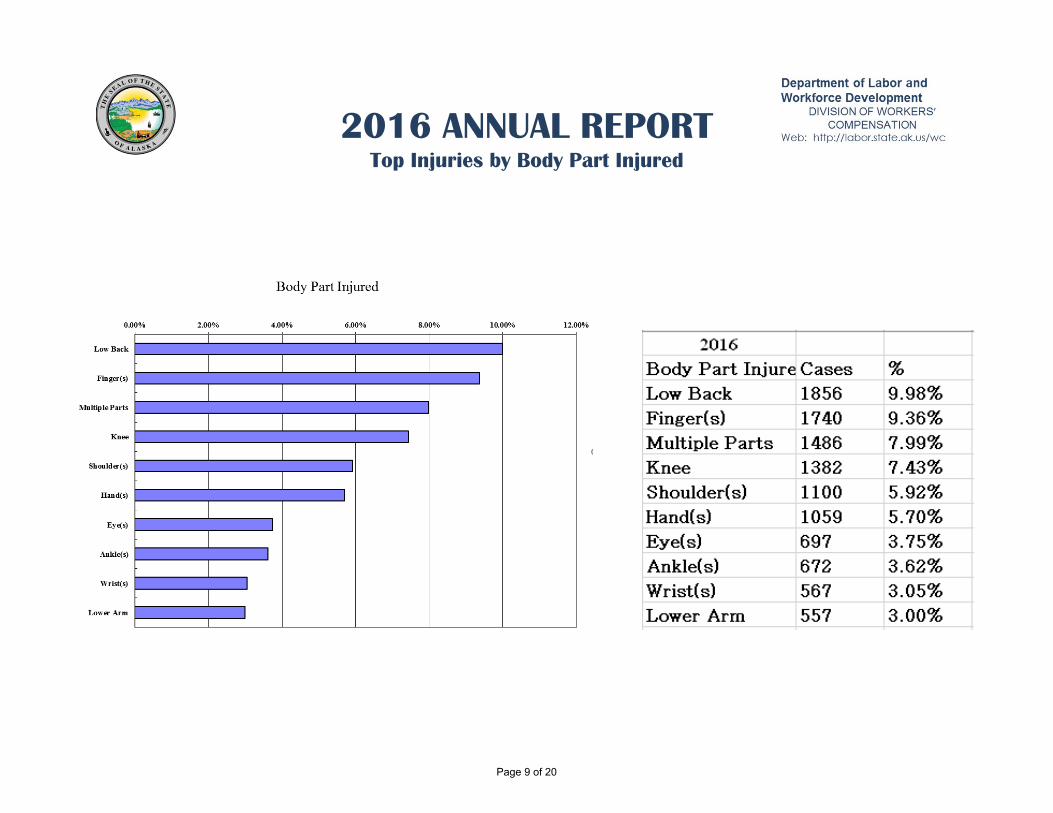
2016 ANNUAL REPORTTop Injuries by Body Part Injured
Page 9 of 20
2016 ANNUAL REPORTAlaska Injury Frequency
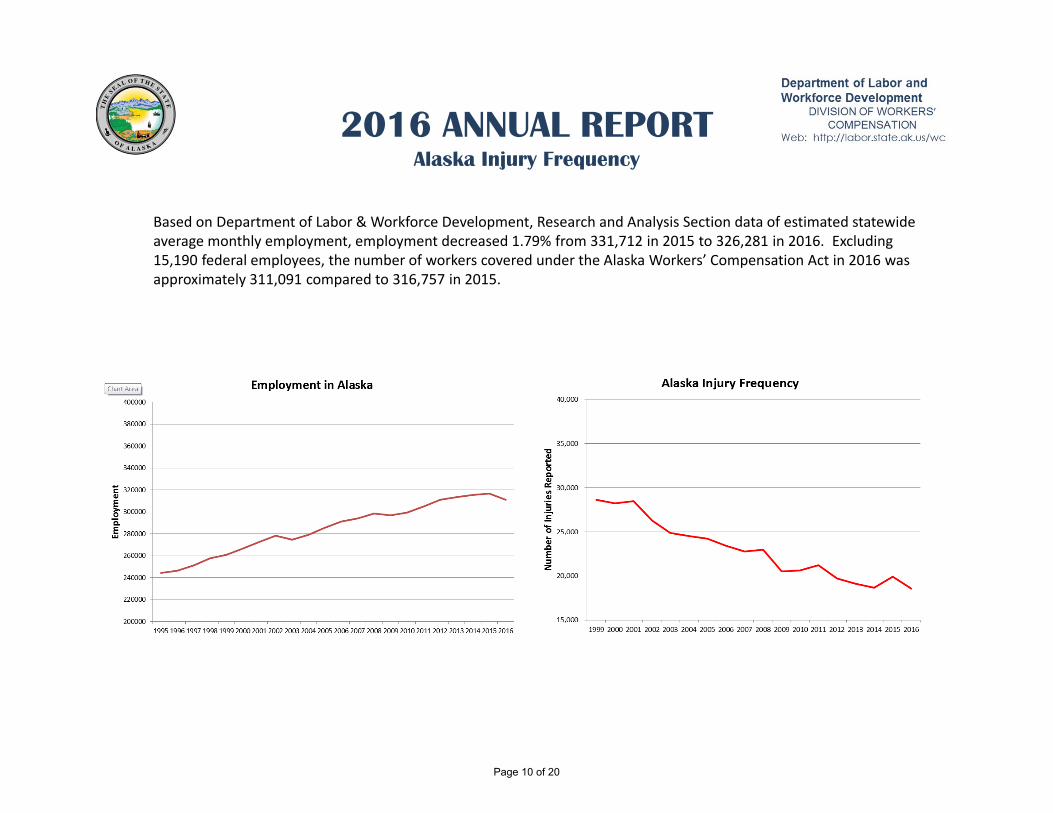
Based on Department of Labor & Workforce Development, Research and Analysis Section data of estimated statewide average monthly employment, employment decreased 1.79% from 331,712 in 2015 to 326,281 in 2016. Excluding 15,190 federal employees, the number of workers covered under the Alaska Workers’ Compensation Act in 2016 was approximately 311,091 compared to 316,757 in 2015.
Page 10 of 20
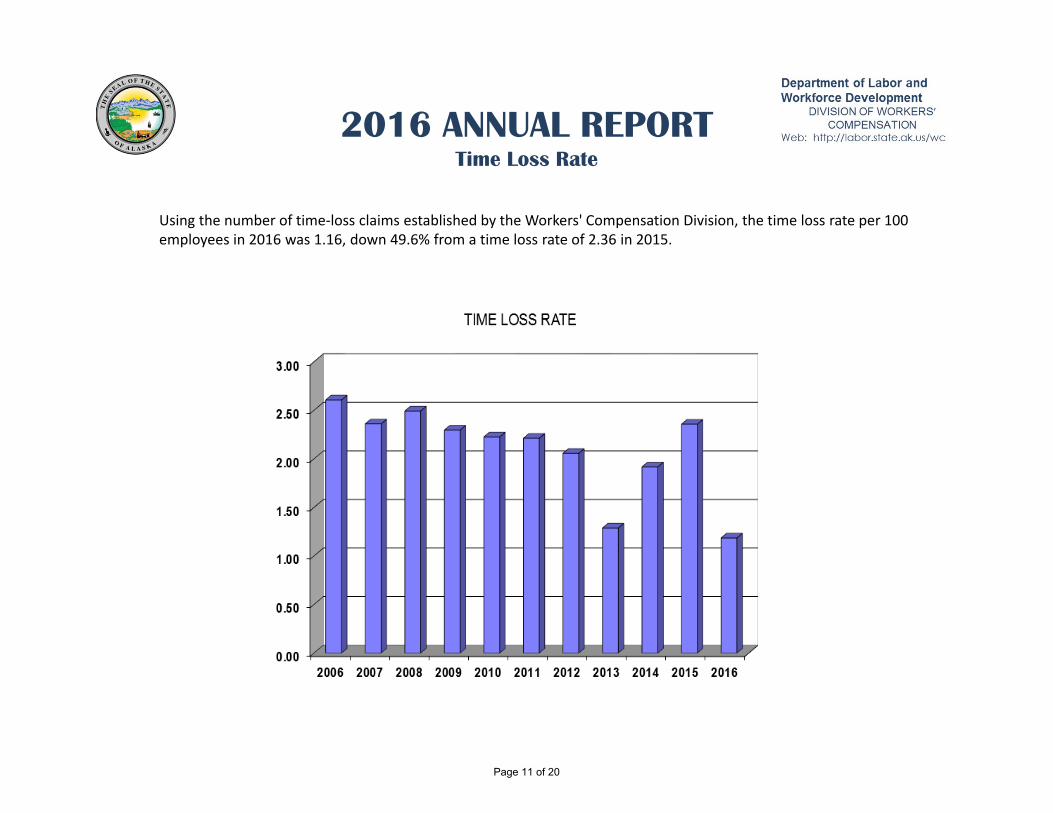
2016 ANNUAL REPORTTime Loss Rate
Using the number of time‐loss claims established by the Workers' Compensation Division, the time loss rate per 100 employees in 2016 was 1.16, down 49.6% from a time loss rate of 2.36 in 2015.
Page 11 of 20
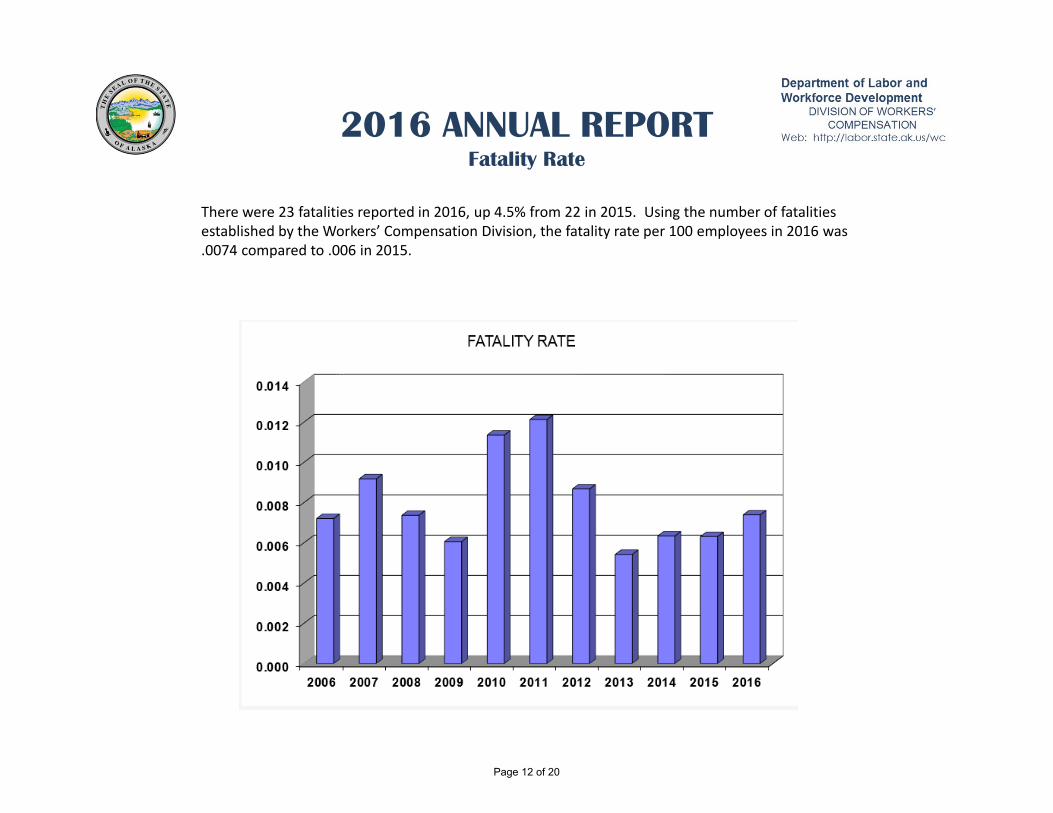
2016 ANNUAL REPORTFatality Rate
There were 23 fatalities reported in 2016, up 4.5% from 22 in 2015. Using the number of fatalities established by the Workers’ Compensation Division, the fatality rate per 100 employees in 2016 was .0074 compared to .006 in 2015.
Page 12 of 20
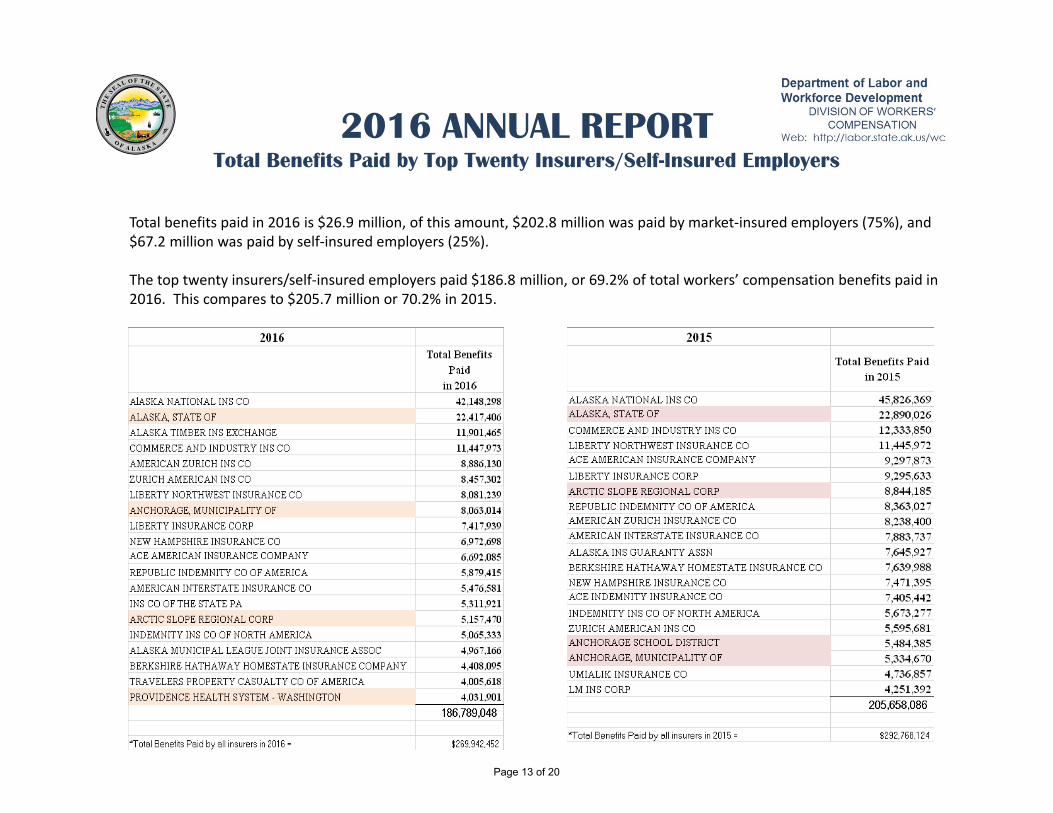
2016 ANNUAL REPORTTotal Benefits Paid by Top Twenty Insurers/Self-Insured Employers
Total benefits paid in 2016 is $26.9 million, of this amount, $202.8 million was paid by market‐insured employers (75%), and $67.2 million was paid by self‐insured employers (25%).
The top twenty insurers/self‐insured employers paid $186.8 million, or 69.2% of total workers’ compensation benefits paid in 2016. This compares to $205.7 million or 70.2% in 2015.
Page 13 of 20
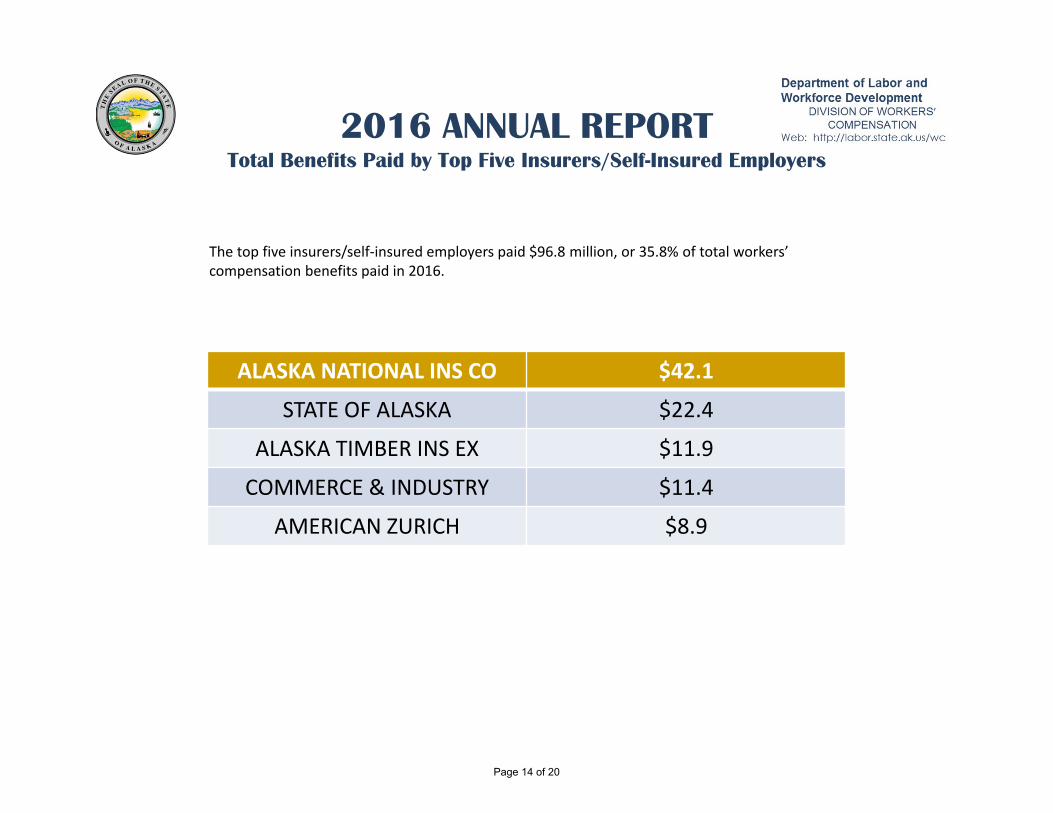
2016 ANNUAL REPORTTotal Benefits Paid by Top Five Insurers/Self-Insured Employers
The top five insurers/self‐insured employers paid $96.8 million, or 35.8% of total workers’ compensation benefits paid in 2016.
ALASKA NATIONAL INS CO $42.1
STATE OF ALASKA $22.4
ALASKA TIMBER INS EX $11.9
COMMERCE & INDUSTRY $11.4
AMERICAN ZURICH $8.9
Page 14 of 20
2016 ANNUAL REPORTDirect Written Premium
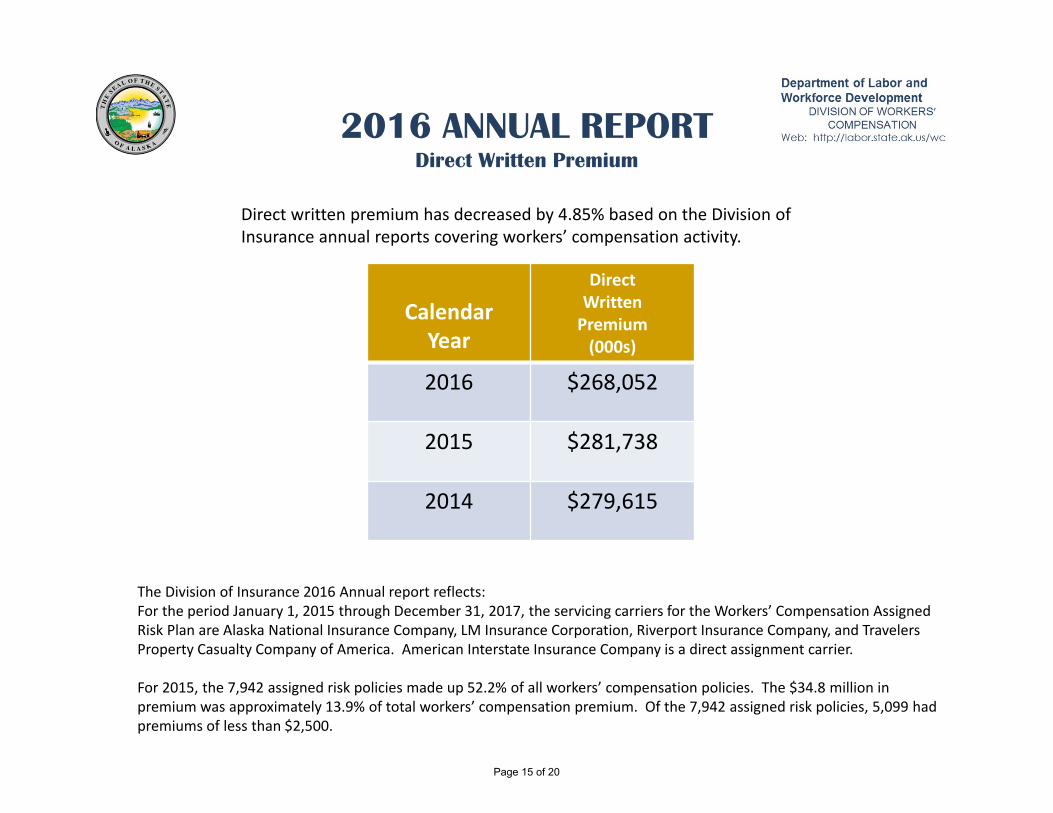
Direct written premium has decreased by 4.85% based on the Division of Insurance annual reports covering workers’ compensation activity.
CalendarYear
Direct Written Premium(000s)
2016 $268,052
2015 $281,738
2014 $279,615
The Division of Insurance 2016 Annual report reflects:For the period January 1, 2015 through December 31, 2017, the servicing carriers for the Workers’ Compensation Assigned Risk Plan are Alaska National Insurance Company, LM Insurance Corporation, Riverport Insurance Company, and Travelers Property Casualty Company of America. American Interstate Insurance Company is a direct assignment carrier.
For 2015, the 7,942 assigned risk policies made up 52.2% of all workers’ compensation policies. The $34.8 million in premium was approximately 13.9% of total workers’ compensation premium. Of the 7,942 assigned risk policies, 5,099 had premiums of less than $2,500.
Page 15 of 20
2016 ANNUAL REPORTTop Five Insurers by Market Share
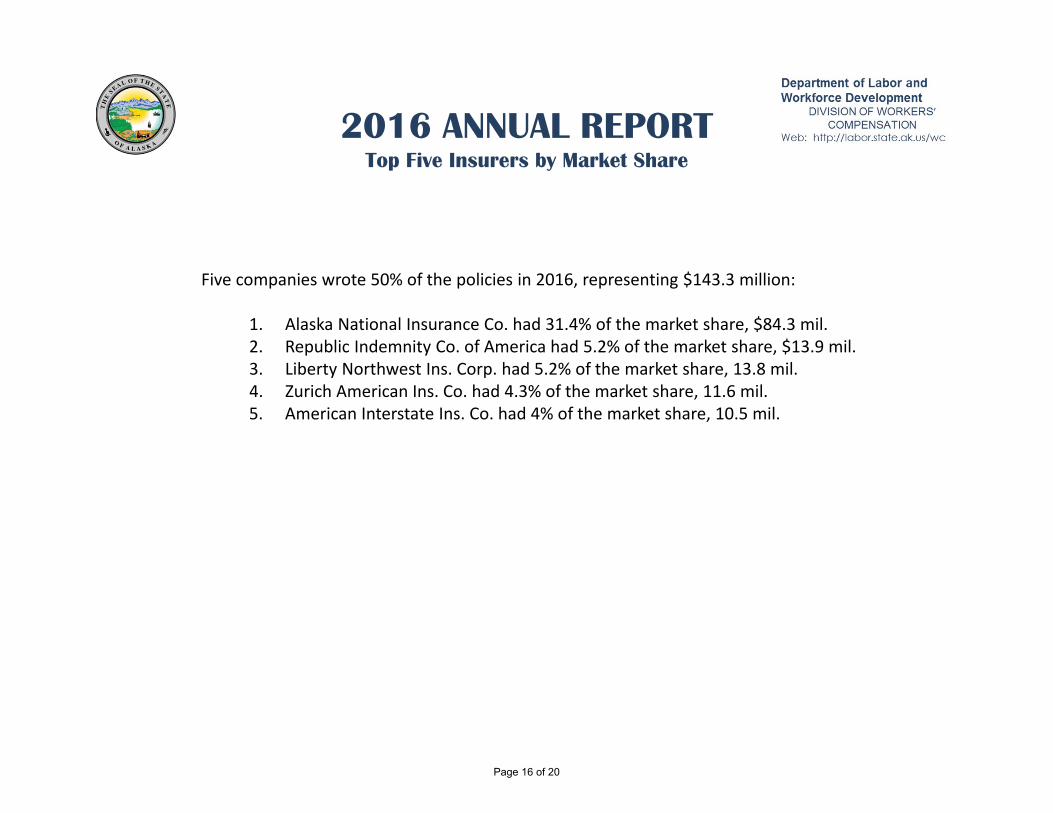
Five companies wrote 50% of the policies in 2016, representing $143.3 million:
1. Alaska National Insurance Co. had 31.4% of the market share, $84.3 mil.2. Republic Indemnity Co. of America had 5.2% of the market share, $13.9 mil.3. Liberty Northwest Ins. Corp. had 5.2% of the market share, 13.8 mil.4. Zurich American Ins. Co. had 4.3% of the market share, 11.6 mil.5. American Interstate Ins. Co. had 4% of the market share, 10.5 mil.
Page 16 of 20
2016 ANNUAL REPORTActive Self-Insured Employers
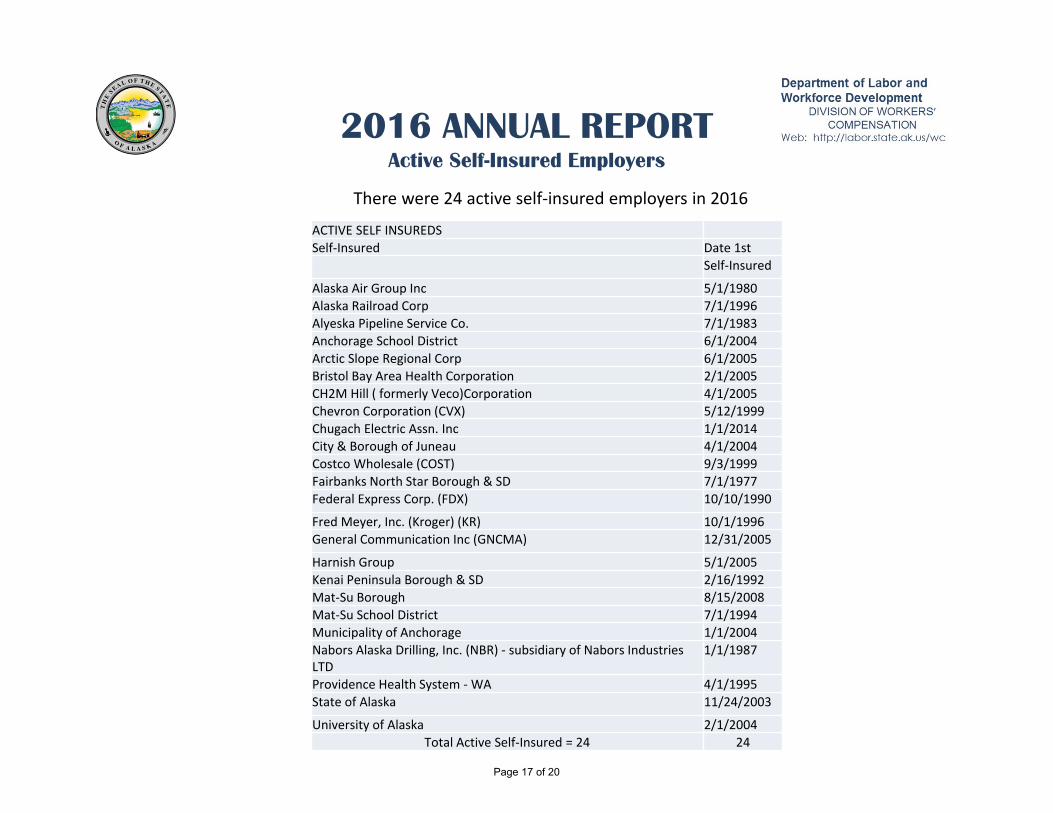
There were 24 active self‐insured employers in 2016
ACTIVE SELF INSUREDSSelf‐Insured Date 1st
Self‐Insured
Alaska Air Group Inc 5/1/1980Alaska Railroad Corp 7/1/1996Alyeska Pipeline Service Co. 7/1/1983Anchorage School District 6/1/2004Arctic Slope Regional Corp 6/1/2005Bristol Bay Area Health Corporation 2/1/2005CH2M Hill ( formerly Veco)Corporation 4/1/2005Chevron Corporation (CVX) 5/12/1999Chugach Electric Assn. Inc 1/1/2014City & Borough of Juneau 4/1/2004Costco Wholesale (COST) 9/3/1999Fairbanks North Star Borough & SD 7/1/1977Federal Express Corp. (FDX) 10/10/1990
Fred Meyer, Inc. (Kroger) (KR) 10/1/1996General Communication Inc (GNCMA) 12/31/2005
Harnish Group 5/1/2005Kenai Peninsula Borough & SD 2/16/1992Mat‐Su Borough 8/15/2008Mat‐Su School District 7/1/1994Municipality of Anchorage 1/1/2004Nabors Alaska Drilling, Inc. (NBR) ‐ subsidiary of Nabors Industries LTD
1/1/1987
Providence Health System ‐WA 4/1/1995State of Alaska 11/24/2003
University of Alaska 2/1/2004Total Active Self‐Insured = 24 24
Page 17 of 20
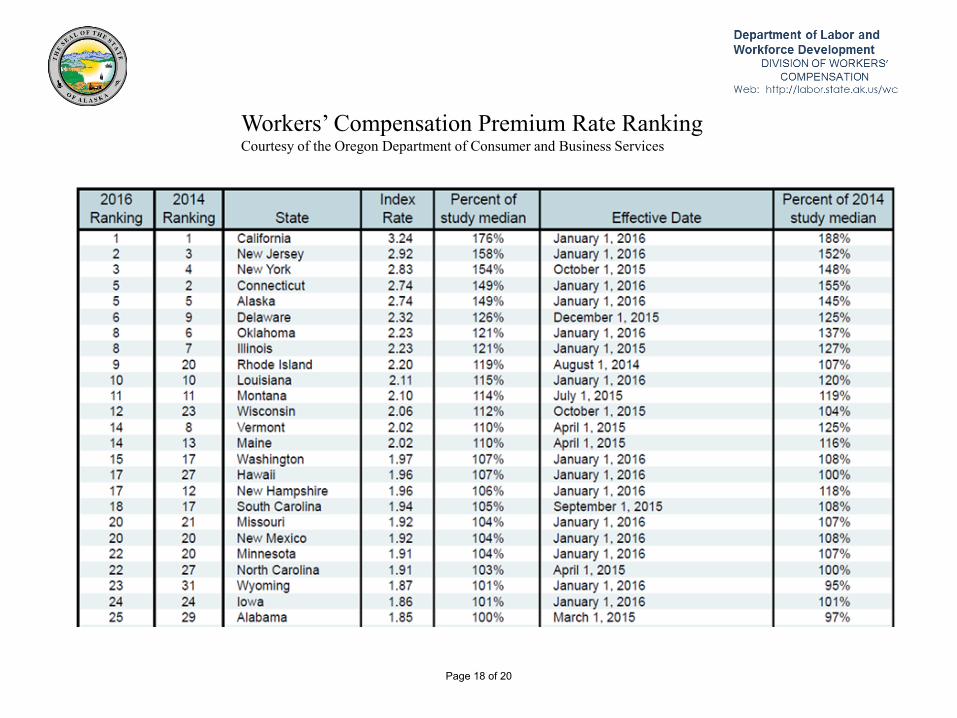
Workers’ Compensation Premium Rate RankingCourtesy of the Oregon Department of Consumer and Business Services
Page 18 of 20
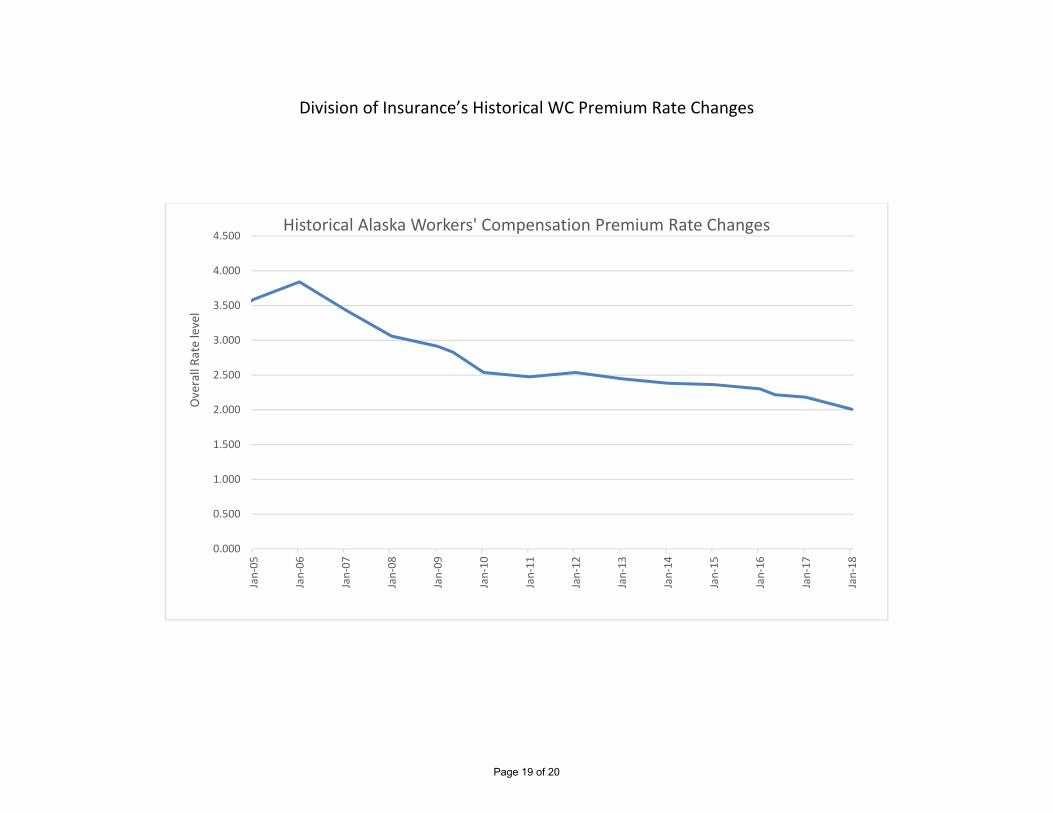
Division of Insurance’s Historical WC Premium Rate Changes
0.000
0.500
1.000
1.500
2.000
2.500
3.000
3.500
4.000
4.500Jan‐05
Jan‐06
Jan‐07
Jan‐08
Jan‐09
Jan‐10
Jan‐11
Jan‐12
Jan‐13
Jan‐14
Jan‐15
Jan‐16
Jan‐17
Jan‐18
Overall Ra
te level
Historical Alaska Workers' Compensation Premium Rate Changes
Page 19 of 20
Professional Component
Technical Component Global Professional
ComponentTechnical
Component Global
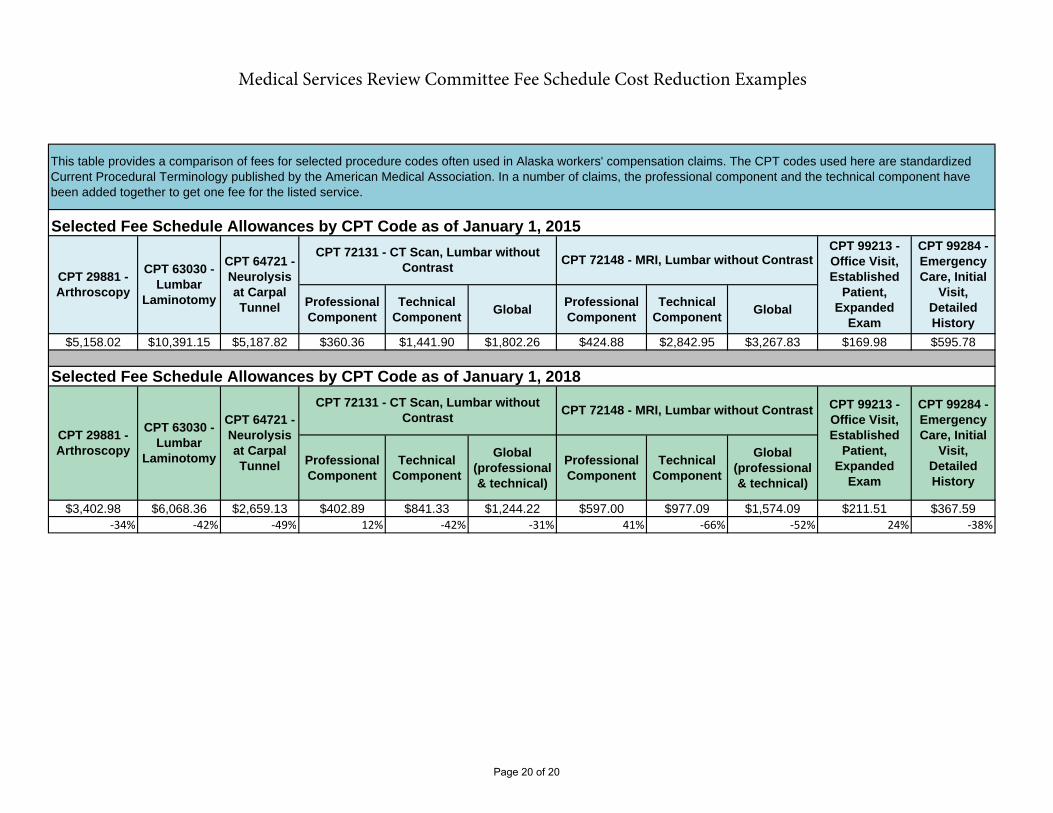
$5,158.02 $10,391.15 $5,187.82 $360.36 $1,441.90 $1,802.26 $424.88 $2,842.95 $3,267.83 $169.98 $595.78
Professional Component
Technical Component
Global (professional & technical)
Professional Component
Technical Component
Global (professional & technical)
$3,402.98 $6,068.36 $2,659.13 $402.89 $841.33 $1,244.22 $597.00 $977.09 $1,574.09 $211.51 $367.59 ‐34% ‐42% ‐49% 12% ‐42% ‐31% 41% ‐66% ‐52% 24% ‐38%
This table provides a comparison of fees for selected procedure codes often used in Alaska workers' compensation claims. The CPT codes used here are standardized Current Procedural Terminology published by the American Medical Association. In a number of claims, the professional component and the technical component have been added together to get one fee for the listed service.
CPT 29881 - Arthroscopy
CPT 63030 - Lumbar
Laminotomy
CPT 64721 - Neurolysis at Carpal Tunnel
CPT 72131 - CT Scan, Lumbar without Contrast CPT 72148 - MRI, Lumbar without Contrast
CPT 99213 -Office Visit, Established
Patient, Expanded
Exam
Selected Fee Schedule Allowances by CPT Code as of January 1, 2015
CPT 72148 - MRI, Lumbar without Contrast CPT 99213 -Office Visit, Established
Patient, Expanded
Exam
CPT 99284 - Emergency Care, Initial
Visit, Detailed History
CPT 99284 - Emergency Care, Initial
Visit, Detailed History
Selected Fee Schedule Allowances by CPT Code as of January 1, 2018
CPT 29881 - Arthroscopy
CPT 63030 - Lumbar
Laminotomy
CPT 64721 - Neurolysis at Carpal Tunnel
CPT 72131 - CT Scan, Lumbar without Contrast
Medical Services Review Committee Fee Schedule Cost Reduction Examples
Page 20 of 20