Embed Size (px)
Citation preview

State of Environment Report India –2009State of Environment Report India –2009
11th August 2009
Process and Content

Development Alternatives
� SoE Reporting Process in India
� SoE Report – India 2009
… key highlights
� Future Outlook
Presentation Profile

Development Alternatives
SoE Reporting Process
in India

Development Alternatives
� 10th Five Year Plan
– Decision to streamline SoE Reporting System in India
– NHIs and SHIs designated
� Objectives
– to present an overview of the environmental situation in space and time
– to create awareness and ownership of issues among stakeholders
– to enable policy and strategy formulation
– to facilitate analytical and informed decision-making
Background

Sensitisation / Stakeholders Workshop
Response Identification
Draft Report Consultation Finalisation
SoE Report - India
(Perception Based)(Data Based)
SoE – Reporting Approach
Data Collection
Data Collation Synthesis & Consultation
- Gaps
- Possible responses
Issue Identification & Prioritisation
Validation & Data Gap Filling
Verification with stakeholders

Development Alternatives
PSIR framework has been used to analyse the various issues
� Pressure : Agents of environmental changes;
� State : Analysis of the past trends or projection of the future;
� Impact : Effects on environment quality; and
� Response : Societal response with policies to affect State of theEnvironment
PSIR - Analytic Framework

Development Alternatives
SoE Reporting Products

Development Alternatives
SoE Report India – 2009
Key Highlights

Development Alternatives
The report is structured into five sections
� Section I : Overview
� Section II : State and Trends of the Environment
� Section III : Key Environmental Issues
� Section IV : Policies and Institutional Options
� Section V : Annexure
State of Environment Report

Development Alternatives
STATE & TRENDS
of
ENVIRONMENTLand
Air
Water
Biodiversity

Development Alternatives
� Approximately 45% land degraded
– Water erosion
– Soil acidity, alkalinity, salinity
– Water logging
– Wind erosion & complex problems
� Prime Causes
– Deforestation
– Unsustainable agriculture practices
– Mining operations
– Excessive ground water extraction
� >2/3 of this 147 Mha. can be quite easily regenerated
– Forest Cover gradually improving
Land

Development Alternatives
� Increasing trend of RSPM and SPM levels
– Most cities > NAAQ Standards
– Public Health damage costs in 50 cities (110m population) = Rs.15,000 crores in 2004
� Prime drivers
– Vehicular pollution
– Industrialisation
� SO2 and NO2 levels fortunately decreasing due to measures taken
Air

Development Alternatives
� Quantitative limits to Water Use
– Availability – consuming 75% utilisable resource
– Future requirement – just enough if careful
– Temporal Challenge – 80% flows in four months
– Spatial Challenge – many basins facing scarcity
� Prime Causes
– Domestic Activities• Unsustainable consumption patterns – pricing• Inadequate sanitation – pollution
– Industrial Activities• Unregulated extraction of ground water• Discharge of toxic and organic waste water
– Agricultural Activities• Inefficient Irrigation and farming practices• Overuse of chemical fertilisers and pesticides
Water

Development Alternatives
� India – biodiversity rich
– With 2.4% global land area has 8% biodiversity wealth
– One of the 17 mega diverse countries
– >45,500 plant and 91,000 animal species
– Mostly in 10% of our land area
� However – rapid loss trends
– 10% wild flora and fauna in threatened list
– Many on the verge of extinction
� Prime Causes
– Anthropogenic habitat destruction
– Others – poaching and hunting, invasive species, over exploitation of wild bio-resources, pollution and climate change
Biodiversity

Development Alternatives
KEYENVIRONMENTAL
ISSUES
Climate Change
Water Security
ManagingUrbanization
Food Security
Energy Security

Development Alternatives
Addressing Climate Challenge
� National Perspective
– India contributes only ~5% global CO2 emissions @ 1.2T/capita/annum
– Over 700 million people likely to be affected
– Preliminary vulnerability assessments completed – detailing in progress
� Response Strategy - NAPCC
– Adaptation to climate change
– Enhancement of ecological sustainability of India’s development path
– Multi-pronged integrated strategies through Eight National Missions

Development Alternatives
Food Security
� National Perspective
– Under nourished population of ~ 231 million
– Marginal improvement in Children’s nutrition status
� Response Strategy (NFS Mission)
– Sustainable increase in production & productivity of food crops
– Boosting agricultural science and technology
– Promotion of organic farming
– Upgradation of storage and distribution systems

Development Alternatives
� Improving efficiencies and minimising losses
� Recharging Ground Water Aquifers
� Abatement and Treatment of Pollution
� Reuse and recycling of Waste Water
Water Security
Projected Annual Requirement of Water
Development Alternatives
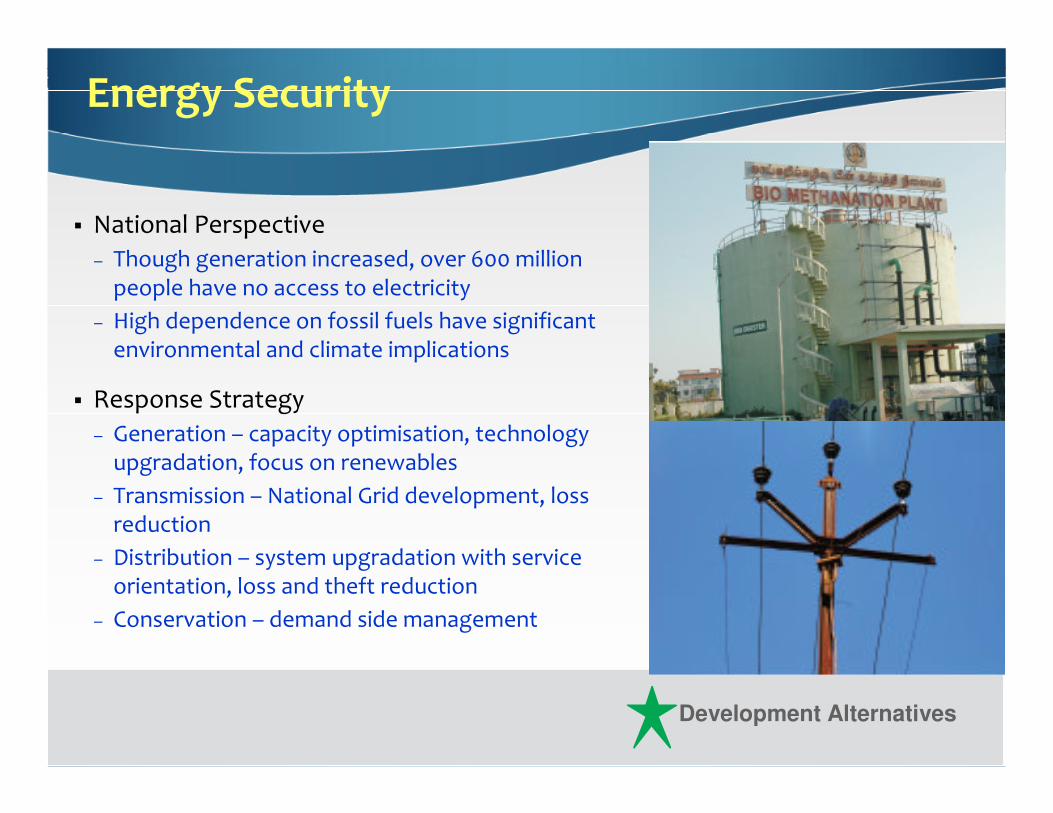
Energy Security
� National Perspective
– Though generation increased, over 600 million people have no access to electricity
– High dependence on fossil fuels have significant environmental and climate implications
� Response Strategy
– Generation – capacity optimisation, technology upgradation, focus on renewables
– Transmission – National Grid development, loss reduction
– Distribution – system upgradation with service orientation, loss and theft reduction
– Conservation – demand side management

Development Alternatives
Managing Urbanization
� National Perspective
– Currently ~ 28% urban population – rapidly increasing
– 20 to 40% urban population in slums – with environmental and health implications
� Response Strategies
– JN National Urban Renewal Mission• Well Integrated• More emphasis may be given to small and
medium towns

Development Alternatives
Future Outlook

Development Alternatives
� National Products
– SoE Report – India 2009
– Two Thematic SoEs
– Updated Interactive SoE Atlas
– India Sustainability Watch
� State Level Products
– Second set of Reports – all States
– Second set of other products – most states
Future Outlook
… before 2012

Development Alternatives
Thank you