Embed Size (px)
Citation preview
Static and dynamic respirometric indexes � Italianresearch and studies
1Adani F., 1Ubbiali C., 1Tambone F., 1Scaglia B., 2Centemero M and 1Genevini P.L.
1Dipartimeno di Produzione Vegetale � Università degli Studi di Milano, Via Celoria 2,20133, Milano, Italy
2 Scuola Agraria del Parco di Monza, Viale Cavriga 5, Monza, Italy
Web site: http://users.unimi.it/~ricicla/ricicla.htm
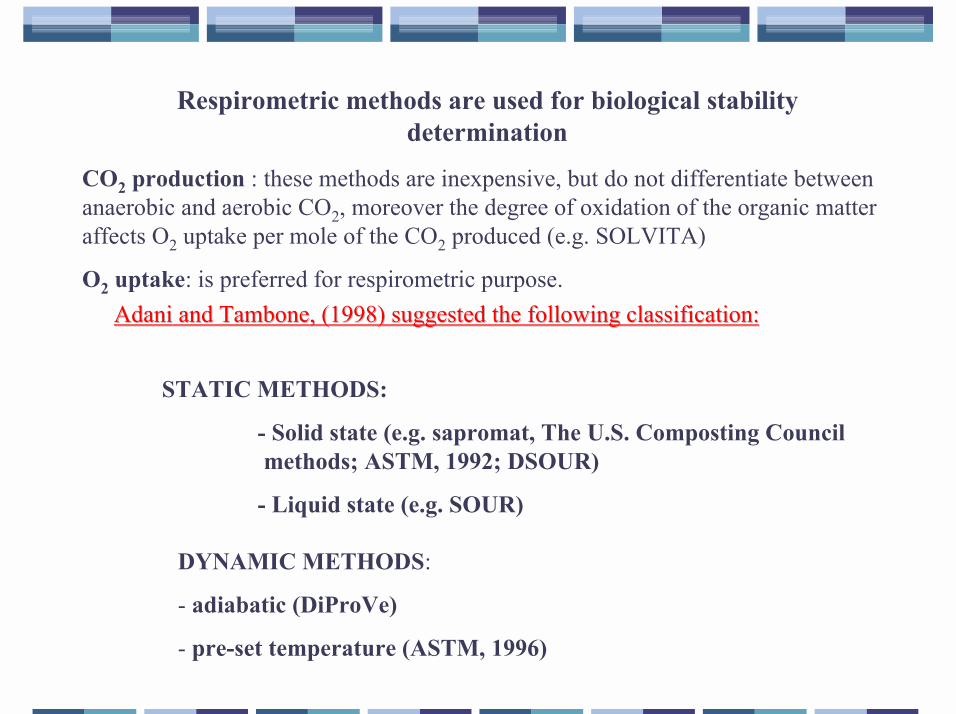
Respirometric methods are used for biological stabilitydetermination
CO2 production : these methods are inexpensive, but do not differentiate betweenanaerobic and aerobic CO2, moreover the degree of oxidation of the organic matteraffects O2 uptake per mole of the CO2 produced (e.g. SOLVITA)
O2 uptake: is preferred for respirometric purpose.
STATIC METHODS:
- Solid state (e.g. sapromat, The U.S. Composting Council methods; ASTM, 1992; DSOUR)
- Liquid state (e.g. SOUR)
DYNAMIC METHODS:
- adiabatic (DiProVe)
- pre-set temperature (ASTM, 1996)
AdaniAdani and and Tambone Tambone, (1998) suggested the following classification:, (1998) suggested the following classification:
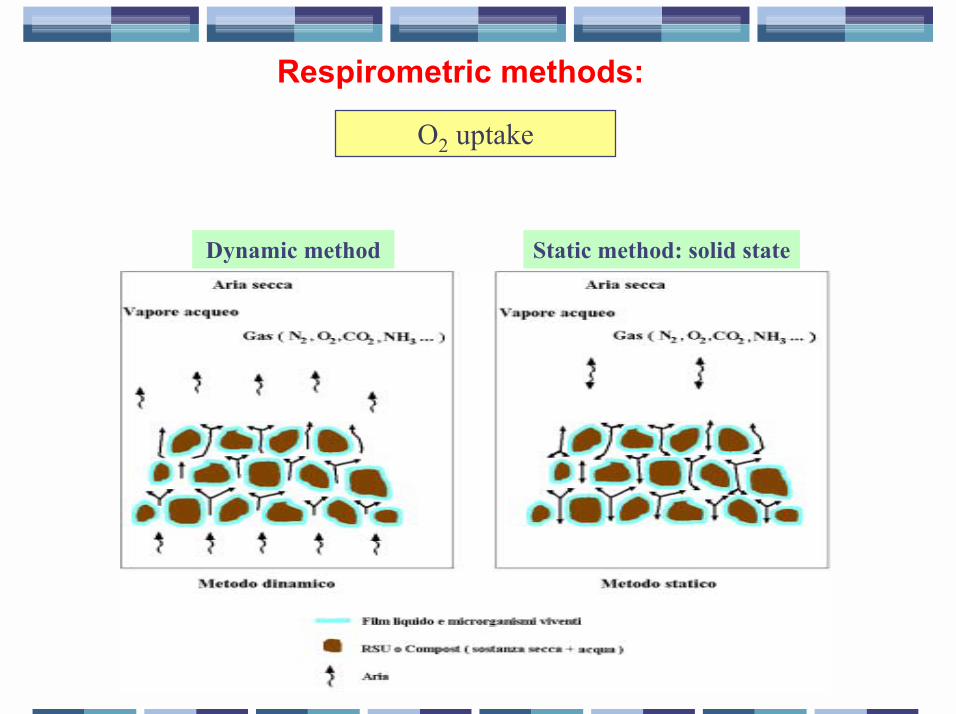
Respirometric methods:
O2 uptake
Dynamic method Static method: solid state
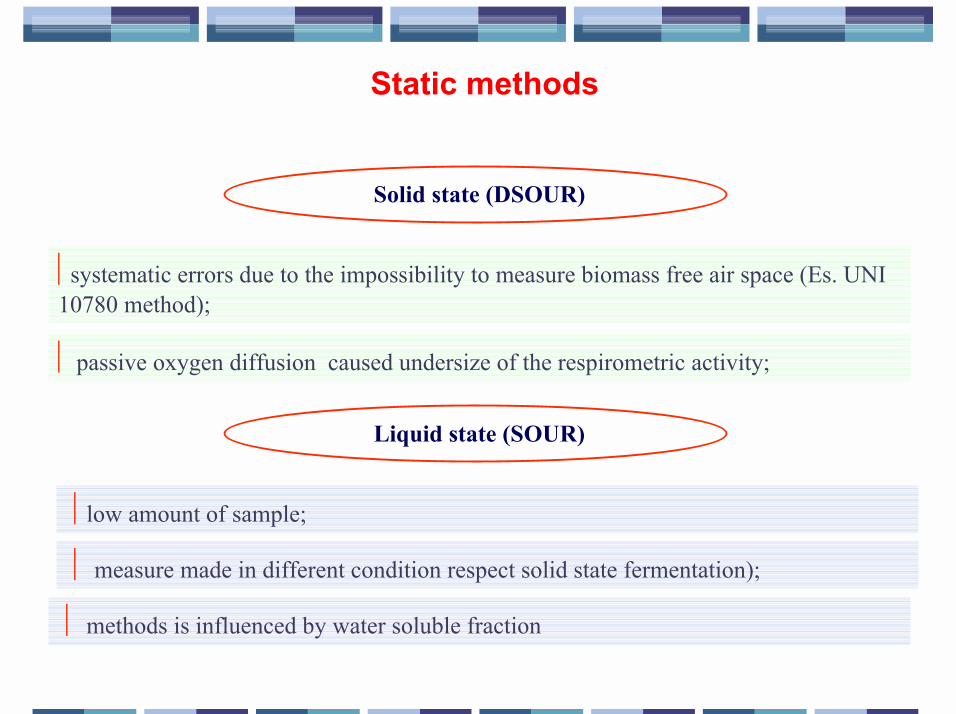
Static methods
�systematic errors due to the impossibility to measure biomass free air space (Es. UNI10780 method);
� passive oxygen diffusion caused undersize of the respirometric activity;
�low amount of sample;
� methods is influenced by water soluble fraction
Solid state (DSOUR)
Liquid state (SOUR)
� measure made in different condition respect solid state fermentation);
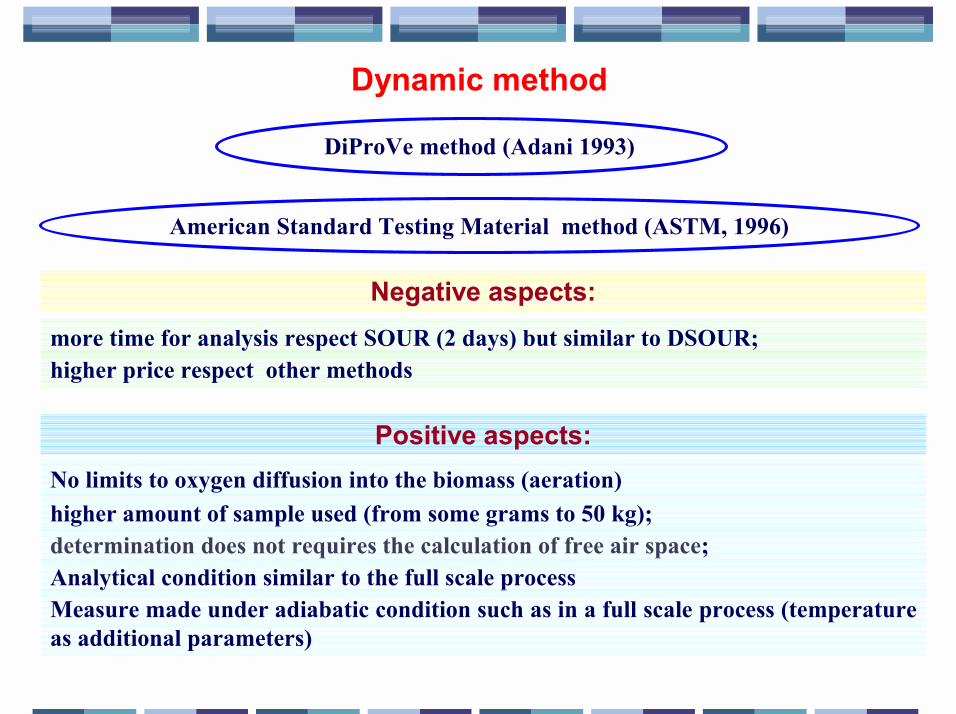
Dynamic method
DiProVe method (Adani 1993)
American Standard Testing Material method (ASTM, 1996)
Negative aspects:more time for analysis respect SOUR (2 days) but similar to DSOUR;higher price respect other methods
Positive aspects:No limits to oxygen diffusion into the biomass (aeration)higher amount of sample used (from some grams to 50 kg);determination does not requires the calculation of free air space;Analytical condition similar to the full scale processMeasure made under adiabatic condition such as in a full scale process (temperatureas additional parameters)
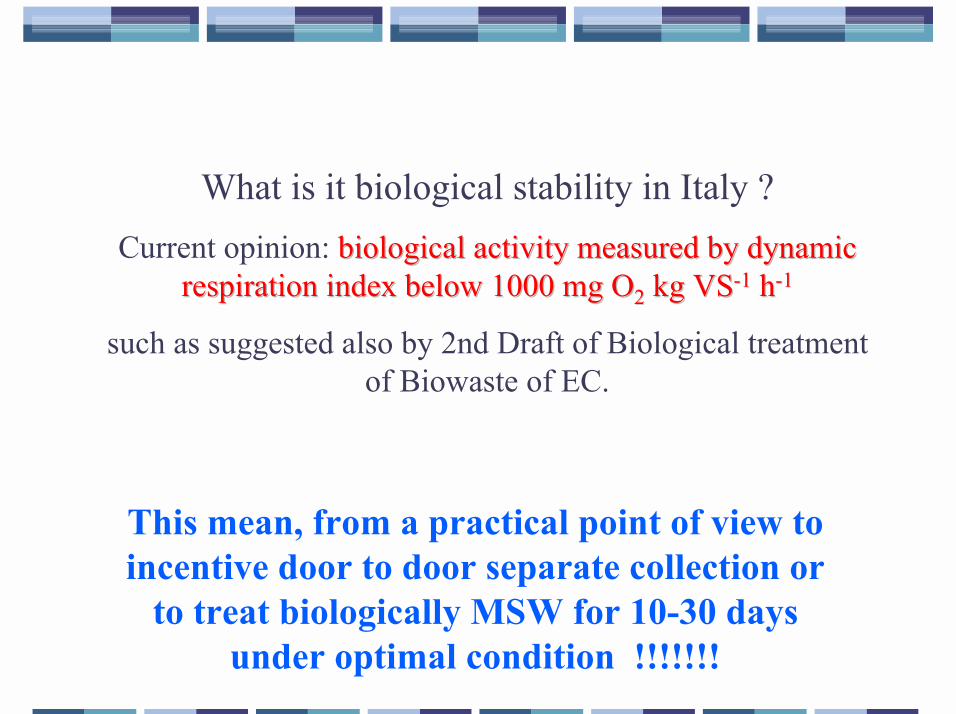
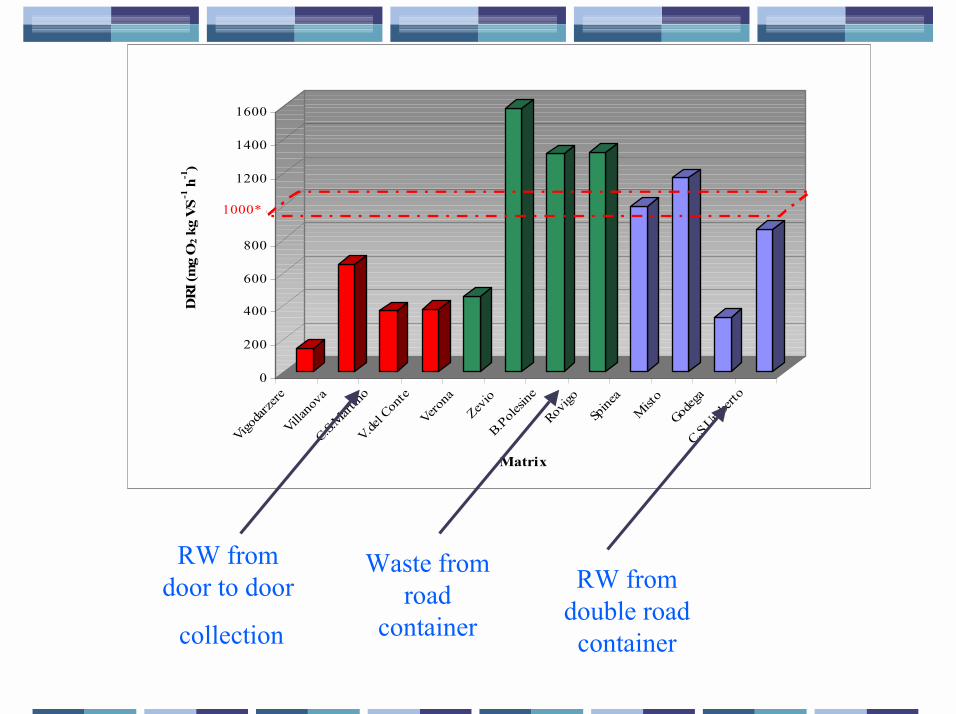
What is it biological stability in Italy ?Current opinion: biological activity measured by dynamicbiological activity measured by dynamic
respiration index below 1000 mg Orespiration index below 1000 mg O22 kg VS kg VS-1-1 h h-1-1
such as suggested also by 2nd Draft of Biological treatmentof Biowaste of EC.
This mean, from a practical point of view toincentive door to door separate collection or
to treat biologically MSW for 10-30 daysunder optimal condition !!!!!!!
0
1000
2000
3000
4000
5000
6000
Inizio processo Metà processo Fine Processo
process
DR
I (m
g O
2 kg
VS-1
h-1)
BT-1
BT-2
BT-3
BS-1
BS-2
BS-3
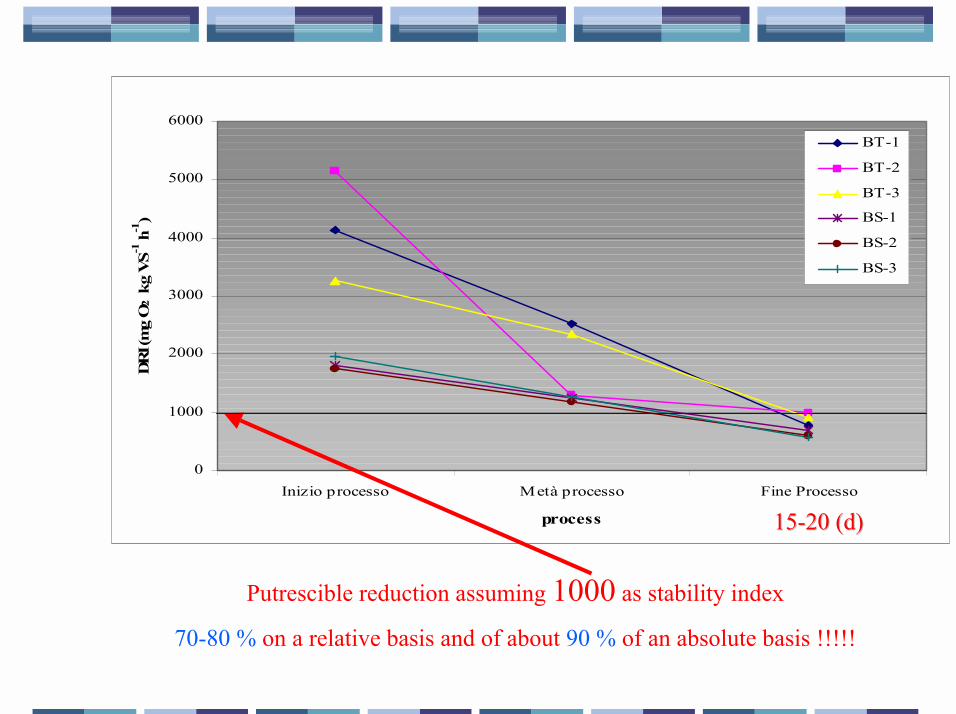
15-20 (d)15-20 (d)
Putrescible reduction assuming 1000 as stability index
70-80 % on a relative basis and of about 90 % of an absolute basis !!!!!
0
200
400
600
800
1000
1200
1400
1600
DRI
(mg
O2 k
g V
S-1
h-1
)
Vigoda
rzere
Villano
vaC.S.
Mart
inoV.de
l Con
teVero
na
Zevio
B.Pole
sine
Rovigo
Spine
a
Mist
oGod
ega
C.S.Umbe
rto
Matrix
1000*
RW fromdoor to door
collection
Waste fromroad
container
RW fromdouble road
container
0% 10% 20% 30% 40% 50% 60%
Vim e rc a te
Villa s a nta
Va re do
Truc a zza no
Tre zzo s / A
R o s a te
P a de rno D .
N o v a te M .
M o nza
M is into
M e le g na no
La ina te
D e s io
C o rbe tta
C o lo g no M .
C inis e llo B .
C a s ta no P .
B uc c ina s c o
B rug he rio
B ia s s o no
A re s e
A lb ia te
A lba ira te
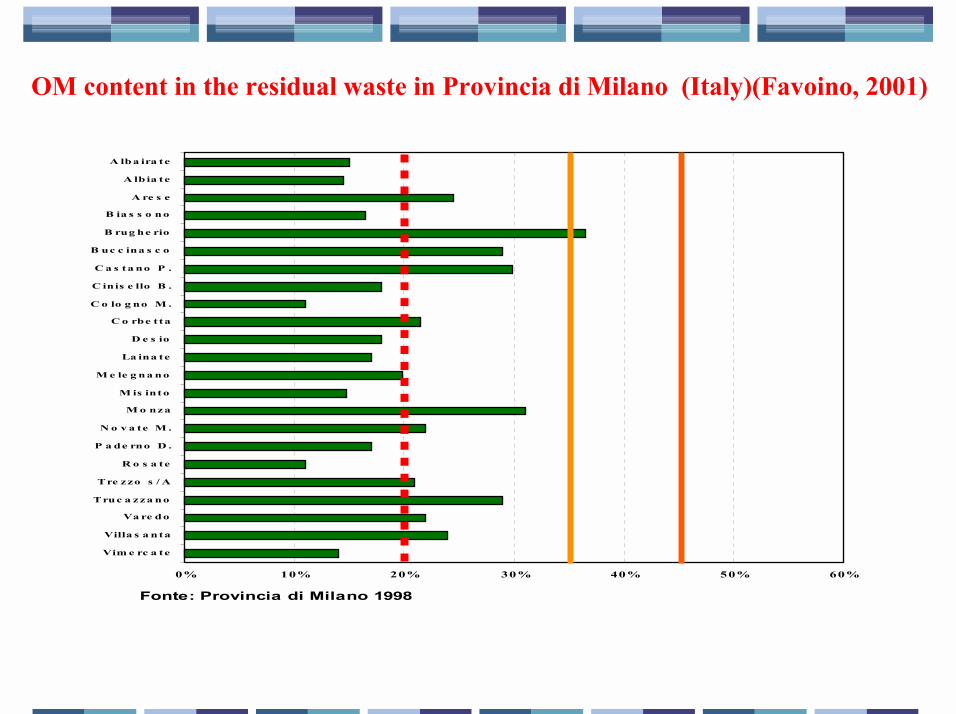
Fonte: Provincia di Milano 1998
OM content in the residual waste in Provincia di Milano (Italy)(Favoino, 2001)
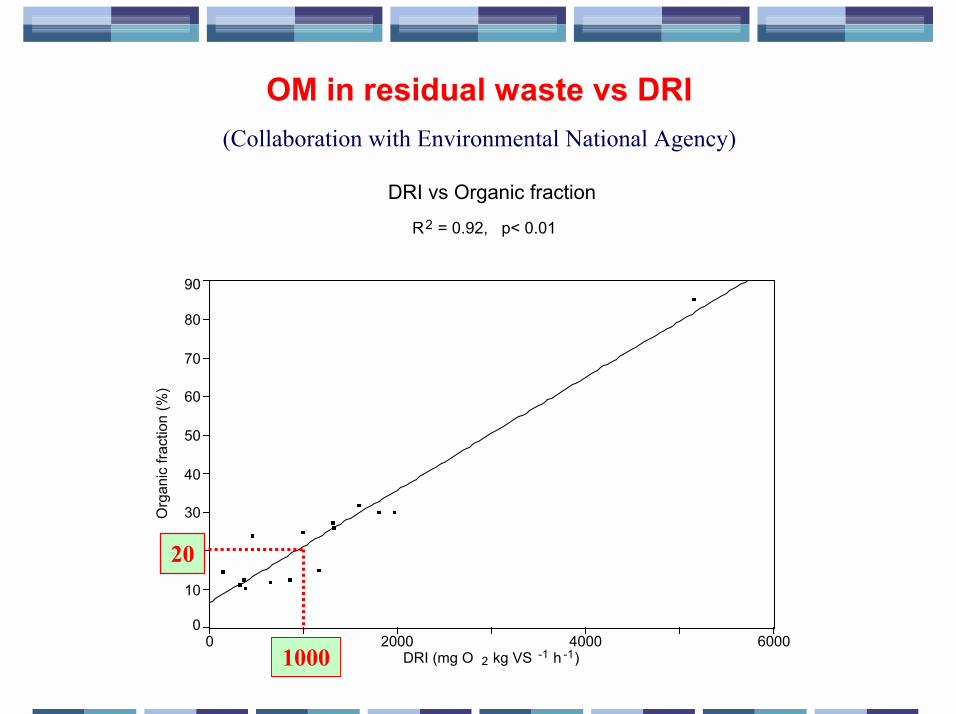
OM in residual waste vs DRI(Collaboration with Environmental National Agency)
DRI vs Organic fraction
R2 = 0.92, p< 0.01
0 2000 4000 6000DRI (mg O 2 kg VS -1 h -1)
0
10
20
30
40
50
60
70
80
90
Org
anic
frac
tion
(%)
1000
20
Therefore we fixed biological stability indicating anumber and a method
Nevertheless many other methods are proposed in theliterature
Therefore it could be useful to give correspondingvalue for biological stability indication
Comparison tests between different methods; wetested
- Dynamic Respiration Index (DiProVe methods, Scaglia et al., 2000) (used in Italy)
- SOUR (Stentiford and Lasaridi, 1998) (used in UK)
- SRI (DiProVe methods; Scaglia et al., 2000) (used in Italy, USA)
- Sapromat (Binner and Zach, 1998) (used in Germany, Austria)
- Solvita (by Woods end® Research, Mt vernon, Me �USA) (used in USA)
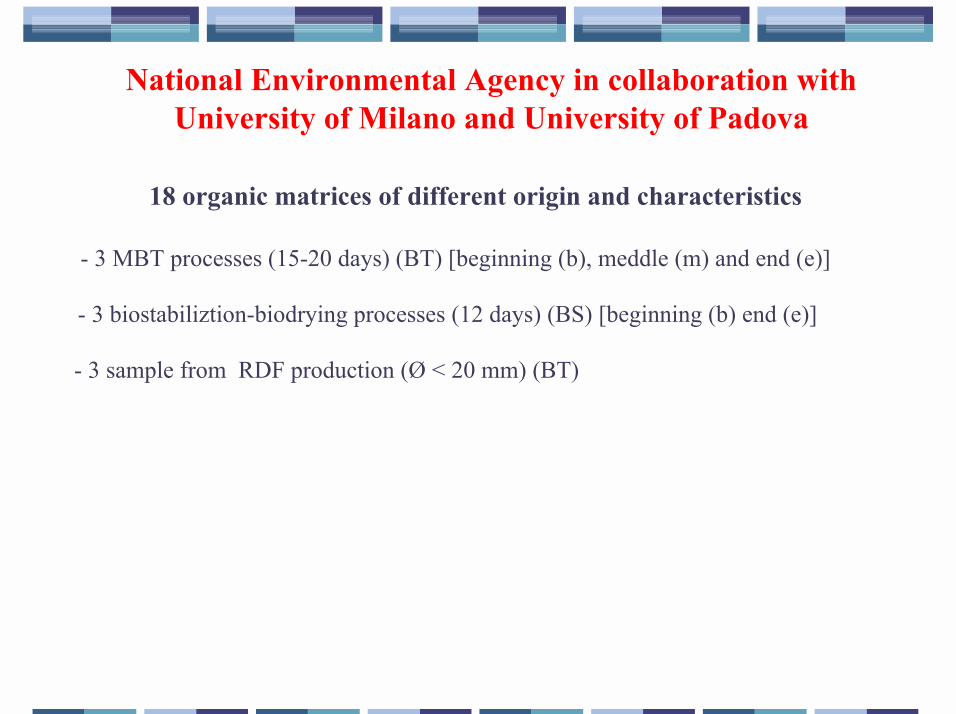
18 organic matrices of different origin and characteristics
- 3 MBT processes (15-20 days) (BT) [beginning (b), meddle (m) and end (e)]
- 3 sample from RDF production (Ø < 20 mm) (BT)
National Environmental Agency in collaboration withUniversity of Milano and University of Padova
- 3 biostabiliztion-biodrying processes (12 days) (BS) [beginning (b) end (e)]
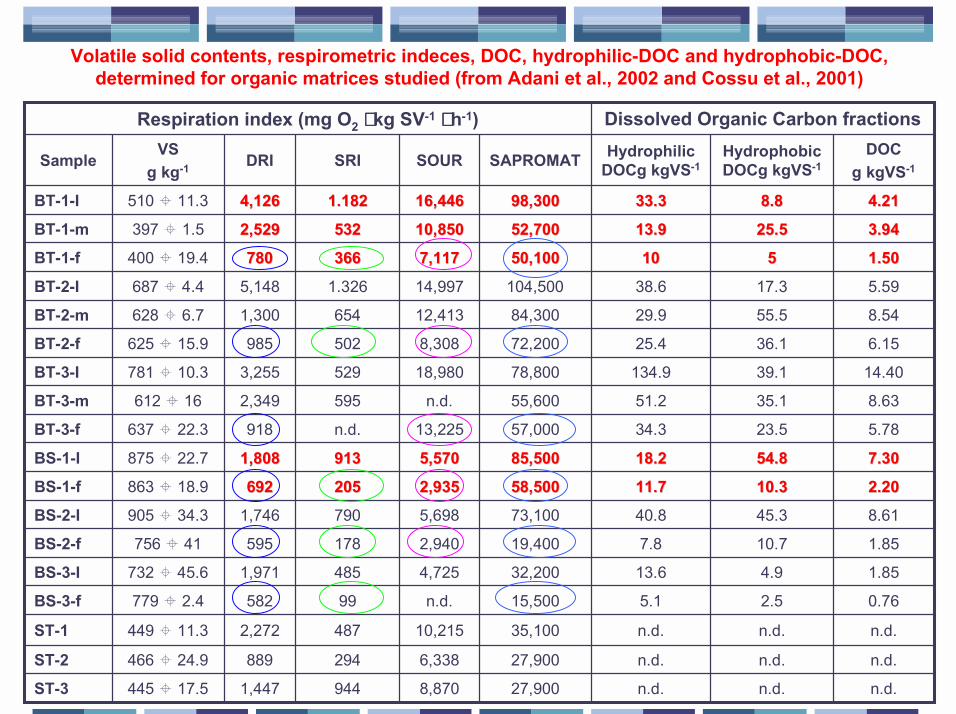
Volatile solid contents, respirometric indeces, DOC, hydrophilic-DOC and hydrophobic-DOC,determined for organic matrices studied (from Adani et al., 2002 and Cossu et al., 2001)
Dissolved Organic Carbon fractions
n.d.n.d.n.d.27,9008,8709441,447445 � 17.5ST-3
n.d.n.d.n.d.27,9006,338294889466 � 24.9ST-2
n.d.n.d.n.d.35,10010,2154872,272449 � 11.3ST-1
0.762.55.115,500n.d.99582779 � 2.4BS-3-f
1.854.913.632,2004,7254851,971732 � 45.6BS-3-I
1.8510.77.819,4002,940178595756 � 41BS-2-f
8.6145.340.873,1005,6987901,746905 � 34.3BS-2-I2.202.2010.310.311.711.758,50058,5002,9352,935205205692692863 � 18.9BS-1-f7.307.3054.854.818.218.285,50085,5005,5705,5709139131,8081,808875 � 22.7BS-1-I
5.7823.534.357,00013,225n.d.918637 � 22.3BT-3-f
8.6335.151.255,600n.d.5952,349612 � 16BT-3-m
14.4039.1134.978,80018,9805293,255781 � 10.3BT-3-I
6.1536.125.472,2008,308502985625 � 15.9BT-2-f
8.5455.529.984,30012,4136541,300628 � 6.7BT-2-m
5.5917.338.6104,50014,9971.3265,148687 � 4.4BT-2-I1.501.5055101050,10050,1007,1177,117366366780780400 � 19.4BT-1-f3.943.9425.525.513.913.952,70052,70010,85010,8505325322,5292,529397 � 1.5BT-1-m4.214.218.88.833.333.398,30098,30016,44616,4461.1821.1824,1264,126510 � 11.3BT-1-I
DOCg kgVS-1
HydrophobicDOCg kgVS-1
HydrophilicDOCg kgVS-1SAPROMATSOURSRIDRIVS
g kg-1Sample
Respiration index (mg O2 ⋅⋅⋅⋅ kg SV-1 ⋅⋅⋅⋅ h-1)
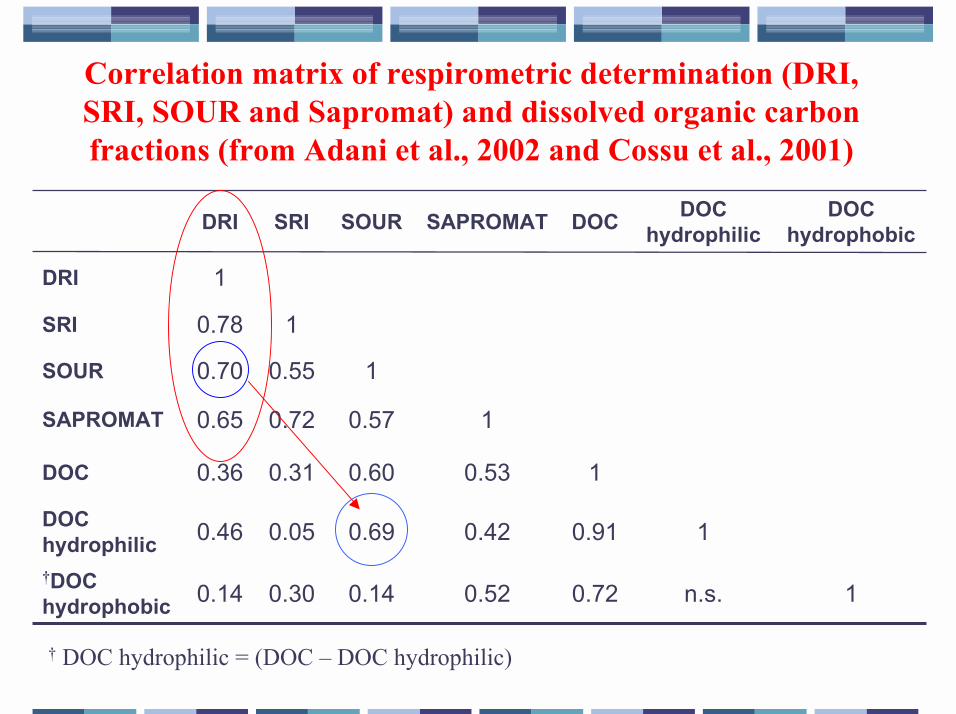
Correlation matrix of respirometric determination (DRI,SRI, SOUR and Sapromat) and dissolved organic carbonfractions (from Adani et al., 2002 and Cossu et al., 2001)
1n.s.0.720.520.140.300.14�DOChydrophobic
10.910.420.690.050.46DOChydrophilic
10.530.600.310.36DOC
10.570.720.65SAPROMAT
10.550.70SOUR
10.78SRI
1DRI
DOChydrophobic
DOChydrophilicDOCSAPROMATSOURSRIDRI
� DOC hydrophilic = (DOC � DOC hydrophilic)
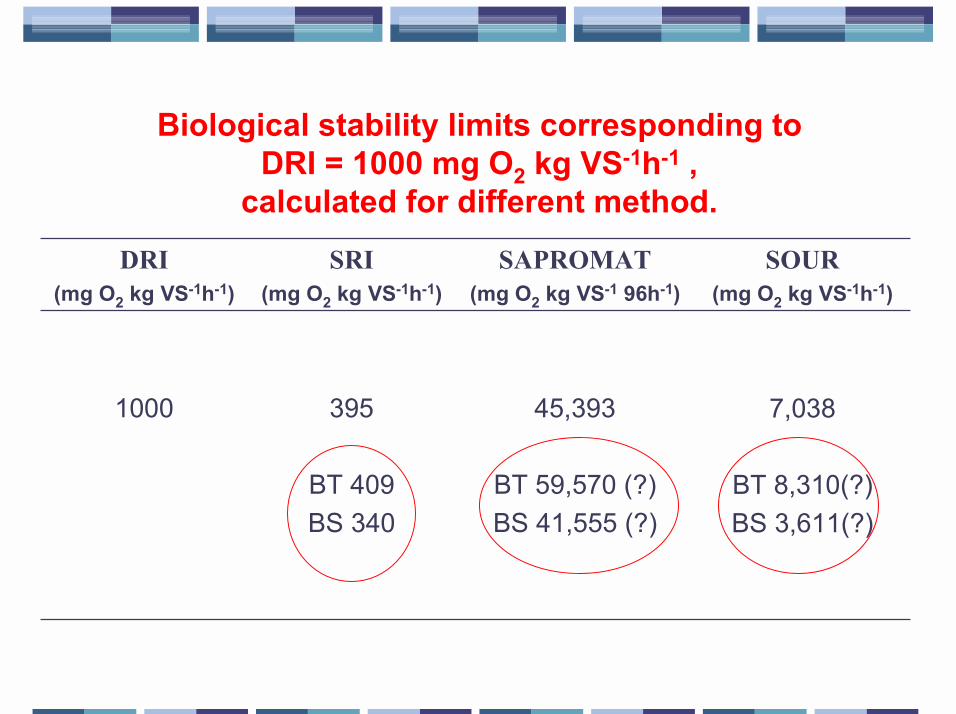
Biological stability limits corresponding toDRI = 1000 mg O2 kg VS-1h-1 ,
calculated for different method.
7,038
BT 8,310(?)BS 3,611(?)
45,393
BT 59,570 (?)BS 41,555 (?)
395
BT 409BS 340
1000
SOUR(mg O2 kg VS-1h-1)
SAPROMAT(mg O2 kg VS-1 96h-1)
SRI(mg O2 kg VS-1h-1)
DRI(mg O2 kg VS-1h-1)
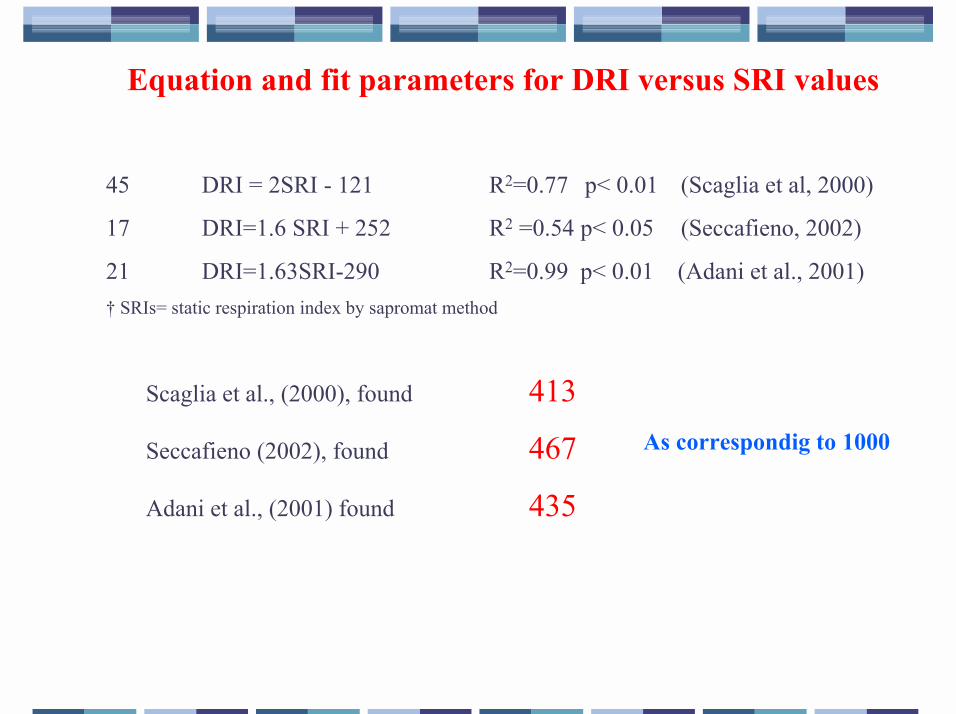
Equation and fit parameters for DRI versus SRI values
45 DRI = 2SRI - 121 R2=0.77 p< 0.01 (Scaglia et al, 2000)
17 DRI=1.6 SRI + 252 R2 =0.54 p< 0.05 (Seccafieno, 2002)
21 DRI=1.63SRI-290 R2=0.99 p< 0.01 (Adani et al., 2001)� SRIs= static respiration index by sapromat method
Scaglia et al., (2000), found 413
Seccafieno (2002), found 467
Adani et al., (2001) found 435
As correspondig to 1000
SRI =
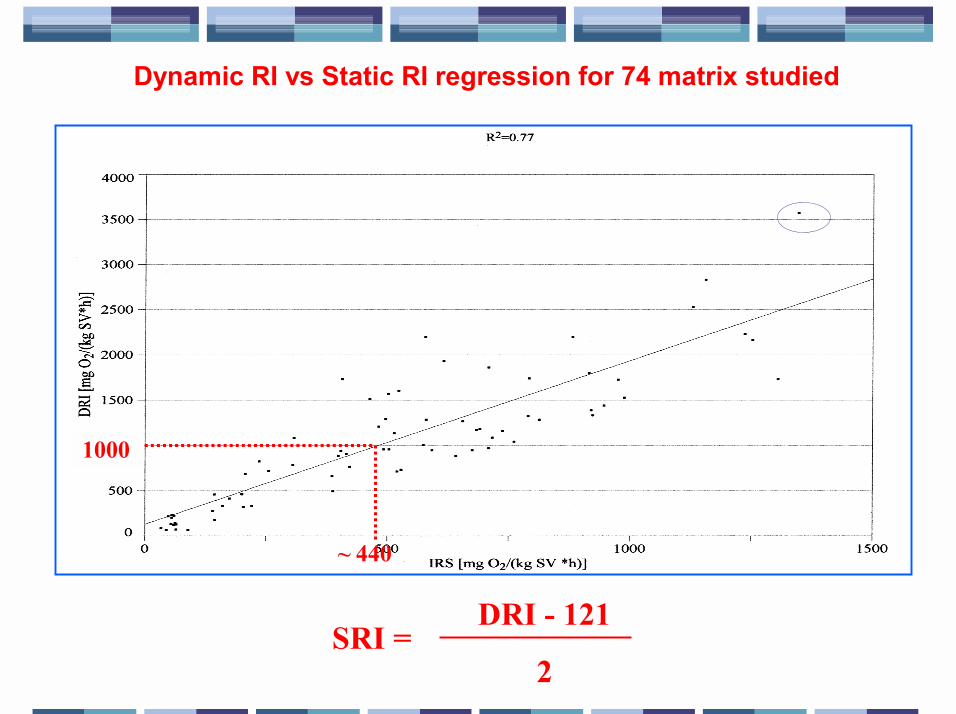
Dynamic RI vs Static RI regression for 74 matrix studied
1000
~ 440
DRI - 121
2
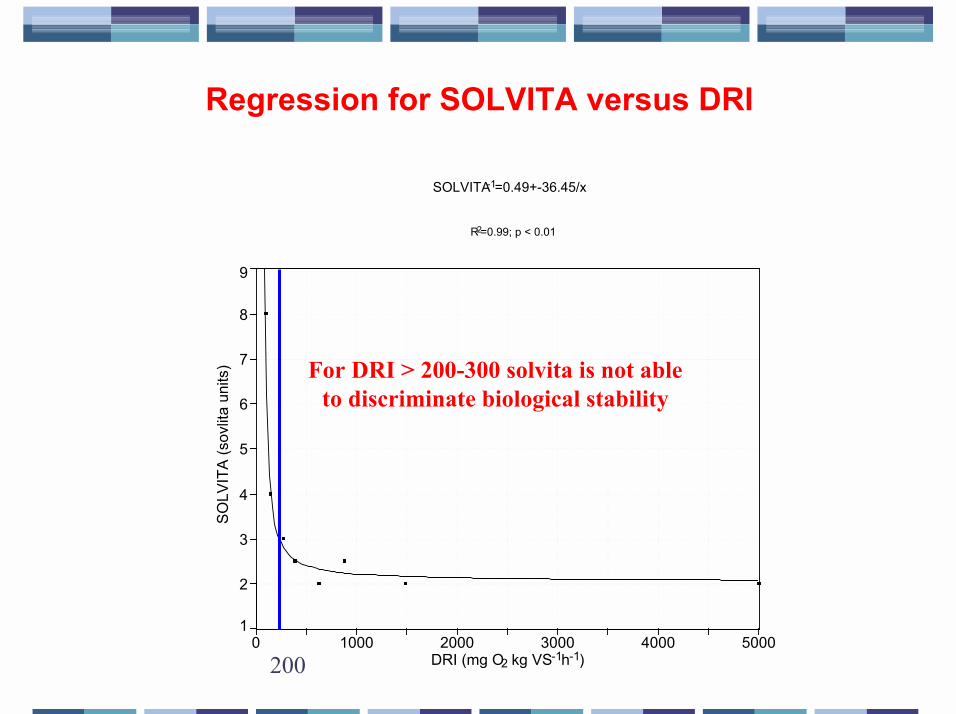
Regression for SOLVITA versus DRI
SOLVITA-1=0.49+-36.45/x
R2=0.99; p < 0.01
0 1000 2000 3000 4000 5000DRI (mg O2 kg VS-1h-1)
1
2
3
4
5
6
7
8
9
SOLV
ITA
(sov
lita
units
)
200
For DRI > 200-300 solvita is not ableto discriminate biological stability
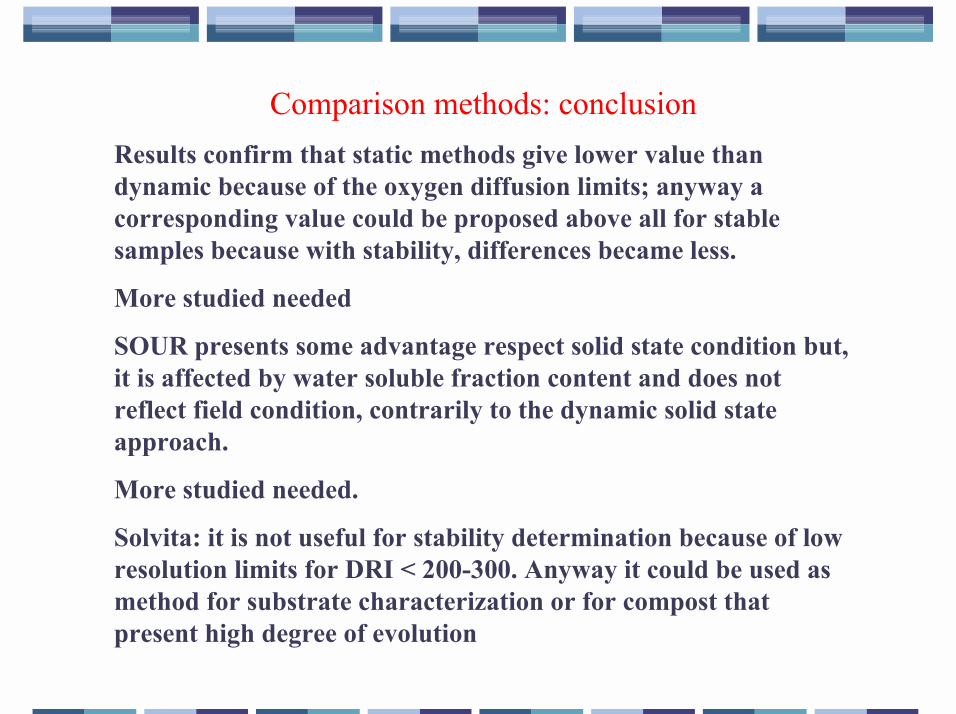
Comparison methods: conclusionResults confirm that static methods give lower value thandynamic because of the oxygen diffusion limits; anyway acorresponding value could be proposed above all for stablesamples because with stability, differences became less.
More studied needed
SOUR presents some advantage respect solid state condition but,it is affected by water soluble fraction content and does notreflect field condition, contrarily to the dynamic solid stateapproach.
More studied needed.
Solvita: it is not useful for stability determination because of lowresolution limits for DRI < 200-300. Anyway it could be used asmethod for substrate characterization or for compost thatpresent high degree of evolution
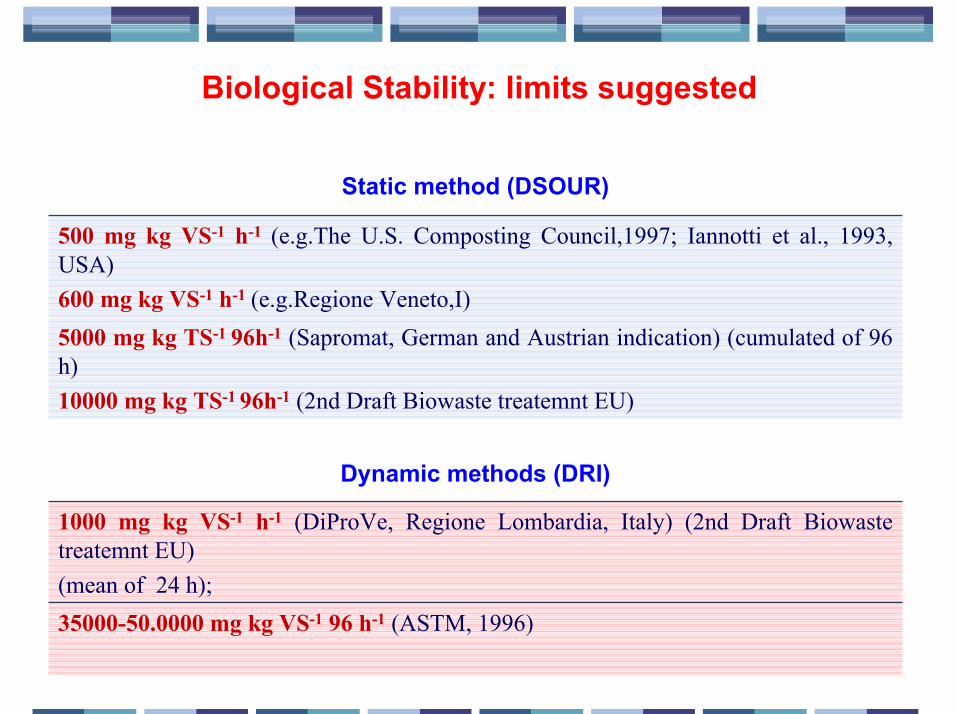
Biological Stability: limits suggested
5000 mg kg TS-1 96h-1 (Sapromat, German and Austrian indication) (cumulated of 96h)10000 mg kg TS-1 96h-1 (2nd Draft Biowaste treatemnt EU)
500 mg kg VS-1 h-1 (e.g.The U.S. Composting Council,1997; Iannotti et al., 1993,USA)600 mg kg VS-1 h-1 (e.g.Regione Veneto,I)
Static method (DSOUR)
35000-50.0000 mg kg VS-1 96 h-1 (ASTM, 1996)
1000 mg kg VS-1 h-1 (DiProVe, Regione Lombardia, Italy) (2nd Draft Biowastetreatemnt EU)(mean of 24 h);
Dynamic methods (DRI)
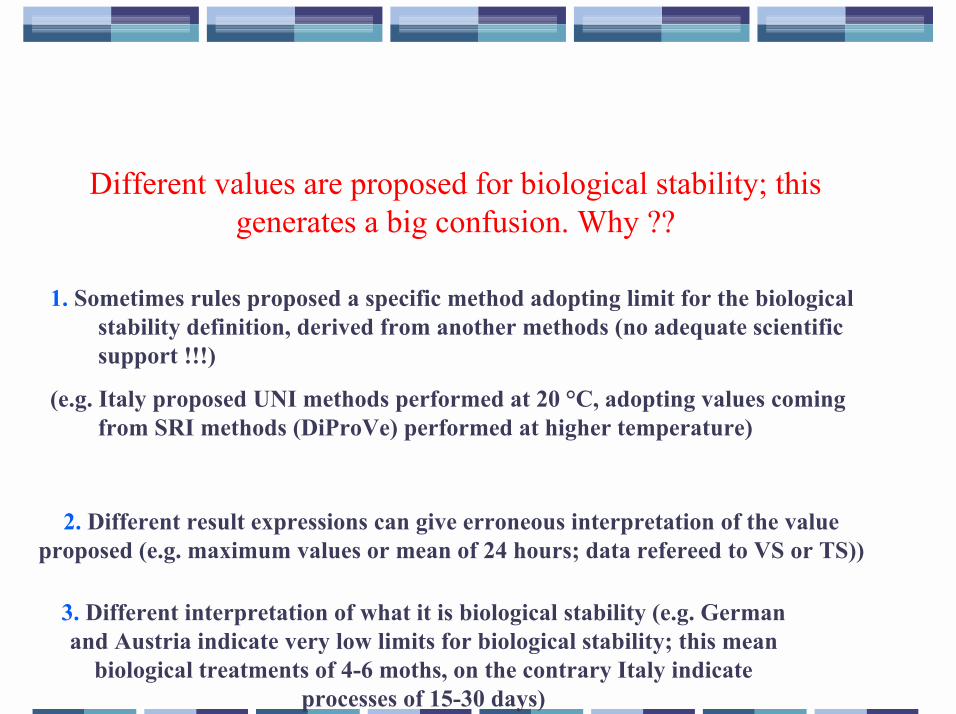
Different values are proposed for biological stability; thisgenerates a big confusion. Why ??
1. Sometimes rules proposed a specific method adopting limit for the biologicalstability definition, derived from another methods (no adequate scientificsupport !!!)
(e.g. Italy proposed UNI methods performed at 20 °C, adopting values comingfrom SRI methods (DiProVe) performed at higher temperature)
2. Different result expressions can give erroneous interpretation of the valueproposed (e.g. maximum values or mean of 24 hours; data refereed to VS or TS))
3. Different interpretation of what it is biological stability (e.g. Germanand Austria indicate very low limits for biological stability; this mean
biological treatments of 4-6 moths, on the contrary Italy indicateprocesses of 15-30 days)
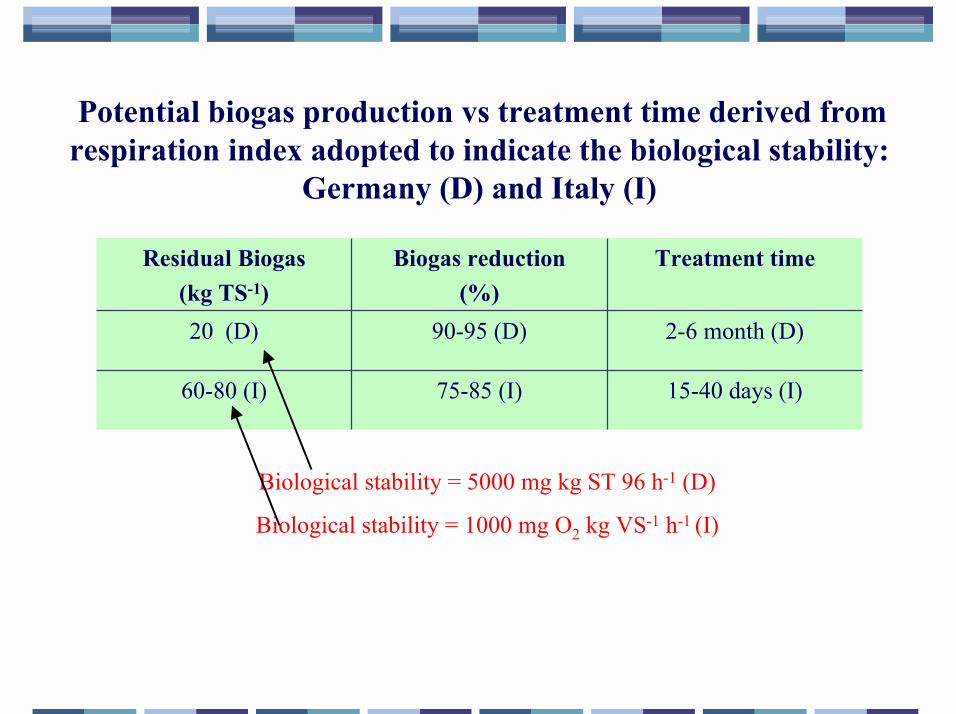
Potential biogas production vs treatment time derived fromrespiration index adopted to indicate the biological stability:
Germany (D) and Italy (I)
15-40 days (I)75-85 (I)60-80 (I)
2-6 month (D)90-95 (D)20 (D)
Treatment timeBiogas reduction(%)
Residual Biogas(kg TS-1)
Biological stability = 5000 mg kg ST 96 h-1 (D)
Biological stability = 1000 mg O2 kg VS-1 h-1 (I)
DRI Research
Microbial growth during analysis
Reproducibility of the method
Result expression
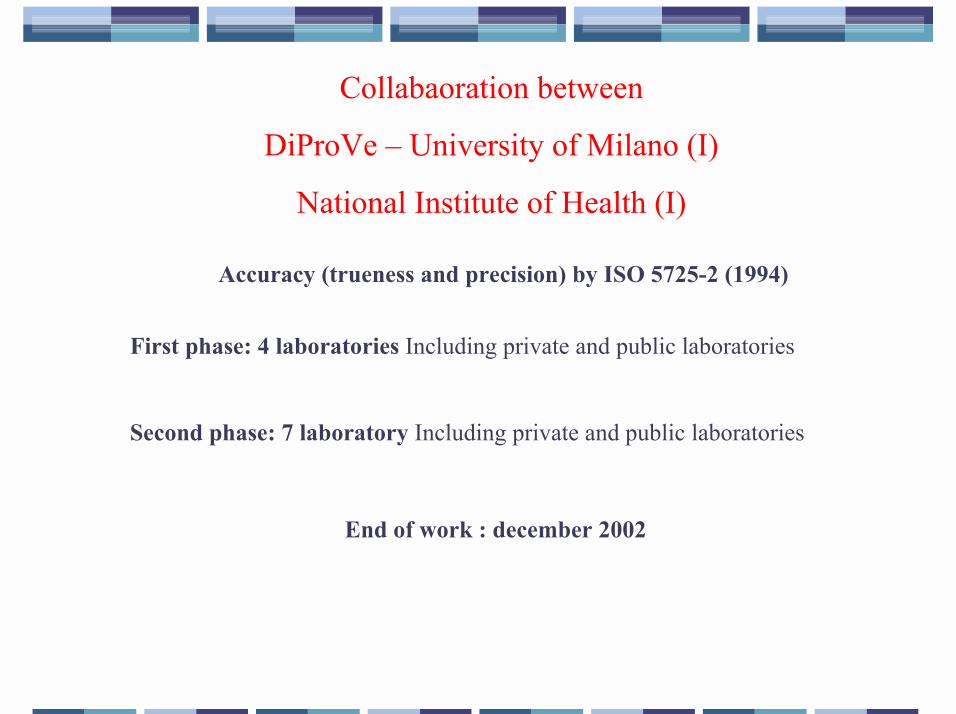
Collabaoration between
DiProVe � University of Milano (I)
National Institute of Health (I)
Accuracy (trueness and precision) by ISO 5725-2 (1994)
First phase: 4 laboratories Including private and public laboratories
Second phase: 7 laboratory Including private and public laboratories
End of work : december 2002

Result obtained for DRI determination operated by twolaboratories (A and B, from Seccafieno, 2001; other
samples from Adani and Genevini, 2001)
2407Lab 2
823Lab 2
3262Lab 2
2693Lab 2
2517Lab 2
2373Lab 2
Lab 1
Lab 1
Lab 1
Lab 1
Lab 1
Lab 1
4.195.462339.52272
ST-1
7.7167.18870.5918
BT-f-3
0.154.9532583255
BT-i-3
4.4411626112529
BT-i-1
4.110024462375
B
1.74024012430
A
VariationcoefficientSTDMean
DRI(mg O2 kg VS-1 h-1)
Sample
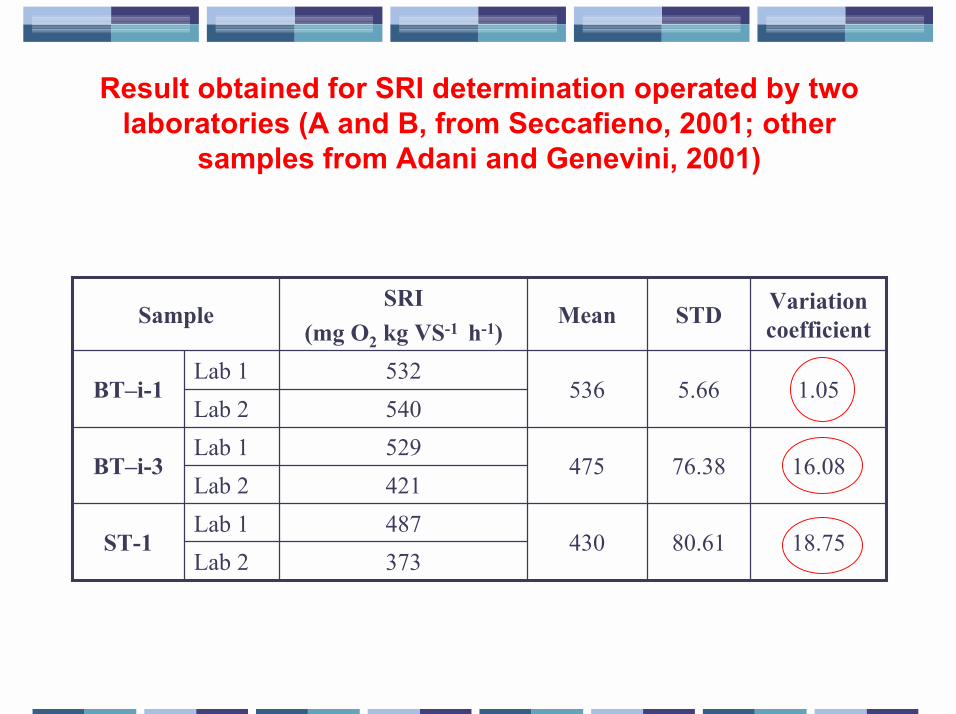
Result obtained for SRI determination operated by twolaboratories (A and B, from Seccafieno, 2001; other
samples from Adani and Genevini, 2001)
373Lab 2
421Lab 2
540Lab 2
Lab 1
Lab 1
Lab 1
18.7580.61430487
ST-1
16.0876.38475529
BT�i-3
1.055.66536532
BT�i-1
VariationcoefficientSTDMean
SRI(mg O2 kg VS-1 h-1)
Sample
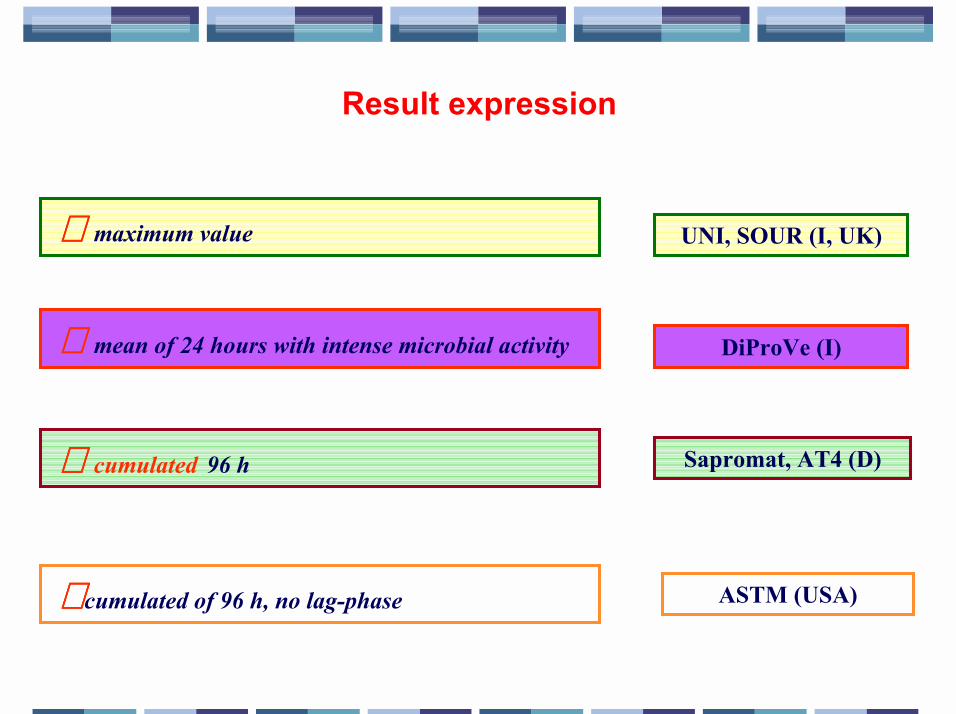
Result expression
⊇⊇⊇⊇ cumulated of 96 h, no lag-phase
⊇⊇⊇⊇ maximum value
⊇⊇⊇⊇ mean of 24 hours with intense microbial activity
⊇⊇⊇⊇ cumulated 96 h
UNI, SOUR (I, UK)
DiProVe (I)
Sapromat, AT4 (D)
ASTM (USA)
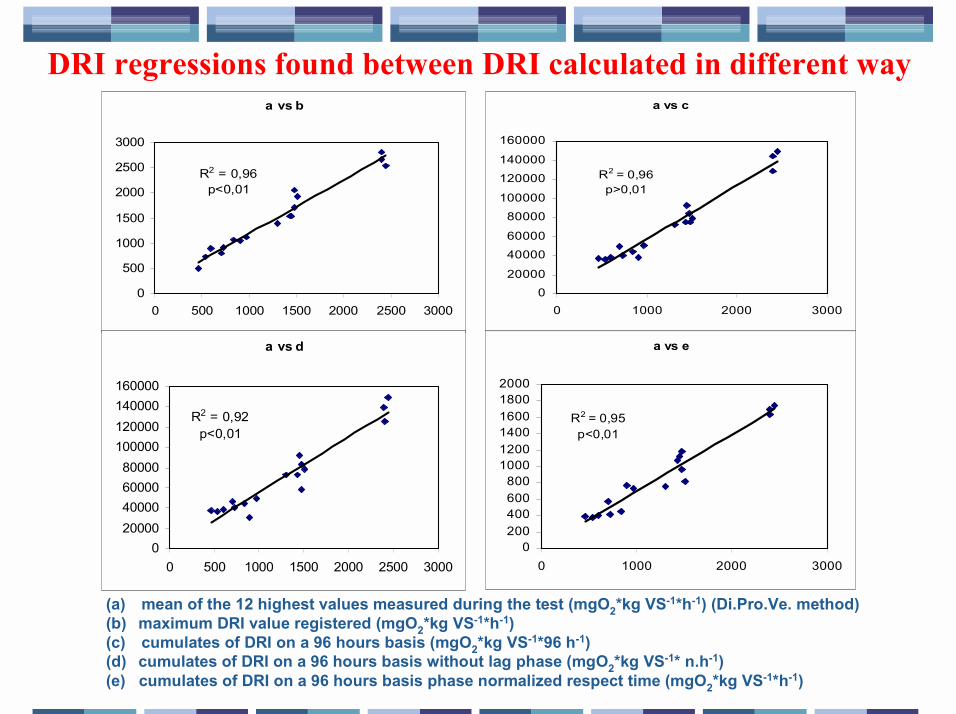
DRI regressions found between DRI calculated in different way
(a) mean of the 12 highest values measured during the test (mgO2*kg VS-1*h-1) (Di.Pro.Ve. method)(b) maximum DRI value registered (mgO2*kg VS-1*h-1)(c) cumulates of DRI on a 96 hours basis (mgO2*kg VS-1*96 h-1)(d) cumulates of DRI on a 96 hours basis without lag phase (mgO2*kg VS-1* n.h-1)(e) cumulates of DRI on a 96 hours basis phase normalized respect time (mgO2*kg VS-1*h-1)
a vs b
R2 = 0,96p<0,01
0
500
1000
1500
2000
2500
3000
0 500 1000 1500 2000 2500 3000
a vs c
R2 = 0,96p>0,01
020000
4000060000
80000100000
120000140000
160000
0 1000 2000 3000
a vs d
R2 = 0,92p<0,01
020000400006000080000
100000120000140000160000
0 500 1000 1500 2000 2500 3000
a vs e
R2 = 0,95p<0,01
0200400600800
100012001400160018002000
0 1000 2000 3000
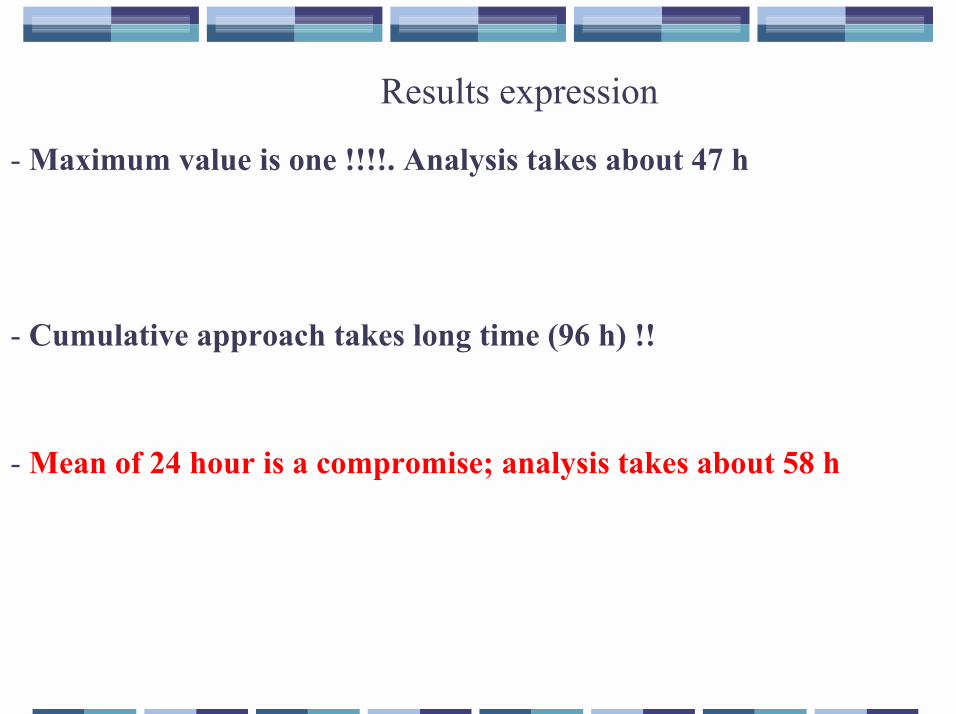
Results expression
- Maximum value is one !!!!. Analysis takes about 47 h
- Cumulative approach takes long time (96 h) !!
- Mean of 24 hour is a compromise; analysis takes about 58 h
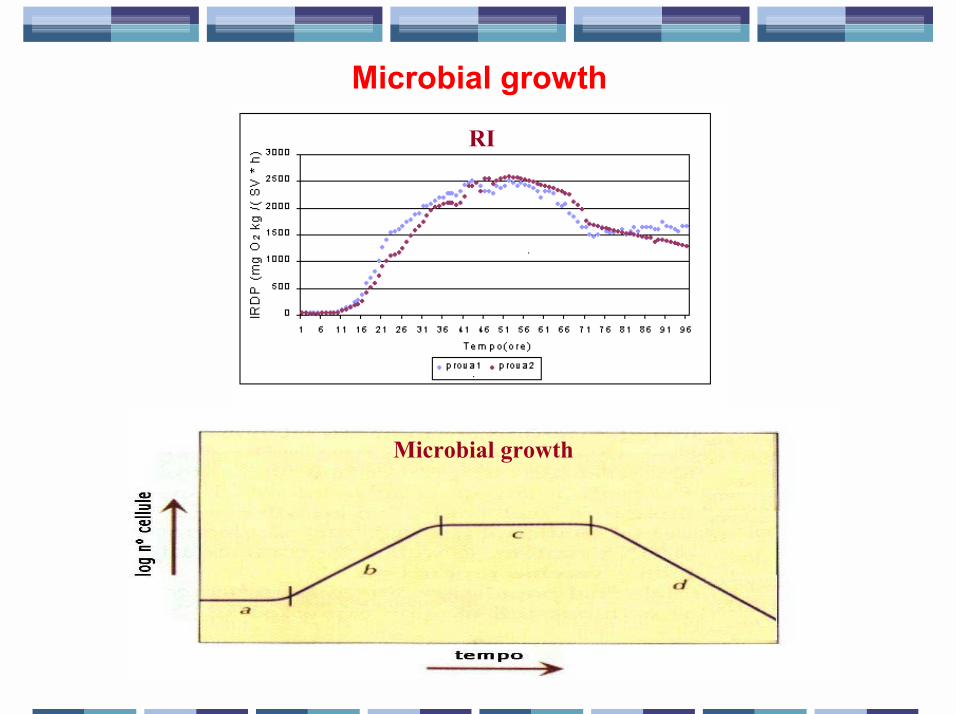
Microbial growth
Microbial growth
RI
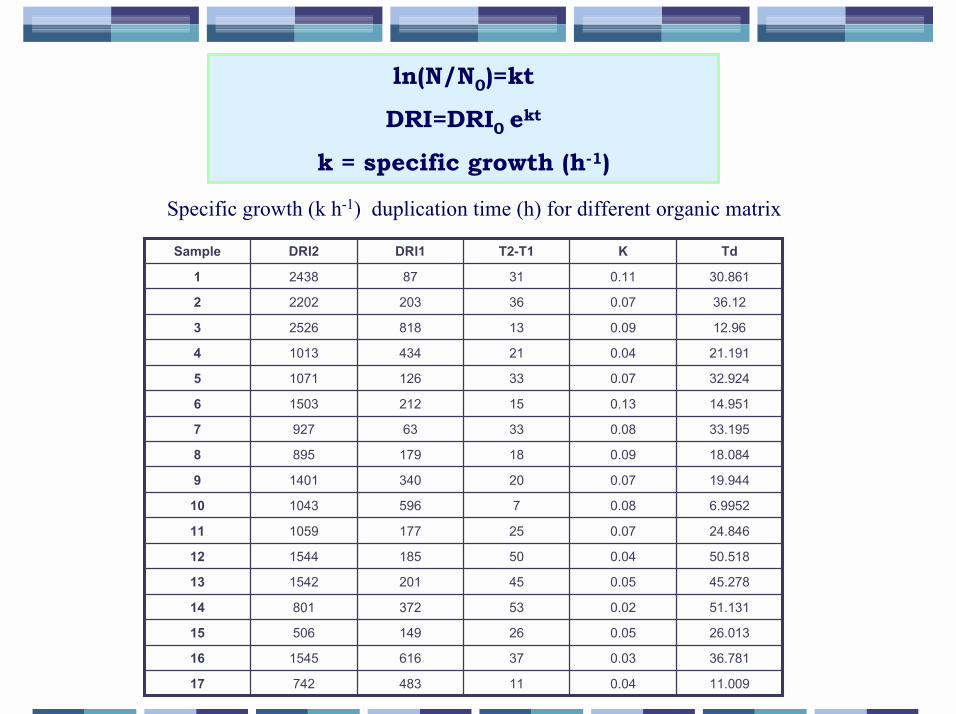
Specific growth (k h-1) duplication time (h) for different organic matrix
ln(N/N0)=kt
DRI=DRI0 ekt
k = specific growth (h-1)
11.0090.041148374217
36.7810.0337616154516
26.0130.052614950615
51.1310.025337280114
45.2780.0545201154213
50.5180.0450185154412
24.8460.0725177105911
6.99520.087596104310
19.9440.072034014019
18.0840.09181798958
33.1950.0833639277
14.9510.131521215036
32.9240.073312610715
21.1910.042143410134
12.960.091381825263
36.120.073620322022
30.8610.11318724381
TdKT2-T1DRI1DRI2Sample
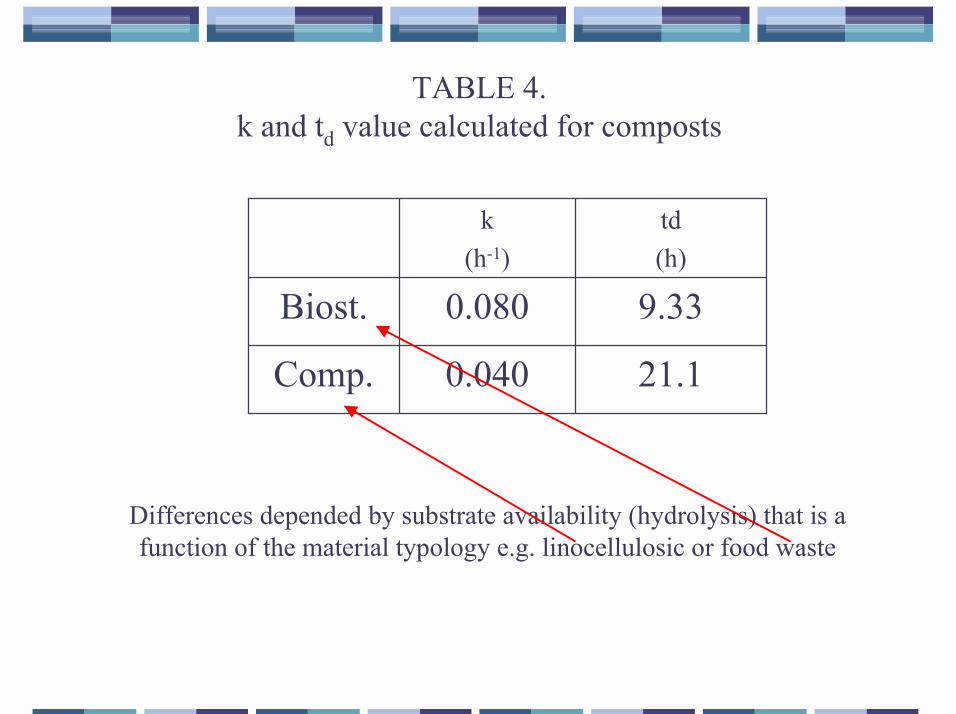
TABLE 4.k and td value calculated for composts
Differences depended by substrate availability (hydrolysis) that is afunction of the material typology e.g. linocellulosic or food waste
21.10.040Comp.
9.330.080Biost.
td(h)
k(h-1)
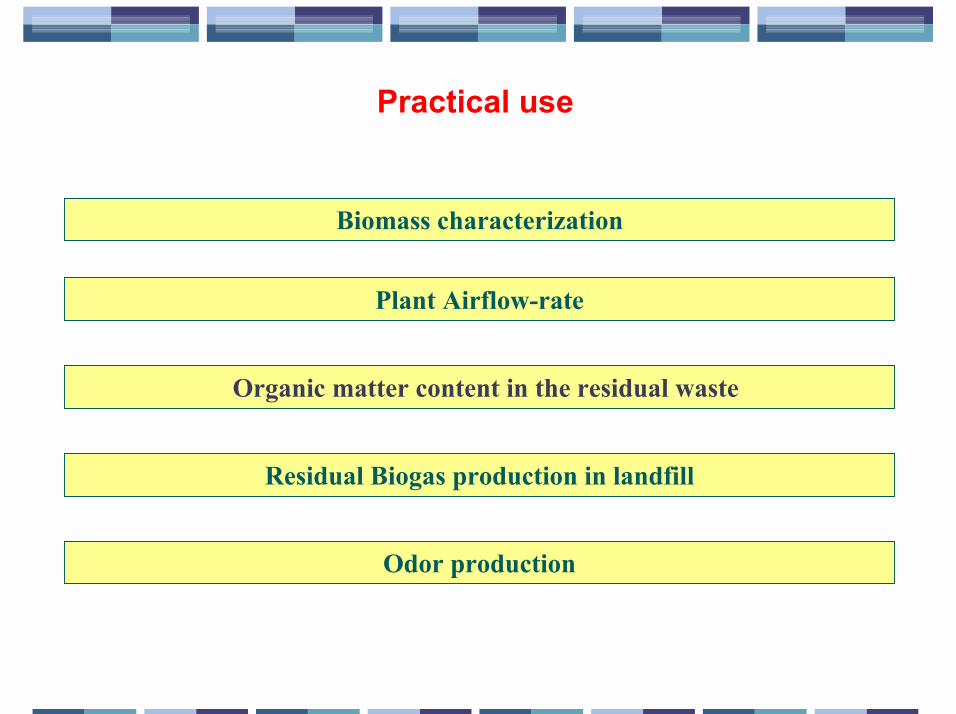
Practical use
Biomass characterization
Plant Airflow-rate
Organic matter content in the residual waste
Residual Biogas production in landfill
Odor production
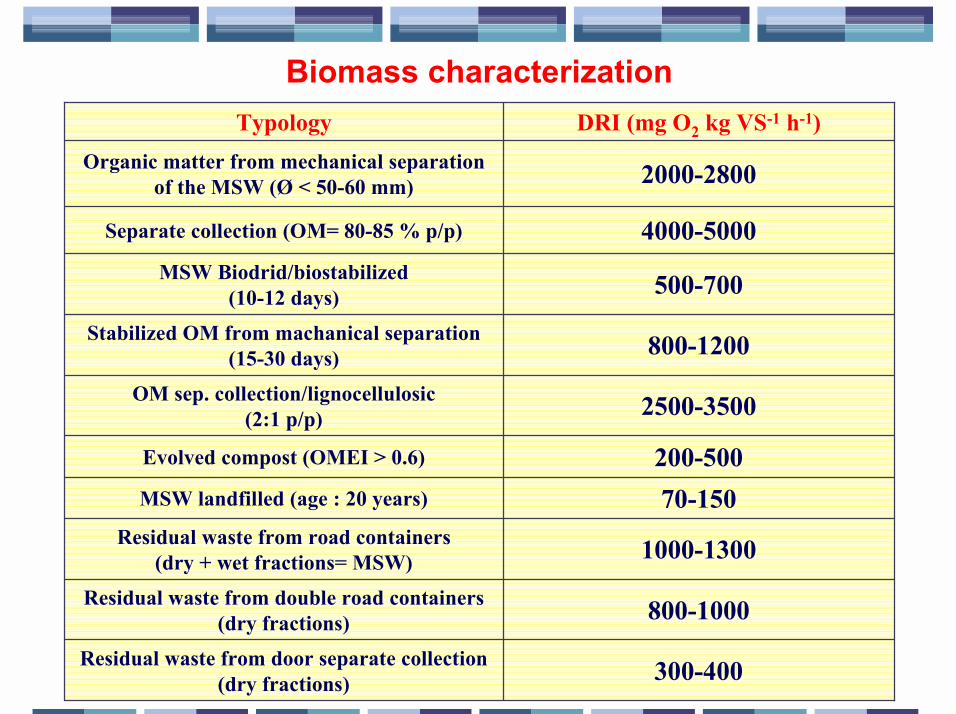
Biomass characterization
300-400Residual waste from door separate collection(dry fractions)
800-1000Residual waste from double road containers(dry fractions)
1000-1300Residual waste from road containers(dry + wet fractions= MSW)
70-150MSW landfilled (age : 20 years)
200-500Evolved compost (OMEI > 0.6)
2500-3500OM sep. collection/lignocellulosic(2:1 p/p)
800-1200Stabilized OM from machanical separation(15-30 days)
500-700MSW Biodrid/biostabilized(10-12 days)
4000-5000Separate collection (OM= 80-85 % p/p)
2000-2800Organic matter from mechanical separationof the MSW (Ø < 50-60 mm)
DRI (mg O2 kg VS-1 h-1)Typology
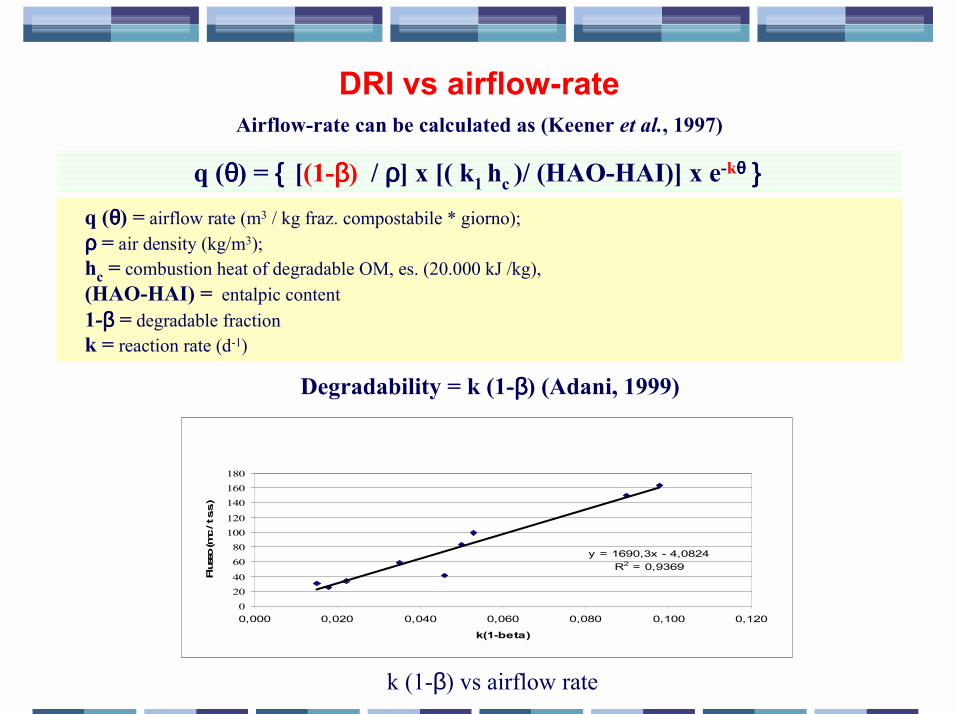
DRI vs airflow-rateAirflow-rate can be calculated as (Keener et al., 1997)
q (θθθθ) = {{{{ [(1-ββββ) / ρρρρ] x [( k1 hc )/ (HAO-HAI)] x e-kθθθθ }}}}q (θθθθ) = airflow rate (m3 / kg fraz. compostabile * giorno);ρρρρ = air density (kg/m3);hc = combustion heat of degradable OM, es. (20.000 kJ /kg),(HAO-HAI) = entalpic content1-ββββ = degradable fractionk = reaction rate (d-1)
Degradability = k (1-ββββ) (Adani, 1999)
y = 1690,3x - 4,0824R2 = 0,9369
02040
6080
100120
140160180
0,000 0,020 0,040 0,060 0,080 0,100 0,120
k(1-beta)
Flus
so (m
c / t
s.s.)
k (1-β) vs airflow rate
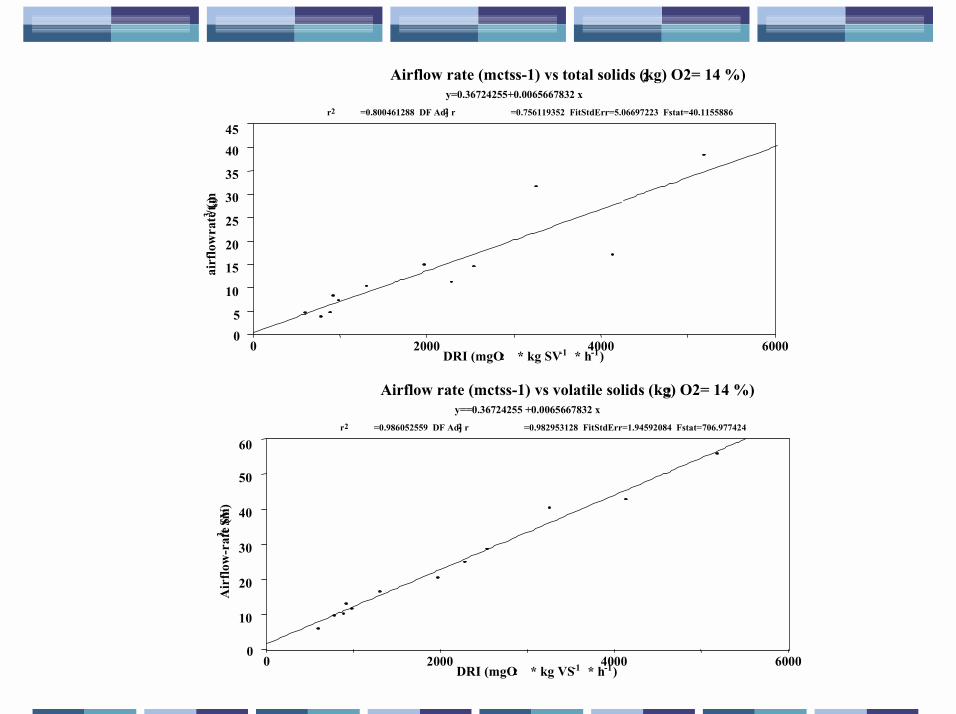
Airflow rate (mctss-1) vs total solids (kg) O2= 14 %)2y=0.36724255+0.0065667832 x
r2 =0.800461288 DF Adj r2 =0.756119352 FitStdErr=5.06697223 Fstat=40.1155886
0 2000 4000 6000DRI (mgO2 * kg SV-1 * h-1)
05
10
15
20
25
30
35
4045
airf
low
rate
(m3 /t ss)
Airflow rate (mctss-1) vs volatile solids (kg) O2= 14 %)2 y==0.36724255 +0.0065667832 x
r2 =0.986052559 DF Adj r2 =0.982953128 FitStdErr=1.94592084 Fstat=706.977424
0 2000 4000 6000DRI (mgO2 * kg VS-1 * h-1)
0
10
20
30
40
50
60
Air
flow
-rat
e (m
3 /t SV
)

OM in residual waste vs DRI(Collaboration with Environmental National Agency)
DRI vs Organic fraction
R2 = 0.92, p< 0.01
0 2000 4000 6000DRI (mg O 2 kg VS -1 h -1)
0
10
20
30
40
50
60
70
80
90
Org
anic
frac
tion
(%)
1000
20
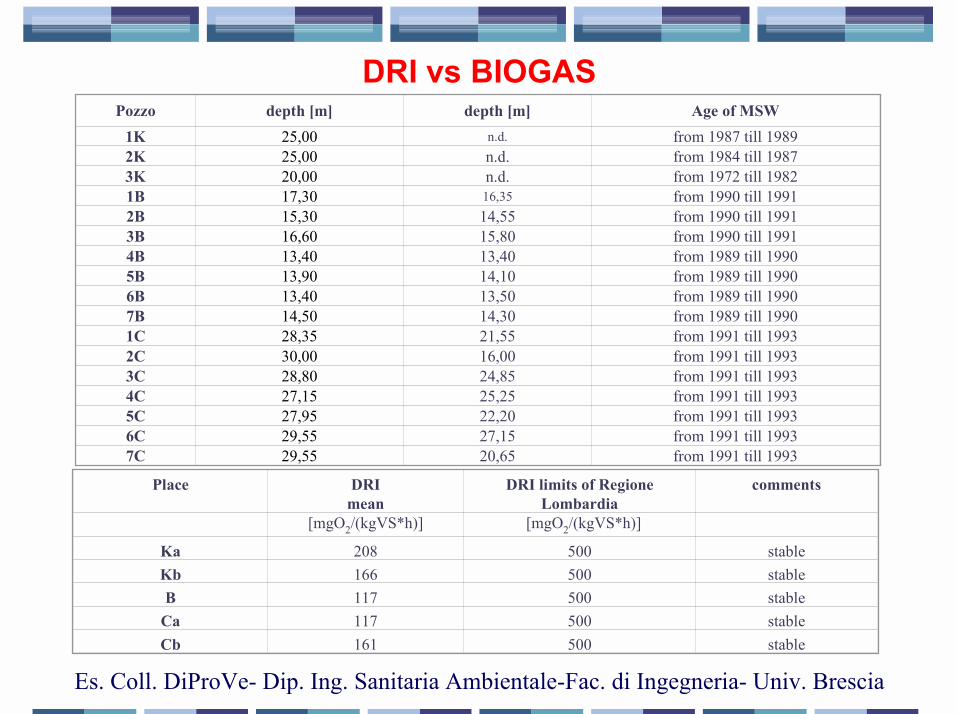
Pozzo depth [m] depth [m] Age of MSW1K 25,00 n.d. from 1987 till 19892K 25,00 n.d. from 1984 till 19873K 20,00 n.d. from 1972 till 19821B 17,30 16,35 from 1990 till 19912B 15,30 14,55 from 1990 till 19913B 16,60 15,80 from 1990 till 19914B 13,40 13,40 from 1989 till 19905B 13,90 14,10 from 1989 till 19906B 13,40 13,50 from 1989 till 19907B 14,50 14,30 from 1989 till 19901C 28,35 21,55 from 1991 till 19932C 30,00 16,00 from 1991 till 19933C 28,80 24,85 from 1991 till 19934C 27,15 25,25 from 1991 till 19935C 27,95 22,20 from 1991 till 19936C 29,55 27,15 from 1991 till 19937C 29,55 20,65 from 1991 till 1993
DRI vs BIOGAS
Es. Coll. DiProVe- Dip. Ing. Sanitaria Ambientale-Fac. di Ingegneria- Univ. Brescia
Place DRImean
[mgO2/(kgVS*h)]
DRI limits of RegioneLombardia
[mgO2/(kgVS*h)]
comments
Ka 208 500 stableKb 166 500 stableB 117 500 stable
Ca 117 500 stableCb 161 500 stable
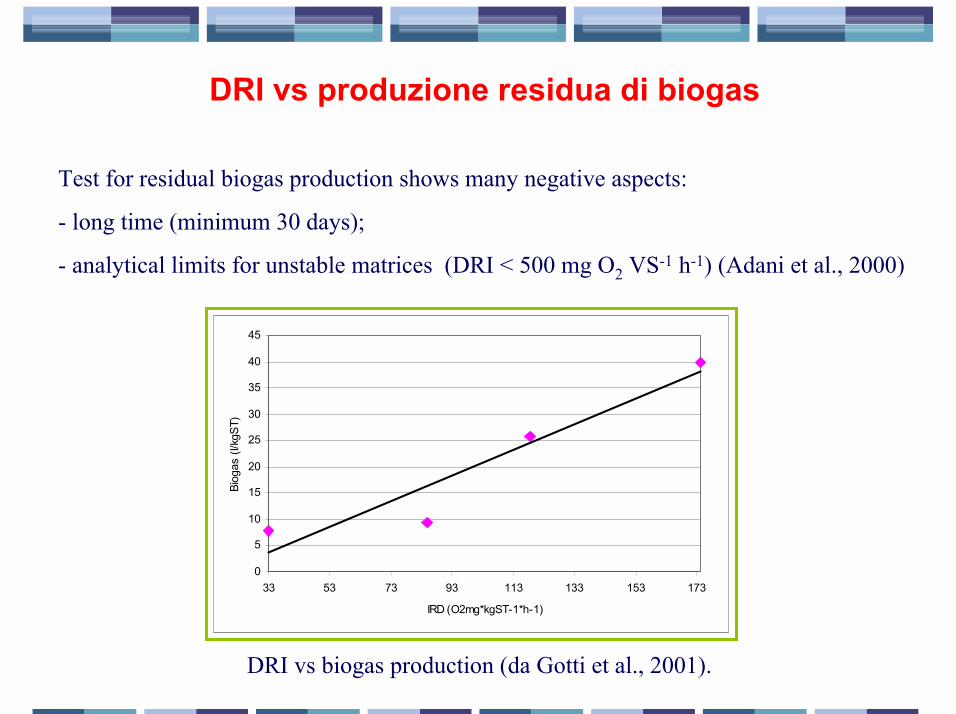
DRI vs produzione residua di biogas
Test for residual biogas production shows many negative aspects:
- long time (minimum 30 days);
- analytical limits for unstable matrices (DRI < 500 mg O2 VS-1 h-1) (Adani et al., 2000)
0
5
10
15
20
25
30
35
40
45
33 53 73 93 113 133 153 173
IRD (O2mg*kgST-1*h-1)
Biog
as (l
/kgS
T)
DRI vs biogas production (da Gotti et al., 2001).
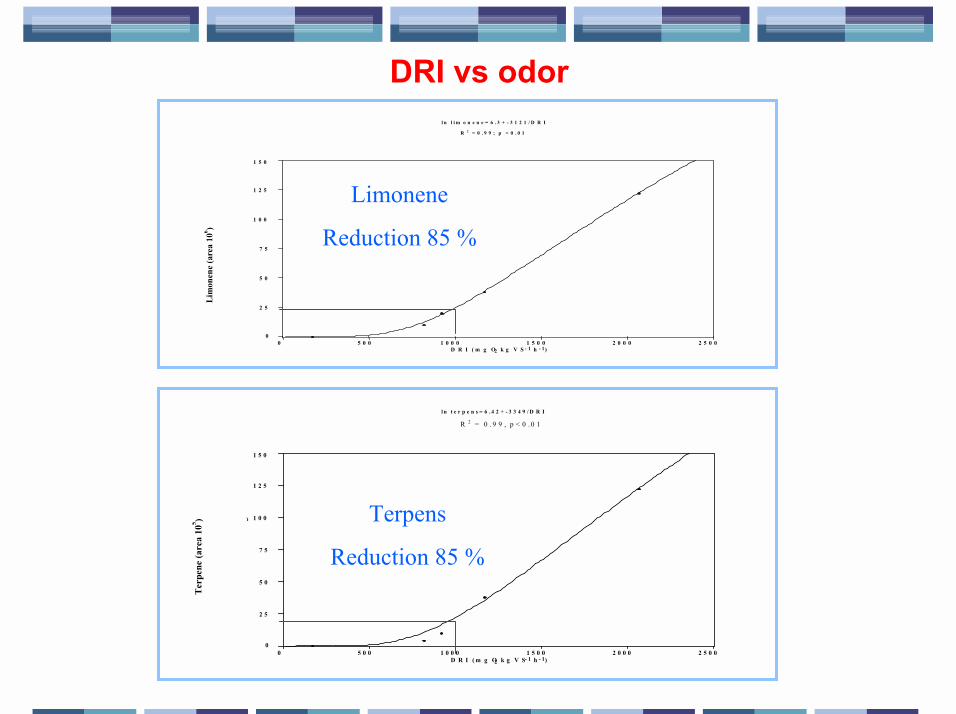
DRI vs odor
l n l i m o n e n e = 6 . 3 + - 3 1 2 1 / D R I R 2 = 0 . 9 9 ; p < 0 . 0 1
0 5 0 0 1 0 0 0 1 5 0 0 2 0 0 0 2 5 0 0 D R I ( m g O 2 k g V S - 1 h - 1 )
0
2 5
5 0
7 5
1 0 0
1 2 5
1 5 0
Li
mon
ene
(are
a 10
6 )
l n t e r p e n s = 6 . 4 2 + - 3 3 4 9 / D R I
R 2 = 0 . 9 9 , p < 0 . 0 1
0 5 0 0 1 0 0 0 1 5 0 0 2 0 0 0 2 5 0 0 D R I ( m g O2 k g V S- 1 h - 1 )
0
2 5
5 0
7 5
1 0 0
1 2 5
1 5 0
)
Ter
pene
(are
a 10
5 ) Limonene
Reduction 85 %
Terpens
Reduction 85 %
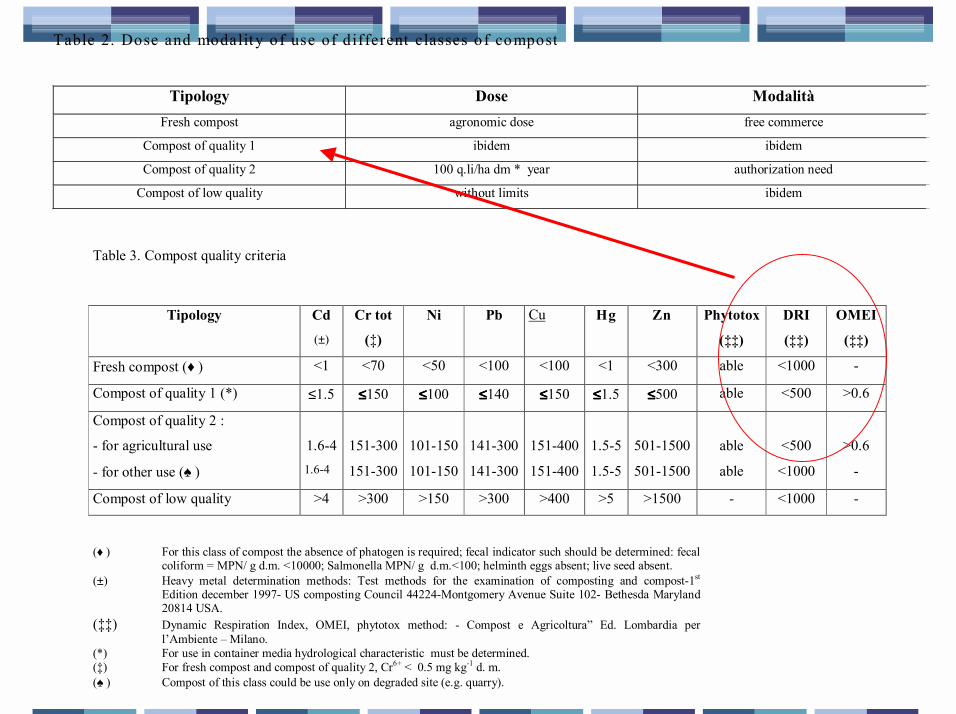
Table 2. Dose and modalit y o f use of different classes o f compost
Tipology Dose Modalità Fresh compost agronomic dose free commerce
Compost of quality 1 ibidem ibidem
Compost of quality 2 100 q.li/ha dm * year authorization need
Compost of low quality without limits ibidem
Table 3. Compost quality criteria
Tipology Cd(±)
Cr tot
(�)
Ni Pb Cu Hg Zn Phytotox
(��)
DRI
(��)
OMEI
(��)
Fresh compost (♦ ) <1 <70 <50 <100 <100 <1 <300 able <1000 -
Compost of quality 1 (*) ≤1.5 ≤≤≤≤150 ≤≤≤≤100 ≤≤≤≤140 ≤≤≤≤150 ≤≤≤≤1.5 ≤≤≤≤500 able <500 >0.6
Compost of quality 2 :
- for agricultural use
- for other use (♠ )
1.6-41.6-4
151-300
151-300
101-150
101-150
141-300
141-300
151-400
151-400
1.5-5
1.5-5
501-1500
501-1500
able
able
<500
<1000
>0.6
-
Compost of low quality >4 >300 >150 >300 >400 >5 >1500 - <1000 -
(♦ ) For this class of compost the absence of phatogen is required; fecal indicator such should be determined: fecalcoliform = MPN/ g d.m. <10000; Salmonella MPN/ g d.m.<100; helminth eggs absent; live seed absent.
(±) Heavy metal determination methods: Test methods for the examination of composting and compost-1st
Edition december 1997- US composting Council 44224-Montgomery Avenue Suite 102- Bethesda Maryland20814 USA.
(��) Dynamic Respiration Index, OMEI, phytotox method: - Compost e Agricoltura� Ed. Lombardia perl�Ambiente � Milano.
(*) For use in container media hydrological characteristic must be determined.(�) For fresh compost and compost of quality 2, Cr6+ < 0.5 mg kg-1 d. m.(♠ ) Compost of this class could be use only on degraded site (e.g. quarry).