Embed Size (px)
Citation preview
Status of Hokkaido Tourism
Bureau of Tourism, Depart of Economic Affairs
October 14, 2014
Change in the number of inbound tourists
(actual number) Tourists from Hokkaido and
elsewhere in Japan (10,000 people) Foreign tourists (10,000 people)
Tourists from elsewhere
in Japan
Foreign tourists
1997 1998 1999 2000 2001 2002 2003 2004 2005 2006 2007 2008 2009 2010 2011 2012 2013
(FY)
Note: A new survey method was adopted in FY 2010.
Survey on the Number of Inbound Tourists in Hokkaido Tourism
Tourists from elsewhere
in Japan
Foreign tourists
Tourists from
Hokkaido
Tourists from
Hokkaido
Status and Challenges of Hokkaido Tourism
1. Change in the number of inbound tourists
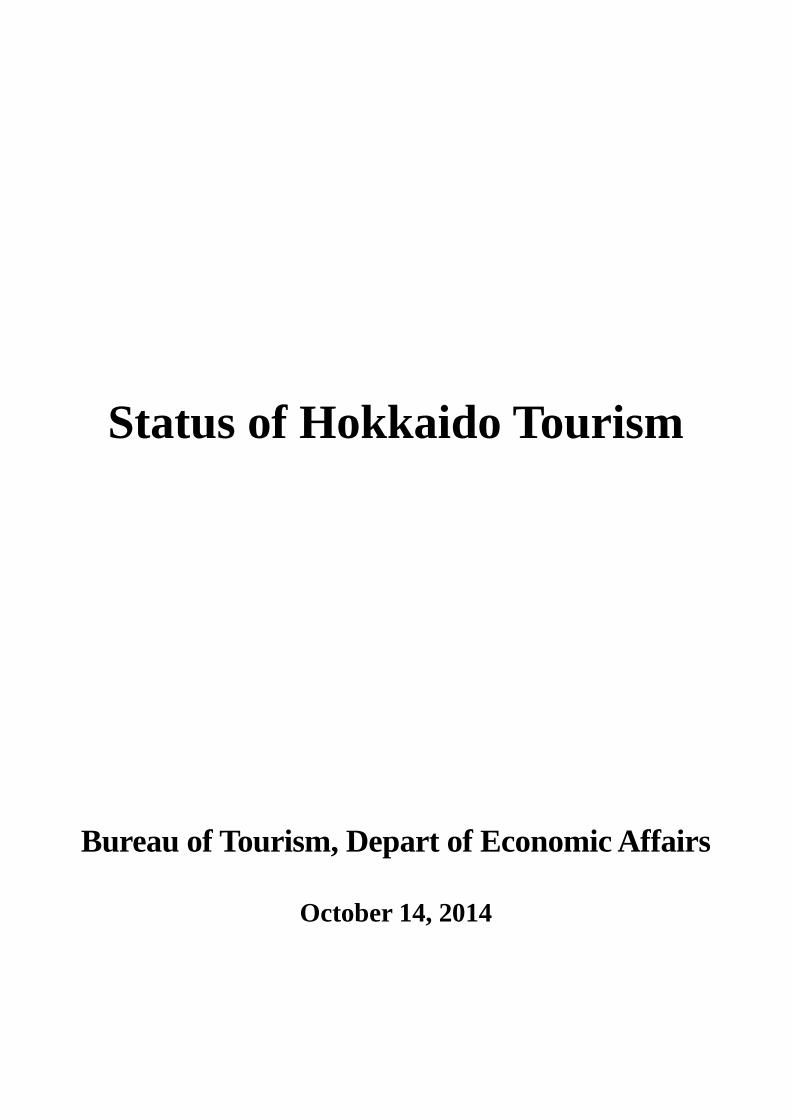
Record high numbers of inbound tourists and foreign tourists to Hokkaido
The number of inbound tourists (actual numbers) decreased in FY 2011 due primarily to the 2011 Great East Japan
Earthquake and Tsunami; however, demand for tourism was back on the track to recovery in FY 2012 and demand
for tourism, both from Japan and overseas, continued to recover in FY 2013 due to gradual economic recovery,
attracting 53.1 million tourists (up 4.2% from the previous year). The number is a record high, surpassing 51.49
million tourists in FY 2009 (though calculation methods differed between FY 2009 and FY 2013).
Although the number of foreign tourists to Hokkaido has been on the rise, the number decreased in FY 2011.
However, the number of foreign tourists to Hokkaido has been recovering due primarily to the start of new
international regular flight services and the depreciation of the yen in FY 2012, as well as easier procedures to obtain
visas for tourists from South Asian countries and an increase in international regular flights in FY 2013. In that fiscal
year, the number of foreign tourists to Hokkaido reached 1,153,100 (up 45.9% from the previous year), a record high,
which means that the number surpassed 1 million for the first time in a fiscal year and accounted for approximately
10% of the total foreign tourists to Japan (10.98 million).
Number of foreign tourists to Hokkaido (by country/region)
Taiwan
China
South Korea
Hong Kong
Thailand
Singapore
Australia
Others
FY 2009
Taiwan
China
Taiwan
Hong Kong
Singapore
Others
(unit: people)
Note: A new survey method was adopted in FY 2010. Survey on the Number of Inbound Tourists in Hokkaido
Tourism
FY 2010
FY 2011
FY 2012
China
China
China
China
S. Korea
S. Korea
Hong Kong
Hong
Kong
Hong Kong
Hong Kong
Taiwan
Taiwan
Taiwan
Taiwan
S. Korea
S. Korea
S. Korea
Singapore
Singapore
Singapore
Singapore
Australia
Australia
Australia
Australia
Australia
Others
Others
Others
Others
Thailand
Thailand
Thailand
Thailand
Thailand
Number of tourists to Hokkaido by season, etc. (total number)
10,000 people (total)
10,000 people
(staying; foreigners)
Total
Foreigners
June to Sept.
67.1 mil.
Dec. to Mar.
1.66 mil. (staying)
June to Sept.
1.18 mil. (staying)
Dec. to Mar.
27.92 mil.
Apr. May June July Aug. Sept. Oct. Nov. Dec. Jan. Feb. Mar.
Survey on the Number of Inbound Tourists in Hokkaido Tourism (FY 2013)
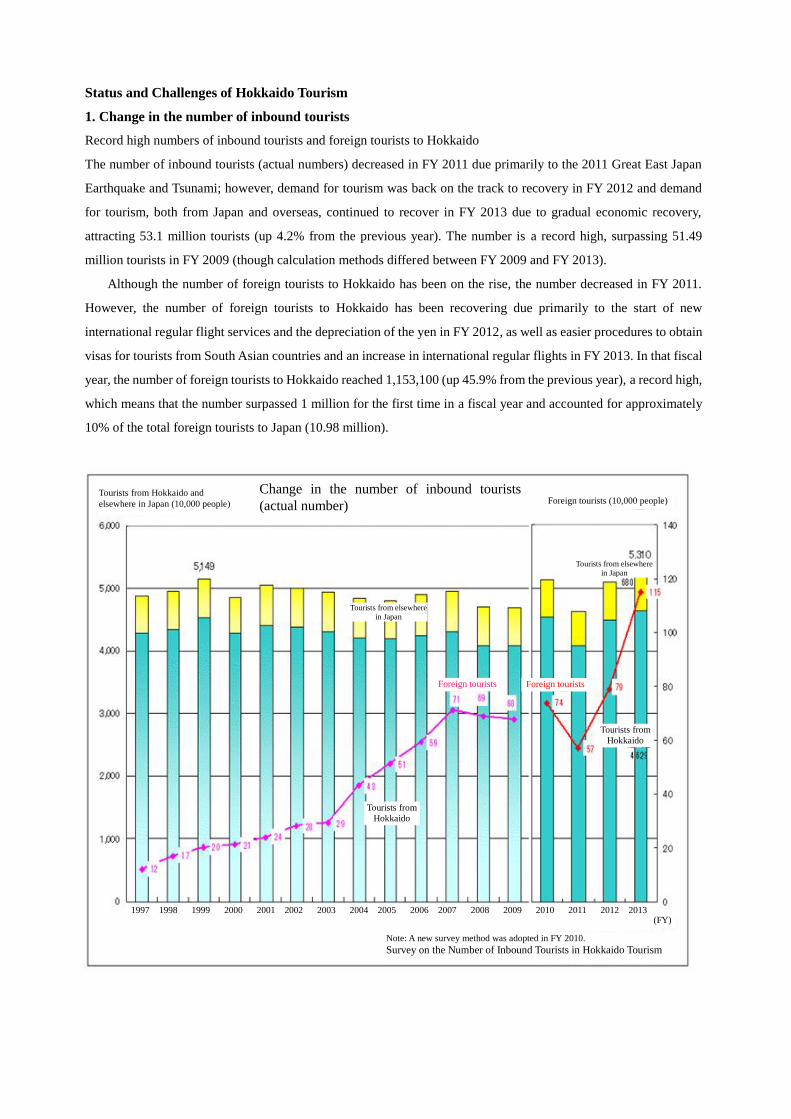
Strongly emerging Asian region
The number of foreign tourists to Hokkaido by country/region indicates that tourists from Taiwan are the largest,
followed by those form China, South Korea, Hong Kong and Thailand in this order. Tourists from Taiwan reached a
record high in FY 2013 due to better access to local airports through international regular and chartered flights and
tourists from Thailand increased 167% from the previous year due to easier procedures for visa requirements and the
increase of direct flights to Hokkaido
Concentration of tourists in summer
Approximately half of the total yearly inbound tourists (131.79 million) come to Hokkaido in summer (June to
September) and this number of tourists accounts for about 20% of the total. Meanwhile, the number of foreign tourists
to Hokkaido indicates that there are two peaks – one in summer and the other in winter.
Male
Female
By gender
10’s
20’s
30’s
40’s
50’s
60’s
70’s
Tohoku
Kanto
Tokai
Hokuriku/Koshinetsu
Kinki
Chugoku/Shikoku
Kyushu/Okinawa
FY2011 Survey on the Trends and Satisfaction of Tourists
By age
By residential area
Change in the types of trips (tourists to Hokkaido)
FY 2002
Married couple
Family trip (inc. honeymoons in 2002 and 2007
*The 2011 Survey was compiled based on valid responses only; therefore, FY 2002 and 2007
survey data were recompiled using valid responses (excluding “unknown”). FY2011 Survey on the Trends and
Satisfaction of Tourists
FY 2007
FY 2011
With children With other family/families
(e.g., relatives)
(With friends/colleagues,
for business, etc.)
Group trip Others Solo trip
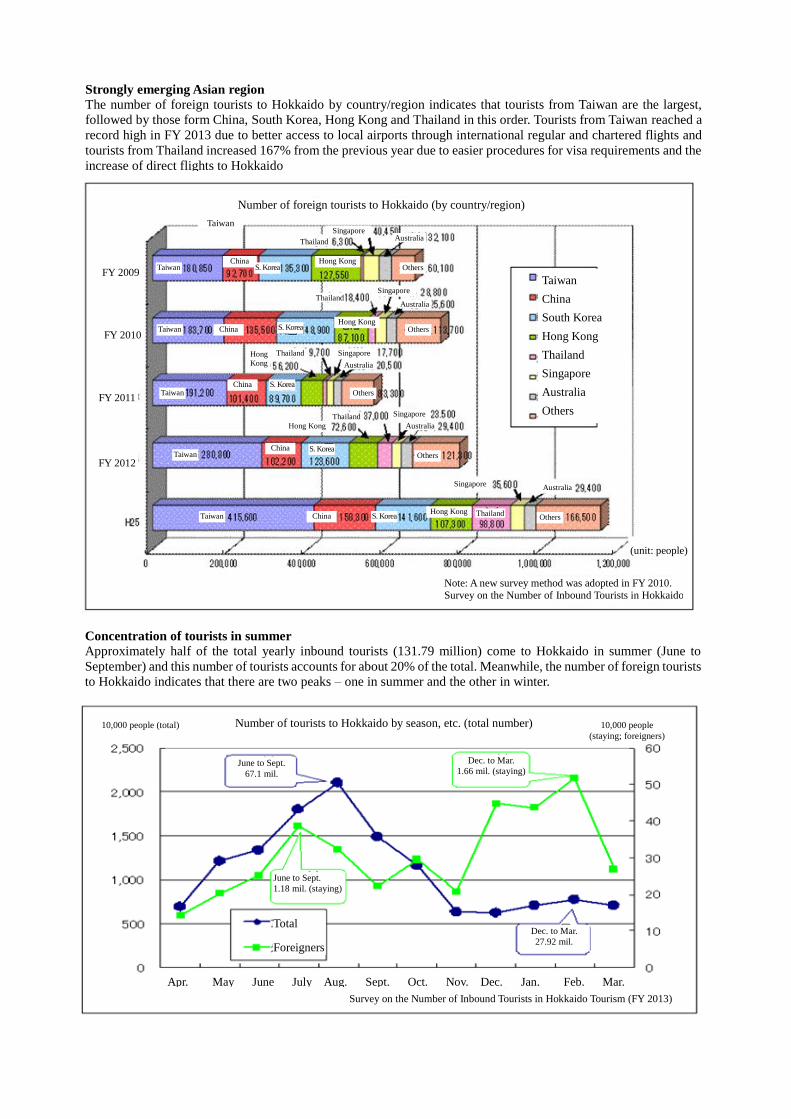
2. Trends of Tourists Attributes of tourists to Hokkaido
Concerning the number of tourists to Hokkaido, men and women account for 47.5% and 52.5% (5% larger than men),
respectively. In terms of age, 50’s or older accounts for 45.4% (almost half). In terms of residential area, tourists from
Kanto account for 46.8%, much more than any other area.
Family trips account for the largest share
In terms of the types of trips, family trips account for 56.8% (the largest share) and the share of group trips account
for 27.2%, indicating a decreasing trend. Solo trips account for 13.5%, indicating a slight increase.

Itinerary (tourists to Hokkaido)
Day trip
Overnight
Three days and
two nights
FY 2002
FY 2007
FY 2011
Four days and
three nights
Five days and
four nights
Six days and five nights or
longer
*The 2011 Survey was compiled based on valid responses only; therefore, FY 2002 and 2007
survey data were recompiled using valid responses (excluding “unknown”).
FY2011 Survey on the Trends and
Satisfaction of Tourists
Frequency of trips to Hokkaido
First time
2 to 4 times
5 times or
more
FY 2002
FY 2007
FY 2011
*The 2011 Survey was compiled based on valid responses only; therefore, FY 2002 and 2007
survey data were recompiled using valid responses (excluding “unknown”).
FY2011 Survey on the Trends and
Satisfaction of Tourists
Increase of extended stay tourists
In terms of the itinerary of tourists to Hokkaido, they stayed for a shorter time in FY 2007 than previous years.
However, extended stay tourists increased in FY 2011, indicating that four days and three nights account for 27.0%,
five days and four nights for 12.0%, and six days and five nights or longer for 16.7%.
“Repeaters” account for 80%
Concerning the number of tourists to Hokkaido, “repeaters,” regular tourists who visited the prefecture in the past,
accounted for more than 80%. “Hokkaido fans,” who visited Hokkaido 5 times or more, accounted for more than 40%.
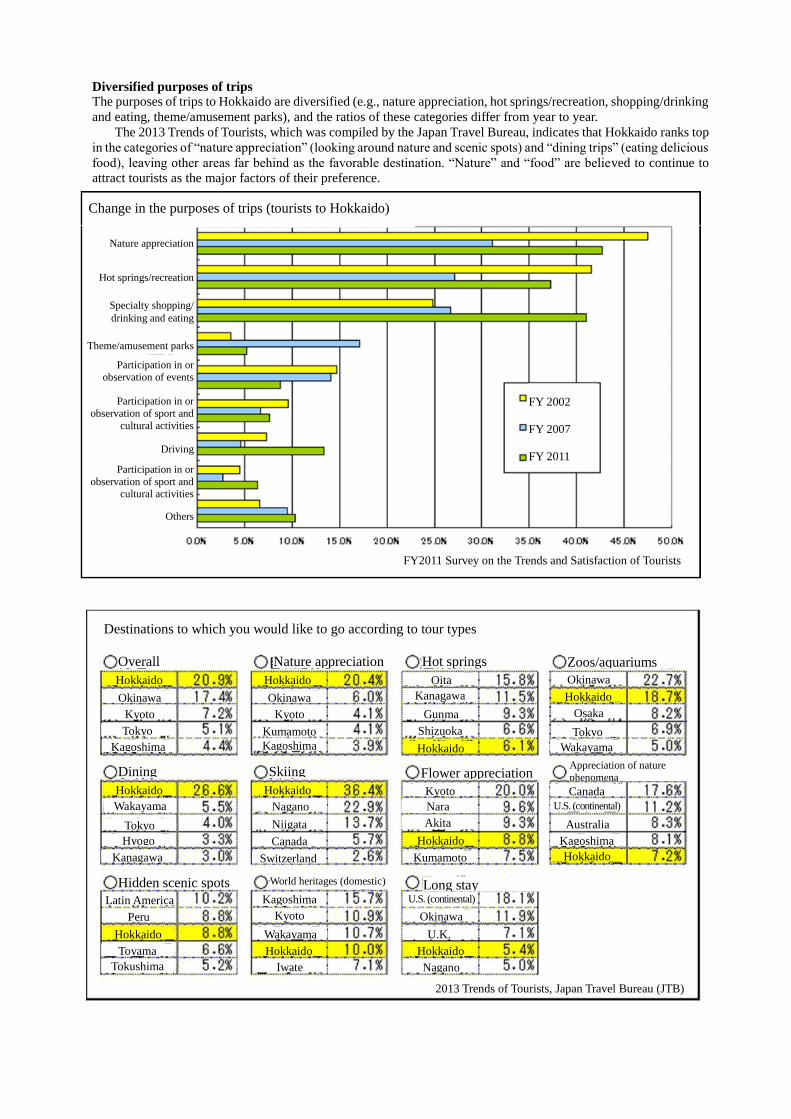
Change in the purposes of trips (tourists to Hokkaido)
Nature appreciation
FY2011 Survey on the Trends and Satisfaction of Tourists
FY 2002
FY 2007
FY 2011
Hot springs/recreation
Specialty shopping/
drinking and eating
Theme/amusement parks
Participation in or
observation of events
Participation in or
observation of sport and
cultural activities
Driving
Participation in or
observation of sport and cultural activities
Others
Hokkaido
Okinawa
Destinations to which you would like to go according to tour types
2013 Trends of Tourists, Japan Travel Bureau (JTB)
Overall
Hokkaido
Hokkaido
Hokkaido
Hokkaido
Hokkaido Hokkaido
Hokkaido
Hokkaido
Hokkaido
Hokkaido
Okinawa
Okinawa
Okinawa
Kyoto Kyoto
Kyoto
Tokyo
Tokyo
Tokyo
Kagoshima Kagoshima
Kagoshima
Kagoshima
Kyoto
Kumamoto
Oita
Kanagawa
Gunma
Shizuoka
Osaka
Wakayama
Wakayama
Wakayama
Hyogo
Kanagawa
Nagano
Niigata
Canada
Switzerland
Nara
Akita
Kumamoto
Canada
Australia
U.S. (continental)
U.S. (continental)
U.K.
Iwate
Peru
Toyama
Tokushima
Latin America
Nagano
Nature appreciation Hot springs Zoos/aquariums
Dining Skiing Flower appreciation Appreciation of nature
phenomena
Hidden scenic spots World heritages (domestic) Long stay
Diversified purposes of trips
The purposes of trips to Hokkaido are diversified (e.g., nature appreciation, hot springs/recreation, shopping/drinking
and eating, theme/amusement parks), and the ratios of these categories differ from year to year.
The 2013 Trends of Tourists, which was compiled by the Japan Travel Bureau, indicates that Hokkaido ranks top
in the categories of “nature appreciation” (looking around nature and scenic spots) and “dining trips” (eating delicious
food), leaving other areas far behind as the favorable destination. “Nature” and “food” are believed to continue to
attract tourists as the major factors of their preference.

Use of package tours (tourists to Hokkaido)
FY 2002
*The 2011 Survey was compiled based on valid responses only; therefore, FY 2002 and 2007 survey
data were recompiled using valid responses (excluding “unknown”).
Package tour
(designated route
trip)
Package tour
(with free plans,
etc.)
Non-package tour
Survey on the Trends and Satisfaction of Tourists
FY 2007
FY 2011
Railroad Sightseeing bus Route bus Rental car Taxi Private car Motorcycle and others
Major means of travel (tourists to Hokkaido)
*The 2011 Survey was compiled based on valid responses only; therefore, FY 2002 and 2007
survey data were recompiled using valid responses (excluding “unknown”).
Survey on the Trends and Satisfaction of Tourists
FY 2002
FY 2007
FY 2011
Decrease in the users of package tours
Tourists who used package tours with designated routes decreased by half, 39.4% in FY 2002, to 19.8% in FY 2011.
Meanwhile, tourists who did not use package tours increased to 45.3% in FY 2011.
Change in means of travel
The share of sightseeing (chartered) buses decreased by about half, 21.0% in FY 2011, from 41.5% in FY 2002 in
the category of the major means of travel. Meanwhile, the share of railroads accounted for a record high 29.3% in
FY 2011, indicating a change in the means of travel reflecting an increase in trips with a small number of participants.
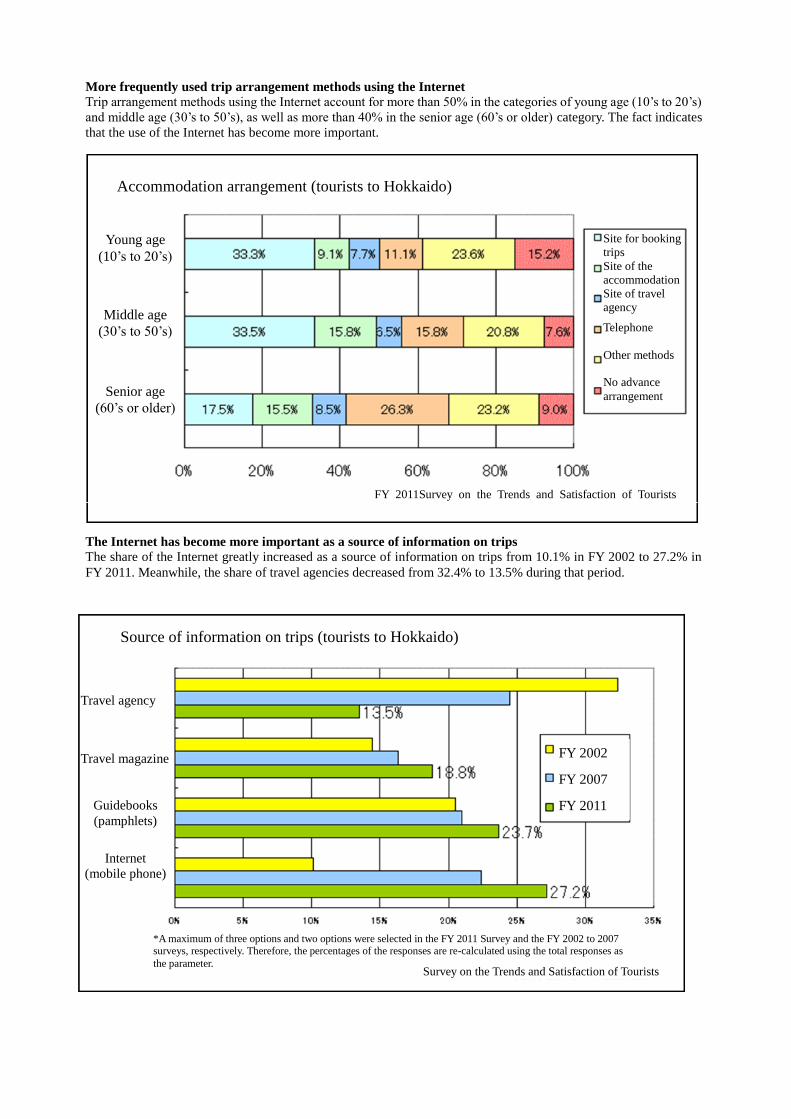
Source of information on trips (tourists to Hokkaido)
Travel agency
Travel magazine
Guidebooks
(pamphlets)
*A maximum of three options and two options were selected in the FY 2011 Survey and the FY 2002 to 2007 surveys, respectively. Therefore, the percentages of the responses are re-calculated using the total responses as
the parameter.
FY 2002
FY 2007
FY 2011
Survey on the Trends and Satisfaction of Tourists
Internet
(mobile phone)
Accommodation arrangement (tourists to Hokkaido)
Young age
(10’s to 20’s)
Site for booking
trips
Site of the
accommodation
Site of travel
agency
Telephone
Other methods
No advance
arrangement
FY 2011Survey on the Trends and Satisfaction of Tourists
Middle age
(30’s to 50’s)
Senior age
(60’s or older)
More frequently used trip arrangement methods using the Internet
Trip arrangement methods using the Internet account for more than 50% in the categories of young age (10’s to 20’s)
and middle age (30’s to 50’s), as well as more than 40% in the senior age (60’s or older) category. The fact indicates
that the use of the Internet has become more important.
The Internet has become more important as a source of information on trips
The share of the Internet greatly increased as a source of information on trips from 10.1% in FY 2002 to 27.2% in
FY 2011. Meanwhile, the share of travel agencies decreased from 32.4% to 13.5% during that period.

Note: For tourists from Hokkaido in the 1st to 4th surveys consumption value per household was adopted. The
5th survey used a different estimation method from the estimation methods for the 1st to 4th surveys
Tourist from Hokkaido (per capita)
Tourists from elsewhere in Japan
(per capita)
Foreign tourist (per capita)
(yen)
1st survey 2nd survey 3rd survey 4th survey 5th survey
Survey period
1st survey:
Oct. 1988 to Sept. 1989
2nd survey:
Oct. 1993 to Sept. 1994
3rd survey:
Jan. 1999 to Dec. 1999
4th Survey:
July 2004 to June 2005
5th survey:
July 2009 to June 2010
Survey on the Economic Effects of the Tourism Industry in Hokkaido
Tourism consumption
Unit tourism consumption
In terms of the amount spent by a tourist per trip, tourists from Hokkaido spent ¥13,271, tourists from elsewhere in
Japan spent ¥69,670, and foreign tourists to Hokkaido spent ¥122,128.

Change in the number of accommodation facilities and capacity of guests (Unit: facility, person, guest night)
FY 2008 FY 2009 FY 2010 FY 2011 FY 2012 FY 2013 FY 2013/08
Hotel
Japanese inn
Common
lodging houses
Capacity
No. of facilities
Capacity
No. of facilities
Capacity
No. of facilities
Capacity
No. of facilities
Capacity
No. of facilities
Capacity
No. of facilities
Capacity
No. of facilities
Capacity
No. of facilities
In urban areas
In urban areas
In urban areas
In urban areas
Total
*1 Urban areas: 7 cities (Sapporo, Otaru, Hakodate, Asahikawa, Abashiri, Obihiro and Kushiro)
*2 FY: as of end of March
Food Sanitation Division, Bureau of Health and Safety,
Department of Health and Welfare, Hokkaido
Category
Class I Director-General,
Japan Travel Agency
Hokkaido
Governor
Agent-organized trips in Japan and overseas
Tailor-made trips in Japan and overseas
Arranged trips
Sale by agent based on outsourcing agreement
Agent-organized trips in Japan Tailor-made trips in Japan and overseas Arranged trips
Sale by agent based on outsourcing agreement
Agent-organized trips in Japan (area-based) Tailor-made trips in Japan and overseas Arranged trips
Sale by agent based on outsourcing agreement
Agent-organized trips in Japan (area-based) Tailor-made trips in Japan (area-based) Arranged trips (area-based)
Sale by agent based on outsourcing agreement
Sale by agent based on outsourcing agreement
Hokkaido District Transport Bureau (MLIT)/Tourism Bureau,
Department of Economic Affairs, Hokkaido Government *FY: as of end of March
*Area-based travel business has been implemented since FY 2013.
Travel agencies that have principal offices in Hokkaido
Hokkaido
Governor
Hokkaido
Governor
Hokkaido Governor
Class II
Class III
Reg. category
Area-based
Agency
Reg. agency Range of business FY 2011 FY 2012 FY 2013
Total
3. Status of the Tourism Industry Lodging industry
As of March 2014, the number of hotels, Japanese inns and common lodging houses in Hokkaido certified by the
Inns and Hotels Act is 4,808. A statistic survey on trips with accommodations conducted by the Japan Tourism
Agency indicates that the number of accommodation facilities with 10 or more employees is 652 (as of January
2014). This means that more than 80% of accommodation facilities are small ones with 9 or fewer employees.
In comparison with the FY 2008 survey, hotels increased by 3.2% in the number of facilities and 7.0% in terms of
capacity; Japanese inns decreased by 12.7% and 11.5%, respectively. In total, hotels and Japanese inns decreased by
2.2% and 3.5%, respectively.
Travel agencies
The number of register travel agencies that have principal offices in Hokkaido is 304 as of the end of March 2014,
slightly increasing from the previous fiscal year.

Railroad/track
JR
Ship and vessel
Automobile
Airline
Total
FY 2008 FY 2009
FY 2010
FY 2011
FY 2012
(1,000 people)
2012/2007
FY 2007
Change in passengers transported by means of transportation (in Hokkaido)
JR
Ship and vessel
Airline
Total
FY 2007
FY 2008
FY 2009
FY 2010
FY 2011
FY 2012
2012/2007
Transportation in numbers in Hokkaido (Hokkaido District Transport Bureau)
(1,000 people)
Change in passengers transported by means of transportation (between Hokkaido and elsewhere in Japan)
Change in transportation by airplanes (major airports in Hokkaido – Tokyo (people)
No. of
passengers
transported
No. of seats
provided
Seat occupancy
rate
2000 2001 2002 2003 2004 2005 2006 2007 2008 2009 2010 2911 2012 2013
*Major airports: New Chitose, Kushiro, Hakodate, Asahikawa, Memambetsu and Obihiro Annual Statistic Report of Air Transportation, Ministry
of Land, Infrastructure, Transport and Tourism
(FY)
No of operators
No of vehicles
Travel distance
(vehicle, 1,000 km, 1,000 people)
FY 2007
Business results by chartered bus
Transportation numbers in Hokkaido (Hokkaido District Transport Bureau)
No. of passengers
FY 2008 FY 2009 FY 2010 FY 2011 FY 2012 2012/2007
Passenger transport industry
In comparison with FY 2007, the number of passengers transported inside Hokkaido decreased in FY 2012 for all
means of transport except JR Hokkaido (slight increase). The number of passengers transported between Hokkaido
and elsewhere in Japan decreased for JR Hokkaido, ships and vessels, and airlines.
The results of air transport by major airports in Hokkaido shows that the number of passengers transported
between Hokkaido and Tokyo had decreased in the past several years, but the number has increased since FY 2012.
Status of chartered buses
In comparison with FY 2007, the number of bus service operators remained almost the same in FY 2012, but the
number of vehicles, travel distance and the number of passengers decreased by 6.2%, 20.0% and 8.3%, respectively,
over that period