Embed Size (px)
Citation preview

1
Steel Exports Report: United States February 2017 Background
The United States is the world’s 9th largest steel exporter. In 2016, the
U.S. exported 8.9 million metric tons of steel, a decrease from 9.6
million metric tons in 2015. U.S. exports represented about 2 percent of
all steel exported globally in 2016. The volume of U.S. 2016 steel
exports was 1/12th that of the world’s largest exporter, China, and just
over 1/4th that of the second-largest exporter, Japan. In value terms,
steel represented just 0.8 percent of the total amount of goods the U.S.
exported in 2016.
The U.S. exports steel to more than 150 countries and territories. The 2
countries labeled in the map below represent the top markets for U.S.
exports of steel, receiving more than 1 million metric tons each and
accounting for 83 percent of U.S. steel exports in 2016.
Quick Facts:
● World’s 9th largest steel
exporter: 8.9 million
metric tons (2016)
● 2% steel export decline
since 2009
● Exports as a share of
production down from
15.2% in 2009 to 1.3% in
2016
● Year-on-year export
volume down 7% while
export value down 16%.
● Top two markets:
Canada and Mexico
● Top Producers: Nucor,
U.S. Steel, and
ArcelorMittal USA
● 7 trade remedies in effect
in 3 countries and the
European Union involving
steel mill imports from
U.S.
U.S. Exports of Steel Mill Products - 2016
Data Source: Global Trade Atlas; Copyright © IHS Global Inc. 2017. All rights reserved.

2
Steel Trade Balance
The United States has maintained
a persistent trade deficit in steel
products. Since 2009, imports
have returned to the average
levels seen prior to the 2008
global recession while exports
have remained relatively flat in
comparison, and the trade deficit
has widened accordingly. Imports
grew by 104% between 2009 and
2016, and the steel trade deficit
grew by 269%.
In 2016, the U.S. steel trade
deficit amounted to -21.2 million metric tons
Steel Exports Report: United States
Export Volume, Value, and Product
Between 2012 and 2015, U.S. exports of steel mill products decreased by 27 percent, from 12.8
million metric tons in 2012 to 9.6 million metric tons in 2015. In 2016, U.S. steel exports decreased
by 4 percent to 8.9 million metric tons. The value of U.S. 2016 steel exports declined by 16 percent to
$11.5 billion from $13.6 billion in 2015, which can be attributed to a significant drop in global steel
prices.
Flat products accounted for the largest share of U.S. steel exports in 2016 at 58 percent or 5.2 million
metric tons. Long products accounted for 21 percent, or 1.8 million metric tons, of U.S. exports of
steel in 2016, followed by pipe and tube products (11% or 939.8 thousand metric tons), stainless
products (10% or 854.9 thousand metric tons), and semi-finished steel (1% or 83.4 thousand metric
tons).

3
Steel Exports Report: United States
Exports by Top Market
Exports to the U.S. top 5 steel
markets represented 92 percent
of U.S. steel export volume in
2016 at 8.2 million metric tons
(mmt). Canada received the
largest share of U.S. exports with
50 percent (4.4 mmt), followed
by Mexico at 39 percent (3.5
mmt), and India , China, and
Brazil at 1 percent or 86.3, 75.2,
and 53.5 thousand metric tons
respectively.
Trends in Exports to Top Markets
Between 2015 and 2016, the volume of U.S. steel exports decreased to six of the country’s top 10 steel
export markets. Exports decreased the most to Belgium (down 37.4% from 2015), followed by the
United Kingdom (down 24.5%) and China (down 11.6%). Only exports to Italy and South Korea,
increased significantly in volume in 2016, up 34.3 percent and 12.1 percent, respectively.
Italy and South Korea were the only markets for U.S. steel exports to show an increase in value
between 2015 and 2016 — up 5.5 percent and 2 percent, respectively. The other top markets all saw
value decreases from U.S.
with the largest decrease
occurring in Belgium (down
22.3%), followed by Brazil
(down 21.2%), Germany
(d0wn 18.3%), and China
(down 15.5%).
Outside of the top 10
markets, other substantial
volume changes included
U.S. exports to 11th-ranked
Dominican Republic (down
64.3%), and 14th-ranked
Chile (up 108.6%).

4
Steel Exports Report: United States
Top Markets by Steel Product Category
The United States’ top export markets by volume vary across types of steel products. Canada
received the largest share of U.S. exports of flat, long, and pipe and tube products in 2016 at 50
percent (2.6 million metric tons), 60 percent ( 1 million metric tons), and 57 percent (532.4
thousand metric tons), respectively, followed closely by Mexico in all three product categories at 44
percent (2.3 million metric tons), 31 percent (561.9 thousand metric tons), and 21.5 percent (202.3
thousand metric tons), respectively. at 12 percent (968 thousand metric tons).
Mexico received the largest share of U.S. semi-finished and stainless product exports in 2016 at 44
percent (36.8 thousand metric tons) and 50.5 percent (431.8 thousand metric tons), respectively.
Canada held the second-largest share of U.S. exports of semi-finished and stainless products at
23.4 percent (19.5 thousand metric tons) and 26.8 percent (229.2 thousand metric tons),
respectively.

5
Steel Exports Report: United States
U.S. Import Market Share in Top Destinations
In 2016, the import market share for U.S. steel products decreased slightly in six of the U.S. top
export destinations. The share of steel imports from the U.S. decreased the most in Belgium and the
United Kingdom, down 0.2
percentage points from 2015,
followed by China (down 0.1
percentage point) while the
shares remained nearly
unchanged in Italy, Germany,
and South Korea remained
nearly unchanged.
The share of imports from the
U.S. showed the largest
increase in Mexico (up 2.4
percentage points), followed by
Brazil (up 1.6 percentage
points), and Canada (up 1
percentage point).
Among the U.S. top export markets, Canada and Mexico received 59 and 38 percent of their total
steel imports from the United States. In 2016, flat products accounted by far for the largest share of
steel imports from the U.S. in both Mexico (65% or 6.3 million metric tons), and Canada (46% or 3.5
million metric tons).

6
Steel Exports Report: United States
Overall Production and Export Share of Production
The U.S. crude steel production decreased slightly to 78.6 million metric tons in 2016 from 78.8
million metric tons in 2015. Since 2009, apparent consumption (a measure of steel demans) has
increasingly outpaced production. Between 2009 and 2016, crude steel production grew by 32
percent, while apparent consumption increased by 53 percent. Between 2009 and 2016, U.S. steel
exports as a share of production fell by 26 percentage points as production increased while exports
held steady during the same period. In 2016, the export share was 11 percent.
Top Producers
The top eight steel
producers in the United
States are a mix of foreign
and domestically-owned
companies. Based on
available data, the top five
domestically-owned
producers, along with
ArcelorMittal USA,
accounted for 82 percent
of total production in
2015.
United States Top Steel Producers in 2015
Rank Company Production
(mmt) Main Products
1 Nucor Corporation 19.6 Bars, beams, sheets, plate
2 United States Steel Corp. 14.5 Hot-rolled, hardware, fittings
3 ArcelorMittal USA* 13.9 ( 2015
estimate)
Flat products, long products,
tubular products
4 Gerdau North America* N/A Beams, pilings, billets, rebar,
wire rod
5 Steel Dynamics Inc. 7.4 (2014
shipments) Sheets, bars, beams
6 AK Steel Corporation 6.2 Carbon, stainless, electrical
7 Severstal North
America*⁺ N/A
Hot-rolled, cold-rolled,
galvanized
8 Commercial Metals Co. 3.4 (2013) Long products, structural
Source: World Steel Association; Bloomberg; Company websites *Denotes foreign-owned producer ⁺Sold to AK Steel and Steel Dynamics
7
Steel Exports Report: United States
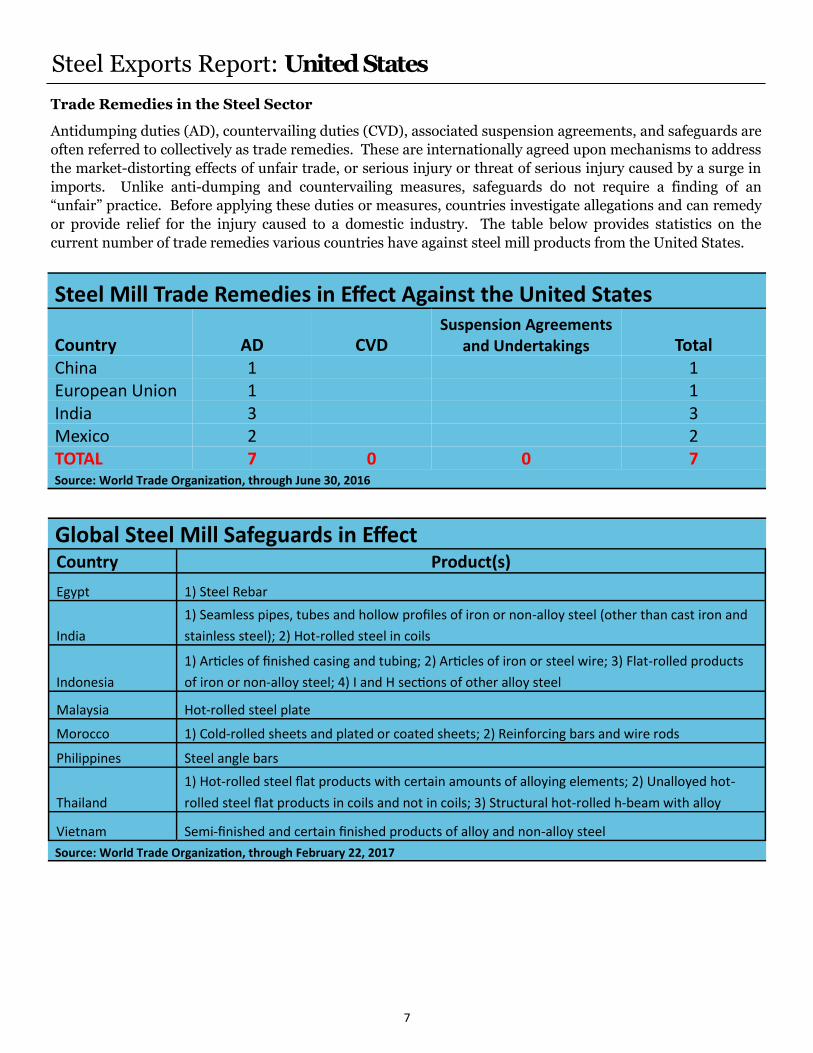
Steel Mill Trade Remedies in Effect Against the United States
Country AD CVD Suspension Agreements
and Undertakings Total China 1 1 European Union 1 1 India 3 3 Mexico 2 2 TOTAL 7 0 0 7 Source: World Trade Organization, through June 30, 2016
Trade Remedies in the Steel Sector
Antidumping duties (AD), countervailing duties (CVD), associated suspension agreements, and safeguards are
often referred to collectively as trade remedies. These are internationally agreed upon mechanisms to address
the market-distorting effects of unfair trade, or serious injury or threat of serious injury caused by a surge in
imports. Unlike anti-dumping and countervailing measures, safeguards do not require a finding of an
“unfair” practice. Before applying these duties or measures, countries investigate allegations and can remedy
or provide relief for the injury caused to a domestic industry. The table below provides statistics on the
current number of trade remedies various countries have against steel mill products from the United States.
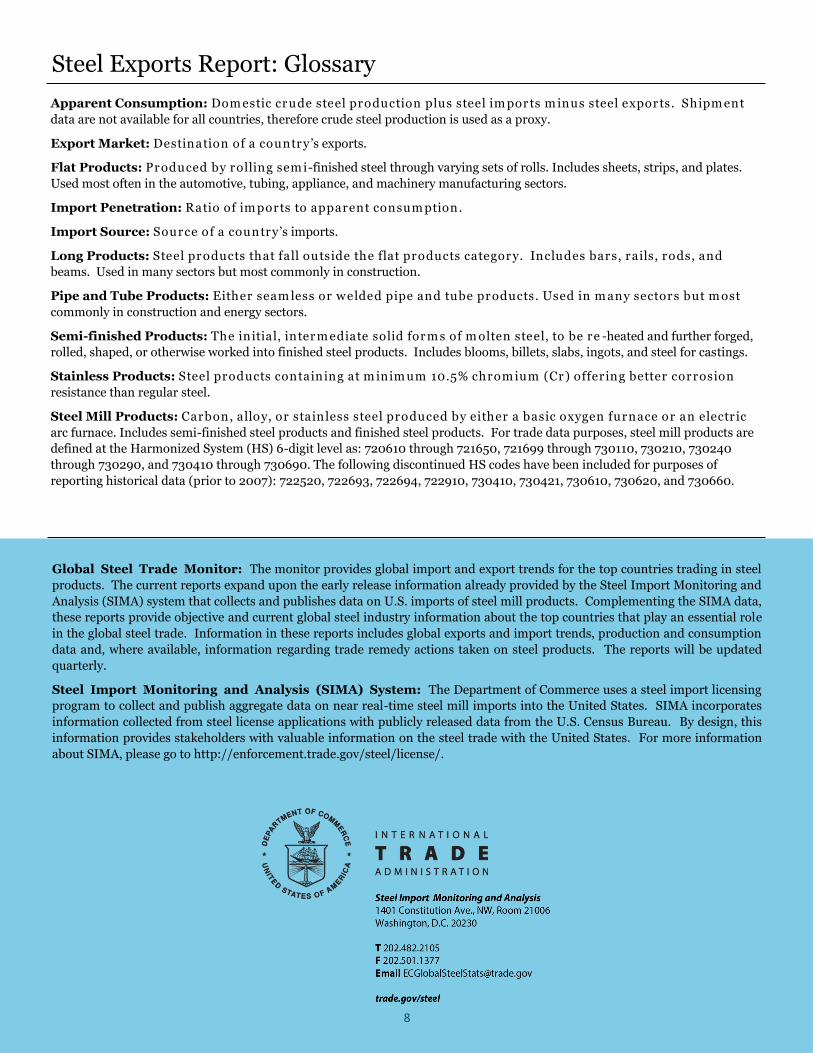
Global Steel Mill Safeguards in Effect
Country Product(s)
Egypt 1) Steel Rebar
India
1) Seamless pipes, tubes and hollow profiles of iron or non-alloy steel (other than cast iron and
stainless steel); 2) Hot-rolled steel in coils
Indonesia
1) Articles of finished casing and tubing; 2) Articles of iron or steel wire; 3) Flat-rolled products
of iron or non-alloy steel; 4) I and H sections of other alloy steel
Malaysia Hot-rolled steel plate
Morocco 1) Cold-rolled sheets and plated or coated sheets; 2) Reinforcing bars and wire rods
Philippines Steel angle bars
Thailand
1) Hot-rolled steel flat products with certain amounts of alloying elements; 2) Unalloyed hot-
rolled steel flat products in coils and not in coils; 3) Structural hot-rolled h-beam with alloy
Vietnam Semi-finished and certain finished products of alloy and non-alloy steel
Source: World Trade Organization, through February 22, 2017
8
Steel Exports Report: Glossary
Apparent Consumption: Dom estic cr ude steel production plus steel im por ts m inus steel expor ts. Shipm ent
data are not available for all countries, therefore crude steel production is used as a proxy.
Export Market: Destination of a countr y ’s exports.
Flat Products: Pr oduced by rolling sem i-finished steel through varying sets of rolls. Includes sheets, strips, and plates.
Used most often in the automotive, tubing, appliance, and machinery manufacturing sectors.
Import Penetration: Ratio of im ports to apparent consum ption.
Import Source: Source of a country ’s imports.
Long Products: Steel pr oducts that fall outside the flat products categor y. Includes bars, rails, rods, and
beams. Used in many sectors but most commonly in construction.
Pipe and Tube Products: Either seam less or w elded pipe and tube pr oducts. Used in m any sectors but m ost
commonly in construction and energy sectors.
Semi-finished Products: The initial, inter m ediate solid for m s of m olten steel, to be re -heated and further forged,
rolled, shaped, or otherwise worked into finished steel products. Includes blooms, billets, slabs, ingots, and steel for castings.
Stainless Products: Steel products containing at m inim um 10.5% chrom ium (Cr ) offer ing better corrosion
resistance than regular steel.
Steel Mill Products: Carbon, alloy, or stainless steel produced by either a basic oxygen furnace or an electr ic
arc furnace. Includes semi-finished steel products and finished steel products. For trade data purposes, steel mill products are
defined at the Harmonized System (HS) 6-digit level as: 720610 through 721650, 721699 through 730110, 730210, 730240
through 730290, and 730410 through 730690. The following discontinued HS codes have been included for purposes of
reporting historical data (prior to 2007): 722520, 722693, 722694, 722910, 730410, 730421, 730610, 730620, and 730660.
Global Steel Trade Monitor: The monitor provides global import and export trends for the top countries trading in steel
products. The current reports expand upon the early release information already provided by the Steel Import Monitoring and
Analysis (SIMA) system that collects and publishes data on U.S. imports of steel mill products. Complementing the SIMA data,
these reports provide objective and current global steel industry information about the top countries that play an essential role
in the global steel trade. Information in these reports includes global exports and import trends, production and consumption
data and, where available, information regarding trade remedy actions taken on steel products. The reports will be updated
quarterly.
Steel Import Monitoring and Analysis (SIMA) System: The Department of Commerce uses a steel import licensing
program to collect and publish aggregate data on near real-time steel mill imports into the United States. SIMA incorporates
information collected from steel license applications with publicly released data from the U.S. Census Bureau. By design, this
information provides stakeholders with valuable information on the steel trade with the United States. For more information
about SIMA, please go to http://enforcement.trade.gov/steel/license/.